Article

Local People’s Participation in Mangrove Restoration Projects and Impacts on Social Capital and Livelihood: A Case Study in the Philippines

1
Department of Forest Sciences, College of Agriculture and Life Sciences, Seoul National University, 1 Gwanak-ro, Gwanak-gu, Seoul 08826, Korea
2
Research Institute of Agriculture and Life Sciences, Seoul National University, 1 Gwanak-ro, Gwanak-gu, Seoul 08826, Korea
3
Graduate School of International Agricultural Technology, Institutes of Green Bio Science and Technology, Seoul National University, 1447 Pyeongchang-daero, Daehwa, Pyeongchang, Gangwon 25354, Korea
*
Author to whom correspondence should be addressed.
Forests 2020, 11(5), 580; https://doi.org/10.3390/f11050580
Submission received: 10 May 2020 / Revised: 15 May 2020 / Accepted: 17 May 2020 / Published: 22 May 2020
(This article belongs to the Section Forest Economics, Policy, and Social Science)

Abstract

:
Participatory forest management has been considered as a practical and effective strategy for sustainable forest management, especially in situations where land tenure is not securely settled. For effective forest restoration, local communities, as the cornerstone of participatory management, should be provided with incentives to facilitate their participation and active role. We postulate that participation in mangrove restoration projects can not only provide financial rewards but also yield intangible benefits for communities, i.e., social capital. The study was conducted in the province of Quezon, Philippines, using face-to-face interviews as the main method for data collection. Regression analyses were undertaken to assess the impact of local community participation in mangrove restoration projects on social capital and its potential benefits to people in terms of access to information and services, which are key components of livelihood. Results revealed that people’s participation in mangrove restoration projects contributes to increasing social capital, consequently improving their access to information and services. Local people’s participation is beneficial to communities, as it can improve their livelihoods.

1. Introduction

1.1. Research Background

Participatory management is a key strategy for natural resource conservation and management that has been adopted in many countries. It recognizes the need to address social and environmental concerns collectively, as one affects the other [1,2]. Theoretically, the participatory approach would lead to a “win-win” result: environmental sustainability and social development. However, its on-site implementation encounters constraints and yields unsuccessful outcomes [2,3,4,5]. Providing benefits and incentives for local communities is also problematic and calls for improvement [6,7].
Worldwide forest governance has adopted participatory approaches in the belief that this strategy would lead to environmental sustainability while also accounting for social concerns [4,5,7,8]. Previous studies concluded that long-standing strict and exclusionary conservation caused pressure on local communities such as displacement and restrictions on the use of resources [7,9,10]. Meanwhile, participatory management, a more people-centered approach, would, in theory, produce “win-win” results: a strategy for resource protection and conservation and for delivering benefits to local communities [1,2].
Local communities, as the cornerstone of the participatory approach, play a vital role in the success of this management strategy, hence strengthening their participation is highly important. However, local people’s participation is contingent on the incentives and benefits they will receive [6,11,12,13]. In contrast, receiving no benefits means the social objective of participatory forest management is neglected, consequently discouraging local people from participating. The studies of Cao et al. [14] stressed that sudden and untimely discontinuation of benefits could cause local people to revert to their former unsustainable practices in forest resource utilization. However, it is important to understand that a perpetual supply of benefits for people is irrational and inefficient. The outcome of participation should function as a means to improve people’s capabilities to achieve self-reliance and self-governance and thus, realize sustainability.
The same situations can be observed in the Philippines, where community-based approach serves as the main strategy in managing forests [15]. Hence, this study was designed to contribute to improving natural resource management through strengthening local people’s participation. This study examined social capital as an incentive and impact of people’s participation in mangrove restoration projects and its implications to their livelihoods, while most studies consider social capital as an enabling condition for participation in collective actions for common pool resources [16,17,18,19].
For this study, the research problems were framed based on two propositions. First, there is a cause-and-effect relationship between the environmental and social components, therefore resource management strategies should cover both environmental and social aspects to achieve sustainability. Second, the benefits for local people who participate in resource management motivate them to continue engaging in participatory management. In particular, two research questions were addressed in this study. First, what are the effects of people’s participation on social capital? Second, what are the implications of changes in social capital to people’s livelihoods? Building social capital may have a greater impact compared to other tangible incentives, in terms of improving people’s overall well-being, as its development also enhances the accumulation of other forms of capital [20]. From the perspective of the poor, increased access to and ownership of assets provides better means and more alternatives to get resources for meeting people’s needs and supporting subsistence. These conditions are favorable for environmental protection, as they diminish people’s dependency on natural resources, which has been identified as a major driver of deforestation and forest degradation [21,22].

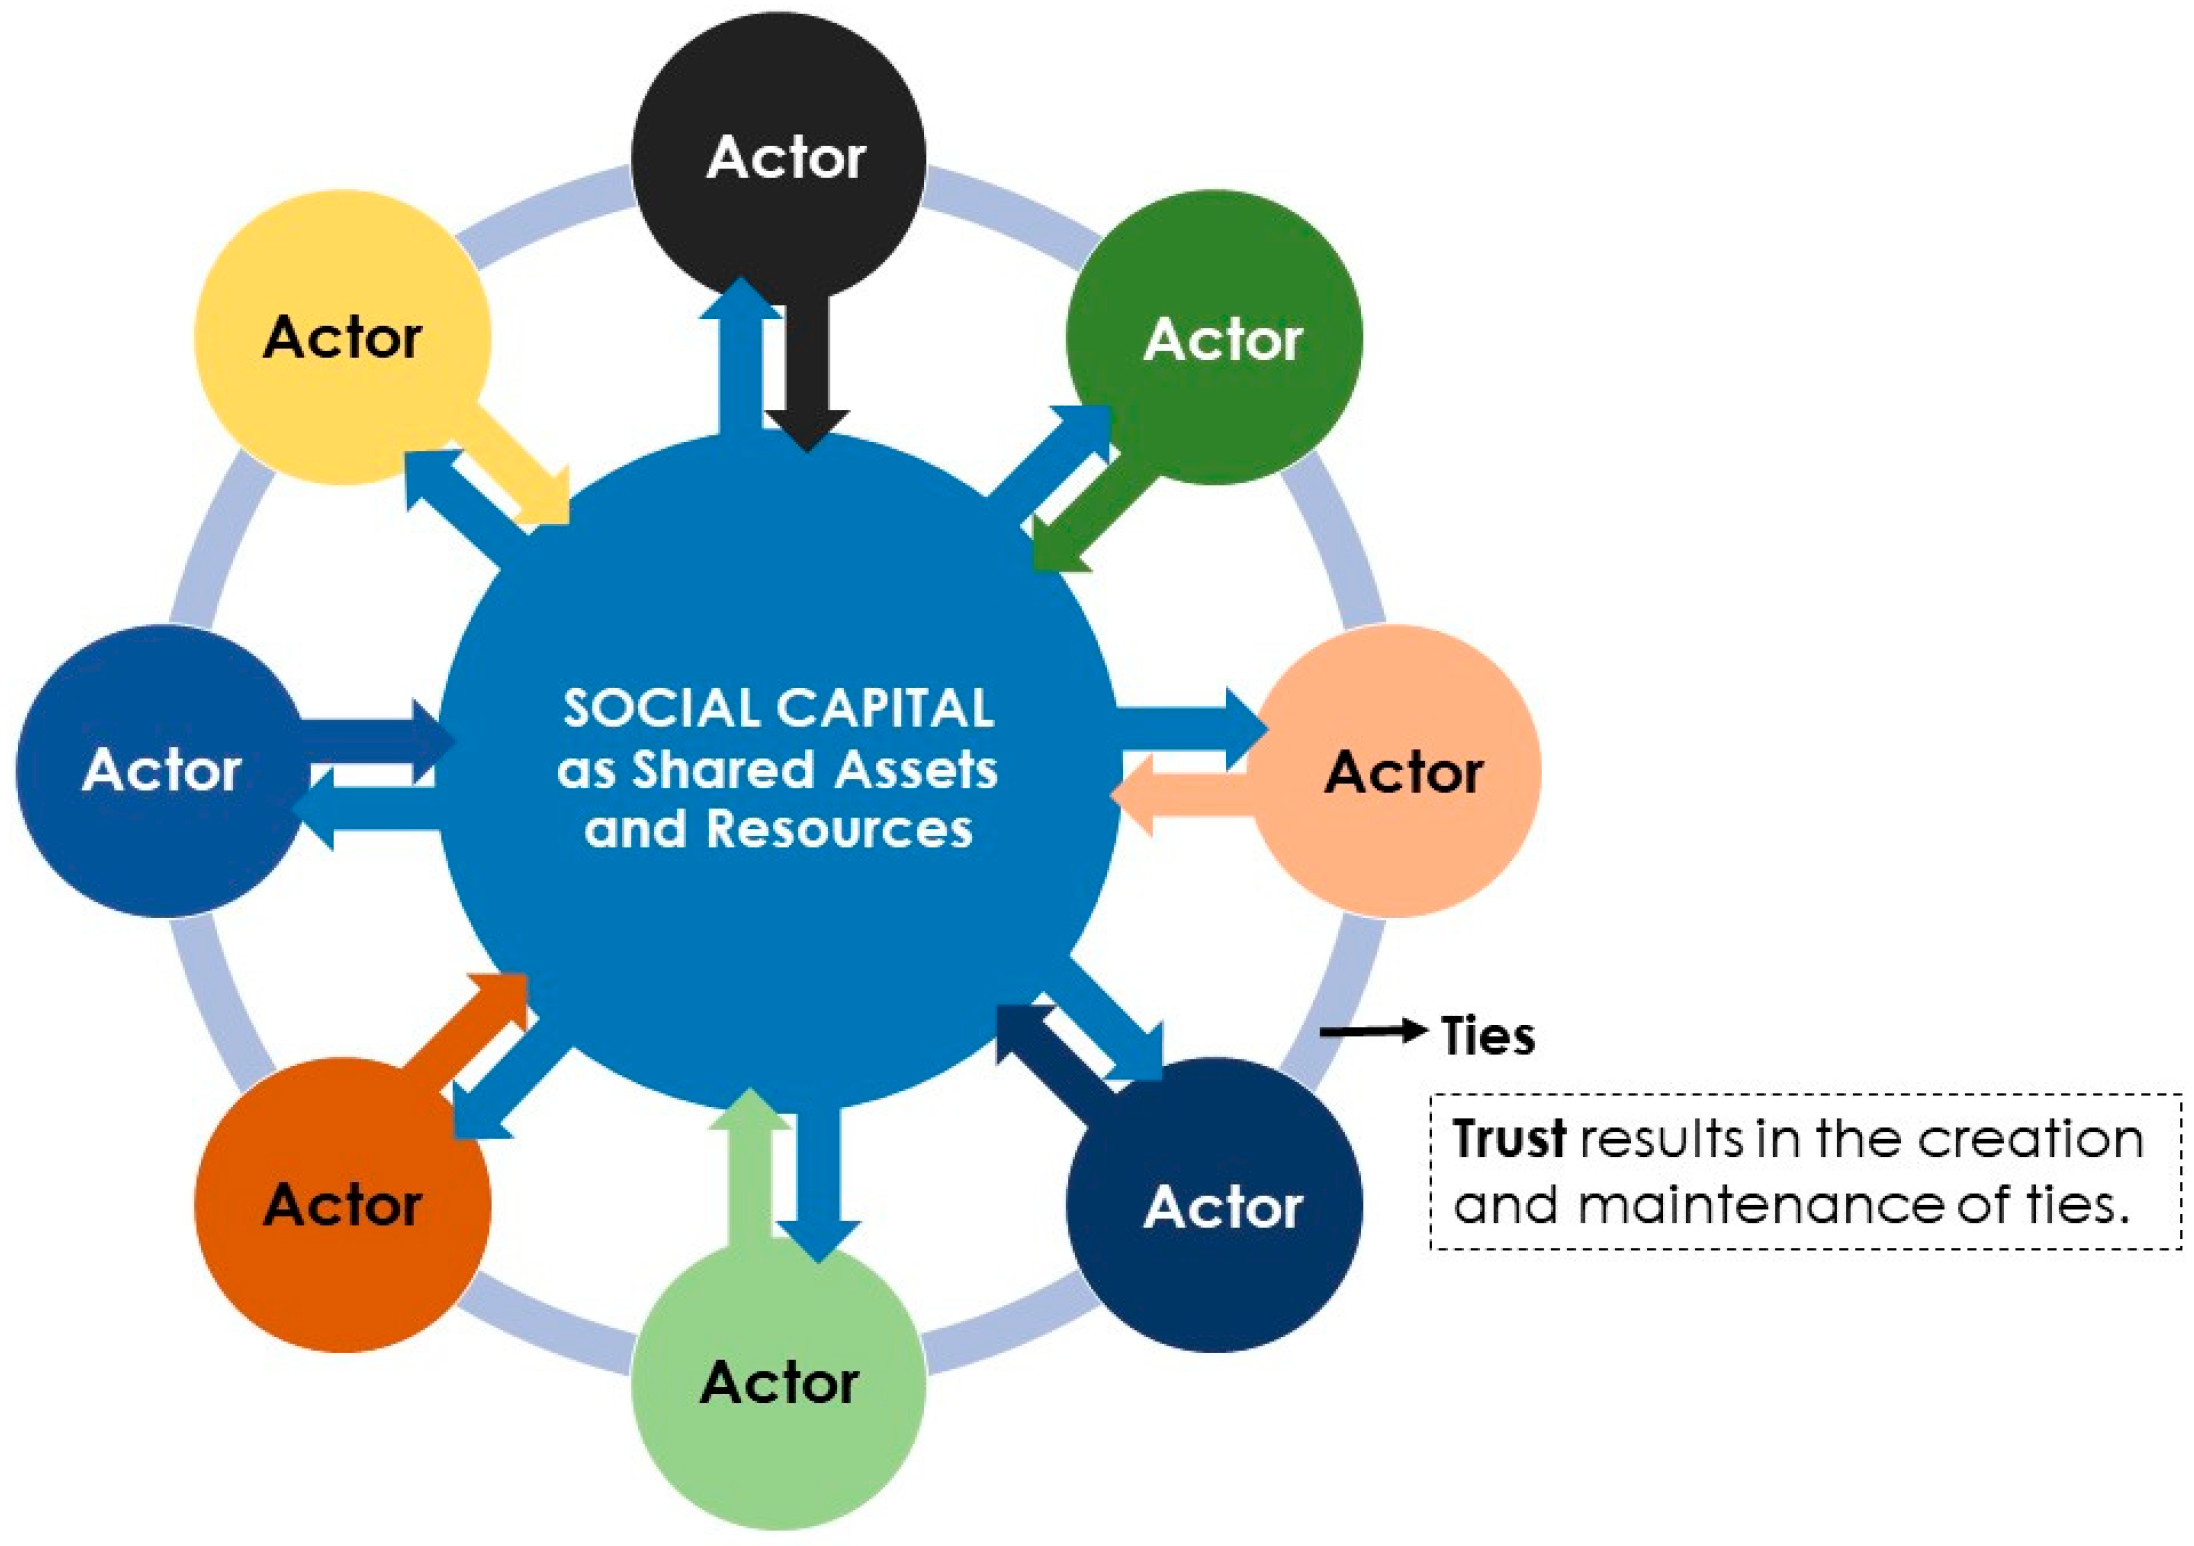
1.2. Social Capital in Natural Resources Management

Social capital was conceptually defined as a productive resource inherent in the relations among persons of less tangible nature than human capital [23]. The forms of social capital consist of trust, norms, and networks which facilitate coordinated actions [24]. The notion of social capital, although centers on actor’s relationships with and between actors, covers more than just social networks (Table 1). These definitions focus more on assets than social relations and highlight two main points. First, social capital is created by building social relationships. Social capital is instantiated in an actual human relationship and leads to cooperation in groups [25,26]. The connections and relationships are driven by interests [20]. Therefore, social capital formed in the relations of actors is characterized by the norm of reciprocity [26]. Second, social capital functions as investments in order to acquire more resources that can further people’s opportunities. Thus, social capital is a resource embedded in social networks accessed and used by actors for their actions [27].
The concept of social capital has been applied to broad fields—in economics, sociology, political science, and anthropology, among others—that have led to the development of its diverse theoretical conceptualizations [19]. Social capital is used for interpreting social phenomena in the sector of natural resource management. Several studies revealed a positive correlation between social capital and people’s participation in resources management [19,29,30]. Social capital can contribute to developing co-management of natural resources through enhanced community member’s participation [31]. The results of these empirical studies follow the concept of social capital by [32] as a “feature of social organizations” that “facilitate[s] action and cooperation for mutual benefit” in natural resource management. Social capital, applied in natural resources management with community participation, can benefit people in two ways: (1) by having connections with people who are “prepared and obliged to provide help and support” [20], and (2) by having access to embedded resources owned by the people within their networks [27,28,33,34]. Through social relations, people can gain control over embedded resources that they did not own previously [27,28]. Lin’s [27] theory of social capital elucidates that each member of a group is recognized as a “custodian of the limits of the group” and each has influence in the decision-making process. Accordingly, by being a member of a group, a person can influence how the resources can be used to her or his advantage. In particular, from the perspective of poor people, the function of social capital can improve one’s status in the society, as they contribute to the person’s improved recognition and increased assets [35,36]. As our study is concerned with the effects of mangrove restoration projects to the livelihood of local communities, two dimensions of social capital such as social relations and embedded resources are highlighted in this research. However, social capital is not a panacea in natural resource management. It functions contextually and brings different outcomes in different places [37]. Hence, this study analyzed social capital of mangrove management with understanding of the Philippine cultural context.

1.3. Philippine Mangroves

Three percent of the remaining forest cover in Philippines is mangrove forests which are defined as a type of forests on tidal mudflats along the sea coast extending along the streams where the water is brackish [38]. Mangrove forests serve as nesting grounds for bird species and home to a wild variety of reptiles, amphibians, mammals, fishes, crabs, shrimps, mollusks, and many other invertebrates [39]. A large part of the population of the Philippines depends on mangroves for food, livelihood, and shelter [38]. Furthermore, mangrove areas play a significant role in climate change mitigation due to their immense carbon absorption potential [40,41].
The Philippines has lost a significant amount of mangrove areas in the last century, from half a million hectares in 1918 to 120,000 hectares in 1994 [42,43], mainly due to the development of aquaculture farms and overharvesting of mangroves for fuelwood use [42,43,44]. Conflicting policies on mangrove land use in the country has also exacerbated the problem [44,45]. Government initiatives to protect mangrove ecosystems did not start until the 1970s [46]. In the 1980s, revisions of forestland zoning were also made to strengthen mangrove management and conservation [42]. New legislations such as the National Integrated Protected Areas System Act (Republic Act 7586) of 1992 and the Philippine Fisheries Code (Republic Act 8550) of 1998 were also enacted to support the government’s conservation efforts [44].
The need for more intensive restoration of the mangrove ecosystems was made clear following the super typhoon Haiyan (Yolanda) disaster in 2013 [47], which killed more than 6000 people in the Philippines [48]. This led the government to implement the Mangrove and Beach Forest Development Project (MBFDP) as part of the National Greening Program (NGP) that started in 2015. The project aims to restore mangrove areas in the country in collaboration with local government units, private sector, non-government organizations, and other concerned stakeholders [49]. The role of local communities is also emphasized in the MBFDP as they were contracted in the restoration activities to recover lost mangrove areas. Local community can contribute to enhancing reforestation success by cultivating local stewardship. Social components like community participation and utilization and reproduction of social capital received attention in mangrove management [50,51,52,53]. In practice, community-based mangrove management has been successfully implemented in many countries such as India, Indonesia, Pakistan, Philippines, and Thailand [50]. Co-management of natural resources such as mangrove with local communities has also been legalized in Brazil [54]. Local communities are given opportunities to make rules managing the mangrove and to implement and monitor the rules. In particular, some studies examined how social capital of local communities matters in mangrove management. Successful rehabilitation of mangrove areas by the Muara Baimbai community in Sei Nagalawan Village in Indonesia was attributed to social capital which facilitates fair work allocation, sharing benefits among the members, internal bond, and external networks [55]. A case study in Kutai National Park, East Kalimantan, Indonesia showed that community involvement, community awareness, and trust based on the society’s social capital supported silvo-fishery in the mangrove resulting in enhanced livelihood of people [56]. A study in the five villages in East Sinjai, Indonesia examined the social capital needs to be activated through intervention of symbolic power by village heads and local leaders for good performances of mangrove forest management [57]. However, there are few inquiries on the effect of participatory mangrove management on social capital of the society, hence, we sought to understand the effect of people’s participation in mangrove restoration on social capital and its implications on the livelihood of communities in the Philippines.

2. Materials and Method
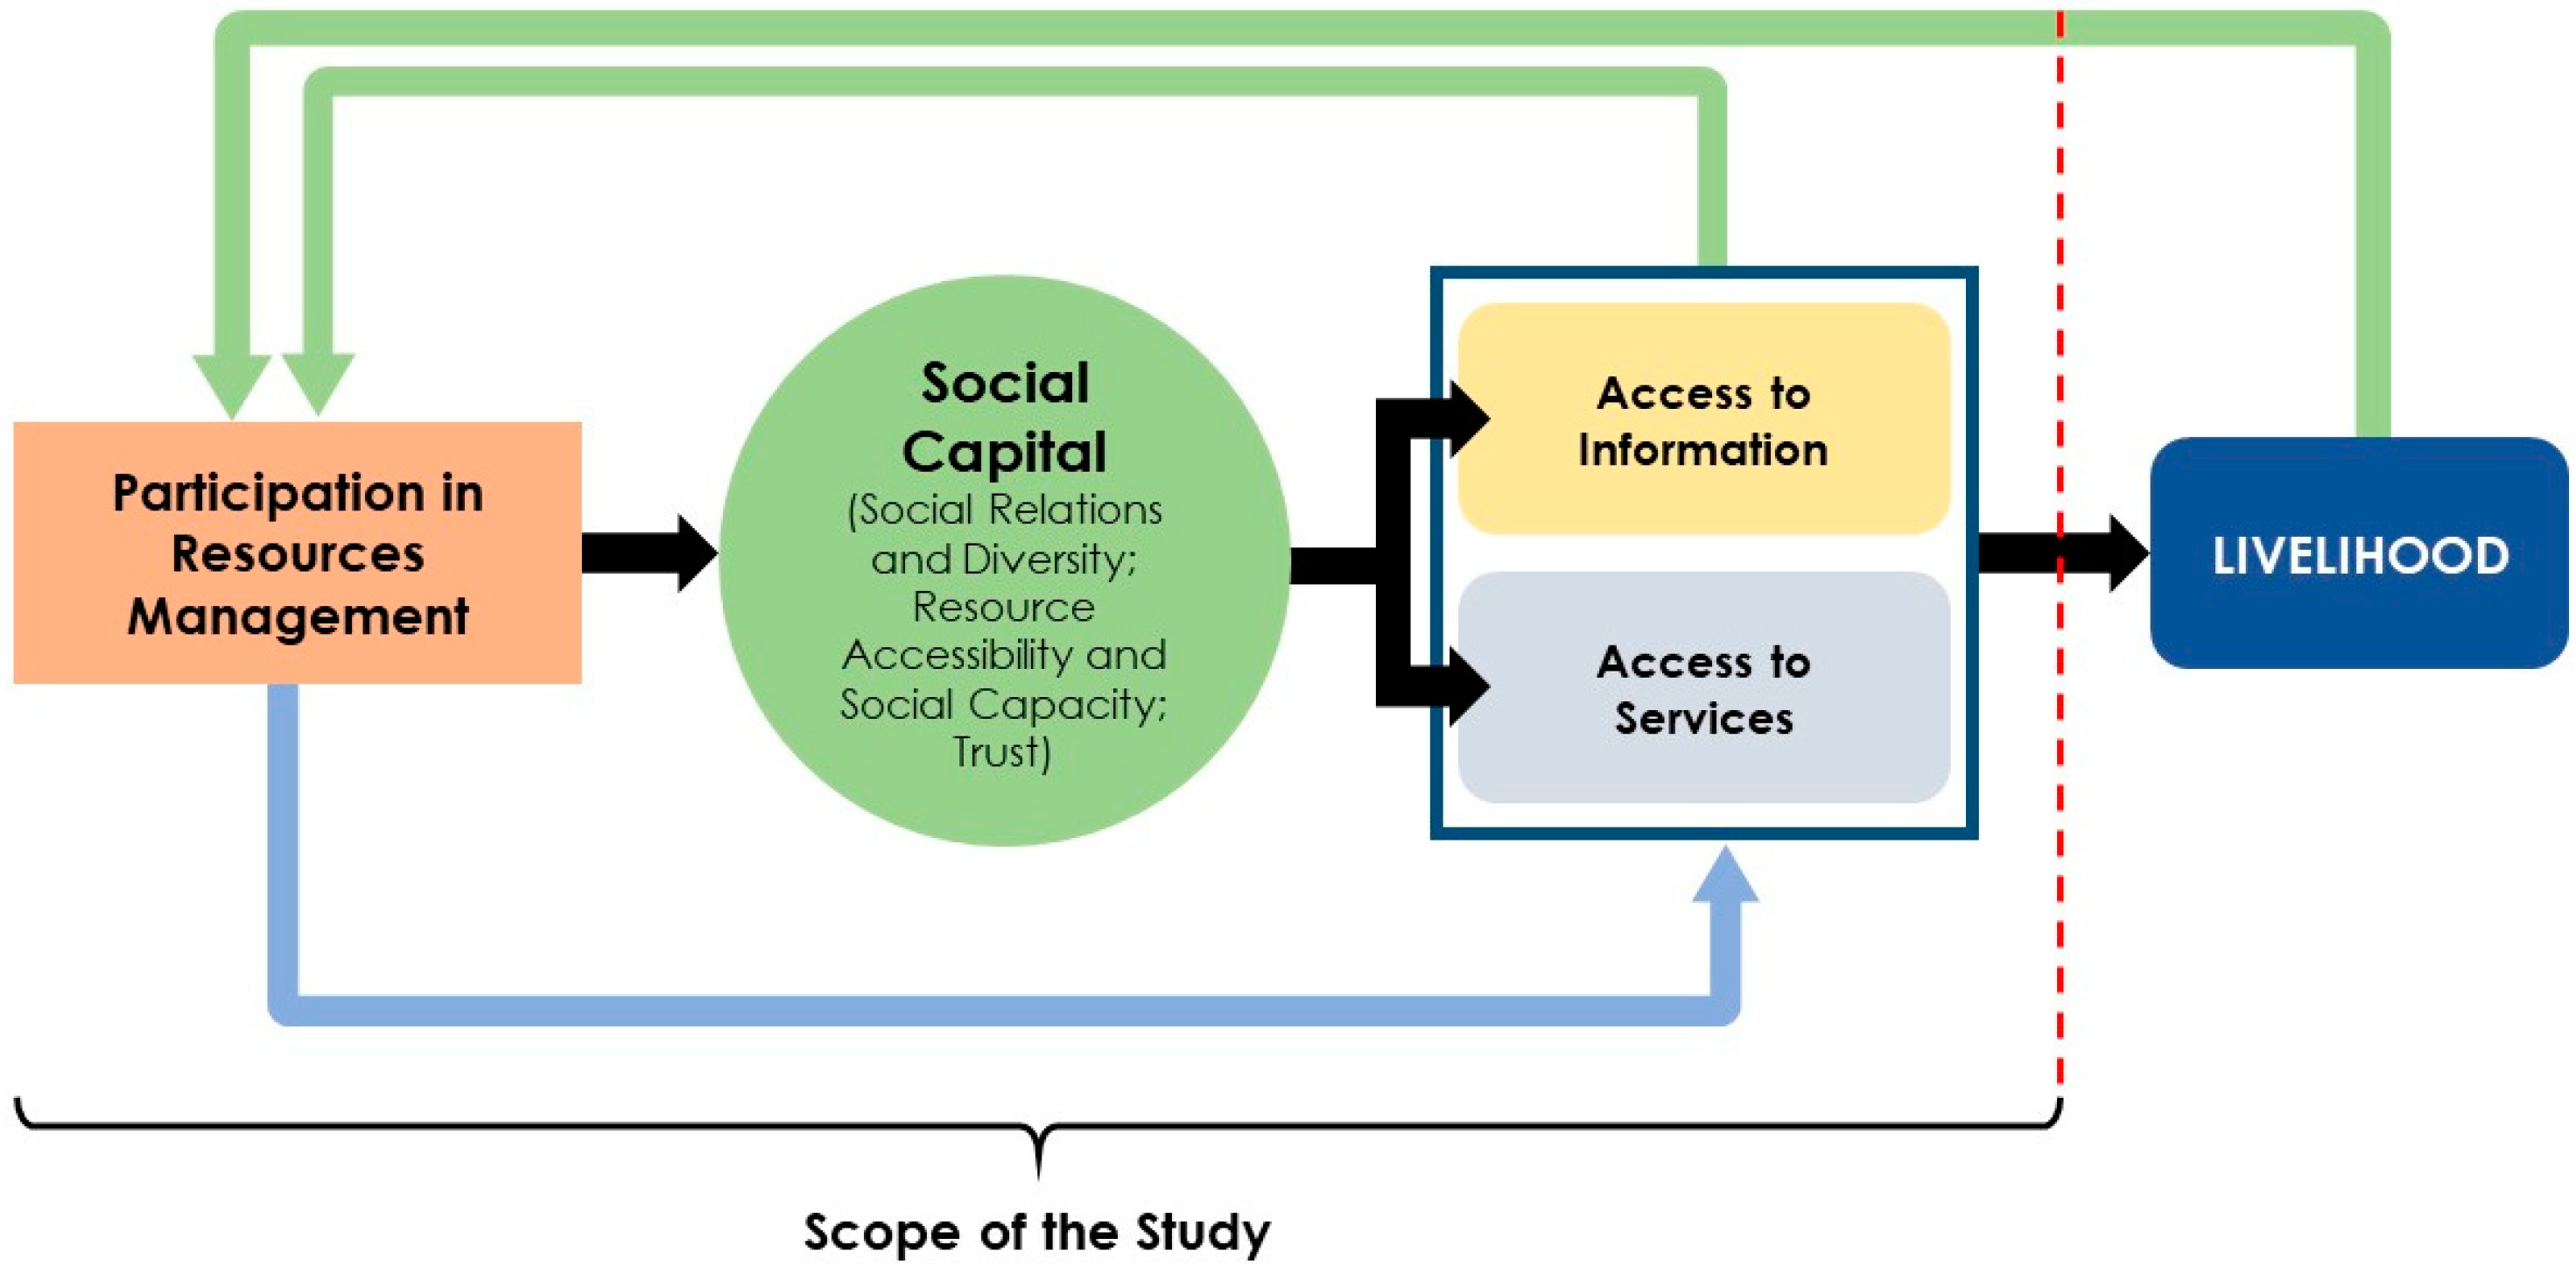
2.1. Research Scope

This study focused on the impacts of local participation in resource management on the development of a community and its people, specifically the effects on social capital and people’s livelihoods. The utility of social capital for the improvement of livelihoods is considered as an incentive that can motivate people to actively and continuously participate in resource management projects. “People who are better equipped with social capital will be better able to attain their ends” [20]. This study further analyzed the impacts of social capital on people’s livelihoods. As defined by [58], livelihood encompasses components beyond financial capital and income and is referred to as “the capabilities, assets (stores, resources, claims and access) and activities required for a means of living.” However, due to limitations, this study only covered access to information and services as variables that affect people’s livelihoods.
“Information is important in providing a basis for action” [23], and having access to information improves one’s opportunity for development, e.g., seeking a job [27]. Social capital in the form of social networks, as discussed in the paper of McCreadie and Rice [59], were identified as one of the assets which allow accessing information which can be shared and transferred through one’s interpersonal networks. The paper also highlighted the relevance of the weak ties, as defined by Granovetter [60], in seeking information that are not common knowledge and are not repeatedly used, where only handful of people have knowledge of. On the other hand, access to services provides support for people to develop their overall capabilities and conditions which include improving their health, financial insurance, and literacy. Social capital as represented by engagement and network of people with public organizations could create a better communication route to express their demands and needs [61], thus delivering better public services.
The effects of participation in resource management projects can enhance social capital and increase access to information and services which will improve livelihoods. Enhanced access to information and services attained with enhanced social capital can make the people more motivated and perceive mangrove restoration and management positively. The conceptual framework of the study is shown in Figure 1.

2.2. Theoretical Background

Social capital theory argues that resources are contributed and shared, and become accessible through the establishment of social relations [25,27,62]. This study follows the definition of social capital by Lin [27] as “the capital captured through social relations… with expected returns in the marketplace” with its concept understood by its functions [23]. Several scholars (e.g., [20,25,63]) also take this view and regard social capital as a productive asset that facilitates social and economic improvement. People and communities with better networks and higher social capital have a higher possibility of achieving better outcomes [20,32,64,65]. Furthermore, the author of [20] emphasized that an investment in social capital must also be seen as an investment in other assets, since social capital packages other forms of capital. The concept of social capital is illustrated in Figure 2.
Social capital is the resource captured from social relations [28,62]. In this regard, the number of ties and networks a person has is a major factor that determines his social capital. However, increased social relations may not always increase one’s social capital, as several factors may affect the number of resources a person can access through his social relations. This study focused on three factors that can affect social capital: (a) diversity of social relations, (b) resource accessibility and social capacity, and (c) trust.

2.2.1. Social Relations and Diversity

Theoretically, having more social relations corresponds to having higher social capital, as these relations function as sources of embedded resources [20,34,65]. However, Teilmann [34] elaborated that “not all ties are similar.” Each tie has different amounts of resources and information. The nature and type of the social relations a person is associated with also affect the quantity and diversity of resources he can access. Two of the most common dichotomies of social relations were described by Granovetter [60] and Putnam [66]. Granovetter [60] differentiated strong ties from weak ties. Strong ties are relations that are readily available and can be easily established [60] and require little maintenance [34] while weak ties are the more distanced connections [60,67]. Putnam [66], on the other hand, differentiated social relations between bonding and bridging. Bonding social relationships are those with homogeneous groups, while bridging relations are the connections with other social classes [33,68,69]. Despite the stronger relationships with strong ties and bonding social capital, it may not be enough to produce sufficient benefits, opportunities, and impacts to improve one’s condition; for this purpose, establishing weak ties and bridging social capital are necessary. The work of Woolcock and Narayan [65] also explained that for the poor, bridging social capital is more important since it allows them to “get ahead” by accumulating more resources and better opportunities. Although bonding social capital is also relevant, it can only help the poor to “get by”.

2.2.2. Resource Accessibility and Social Capacity

Social relations are sources of information and resources, and having social relations benefits people as it increases their assets [25,27]. However, social relationships alone may not be sufficient to advance a person’s condition and status. Utilization of social relations is required for them to be impactful. Everyone has their own capacity to utilize their social relations and the attached embedded resources, or social capacity. It is the “ability of rural people to organize and use their social capital and other assets through various social structures and processes to achieve valued economic objectives” [63]. Lin [27] elaborated this in his theory of social capital, that access to and use of social resources are dependent on the ability of the individual. Those people who can use their social relations more effectively are expected to have higher incomes [63].

2.2.3. Trust

Trust is “a basic element of the relational dimension” [70] and the most essential element of social capital [35]. It is requisite to build and maintain social relations [32] and functions as a lubricant for interactions and cooperation between actors [34]. Groups exhibiting trust in their members can accomplish more compared to those without trust [23,71,72]. Furthermore, utilizing social relations requires trust; in contrast, having no trust depletes the purpose of social capital and undermines the contribution and sharing of embedded resources [28,69].

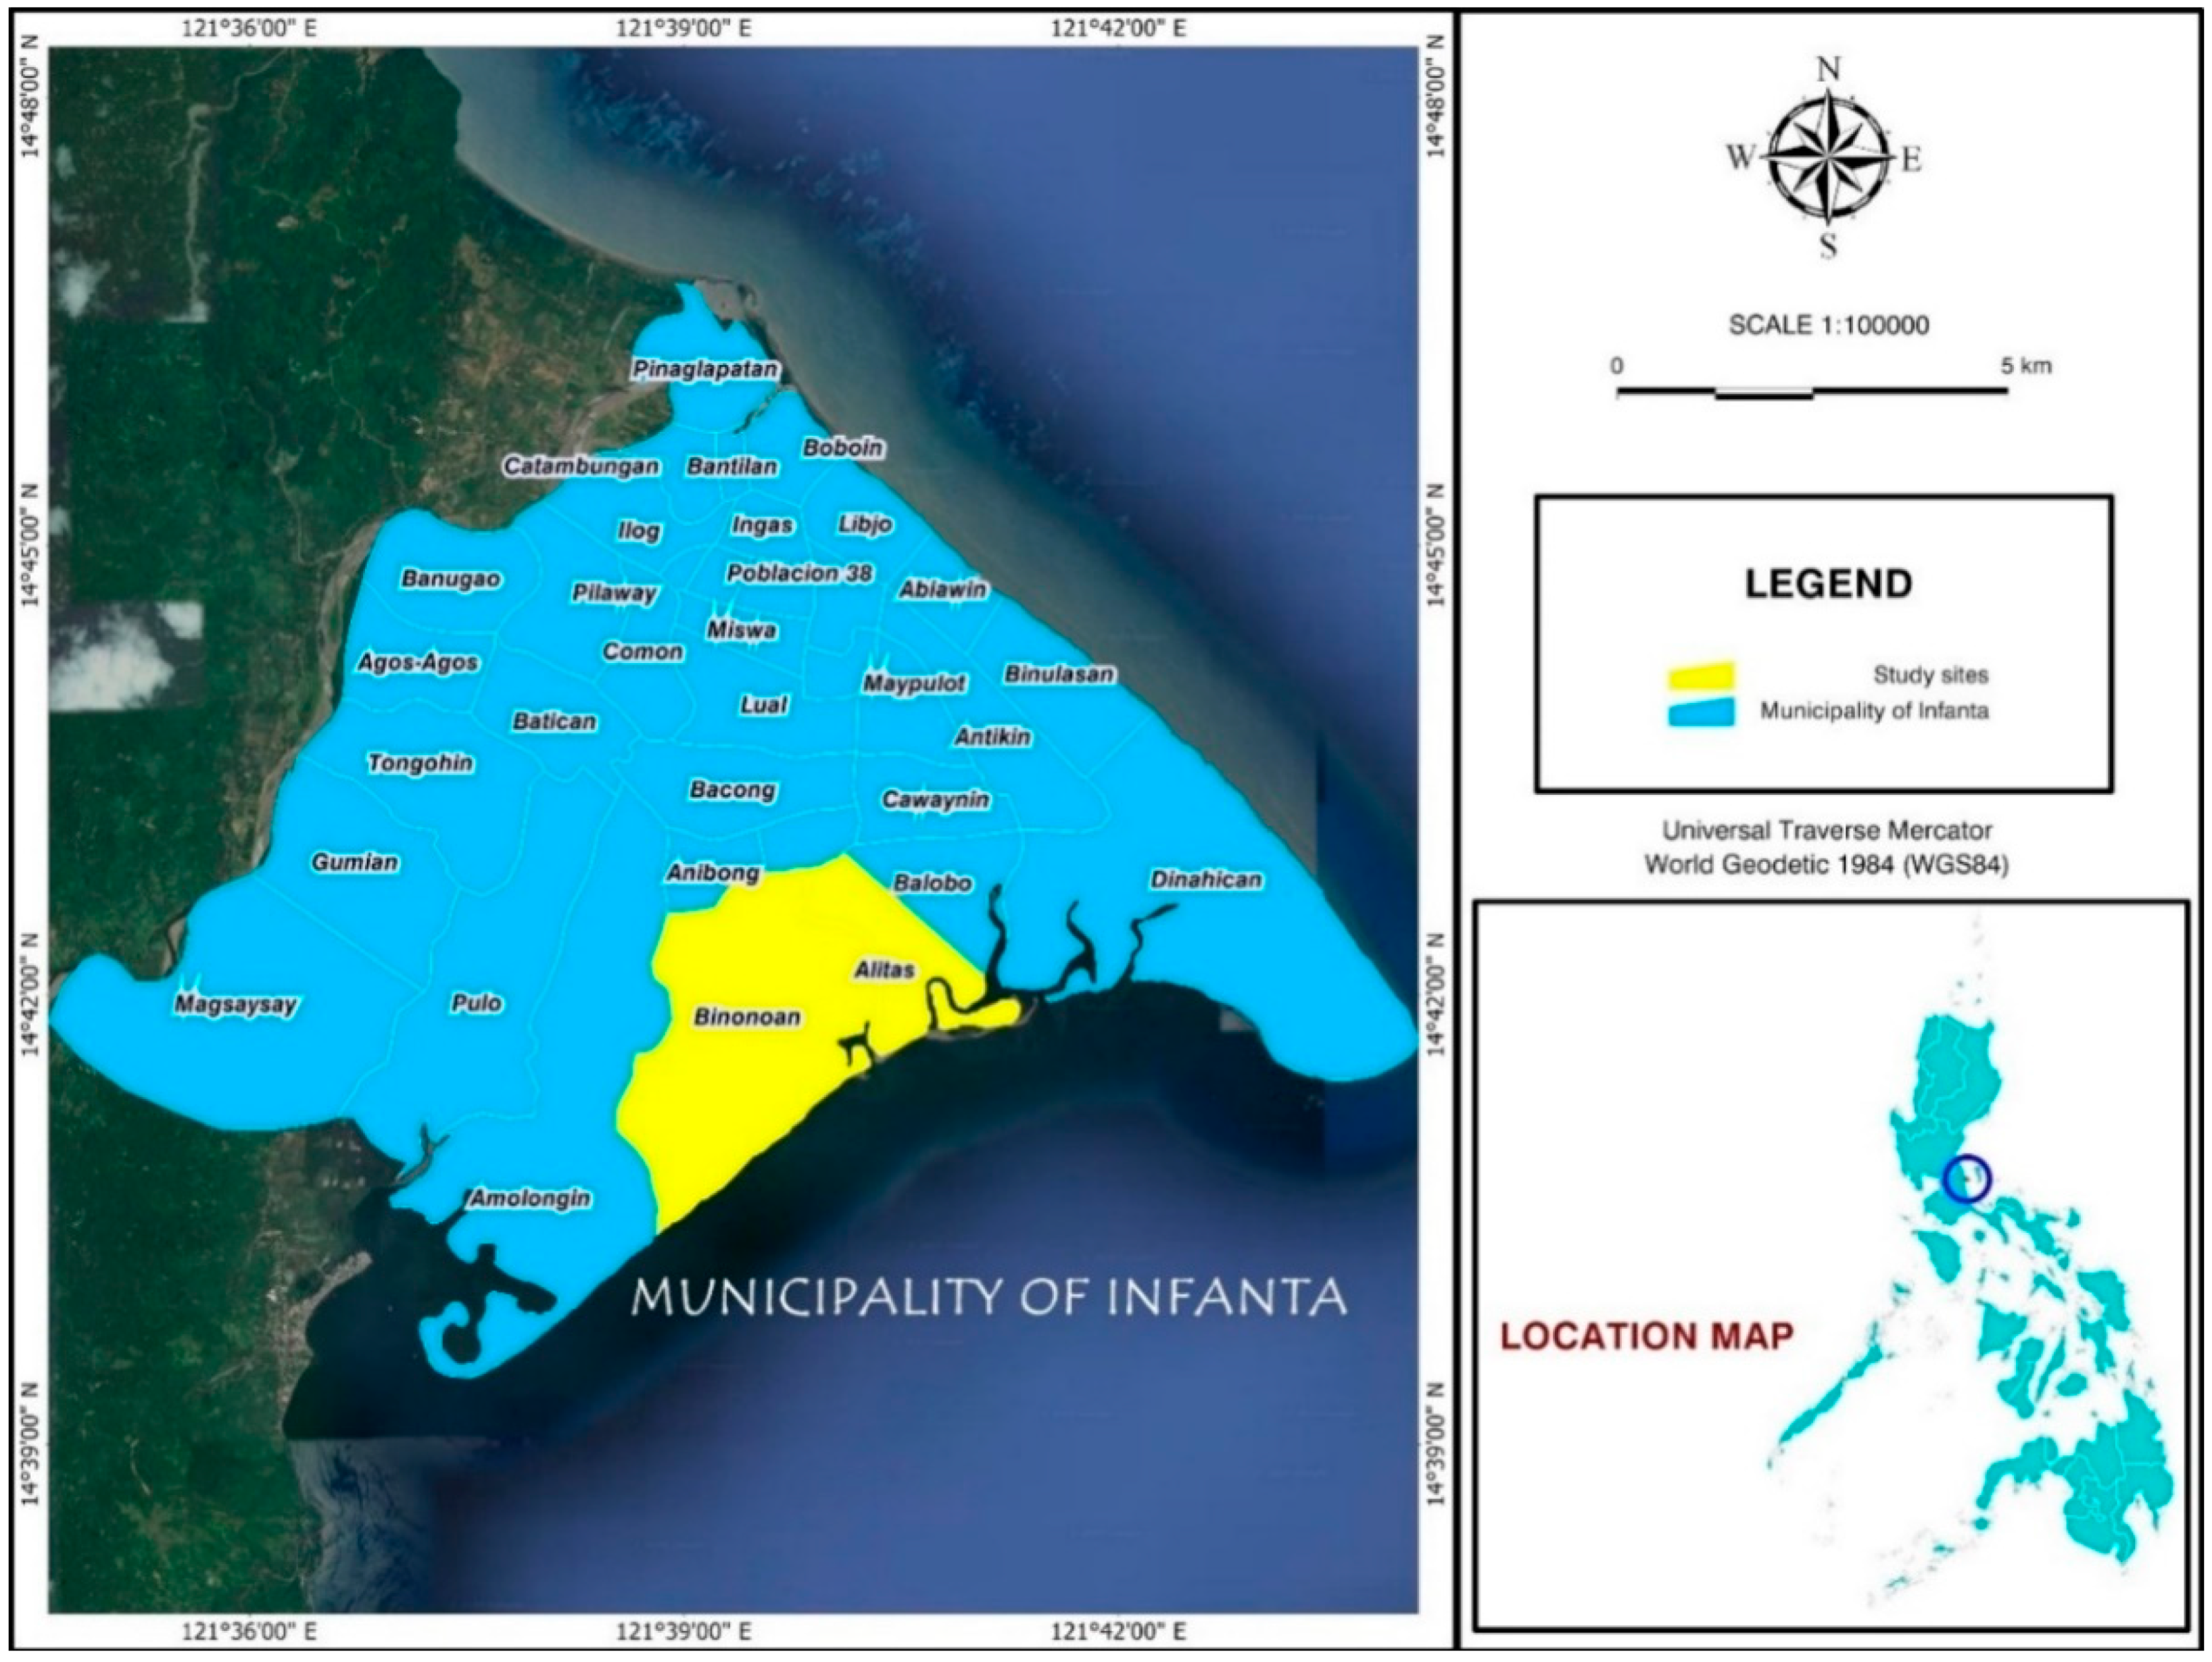
2.3. The Study Site and the People’s Organization

The study was conducted in two barangays (the smallest political unit in the Philippines, abbreviated as Brgy.): Brgy. Alitas and Brgy. Binonoan in the municipality of Infanta in the province of Quezon (Figure 3). Infanta lies in the southern part of the main island of the Philippines. Both areas are classified as rural barangays, where the main sources of income are related to farming, forestry, and fishing, as well as being contracted as laborers and unskilled workers [73]. Brgy. Alitas comprised of 279 households while Brgy. Binonoan has 356. Both barangays are home to people’s organizations (People’s Organization (PO), as defined by the 1987 Constitution of the Republic of the Philippines, are bonafide associations of citizens with demonstrated capacity of promoting the public interest and with identifiable) (POs)—the Alitas Farmers Association (AFA) of Brgy. Alitas and the Binonoan Producers Cooperative (BIPCO) of Brgy. Binonoan. PO members represent those who participate in natural resource management—in mangrove restoration project in this study. The Philippine government implements decentralized governance of managing forests and mangroves in the country through partnerships with the POs. The government recognize the role of the communities and local groups, including POs, in the conservation of natural resources through community-based forest management law (Executive Order No. 263 of 1995) [74]. Furthermore POs were given the primary responsibilities of participating in the recent major reforestation and conservation programs in the country, as indicated in Executive Order No. 26 of 2011 [75].
The two POs started as part of a federation formed by the local government of Infanta to fight private groups and individuals illegally taking over mangrove areas and converting them to fish ponds. In 2013, they were formally formed as POs managing their own projects in collaboration with the local government and different government agencies. AFA and BIPCO participated in NGP, a massive reforestation program under the Aquino Administration that aimed to plant 1.5 billion trees in 1.5 million-hectare lands in the country that started in 2011, and focused their activities in the mangrove areas since their locale is adjacent to the coast. AFA and BIPCO have also expanded their activities beyond environmental programs and are now involved in livelihood development projects. They have partnerships with the Department of Environment and Natural Resources (DENR), Department of Agriculture (DA), Department of Tourism (DOT), and Department of Trade and Industry (DTI).

2.4. Data Collection

Face-to-face interviews using a semi-structured questionnaire was the main method of data collection employed in this research. The questionnaire was designed with five parts, focusing on the following topics: demographic characteristics of the respondents, networks and organizations of the respondents, access to resources and services, access to information, and details on the people’s organization. A total of 314 households were surveyed which comprised both PO members and nonmembers. All 88 households (Brgy. Alitas = 64 and Brgy. Binonoan = 24) with at least one PO member were interviewed. For households with no PO member, respondents were randomly selected from the master lists provided by the barangay secretaries. The total non-PO respondents interviewed was 226, in which, 83 were from Brgy. Alitas and 143 were from Brgy. Binonoan. Data collection was conducted from December 2018 to January 2019.
Key stakeholder interviews were also carried out for a more detailed discussion and better understanding of the situation in the research sites. These interviews were done with the officials of the POs, officials of the barangays, government staff, and community members who are nonmembers of the PO. In addition, reports provided by the POs, barangay offices, local government unit of Infanta, and the DENR-Community Environment and Natural Resources Office of Real were used as reference for secondary data.
Preparatory meetings, consultations, and coordination were done during November 2018. Meetings and consultations were held to explain the background, objectives, and activities of this research and were attended by PO members, PO officials, barangay officials, selected barangay residents, and government staff. Coordination was achieved with the help of government offices with projects on the site. The Free, Prior, and Informed Consent was confirmed by the PO presidents and the barangay chairpersons after consultation with their constituents.

2.5. Measuring Social Capital

This research developed a formula to compute and quantify social capital. Appendix Table A1 shows the matrix that was used to question respondents for the computation of social capital. The computed values of social capital ranged from 0 to 1, where measured values closer to 1 represent higher levels.
Social Capital = Ties Value × Embedded Resources Value × Trust Value
Note: we obtained a computed social capital value of 0 for several respondents in the study, however, this does not reflect that these respondents do not have social relations. In general, social capital includes any form of social connections, including neighbors, family, and friends. However, since this research focused on social relations that have actual and potential impacts on people’s livelihoods, not all social relations were covered.
A. Ties value covers the concept of social relations. Resources are captured through the establishment of connections with other individuals or groups [27]. Without ties, no social relation or network is formed, thus, no embedded resource.
Ties value = (Ties + Diversity)/2
A.1. Ties. The size of a network matters [25,69] as the number of ties and networks may represent the amount of resources a person can access [25,27]. More ties may reflect more collectively owned resources available to the individual. To determine the number of ties, respondents listed all organizations, associations, or companies they have connections with. The number of ties is equal to the number of the respondent’s affiliations. In this study, the most ties a respondent could have was eight (maximum actual number of ties).
Ties = n u m b e r   o f   t i e s m a x i m u m   a c t u a l   n u m b e r   o f   t i e s
A.2. Diversity of ties can be explained by “a more diverse composition of ties is positive for the accumulation of social capital” [34], as each tie comes with a particular kind of asset. Consequently, more diversified ties create access to more diversified forms of resources and assets. Furthermore, the diversity of ties represents sources of information. Ties were classified into five categories: (1) local association, (2) local business, (3) municipality-level association, (4) professional association, and (5) national-level association. The diversity of ties was measured by the different kinds of ties respondents had. The maximum diversity of ties is equal to five.
Diversity   of   ties = d i f f e r e n t   k i n d s   o f   t i e s m a x i m u m   d i v e r s i t y   o f   t i e s
B. Embedded resources value represents the actual and potential resources accessible to respondents through their social relations.
Embedded Resources Value = (GESM + AER)/2
B.1. General economic status of members (GESM). The amount of resources possessed by the individuals and groups in one’s social relations is a major factor in one’s social capital [19], as these are the embedded resources that can potentially be used. GESM was measured through the respondent’s perception of the amount of resources owned by those among their social ties using a 5-point Likert scale: 1: very low; 2: low; 3: average; 4: high; and 5: very high. GESM is the sum of the weights of resource ownership by members of the respondent’s social network, with the maximum possible weight equal to five.
GESM = Σ   weights   of   perceived   resource   ownership number   of   ties max   possible   weight   of   perceived   resource   ownership
B.2. Access to embedded resources (AER). This relates to the second component of the social capital concept of Lin [27] and to social capability. Mobilizing the resources embedded in one’s social networks is what leads to one’s betterment [27]. AER was measured using a 5-point Likert scale: 1: very low; 2: low; 3: average; 4: high; and 5: very high. Respondents were asked to rate the level at which they access and use the resources owned by their organizations and members. The maximum possible weight of access to resources is equal to five.
AER = Σ   weights   of   access   to   embedded   resources number   of   ties max   possible   weight   of   access   to   resources
C. Trust value. Trust between actors is a requirement for working together. Without it, cooperation and reciprocity may not exist [23,33,34]. Additionally, it is important in building, strengthening, and maintaining social relationships.
Trust   Value = ( T r u s t   i n   t i e s +   P a r t i c i p a t i o n   i n   s o c i a l   t i e s ) / 2
C.1. Trust in ties signifies the person’s level of trust in his current ties. This represents the possibility to continue working and maintaining existing social ties. This was measured using a 5-point Likert scale: 1: very low; 2: low; 3: average; 4: high; and 5: very high. The maximum possible weight of current ties is equal to five.
Trust   in   ties = Σ   weights   of   trust   in   ties number   of   ties max   possible   weight   of   trust   in   current   ties
C.2. Participation in social ties. For a partnership to function, both sides need to trust each other and meet their responsibilities and obligations, which will yield reciprocity. Local people are obligated to participate in activities and projects of their social ties to extend trust between parties. People’s level of participation reflects their dedication to their social ties to maintain cooperation. This component was measured by the respondent’s degree of participation in the activities and events of their ties. Respondents were asked to select among four choices: (1) does not attend events and meetings; (2) fair number of absences (average); (3) present most of the time during events and meetings; and (4) never absent from any events or meetings. The maximum possible weight of trust in ties is equal to four.
Participation   in   social   ties = Σ   weights   of   participation   in   social   ties number   of   ties   maxpossible   weight   of   trust   in   ties

2.6. Analysis Model

2.6.1. Factors Affecting Social Capital

A tobit model was used to determine the factors affecting social capital. This is the most frequently used model for censored data [76]. Using the formula developed in this study, social capital will result in values ranging from 0 to 1, hence, was treated as censored data due to the presence of upper and lower boundaries. We regressed the social capital against PO membership (dummy variable) and socio demographic factors (annual income and educational attainment of the household head) as formulated in Model 1. The variables used in the regression analysis are explained in Table 2. Furthermore, the Kruskal–Wallis test, a nonparametric test, was performed to determine any significant differences between groups [77].
YSC Value = β0 + βPO + βEducation + βIncome + ui (Model 1)
where YSC is the measure level of social capital, PO dummy for people’s organization membership, βi coefficient of independent variable i and ui the error term for individual i. YSC value has a lower threshold of 0 and an upper threshold of 1.

2.6.2. Factors Affecting Access to Information and Services

Two linear regression models were developed to test the impact of social capital on people’s access to information (Model 2) and services (Model 3). These are the effects of social capital extended and the potential benefits that people can gain from their participation in mangrove restoration projects, and at the same time, motivate them to continue their involvement in the project. Descriptions and explanations of the variables used in the regression models are presented in Table 2.
YInformation = β0 + βSC Value + βEducation + βIncome + ui (Model 2)
YServices = β0 + βSC Value + βEducation + βIncome + ui (Model 3)
where YInformation and YServices are the levels of access to information and access to services, respectively.

3. Results

3.1. Socioeconomic Characteristics of Respondents

Household surveys with face-to-face interviews (n = 314; 88 PO members and 226 nonmembers) were conducted in Brgy. Alitas (n = 147) and Brgy. Binonoan (n = 167). The respondents were almost equally represented by men (n = 159) and women (n = 155). Their mean age was 46.77 years old and the average household size was 4.21 members. In terms of educational attainment of the household head, less than half graduated from high school and less than a quarter pursued a college degree. Most of the respondents earned less than PhP 60,000 (USD 1181) to PhP 119,999 (USD 2362) per year while almost 7% of the respondents earned more than PhP 180,000 (USD 3547). The summary of the socioeconomic characteristics of the respondents is shown in Table 3.

3.2. Descriptive Statistics

Table 3 also presents the summary of the descriptive statistics of the variables covered in this study with corresponding result of the Kruskal–Wallis test. It was observed that for the variables used to compute social capital—ties value, embedded resources value, and trust value—the mean values for the PO members is higher compared to the non-PO members. The results of the Kruskal–Wallis test confirmed statistical differences in all the observed variables (p < 0.001), except in the household size and household head education, between the members and the non-members of the PO. This test also covered the sub-variables used to compute ties value, embedded resources value, and trust value: the number of ties, diversity of ties, general economic status of members, access to embedded resources, trust in ties, and people’s participation in their social ties.

3.3. Statistical Results

3.3.1. Impacts on Social Capital

Tobit regression was employed to measure the influence of the PO membership, level of education, and income on social capital. Results of regression analysis are shown in Table 4. It indicates that the member of PO is an important factor of social capital with a positive association. The level of education and income, although not statistically significant, also exhibits positive associations with social capital. The estimated model explains 47% of variations.

3.3.2. Access to Information and Services

Models 2 and 3 were employed to determine the impacts of the social capital, educational attainment, and income on the access to information and services, respectively. Results of regression analysis are shown in Table 5 and Table 6. The estimated equation of Model 2 reveals that social capital and income level are statistically significant factors of access to information, both having positive associations with the social capital. Similarly, social capital and level of income were found to be significant factors, with positive associations, of access to services (see Table 5 and Table 6).

4. Discussion

4.1. Impacts of Participation on Social Capital

The result of regression analysis supports the hypothesis of this study, that participating in natural resource management improves social capital and is in line with the findings of previous research [31,79]. Results of the Kruskal–Wallis test also showed statistical differences between the PO members and non-members in their social capital (p < 0.001), network size expressed here as ties value (p < 0.001), embedded resources value (p < 0.001), and trust value (p < 0.001).
The most perceivable impact of participation can be observed in the difference in the amount of external social relationships, presented by number of the ties, between PO members (mean = 0.50) and nonmembers (mean = 0.11). Thus, external social relationship is considered to be an important determinant of social capital. Members of POs have established connections and partnered with different government organizations such as the DA, DTI, and DOT in the process of their involvement in the mangrove restoration project initiated by DENR. Dasgupta et al. [67] described this as the utilization of indirect links, in which people can establish networks by means of their existing ties. The networks with external organization have also improved the PO members’ access to diverse and more resources, mainly provided through government programs, that made more embedded resources available to the PO members (mean = 0.38) compared to the nonmembers (mean = 0.67). New collaborations with other external organizations of the PO can also be explained by the accomplishments of the two people’s organizations in mangrove restoration projects, where both POs were awarded with recognition as top performing organizations contributing to the NGP. The awards can serve as a proof and recognition that strengthen trust in the POs by external organizations, increasing the possibility of receiving continuous support and involvement in future projects [27,34]. Repeated interactions between POs and the government can strengthen the trust between the parties, leading to more positive collaborations [26,67]. Being involved in more projects allows more cooperation between the members of the PO, thus strengthening the trust within their group. The trust value of PO members in their groups (mean = 0.72) is higher than the nonmembers (mean = 0.46). Additionally, PO members (mean = 0.72) are more active in participating in various events of their organizations compared with the nonmembers (mean = 0.54). Discussions, meetings, and dialogues between stakeholders are held as part of the project implementation, improves support and trust even from non-PO members. As Willis [81], focusing on Elinor Ostrom’s research on common pool resources, emphasized the importance of face-to-face communications in strengthening trust and cooperation among people, the members of POs were engaged in more communications during the mangrove restoration projects and became more cooperative in community affairs and to trust each other.
It was also determined, through the interviews and consultation, that nonmembers respect those who are members of the PO and recognize their accomplishments. Nonmember residents, as well as the village councils and the local government, have acknowledged both POs for their role in the protection and conservation of the environment. Residents of the two barangays generally trust the POs not only as environmental stewards but also as conflict managers and credible sources of information.

4.2. Social Capital and Access to Information

The results of the regression analysis support the hypothesis that the increased social capital (p < 0.001) improves people’s access to information. The result of Kruskal–Wallis test revealed that PO members develop more ties (mean = 0.52) than the nonmembers (mean = 0.13); PO members also have more diverse ties (mean = 0.47) than non-members (mean = 0.20). Social ties are sources of embedded resources, as well as information [25,27]. Accordingly, the density of people’s social ties and networks affects the diversity and sources of information they can access [23,27,82]. Lin [27] also emphasized that social ties “activate chains of multiple actors” that extend one’s social networks: a person is indirectly connected with the networks of his social ties, i.e., the friends of his friends. This allows the utilization and activation of more resources and information. Similar to Lin’s argument, our analysis indicates that those with denser and more diverse networks have more opportunities to acquire information.
As confirmed by the PO officials and members through interviews, POs have established strong connections with other external organizations that feed them information, including information about new government programs. The diversity of the POs’ networks can be reflected in their ties with different government agencies, in local, regional, and national level, and in a wide range of fields and sectors, such as is agriculture, tourism, and with state universities. This highlights the significance of bridging social capital over bonding social capital, which was emphasized by Dasgupta et al. [67] and Granovetter [60]. Bridging social capital produces sources of diverse and “nonredundant” information that facilitates development and progress [83]. Furthermore, higher social capital enables reduced transaction cost [20,26,65]. POs’ connections with government agencies and other external organizations allow them to access a wide range of information through a faster route, since they have direct contacts with these organizations. Higher social capital facilitates “good information flow” [70]. Conversely, those who have inadequate social capital have scarce information [69]. In addition, trust is seen as a key component of productive cooperation that allows a better flow of knowledge and acquisition of new ideas and technologies [84,85]. Based from the interviews with PO officials, previous accomplishments of their organizations resulted in trust of external organizations, including government institutions. This made them available for more participation in government trainings and bigger projects. For example, AFA members received trainings for mushroom farming from the Department of Agriculture while BIPCO was granted a mechanized sugar production from Nipa (Nypa fruticans) from the Department of Trade and Industry.
Result of Model 2 estimation also revealed that income is positively associated with access to information. This is in line with the findings of previous research [6,86,87,88]. Households with limited financial assets endure social disadvantages and generally have lower literacy compared to wealthier households. These social constraints of the poor compromise their ability to have access to information and utilize technical knowledge [87].

4.3. Social Capital and Access to Services

The results of estimation for Model 3 support the hypothesis that social capital improves access to services. Regression findings showed that social capital and income are statistically significant factors of people’s access to services. These services are provided to improve people’s well-being and convenience. There are two standard ways to access these services: (1) by having the resources (normally in terms of financial assets) for payments, or (2) by taking advantage of services provided by the government as assistance for those who are financially constrained.
Higher financial capabilities improve a person’s ability to access services. If freedom can be viewed as opportunity, as argued by Sen [35], then a person’s financial capability provides the person with freedom to get access to more services. The respondents in this study possess limited financial assets, as reflected in their annual income. This condition forces them to rely on government programs to gain access to various services.
With regards to social capital, having more and diverse ties, PO members (mean = 0.50) have allowed them to enjoy more access to services compared to the nonmembers (mean = 0.11). This is corroborated with the result of the Kruskal–Wallis test for access to services variable and revealed that there is a statistical difference between the PO members (mean = 21.47) and nonmembers (mean = 16.77). It was disclosed by the PO members and their officials during the interviews and key stakeholder meetings that they receive more services compared to nonmembers. Almost all PO members are involved in government-led livelihood programs in their barangays. The increased income from these programs improves their capacity to access more services, such as education and health. In terms of financial sources, especially during emergencies, POs have established a revolving fund that members can borrow from. This financing scheme is easier to access since it does not require collateral, unlike in formal financing institutions. The same result was concluded by McGrath et al. [89] in their study, in which they observed that participants of PES projects can easily borrow money from the group, which does not require collateral, compared to nonparticipants. In addition, the information they receive from the regular PO meetings improved their opportunities to access services. For instance, all PO members know the “Botika ng Barangay” where people can access medicines at cheaper prices. Meanwhile, a number of nonmembers are not aware that this program exists in their area.
The Palakasan or Padrino system, which is common in the Philippines, was also observed in both POs. This system is a “value system where one gains favor, promotion, or political appointment through family affiliation (nepotism) or friendship (cronyism), as opposed to one’s merit” [90]. POs, as they have already proven with their accomplishments and recognition, were favored collaborators of development programs. Although this portrays bias and undermines the equality of the selection process, it adds to the assurance that the objectives and deliverables of the programs can be achieved because of the good track record of the POs. This system was also explained implicitly by Lin [27] as one of the advantages of social capital.

5. Conclusions

This study argues that participation in natural resource management can provide benefits for people, more than just tangible benefits, but intangibles that indirectly lead to more sustainable and long-term rewards. The results of this study confirmed that people’s participation in mangrove restoration projects increases social capital, consequently improving their access to information and services. In general, increased social capital reflects higher density and more diverse social ties, having more access to resources, and stronger trust. The differences in social capital are evident between the members and the nonmembers of the PO, representing those who do and do not participate in mangrove restoration projects implemented in co-management format. The networks established by the PO members, through their engagement and accomplishments in government-led environmental projects, allowed the creation of more networks that further resulted in more project involvements and benefits, directly and indirectly.
These benefits motivate people towards more effective and continuous participation in projects. The records and reports of the POs showed that the size of their organizations grew as they engaged in more projects, their inactive members started to participate in PO meetings and PO activities again. The PO membership further increased since their involvement in the implementation of the NGP and MBFDP.
Social capital, through a person’s social networks, is a means to acquire benefits. However, it requires investments. Following the investment argument, it can be argued that people build connections with others whom they believe can provide more resources [20]. This study found out that the PO members are more active in participating in the organization’s activities than other civic organizations, such as labor and community groups. Moreover, PO members value their membership to their group because of the rewards they can get and the respect from the nonmembers and external organizations.
The findings of this study can be applied to development of policies for sustainable management of forest resources. In particular, designing cooperative management programs with enhanced participation of local people in decision-making for forest management. We argue that participatory forest management can not only contribute to environmental sustainability but also help the social capital of society to be built for enhancing people’s livelihoods.
Although different types of social connections are recognized by other researchers such as [19,91] in the measurement of social capital, in this study, we did not distinguish ties between bonding and bridging social capital due to difficulties in measurement. The potential difference in the impacts of social connections by different types can be further studied in future research.
Significance of having a good leader in the success of the organizations was also observed during data collection. Both POs have reputable leaders and are trusted by external organizations. This factor was not included in the study. This, including the other limitation, should be considered for further research.

Author Contributions

R.B.V. designed the study, conducted the survey, processed and analyzed the data, interpreted the results, and wrote the first manuscript. Y.Y.-C. and M.S.P. provided comments in designing the study and analyzing the data, as well as edited the manuscript. J.-N.C. supervised the overall research. All authors have read and agreed to the published version of the manuscript.

Funding

This study was carried out with the support of Seoul National University Carbon Sink Graduate Program (grant number 500-20180066) provided by the Korea Forest Service & Korea Forestry Promotion Institute.

Acknowledgments

The authors would like to thank the people of Barangay Alitas and Barangay Binonoan, Infanta District, Quezon, the Philippines, for all their help and assistance during the field survey. Additionally, the first author would like to express his sincere gratitude to the Korea Forestry Promotion Institute (KOFPI) for providing the full scholarship for his master’s degree.

Conflicts of Interest

The authors declare no conflict of interest. The funders had no role in the design of the study; in the collection, analyses, or interpretation of data; in the writing of the manuscript, or in the decision to publish the results.

Appendix A

Table A1. Measuring social capital.
A. OrganizationsB. Name of OrganizationC. General Economic Status of the MembersD. “Access to” and “Use of” the Resources Owned by the Organization or IndividualE. Trust in Ties and OrganizationsF. Participation in Social Ties
Environmental Group (Bantay Gubat)
People’s Organization
Farmer/Fisherman group or cooperative
Finance, credit, savings group, cooperatives
Traders or Business Association
Professional Association
Trade Union or Labor Union
Neighborhood/ Village committee
NGO or civic group (Rotary Club, Red Cross)
Women’s group
Others
A.1. Ties—counting the number of ties or membership to organizations. A.2. Diversity of ties—classification of ties into five categories: (1) local association, (2) local business, (3) municipality-level association, (4) professional association, and (5) national-level association. B.1. General economic status of members—was measured through the respondent’s perception of the amount of resources owned by those among their social ties using a 5-point Likert scale: 1: very low; 2: low; 3: average; 4: high; and 5: very high. B.2. Access to embedded resources—respondents were asked to rate the level at which they access and use the resources owned by their organizations and members. AER was measured using a 5-point Likert scale: 1: very low; 2: low; 3: average; 4: high; and 5: very high.C.1. Trust in ties—measured using a 5-point Likert scale: 1: very low; 2: low; 3: average; 4: high; and, 5: very high. C.2. Participation in social ties—people performing their obligation to their organizations and ties. Respondents were asked to select from among four choices: (1) does not attend events and meetings, (2) fair number of absences (average), (3) present most of the time at events and meetings, and (4) never absent from any events or meetings.

References

  1. Adams, W.M.; Hutton, J. People, Parks and Poverty: Political Ecology and Biodiversity Conservation. Conserv. Soc. 2007, 5, 147–183. [Google Scholar]
  2. Porter-Bolland, L.; Ellis, E.A.; Guariguata, M.R.; Ruiz-mallén, I.; Negrete-yankelevich, S.; Reyes-garcía, V. Forest Ecology and Management Community managed forests and forest protected areas: An assessment of their conservation effectiveness across the tropics. For. Ecol. Manag. 2012, 268, 6–17. [Google Scholar] [CrossRef]
  3. Méndez-López, M.E.; García-Frapolli, E.; Ruiz-Mallén, I.; Porter-Bolland, L.; Reyes-Garcia, V. From Paper to Forest: Local Motives for Participation in Different Conservation Initiatives. Case Studies in Southeastern Mexico. Environ. Manag. 2015, 56, 695–708. [Google Scholar] [CrossRef]
  4. Mannigel, E. Integrating Parks and People: How Does Participation Work in Protected Area Management? Integrating Parks and People: How Does Participation Work in Protected Area Management? Soc. Nat. Resour. 2008, 21, 498–511. [Google Scholar] [CrossRef]
  5. Karki, S.T. Do protected areas and conservation incentives contribute to sustainable livelihoods ? A case study of Bardia National Park, Nepal. J. Environ. Manag. 2013, 128, 988–999. [Google Scholar] [CrossRef] [PubMed]
  6. Agrawal, A.; Gupta, K. Decentralization and Participation: The Governance of Common Pool Resources in Nepal ’ s Terai. World Dev. 2005, 33, 1101–1114. [Google Scholar] [CrossRef]
  7. Fox, H.; Cundill, G. Towards Increased Community-Engaged Ecological Restoration: A Review of Current Practice and Future Directions. Ecol. Restor. 2018, 36, 208–218. [Google Scholar] [CrossRef]
  8. Agarwal, B. Participatory Exclusions, Community Forestry, and Gender: An Analysis for South Asia and a Conceptual Framework: Erratum. World Dev. 2001, 29, 1623–1648. [Google Scholar] [CrossRef]
  9. Lele, S.; Wilshusen, P.; Brockington, D.; Seidler, R.; Bawa, K. Beyond exclusion: Alternative approaches to biodiversity conservation in the developing tropics. Curr. Opin. Environ. Sustain. 2010, 2, 94–100. [Google Scholar] [CrossRef]
  10. Eriksson, B.; Johansson, F.; Blicharska, M. Socio-economic impacts of marine conservation efforts in three Indonesian fishing communities. Mar. Policy 2019, 103, 59–67. [Google Scholar] [CrossRef]
  11. Cuenca, P.; Robalino, J.; Arriagada, R.; Echeverrı, C. Are government incentives effective for avoided deforestation in the tropical Andean. PLoS ONE 2018, 13, e0203545. [Google Scholar] [CrossRef] [PubMed] [Green Version]
  12. Moukrim, S.; Lahssini, S.; Naggar, M.; Lahlaoi, H.; Rifai, N.; Arahou, M. Local community involvement in forest rangeland management: Case study of compensation on forest area closed to grazing in Morocco. Rangel. J. 2019, 41, 43–53. [Google Scholar] [CrossRef]
  13. Paudyal, R.; Thapa, B.; Neupane, S.S.; Kc, B. Factors Associated with Conservation Participation by Local Communities in Gaurishankar Conservation Area Project, Nepal. Sustainability 2018, 10, 3488. [Google Scholar] [CrossRef] [Green Version]
  14. Cao, S.; Wang, X.; Wang, G. Lessons learned from China ’ s fall into the poverty trap. J. Policy Modeling 2009, 31, 298–307. [Google Scholar] [CrossRef]
  15. Pulhin, J.M.; Inoue, M.; Enters, T. Three decades of community-based forest management in the Philippines: Emerging lessons for sustainable and equitable forest management. Int. For. Rev. 2007, 9, 865–883. [Google Scholar] [CrossRef]
  16. Smith, J.W.; Siderelis, C.; Moore, R.L.; Anderson, D.H. The effects of place meanings and social capital on desired forest management outcomes: A stated preference experiment. Landsc. Urban Plan. 2012, 106, 207–218. [Google Scholar] [CrossRef] [Green Version]
  17. Yoder, L.; Roy Chowdhury, R. Tracing social capital: How stakeholder group interactions shape agricultural water quality restoration in the Florida Everglades. Land Use policy 2018, 77, 354–361. [Google Scholar] [CrossRef]
  18. Ohno, T.; Tanaka, T.; Sakagami, M. Does social capital encourage participatory watershed management? An analysis using survey data from the yodo river watershed. Soc. Nat. Resour. 2010, 23, 303–321. [Google Scholar] [CrossRef]
  19. Nenadovic, M.; Epstein, G. The relationship of social capital and fishers’ participation in multi-level governance arrangements. Environ. Sci. Policy 2016, 61, 77–86. [Google Scholar] [CrossRef]
  20. Flap, H. No man is an island: The research programme of a social capital theory. In Conventions and Structures in Economic Organization; Favereau, O., Lazega, E., Eds.; Edward Elgar Publishing Limited: Northampton, MA, USA, 2002; pp. 29–59. [Google Scholar]
  21. Geist, H.; Lambin, E. Proximate Causes and Underlying Driving Forces of Tropical Deforestation. Bioscience 2002, 52, 143–150. [Google Scholar] [CrossRef]
  22. Park, M.S.; Youn, Y.C. Reforestation policy integration by the multiple sectors toward forest transition in the Republic of Korea. For. Policy Econ. 2017, 76, 45–55. [Google Scholar] [CrossRef]
  23. Coleman, J.S. Social Capital in the Creation of Human Capital. Am. J. Sociol. 1988, 94, S95–S120. [Google Scholar] [CrossRef]
  24. Putnam, R. Making Democracy Work: Civic Traditions in Modern Italy; Princeton University Press: Princeton, NJ, USA, 1993; ISBN 0691078890. [Google Scholar]
  25. Bourdieu, P. The forms of capital. In Handbook of Theory and Research for the Sociology of Education; Richardson, J., Ed.; Greenwood Press: Westport, CT, USA, 1986; pp. 241–258. ISBN 9780429962882. [Google Scholar]
  26. Fukuyama, F. Social capital, civil society and development. Third World Q. 2001, 22, 7–20. [Google Scholar] [CrossRef]
  27. Lin, N. Social Capital: A Theory of Social Structure and Action; Cambridge University Press: Cambridge, UK, 2001. [Google Scholar]
  28. Portes, A. SOCIAL CAPITAL: Its Origins and Applications in Modern Sociology. Ann. Rev. Social. 1998, 24, 1–24. [Google Scholar] [CrossRef] [Green Version]
  29. Marín, A.; Gelcich, S.; Castilla, J.C.; Berkes, F. Exploring social capital in Chile’s coastal benthic Comanagement system using a network approach. Ecol. Soc. 2012, 17, 13. [Google Scholar] [CrossRef] [Green Version]
  30. Saptutyningsih, E.; Diswandi, D.; Jaung, W. Does social capital matter in climate change adaptation? A lesson from agricultural sector in Yogyakarta, Indonesia. Land Use Policy 2019, 104189. [Google Scholar] [CrossRef]
  31. Prayitno, G.; Sari, N.; Putri, I.K. Social Capital in Poverty Alleviation Through Pro-Poor Tourism Concept in Slum Area (Case Study: Kelurahan Jodipan, Malang City). Int. J. GEOMATE 2019, 16, 131–137. [Google Scholar] [CrossRef]
  32. Putnam, R. The Prosperous Community. Am. Prospect 1993, 4, 35–42. [Google Scholar]
  33. Putnam, R. Bowling Alone: The Collapse and Revival of American Community; SIMON & SCHUSTER: New York, NY, USA, 2000; ISBN 9780684832838. [Google Scholar]
  34. Teilmann, K. Measuring social capital accumulation in rural development. J. Rural Stud. 2012, 28, 458–465. [Google Scholar] [CrossRef]
  35. Sen, A. Development as Freedom; Alfred A. Knopf, Inc.: New York, NY, USA, 1999. [Google Scholar]
  36. World Bank. World Development Report 2000/2001. Attacking Poverty; Oxford University Press, Inc.: New York, NY, USA; Oxford, UK, 2001; ISBN 0195215982. [Google Scholar]
  37. Ballet, J.; Sirven, N.; Requier-Desjardins, M. Social capital and natural resource management: A critical perspective. J. Environ. Dev. 2007, 16, 355–374. [Google Scholar] [CrossRef]
  38. Garcia, K.B.; Malabrigo, P.J.; Gevaña, D.T. Philippines’ Mangrove Ecosystem: Status, Threats and Conservation. In Mangrove Ecosystems of Asia: Status, Challenges and Management; Springer: New York, NY, USA, 2014; pp. 81–94. [Google Scholar]
  39. Nagelkerken, I.; Blaber, S.J.M.; Bouillon, S.; Green, P.; Haywood, M.; Kirton, L.G.; Meynecke, J.O.; Pawlik, J.; Penrose, H.M.; Sasekumar, A.; et al. The habitat function of mangroves for terrestrial and marine fauna: A review. Aquat. Bot. 2008, 89, 155–185. [Google Scholar] [CrossRef] [Green Version]
  40. Camacho, L.D.; Gevaña, D.T.; Carandang, A.P.; Camacho, S.C.; Combalicer, E.A.; Rebugio, L.L.; Youn, Y.C. Tree biomass and carbon stock of a community-managed mangrove forest in Bohol, Philippines. Forest Sci. Technol. 2011, 7, 161–167. [Google Scholar] [CrossRef]
  41. Abino, A.C.; Castillo, J.A.A.; Lee, Y.J. Assessment of species diversity, biomass and carbon sequestration potential of a natural mangrove stand in Samar, the Philippines. Forest Sci. Technol. 2014, 10, 2–8. [Google Scholar] [CrossRef]
  42. Primavera, J.H. The values of wetlands: Landscape perspectives development and conservation institutional of Philippine issues mangroves. Ecol. Econ. 2000, 35, 91–106. [Google Scholar] [CrossRef]
  43. Primavera, J.H.; Esteban, J.M.A. A review of mangrove rehabilitation in the Philippines: Successes, failures and future prospects. Wetl. Ecol. Manag. 2008, 16, 345–358. [Google Scholar] [CrossRef]
  44. Pulhin, J.M.; Gevaña, D.T.; Pulhin, F.B. Community-Based Mangrove Management in the Philippines: Experience and Challenges in the Context of Changing Climate. In Participatory Mangrove Management in a Changing Climate Perspectives from the Asia-Pacific; DasGupta, R., Shaw, R., Eds.; Springer: Tokyo, Japan, 2017; pp. 247–262. [Google Scholar]
  45. Friess, D.A.; Thompson, B.S.; Brown, B.; Amir, A.A.; Cameron, C.; Koldewey, H.J.; Sasmito, S.D.; Sidik, F. Policy challenges and approaches for the conservation of mangrove forests in Southeast Asia. Conserv. Biol. 2016, 30, 933–949. [Google Scholar] [CrossRef]
  46. Buitre, M.; Zhang, H.; Lin, H. The Mangrove Forests Change and Impacts from Tropical Cyclones in the Philippines Using Time Series Satellite Imagery. Remote Sens. 2019, 11, 688. [Google Scholar] [CrossRef] [Green Version]
  47. Panay News Mangrove and Beach Forest Development Project. Available online: https://ani.seafdec.org.ph/handle/20.500.12174/2936 (accessed on 9 July 2019).
  48. Bueza, M. IN NUMBERS: 3 Years after Super Typhoon. Available online: https://www.rappler.com/newsbreak/iq/151549-in-numbers-3-years-after-super-typhoon-yolanda-haiyan (accessed on 9 July 2019).
  49. DENR-R6 Mangrove and Beach Forest Development Project. Available online: http://r6.denr.gov.ph/index.php/86-region-news-items/593-mangrove-and-beach-forest-development-project (accessed on 9 July 2019).
  50. Datta, D.; Chattopadhyay, R.N.; Guha, P. Community based mangrove management: A review on status and sustainability. J. Environ. Manag. 2012, 107, 84–95. [Google Scholar] [CrossRef]
  51. Quarto, A. Local Community Involvement in Mangrove 139 Rehabilitation: Thailand’s Yadfon. In An International Perspective on Wetland Rehabilitation; Streever, W., Ed.; Springer: Dordrecht, The Netherlands, 1999; pp. 139–142. [Google Scholar]
  52. Qurniati, R.; Hidayat, W.; Kaskoyo, H.; Firdasari, F.; Inoue, M. Social Capital in Mangrove Management: A Case Study in Lampung Province, Indonesia. J. For. Environ. Sci. 2017, 33, 8–21. [Google Scholar] [CrossRef]
  53. Sudtongkong, C.; Webb, E.L. Outcomes of state- vs. community-based mangrove management in Southern Thailand. Ecol. Soc. 2008, 13, 27. [Google Scholar] [CrossRef] [Green Version]
  54. Glaser, M.; da Silva Oliveira, R. Prospects for the co-management of mangrove ecosystems on the North Brazilian coast: Whose rights, whose duties and whose priorities? Nat. Resour. Forum 2004, 28, 224–233. [Google Scholar] [CrossRef]
  55. Situmorang, R.O. Social Capital in Managing Mangrove Area As Ecotourism By Muara Baimbai Community. Indones. J. For. Res. 2018, 5, 21–32. [Google Scholar] [CrossRef]
  56. Sulistyorini, I.S.; Poedjirahajoe, E.; Faida, L.R.W.; Purwanto, R.H. Social capital in mangrove utilization for silvofishery. Case study in Kutai National Park, Indonesia. J. Manaj. Hutan Trop. 2018, 24, 59–68. [Google Scholar] [CrossRef]
  57. Suharti, S.; Darusman, D.; Nugroho, B.; Sundawati, L. Strengthening social capital for propelling collective action in mangrove management. Wetl. Ecol. Manag. 2016, 24, 683–695. [Google Scholar] [CrossRef]
  58. Farrington, J.; Ramasut, T.; Walker, J. Sustainable Livelihoods Approaches in Urban Areas: General Lessons, with Illustrations from Indian Cases; Overseas Development Institute: London, UK, 2002. [Google Scholar]
  59. McCreadie, M.; Rice, R.E. Trends in analyzing access to information. Part II. Unique and integrating conceptualizations. Inf. Process. Manag. 1999, 35, 77–99. [Google Scholar] [CrossRef]
  60. Granovetter, M.S. The Strength of Weak Ties. Am. J. Sociol. 1973, 78, 1360–1380. [Google Scholar] [CrossRef] [Green Version]
  61. Andrews, R.; Brewer, G.A. Social Capital, Management Capacity and Public Service Performance: Evidence from the US States. Public Manag. Rev. 2013, 15, 19–42. [Google Scholar] [CrossRef]
  62. Carrillo Álvarez, E.; Riera Romaní, J. Measuring social capital: Further insights. Gac. Sanit. 2017, 31, 57–61. [Google Scholar] [CrossRef] [Green Version]
  63. Tiepoh, M.G.N.; Reimer, B. Social capital, information flows, and income creation in rural Canada: A cross-community analysis. J. Socio. Econ. 2004, 33, 427–448. [Google Scholar] [CrossRef] [Green Version]
  64. Harrison, J.L.; Montgomery, C.A.; Jeanty, P.W. A spatial, simultaneous model of social capital and poverty. J. Behav. Exp. Econ. 2019, 78, 183–192. [Google Scholar] [CrossRef]
  65. Woolcock, M.; Narayan, D. Social Capital: Implications for Development Theory, Research, and Policy. World Bank Res. Obs. 2000, 15, 225–249. [Google Scholar] [CrossRef] [Green Version]
  66. Putnam, R.D. Bowling Alone: America’ s Declining Social Capital. J. Democr. 1995, 6, 65–78. [Google Scholar] [CrossRef] [Green Version]
  67. Dasgupta, P.; Putnam, R.; Dasgupta, P. The economics of social capital. Environ. Econ. Middle East North Africa 2005, 81, 2–21. [Google Scholar] [CrossRef]
  68. Villalonga-Olives, E.; Kawachi, I. The measurement of social capital. Gac. Sanit. 2015, 29, 62–64. [Google Scholar] [CrossRef]
  69. Kay, A. Social capital, the social economy and community development. Community Dev. J. 2005, 41, 160–173. [Google Scholar] [CrossRef] [Green Version]
  70. Nardone, G.; Sisto, R.; Lopolito, A. Social Capital in the LEADER Initiative: A methodological approach. J. Rural Stud. 2010, 26, 63–72. [Google Scholar] [CrossRef]
  71. Sandefur, R.L.; Laumann, E.O. A Paradigm of Social Capital. Ration. Soc. 1998, 10, 481–501. [Google Scholar] [CrossRef]
  72. Coleman, J.S. Foundation of Social Theory; The Belknap Press of Harvard University Press: Cambridge, MA, USA, 1990; ISBN 0674312252. [Google Scholar]
  73. Local Government Unit of Infanta. Ecological Profile of Infanta, Quezon; Local Government Unit of Infanta: Infanta, Philippines, 2018.
  74. The Republic of the Philippines. Office of the President. Community-based Forest Mangement (Executive Order No. 263 s. 1995). Available online: https://www.officialgazette.gov.ph/1995/07/19/executive-order-no-263-s-1995/ (accessed on 14 May 2020).
  75. The Republic of the Philippines. Office of the President. National Greening Program (Executive Order No. 26 s. 2011). Available online: https://www.officialgazette.gov.ph/2011/02/24/executive-order-no-26-s-2011/ (accessed on 14 May 2020).
  76. Long, H.; Liu, J.; Tu, C.; Fu, Y. From State-controlled to Polycentric Governance in Forest Landscape Restoration: The Case of the Ecological Forest Purchase Program in Yong’ an Municipality of China. Environ. Manag. 2018, 62, 58–69. [Google Scholar] [CrossRef]
  77. Laerd Statistics Kruskal-Wallis H test using SPSS Statistics. Available online: https://statistics.laerd.com/spss-tutorials/kruskal-wallis-h-test-using-spss-statistics.php (accessed on 15 May 2015).
  78. Avila-Foucat, V.S.; Rodríguez-Robayo, K.J. Determinants of livelihood diversification: The case wildlife tourism in four coastal communities in Oaxaca, Mexico. Tour. Manag. 2018, 69, 223–231. [Google Scholar] [CrossRef]
  79. Damastuti, E.; de Groot, R. Participatory ecosystem service mapping to enhance community-based mangrove rehabilitation and management in Demak, Indonesia. Reg. Environ. Chang. 2019, 19, 65–78. [Google Scholar] [CrossRef] [Green Version]
  80. Lee, Y.; Rianti, I.P.; Park, M.S. Measuring social capital in Indonesian community forest management. Forest Sci. Technol. 2017, 13, 133–141. [Google Scholar] [CrossRef]
  81. Willis, P. Engaging communities: Ostrom’s economic commons, social capital and public relations. Public Relat. Rev. 2012, 38, 116–122. [Google Scholar] [CrossRef]
  82. Saffer, A.J. A message-focused measurement of the communication dimension of social capital: Revealing shared meaning in a network of relationships. J. Public Relations Res. 2016, 28, 170–192. [Google Scholar] [CrossRef]
  83. Hamilton, M.L.; Lubell, M. Climate change adaptation, social capital, and the performance of polycentric governance institutions. Clim. Chang. 2019, 152, 307–326. [Google Scholar] [CrossRef]
  84. Shah, S.I.A.; Zhou, J.; Shah, A.A. Ecosystem-based Adaptation (EbA) practices in smallholder agriculture; emerging evidence from rural Pakistan. J. Clean. Prod. 2019, 218, 673–684. [Google Scholar] [CrossRef]
  85. Abid, M.; Ngaruiya, G.; Scheffran, J.; Zulfiqar, F. The Role of Social Networks in Agricultural Adaptation to Climate Change: Implications for Sustainable Agriculture in Pakistan. Climate 2017, 5, 85. [Google Scholar] [CrossRef] [Green Version]
  86. Franzel, S. Costs of secondary parasitism in the facultative hyperparasitoid Pachycrepoideus dubius: Does host size matter? Entomol. Exp. Appl. 2002, 103, 239–248. [Google Scholar]
  87. Kiptot, E.; Franzel, S. Gender and agroforestry in Africa: A review of women’s participation. Agrofor. Syst. 2012, 84, 35–58. [Google Scholar] [CrossRef] [Green Version]
  88. Sanou, L.; Savadogo, P.; Ezebilo, E.E.; Thiombiano, A. Drivers of farmers’ decisions to adopt agroforestry: Evidence from the Sudanian savanna zone, Burkina Faso. Renew. Agric. Food Syst. 2019, 34, 116–133. [Google Scholar] [CrossRef]
  89. McGrath, F.L.; Erbaugh, J.T.; Leimona, B.; Amaruzaman, S.; Rahadian, N.P.; Carrasco, L.R. Green without envy: How social capital alleviates tensions from a payments for ecosystem services (PES) program in Indonesia. Ecol. Soc. 2018, 23, 10. [Google Scholar] [CrossRef] [Green Version]
  90. ReddVi Padrino/Palakasan System Should not be Practice in the Philippines. Do you Agree or Disagree? Available online: https://ph.toluna.com/opinions/2872883/Padrino-Palakasan-System-should-not-be-practiced-here-in (accessed on 9 May 2019).
  91. Auer, A.; Von Below, J.; Nahuelhual, L.; Mastrangelo, M.; Gonzalez, A.; Gluch, M.; Vallejos, M.; Staiano, L.; Laterra, P.; Paruelo, J. The role of social capital and collective actions in natural capital conservation and management. Environ. Sci. Policy 2020, 107, 168–178. [Google Scholar] [CrossRef]
Figure 1. Conceptual framework for analyzing social capital in resource management.
Forests 11 00580 g001
Figure 2. The concept of social capital.
Forests 11 00580 g002
Figure 3. Location map of research areas.
Forests 11 00580 g003
Table 1. Definitions of social capital.
Definitions of Social CapitalReferences
“An entity, consisting of all expected future benefits derived, not from one’s own labor, but from connections with other persons”[20]
“The connections and relationships between individuals and/or groups that leads to aggregation of capitals”[25]
“Features of social organization, such as trust, norms, and networks, that can improve the efficiency of society by facilitating coordinated actions”[24]
“Assets gained through membership in networks”[28]
“Capital captured through social relations”
“Resources embedded in social networks accessed and used by actors for actions”
[27]
Table 2. Variables used for regression analysis. PO, people’s organization.
VariablesDescriptionReason for Selection of the VariableCode
Social capital valueQuantified value of social capital computed using the formula developed in this study. Values range from 0 to 1.Previous studies identified social capital as a key factor in the development of a community [31,78]. Verifying a positive relationship between participation and social capital will provide empirical evidence that participatory resource management creates favorable conditions for development of local communities while addressing environmental concerns.SC Value
Access to informationPeople’s access to information (work-related announcements, government and development programs, weather, and disaster forecasts, etc.). Values range from 0 to 13.Information provides a “basis for action” for people [23]. Information has been widely connected to social capital, specifically to social networks and ties [27,60]. Networks and ties serve as channels that improve access to information [69].Information
Access to servicesPeople’s access to general services (health facilities, schools and universities, markets, financial and insurance institutions, etc.). Values range from 0 to 31.Access to general services improves people’s capabilities, conditions, and well-being. The study looks at the impacts of social capital on access to general services as an extension of the benefits people can get from their participation in natural resources management.Services
PO membership (dummy variable)Whether or not the respondent is a member of a PO. This variable represents people’s participation in resource management (0 if not a member; 1 if a member). Members of POs are people who participate in mangrove restoration projects.Participation is a common practice in resource management that addresses environmental and social concerns together [6,7]. This variable was selected to test if participation in resource management improves local people’s social capital. Studies of Damastuti and de Groot [79] and Prayitno et al. [31] concluded that there is a positive relationship between participation and social capital.PO
Annual incomeTotal annual income (PhP) of all household members.Income, among other individual characteristics, was included in [80] as a component of the internal factors that can affect social capital. This study also concluded that there is a positive relationship between income and social capital.Income
Education of household headNumber of years of schooling of household head.Individual education was included as a component in [80] among the internal factors that can affect social capital.Education
Table 3. Descriptive statistics of sampled households.
VariableTotal Samples (n = 314)Non-PO Members (n = 226)PO Members (n = 88)Kruskal–Wallis
MeanSDMinMaxMeanSDMinMax(p-Value)
Social capital value0.110.060.067300.31190.260.01480.03370.64642.2 × 10−16 ***
a Ties value0.220.110.113500.46790.50.17980.13210.89172.2 × 10−16 ***
a Embedded resources value0.460.380.3442010.670.13160.366711.15 × 10−11 ***
a Trust value0.530.460.4115010.720.12460.42513.72 × 10−5 ***
Access to services18.0916.776.270973121.475.85453312.2 × 10−16 ***
Access to information8.347.323.053231310.971.93255132.2 × 10−16 ***
Household size4.214.181.69911114.271.6169190.5322
Household head education (years)4.84.851.3101284.671.3280170.3406
Annual income (PhP)73937.0472628.4660665.8210000366,00077297.7365711.2818000318,0002.2 × 10−16 ***
b Number of ties0.220.130.102100.3750.520.22170.12512.2 × 10−16 ***
b Diversity of ties0.240.20.141700.60.470.13800.20.82.2 × 10−16 ***
c General economic status of members0.450.370.3451010.670.16270.214.47 × 10−12 ***
c Access to embedded resources0.470.390.3561010.680.14590.419.04 × 10−10 ***
d Trust in ties0.530.450.4087010.730.13970.411.44 × 10−6 ***
d Participation in social ties0.540.470.4265010.720.16500.071410.0011 ***
* Statistical differences (Kruskal–Wallis) Significance level: *** p < 0.001. a Variables used for computation of social capital value. b Variables used for computation of ties value. c Variables used for computation of embedded resources value. d Variables used for computation of trust value.
Table 4. Regression model for estimating social capital (Model 1).
EstimateStd. Errorz ValuePr(>|z|)
(Intercept)−2.1424.861 × 10−2−44.0602 × 10⁻¹⁶ ***
PO (member)2.244 × 10−11.510 × 10−214.8632 × 10⁻¹⁶ ***
Education1.625 × 10−32.136 × 10−30.7610.447
Income2.380 × 10−81.144 × 10−70.2080.835
R squared: 0.4708273
Significance level: *** p < 0.001.
Table 5. Results of regression analysis estimating the impact of social capital on access to information (Model 2).
EstimateStd. Errort ValuePr(>|t|)
(Intercept)0.33409460.15733562.1230.034508 *
SC value0.04938000.01116184.4241.34 × 10−5 ***
Education−0.00018440.0030743−0.0600.952207
Income0.13103990.03339703.9240.000107 ***
Residual standard error: 0.1799 on 310 degrees of freedom
Multiple R-squared: 0.1056
Adjusted R-squared: 0.0969
F-statistic: 12.2 on 3 and 310 DOF
p-value: 1.443 × 10⁻⁷ ***
Significance levels: * p < 0.05; *** p < 0.001.
Table 6. Results of regression analysis estimating the impact of social capital on access to services (Model 3).
EstimateStd. Errort ValuePr(>|t|)
(Intercept)0.8877860.1352946.5622.23 × 10−10 ***
SC value0.0452330.0095984.7133.70 × 10−6 ***
Education−0.0030190.002644−1.1420.25442
Annual income0.0910880.0287183.1720.00167 ***
Residual standard error: 0.1547 on 310 degrees of freedom
Multiple R-squared: 0.09709
Adjusted R-squared: 0.0884
F-statistic: 11.11 on 3 and 310 DF
p-value: 6.016 × 10⁻⁷ ***
Significance levels: *** p < 0.001.

