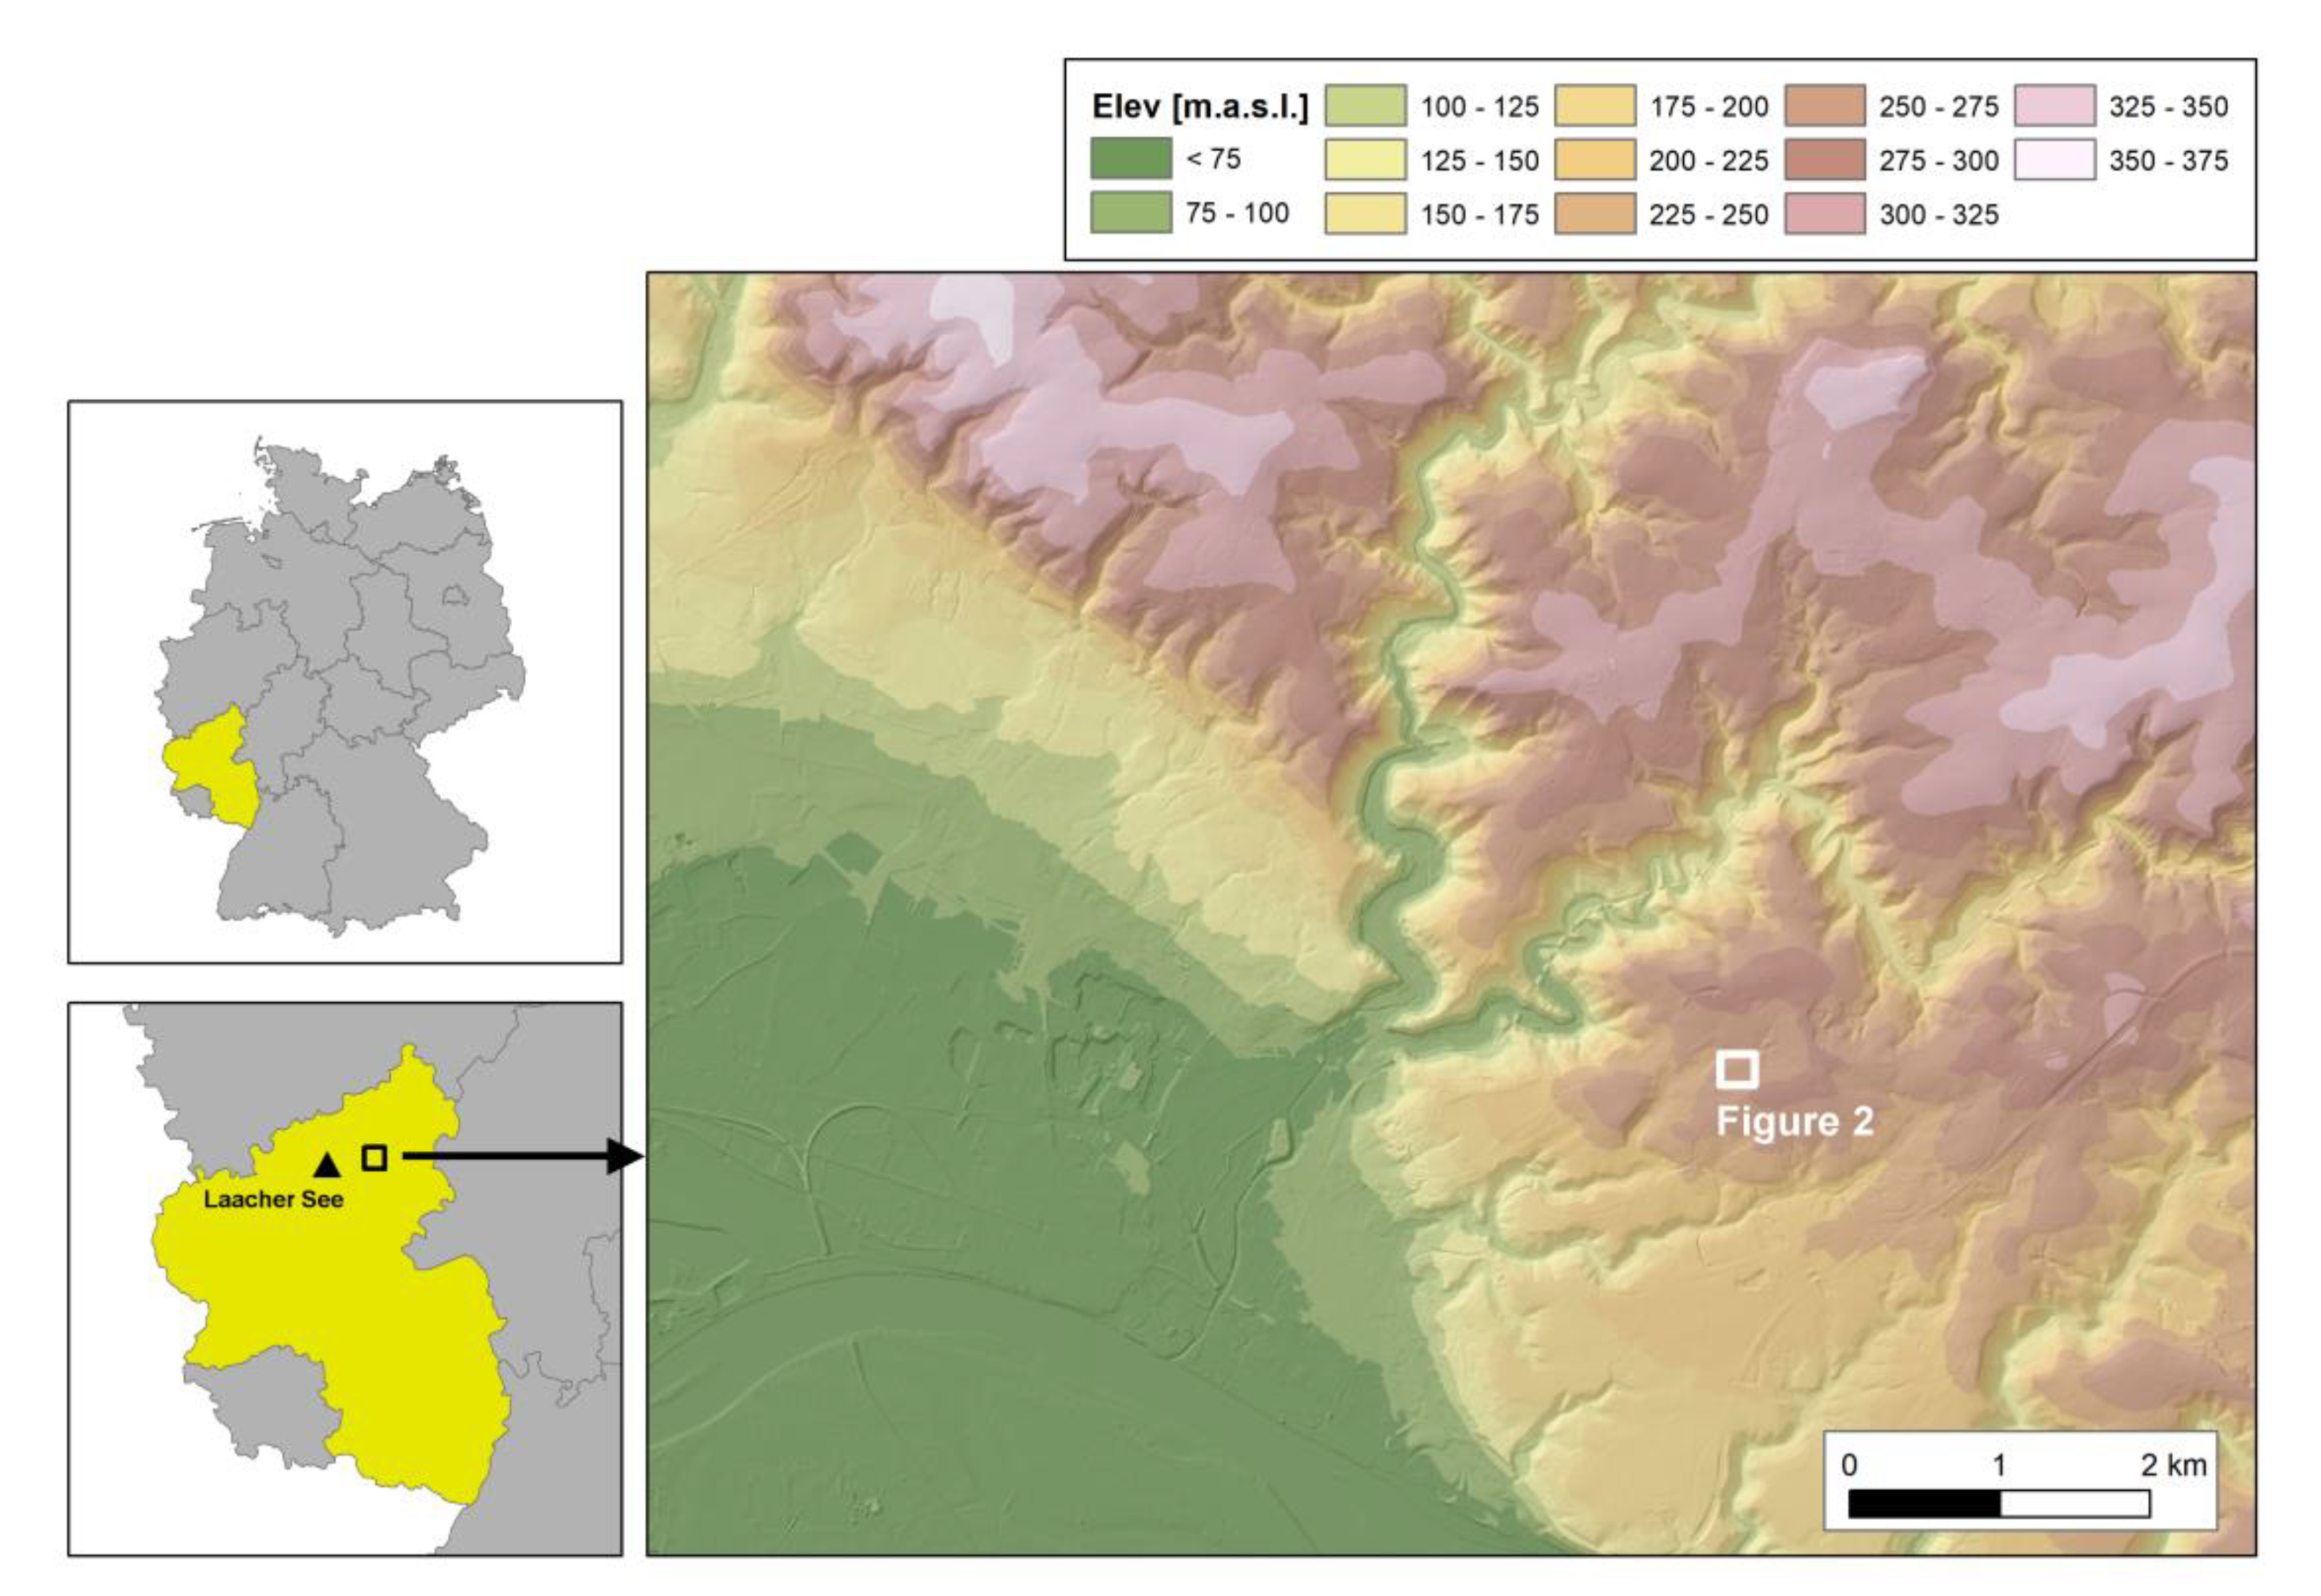
Figure 1.
Location of the study area (after [
37,
48]).
Figure 1.
Location of the study area (after [
37,
48]).
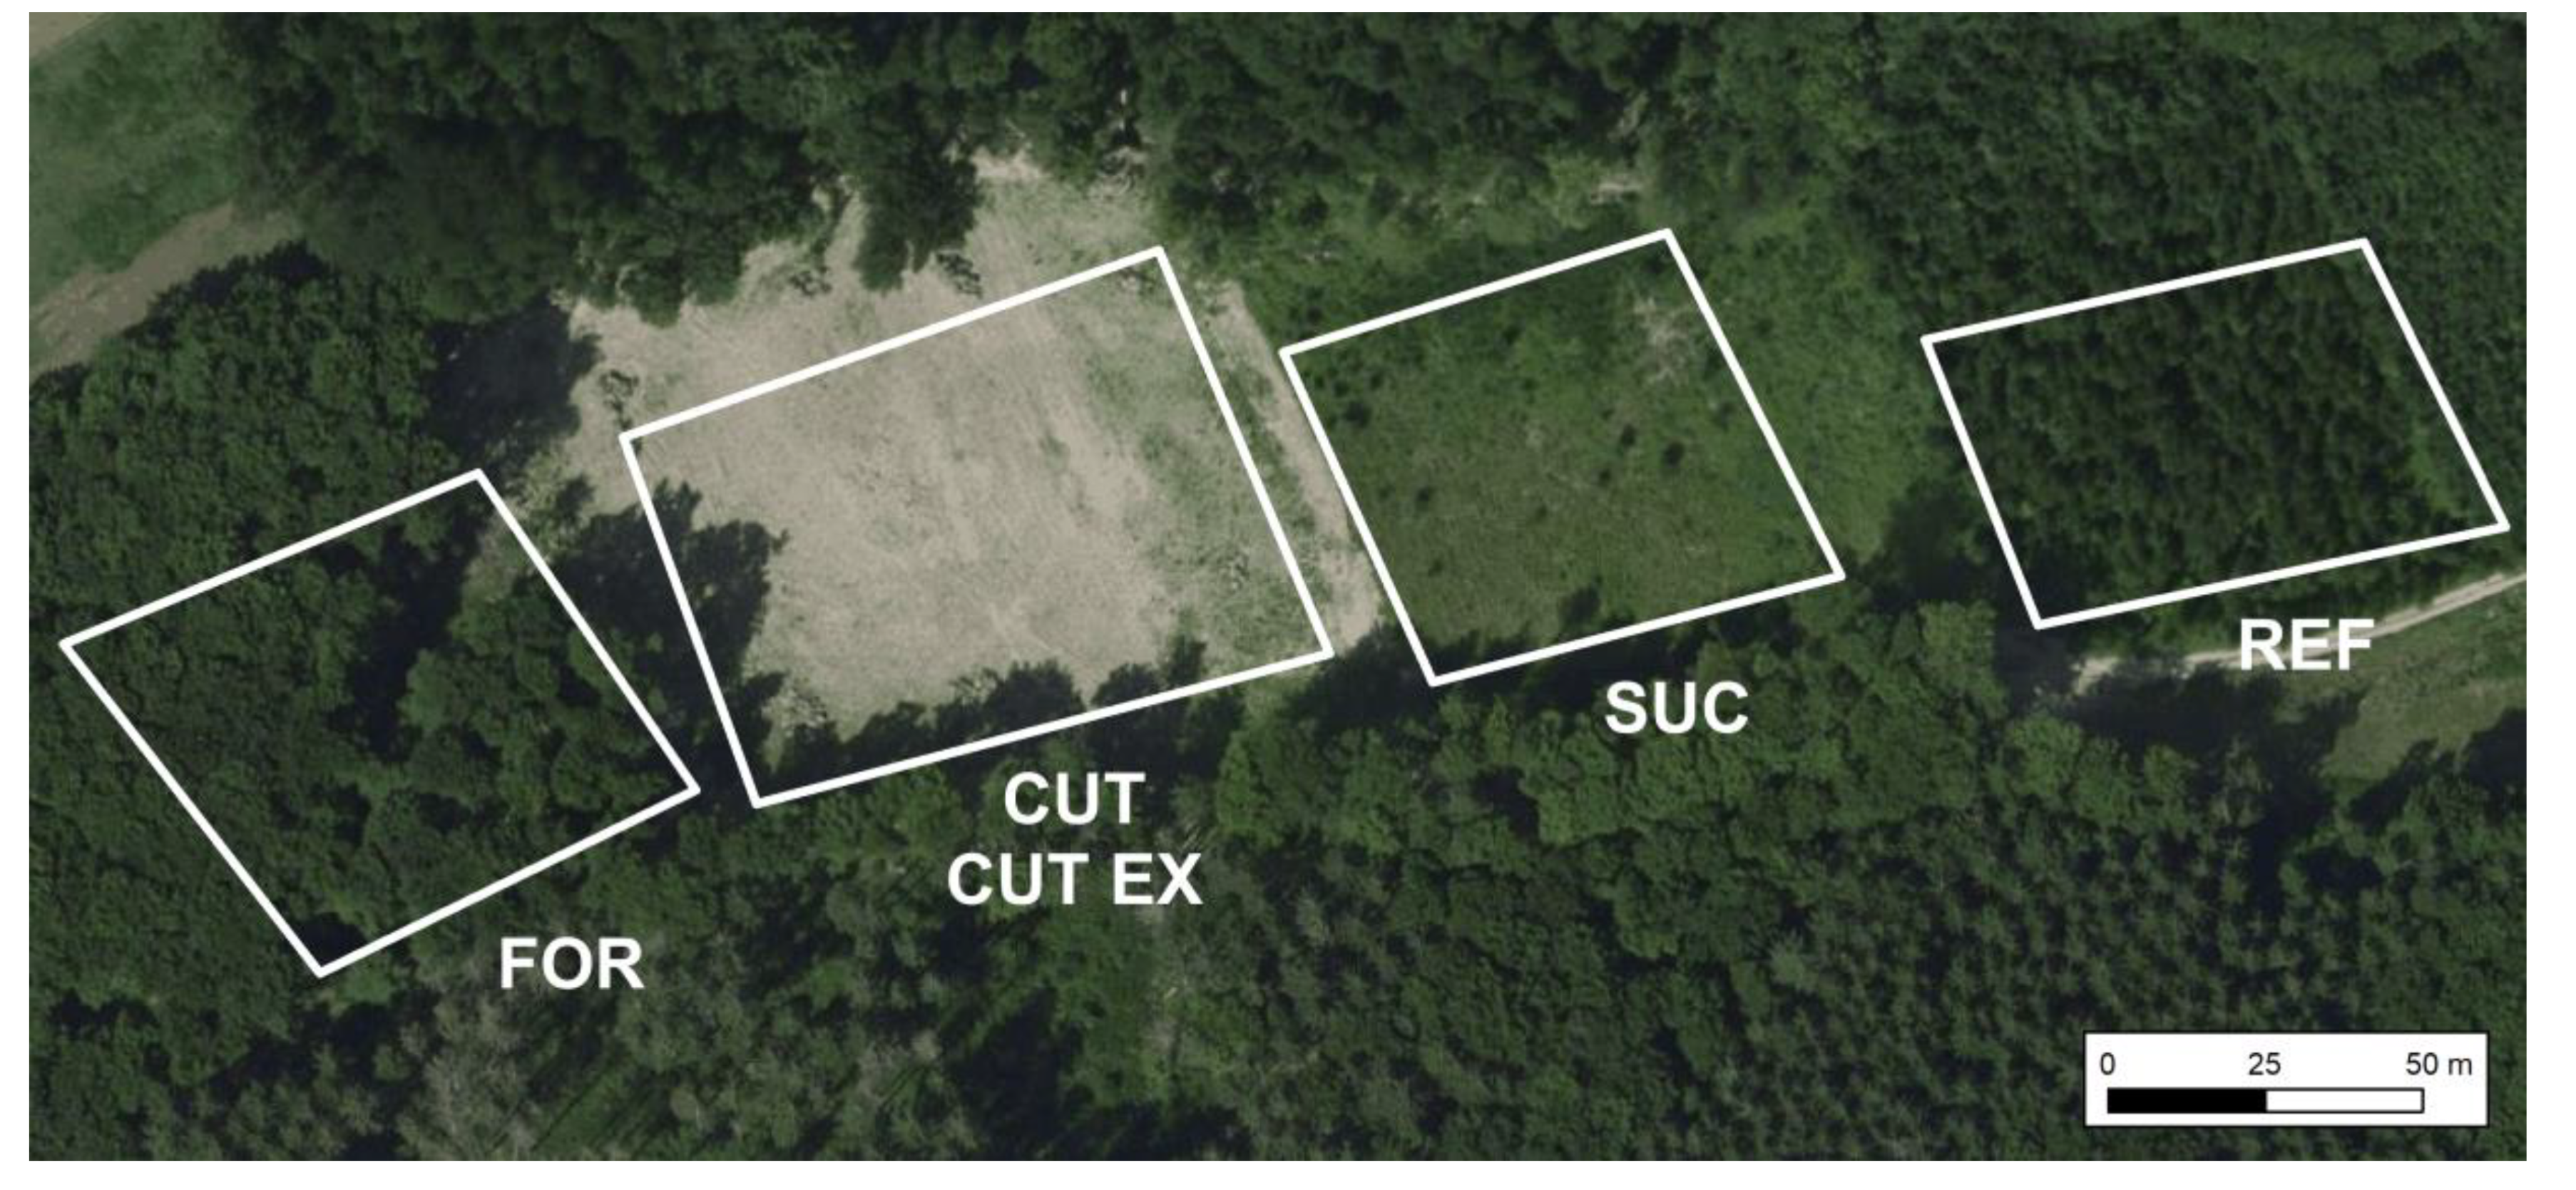
Figure 2.
Sampling areas. Aerial photography provided by LVermGeo RLP (2019).
Figure 2.
Sampling areas. Aerial photography provided by LVermGeo RLP (2019).
Figure 3.
Beginning pumice excavation in forest district Bendorf, area CUT/CUT EX in late 2018 (Photo: Alexander Klein). Material for later backfilling and LST are visible on both sides. Area FOR is located on the left (West), excavation continued gradually to the right (East).
Figure 3.
Beginning pumice excavation in forest district Bendorf, area CUT/CUT EX in late 2018 (Photo: Alexander Klein). Material for later backfilling and LST are visible on both sides. Area FOR is located on the left (West), excavation continued gradually to the right (East).
Figure 4.
Penetrologger sampling points. Aerial photography provided by LVermGeo RLP (2019).
Figure 4.
Penetrologger sampling points. Aerial photography provided by LVermGeo RLP (2019).
Figure 5.
Mean percentages of clay, silt and sand of each area and depth-category.
Figure 5.
Mean percentages of clay, silt and sand of each area and depth-category.
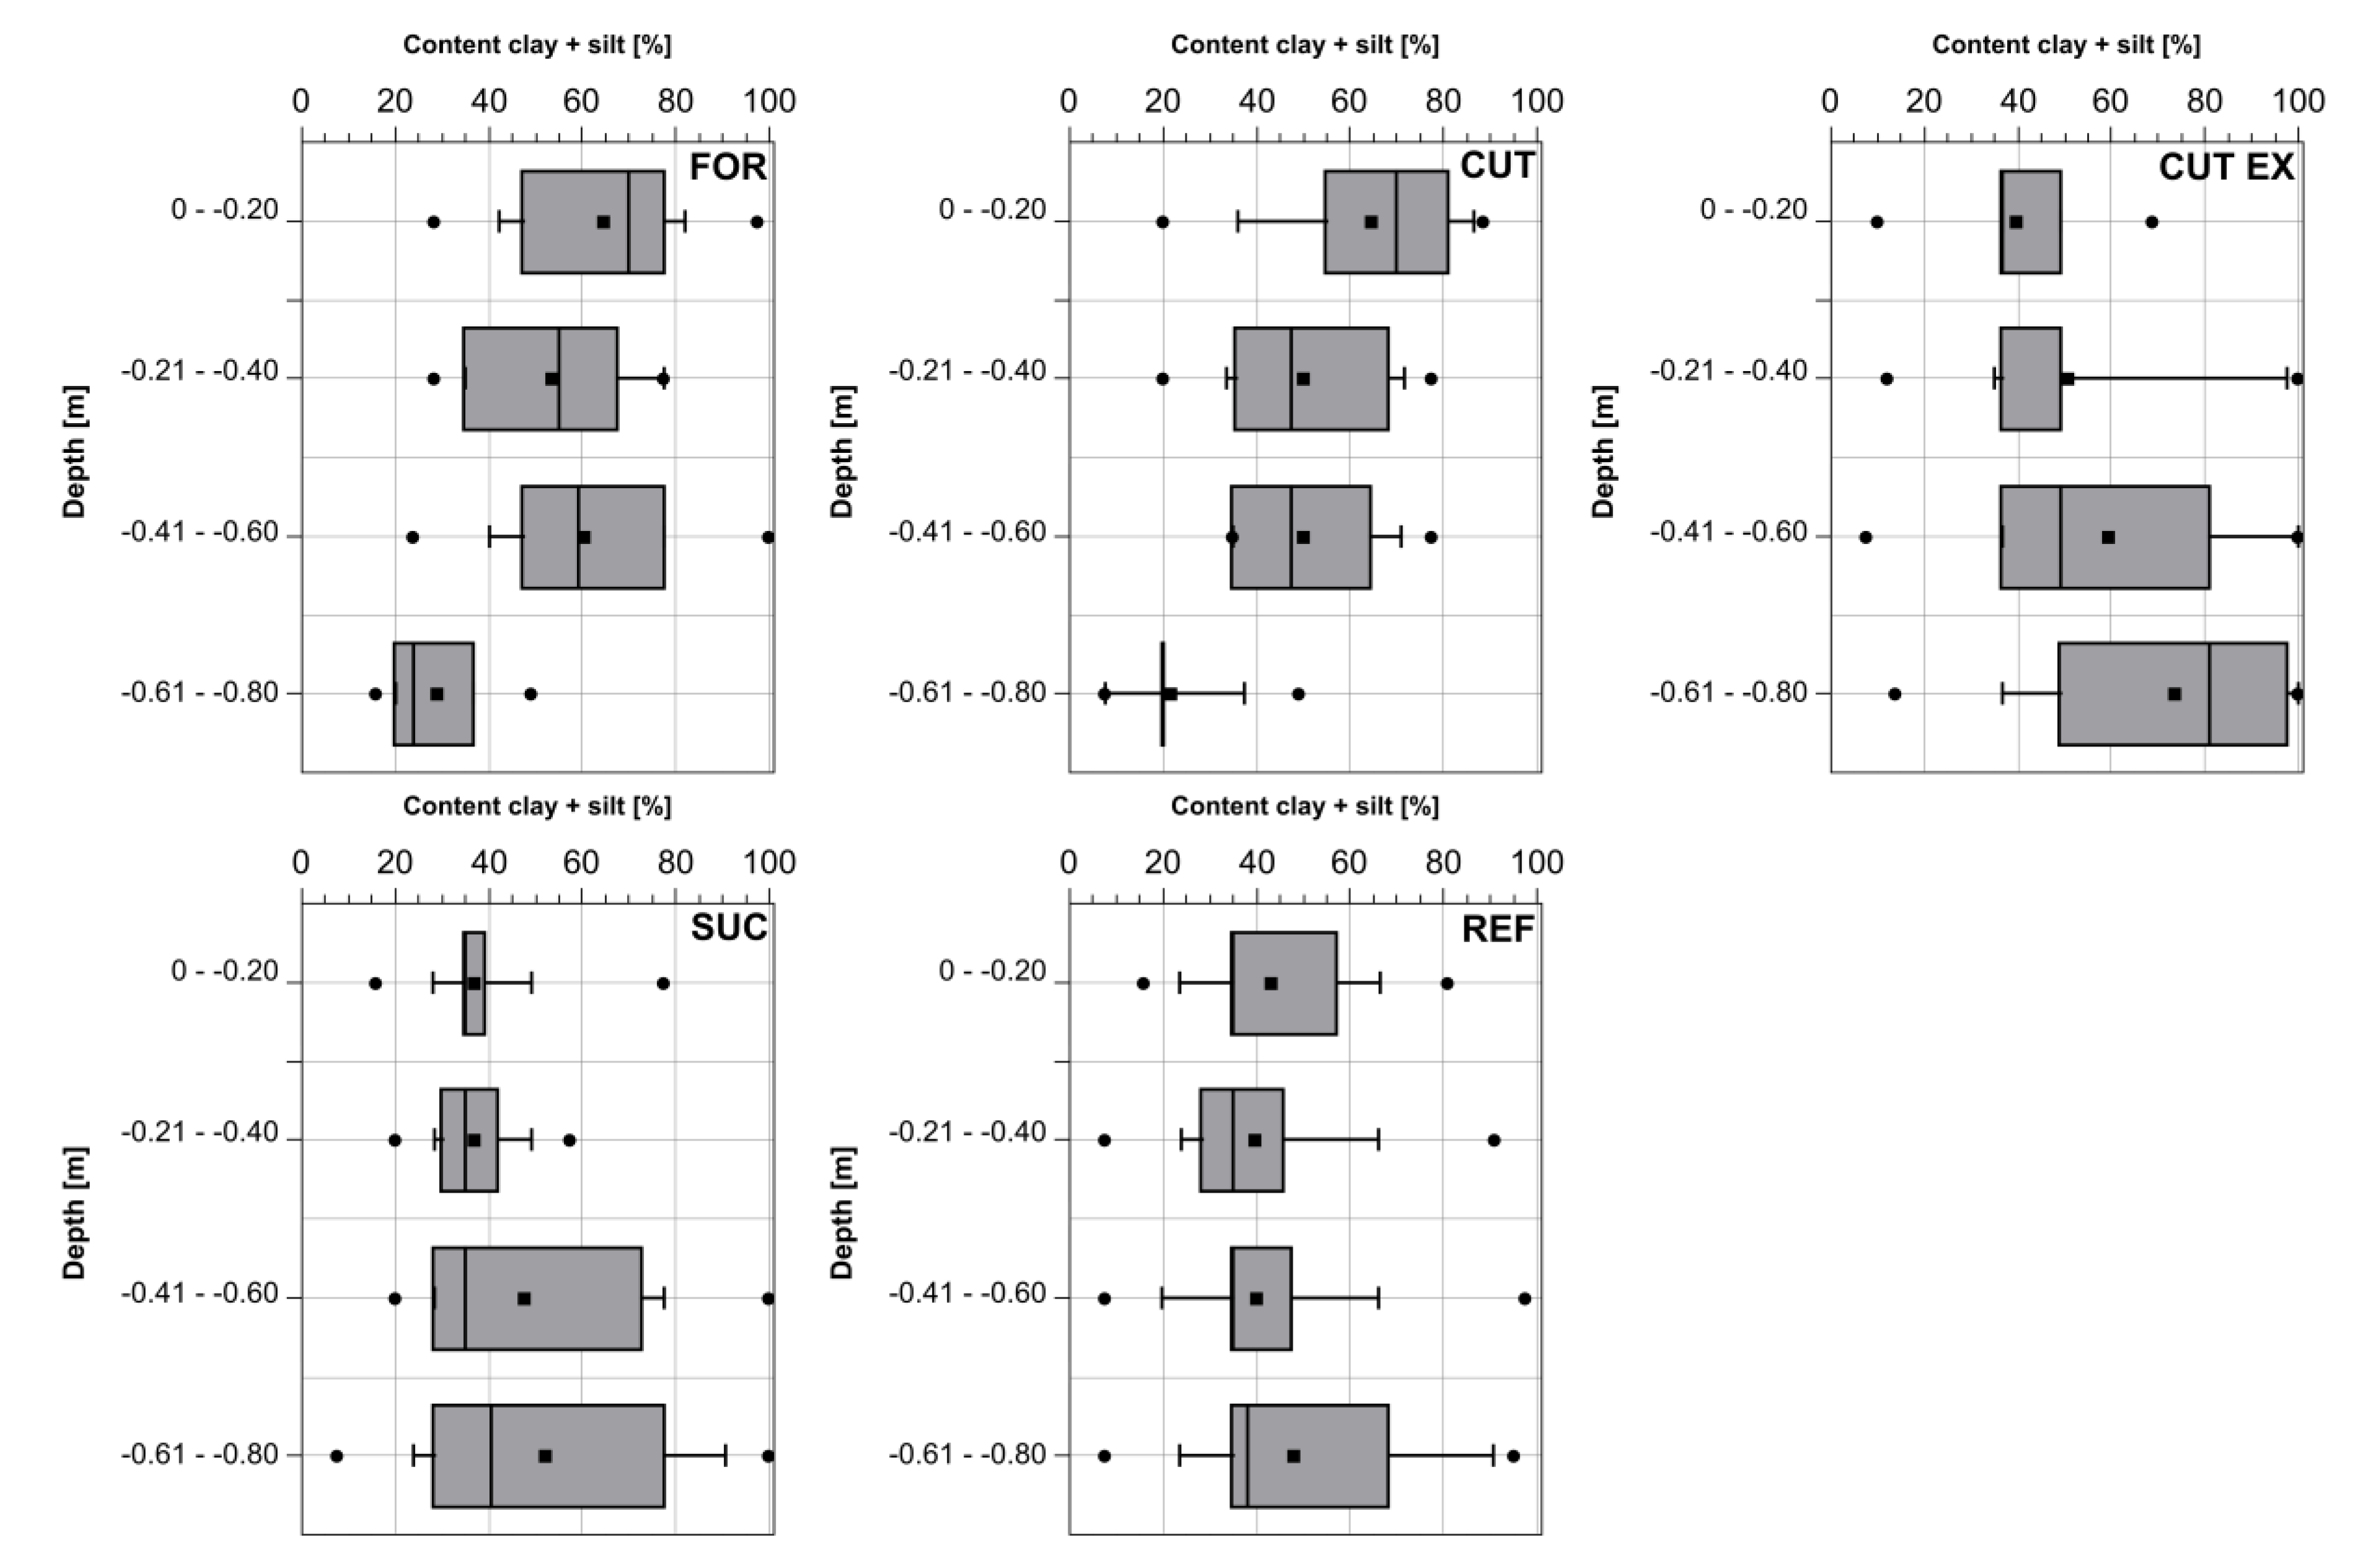
Figure 6.
Clay and silt content dataset distribution.
Figure 6.
Clay and silt content dataset distribution.
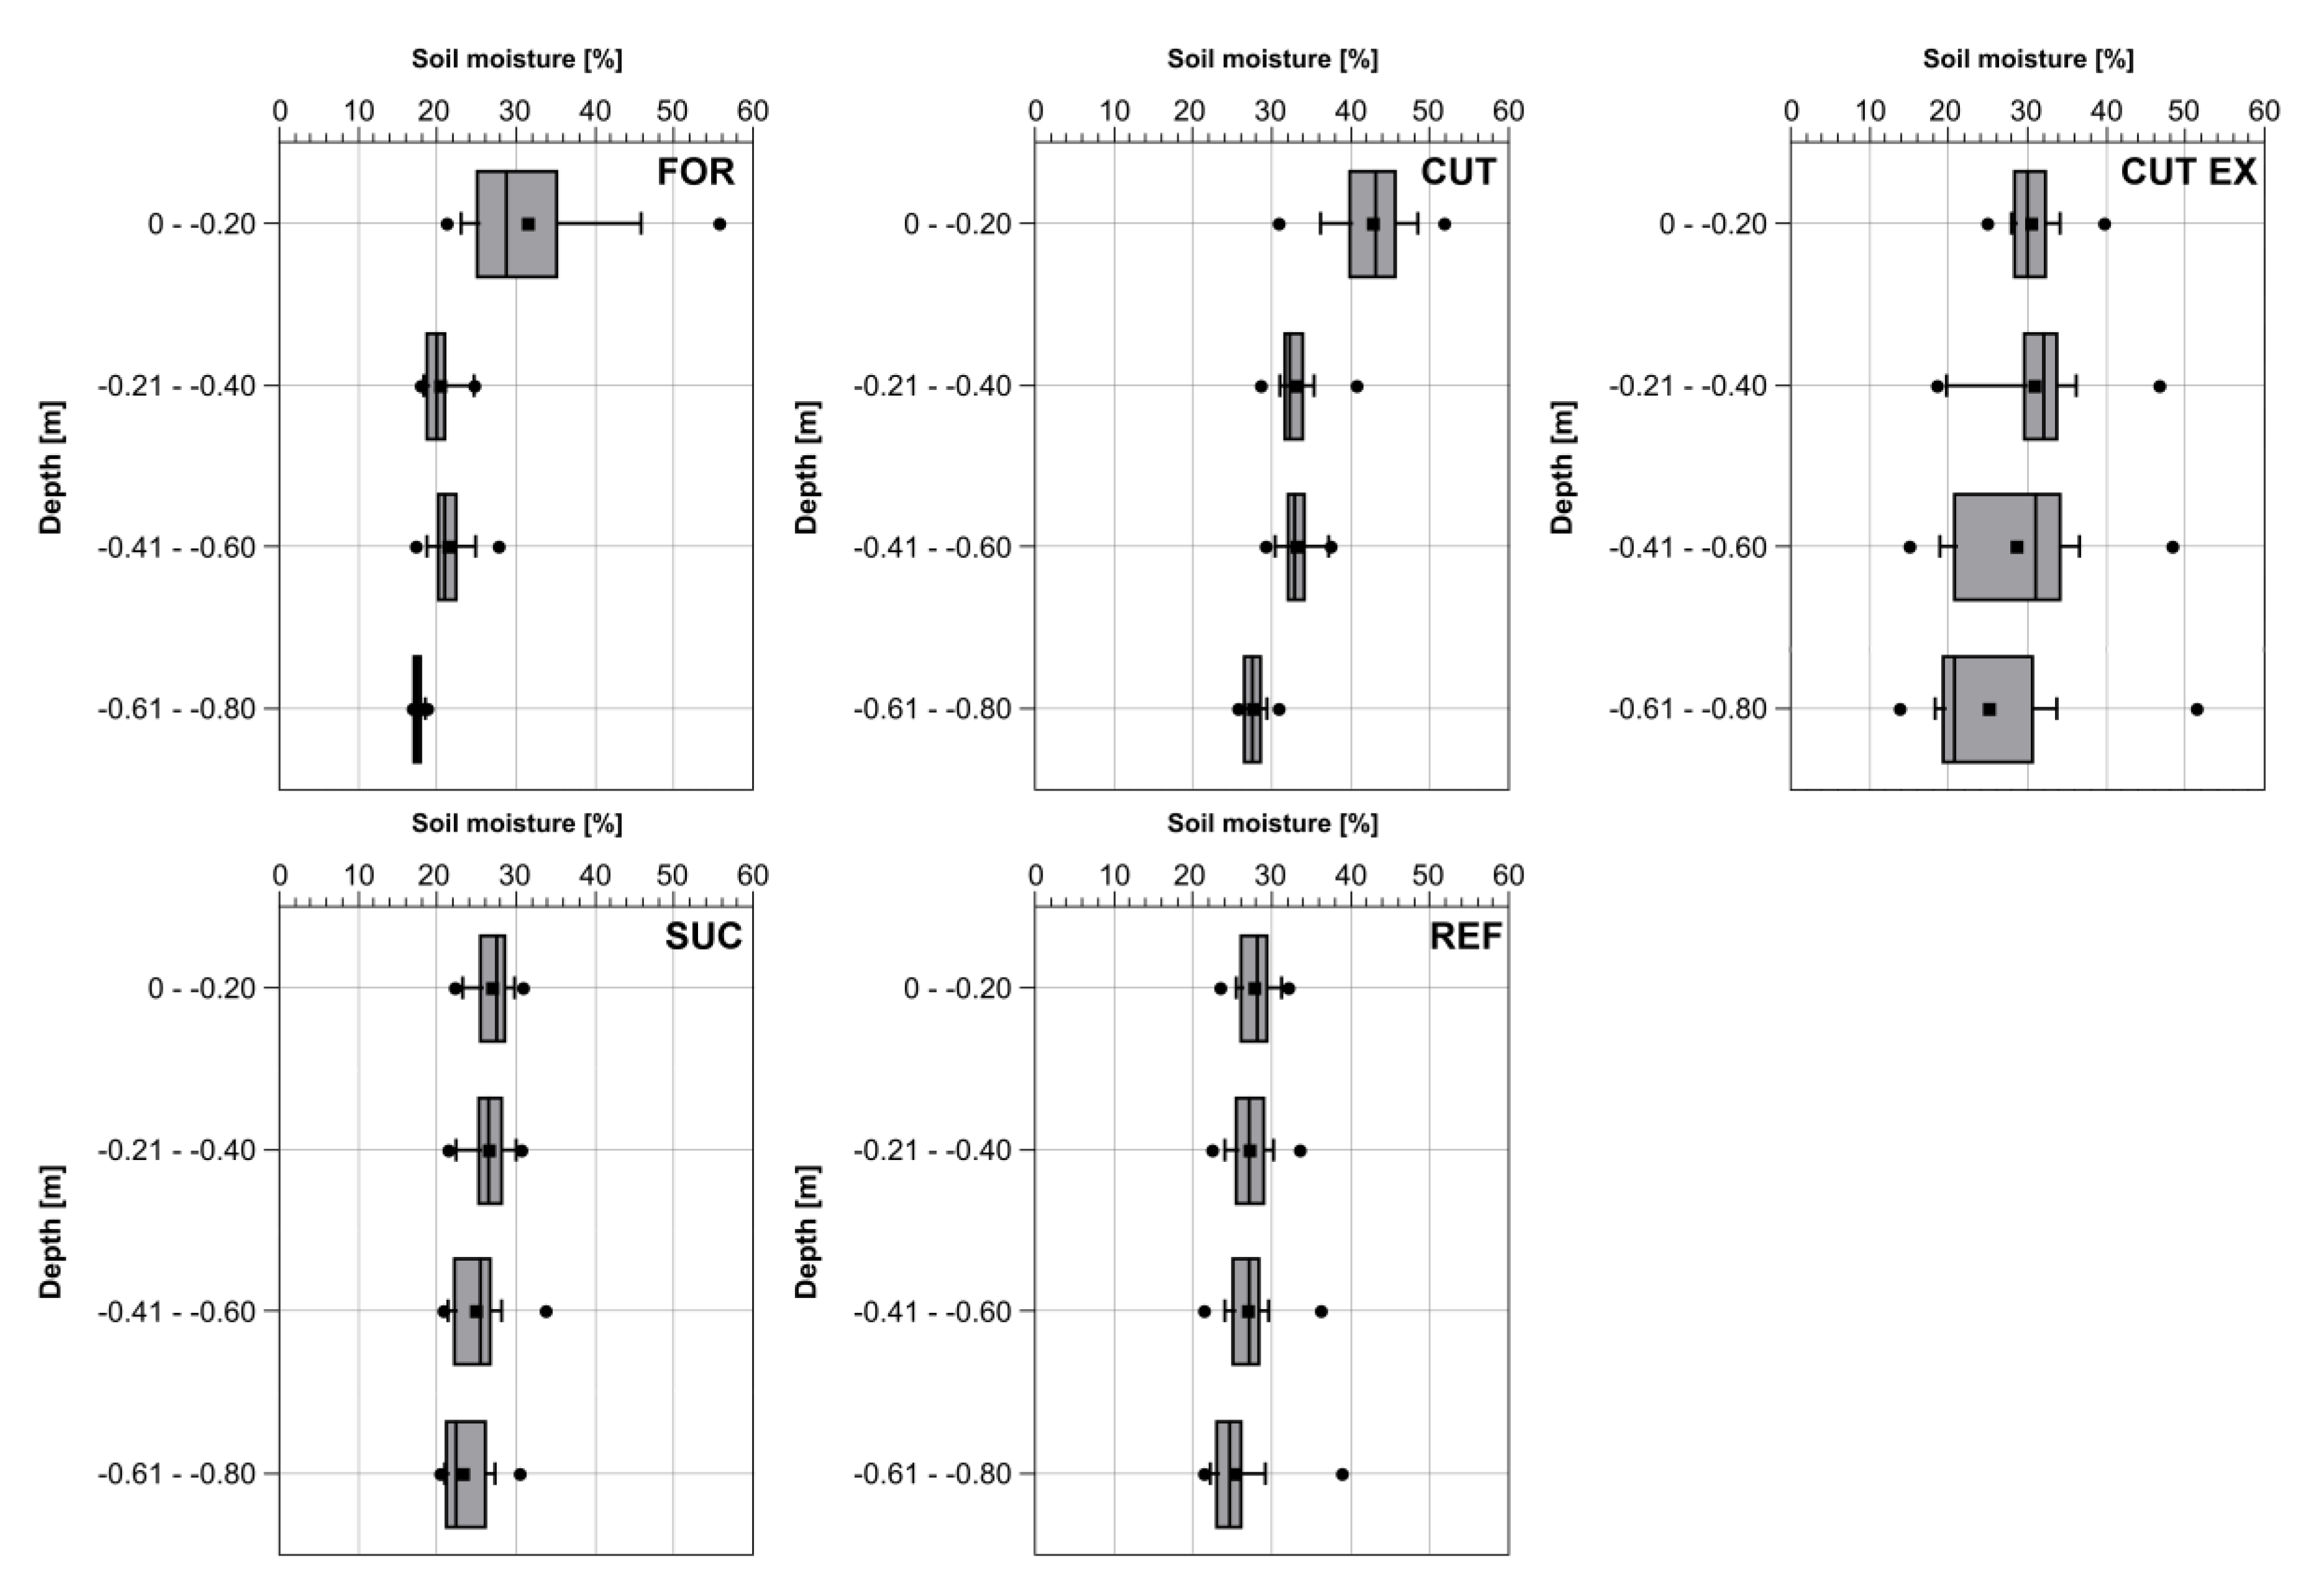
Figure 7.
Soil moisture dataset distribution. Recorded in fall 2018 (FOR, CUT, SUC, REF) and early summer 2019 (CUT EX), carried out at the same time as penetrologger measurements.
Figure 7.
Soil moisture dataset distribution. Recorded in fall 2018 (FOR, CUT, SUC, REF) and early summer 2019 (CUT EX), carried out at the same time as penetrologger measurements.
Figure 8.
Soil organic matter (SOM) dataset distribution.
Figure 8.
Soil organic matter (SOM) dataset distribution.
Figure 9.
Penetration resistance (PR) dataset distribution. Dotted lines (2, 3 MPa) represent literature-based, critical PR affecting root growth according to [
13].
Figure 9.
Penetration resistance (PR) dataset distribution. Dotted lines (2, 3 MPa) represent literature-based, critical PR affecting root growth according to [
13].
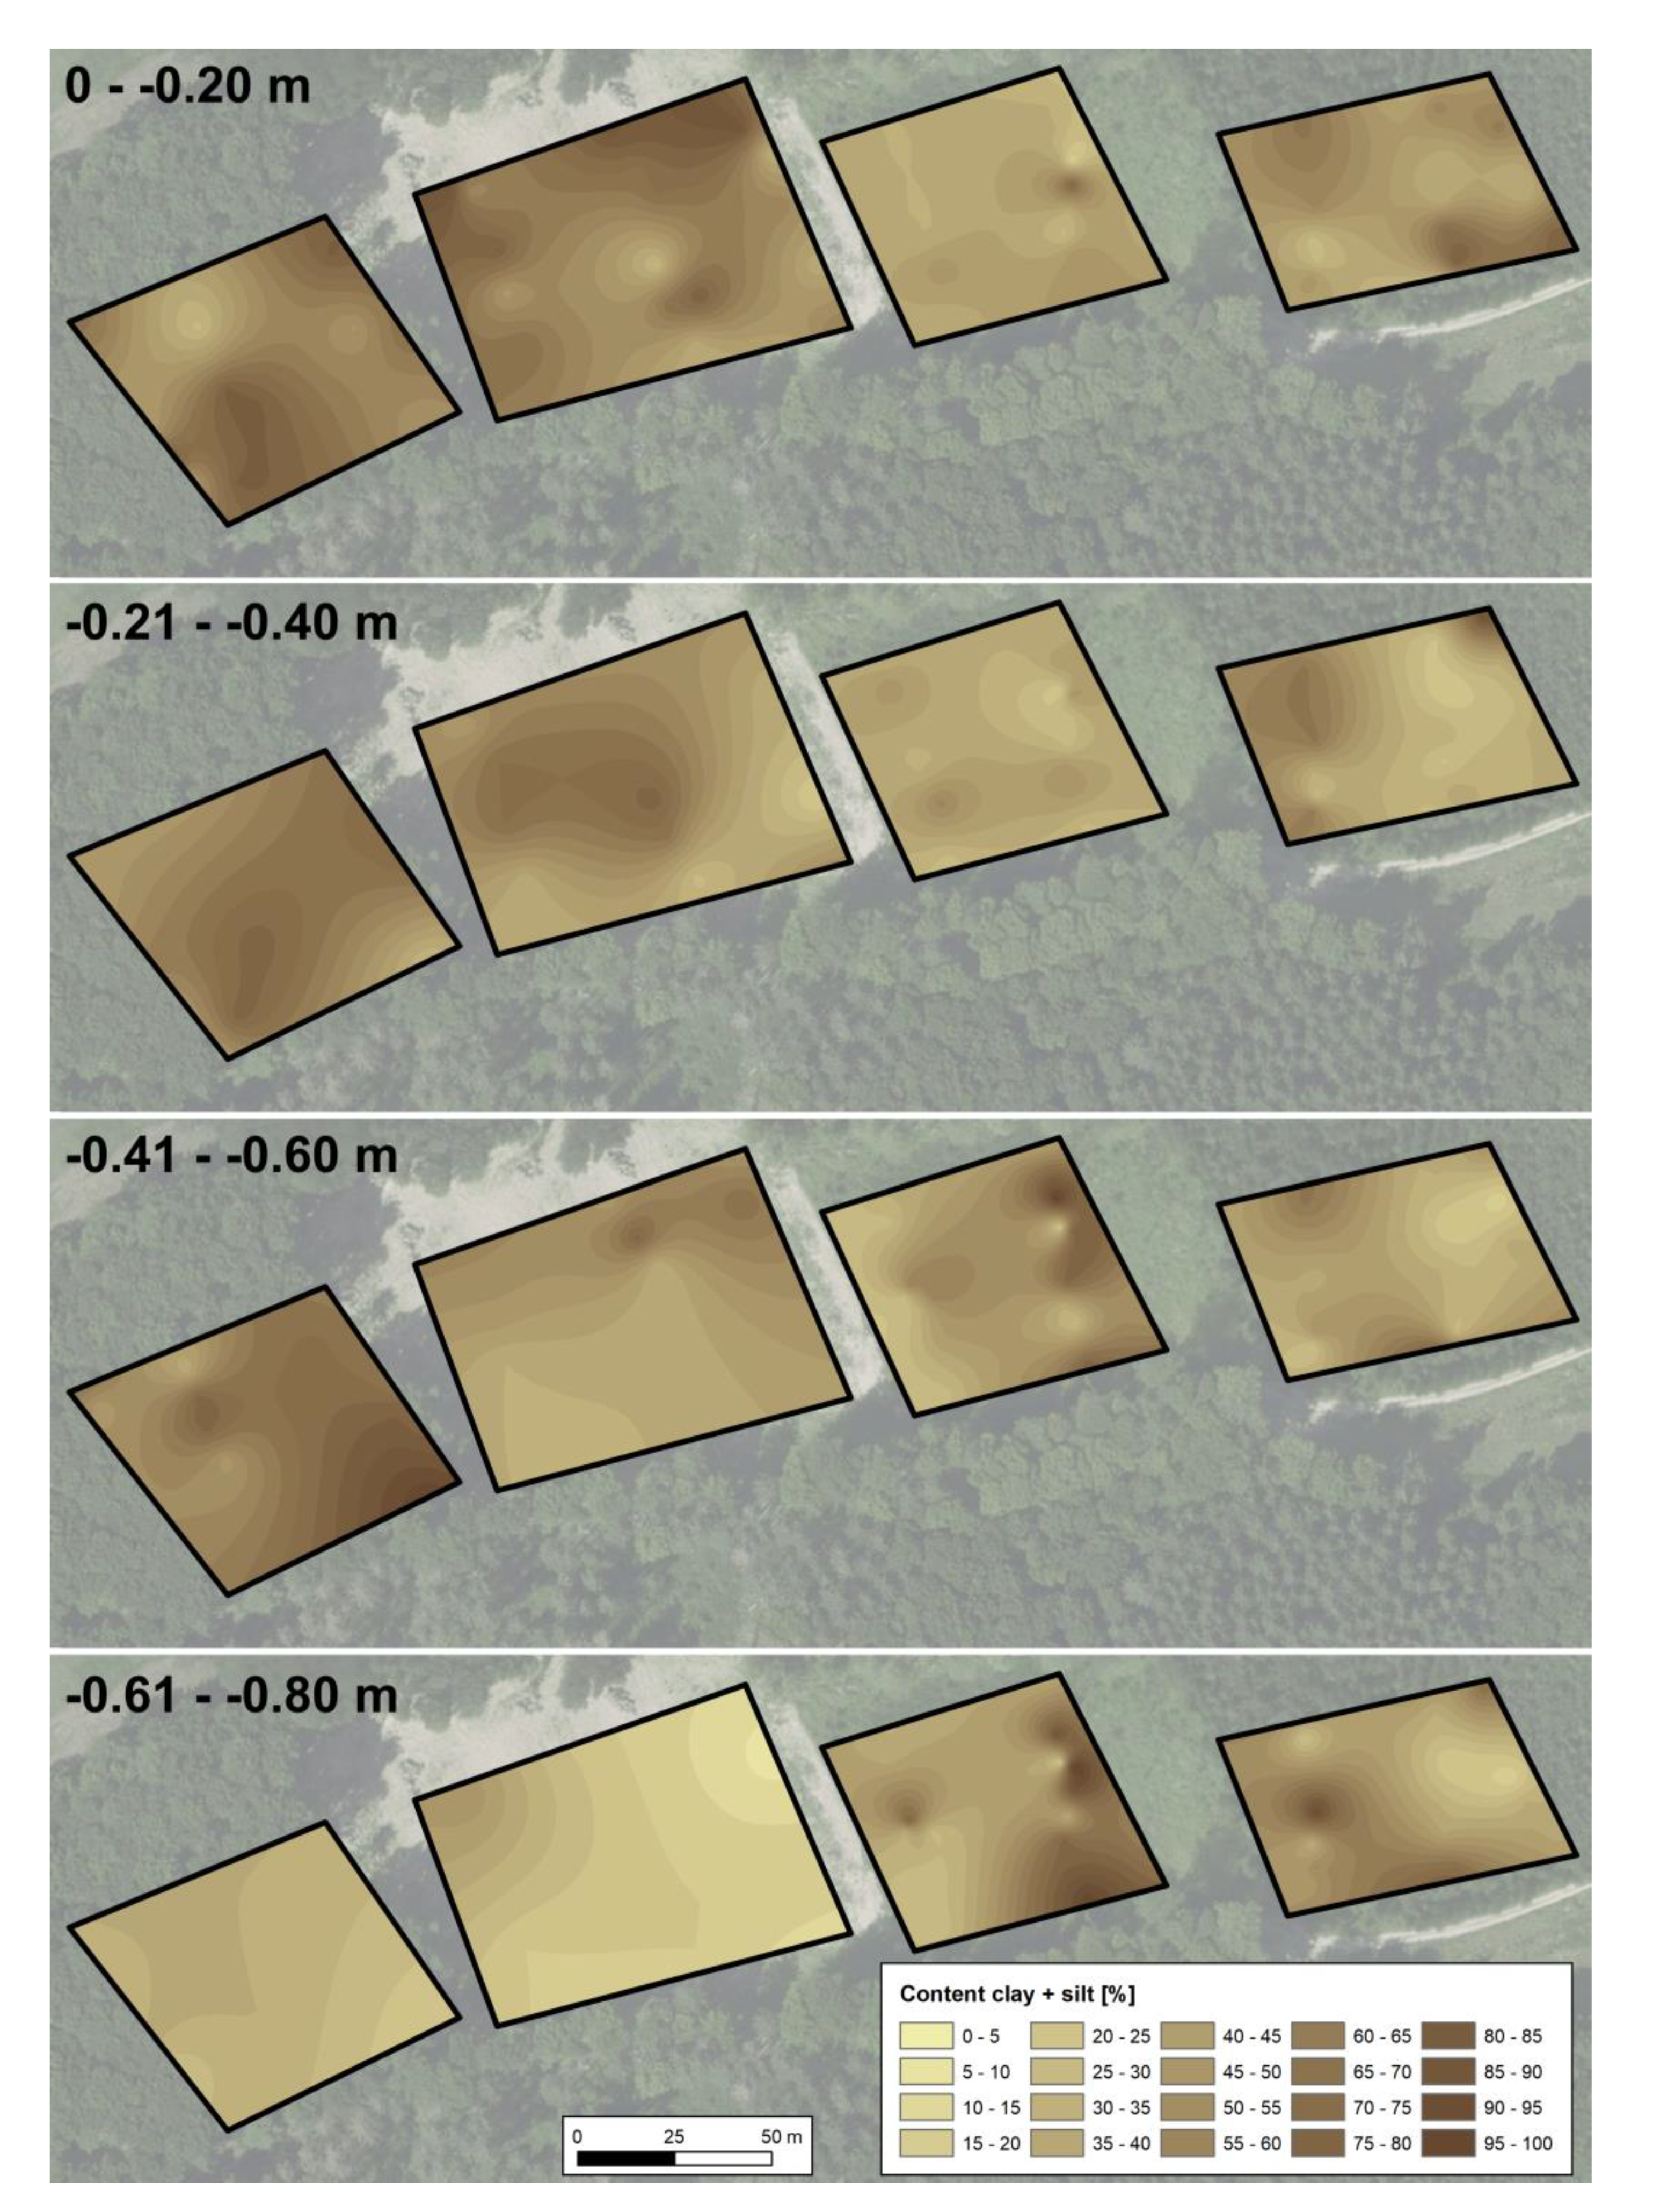
Figure 10.
Interpolated content clay + silt. Aerial photography provided by LVermGeo RLP (2019).
Figure 10.
Interpolated content clay + silt. Aerial photography provided by LVermGeo RLP (2019).
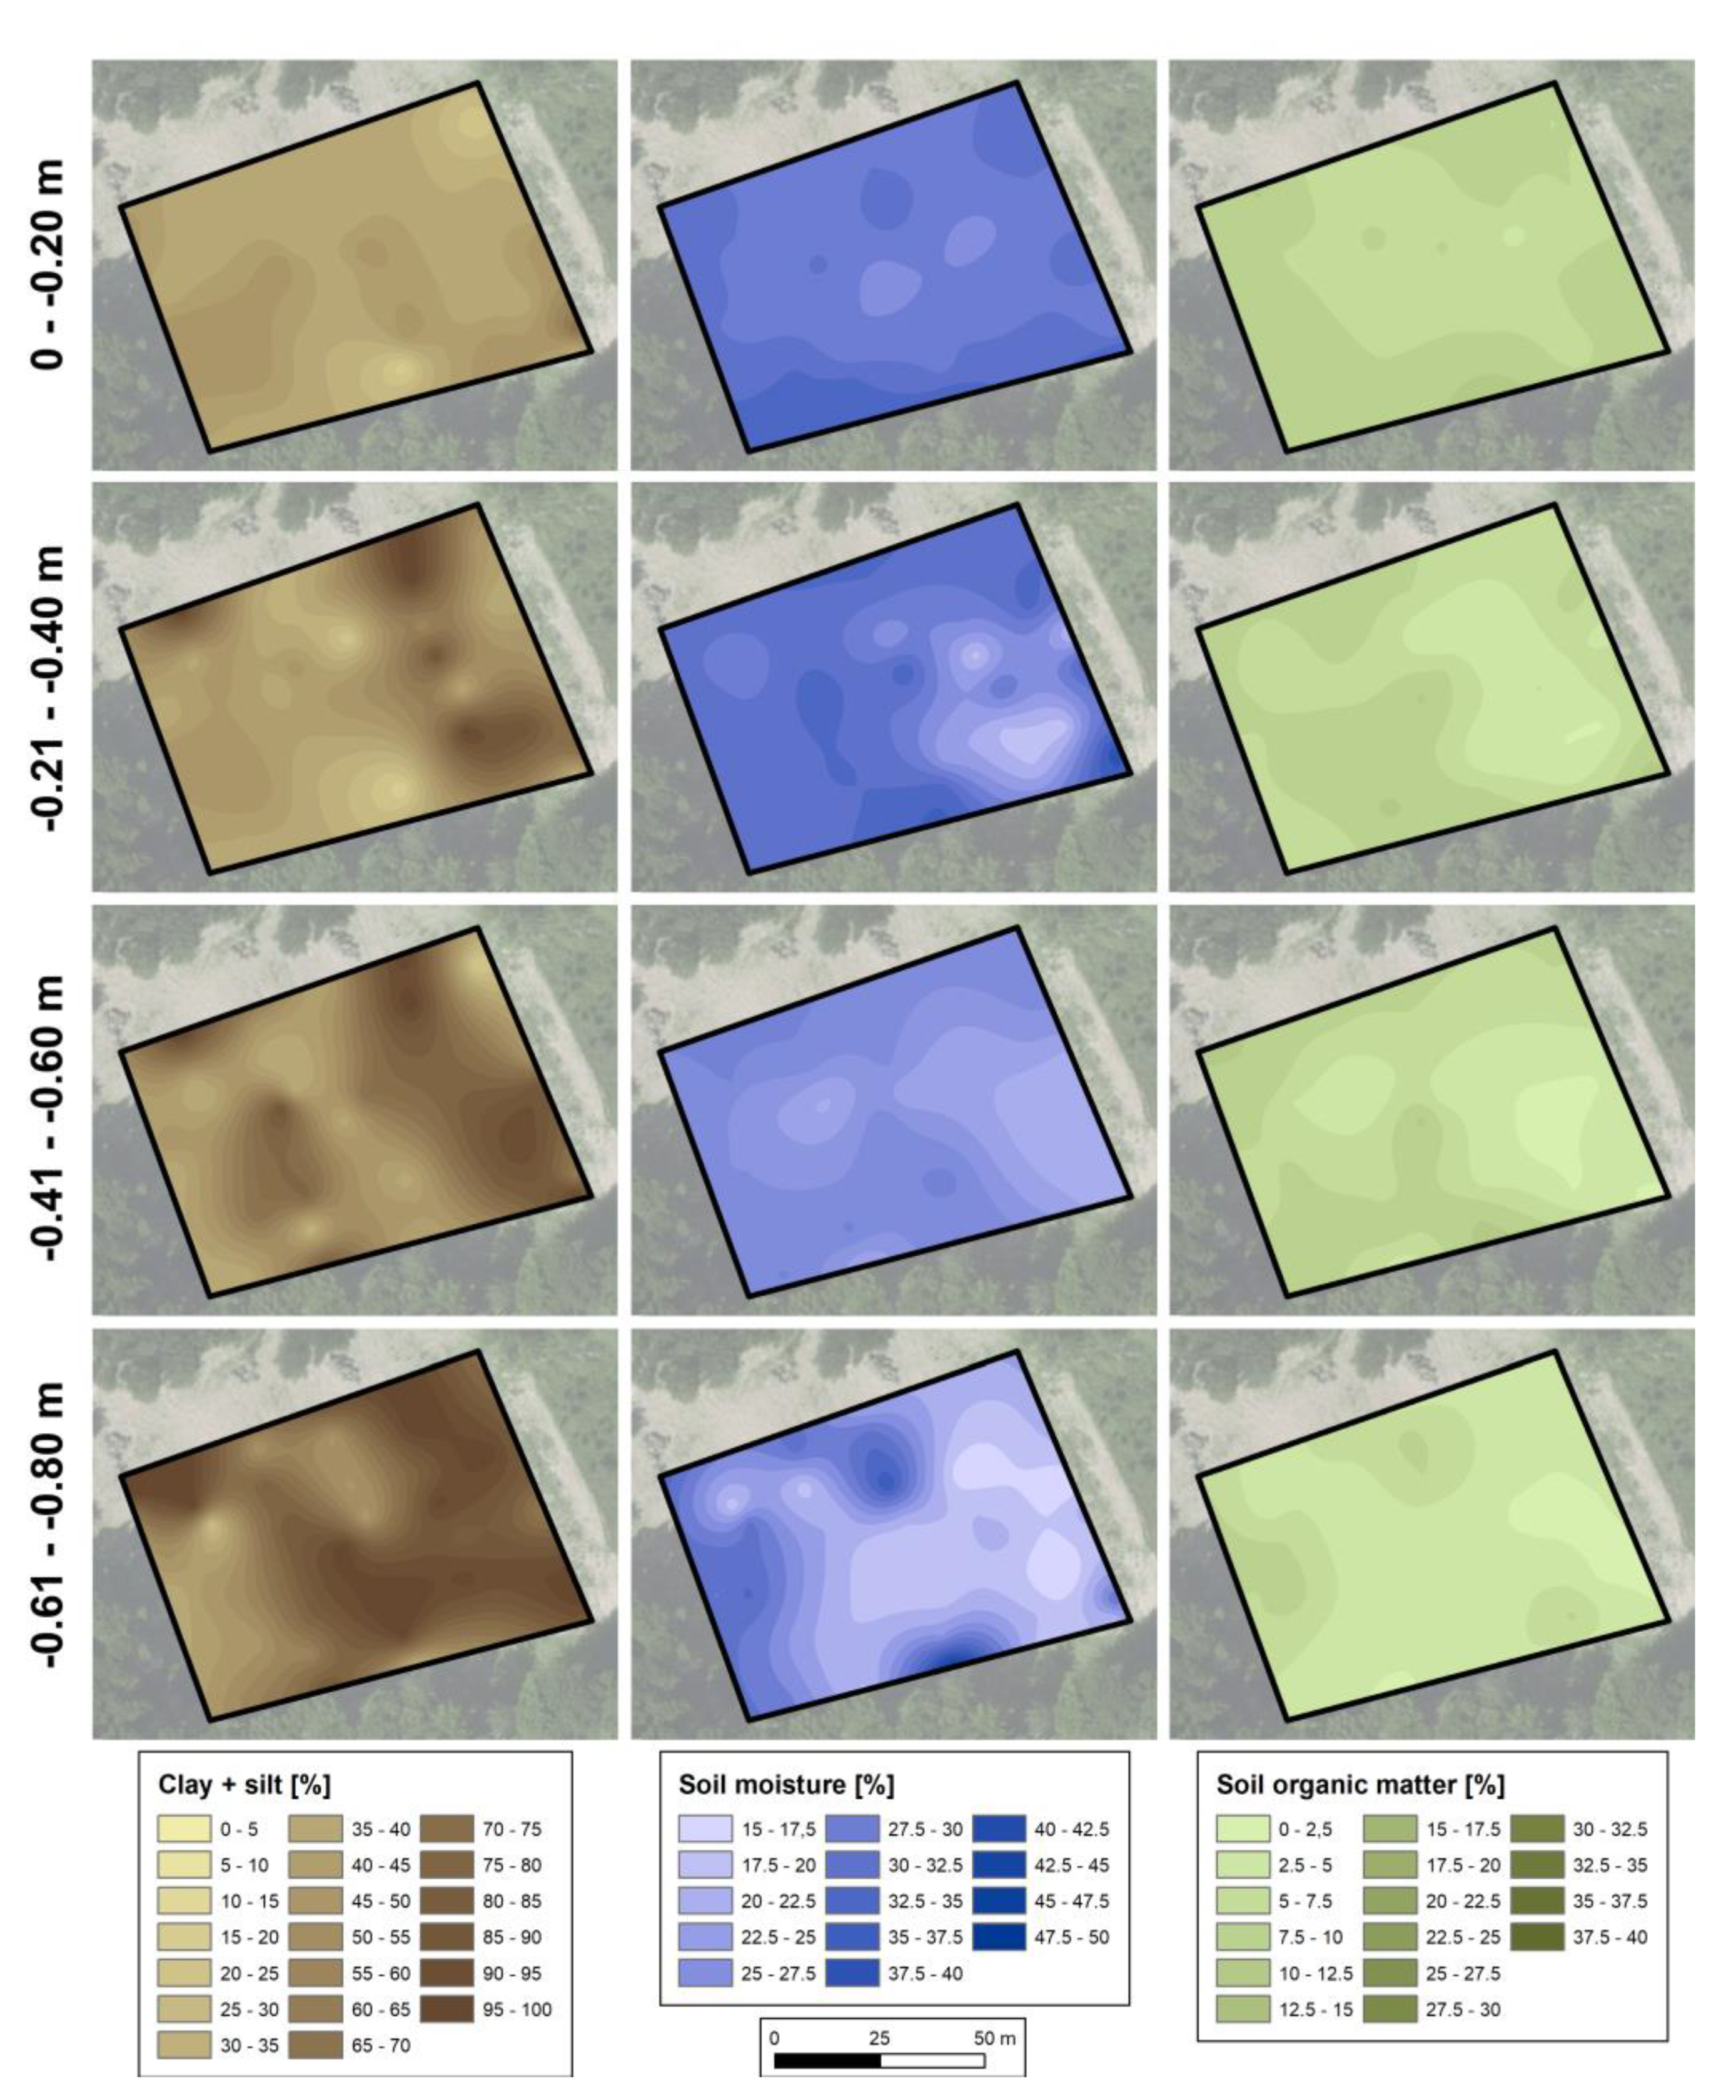
Figure 11.
Interpolated soil moisture. Aerial photography provided by LVermGeo RLP (2019).
Figure 11.
Interpolated soil moisture. Aerial photography provided by LVermGeo RLP (2019).
Figure 12.
Interpolated soil organic matter, depth 0–−0.20 m. Aerial photography provided by LVermGeo RLP (2019).
Figure 12.
Interpolated soil organic matter, depth 0–−0.20 m. Aerial photography provided by LVermGeo RLP (2019).
Figure 13.
Interpolated soil characteristics, CUT EX. Aerial photography provided by LVermGeo RLP (2019).
Figure 13.
Interpolated soil characteristics, CUT EX. Aerial photography provided by LVermGeo RLP (2019).
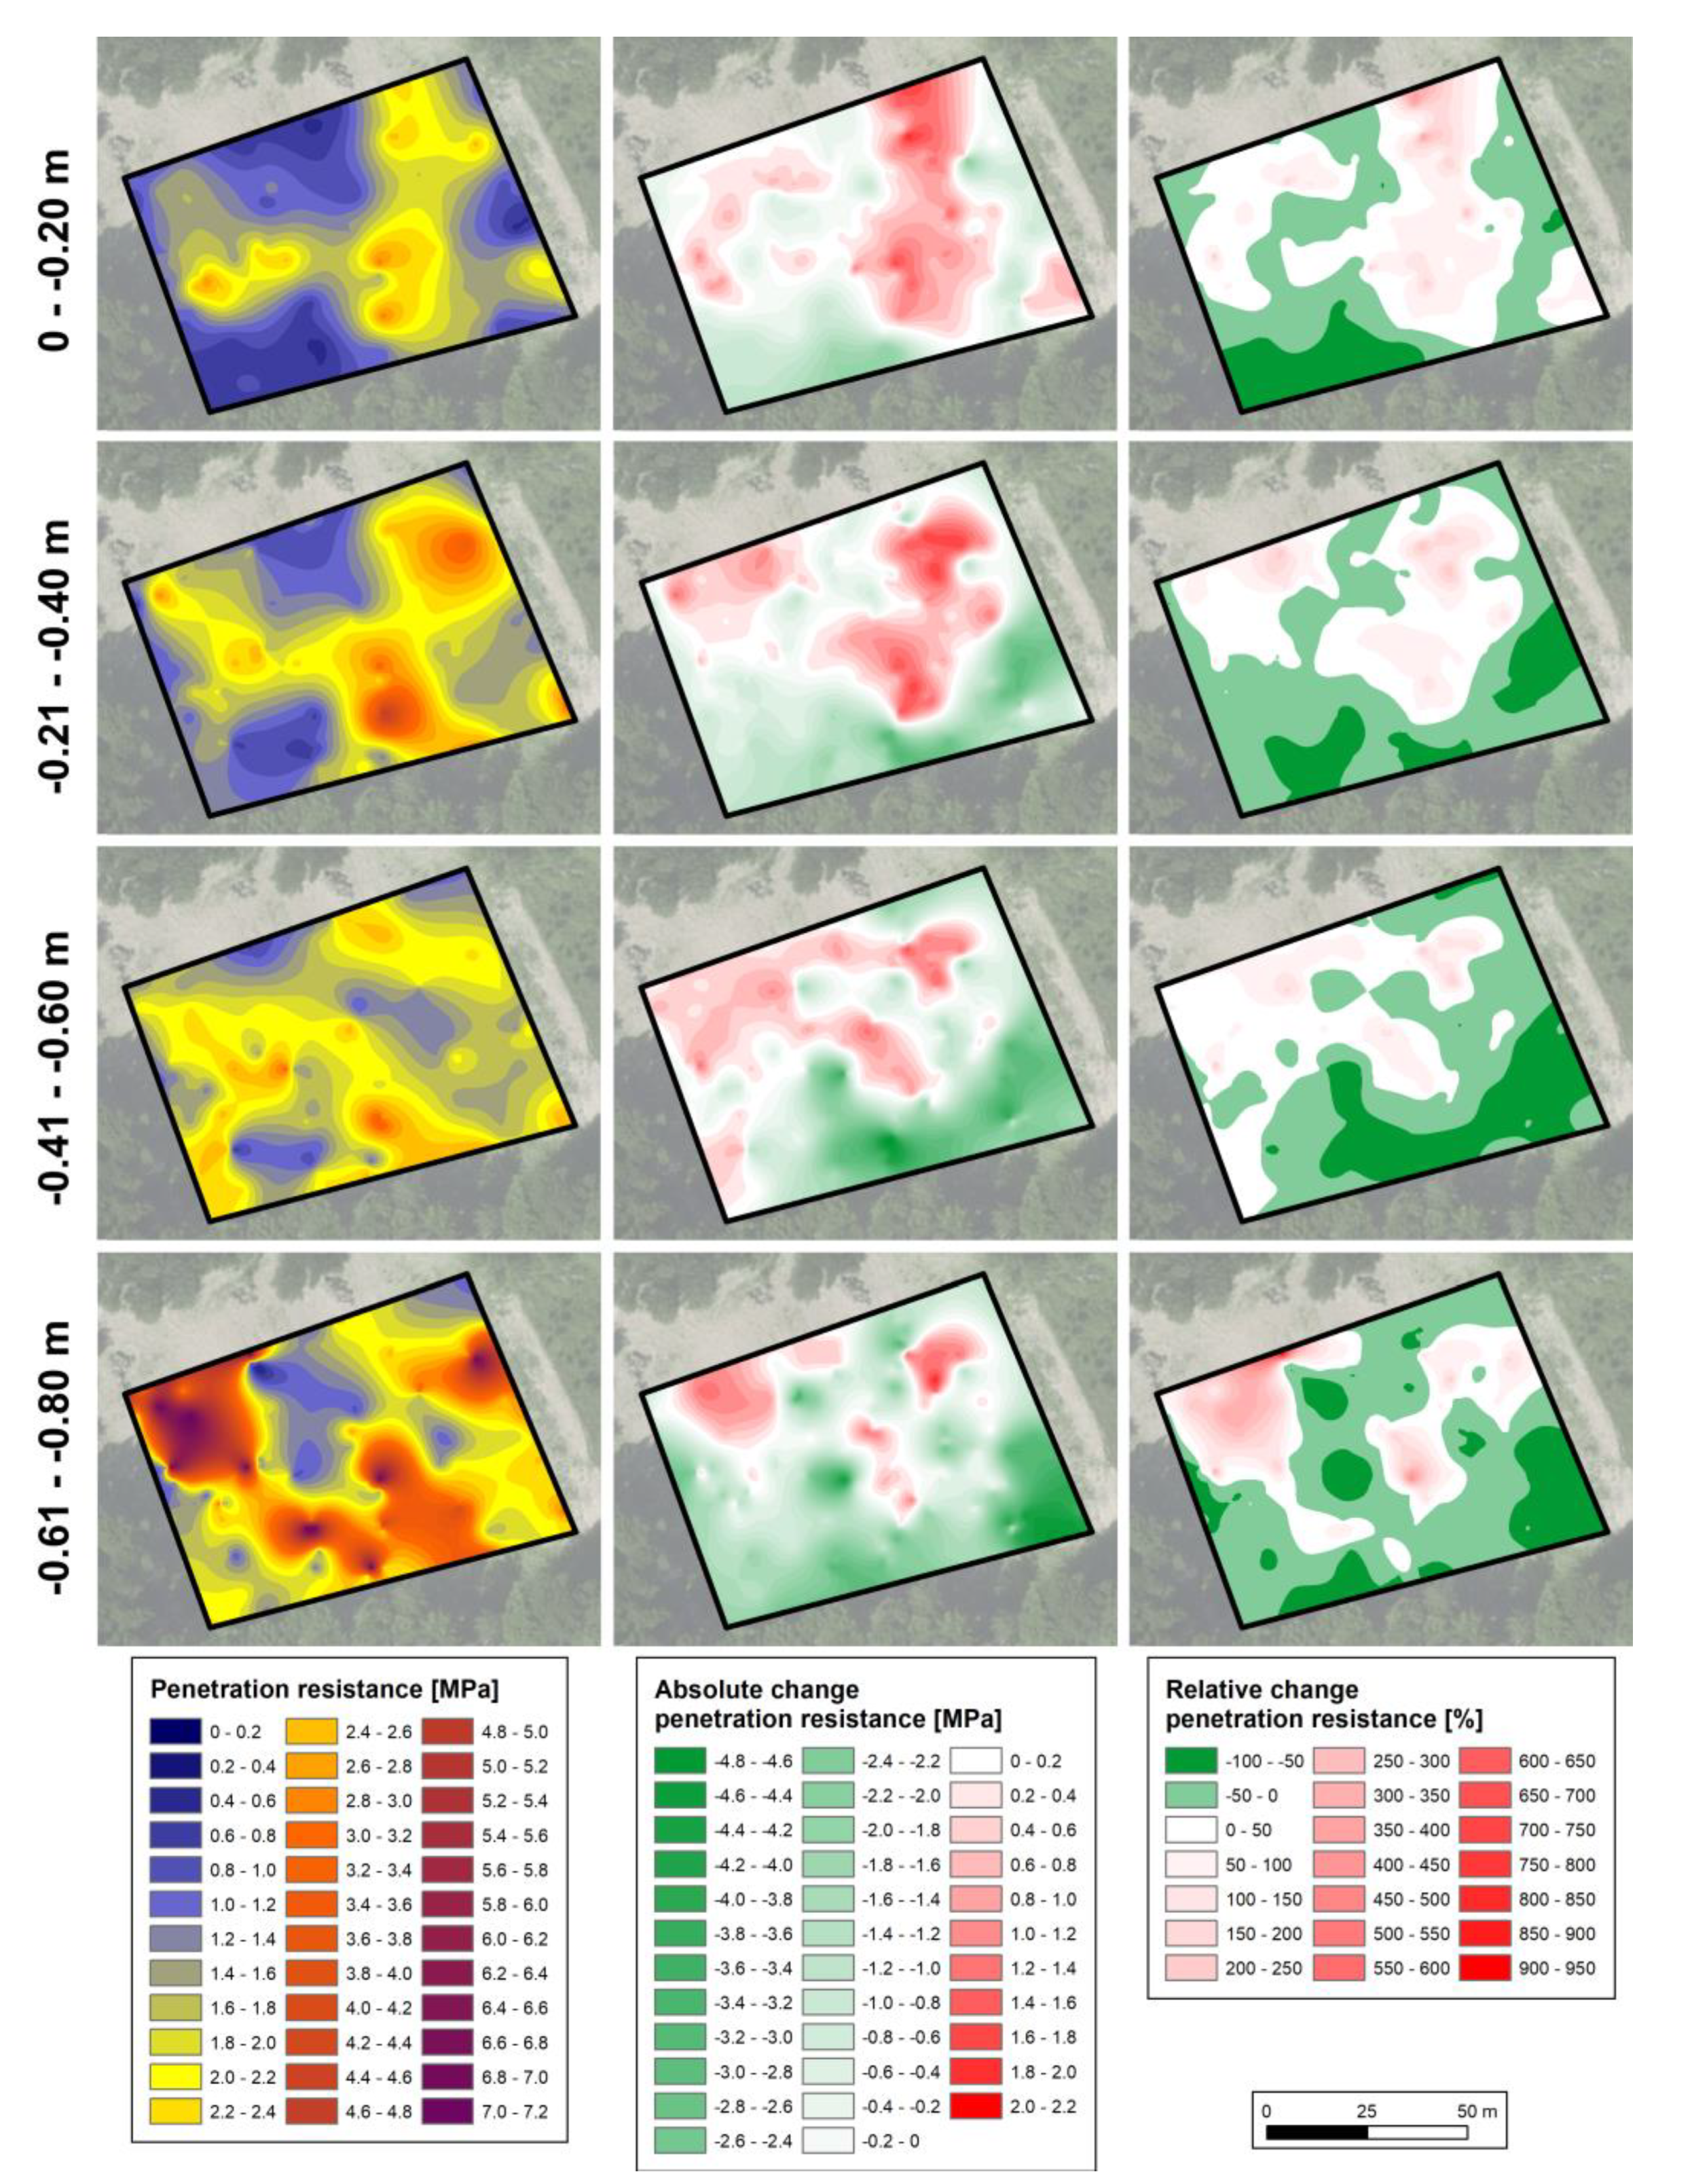
Figure 14.
Interpolated penetration resistance. Aerial photography provided by LVermGeo RLP (2019).
Figure 14.
Interpolated penetration resistance. Aerial photography provided by LVermGeo RLP (2019).
Figure 15.
Interpolated penetration resistance, absolute and relative change of penetration resistance, CUT EX compared to CUT. Aerial photography provided by LVermGeo RLP (2019).
Figure 15.
Interpolated penetration resistance, absolute and relative change of penetration resistance, CUT EX compared to CUT. Aerial photography provided by LVermGeo RLP (2019).
Figure 16.
Absolute and relative change of penetration resistance, CUT EX compared to CUT.
Figure 16.
Absolute and relative change of penetration resistance, CUT EX compared to CUT.
Figure 17.
Relative penetration resistance deviation of backfilled areas compared to undisturbed soil; depth-aggregated data.
Figure 17.
Relative penetration resistance deviation of backfilled areas compared to undisturbed soil; depth-aggregated data.
Figure 18.
Relative shares of factor-classes used for ANOVA.
Figure 18.
Relative shares of factor-classes used for ANOVA.
Figure 19.
Interpolated penetration resistance, root growth restriction classes according to [
13]. Right column: Area CUT EX.
Figure 19.
Interpolated penetration resistance, root growth restriction classes according to [
13]. Right column: Area CUT EX.
Figure 20.
Relative shares of root growth restriction classes according to [
13], interpolated datasets.
Figure 20.
Relative shares of root growth restriction classes according to [
13], interpolated datasets.
Table 1.
Strength of correlation coefficients according to [
50,
51].
Table 1.
Strength of correlation coefficients according to [
50,
51].
| Correlation Coefficient | Strength of Correlation |
|---|
| 0.00–(−)0.09 | Negligible |
| (−)0.10–(−)0.39 | Weak |
| (−)0.40–(−)0.69 | Moderate |
| (−)0.70–(−)0.89 | Strong |
| (−)0.90–(−)1.00 | Very strong |
Table 2.
Effect sizes of Cohen’s f according to ([
52], pp. 285–287).
Table 2.
Effect sizes of Cohen’s f according to ([
52], pp. 285–287).
| f | Effect Size |
|---|
| 0.10 | Small |
| 0.25 | Medium |
| 0.40 | Large |
Table 3.
Soil texture percentages for depth-aggregated data, soil textures according to FAO WRB. Highest percentages indicated bold.
Table 3.
Soil texture percentages for depth-aggregated data, soil textures according to FAO WRB. Highest percentages indicated bold.
| Depth [m] | Soil Texture | FOR | CUT | CUT EX | SUC | REF |
|---|
| 0–−0.20 | S | - | - | 2% | - | - |
| LS | - | 4% | 6% | 3% | 10% |
| SL | 16% | 11% | 86% | 70% | 40% |
| L | 4% | 7% | - | - | 13% |
| SiL | 56% | 67% | 4% | - | 7% |
| Si | - | - | - | - | - |
| CL | - | - | - | - | - |
| SCL | 8% | 7% | 2% | 20% | 13% |
| SiCL | - | - | - | - | - |
| SC | 16% | 4% | - | 3% | 7% |
| SiC | 8% | - | - | - | 3% |
| C | 4% | - | - | 3% | 7% |
| −0.21–−0.40 | S | - | - | 2% | - | 3% |
| LS | - | 5% | 9% | 3% | 3% |
| SL | 36% | 21% | 73% | 54% | 57% |
| L | - | 10% | 2% | 7% | 10% |
| SiL | 7% | - | 4% | - | 7% |
| Si | - | - | - | - | - |
| CL | - | 16% | - | - | - |
| SCL | 7% | 16% | - | 33% | 10% |
| SiCL | - | - | 4% | - | - |
| SC | 7% | 21% | 2% | 3% | 3% |
| SiC | - | - | 2% | - | - |
| C | 43% | 11% | 2% | - | 7% |
| −0.41–−0.60 | S | - | - | 2% | - | 3% |
| LS | - | - | 4% | 3% | 10% |
| SL | 20% | 40% | 51% | 27% | 50% |
| L | - | - | 4% | 7% | 10% |
| SiL | 13% | 10% | 7% | - | 3% |
| Si | - | - | - | - | - |
| CL | - | 10% | 2% | - | - |
| SCL | 7% | - | 4% | 37% | 13% |
| SiCL | - | - | 9% | 3% | - |
| SC | 27% | 30% | 2% | - | 7% |
| SiC | - | - | 2% | - | 3% |
| C | 33% | 10% | 13% | 23% | - |
| −0.61–−0.80 | S | - | 18% | 5% | 3% | 3% |
| LS | 31% | 64% | 2% | 3% | 7% |
| SL | 69% | 9% | 24% | 13% | 50% |
| L | - | - | - | 7% | 3% |
| SiL | - | - | 21% | 7% | 3% |
| Si | - | - | - | - | - |
| CL | - | - | 5% | - | 10% |
| SCL | - | 9% | - | 33% | 3% |
| SiCL | - | - | 7% | 7% | 13% |
| SC | - | - | 7% | 3% | 3% |
| SiC | - | - | 19% | 3% | - |
| C | - | - | 10% | 20% | 3% |
Table 4.
Mean content clay + silt. Depth aggregated data.
Table 4.
Mean content clay + silt. Depth aggregated data.
| | Mean Content Clay + Silt [%] |
|---|
| Depth [m] | FOR | CUT | CUT EX | SUC | REF |
|---|
| 0–−0.20 | 64.5 | 64.7 | 39.6 | 37.0 | 43.4 |
| −0.21–−0.40 | 53.6 | 50.1 | 50.6 | 37.0 | 39.8 |
| −0.41–−0.60 | 60.5 | 50.0 | 59.5 | 47.6 | 40.0 |
| −0.61–−0.80 | 29.0 | 22.0 | 73.4 | 52.3 | 48.0 |
Table 5.
Mean soil moisture (SM). Depth aggregated data.
Table 5.
Mean soil moisture (SM). Depth aggregated data.
| | Mean SM [%] |
|---|
| Depth [m] | FOR | CUT | CUT EX | SUC | REF |
|---|
| 0–−0.20 | 31.7 | 43.0 | 30.5 | 27.1 | 28.0 |
| −0.21–−0.40 | 20.5 | 33.0 | 31.0 | 26.6 | 27.3 |
| −0.41–−0.60 | 21.6 | 33.4 | 28.8 | 25.1 | 27.1 |
| −0.61–−0.80 | 17.7 | 27.8 | 25.1 | 23.5 | 25.5 |
Table 6.
Mean soil organic matter (SOM) content. Depth aggregated data.
Table 6.
Mean soil organic matter (SOM) content. Depth aggregated data.
| | Mean SOM [%] |
|---|
| Depth [m] | FOR | CUT | CUT EX | SUC | REF |
|---|
| 0–−0.20 | 16.0 | 19.4 | 8.1 | 7.7 | 7.6 |
| −0.21–−0.40 | 7.9 | 8.2 | 7.0 | 7.3 | 7.2 |
| −0.41–−0.60 | 8.6 | 8.4 | 6.2 | 5.5 | 7.0 |
| −0.61–−0.80 | 4.6 | 4.7 | 4.3 | 4.2 | 5.7 |
Table 7.
Descriptive statistics (mean, minimum, maximum, standard deviation (σ)) for penetration resistance (PR), depth aggregated data. Values >2 MPa indicated bold.
Table 7.
Descriptive statistics (mean, minimum, maximum, standard deviation (σ)) for penetration resistance (PR), depth aggregated data. Values >2 MPa indicated bold.
| Depth [m] | PR [MPa] | FOR | CUT | CUT EX | SUC | REF |
|---|
| 0–−0.20 | Mean | 1.50 | 1.30 | 1.37 | 1.66 | 1.35 |
| Min | 0.10 | 0.20 | 0.35 | 0.30 | 0.41 |
| Max | 2.71 | 4.33 | 3.21 | 3.47 | 3.03 |
| σ | 0.58 | 0.64 | 0.66 | 0.62 | 0.48 |
| −0.21–−0.40 | Mean | 1.81 | 1.86 | 1.72 | 3.06 | 3.27 |
| Min | 0.73 | 0.47 | 0.49 | 0.80 | 0.20 |
| Max | 3.21 | 6.00 | 4.78 | 4.90 | 4.61 |
| σ | 0.61 | 1.12 | 0.80 | 1.71 | 1.59 |
| −0.41–−0.60 | Mean | 2.01 | 2.27 | 1.82 | 3.35 | 4.44 |
| Min | 0.72 | 0.29 | 0.63 | 1.80 | 0.46 |
| Max | 4.25 | 7.34 | 4.78 | 5.70 | 5.21 |
| σ | 0.76 | 1.49 | 0.71 | 1.80 | 1.07 |
| −0.61–−0.80 | Mean | 2.55 | 2.80 | 2.87 | 3.42 | 4.69 |
| Min | 0.84 | 0.30 | 0.70 | 1.4 | 0.80 |
| Max | 4.44 | 6.47 | 7.20 | 5.92 | 5.32 |
| σ | 0.98 | 1.55 | 1.80 | 1.89 | 0.98 |
Table 8.
Root mean square error (RMSE) interpolated raster clay + silt.
Table 8.
Root mean square error (RMSE) interpolated raster clay + silt.
| | RMSE Clay + Silt |
|---|
| Depth [m] | FOR | CUT | SUC | REF |
|---|
| 0–−0.20 | 4.9 × 10⁻⁸ | 6.3 × 10⁻⁸ | 1.5 × 10⁻⁸ | 3.0 × 10⁻⁸ |
| −0.21–−0.40 | 1.1 × 10⁻⁸ | 1.8 × 10⁻⁸ | 1.4 × 10⁻⁸ | 2.5 × 10⁻⁸ |
| −0.41–−0.60 | 2.9 × 10⁻⁸ | 3.0 × 10⁻⁸ | 4.1 × 10⁻⁸ | 1.4 × 10⁻⁸ |
| −0.61–−0.80 | 4.3 × 10⁻⁹ | 1.2 × 10⁻⁸ | 3.8 × 10⁻⁸ | 2.8 × 10⁻⁸ |
Table 9.
Root mean square error (RMSE) interpolated raster soil moisture.
Table 9.
Root mean square error (RMSE) interpolated raster soil moisture.
| | RMSE Soil Moisture |
|---|
| Depth [m] | FOR | CUT | SUC | REF |
|---|
| 0–−0.20 | 2.1 × 10⁻⁸ | 2.1 × 10⁻⁸ | 2.9 × 10⁻⁸ | 2.6 × 10⁻⁸ |
| −0.21–−0.40 | 1.6 × 10⁻⁸ | 3.6 × 10⁻⁸ | 2.4 × 10⁻⁸ | 1.7 × 10⁻⁸ |
| −0.41–−0.60 | 2.0 × 10⁻⁸ | 4.1 × 10⁻¹¹ | 1.4 × 10⁻⁸ | 2.2 × 10⁻⁸ |
| −0.61–−0.80 | 5.1 × 10⁻⁹ | 8.0 × 10⁻¹² | 1.7 × 10⁻⁸ | 5.8 × 10⁻⁹ |
Table 10.
Root mean square error (RMSE), interpolated raster soil organic matter.
Table 10.
Root mean square error (RMSE), interpolated raster soil organic matter.
| | RMSE Soil Organic Matter |
|---|
| Depth [m] | FOR | CUT | SUC | REF |
|---|
| 0–−0.20 | 1.1 × 10⁻⁸ | 1.0 × 10⁻⁸ | 1.0 × 10⁻⁸ | 2.4 × 10⁻⁹ |
| −0.21–−0.40 | 9.1 × 10⁻⁹ | 8.4 × 10⁻⁹ | 6.5 × 10⁻⁹ | 7.2 × 10⁻⁹ |
| −0.41–−0.60 | 6.4 × 10⁻⁹ | 2.3 × 10⁻¹⁰ | 2.8 × 10⁻⁹ | 4.2 × 10⁻⁹ |
| −0.61–−0.80 | 1.2 × 10⁻⁹ | 2.5 × 10⁻¹² | 4.3 × 10⁻⁹ | 2.0 × 10⁻⁹ |
Table 11.
Root mean square error (RMSE), interpolated raster datasets of CUT EX.
Table 11.
Root mean square error (RMSE), interpolated raster datasets of CUT EX.
| | RMSE Area CUT EX |
|---|
| Depth [m] | Clay + Silt | Soil Moisture | Soil Organic Matter |
|---|
| 0–−0.20 | 7.1 × 10⁻⁹ | 1.4 × 10⁻⁸ | 3.9 × 10⁻⁸ |
| −0.21–−0.40 | 8.0 × 10⁻⁹ | 2.2 × 10⁻⁸ | 3.4 × 10⁻⁸ |
| −0.41–−0.60 | 2.7 × 10⁻⁹ | 2.1 × 10⁻⁸ | 1.9 × 10⁻⁸ |
| −0.61–−0.80 | 1.7 × 10⁻⁹ | 2.2 × 10⁻⁸ | 3.9 × 10⁻⁸ |
Table 12.
Root mean square error (RMSE), interpolated raster datasets (penetration resistance).
Table 12.
Root mean square error (RMSE), interpolated raster datasets (penetration resistance).
| | RMSE Penetration Resistance |
|---|
| Depth [m] | FOR | CUT | SUC | REF |
|---|
| 0–−0.20 | 0.17 | 0.19 | 0.35 | 0.22 |
| −0.21–−0.40 | 0.19 | 0.25 | 0.34 | 0.33 |
| −0.41–−0.60 | 0.24 | 0.34 | 0.34 | 0.20 |
| −0.61–−0.80 | 0.33 | 0.41 | 0.32 | 0.20 |
Table 13.
Descriptive statistics for absolute and relative change of penetration resistance (PR), depth aggregated data. Area CUT EX compared to area CUT.
Table 13.
Descriptive statistics for absolute and relative change of penetration resistance (PR), depth aggregated data. Area CUT EX compared to area CUT.
| Depth [m] | | Absolute Change PR [MPa] | Relative Change PR [%] |
|---|
| 0–−0.20 | Mean | 0.03 | 13.9 |
| Min | −2.01 | −78.6 |
| Max | 2.00 | 387 |
| −0.21–−0.40 | Mean | −0.27 | 1.38 |
| Min | −3.19 | −71.3 |
| Max | 1.8 | 253.2 |
| −0.41–−0.60 | Mean | −0.61 | −6.4 |
| Min | −4.77 | −79.0 |
| Max | 1.54 | 257.1 |
| −0.61–−0.80 | Mean | −0.37 | 12.2 |
| Min | −4.69 | −76.1 |
| Max | 6.49 | 906.0 |
Table 14.
Results of the Kolmogorov–Smirnov test for depth aggregated data. Normally distributed datasets (p > 0.05) are indicated bold.
Table 14.
Results of the Kolmogorov–Smirnov test for depth aggregated data. Normally distributed datasets (p > 0.05) are indicated bold.
| Depth [m] | | FOR | CUT | CUT EX | SUC | REF |
|---|
| 0–−0.20 | n | 150 | 150 | 153 | 150 | 150 |
| p | 0.200 | 0.200 | 0.000 | 0.200 | 0.200 |
| −0.21–−0.40 | n | 150 | 150 | 153 | 120 | 68 |
| p | 0.033 | 0.000 | 0.002 | 0.004 | 0.003 |
| −0.41–−0.60 | n | 147 | 150 | 150 | 106 | 34 |
| p | 0.012 | 0.000 | 0.002 | 0.121 | 0.001 |
| −0.61–−0.80 | n | 144 | 149 | 137 | 101 | 29 |
| p | 0.003 | 0.000 | 0.000 | 0.200 | 0.050 |
Table 15.
Kruskal–Wallis test for all areas (FOR, CUT, CUT EX, SUC, REF). Significantly different areas (p < 0.05) are indicated bold.
Table 15.
Kruskal–Wallis test for all areas (FOR, CUT, CUT EX, SUC, REF). Significantly different areas (p < 0.05) are indicated bold.
| Depth [m] | p |
|---|
| 0–−0.20 | 0.000 |
| −0.21–−0.40 | 0.000 |
| −0.41–−0.60 | 0.000 |
| −0.61–−0.80 | 0.000 |
Table 16.
Pairwise Kruskal–Wallis test. Significantly different areas (p < 0.05) are indicated bold.
Table 16.
Pairwise Kruskal–Wallis test. Significantly different areas (p < 0.05) are indicated bold.
| Depth [m] | | FOR | CUT | CUT EX | SUC |
|---|
| 0–−0.20 | CUT | 0.010 | − | − | − |
| CUT EX | 1.000 | 0.515 | − | − |
| SUC | 0.233 | 0.000 | 0.020 | − |
| REF | 0.204 | 1.000 | 1.000 | 0.000 |
| −0.21–−0.40 | CUT | 1.000 | − | − | − |
| CUT EX | 1.000 | 1.000 | − | − |
| SUC | 0.000 | 0.000 | 0.000 | − |
| REF | 0.000 | 0.000 | 0.000 | 1.000 |
| −0.41–−0.60 | CUT | 1.000 | − | − | − |
| CUT EX | 1.000 | 0.426 | − | − |
| SUC | 0.000 | 0.000 | 0.000 | − |
| REF | 0.000 | 0.000 | 0.000 | 1.000 |
| −0.61–−0.80 | CUT | 1.000 | − | − | − |
| CUT EX | 0.000 | 0.156 | − | − |
| SUC | 0.000 | 0.000 | 0.000 | − |
| REF | 0.000 | 0.000 | 0.000 | 1.000 |
Table 17.
Kruskal–Wallis test for simplified areas (Undisturbed, CUT EX, SUC, REF). Significantly different areas (p < 0.05) are indicated bold.
Table 17.
Kruskal–Wallis test for simplified areas (Undisturbed, CUT EX, SUC, REF). Significantly different areas (p < 0.05) are indicated bold.
| Depth [m] | p |
|---|
| 0–−0.20 | 0.067 |
| −0.21–−0.40 | 0.000 |
| −0.41–−0.60 | 0.000 |
| −0.61–−0.80 | 0.000 |
Table 18.
Pairwise Kruskal–Wallis test, comparing disturbed and aggregated undisturbed areas. Significantly different areas (p < 0.05) are indicated bold.
Table 18.
Pairwise Kruskal–Wallis test, comparing disturbed and aggregated undisturbed areas. Significantly different areas (p < 0.05) are indicated bold.
| Depth [m] | | CUT EX | SUC | REF |
|---|
| 0–−0.20 | Undisturbed | 1.000 | 0.000 | 1.000 |
| −0.21–−0.40 | Undisturbed | 1.000 | 0.000 | 0.000 |
| −0.41–−0.60 | Undisturbed | 0.182 | 0.000 | 0.000 |
| −0.61–−0.80 | Undisturbed | 0.092 | 0.000 | 0.000 |
Table 19.
Spearman-correlation for penetration resistance (PR), clay + silt content (C + Si), soil moisture (SM), soil organic matter (SOM). Strong (< −0.700, > 0.700) and very strong (< −0.900, > 0.900) correlations are indicated bold.
Table 19.
Spearman-correlation for penetration resistance (PR), clay + silt content (C + Si), soil moisture (SM), soil organic matter (SOM). Strong (< −0.700, > 0.700) and very strong (< −0.900, > 0.900) correlations are indicated bold.
| | PR FOR
(n = 600) | PR CUT
(n = 600) | PR CUT EX
(n = 612) | PR SUC
(n = 600) | PR REF
(n = 600) |
|---|
| C + Si | −0.18 ** | −0.51 ** | 0.33 ** | 0.14 ** | −0.06 ** |
| SM | −0.36 ** | −0.40 ** | −0.30 ** | −0.28 ** | −0.35 ** |
| SOM | −0.35 ** | −0.39 ** | −0.32 ** | −0.28 ** | −0.36 ** |
| Depth | 0.41 ** | 0.40 ** | 0.29 ** | 0.54 ** | 0.79 ** |
Table 20.
Class breaks for dependent factors (Content clay + silt (C + Si), soil moisture (SM), soil organic matter (SOM)), based on quantiles.
Table 20.
Class breaks for dependent factors (Content clay + silt (C + Si), soil moisture (SM), soil organic matter (SOM)), based on quantiles.
| | | Class Break Value [%] |
|---|
| Quantile | Class | (C + Si) | SM | SOM |
|---|
| 10% | 1 | 30.8 | 19.6 | 3.9 |
| 25% | 2 | 36.8 | 23.0 | 5.2 |
| 50% | 3 | 46.5 | 26.7 | 6.8 |
| 75% | 4 | 61.1 | 30.6 | 8.4 |
| 90% | 5 | 72.1 | 33.7 | 12.2 |
Table 21.
Sorted effect sizes (f) of all significant (p < 0.05) factors affecting penetration resistance.
Table 21.
Sorted effect sizes (f) of all significant (p < 0.05) factors affecting penetration resistance.
| Factor(s) | f |
|---|
| Depth | 0.167 |
| (C + Si) × Area | 0.136 |
| Depth × (C + Si) × Area | 0.097 |
| Area | 0.095 |
| SOM × Area | 0.088 |

 ,
, 


