Article

Rural Household Livelihood and Tree Plantation Dependence in the Central Mountainous Region of Hainan Island, China: Implications for Poverty Alleviation

1
State Key Laboratory of Urban and Regional Ecology, Research Center for Eco-Environmental Sciences, Chinese Academy of Science, Beijing 100085, China
2
University of Chinese Academy of Sciences, Beijing 100049, China
3
Environmental Science Institute of Hainan, Haikou 571126, China
4
Humphrey School of Public Affairs, Minneapolis, MN 55455, USA
5
Institute on the Environment, University of Minnesota, St Paul, MN 55108, USA
6
Rainforest Alliance, New York, NY 10279, USA
7
School of Economics and Finance, Xi’an Jiaotong University, Xi’an 710061, China
8
Department of Applied Economics, University of Minnesota, St Paul, MN 55108, USA
9
Beijing Museum of Natural History, Beijing 100050, China
*
Author to whom correspondence should be addressed.
Forests 2020, 11(2), 248; https://doi.org/10.3390/f11020248
Submission received: 5 January 2020 / Revised: 17 February 2020 / Accepted: 19 February 2020 / Published: 24 February 2020
(This article belongs to the Special Issue Forests, Plantations, and Land Use)

Abstract

:
Plantations support local economies and rural livelihoods in many mountainous regions, where poverty and a fragile environment are often interlinked. Managing plantations sustainably and alleviating poverty is a major challenge. This study reports on the findings of a household livelihood survey in the central mountainous region of Hainan Island, a global biodiversity hotspot. The survey aimed to identify rural household livelihoods, strategies to lift rural households out of poverty and potential environmental consequences of different livelihood strategies. Households were divided into five groups based on their main source of income: plantations, crops, livestock, local off-farm income and remittances. Plantations were the main source of income for 74% of households and provided 46% of the total income. Plantation land area, planting diverse tree species and intercropping were significantly associated with higher income. Reallocating land by family size could increase the proportion of households above the poverty line in the plantation group from 51.3% to 85.3%, while making only 3.3% of households worse off. Lower income households tended to apply more chemicals to plantations, which suggests that they create more strain on the environment. Improving household income through dynamically allocating plantation land and diversifying planted species could therefore be beneficial both socially and environmentally. Our results emphasize the importance of dynamic plantation land allocation and diverse plantation planting in poverty alleviation and environmental sustainability.

Graphical Abstract

1. Introduction

An estimated 13% of the world’s people live in mountain areas [1]. The scarcity of available arable land, general absence of local roads to urban areas, low public investment in health and education, scarce basic infrastructure and low levels of employment contribute to a low standard of living and reduced wellbeing [2,3]. Mountainous areas also often contain a large number of long-term poverty traps [2,3]. Increasingly strict conservation policies have led to fewer opportunities to encroach on natural forest and bring it into agricultural production, which means that the potential to reduce poverty by expanding agricultural land is limited. It is important to understand how to optimize constrained agricultural resources, especially in forest estates, and also improve human well-being to alleviate poverty globally [4,5,6].
In theory, effective plantation management may increase peasants’ incomes and contribute to poverty alleviation. Widespread tree plantations (such as Eucalyptus spp., tropical Acacia spp. and oil palm) increase household income from wood and biofuel production [7,8]. Unlike monocultures with a single objective, polyculture has the potential to fulfill a variety of objectives [7], such as increased income, reduced vulnerability to volatile global markets for forestry products [9], better regulating services and nature conservation [10]. Polycultures could be designed to accomplish diverse and context-specific goals. Intercropping with vegetables or legumes, forest farming for mushrooms, medicinal herbs, floral greenery and livestock are all being integrated into plantation systems [11]. The shortage of land can hamper long-term income generation for local rural households in tropical forest areas [3], but appropriate forestry land reallocation and full use of current land resources might be helpful to alleviate poverty [12]. Tree plantations can contribute to economic growth and rural livelihoods [13,14]. However, plantation monocultures often generate environmental problems, including air and water pollution, soil erosion, waterway siltation, flooding and biodiversity loss [14].
There are many examples of forest-based resources being used to achieve multiple Sustainable Development Goals [15], including alleviating poverty, reducing inequalities and supporting decent work and economic growth [16,17]. Most previous studies have been qualitative and based on residents’ recognition of effects [18]. Various studies have also investigated the interactions between natural/public managed forest, or mixed-planted forests and rural livelihoods [19,20,21,22]. A recent study investigated the role of planted forests, mainly industrial plantations, in supporting rural households [6]. However, there is still little quantitative evidence to support the role that could be played by tree plantations owned by local smallholders in mountainous areas to alleviate poverty with little environmental effect [14,17,18].
China has the largest afforested area in the world [23]. Through the Bonn Challenge, plantation forests are being expanded by involving local smallholders in many other countries [24,25,26]. This approach leads to intimate relationships between forest assets and poverty. In many other countries, extreme poverty and biodiversity hot spots are also similarly geographically collocated and concentrated in rural areas where livelihoods depend disproportionately on natural capital in forests [27,28]. As a global biodiversity hotspot, the central mountainous region of Hainan Island has increasingly large areas given over to tree plantations and an extremely poor population [10]. To identify the interactions between plantation forests and rural livelihoods, we took the central region of Hainan Island as a case study area and conducted a household survey to determine: (i) the common livelihood strategies in tropical mountainous areas and the role of plantations for rural households; (ii) the potential paths to leverage the limited land resource to alleviate poverty in mountainous areas and (iii) the potential environmental outcomes for each livelihood strategy.

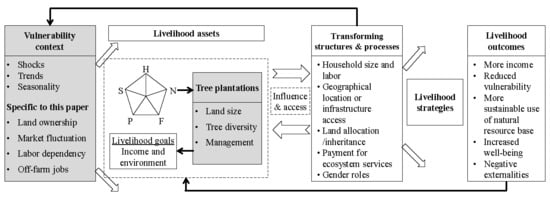
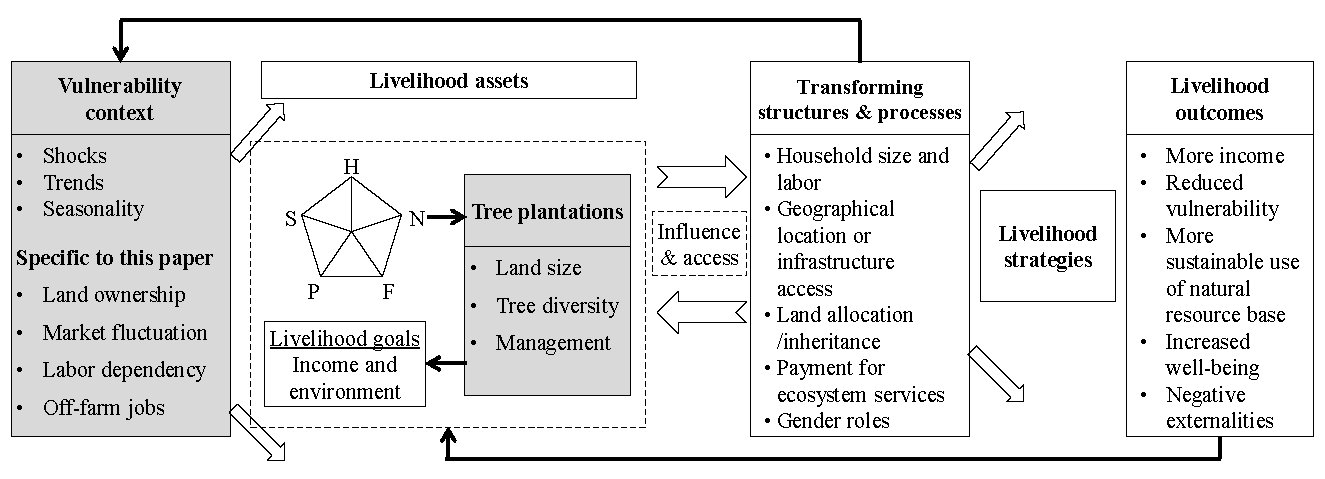
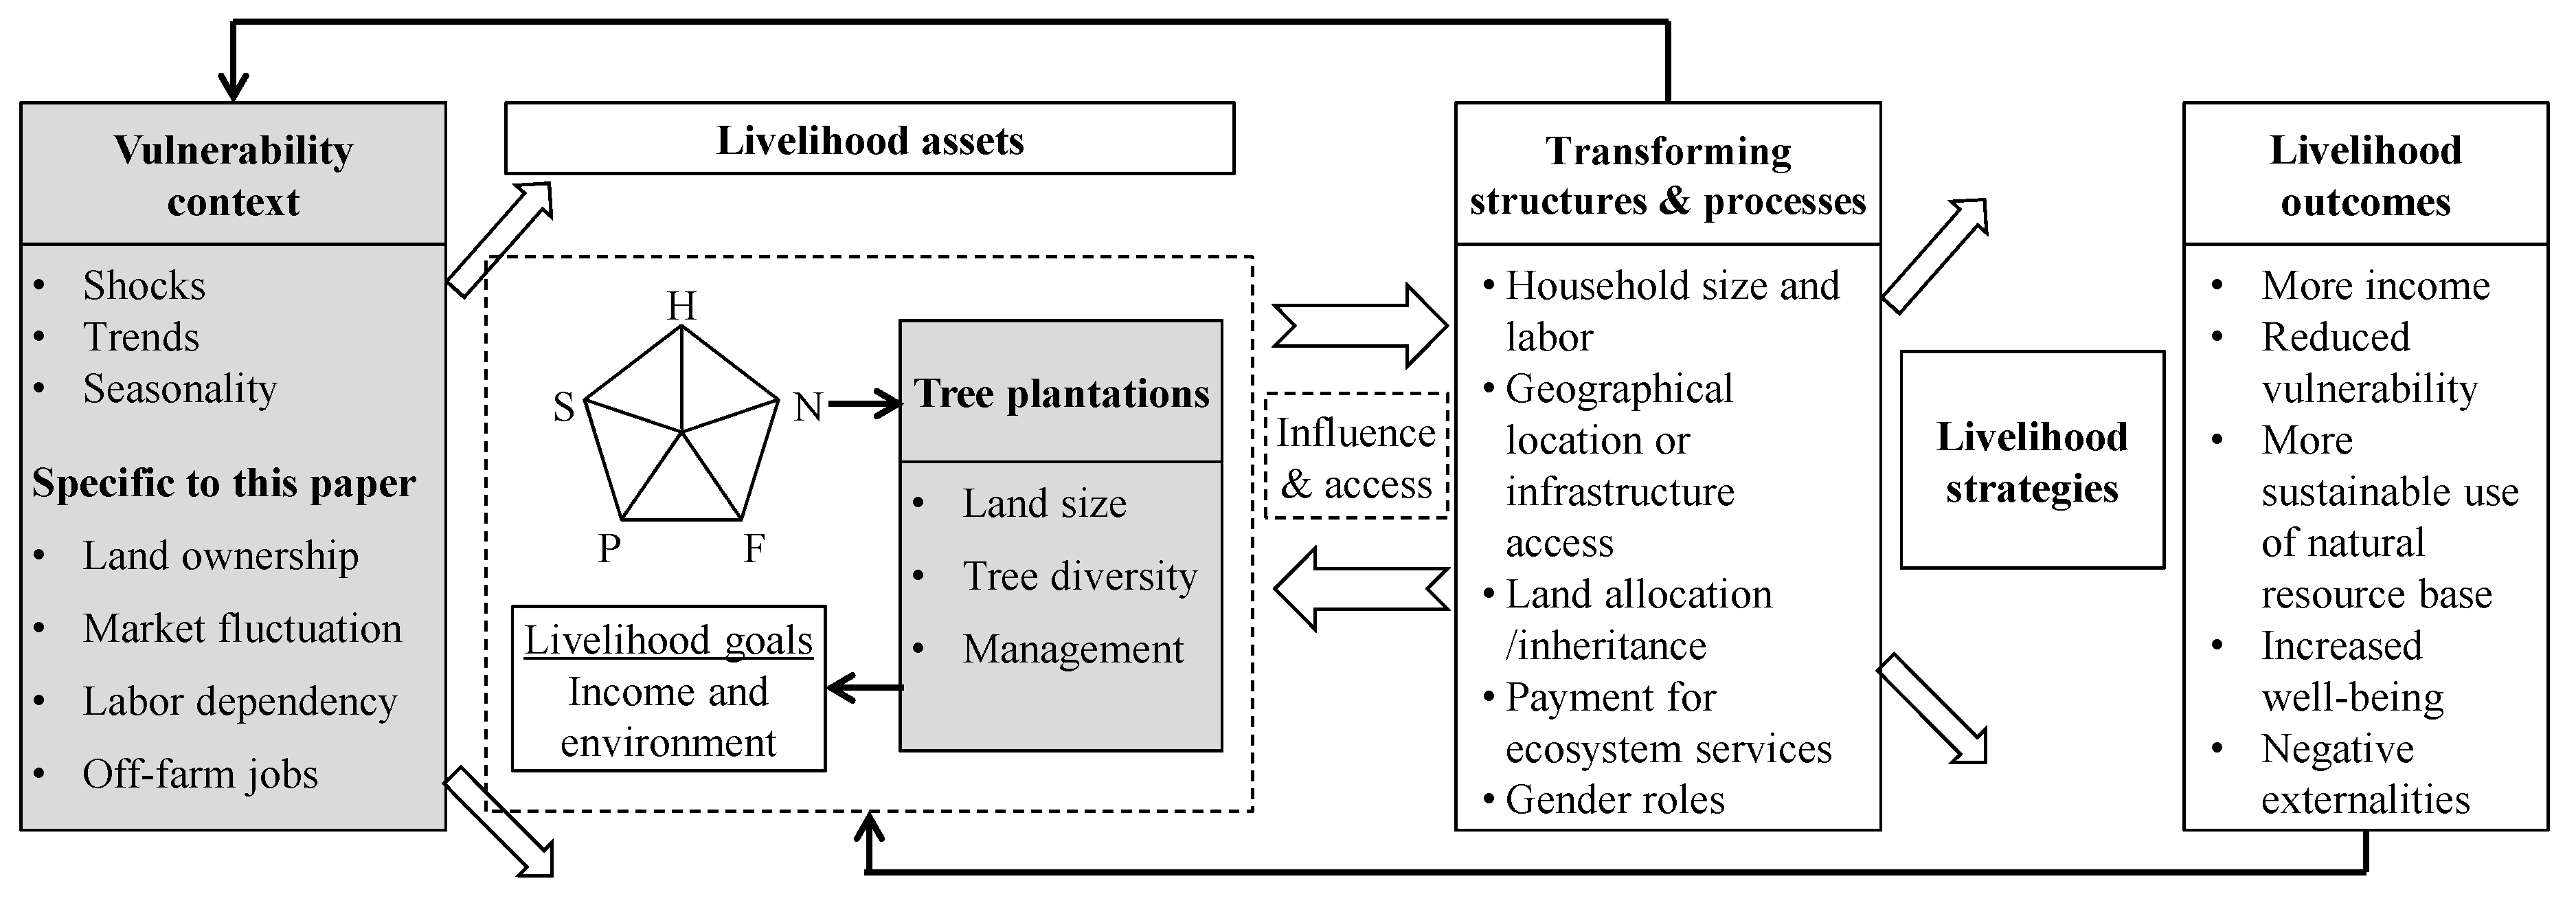
2. Conceptual Framework

In line with previous studies [29], we used a livelihood approach as an organizing framework to better understand the relationships between rural household livelihood and tree plantation dependence in mountainous areas (Figure 1). Chambers and Conway [30] proposed a popular definition of livelihoods as “the capability, assets (including both material and social resources) and activities required for a means of living. A livelihood is sustainable when it can cope with and recover from stresses and choices, maintain or enhance its capabilities and assets, while not undermining the natural resource base”. Subsequent studies identified five main categories of capital (natural, physical, human, financial and social), which are useful in understanding rural livelihoods [29].
The framework in Figure 1 highlights the role of tree plantations, an important form of natural capital [31], interacting with other forms to shape household livelihoods. The land area, tree diversity and management (such as management intensity) of tree plantations will directly affect livelihood goals (such as income and environment) [31,32,33] and also affect livelihood in other ways (such as land allocation/inheritance, payment for ecosystem services (PES)) and other constraints (such as household size and labor, geographical location or infrastructure access) [18,34,35]. Different livelihood strategies will result in positive or negative livelihood outcomes.
Figure 1 also highlights the vulnerability of rural households in mountainous regions with tree plantations. Land ownership of tree plantations, market fluctuations in plantation products, labor dependency and off-farm jobs will directly influence the amounts of different kinds of livelihood assets and also affect livelihood strategies and outcomes [18,36].
In mountainous regions, tree plantations play a key role in supporting rural household livelihood. However, their management significantly influences livelihood (such as income and environmental externalities). The framework (Figure 1) helps us to understand (i) common livelihood strategies, (ii) the role of plantations for rural households, (iii) potential institutions to alleviate poverty by leveraging the limited land resource and (iv) the potential environmental outcomes for each livelihood strategy in tropical mountainous areas.

3. Materials and Methods
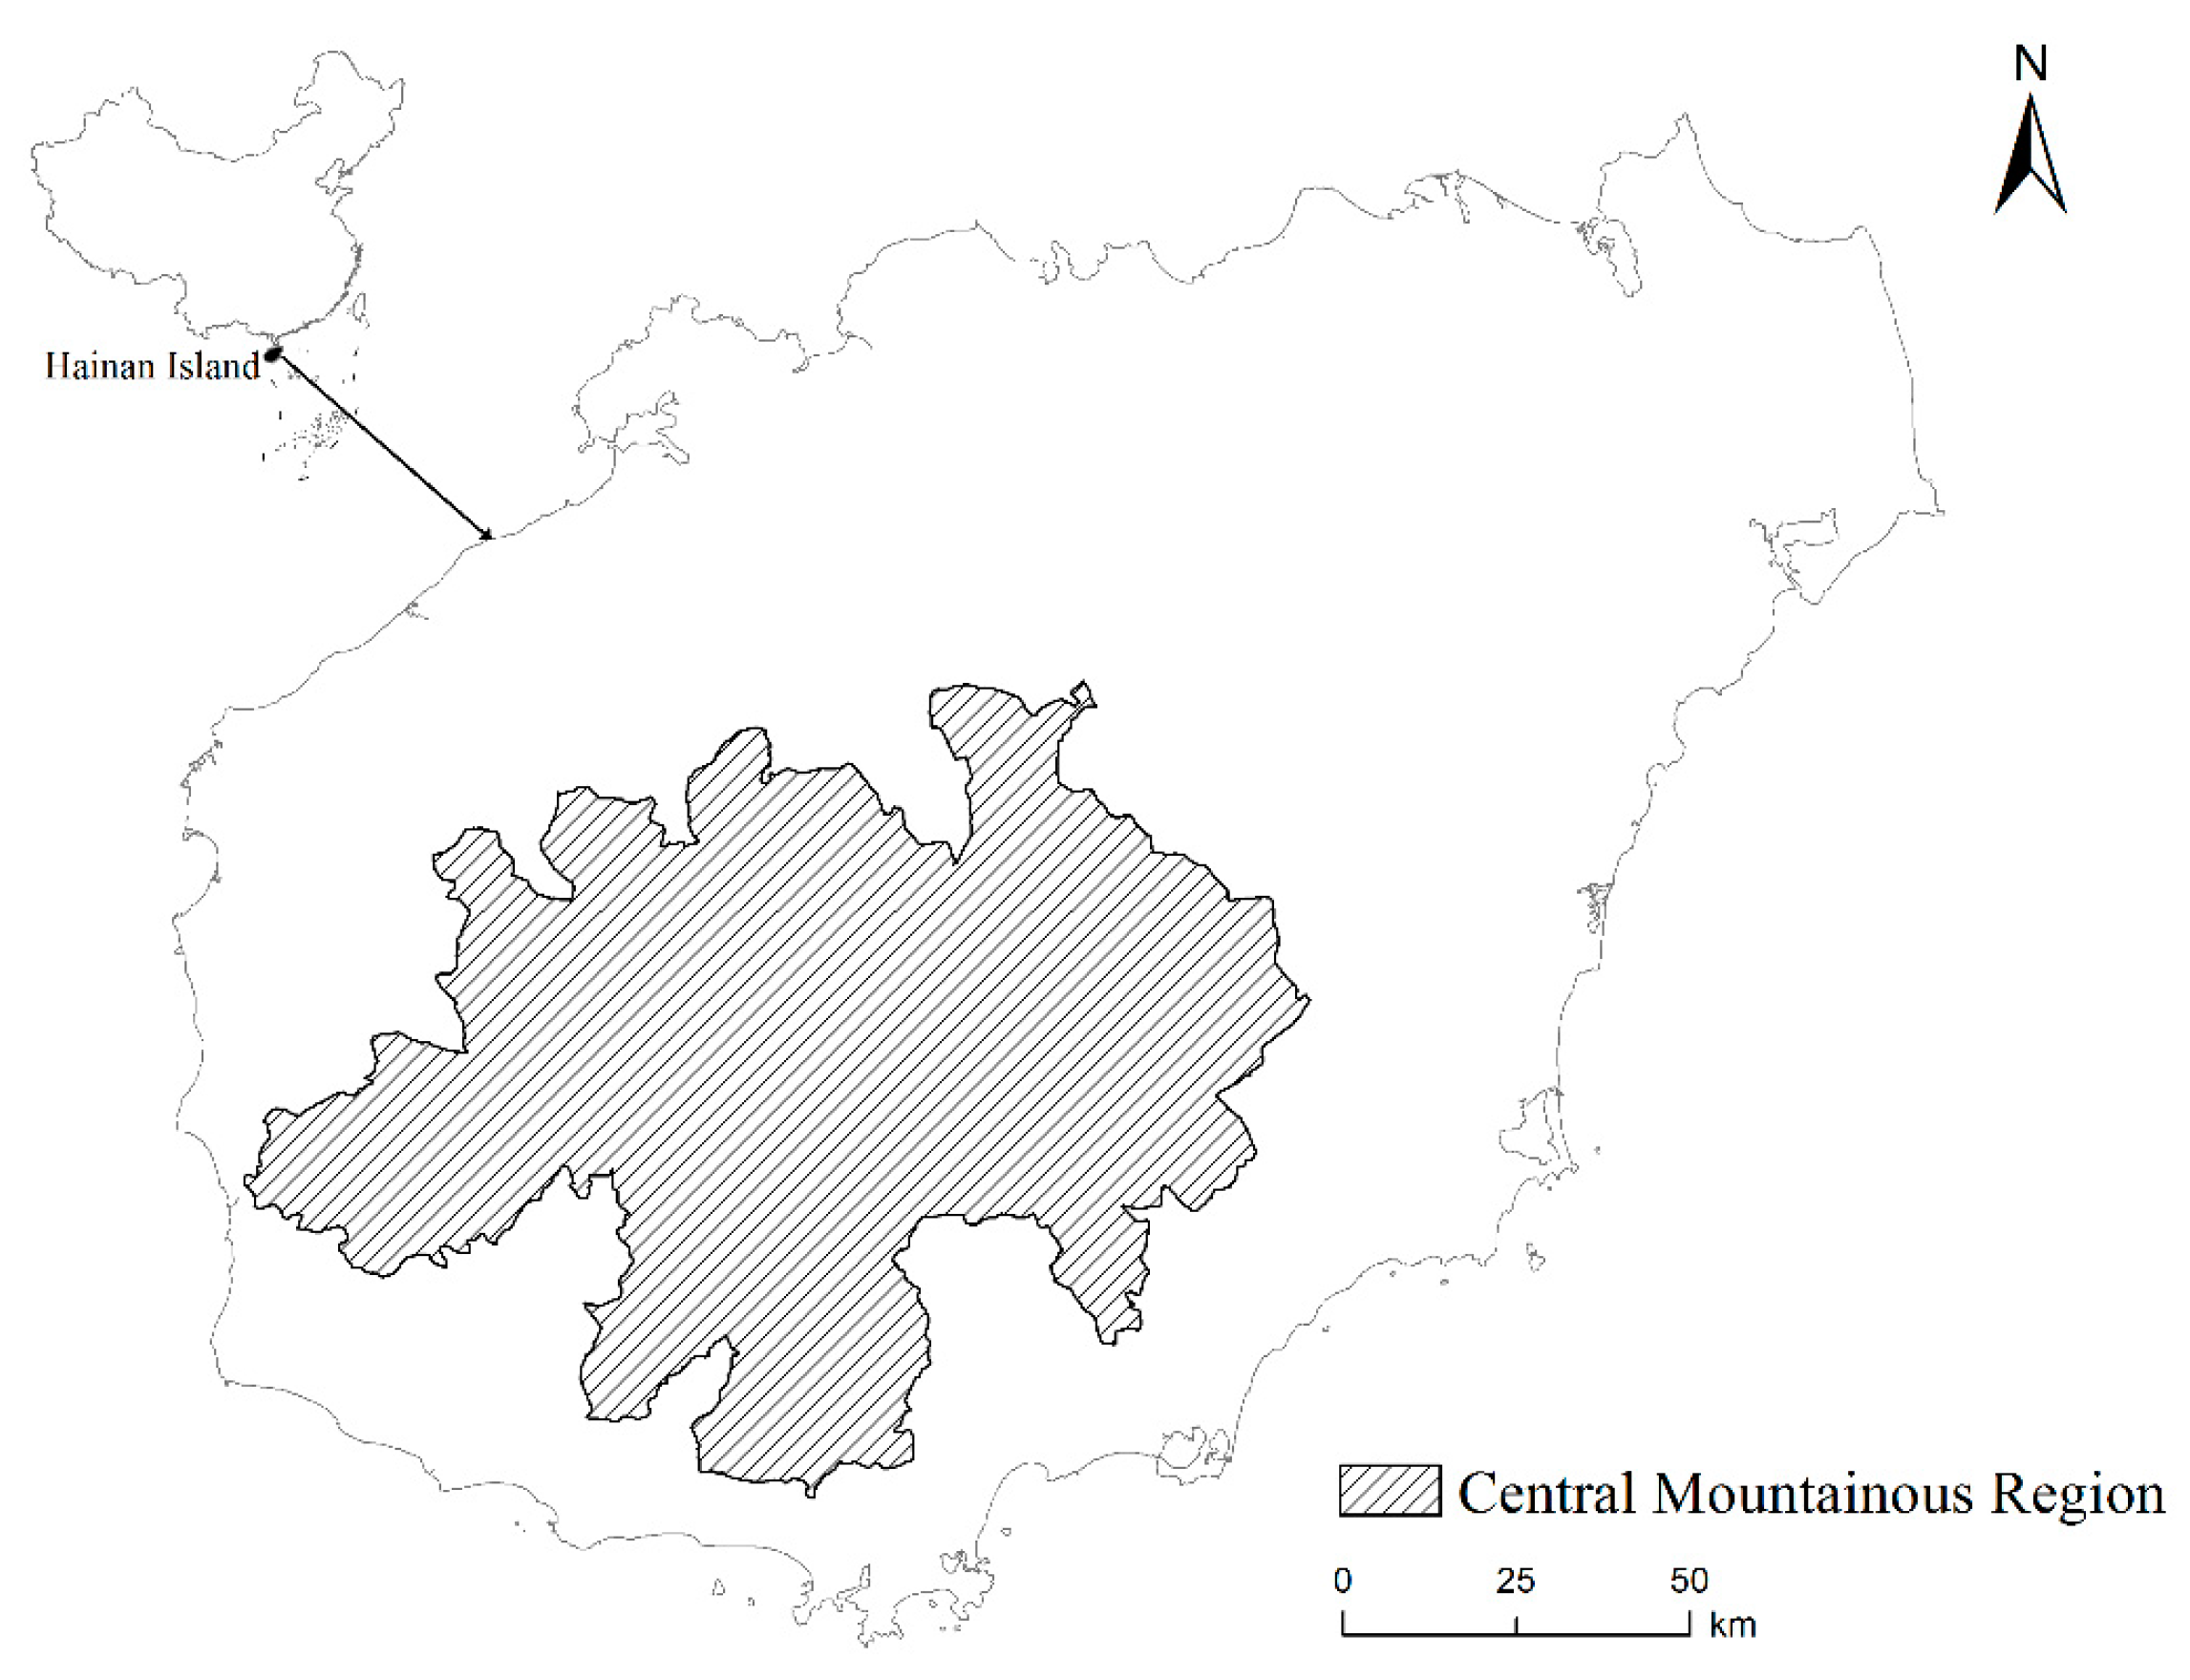
3.1. Study Area

The study area is the central region of Hainan Island (18°10′–20°10′ N, 108°37′–110°03′ E), which is predominantly mountainous (Figure 2). The area covers 9200 km2 and accounts for 27.1% of the land area of Hainan Island, including 41 towns. It is in the Indo-Burma biodiversity hotspot [38,39] and plays a critical role in safeguarding ecological security [40,41], especially in biodiversity conservation, water provision and soil conservation. To date, nine nature reserves have been established in the region. In total, 90% of the low-income people on Hainan live in in the central mountainous region [42].
As in several other tropical areas in China, plantation cultivation is one of the main livelihood activities for local households [17]. In the central mountainous region of Hainan Island, plantations are mainly monocultural tree plantations [10]. The most common trees cultivated are rubber (Hevea braziliensis) and betel nut palm (Areca cathecuI) [42]. There is also some intercropping of rubber plantations with economic crops (such as Chinese medicine Alpinia oxyphylla) [10]. The rapid urbanization and development of ecotourism mean that local off-farm and non-farm activities provide emerging opportunities for rural communities [43]. Subsistence agriculture is predominant in the region and only a small proportion of agricultural products and livestock are traded on the market.
The study area has suffered from dramatic destruction of natural forests over the last decade [44,45]. However, long-term poverty is the main socioeconomic issue in the area, mainly because of limited land resources [46]. Environmental issues and poverty reduction are therefore major concerns for the government, and alternative strategies are urgently sought to reconcile the conflicts. To coordinate the relationship between ecological conservation and economic development, some payments for ecosystem services programs have been provided in the study region, to align individual economic incentives with protection and restoration of natural capital [47]. These include the Sloping Land Conversion Program. Under this program, the central government provides payments to local farmers to convert sloping farmland to forest, to restore important regulating services (such as soil retention) and improve rural household income [47]. However, its long-term effects on household livelihood remain controversial because of the limited compensation available [47].

3.2. Data Collection

3.2.1. Sample Selection

Households were sampled in the central mountainous region of Hainan Island in 2014. Several hierarchical administrative divisions were involved, including counties, townships and villages. Each administrative level was considered to have the homogenous characteristic, and we used multistage sampling to minimize the unobserved factors within each level and maintain the homogeneity between levels [48,49,50]. In the first stage, we chose the seven counties fully or partly located in the central mountainous region. In the second stage, we used the census list of townships within each county, combined with the number of townships in each county within the central mountainous region. We randomly chose at least two townships that were fully or partly in the mountainous region. In the third stage, we used the same logic to randomly choose at least two villages within each chosen township. Finally, we used the lists of households from local authorities and randomly chose a survey sample of more than 20% of households in each village [51,52], giving a total of 1094 households.

3.2.2. Household Survey

We carried out in-depth interviews with household members from June to August 2014, using semi-structured questionnaires. The head of the household (the householder) or a family member over 18 years old was asked to complete a questionnaire. The questionnaire mainly used content from Li et al. [49], and focused on household-level quantitative data, including (i) demographic characteristics (such as family size, gender, age, education level and occupation) and basic living condition (such as type of housing and access to transport); (ii) forms of capital available to the household and (iii) main income-generating activities (such as agricultural and forestry production, rural–urban cyclic migration and local off-farm enterprise) and corresponding net income. For all income variables, the reference period in the questionnaire was one year (that is, the past 12 months); (iv) main expenses on agriculture (such as seeds, chemical fertilizer and pesticides) and energy consumption.
Before the field survey, we organized training for the investigators from Hainan University, so that they could fully understand the purpose and content of the household livelihood survey. We also discussed questions that might arise during the survey period. Four subgroups, each with six to eight investigators, each conducted field interviews along different routes. We used Mandarin during the interview. In rare cases, where older householders could not speak fluent Mandarin, other villagers acted as interpreters. During the fieldwork, 1094 questionnaires were collected. After excluding any with missing or extreme values, we had 877 completed and valid questionnaires for analysis.

3.3. Data Analysis

Quantitative data from the interview results were processed and analyzed using Stata 13. The livelihood strategies were classified by income shares, then the household-owned capitals of different livelihood strategies were compared. The main factors influencing net income derived from plantation cultivation were identified using multiple regression analysis. An estimated model was used to test the effect of land reallocation on poverty alleviation, based on family size. Poverty has multiple dimensions (such as income, housing, health condition, provision of public goods and education) [53,54], but this study only focused on income poverty, which is closely related to plantations and other dimensions of poverty. Finally, the livelihood outcomes of different livelihood strategies were compared.

3.3.1. Income Composition

Household incomes were stated as annual net income derived from the gross income minus all input costs including labor and other materials [55]. The main income sources were:
  • Plantation income: earnings from forestry land and intercropping within plantations, such as Alpinia oxyphylla.
  • Crop income: both subsistence and commercial crops cultivated in cropland. Rice, corn, potato, bean and peanut were the main subsistence crops and the main commercial crops were wax gourd, long bean, cowpea, luffa and watermelon [56].
  • Livestock income: earnings from sale of small ruminants, such as pigs, cows and poultry.
  • Local off-farm income: earnings from local self-employment or short-term employment. This did not include income from the household’s own agriculture or forestry production and processing.
  • Remittances: earnings transferred to the original home by household members with a permanent or temporary job out of the town.
  • Subsidy: financial support from government, such as agricultural subsidies or poverty subsidies.
  • Payment for ecosystem services (PES): ecological compensation to households involved in protection and restoration of natural capital.
The poverty line in our study was set using the national standard of 2800 CNY (about 457 US$) per person per year in 2014 [57], to fit the year of our survey.

3.3.2. Classification of Livelihood Strategies

We used principal component analysis to classify livelihood strategies by household income shares [58,59]. Income shares from seven main income sources were used for factor analysis. Factors with an eigenvalue greater than 1 were retained, giving five factors that explained 63% of the variance. Second, we put the factors from the principal component analysis into a hierarchical cluster analysis (k-means cluster). We used the Calinski–Harabasz criterion and the Duda–Hart index to determine the most appropriate number of livelihood clusters [52]. We used one-way ANOVA, the Kruskal–Wallis test and chi-squared test to examine the significance of income differences among clusters.

3.3.3. Relationships between Plantation Income and Forms of Capital

Tree plantations were the main form of natural capital for local rural households, so we tried to identify the strategies that might raise plantation returns. We used linear ordinary least squares (OLS) regression to identify the main factors that could influence plantation income. The independent variables for the regression model were based on the five capitals and geographic location in the Sustainable Livelihood Framework [47,55]. Natural capital was represented by the area of plantation land and cropland and we included dummy variables for whether the household diversified its plantation species and adopted intercropping within the plantation. We considered that land size and management options might be suggestive of productivity and wealth in rural areas [52,58,60]. Ecological policies could affect household behavior, and this was represented by ecological compensation funds [59]. Human capital was represented by household size, average age and average education level of those available to work within the household [61]. Geographical location was also critical in shaping household income profile because it represents the opportunities for economic trade and environmental status [58]. We used the distance to the road and town and altitude, to represent location.
The definition of each indicator is listed in the Table A1, and the regression equation was:
yi = β0 + β1∙x1i + β2∙x2i + β3∙x3i + β4∙x4i + β5∙x5i + β6∙x6i + β7∙x7i + β8∙x8i + β9∙x9i + β10∙x10i + β11∙x11i + εi,
where, yi is the log of (plantation income + 1) of household i, β shows vectors of parameters to be estimated, x1i is plantation area of household i, x2i is a diversified plantation system dummy (1 if the household uses a diversified plantation system), x3i is an intercrop system dummy (1 if the household uses an intercrop plantation system), x4i is cropland area of household i, x5i is PES funds of household i, x6i is family size of household i, x7i is average age and x8i average education level of the household labor in household i, x9i is distance to road for household i, x10i is distance to town from the village in which household i is located and x11i is the altitude of the village in which household i is located.
The variance inflation factor (VIF) test was used to detect potential multicollinearity between variables. If VIF exceeded 4, we considered that further investigations were needed.

3.3.4. Relationships between Household Plantation Area and Poverty

We found that there was considerable variation in plantation area per household, because of the implementation of the Forestry Production Responsibility System in 1981 [62]. This allocated forest areas to households by family size [63] and then kept forestry land tenure stable for 30–70 years [64], even though the population per household has dramatically changed since 1981. To identify the relationships between plantation area and household income, households that derived the majority of their income from plantations (the Plantation group) were selected for further investigation. Income quintiles were determined within each town by ranking households by total income and then dividing them into five groups from the lowest income (Quintile 1) to the highest (Quintile 5). One-way ANOVA was used to examine the significance of family size, plantation area per household, plantation area per capita, plantation income per capita and total income per capita among the clusters.
To further examine the potential effects of plantation land allocation on household income or poverty alleviation, we created a transition matrix to show the changes in the percentage of households living above or below the poverty line. To do so, we summed the plantation area and family size for all households (N = 552) in the Plantation group. We then obtained the average land area per capita by dividing the total plantation area by the total number of people in households in this group. Finally, we estimated the new plantation income of each household by multiplying the average land area by the average net return of the unit area of the plantations. This enabled us to identify the potential impact of the land allocation system on household income and poverty alleviation.

3.3.5. Main Livelihood Outcomes of Different Livelihood Strategies

We used income level and potential environmental impact as livelihood outcomes, because these are extremely important in the study area [10]. For income level, we used total income per capita for each household. Potential environmental impact was assessed using two measures, land investment (that is, cost of fertilizer and pesticide use on plantations) and energy consumption, including firewood, liquefied petroleum gas (LPG) and electricity. We used one-way ANOVA and the Kruskal–Wallis test to examine the significance of differences between clusters.

4. Results

4.1. Classification of Rural Household Livelihood Strategies

In the central mountainous region of Hainan Island, 55% of the study respondents lived below the poverty line (about 457 US$ per person per year). Plantation cultivation was the main income source for rural households, accounting for 46% of total income, followed by crops (15%) and livestock (14%). Household livelihood strategies were therefore further classified into four groups: (i) Plantation, (ii) Livestock/plantation, (iii) PES/outmigration and (iv) Local off-farm (Table 1).
Overall, 65% of total income for plantation households (63% of all households) came from plantation cultivation. These households had approximately an average income compared to all households. The Livestock/plantation group (11% of all households) had a slightly higher total income than the Plantation group, but their income came from more sources, including livestock, plantation and crops. Households in the PES/outmigration group (6% of all households) mainly lived on remittances from out-migrants and payment from ecological programs. These households had the lowest total income and the highest ratio of households below the poverty line. The fourth household group, the Local off-farm group, largely depended on local off-farm activities. These households had the highest income on average but significantly lower diversity in income sources and the second highest ratio of households below the poverty line, indicating that the high return of off-farm activities only benefits a very small proportion of the group (Table 1).

4.2. Descriptive Statistics of Livelihood Capital by Rural Household Livelihood Strategies

Households in the Plantation group owned the largest area of plantation and had the smallest family size. They also had more financial capital from saving and PES funds and lived further away from towns and at higher altitudes. Households in the Livestock/plantation group showed many similarities with the Plantation group in terms of land area and location, but they had the lowest income from ecological funds and the most diverse income sources and plantation systems. The PES/outmigration group had the smallest area of land and household labor, weak social bonds and poorer access to roads. However, they had the highest PES. Households in the Local off-farm group had the smallest plantation area, but they had larger families and more social capital. Unlike the plantation-related groups, households with better accessibility to towns had the lowest diversity of income sources and plantation systems because they tended to specialize their income-generating activities (Table 2).

4.3. Relationships between Plantation Income and Forms of Capital

Plantation land area and plantation management options (that is, a range of different trees and intercropping) were significantly related to higher plantation income for all the study households. Land area had no significant relationship with plantation income for the livestock/plantation group and the local off-farm group, but growing a range of tree species was significantly associated with plantation income, indicating the potential to obtain higher income by adding more value to plots (Table 3).
The PES program had significantly positive effects on plantation income for the whole sample and the Plantation group. Family size was positively related to plantation income for the Local off-farm group. The average age and education level of labor had no significant impact on the plantation income in any group. However, in the total sample, average education level of household labor was significantly related to plantation income. Geographic location also showed a positive relationship with plantation income (Table 3).

4.4. Impacts of Plantation Land Reallocation on Poverty Alleviation

There were no significant differences in family size across different income groups. However, the best-off quintile owned significantly more land than the poorest quintile (Table 4). The original land distribution was allocated to households in an egalitarian way based on household numbers [55], but changes in family size over time have led to the current unequal land distribution per person. There was no significant correlation between household plantation area and family size in this study (Pearson’s correlation coefficient = −0.0415, p > 0.05).
To examine whether plantation land reallocation based on current family size could reduce overall poverty, we estimated changes in plantation income after land reallocation based on current family size for households in the Plantation group. We found that if the plantation land was reallocated based on current family size, the proportion of households below the poverty line decreased from 48.7% to 14.7%. Only 3.3% of households would be worse off. The proportion of households above the poverty line would increase from 51.3% to 85.3% (Table 5).

4.5. Main Livelihood Consequences by Livelihood Strategies

The Livestock/plantation group and the Local off-farm group generated the highest income per capita on average and the PES/outmigration group had the lowest income per capita.
Plantation-based groups had higher costs of fertilizer use. However, the Livestock/plantation group spent less on pesticides than the Plantation and PES/outmigration groups. The PES/outmigration group owned less plantation land than the Plantation group, but spent a similar amount on chemicals.
Local off-farm households consumed significantly higher amounts of modern energy and the plantation-related groups used significantly more wood for fuel. The Plantation group had the highest return and highest investment in plantation cultivation. The Livestock/plantation group showed limited investment in chemical inputs but had a higher economic return. The Local off-farm group had low levels of input but medium return and the PES/outmigration group invested most, but gained little (Table 6).

5. Discussion

5.1. Rural Household Livelihoods and Plantations

We found that plantation income was critical for rural livelihoods in the Hainan mountainous area. Plantations contributed more than 46% of total income and substantially supported the largest plantation-based groups (that is, the Plantation and Livestock/plantation groups; Table 1). They also positively interacted with other income-generating activities to generate a livelihood from more diverse combinations (such as Livestock/plantation and PES/outmigration). For example, the Livestock/plantation group had a similar level of assets to the Plantation group, but generated marginally higher total income and had a more evenly distributed income profile. The wide opportunities from plantation cultivation coupled with other livelihood activities could be a compelling reason to develop a multi-objective livelihood portfolio [65,66]. This is in line with the goal of sustainable livelihood [29]. The two plantation-related groups were associated with an average level of income per capita but the lowest ratio below the poverty line, showing promising potential for poverty alleviation and reduction of income inequality. This result is consistent with the findings of Abtew, Pretzsch, Secco and Mohamod [16] who showed that gum and resin income was pro-poor and contributed to narrowing the income disparities in rural communities, especially in areas where plantation markets were not well developed and the profit from plantation production was much lower. The PES/outmigration group was the worst-off. However, enhancing social bonds, for example, by providing more social support and external connections with employment opportunities, could help them out of poverty. Increased income from plantation could also create more opportunities to access institutions, services, community cohesion, social connections and exchange of knowledge and improve the overall social capital. However, possible shocks (such as tree diseases and insect pests from plantation expansion, climate variability and market price of agricultural products; Figure 1) may accelerate poverty in the study area, especially with natural forest destruction. Poverty alleviation will require careful consideration of coping with the risks from these shocks.
In areas with limited land resources or with a close relationship between people and land, maximizing the economic return per unit area is essential to increase income. In Hainan, we identified two compelling alternatives (that is, more diverse plantation species and intercropping) to increase plantation land value without expanding current land area (Table 3). Planting areca or other tropical fruit trees, like mango or litchi, provided a significantly better economic return than rubber monocultures. A similar finding was reported in Indonesia, where mixed plantations including sengon (Paraserianthes falcataria) were found to be more profitable and to provide more routine income to communities than pure sengon [67]. Another attractive approach is planting shading species within a plantation to develop an intercropping system. This creates a diverse and lush understory [68] and has been called “alley cropping” [69]. We found a significant positive relationship between intercropping and plantation income (Table 3). There is a growing interest in comparing the performance of mixed and monocultures, both economically and operationally [7,70]. Our results provide empirical evidence that agroforestry might be a promising opportunity to increase income in mountainous areas.

5.2. Plantation Land Allocation Policy and Rural Household Livelihood

Cropland is the dominant form of natural capital for those living in rural areas [71]. We found that plantation land area was significantly related to livelihood strategy and plantation income. The land management costs (that is, fertilizer, labor and machine rental) may be higher for smaller or scattered areas of land than for large tracts of land [72]. This means farmers can become trapped in poverty. A longitudinal analysis of land-holding among forest peasant households in an Amazonian village described a new mechanism of “land-size” poverty traps [3]. The study found that the initial condition of land-holding induced low agricultural productivity, which limited future prospects for peasant farmers [3]. These findings show that having small areas of land is an impediment to the alleviation of poverty for rural households. Even worse, allied with a shortage of labor and accessibility to towns, households in the PES/outmigration group invested more in chemical inputs (that is, fertilizer and pesticides) to maintain plantation production. This finding is consistent with a recent report in China that a 1% increase in farm size was associated with a 0.3% and 0.5% decrease in fertilizer and pesticide use per hectare (p < 0.001) [72]. Insufficient land can therefore trap poor households into a vicious cycle with meager net return and many off-site consequences. However, there may be effects of endogeneity between plantation area and income, for example, high income households might invest more, or rent more forestry land, to enlarge production [73]. More research is therefore needed in the future to clarify causality in this relationship.
Household plantation area was not significantly related to family size (Pearson’s correlation coefficient = −0.0415, p > 0.05), indicating that the land allocation did not match the household size in the study sample. The highest income quintile owned significantly more land per capita than the poorest quintile (p < 0.05), which was also found by Hogarth, Belcher, Campbell and Stacey [55] in some rural villages in southern China. We did not have panel data to determine the causality of unequal land allocation, but one possible reason is forestry policy. Land was allocated to households under the Forestry Production Responsibility System in 1981 [62], but there have been no further reallocations of land to account for household demographic changes and maintain stable per capita landholdings. The policy aimed to guarantee land ownership, so that farmers had more incentive to invest in land improvements and secure loans [63]. However, it may have aggravated poverty for those living in remote mountain areas with a growing population but confined land resources. We estimated that if the plantation land was reallocated by family size for the Plantation group, 206 households would rise above the poverty line, at the expense of 18 households falling into poverty (Table 5). Our simple estimation shows the potential improvements in overall welfare that could result from equalizing land endowment per capita among households, especially for those who are still strongly dependent on land. Our estimation was simple and had a number of limitations, but still contributes to the literature on land consolidation as a way to alleviate poverty [12]. Land allocation/tenure is complex and very different in different places and contexts (such as collective or private ownership). Our results are probably more applicable in the context of collective ownership of land. For example, plantation land reallocation could be implemented at the production team or village scales in China, which are the usual adjustment units for land resources. Another way to consolidate land would cooperate with schemes to encourage diverse forms of land consolidation or intensification, which may increase land use efficiency and environmental protection [74].

5.3. Livelihood Outcomes of Plantation-Based Households

Plantation-based households are characterized by low income levels and potentially higher negative environmental outcomes, because of their high investment in chemical inputs, especially for the PES/outmigration group (Table 6). This finding is consistent with a survey study in North China, which found that households participating in an ecological conservation program had significant higher expenditure on agricultural fertilizers [50]. These results, however, differed from another study, which found that middle-income classes were responsible for negative environmental impacts [58]. In contrast, our study showed that the worst-off group (that is, ‘PES/outmigration’), which had inadequate access to land, labor, social connections and roads, tended to apply more chemicals to offset the shortage of land resource, labor and social capital. Lu and Xie [75] also found that household labor had a significant negative relationship with excessive nitrogen. The worst-off group is therefore likely to pose a higher risk to environmental quality (Table 2 and Table 6). Faße and Grote [51] found that the poorest households generated higher incomes if they extracted firewood unsustainably. Poverty alleviation initiatives targeted at the poorest households with livelihood strategies limited by inferior assets and dependency on transfer income might therefore have a positive effect on environmental protection. Increasing natural capital (such as plantations) through plantation land allocation or providing more regulating services for the external stakeholders may increase household income and decrease the application of chemicals.
One further implication of our study was that plantation-based households were less likely to use modern fuels or energy and instead used more firewood, often from surrounding natural woodland. Wood is the most important energy source for rural households in China [76]. Encroachment on forests for firewood is not as obvious as clear-cutting for timber, but it has a range of negative consequences including the loss of biodiversity and deterioration of the ecosystem [77]. The introduction of modern energy sources for households with a high dependence on plantations might therefore be an alternative strategy to improve conservation effectiveness. The measures used to represent environmental impact in this study are simple and do not reflect the complexity of the true impact of human behavior on the environment. The actual negative effects could include non-point source pollution from agricultural production and animal rearing, over-exploitation of natural resources, soil degradation and erosion, biodiversity loss because of hunting and human disturbances and micro-climate [18,31,78,79]. Long-term studies, off-site surveys and experimental study designs may all be useful in exploring this issue further.

6. Conclusions

Plantations strongly supported rural household livelihoods in the central mountainous region of Hainan Island, where a strict conservation policy has been initiated. However, poverty alleviation is still a great challenge in the area. Potential ways to increase income, alleviate poverty and reduce environmental pollution include land allocation policies, making land allocation more equitable, diversifying the range of tree species in plantations and intercropping. Our results therefore provide practical approaches to alleviate poverty and improve rural household livelihoods in other tropical mountainous regions.

Author Contributions

H.Z., C.Z. and C.L. planned and designed the survey. R.L. and H.Z. developed the original concept for the paper. R.L. analyzed the data and wrote the drafts of the manuscripts, and H.Z. edited all subsequent drafts of the manuscripts. B.K. and L.H.S. helped shape the frame of the drafts and edit the original draft. S.P. and Y.N., Z.O. reviewed and edited the drafts. All authors have read and agreed to the published version of the manuscript.

Funding

This work was supported by the National Natural Science Foundation of China (41925005; 41871217) and the National Key Research and Development Program of China (No. 2016YFC0503401).

Acknowledgments

Great thanks to the teachers and students at the University of Hainan to help interviews. We acknowledge the financial supports from China Scholarship Council and constructive comments from the Natural Capital Project team and others at the Institute on the Environment and the Department of Applied Economics of the University of Minnesota.

Conflicts of Interest

The authors declare no conflict of interest.

Appendix A

Table A1. The definition of explanatory variables.
VariablesDefinition
Natural Capital
Plantation area (mu)Size of household’s own land for planted trees, including rubber, areca, and other fruit trees
Cropland area (mu)Size of household’s own land for agricultural crops
Diversified plantation system (0/1)If the household plant more than one species of trees = 1; otherwise = 0
Intercropped with commercial crops (0/1)If the household plant commercial crops under plantation trees = 1; otherwise = 0
Human Capital
Household sizeNumber of members in household
Household labor at homeNumber of members with age between 15 and 65 in household and working at home
Average age of household laborAverage age of members with age between 15 and 65 in household
Average education level of household laborAverage years of education for each member with age between 15 and 65 in household
Physical Capital
House value (104 Yuan)Market value of house estimated by the household head
Quantity of applianceNumber of household appliance owned by a household, including television, refrigerator, and wash machine
Quantity of transport toolsNumber of transport tools owned by a household, including motor, electric bicycle, tri-motor, tractor and car
Social Capital
Phone call costs (Yuan/year)Telephone bills per year in each household
Social relation (0/1)At least one of the family members is a cadre = 1; otherwise = 0
Expense on cash gifts (Yuan/year)Total cash gift per year in household
Financial Capital
Saving (0/1)If the household has saving = 1; otherwise = 0
Loan (Yuan)Amount of borrowing money from friends and relatives or bank
PES funds (Yuan/year) PES funds from ecological program, including Sloping Land Conservation Program, Ecological Public Welfare Forest, etc.
Geographical location
Distance to road (m)Distance from each household to nearest road
Distance to town (km)Distance from each village to its capital town
Altitude (m)Altitude of village based on DEM map
Others
Income diversity index Income   diversity   index =   i = 1 N P i l o g P i
Pi = proportion of total income contributed by income source i
N = number of income sources
Plantation area per household (mu)Plantation area owned by each household
Plantation area per capita (mu/capita)Plantation area divided by number of household’s members
Plantation income per capita (Yuan/capita)Plantation income divided by number of household’s members
Total income per capita (Yuan/capita)Total income divided by number of household’s members
Expense of fertilizer per household (Yuan/year)Annual expense of fertilizer in household
Expense of pesticide per household (Yuan/year)Annual expense of pesticide in household
Firewood consumption per household (kg/year)Annual firewood consumption in household
LPG consumption per household (Yuan/year)Annual expense of liquid petroleum gas (LPG) in household
Electricity consumption per household (Yuan/year)Annual expense of electricity in household

References

  1. FAO. Mountain Environments. Available online: http://www.fao.org/3/a-ar590e.pdf (accessed on 24 June 2019).
  2. Jalan, J.; Ravallion, M. Is transient poverty different? Evidence for rural China. J. Dev. Stud. 2000, 36, 82–99. [Google Scholar] [CrossRef]
  3. Coomes, O.T.; Takasaki, Y.; Rhemtulla, J.M. Land-use poverty traps identified in shifting cultivation systems shape long-term tropical forest cover. Proc. Natl. Acad. Sci. USA 2011, 108, 13925–13930. [Google Scholar] [CrossRef] [PubMed] [Green Version]
  4. Wunder, S.; Angelsen, A.; Belcher, B. Forests, Livelihoods, and Conservation: Broadening the Empirical Base. World Dev. 2014, 64, S1–S11. [Google Scholar] [CrossRef] [Green Version]
  5. Torres-Rojo, J.M.; Moreno-Sánchez, R.; Amador-Callejas, J. Effect of capacity building in alleviating poverty and improving forest conservation in the communal forests of Mexico. World Dev. 2019, 121, 108–122. [Google Scholar] [CrossRef]
  6. D’Amato, D.; Rekola, M.; Li, N.; Toppinen, A. Monetary valuation of forest ecosystem services in China: A literature review and identification of future research needs. Ecol. Econ. 2016, 121, 75–84. [Google Scholar] [CrossRef] [Green Version]
  7. Paquette, A.; Messier, C. The role of plantations in managing the world’s forests in the Anthropocene. Front. Ecol. Environ. 2010, 8, 27–34. [Google Scholar] [CrossRef] [Green Version]
  8. Schoneveld, G.C.; German, L.A.; Nutakor, E. Land-based Investments for Rural Development? A Grounded Analysis of the Local Impacts of Biofuel Feedstock Plantations in Ghana. Ecol. Soc. 2011, 16. [Google Scholar] [CrossRef] [Green Version]
  9. Ahrends, A.; Hollingsworth, P.M.; Ziegler, A.D.; Fox, J.M.; Chen, H.; Su, Y.; Xu, J. Current trends of rubber plantation expansion may threaten biodiversity and livelihoods. Glob. Environ. Chang. 2015, 34, 48–58. [Google Scholar] [CrossRef]
  10. Zheng, H.; Wang, L.; Peng, W.; Zhang, C.; Li, C.; Robinson, B.E.; Wu, X.; Kong, L.; Li, R.; Xiao, Y.; et al. Realizing the values of natural capital for inclusive, sustainable development: Informing China’s new ecological development strategy. Proc. Natl. Acad. Sci. USA 2019, 116, 8623–8628. [Google Scholar] [CrossRef] [Green Version]
  11. Bishaw, B. Agroforestry an Integrated Land-use system to meet agricultural production and environmental protection in the United States. In Proceedings of the International Symposium on Agroforestry, Xitou Nature Education Area, the Experimental Forest, Taipei, Taiwan, 16 July 2013; pp. 15–19. [Google Scholar]
  12. Zhou, Y.; Guo, L.; Liu, Y. Land consolidation boosting poverty alleviation in China: Theory and practice. Land Use Policy 2019, 82, 339–348. [Google Scholar] [CrossRef]
  13. Phimmavong, S.; Keenan, R.J. Forest plantation development, poverty, and inequality in Laos: A dynamic CGE microsimulation analysis. For. Policy Econ. 2020, 111, 102055. [Google Scholar] [CrossRef]
  14. Obidzinski, K.; Andriani, R.; Komarudin, H.; Andrianto, A. Environmental and Social Impacts of Oil Palm Plantations and their Implications for Biofuel Production in Indonesia. Ecol. Soc. 2012, 17, 25. [Google Scholar] [CrossRef]
  15. UN. Transforming Our World: The 2030 Agenda for Sustainable Development; United Nations: New York, NY, USA, 2015. [Google Scholar]
  16. Abtew, A.A.; Pretzsch, J.; Secco, L.; Mohamod, T.E. Contribution of small-scale gum and resin commercialization to local livelihood and rural economic development in the drylands of eastern Africa. Forests 2014, 5, 952–977. [Google Scholar] [CrossRef] [Green Version]
  17. Hogarth, N.; Belcher, B. The contribution of bamboo to household income and rural livelihoods in a poor and mountainous county in Guangxi, China. Int. For. Rev. 2013, 15, 71–81. [Google Scholar] [CrossRef]
  18. Malkamäki, A.; D’Amato, D.; Hogarth, N.J.; Kanninen, M.; Pirard, R.; Toppinen, A.; Zhou, W. A systematic review of the socio-economic impacts of large-scale tree plantations, worldwide. Glob. Environ. Chang. 2018, 53, 90–103. [Google Scholar] [CrossRef]
  19. Sunderlin, W.D.; Angelsen, A.; Belcher, B.; Burgers, P.; Nasi, R.; Santoso, L.; Wunder, S. Livelihoods, forests, and conservation in developing countries: An Overview. World Dev. 2005, 33, 1383–1402. [Google Scholar] [CrossRef]
  20. Zenteno, M.; Zuidema, P.A.; de Jong, W.; Boot, R.G.A. Livelihood strategies and forest dependence: New insights from Bolivian forest communities. For. Policy Econ. 2013, 26, 12–21. [Google Scholar] [CrossRef]
  21. Aye, W.N.; Wen, Y.; Marin, K.; Thapa, S.; Tun, A.W. Contribution of Mangrove Forest to the Livelihood of Local Communities in Ayeyarwaddy Region, Myanmar. Forests 2019, 10, 414. [Google Scholar] [CrossRef] [Green Version]
  22. Bodonirina, N.; Reibelt, L.M.; Stoudmann, N.; Chamagne, J.; Jones, T.G.; Ravaka, A.; Ranjaharivelo, H.V.F.; Ravonimanantsoa, T.; Moser, G.; De Grave, A.; et al. Approaching Local Perceptions of Forest Governance and Livelihood Challenges with Companion Modeling from a Case Study around Zahamena National Park, Madagascar. Forests 2018, 9, 624. [Google Scholar] [CrossRef] [Green Version]
  23. Peng, S.-S.; Piao, S.; Zeng, Z.; Ciais, P.; Zhou, L.; Li, L.Z.X.; Myneni, R.B.; Yin, Y.; Zeng, H. Afforestation in China cools local land surface temperature. Proc. Natl. Acad. Sci. USA 2014, 111, 2915–2919. [Google Scholar] [CrossRef] [Green Version]
  24. Bonn Challenge. Available online: http://www.bonnchallenge.org/ (accessed on 15 August 2019).
  25. FAO. Planted Forests in Sustainable Forest Management. A Statement of Principles. Available online: http://www.fao.org/sustainable-forest-management/toolbox/tools/tool-detail/en/c/218088/ (accessed on 15 August 2019).
  26. Hauser, N.; Martin, K.; Germer, J.; He, P.; Blagodatskiy, S.; Liu, H.; Kraus, M.; Rajaona, A.; Shi, M.; Langenberger, G. Environmental and socio-economic impacts of rubber cultivation in the Mekong region: Challenges for sustainable land use. CAB Rev. 2015, 10, 1–11. [Google Scholar] [CrossRef]
  27. Feng, J. Poverty Amid the Plenty-Study on the Poverty of the Areas that Rich in Forest Resource. Ph.D. Thesis, Beijing Forestry University, Beijing, China, 2007. (In Chinese). [Google Scholar]
  28. Barrett, C.B.; Travis, A.J.; Dasgupta, P. On biodiversity conservation and poverty traps. Proc. Natl. Acad. Sci. USA 2011, 108, 13907–13912. [Google Scholar] [CrossRef] [PubMed] [Green Version]
  29. Ellis, F. Rural Livelihoods and Diversity in Developing Countries; Oxford University Press: Oxford, UK, 2000. [Google Scholar]
  30. Chambers, R.; Conway, G. Sustainable Rural Livelihoods: Practical Concepts for the 21st Century; Institute of Development Studies: Falmer, UK, 1992. [Google Scholar]
  31. Baral, H.; Guariguata, M.R.; Keenan, R.J. A proposed framework for assessing ecosystem goods and services from planted forests. Ecosyst. Serv. 2016, 22, 260–268. [Google Scholar] [CrossRef] [Green Version]
  32. Ekins, P.; Simon, S.; Deutsch, L.; Folke, C.; De Groot, R. A framework for the practical application of the concepts of critical natural capital and strong sustainability. Ecol. Econ. 2003, 44, 165–185. [Google Scholar] [CrossRef] [Green Version]
  33. Dominati, E.; Patterson, M.; Mackay, A. A framework for classifying and quantifying the natural capital and ecosystem services of soils. Ecol. Econ. 2010, 69, 1858–1868. [Google Scholar] [CrossRef]
  34. Liang, Y.; Li, S.; Feldman, M.W.; Daily, G.C. Does household composition matter? The impact of the Grain for Green Program on rural livelihoods in China. Ecol. Econ. 2012, 75, 152–160. [Google Scholar] [CrossRef]
  35. D’Amato, D.; Rekola, M.; Wan, M.; Cai, D.; Toppinen, A. Effects of industrial plantations on ecosystem services and livelihoods: Perspectives of rural communities in China. Land Use Policy 2017, 63, 266–278. [Google Scholar] [CrossRef]
  36. Angelsen, A.; Jagger, P.; Babigumira, R.; Belcher, B.; Hogarth, N.J.; Bauch, S.; Börner, J.; Smith-Hall, C.; Wunder, S. Environmental Income and Rural Livelihoods: A Global-Comparative Analysis. World Dev. 2014, 64 (Suppl. 1), S12–S28. [Google Scholar] [CrossRef] [Green Version]
  37. Department of International Development (DFID). Sustainable Livelihoods Guidance Sheets; Department for International Development: London, UK, 1999. [Google Scholar]
  38. Myers, N.; Mittermeier, R.A.; Mittermeier, C.G.; Da Fonseca, G.A.; Kent, J. Biodiversity hotspots for conservation priorities. Nature 2000, 403, 853. [Google Scholar] [CrossRef]
  39. Brooks, T.M.; Mittermeier, R.A.; Mittermeier, C.G.; Da Fonseca, G.A.B.; Rylands, A.B.; Konstant, W.R.; Flick, P.; Pilgrim, J.; Oldfield, S.; Magin, G.; et al. Habitat loss and extinction in the hotspots of biodiversity. Conserv. Biol. 2002, 16, 909–923. [Google Scholar] [CrossRef] [Green Version]
  40. Ouyang, Z.; Zhao, T.; Zhao, J.; Xiao, H.; Wang, X. Ecological regulation services of Hainan Island ecosystem and their valuation. Acta Ecol. Sin. 2004, 15, 1395–1402, (In Chinese with English Abstract). [Google Scholar]
  41. Zhai, J.; Hou, P.; Cao, W.; Yang, M.; Cai, M.; Li, J. Ecosystem assessment and protection effectiveness of a tropical rainforest region in Hainan Island, China. J. Geogr. Sci 2018, 28, 415–428. [Google Scholar] [CrossRef] [Green Version]
  42. Li, X.; Miao, H.; Zheng, H.; Ouyang, Z.; Xiao, Y. Application of opportunity-cost method in determining ecological compensation standard: A case study in the central mountainous area of Hainan Island. Acta Ecol. Sin. 2009, 29, 4875–4883, (In Chinese with English Abstract). [Google Scholar]
  43. Gu, K.; Wall, G. Rapid urbanization in a transitional economy in China: The case of Hainan Island. Singap. J. Trop. Geogr. 2007, 28, 158–170. [Google Scholar] [CrossRef]
  44. Zhai, D.; Cannon, C.H.; Slik, J.W.F.; Zhang, C.; Dai, Z. Rubber and pulp plantations represent a double threat to Hainan’s natural tropical forests. J. Environ. Manag. 2012, 96, 64–73. [Google Scholar] [CrossRef]
  45. Zhai, D.; Cannon, C.H.; Dai, Z.; Zhang, C.; Xu, J. Deforestation and fragmentation of natural forests in the upper Changhua watershed, Hainan, China: Implications for biodiversity conservation. Environ. Monit. Assess. 2014, 187, 4137. [Google Scholar] [CrossRef]
  46. Li, F.; Chen, H.; Li, W. Socioeconomic Impact of Forest Eco-compensation Mechanism in Hainan Province of China. China Popul. Resour. Environ. 2007, 17, 113–118. [Google Scholar] [CrossRef]
  47. Li, J.; Feldman, M.W.; Li, S.; Daily, G.C. Rural household income and inequality under the Sloping Land Conversion Program in western China. Proc. Natl. Acad. Sci. USA 2011, 108, 7721–7726. [Google Scholar] [CrossRef] [Green Version]
  48. Stafford, J.D.; Reinecke, K.J.; Kaminski, R.M.; Gerard, P.D. Multi-stage sampling for large scale natural resources surveys: A case study of rice and waterfowl. J. Environ. Manag. 2006, 78, 353–361. [Google Scholar] [CrossRef]
  49. Li, C.; Li, S.; Feldman, M.W.; Li, J.; Zheng, H.; Daily, G.C. The impact on rural livelihoods and ecosystem services of a major relocation and settlement program: A case in Shaanxi, China. Ambio 2018, 47, 245–259. [Google Scholar] [CrossRef]
  50. Zheng, H.; Robinson, B.E.; Liang, Y.-C.; Polasky, S.; Ma, D.-C.; Wang, F.-C.; Ruckelshaus, M.; Ouyang, Z.-Y.; Daily, G.C. Benefits, costs, and livelihood implications of a regional payment for ecosystem service program. Proc. Natl. Acad. Sci. USA 2013, 110, 16681–16686. [Google Scholar] [CrossRef] [PubMed] [Green Version]
  51. Faße, A.; Grote, U. The economic relevance of sustainable agroforestry practices—An empirical analysis from Tanzania. Ecol. Econ. 2013, 94, 86–96. [Google Scholar] [CrossRef]
  52. Nguyen, T.T.; Do, T.L.; Bühler, D.; Hartje, R.; Grote, U. Rural livelihoods and environmental resource dependence in Cambodia. Ecol. Econ. 2015, 120, 282–295. [Google Scholar] [CrossRef]
  53. Alkire, S.; Foster, J. Counting and multidimensional poverty measurement. J. Public Econ. 2011, 95, 476–487. [Google Scholar] [CrossRef]
  54. Bourguignon, F.; Chakravarty, S.R. The measurement of multidimensional poverty. In Poverty, Social Exclusion and Stochastic Dominance; Springer: Berlin/Heidelberg, Germany, 2019; pp. 83–107. [Google Scholar]
  55. Hogarth, N.J.; Belcher, B.; Campbell, B.; Stacey, N. The role of forest-related income in household economies and rural livelihoods in the border-region of Southern China. World Dev. 2013, 43, 111–123. [Google Scholar] [CrossRef]
  56. Zhang, L.; Huo, Z.; Huang, D.; Jiang, Y.; Xiao, J. Winter chilling damage risk zoning for watermelon and vegetables in the Hainan Island. Chin. J. Eco-Agric. 2014, 22, 1240–1251, (In Chinese with English Abstract). [Google Scholar]
  57. Chen, C.; Pan, J. The effect of the health poverty alleviation project on financial risk protection for rural residents: Evidence from Chishui City, China. Int. J. Equity Health 2019, 18, 79. [Google Scholar] [CrossRef] [Green Version]
  58. Soltani, A.; Angelsen, A.; Eid, T.; Naieni, M.S.N.; Shamekhi, T. Poverty, sustainability, and household livelihood strategies in Zagros, Iran. Ecol. Econ. 2012, 79, 60–70. [Google Scholar] [CrossRef]
  59. Peng, W.; Zheng, H.; Robinson, B.; Li, C.; Wang, F. Household livelihood strategy choices, impact factors, and environmental consequences in Miyun reservoir watershed, China. Sustainability 2017, 9, 175. [Google Scholar] [CrossRef] [Green Version]
  60. Carney, D. Sustainable Rural Livelihoods: What Contribution Can We Make? Department for International Development: London, UK, 1998. [Google Scholar]
  61. Li, C.; Li, S.; Feldman, M.W.; Daily, G.C.; Li, J. Does out-Migration Reshape Rural Households’ Livelihood Capitals in the Source Communities? Recent Evidence from Western China. Asian Pac. Migr. J. 2012, 21, 1–30. [Google Scholar] [CrossRef]
  62. Han, L.; Xu, H. Review and study of collective forest tenure reform in China. For. Resour. Manag. 2009, 1, 140–145, (In Chinese with English Abstract). [Google Scholar]
  63. Lohmar, B.; Somwaru, A. Does China’s Land-Tenure System discourage structural adjustment. In China’s Food and Agriculture: Issues for the 21st Century; USDA: Washington, DC, USA, 2002; p. 38. [Google Scholar]
  64. Chen, J.; Innes, J.L. The implications of new forest tenure reforms and forestry property markets for sustainable forest management and forest certification in China. J. Environ. Manag. 2013, 129, 206–215. [Google Scholar] [CrossRef] [PubMed]
  65. Bradshaw, B.; Dolan, H.; Smit, B. Farm-Level Adaptation to Climatic Variability and Change: Crop Diversification in the Canadian Prairies. Clim. Chang. 2004, 67, 119–141. [Google Scholar] [CrossRef]
  66. Herrero, M.; Thornton, P.K.; Notenbaert, A.M.; Wood, S.; Msangi, S.; Freeman, H.A.; Bossio, D.; Dixon, J.; Peters, M.; van de Steeg, J.; et al. Smart Investments in Sustainable Food Production: Revisiting Mixed Crop-Livestock Systems. Science 2010, 327, 822–825. [Google Scholar] [CrossRef] [Green Version]
  67. Siregar, U.J.; Rachmi, A.; Massijaya, M.Y.; Ishibashi, N.; Ando, K. Economic analysis of sengon (Paraserianthes falcataria) community forest plantation, a fast growing species in East Java, Indonesia. For. Policy Econ. 2007, 9, 822–829. [Google Scholar] [CrossRef]
  68. Aubin, I.; Messier, C.; Bouchard, A. Can plantations develop understory biological and physical attributes of naturally regenerated forests? Biol. Conserv. 2008, 141, 2461–2476. [Google Scholar] [CrossRef] [Green Version]
  69. Wolz, K.J.; Lovell, S.T.; Branham, B.E.; Eddy, W.C.; Keeley, K.; Revord, R.S.; Wander, M.M.; Yang, W.H.; DeLucia, E.H. Frontiers in alley cropping: Transformative solutions for temperate agriculture. Glob. Chang. Biol. 2018, 24, 883–894. [Google Scholar] [CrossRef] [Green Version]
  70. Mayoral, C.; van Breugel, M.; Cerezo, A.; Hall, J.S. Survival and growth of five Neotropical timber species in monocultures and mixtures. For. Ecol. Manag. 2017, 403, 1–11. [Google Scholar] [CrossRef]
  71. Dokken, T.; Angelsen, A. Forest reliance across poverty groups in Tanzania. Ecol. Econ. 2015, 117, 203–211. [Google Scholar] [CrossRef] [Green Version]
  72. Wu, Y.; Xi, X.; Tang, X.; Luo, D.; Gu, B.; Lam, S.K.; Vitousek, P.M.; Chen, D. Policy distortions, farm size, and the overuse of agricultural chemicals in China. Proc. Natl. Acad. Sci. USA 2018, 115, 7010–7015. [Google Scholar] [CrossRef] [Green Version]
  73. Evans, H.E.; Ngau, P. Rural-urban relations, household income diversification and agricultural productivity. Dev. Chang. 1991, 22, 519–545. [Google Scholar] [CrossRef]
  74. Lambin, E.F.; Meyfroidt, P. Global land use change, economic globalization, and the looming land scarcity. Proc. Natl. Acad. Sci. USA 2011, 108, 3465–3472. [Google Scholar] [CrossRef] [Green Version]
  75. Lu, H.; Xie, H. Impact of changes in labor resources and transfers of land use rights on agricultural non-point source pollution in Jiangsu Province, China. J. Environ. Manag. 2018, 207, 134–140. [Google Scholar] [CrossRef]
  76. Wang, R.; Jiang, Z. Energy consumption in China’s rural areas: A study based on the village energy survey. J. Clean. Prod. 2017, 143, 452–461. [Google Scholar] [CrossRef]
  77. An, L.; Lupi, F.; Liu, J.; Linderman, M.A.; Huang, J. Modeling the choice to switch from fuelwood to electricity: Implications for giant panda habitat conservation. Ecol. Econ. 2002, 42, 445–457. [Google Scholar] [CrossRef]
  78. Polasky, S.; Nelson, E.; Pennington, D.; Johnson, K.A. The impact of land-use change on ecosystem services, biodiversity and returns to landowners: A case study in the State of Minnesota. Environ. Resour. Econ. 2011, 48, 219–242. [Google Scholar] [CrossRef]
  79. Baffoe, G.; Matsuda, H. A perception based estimation of the ecological impacts of livelihood activities: The case of rural Ghana. Ecol. Indic. 2018, 93, 424–433. [Google Scholar] [CrossRef]
Figure 1. A livelihood framework with tree plantations. Source: adapted from Department of International Development (DFID) [37]. Note: H = Human Capital; N = Natural Capital; F = Financial Capital; P = Physical Capital; S = Social Capital.
Forests 11 00248 g001
Figure 2. The central mountainous region of Hainan Island.
Forests 11 00248 g002
Table 1. Classification of rural household livelihood strategies.
VariablesPlantation (Cluster1)Livestock/plantation (Cluster2)PES/outmigration (Cluster3)Local off-farm (Cluster4)Total
MeanSDMeanSDMeanSDMeanSDMeanSD
Income share
Plantation income (%)652,3,425361,3,42621,2751.2134635
Crop income (%)213,425113,41641,2941,2101523
Livestock income (%)427451,3,423426226917
Local off-farm income (%)2472486413611,2,3391430
Remittance (%)033339351,2,438236313
Subsidy (%)145248247241,2,338620
Payment for ecosystem services (%)639133491,2,445339717
Income level
Total income (Yuan)15549b1773118657ab264736911c1069650498a25786622372117019
Below poverty line (%)493,45057350841,2.437651,3485550
Household number (%)6311620100
Note: Superscript letters show that the cluster is significantly different from other clusters at the 5% level using one-way ANOVA. The superscript numbers show the difference between two clusters at the 5% level using the Kruskal–Wallis test.
Table 2. Descriptive statistics of household capital by different livelihood strategies.
VariablesPlantation (Cluster1)Livestock/Plantation (Cluster2)PES/Outmigration (Cluster3)Local Off-Farm (Cluster4)Total
MeanSDMeanSDMeanSDMeanSDMeanSD
Natural Capital
Plantation area (mu)23a2023a2011b117b131920
Cropland area (mu)4759373647
Human Capital
Household size (capita)4.2b1.34.2ab1.24.5ab1.74.5a1.54.31.3
Household labor at home (capita)3.1a1.22.9ab1.22.4b1.42.9ab1.43.01.3
Average age of household labor (Year)367356389376367
Average education level of household labor (Year)8.62.58.22.28.02.38.42.98.52.5
Physical Capital
House value (104 Yuan)101111138614201114
Quantity of Appliance1.5bc0.81.9a1.01.3c0.71.7ab1.11.60.9
Quantity of Transport tools1.50.81.50.91.60.81.51.51.51.0
Social Capital
Phone call costs (Yuan/year)136a119127ab11580b82132a132131120
Social relation (0/1)0.220.40.310.50.20.40.20.40.20.4
Expense of cash gifts (Yuan/year)1618b2525944b15941492b32702829a567417763409
Financial Capital
Saving (0/1)0.740.50.60.50.50.50.510.50.60.5
Loan (Yuan)0.10.20.10.30.10.30.10.30.10.3
PES funds (Yuan/year)936a1511137b536826a1040131b3326791299
Geographical location
Distance to road (m)125a36180a30184a2760b2012438
Distance to town (km)7.5a5.75.4b4.23.9b3.14.1b3.96.45.3
Altitude (m)235b96289a132212b96161c120225112
Diversity index
Income diversity index0.6b0.40.8a0.30.4c0.40.4c0.40.60.4
Diversified plantation system (0/1)0.52,3,40.50.71,3,40.50.31,20.40.21,20.40.40.5
Note: Superscript letters show the cluster is significantly different from other clusters at the 5% level by one-way ANOVA or Kruskal–Wallis test. Superscript numbers show the differences between two clusters at the 5% level, using chi-squared tests. 1 mu = 1/15 hectare.
Table 3. Regression relationships between plantation income and forms of capital for different livelihood strategies.
VariablesLog of Plantation Income per Household
PlantationLivestock/PlantationPES/OutmigrationLocal Off-FarmTotal Sample
Coef.p > t Coef.p > t Coef.p > t Coef.p > t Coef.p > t
Natural capital
Plantation area (mu)0.03060.0000.00390.8590.08130.042−0.00270.8970.04730.000
Diversified plantation system (0/1)0.68990.0004.51800.000−0.54940.5673.01240.0001.83770.000
Intercropped with commercial crops (0/1)0.57150.230−0.28190.8657.36480.003 2.18710.002
Cropland area (mu)−0.01310.3090.06550.080−0.08360.1100.01420.695−0.00230.889
Ecological policies
PES funds (Yuan/year)0.00040.000−0.00100.043−0.00020.5270.00080.2620.00070.000
Human capital
Household size (capita)−0.07730.2360.34170.148−0.12440.5350.35340.021−0.04300.592
Average age of household labor (Year)−0.00680.551−0.02520.588−0.01240.7500.04010.277−0.01290.404
Average education level of household labor (Year)0.04750.1780.10360.4870.12840.3710.06900.4570.14720.001
Geographical location
Distance to road (m)0.13430.052−0.06750.7880.07700.790−0.03880.8660.14490.114
Distance to town (km)0.07520.0000.25650.002−0.01410.906−0.02270.6970.17930.000
Altitude (m)0.00530.0000.00360.2610.00030.9220.00580.0140.00810.000
Constant4.92330.000−0.54530.859−0.05610.982−3.70260.0970.15400.878
N5529951175877
F-value24.59***11.28***2.34**6.11***59.24***
Adj R20.320.540.230.23
Note: variance inflation factor (VIF) = 1.30. ***, clusters that are significantly different at the 1% level from one-way ANOVA, **, clusters that are significantly different at the 5% level from one-way ANOVA.
Table 4. Land and income characteristics by household income classes within the Plantation group.
VariablesQuintile1Quintile2Quintile3Quintile4Quintile5Total
MeanSDMeanSDMeanSDMeanSDMeanSDMeanSD
Household size (capita)4.01.04.31.54.21.44.21.14.21.34.21.3
Plantation area per household (mu)14.2c10.217.3c13.021.5bc17.327.7ab24.233.4a26.322.820.3
Plantation area per capita (mu/capita)4.4c3.94.8bc4.36.4bc9.26.8ab6.38.6a8.06.26.8
Plantation income per capita (Yuan/capita)981c12231544bc14762303b22313099a30466097a814227504318
Total income per capita (Yuan/capita)1600a17252530b20403551b31064871ab39529068a1153742476083
Note: Superscript letters show clusters that are significantly different at the 5% level from one-way ANOVA.
Table 5. Poverty changes resulting from reallocation of plantation land to reflect family size within the Plantation group.
After Land Reallocation
Below Poverty Line (%)Above Poverty Line (%)Total (%)
Before land reallocationBelow poverty line (%)11.4 37.348.7
Above poverty line (%)3.348.051.3
Total (%)14.785.3100
Table 6. Main livelihood outcomes of different livelihood strategies.
PlantationLivestock/PlantationPES/OutmigrationLocal Off-FarmTotal
MeanSDMeanSDMeanSDMeanSDMeanSD
Economic income
Total income per capita (Yuan/year)4104b48005045ab107301705c279013911a72509602732986
Chemical inputs
Expense of fertilizer per household (Yuan/year)764a617706a422891a1015594b699743648
Expense of pesticide per household (Yuan/year)485a358278b188573a448284b223450349
Energy consumption
Firewood consumption per household (kg/year)4015a67573830a36643410b42082754c783936956603
LPG consumption per household (Yuan/year)387b654383b593209c401676a1192436790
Electricity consumption per household (Yuan/year)709b655846ab514832ab1144932a828776720
Note: Superscript letters show clusters that are significantly different at the 5% level using one-way ANOVA or Kruskal–Wallis test.

