Article

A Comparative Study to Evaluate Accuracy on Canopy Height and Density Using UAV, ALS, and Fieldwork

1
Division of Earth Environmental System Science (Major of Spatial Information Engineering), Pukyong National University, Busan 49513, Korea
2
Hydrographic Technology Research Center, Korea Hydrography and Research Association, Seoul 08590, Korea
*
Author to whom correspondence should be addressed.
Forests 2020, 11(2), 241; https://doi.org/10.3390/f11020241
Submission received: 30 December 2019 / Revised: 15 February 2020 / Accepted: 19 February 2020 / Published: 22 February 2020
(This article belongs to the Section Forest Inventory, Modeling and Remote Sensing)

Abstract

:
Accurate measurement of the tree height and canopy cover density is important for forest biomass and management. Recently, Light Detection and Ranging (LIDAR) and Unmanned Aerial Vehicle (UAV) images have been used to estimate the tree height and canopy cover density for a forest stands. More so, UAV systems with autopilot functions, affordable Global Navigation Satellite System (GNSS) and Inertial Measurement Unit (IMU) have created new possibilities, aided by available photogrammetric programs. In this study, we investigated the possibility of data collection methods using an Aerial LIDAR Scanner (ALS) and an UAV together with a fieldworks to evaluate accurate the tree standard metrics in Singyeri, Gyeongjusi, and Gyeongsangbukdo province. The derived metrics via statistical analyses of the ALS and UAV data and validated by field measurements were compared to a published forest type map (scale 1:5000) by the Korea Forest Service; geared towards improving the forest attributes. We collected data and analyzed and compared them with existent the forest type map produced from an aerial photographs and a digital stereo plotter. The ALS data of around 19.5 points·m–2 were collected by an airplane, then processed and classified using the LAStools; while about 362 images of the UAV were processed via Structure from Motion algorithm in the Agisoft Metashape Pro. Thus, we calculated the metrics using the point clouds of both an ALS and an UAV, and then verified their similarity. The fieldwork was manually done on 110 sampled trees. Calculated heights of the UAV were 3.8~5.8 m greater than those for the ALS; and when correlated with the fieldwork, the UAV data overestimated, while the maximum height of the ALS data was more accurate. For the canopy cover, the ALS computed canopy cover was 10%~30% less than that of the UAV. However, the canopy cover above 2 m by an UAV was the best measurement for a forest canopy. Therefore, these results assert that the examined techniques are robust and can significantly complement methods of the conventional data acquisition for the forest type map.

1. Introduction

More than 63% of South Korea is a forest zone. As such, these resources are both environmentally and economically important to the country. The total forested area peaked at 6750 kilo hectares in 1961, and has continuously declined since to 6335 kilo hectares in 2017 [1].
The Korea Forest Service in South Korea started to create the forest type map that includes tree attribute data to aid efficient forest management. The first forest type maps were made between 2008 and 2012, and the border zone was added in 2013, so that the whole country is mapped. After that, the forest type map’s accuracy improved from 2014 to 2019. The Korean forest type map describes the distribution of the tree attributes such as diameter at breast height, tree age, tree height, and canopy cover density. The forest type map produced by the Government of South Korea is among the main national thematic maps, which include: Topographic, soil, and geology maps.
It is important to evaluate the accuracies of the forest type map produced at the national level [2]. A tree height is measurable in accessible areas such as a roads and graveyards. But this is difficult in a dense forest. A diameter at breast height and a tree age can both be obtained from woodchip statistics established during a forest exploitation. Considering all of these factors, and the fact that the forest type map has about 150~200 polygons per the forest type map (scale 1:5000), it can be difficult to judge the overall accuracy of the forest type map. Alternatives such as an airborne laser scanning and a terrestrial LIDAR scanning can improve the evaluation of the forest metrics [3]. But they are time consuming and expensive.
Recently, a tree height and a diameter at breast height have been measured using a small Light Detection and Ranging (LIDAR) unit mounted on an UAV [4], and a rigorous survey using only an ALS and a fieldwork data has been conducted [5]. Having estimated tree height using an ALS in a tropical rainforest [6], individual trees were detected using an ALS [7], and tree height and diameter at breast height have been measured using an ALS [8]. In other work, the high resolution images have been acquired using an UAV and automatic 3D photographic reconstruction methods have been used to determine a tree height [9,10]. In addition, a researchers have compared the suitability of the UAV photography and ALS point clouds for a forestry applications [11], and have compared RIEGL RiCOPTER and a terrestrial LIDAR scanning measurements of the canopy height and diameter at breast height [4].
In this study, we investigated an ALS and an UAV data collection methods and compared them to the standard metrics (a tree height and a canopy cover density based on the class definition in the Forest Type Map of South Korea), a diameter at breast height, a tree age in the field; used statistical analyses to validate and assess an ALS and an UAV data; and then compared with the fieldwork likewise the forest type map.

2. Research Area and Methodology
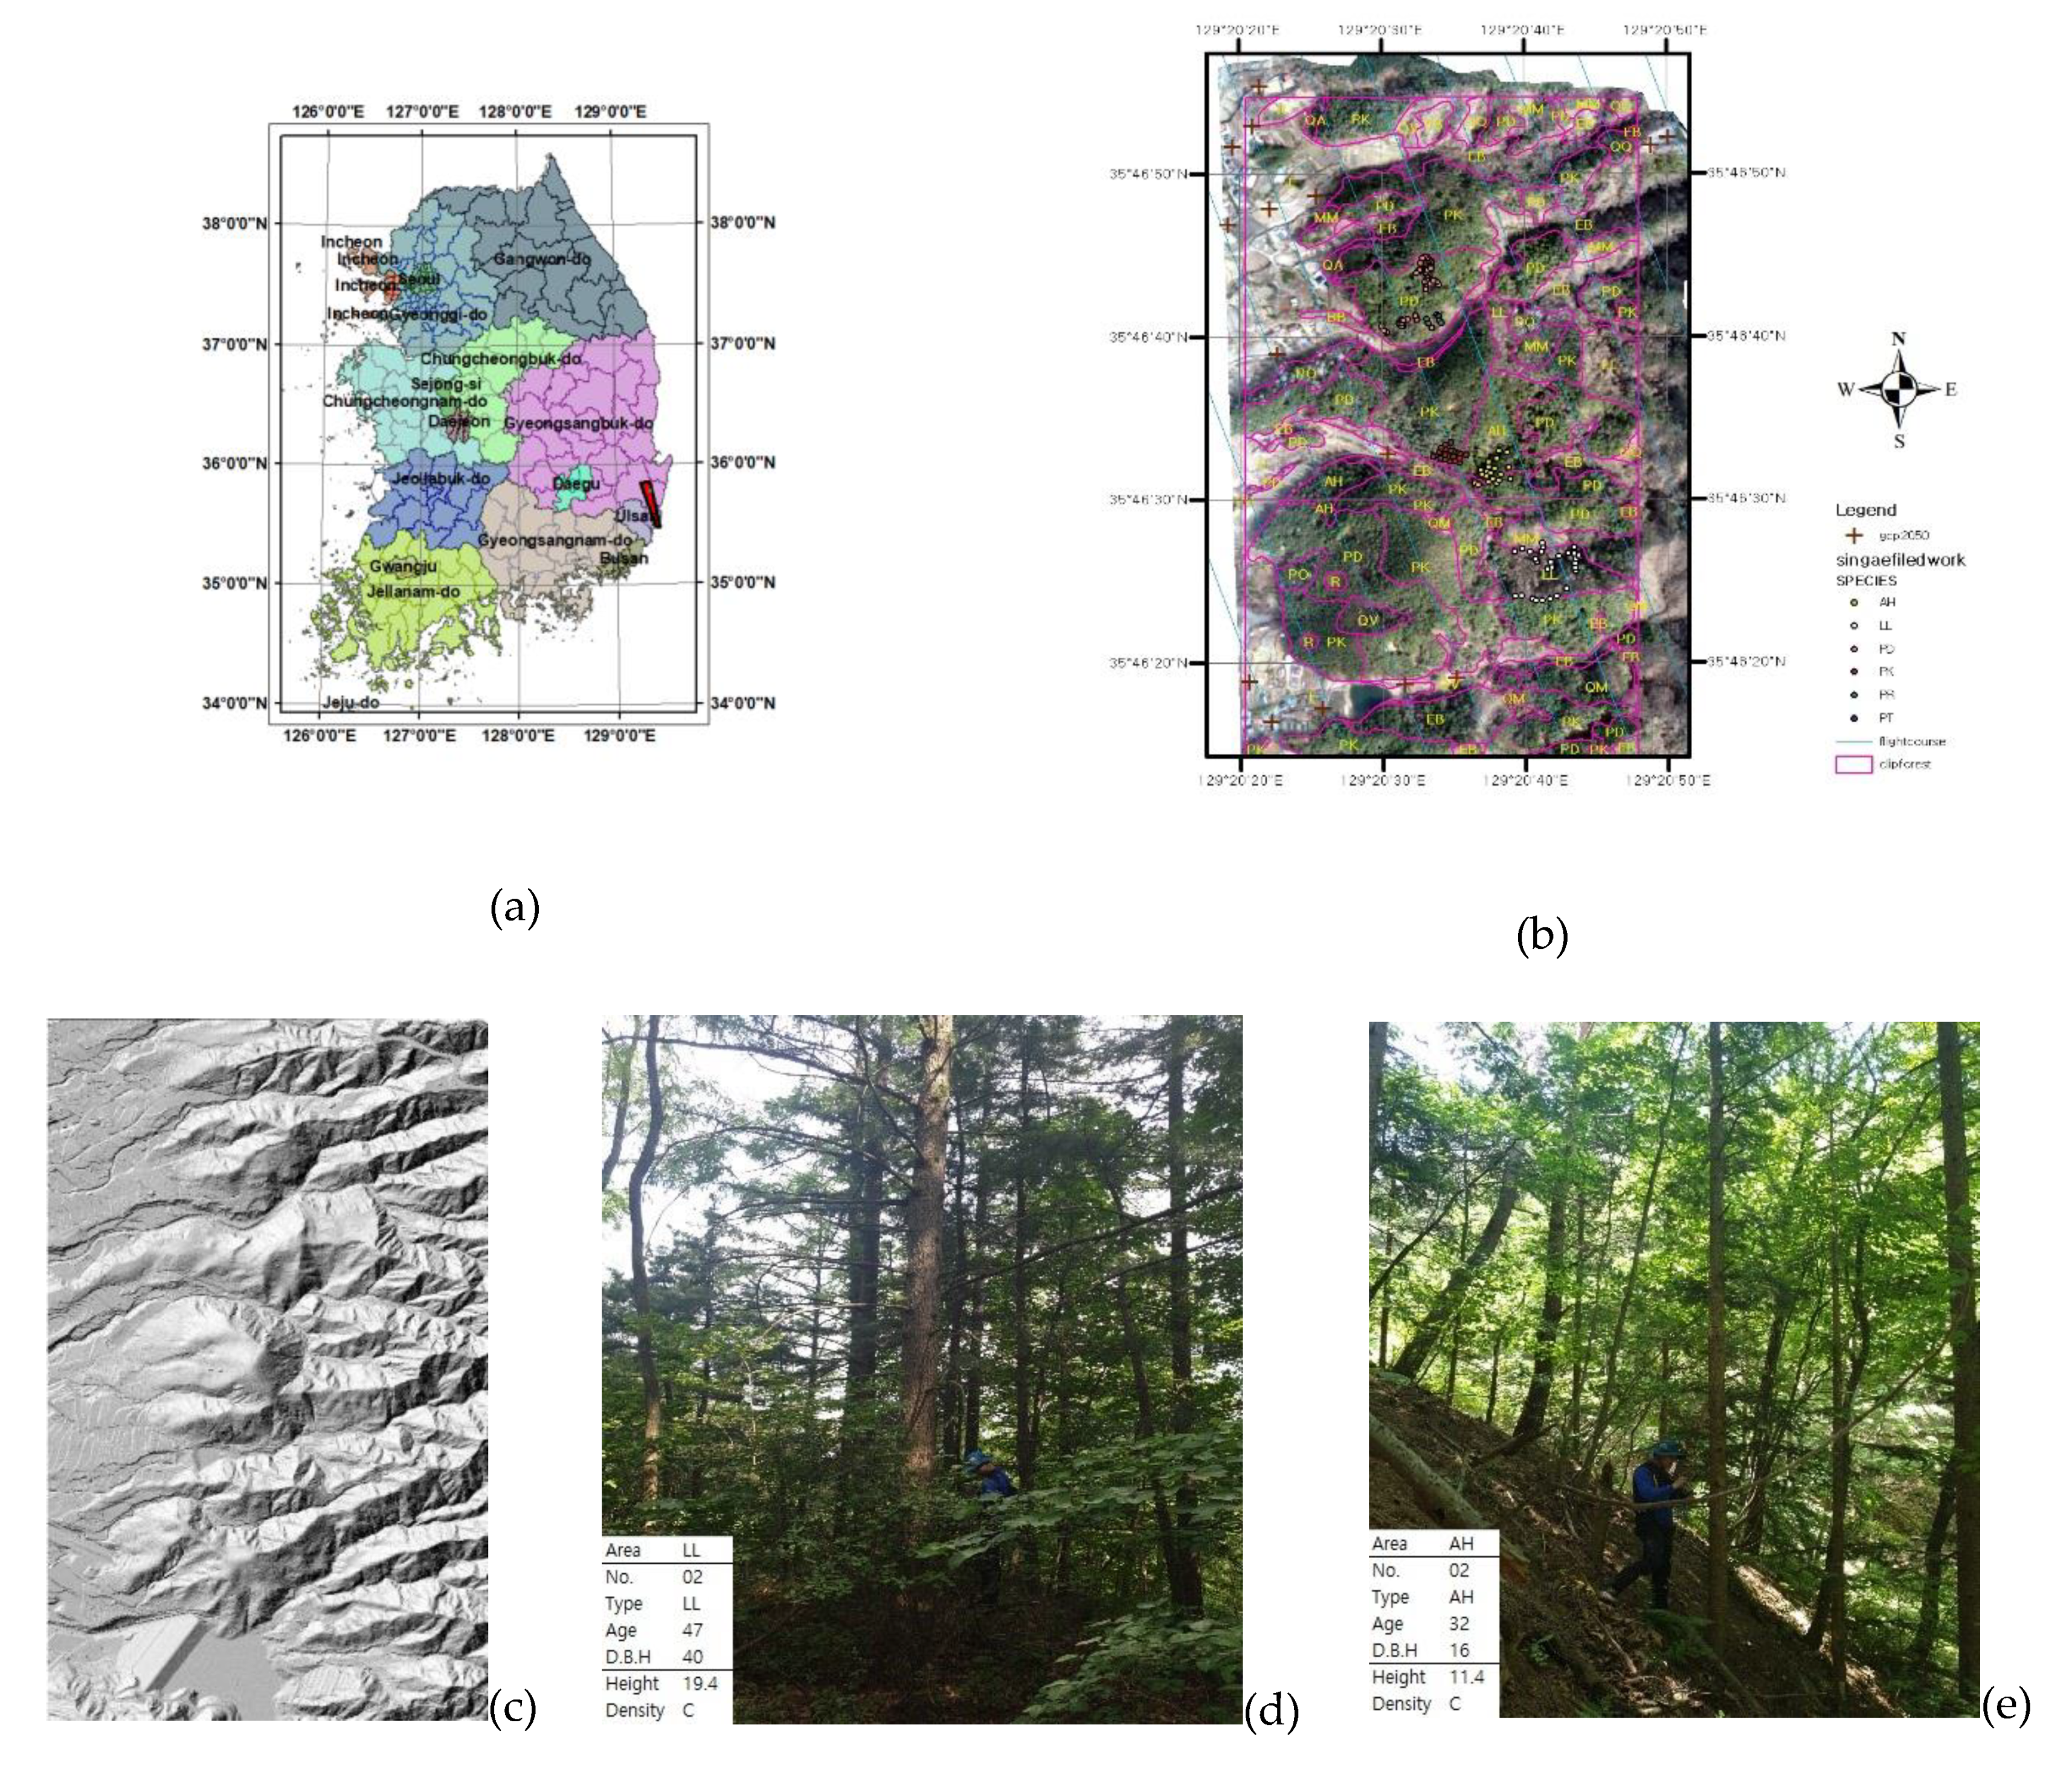
2.1. Study Area

The study area is located in Singyeri, Gyeongjusi, Gyeongsangbukdo province as Figure 1, South Korea (N 35°46’30”, E 129°20’40”). This research site elevation ranges from 198 to 384 m above sea level and the topography is primarily steep hills. This region typically constitutes a variety tree population. Around 29.8% Pinus koraiensis (PK) grow at high altitudes and are distributed across Korea, Japan, Northeastern China, and far Eastern Russia. In China, these trees are referred to as the Silla pines and Japanese refer to them as the Korean pines. The Pinus densiflora (PD) 28.4% is the most common conifer in South Korea, and is found across the country in artificial and natural forests. In this study, it was the only naturally occurring tree as other trees were in artificial forests. About 5.1% Larix kaempferi (LL) is a deciduous needled tree that originated in Japan, and is the most commonly planted tree in South Korea. It grows best in cold climates, and is found in the Kuma Highlands of North Korea. The Abies holophylla (AH) 3.8% is a typical Korean conifer that grows in high altitude mountainous areas with low temperatures. It has a straight, long trunk, and is a native Korean species that grows in groups of hundreds or thousands. Additionally, 19.1% etc. broadleaf (EB), 4.6% mixed forest (MM), 2.1% Populous (PO), 0.5% Quercus acutissima (QA), 2.4% Quercus mongolica (QM), 1.2% Etc. Quercus (QQ), and 3.0% Quercus variabilis (QV) are irregularly distributed all over Korea. However, in the fieldwork only PK, PD, LL, and AH species were sampled and measured. This species is the dominant species order excluding the mixed forest (MM, EB). In the mixed forest it is difficult to find a dominant species, so we did not choose it.

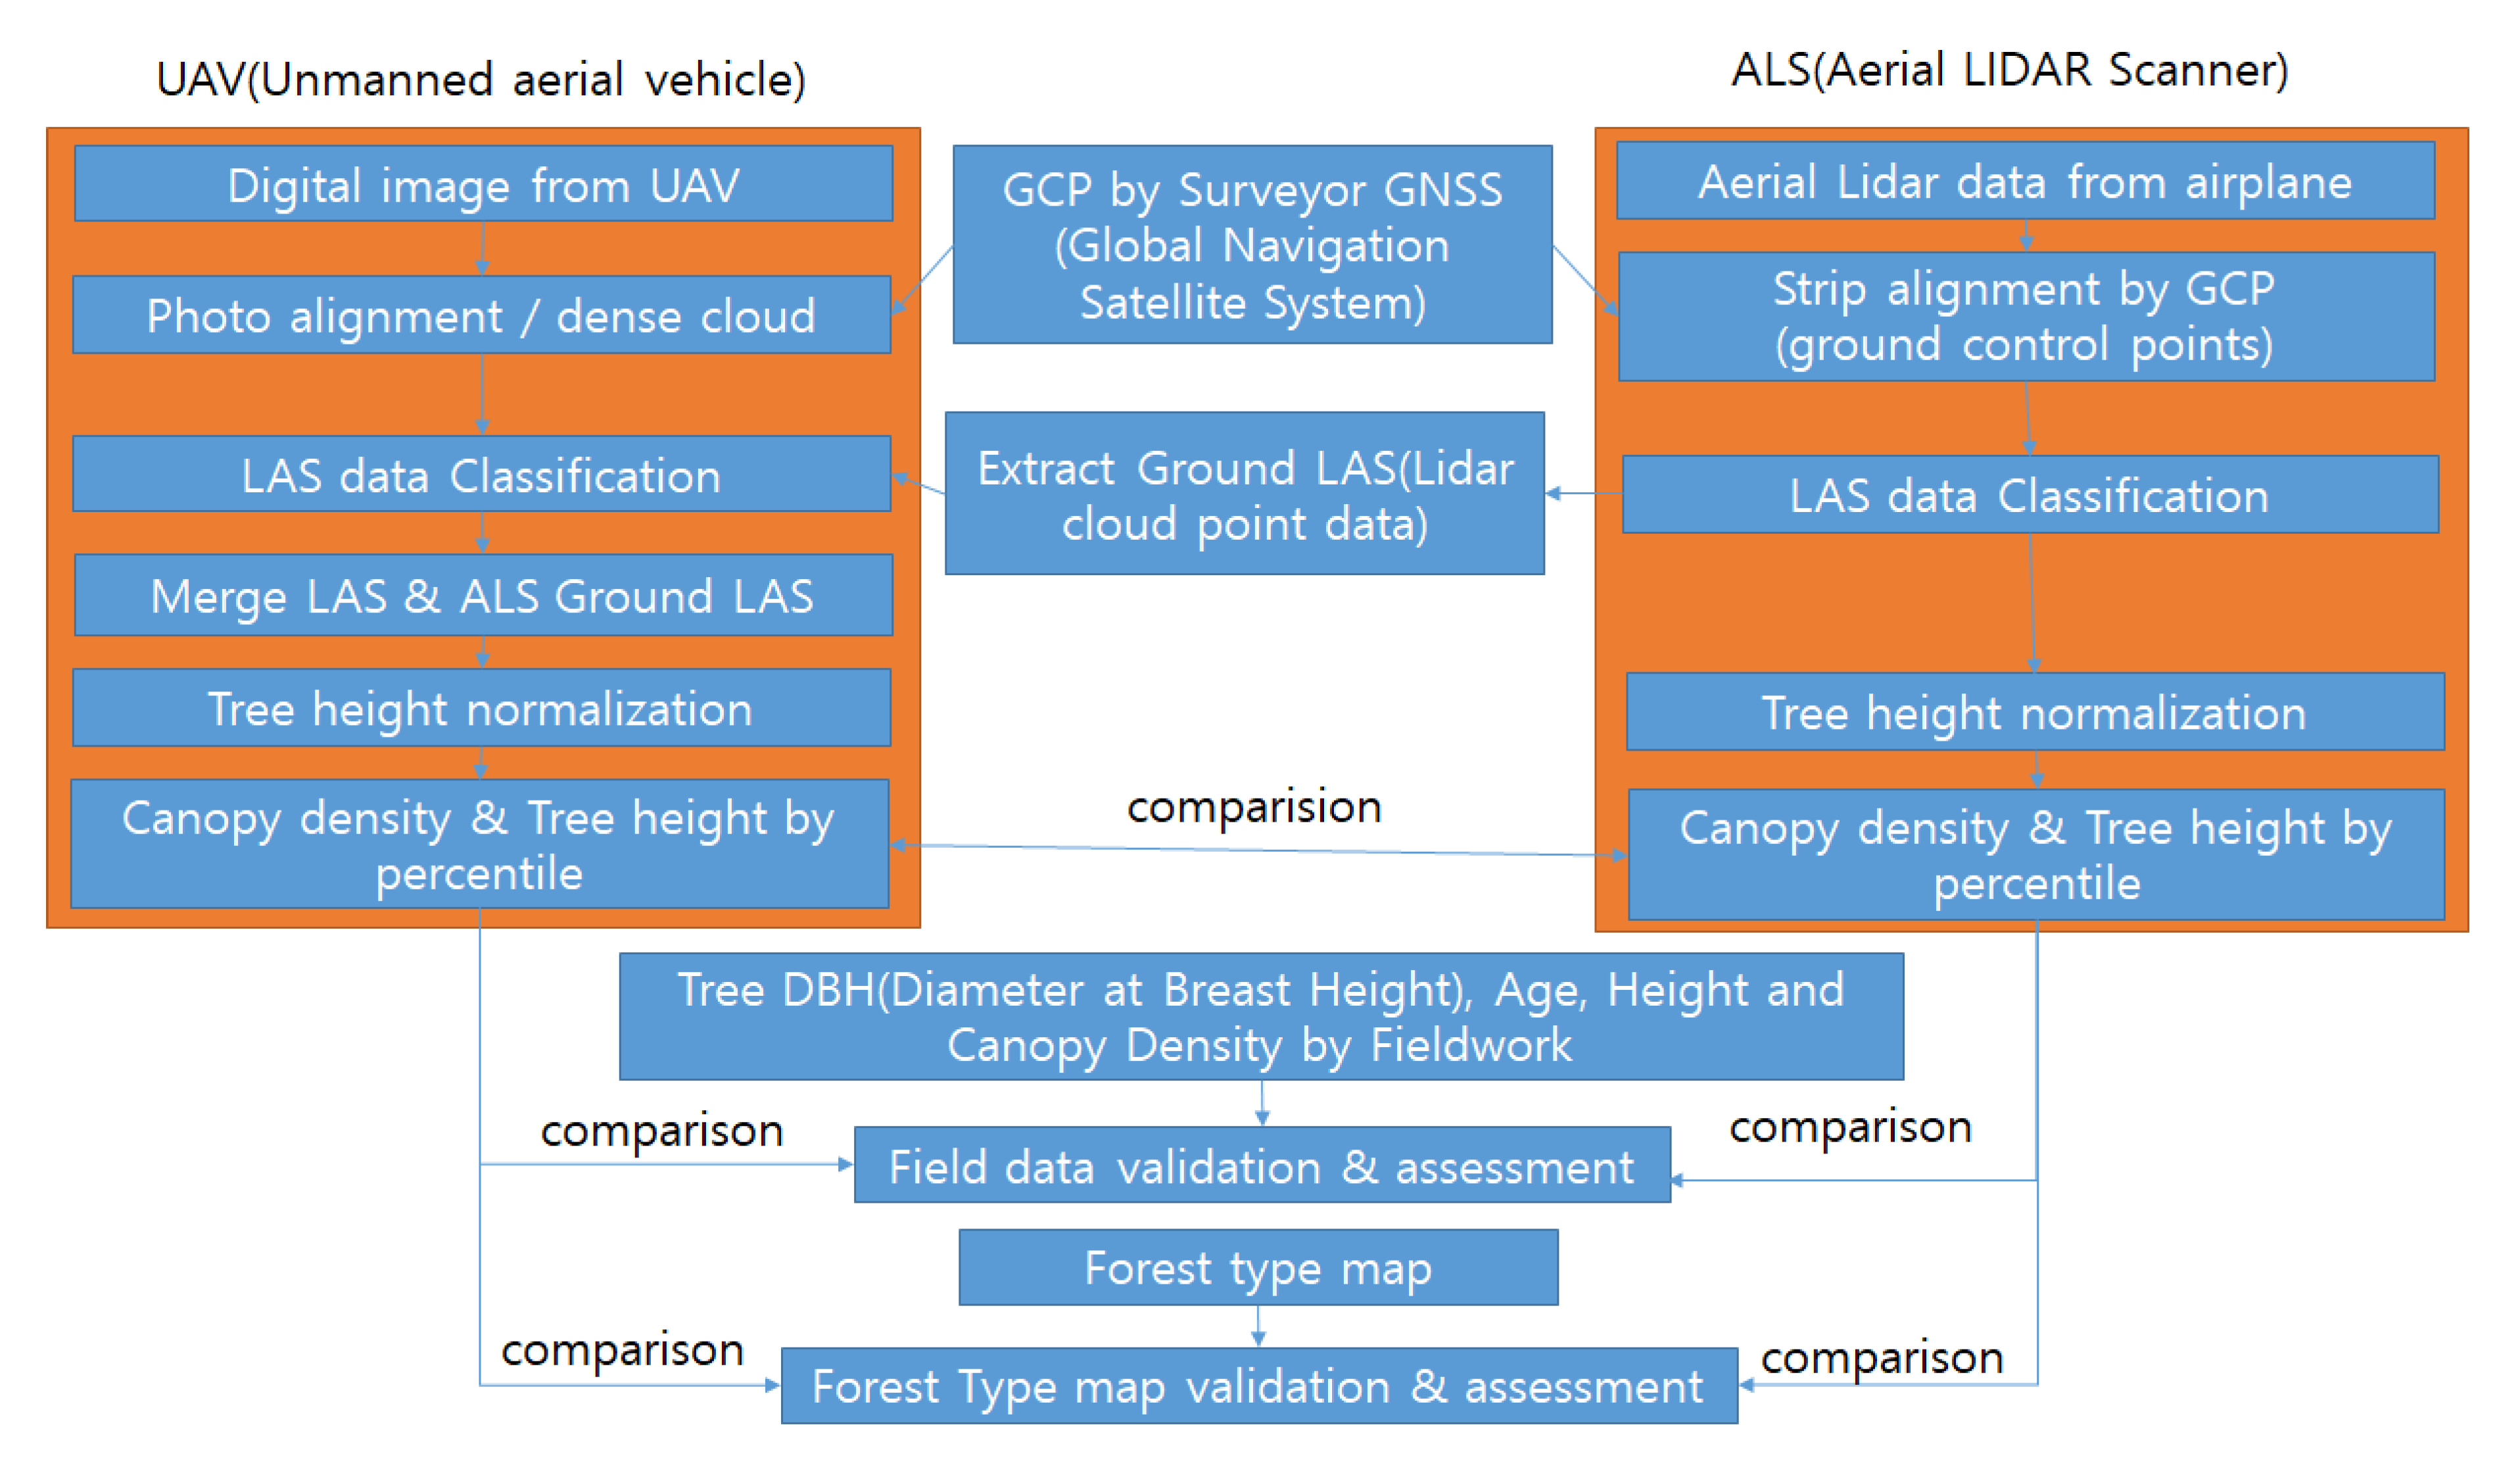
2.2. Aerial LIDAR and Data Processing

This research flowchart is shown in Figure 2. It is important to be able to measure the properties of a single tree in a forest. LIDAR and an ALS can estimate the dimensions of the trees [4,12]. ALS data are commonly collected using an airplane, thereby covering a large area. Data density is typically 1–10 point·m−2, and is determined by the flight altitude and scanner configuration [4]. High resolution ALS data with more than 10 point·m−2 can be used to detect and measure the height, crown diameter, and position of the trees as validated by the field measurements [13]. The ALS data used in this study were collected between 4 and 25 January 2018, using a Leica ALS60 to measure an area of about 266 kilo hectares from an altitude of 1700~2325 m above sea level, and about 1500 m above ground level. The flight speed was in the range of 211~228 km·hour−1, the flight course interval was 110 m, the pulse return was 1~4 point and the scan angle was in the range −11~14° with a point density of 19.5 point·m−2 as shown in Table 1. A Terrascan and Microstation (Terrasolid Co.) program was used for a basic LIDAR data processing.
For strip alignment, we surveyed 57 ground control points (GCPs) with Sokkia GRX2. According to a Global Navigation Satellite System (GNSS) the accuracy was 10 mm + 1 ppm (horizontal) and 15 mm + 1 ppm (vertical). This accuracy depends on the number of satellites visible, the position of dilution of precision (PDOP), multipath signal errors, and the baseline length. The resulting positional accuracy was about 2–5 cm. BayesStripalign 2.1 was used to calculate the vertical difference between overlapped scan swath [14]. The point cloud collection technique is resistant to variation in vegetation, mismatched surfaces, and natural differences due to perspective. The optimal conditions were automatically calculated from the relative displacement using a rigorous model and Bayesian interference [9].
After alignment, the root mean square error was 3.5 cm and the 95% confidence interval (CI95) was 6.9 cm. LAS data processing and classification was performed using LAStools [15]. LAStools are capable of classifying, tiling, converting, filtering, rastering, triangulating, contouring, and clipping LIDAR data [15].
The Lasclassify tool available in LAStools is suitable to classify buildings and tall vegetation (i.e., trees). Using ALS and LAStools, the area was determined to be 37.61% ground with 7.81 point·m−2, 55.51% vegetation with 10.8 point·m−2, and 6.88% other with 1.4 point·m−2. The tree height was normalized using the Lasheight function of LAStools, which computes the tree height of each point above the ground. This process assumes that the ground has been accurately mapped, and a triangular irregular networks (TIN) have been constructed. Tree height normalized LIDAR point clouds is then used to calculate forest metrics such as the canopy cover density, tree height percentiles, mean, minimum, and maximum. The standard input metrics are defined in Table 2.

2.3. UAV Digital Image and Data Processing

In recent years, UAV systems with autopilot functions, low cost GNSS devices, and inertial sensors have created new possibilities for remote measurement applications using commercially available photogrammetric programs [9]. The UAV used here had a central processing unit (CPU) with an integrated Attitude and Heading Reference System (AHRS) based on an L1 GNSS and Inertial Measurement Unit (IMU: accelerometers, gyroscopes, and a magnetometer) [17]. High resolution imagery can be used to determine a tree height and a crown diameter [10], and a LAS data files can be produced using Structure From Motion photogrammetry data exploration and processing [18].
The digital UAV images used in this study were collected on 11 April 2019 using a DJI Inspire 2 and Zenmuse X4S camera that covered the whole study area over 115 ha, at an altitude of 150 m above the takeoff site (Figure. 1b). The flight speed was 18 km·hour−1, and the overlap and sidelap of the flight were 80% and 70%, respectively.
The camera settings were manual during the flight to ensure constant radiometric imagery conditions [19]. The focal length was 8.8 mm (35 mm converted into 24 mm), the aperture was f/4.5, and a sensitivity of ISO 100 was used. The ground sample distance (GSD) was set to 8.95 cm/pixel and 362 images were captured so that the average point canopy cover density was consistent for comparison between UAV and aerial LIDAR data. The average point density was 17 point·m−2 (see Table 1). The 15 GCPs within the study area were surveyed and located by Sokkia GRX2 RTK, and the root mean square error of their measured positions was 6.2 cm, 8.8 cm, and 22.2 cm in the x, y, and z-axes, respectively. The root mean square error of the point cloud reprojection error was 0.822 pixel.
Agisoft Metashape is an image-based 3D modeling program for still images that can built the estimated camera positions and pictures themselves. Images were processed using the Structure from Motion and bundle adjustment (this minimized the reprojection error in the units of tie point) algorithm available in Agisoft Metashape Pro (v1.5.2) [18]. Alignment photographs were captured, the camera was calibrated, a dense point cloud was built, and the ground was classified and exported to a UAV LAS data file. However, the UAV captured limited ground data. Accurate calculation of the tree height of each point above the ground requires ground points that have been classified to enable the construction of a ground TIN. Digital aerial photogrammetry image processing was used to merge the UAV and ALS data and to normalize the tree height. The point clouds were normalized to the ALS LAS data so that the tree height relative to ground could be derived and normalized.

2.4. Field Forest Measurement

The fieldwork was conducted on 11 and 12 May 2019. A Haglof vertex laser, Haglof increment borer, and diameter tape were used to measure the tree height, tree age, and diameter at breast height respectively. This measurement was done at each of the four locations identified with a GNSS receiver (GRX 2, Sokkia, Japan) device and the trees considered had the diameter at breast height greater than 13 cm [20]. However, fieldwork is expensive and time consuming, and taking measurements in high density forests is challenging. Thus, we identified four locations in the research area with easy accessibility and trees near open space.
During the fieldwork, we preferred to exploit the areas demarcated by the forest type map researcher over 5 years ago. A total of 110 trees were measured: 20 from AH, 30 from LL, 40 from PD, and 20 from PK. Indirect methods were used to measure tree height in the forest. Typically an angle between the base and top of a tree, and the horizontal distance to the tree base from the measurement point were used to estimate the tree height according to basic trigonometric formulae [5].
A Haglof vertex laser (VL400, Haglof inc., Sweden) was used for tree height measurement, which had an ultrasonic accuracy of ±1% over 20 m, and a laser accuracy of ±0.4 m in 100 m. The laser was used in low density artificial forests, while the ultrasonic function was used in high density natural areas.
Tree age was measured 110 trees using a Haglof increment borer, which extracted a bore with diameter 5.15 mm, and maximum length 40 cm, and diameter at breast height was measured 110 trees using diameter tape. Canopy cover density measuring was an impracticable task and we used observation with the naked eye method near mountain road. The forest type map of South Korea has only 3 classes. But, in the forest map, canopy cover density estimated by researcher eye in digital stereo plotter.

2.5. Tree Standard Metrics for UAV, ALS, and Class Definition in the Forest Type Map of South Korea.

ALS and UAV image LAS files were compared using two sets of metrics calculated from the UAV images and ALS point cloud. The LAS point clouds were calculated by subtracting the ground elevation from the cloud points [21], and LAStools were used to compute standard tree metrics [14]. The metrics were calculated using both the ALS and UAV point clouds for comparison across the different strata that were over 2 m tall in Table 2 [22,23]. Attribute class were assigned, as described in Table 3 for the forest type map of South Korea, according to a previous study [24]. A tree height uses 3 point measurement in the forest type map. And a canopy cover density in the forest type map was determined simply by visual reading and digital stereo plotter. The 3 point method using digital stereo plotter takes the average of three tree heights from each stand (at a high, medium, and low elevation in the stand), and has a tolerance of ±2.0 m. However, researchers have highlighted that this (eye) visual reading method has a lot of uncertainty. Thus, the canopy cover density is classified into 3 (classes) as shown in Table 3.

3. Results and Discussion

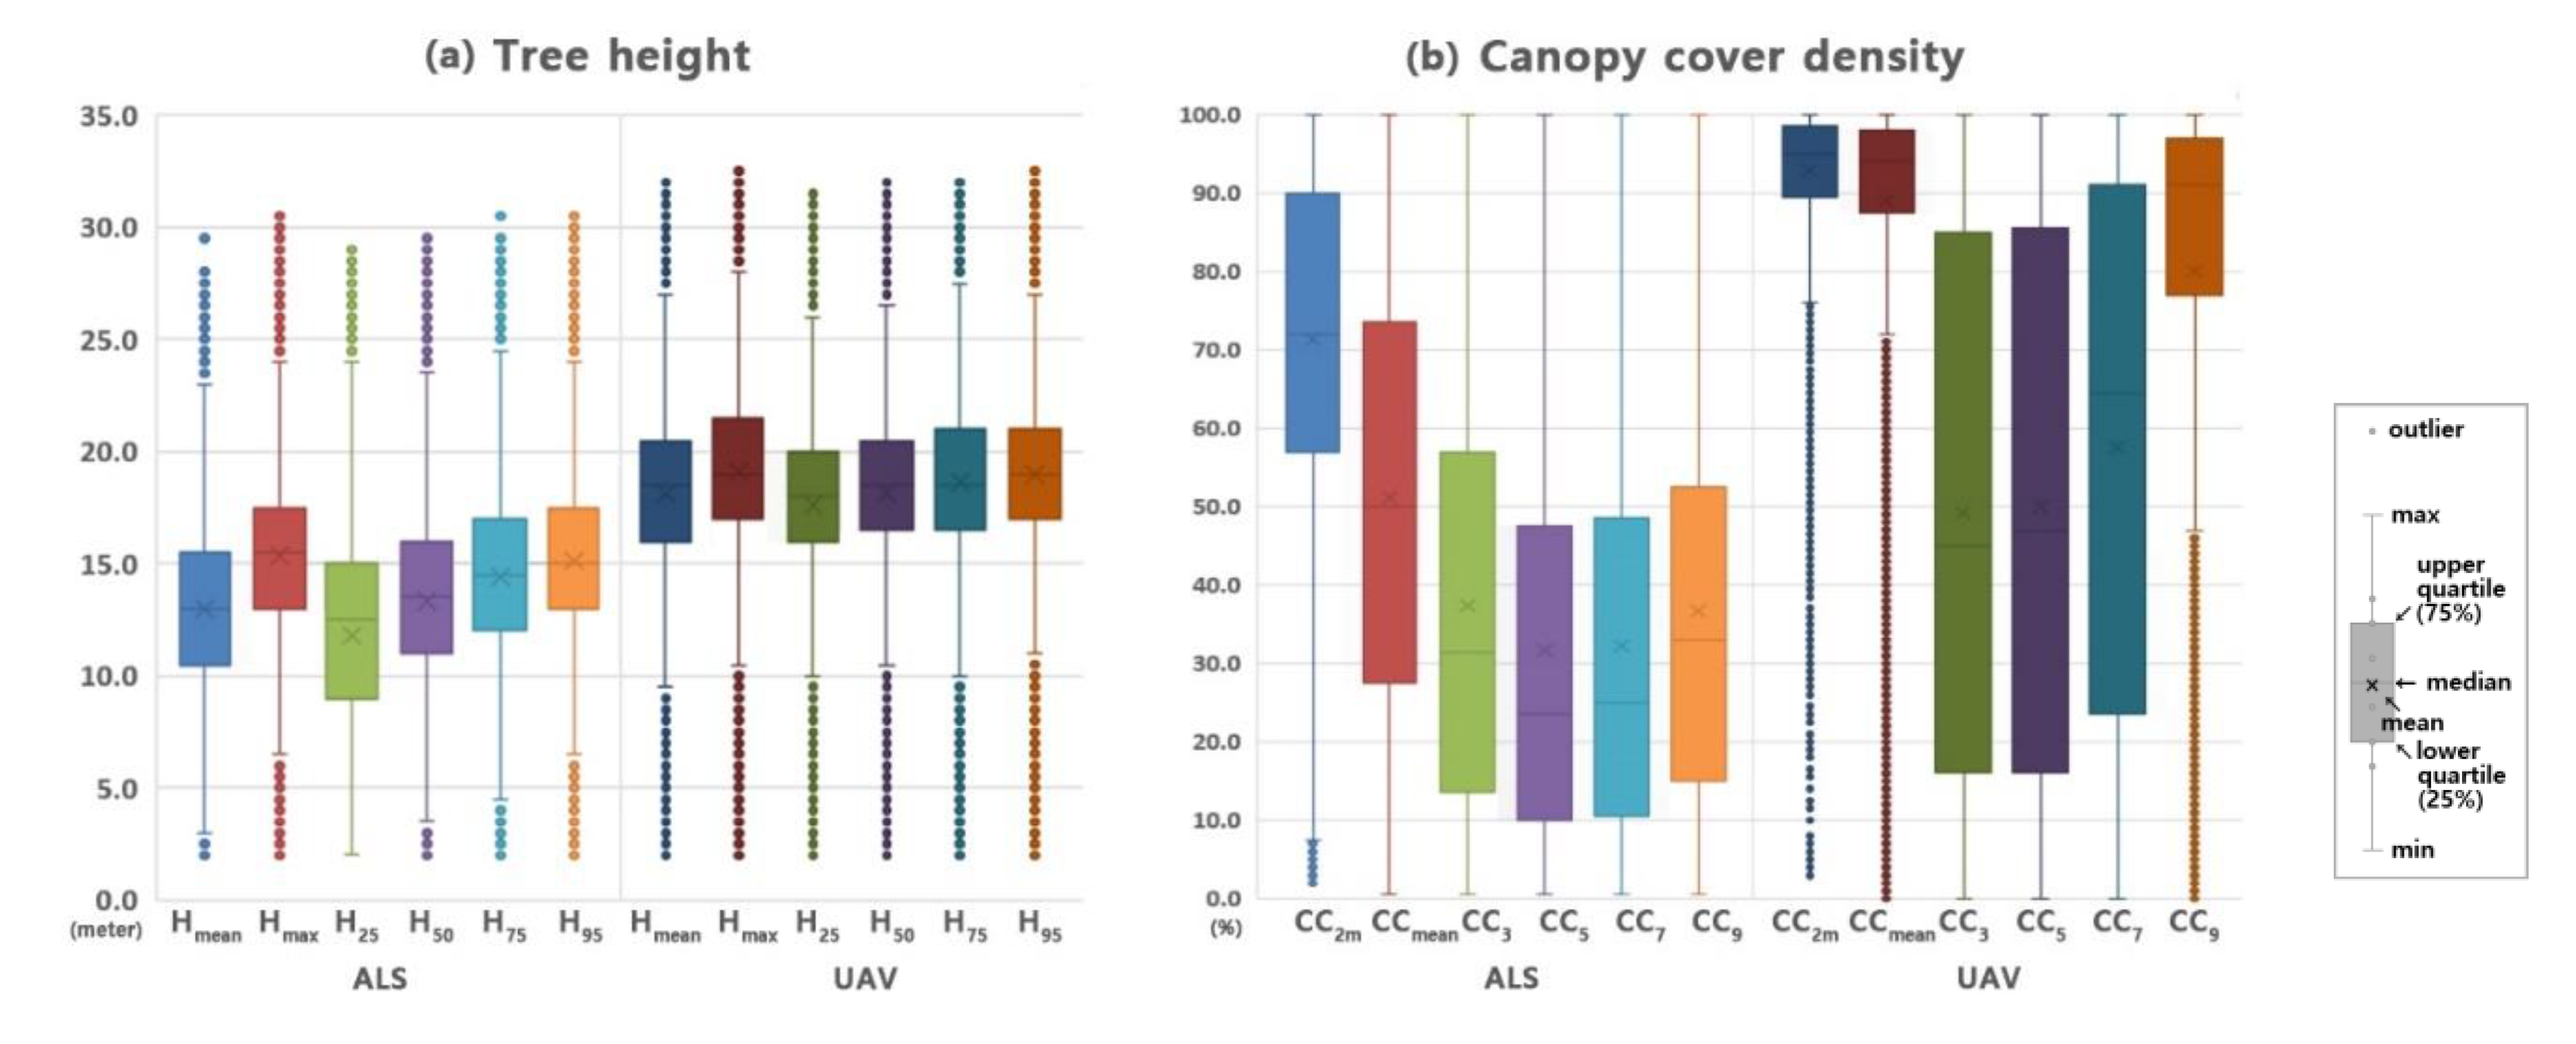
3.1. Comparison of the Standard Metrics of UAV and ALS Point Clouds

Figure 3a shows the tree height determined by UAV and ALS point cloud measurements, compared to field measurements for different tree species. In general, the UAV and ALS point clouds produced a similar tree height distribution. The normalized height percentile differences were 5.8 m (H25), 4.9 m (H50), 4.2 m (H75), and 3.9 m (H95), and the differences in Hmax and Hmean were 3.8 m and 5.1 m, respectively. The tree heights calculated from the UAV measurements were 3.8~5.8 m greater than those computed from ALS. The higher percentile tree height difference was less than the lower percentile tree height. The UAV and ALS point clouds showed good agreement when tree height was above 10 m, and poor agreement below 10 m. The tree height difference above 10 m was 10 m (H25), 5 m (H50), 3.1 m (H75), and 3.0 m (H95), and Hmax and Hmean were 3.0 m and 7.0 m respectively.
As shown in Table 4 (refer to Table 2), the correlation between UAV and ALS measurements were 0.478 (H25), 0.659 (H50), 0.826 (H75), 0.892 (H95,) 0.898 (Hmax), and 0.708 (Hmean). The higher percentiles had stronger correlations, and Hmax and H95 had a correlation greater than 0.85. By contrast, the tree height correlation of UAV based images and TLS based LIDAR reported in a previous study [11,25] was 0.89. However, that study was conducted over a 7 month gap using
TLS whereas our study was executed over 15 months affected by seasonal differences. ALS data is susceptible to climatic conditions whereby winter negatively affects canopy cover while summer adversely impacts tree height measurements.
As shown in Figure 3b and Table 5 (abbreviations based on Table 2), The CC3, CC5, CC7, and CC9 ALS calculated canopy cover density were 20% smaller than the UAV values when canopy cover density was greater than 80%, and the ALS calculated canopy cover density was 30%~50% smaller than the UAV values when canopy cover density was less than 80%. The correlations for parameters CC3, CC9, CCmean, and CC2m were 0.246, 0.208, 0.324, and 0.305 respectively, showing some agreement. But CC5 and CC7 were 0.035 and −0.02 respectively, showing no correlation and both increased for higher and lower canopy cover. Our results are similar to those of a previous study [22] that reported that correlations for ground slope and canopy cover were both less than 0.35 between UAV and ALS. The differences in canopy cover calculated using ALS and UAV point clouds are derived from the differences in the laser and optical sensors used. CC3 (canopy cover in the 25th percentile) represents low density canopy cover. Therefore, there are different sensor patterns received from the tree tops and bottoms between ALS and UAV in the CC3 zone. A comparison of ALS and UAV in Finland found that ALS values are typically greater than UAV values when canopy cover density is low [26]. The canopy cover density mean and standard deviation are greater when measurements are made using ALS. The upper percentiles show a greater difference in canopy cover density due to sensor transmission methodologies. ALS counts the number of pulses transmitted per unit time, and is used to measure from the treetops to ground level [27], whereas UAV systems only detect the treetops, producing a different result.
AS shown in Table 5, UAV measurements have a greater point density than those taken using ALS because the UAV has a smaller GSD and image overlap, which further increases the density and may enable more accurate representation [28,29]. The horizontal accuracy of a technique is determined by the resolution and point-to-point repeatability of each datum. If two techniques have the same resolution, then horizontal accuracy is more important than GSD and resolution. If the accuracy is less than the canopy cover density of the point cloud, therefore, canopy cover density does not have a significant effect on vertical accuracy [30].

3.2. Analyses of Tree Height, Diameter at Breast Height, Tree Age, and Canopy Cover Density for Fieldwork Data

As shown in Table 6, the AH species displayed the following parameters: tree height was 15.7 ± 1.8 m, class 6–8; the diameter at breast height was 26.4 ± 5.9 cm, class 2–3; the tree age was 40.6 ± 3.1 years, class 4–5; and the canopy cover was C.
The measurement for LL were: tree height equals 25.9 ± 4.2 m, class 10–15; the diameter at breast height equals 37.9 ± 5.7 cm, class 3, the tree age equals 49.8 ± 4.8 years, class 4–6, and the canopy cover was C.
On the other hand, tree height 14.5 ± 2.3 m, class 6–8; diameter at breast height 37.2 ± 7.9 cm, class 2–3; tree age 61.0 ± 11.8 years, class 5–8; and canopy cover as C were recorded for PD.
Whereas, fieldwork results for PK included tree height 18.1 ± 0.4 mm and class 8–9, diameter at breast height 26.8 ± 3.9 cm and class 2–3, tree age 42.2 ± 0.8 years and class 5 and the canopy cover was C.
In this study, LL demonstrated the greatest tree height, while PD showed the smallest. However, PD trees in the natural forest were the oldest of those measured, while AH were the youngest measured species in the artificial forest. AH had the smallest diameter at breast height, whereas PD had the largest amongst the oldest trees.

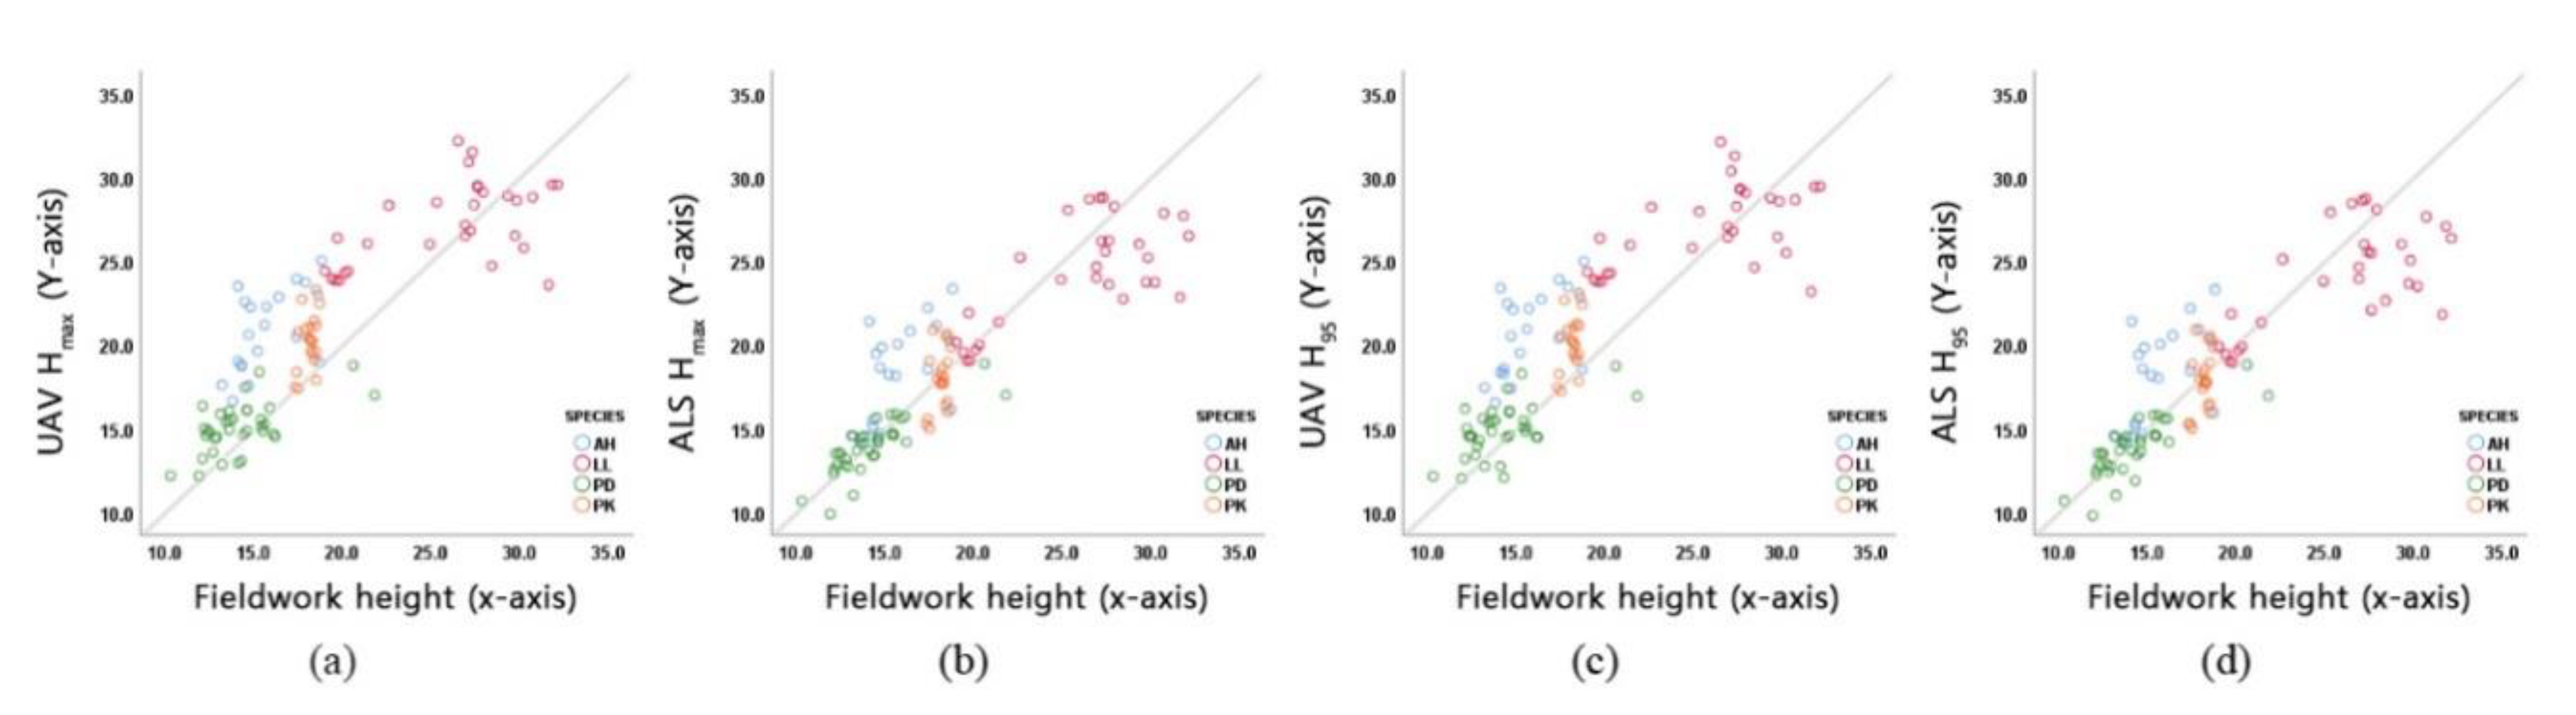
3.3. Tree Height and Canopy Cover Density Accuracy Assessment with Fieldwork and ALS & UAV Data by Tree Point

The differences between tree heights calculated using ALS and those measured during fieldwork were 2.6 m (AH), 1.7 m (LL), −0.3 m (PD), and −0.2 m (PK). The corresponding tree heights were about 5.1 m (AH), 1.2 m (LL), 0.7 m (PD), and 2.0 m (PK). The differences in height measured using the UAV and ALS were largest, in the H25, H50 and H75. However, AH, PK, PD, and LL species were in significance level at greatest height percentiles including ALS Hmax and ALS H95 and UAV Hmax and H95.
The correlation coefficients of the tree heights measured using UAV, ALS, and fieldwork were in the range 0.865–0.899, as shown in Table 7. The correlation between the UAV and fieldwork tree heights was between 0.72 and 0.75 [10]. The Hmax spearman correlation was 0.90–0.95 [31]. The ALS and UAV residual standard deviation, mean, and median were in the ranges ±2.397 to 2.702 m, –0.02 to 2.073 m, and –0.1 to –1.9 respectively, and ALS was better than the UAV at Hmax and H95. In two previous studies [10,26], the residual standard deviations of the ALS and UAV measurements were 1.47 m and 2.13 m respectively.
We attributed the reduced standard deviation of the ALS measurements to three factors: (i) Tree height data are sensitive to seasonal changes, thus, in a previous study, ALS and UAV data collected within a single season or within 30 days had a correlation coefficients of 0.96 and 0.90, respectively at H90, for a 1.5 m tree height [22]. (ii) In other studies, geolocation accuracy was reduced [11], and (iii) the sensor systems were different [25].
First order linear regressions of fieldwork, UAV, and ALS data were calculated in Table 8 and Figure 4. It is normal for no offset to be expected when a first order linear regression is performed on two datasets that are in agreement. Based on regression result, nonstandardized “B coefficients” and upper and lower bounds at 95% confidence intervals for B can be used to determine the expected range. For example, the UAV and ALS measurements are shown to be similar if the B value of their regression is close to unity. A larger value means that the values are relatively large, and a lower value means that they are relatively low.
The Hmax B determined for the ALS data was 0.978, and the 95% confidence interval was in the range 0.953~1.002. The average was about 2% less than the fieldwork data, suggesting that they were similar. The Hmax of B calculated for the UAV data was 1.083, representing an overestimation of about 8%. The 95% confidence interval was in the range 1.053~1.114. H95 was 1.076 and the 95% confidence interval was in the range 1.046~1.106, representing an overestimation of 7%.
The agreement in tree height data was in the order ALS Hmax, ALS H95, UAV H95, and UAV Hmax. In general, UAV measurements had larger tree heights than comparable measurements made using ALS [32,33,34]. When the tree height measurements using UAV and ALS were compared to fieldwork using a zero offset linear regression method similar behavior was noticed.
As shown in Table 9, the canopy cover density calculated using ALS was 10%~30% less than comparable measurements with the UAV. For the same canopy cover density class, all UAV CC2m were the same, but the ALS CC2m and UAV CCmean were in agreement for three tree species. The ALS CCmean only agreed for one tree species. Therefore, UAV CC2m produced the best measurement of the forest canopy cover density.
The different techniques were assigned the following order of canopy cover density similarity: UAV CC2m, UAV CCmean, ALS CC2m, and ALS CCmean. The canopy cover calculated using LIDAR differed from estimates using traditional methods, such as fieldwork, or aerial and satellite imagery. The canopy cover calculated using LIDAR was overestimated in areas with a low canopy coverage (less than 30%), but underestimated in areas with a high coverage (the upper 50%). The mean difference in canopy cover estimates was in the range −10% (canopy coverage <30%) to −20% (upper 30% of canopy coverage data) [35].

3.4. Comparison of Tree Height and Canopy Cover Density Using the Forest Type Map and Fieldwork Data in Same Polygon

The greatest difference is between tree height, and the smallest difference is between canopy cover density values (Table 10). The greatest difference in tree height calculated during our fieldwork and recorded on the forest type map was between 1.5 m and 9.2 m, while the greatest class difference was from 1 to 5. The greatest difference in diameter at breast height was one class, with a difference of 13.2 cm to 15.0 cm. The difference in estimated tree age was 1~3 classes and 14.8~27 years. The attributes recorded in the forest type map were mostly underestimated according to our fieldwork, except for canopy cover density that demonstrated a good agreement.
Map makers can find the height of AH and PD trees according to their base and top. Based on the forest type map that were produced using fieldwork and a digital stereo plotter, the tree height of a PD can be calculated within the tolerance of ±2.0 m, which is more accurate than LL and PK. The tree types can be ordered according to the difference in diameter at breast height as PD, LL, AH, and PK. This is similar to the order according to age: LL, PD, AH, and PK. The AH and PK studied during our fieldwork were in a valley, near a stream. Typically, trees are taller in a valley [36], so the size of AH and PK is expected to be overestimated.

3.5. Tree Height and Canopy Cover Density Recorded in The Forest Type Map Against Measurements Using UAV and ALS

As shown in Table 11, the differences between the AH tree height recorded in the forest type map, and the ALS and UAV data recorded here are less than 6.2 m and 8.6 m, respectively. LL measured using ALS was estimated to be less than 0.2 m, and the UAV was about 4.3 m. PD measured using ALS was estimated to be less than 1.7 m and the UAV was about 2.4 m. PK measured using ALS was estimated to be 7 m while UAV was about 9.3 m.
The tree height calculated using a UAV was greater than that measured with ALS. As such, the forest type map will underestimate tree heights as in Table 12. The correlation between ALS and UAV data and the forest type map tree height was inverse and between −0.286 and −0.151. The correlations for Hmax, H95, and Hmean between UAV and ALS measurements were in the range 0.836~0.892. These data indicated that the UAV and ALS data for tree height are rigorous, thus, insinuating a change of measurement technique for the forest type map.
However, the forest type map makers used a 25 cm GSD aerial photograph taken by the Korean National Geographic Information Institute via the 3 point method [2]. It is difficult to identify the tops of trees and the ground level when using a GSD based photograph. Moreover, implementation of the 3 point method requires a high level of experience and skill. After verification through fieldwork, we found that the forest type map had tree height errors [37].
The tree height recorded in the forest type map would have been within ±2.0 m tolerance if the stand was in low canopy cover density forest, or where the bottom of a tree could be easily found. But high canopy cover density areas were out of tolerance, and our fieldwork data identified many differences in tree heights. Generally, the 3 point method has been used to draw 3800 maps from digital stereo plotter. The ALS and UAV methods used here are expensive and require many man hours. It is both quicker and cheaper to measure tree height using the 3 point method, which is why it has been used by the forest type map makers.
The differences in diameter at breast height and tree age classes resulted from long distance naked eye measurements as well as problems with the interpretation of aerial photographs [24]. Excluding LIDAR, there was high confidence in the 3 point technique, and it is being used for tree height measurements by most forestry researchers.
As shown in Figure 5, the tree heights of the 84 polygons in the forest type map are underestimated between −2.16 m and −0.15 m, with a standard deviation of ±4.62 m and a class difference of ±2~3. The values were greater for natural forest species (EB, MM, PD, QA, QM, QQ, QV) than for artificial forest (AH, LL, PK, PO). The trees in artificial forests are planted around the same time, and thus their tree heights are constant. In contrast, natural forests grow over time, and thus, the standard deviation is relatively large. Over the years, the standard deviation and range of artificially planted PKs have largely been accurately estimated.
As shown in Table 13, the canopy cover density class consistency across 84 stands was 27.4% for ALS CC2m, 69.04% for UAV CC2m, 3.6% for ALS CCmean, and 39.3% for UAV CCmean. UAV CC2m was the best while ALS CCmean was the worst canopy cover density measurement.
Individual tree heights agreed well with field measurements [38]. And exact crown width data can be distinguished using high canopy cover density LIDAR point clouds [39]. Uncertainty factors such as artificial measurement errors and inconsistent standards often affect ground measurements of crown amplitude, which results in low accuracy CC estimations [40].

4. Conclusions

In this study, a set of tree attributes were extracted which have the potential to aid us investigate better techniques amongst ALS, UAV, and fieldwork, capable of providing accurate data (standard metrics) for the improvement of the forest type map. We utilized statistical analyses to assess and derive the ALS and UAV data; validate with tree height and canopy cover data measured during the fieldwork in the Singyeri Forest of Gyeongju, and then correlated with the existent the forest type map’s attributes.
This work proposes a new technique for the forest type map initially developed based on the 3 point method using digital stereo plotter that considers the average of high, medium and low tree heights from each stand; via a 25 cm GSD aerial photograph with a ±2 cm tolerance.
The GSD was set to 8.95 cm/pixel during imaging to ascertain a consistent average point density comparable between UAV and ALS data. The digital aerial photogrammetry image processing was used to merge the UAV and ALS data; to normalize the tree height and enables the canopy cover and tree height percentiles, mean, minimum and maximum be computed.
The height measurements for UAV and ALS demonstrated stronger correlation greater than 0.85 in the higher percentiles (H95 and Hmax) while the density parameters CC3, CC9, CCmean and CC2m equals 0.246, 0.208, 0.324, and 0.305 respectively displayed some agreement.
The Hmax B determined for the ALS data was 0.978, and the 95% confidence interval was in the range 0.953–1.002. The average was about 2% less than the fieldwork data, suggesting great similarity. The Hmax of B calculated for the UAV data was 1.083, representing an overestimation of about 8%. The 95% confidence interval was in the range 1.053–1.114. H95 was 1.076 and the 95% confidence interval was in the range 1.046–1.106, representing an overestimation of 7%. However, the correlation coefficients of the tree height measured using UAV, ALS, and fieldwork in the range 0.865~0.899 affirm that the results of this study are robust.
The tree height for the forest type map were inverse ranging from −0.286 to −0.151 while the correlation for Hmax, H95, and Hmean between UAV and ALS ranged from 0.836 to 0.892. The ALS calculated canopy cover was 20% smaller than UAV values when canopy cover was above 80% and when canopy cover was less than 80%, ALS calculated canopy cover was 30% to 50% smaller than UAV values. This justifies that UAV and ALS tree height and canopy cover measurements will reliably be a better data acquisition method for the forest type map.
Note that LIDAR data is vulnerable to uncertainties in winter when evaluating canopy density because of the shaded leaves while in summer those leaves prevent a laser beam from penetrating to the tree bottom during the tree height measurement, registering inaccuracies. Additionally, it is difficult to identify the tops of trees and ground when using a GSD photograph. Thus, a tree height recorded in the forest type map could be within tolerance in case of low-density forest or accessible tree bottoms.
However, a tree height values on the forest type map are underestimated, and the measurement technique should be changed. Therefore, we suggest that forest managers adopt a mixed method whereby highest percentile. ALS Hmax, H95 or 3 point method be used for a tree heights, UAV (CC2m) for a canopy cover density, and fieldwork for an age and a diameter at breast height data, to produce accurate the forest type map.

Author Contributions

Formal analysis, C.-y.O., N.W.N. and C.C.; data curation, S.S., C.J. and C.C.; writing—original draft preparation, S.S. and C.C.; writing—review and editing, C.J., N.W.N.; visualization, C.J. and C.-y.O.; supervision, C.C. All authors have read and agreed to the published version of the manuscript.

Funding

This research received no external funding.

Acknowledgments

This work was supported by the BK21 plus Project of the Graduate School of Earth Environmental Hazard System.

Conflicts of Interest

The authors declare no conflict of interest.

References

  1. Korea Statistical Information Service Forest Area and Growing Stock Statics. Available online: http://index.go.kr/potal/main/EachDtlPageDetail.do?idx_cd=1300 (accessed on 14 August 2019).
  2. Kim, K.; Mun, G.; Lee, J.; Kim, C.; Lim, J. Application of Remote Sensing Data for Advancing Forest Type Map; Research Report; Korea National Institute of Forest Service: Seoul, Korea, 2016; Volume 30, ISBN 979-11-6019-030-4.
  3. Hernández-Clemente, R.; Navarro-Cerrillo, R.M.; Ramírez, F.J.R.; Hornero, A.; Zarco-Tejada, P.J. A Novel Methodology to Estimate Single-Tree Biophysical Parameters from 3D Digital Imagery Compared to Aerial Laser Scanner Data. Remote Sens. 2014, 6, 11627–11648. [Google Scholar] [CrossRef] [Green Version]
  4. Brede, B.; Lau, A.; Bartholomeus, H.M.; Kooistra, L. Comparing RIEGL RiCOPTER UAV LiDAR Derived Canopy Height and DBH with Terrestrial LiDAR. Sensors 2017, 17, 2371. [Google Scholar] [CrossRef] [PubMed]
  5. Andersen, H.-E.; Reutebuch, S.E.; McGaughey, R.J. A rigorous assessment of tree height measurements obtained using airborne LIDAR and conventional field methods. Can. J. Remote Sens. 2006, 32, 355–366. [Google Scholar] [CrossRef]
  6. Clark, M.L.; Clark, D.B.; Roberts, D.A. Small-footprint lidar estimation of sub-canopy elevation and tree height in a tropical rain forest landscape. Remote Sens. Environ. 2004, 91, 68–89. [Google Scholar] [CrossRef]
  7. Kwak, D.-A.; Lee, W.-K.; Lee, J.-H.; Biging, G.S.; Gong, P. Detection of individual trees and estimation of tree height using LiDAR data. J. For. Res. 2007, 12, 425–434. [Google Scholar] [CrossRef]
  8. Falkowski, M.J.; Smith, A.M.S.; Hudak, A.T.; Gessler, P.E.; Vierling, L.A.; Crookston, N.L. Automated estimation of individual conifer tree height and crown diameter via two-dimensional spatial wavelet analysis of lidar data. Can. J. Remote Sens. 2006, 32, 153–161. [Google Scholar] [CrossRef] [Green Version]
  9. Zarco-Tejada, P.J.; Diaz-Varela, R.; Angileri, V.; Loudjani, P. Tree height quantification using very high resolution imagery acquired from an unmanned aerial vehicle (UAV) and automatic 3D photo-reconstruction methods. Eur. J. Agron. 2014, 55, 89–99. [Google Scholar] [CrossRef]
  10. Panagiotidis, D.; Abdollahnejad, A.; Surový, P.; Chiteculo, V. Determining tree height and crown diameter from high-resolution UAV imagery. Int. J. Remote Sens. 2017, 38, 2392–2410. [Google Scholar] [CrossRef]
  11. Thiel, C.; Schmullius, C. Comparison of UAV photograph-based and airborne lidar-based point clouds over forest from a forestry application perspective. Int. J. Remote Sens. 2017, 38, 2411–2426. [Google Scholar] [CrossRef]
  12. Brandtberg, T.; Warner, T.A.; Landenberger, R.E.; McGraw, J.B. Detection and analysis of individual leaf-off tree crowns in small footprint, high sampling density lidar data from the eastern deciduous forest in North America. Remote Sens. Environ. 2003, 85, 290–303. [Google Scholar] [CrossRef]
  13. Persson, A.E.G.; Holmgren, J.; Soederman, U. Detecting and measuring individual trees using an airborne laser scanner. Photogramm. Eng. Remote Sens. 2002, 68, 925–932. [Google Scholar]
  14. Isenburg, M. Bayes Strip Align 2.1 Software Manual. Available online: http://bayesmap.com/wp-content/uploads/StripAlign2manual.pdf (accessed on 2 July 2019).
  15. Isenburg, M. LAS File Processing Using LASTOOLS. Available online: ftp://ftp.lmic.state.mn.us/pub/data/elevation/lidar/LAS_File_Processing_Using_LASTOOLS.pdf (accessed on 29 December 2019).
  16. Shivakoti, G.; Pradhan, U.; Helmi, H. Redefining Diversity and Dynamics of Natural Resources Management in Asia, Volume 1: Sustainable Natural Resources Management in Dynamic Asia; Elsevier: Amsterdam, The Netherlands, 2016; ISBN 978-0-12-810470-5. [Google Scholar]
  17. Berni, J.; Zarco-Tejada, P.J.; Suarez, L.; Fereres, E. Thermal and Narrowband Multispectral Remote Sensing for Vegetation Monitoring from an Unmanned Aerial Vehicle. IEEE Trans. Geosci. Remote Sens. 2009, 47, 722–738. [Google Scholar] [CrossRef] [Green Version]
  18. Shervais, K.; Dietrich, J.; Lauer, I. Structure from Motion (SfM) Photogrammetry Data Exploration and Processing Manual. Available online: https://kb.unavco.org/kb/file.php?id=781 (accessed on 29 December 2019).
  19. Sanz-Ablanedo, E.; Chandler, J.; Rodríguez-Pérez, J.; Ordóñez, C. Accuracy of Unmanned Aerial Vehicle (UAV) and SfM Photogrammetry Survey as a Function of the Number and Location of Ground Control Points Used. Remote Sens. 2018, 10, 1606. [Google Scholar] [CrossRef] [Green Version]
  20. Edson, C.; Wing, M.G. Airborne Light Detection and Ranging (LiDAR) for Individual Tree Stem Location, Height, and Biomass Measurements. Remote Sens. 2011, 3, 2494–2528. [Google Scholar] [CrossRef] [Green Version]
  21. Wallace, L.; Lucieer, A.; Watson, C.; Turner, D. Development of a UAV-LiDAR System with Application to Forest Inventory. Remote Sens. 2012, 4, 1519–1543. [Google Scholar] [CrossRef] [Green Version]
  22. White, J.; Stepper, C.; Tompalski, P.; Coops, N.; Wulder, M. Comparing ALS and Image-Based Point Cloud Metrics and Modelled Forest Inventory Attributes in a Complex Coastal Forest Environment. Forests 2015, 6, 3704–3732. [Google Scholar] [CrossRef]
  23. Cao, L.; Liu, H.; Fu, X.; Zhang, Z.; Shen, X.; Ruan, H. Comparison of UAV LiDAR and Digital Aerial Photogrammetry Point Clouds for Estimating Forest Structural Attributes in Subtropical Planted Forests. Forests 2019, 10, 145. [Google Scholar] [CrossRef] [Green Version]
  24. Kim, K.M.; Kim, C.M.; Kim, S.M.; Jung, J.H.; Lee, S.H.; KIm, J.C.; RYU, J.H.; Shim, U.B.; Kim, J.S.; Seo, S.W.; et al. 4th Forest Type Map; Korea Forest Research Institute: Seoul, Korea, 2009; p. 8. [Google Scholar]
  25. Lisein, J.; Pierrot-Deseilligny, M.; Bonnet, S.; Lejeune, P. A Photogrammetric Workflow for the Creation of a Forest Canopy Height Model from Small Unmanned Aerial System Imagery. Forests 2013, 4, 922–944. [Google Scholar] [CrossRef] [Green Version]
  26. Vastaranta, M.; Wulder, M.; White, J.; Pekkarinen, A.; Tuominen, S.; Ginzler, C.; Kankare, V.; Holopainen, M.; Hyyppä, J.; Hyyppä, H. Airborne laser scanning and digital stereo imagery measures of forest structure: Comparative results and implications to forest mapping and inventory update. Can. J. Remote Sens. 2013, 39, 382–395. [Google Scholar] [CrossRef]
  27. Suárez, J.C.; Ontiveros, C.; Smith, S.; Snape, S. Use of airborne LiDAR and aerial photography in the estimation of individual tree heights in forestry. Comput. Geosci. 2005, 31, 253–262. [Google Scholar] [CrossRef]
  28. Leberl, F.; Irschara, A.; Pock, T.; Meixner, P.; Gruber, M.; Scholz, S.; Wiechert, A. Point Clouds. Photogramm. Eng. Remote Sens. 2010, 76, 1123–1134. [Google Scholar] [CrossRef]
  29. Baltsavias, E.P. A comparison between photogrammetry and laser scanning. ISPRS J. Photogramm. Remote Sens. 1999, 54, 83–94. [Google Scholar] [CrossRef]
  30. Haala, N.; Hastedt, H.; Wolf, K.; Ressl, C.; Baltrusch, S. Digital Photogrammetric Camera Evaluation–Generation of Digital Elevation Models. Photogramm. Fernerkund. Geoinf. 2010, 2010, 99–115. [Google Scholar] [CrossRef] [PubMed] [Green Version]
  31. Popescu, S.C.; Wynne, R.H.; Nelson, R.F. Estimating plot-level tree heights with lidar: Local filtering with a canopy-height based variable window size. Comput. Electron. Agric. 2002, 37, 71–95. [Google Scholar] [CrossRef]
  32. Bohlin, J.; Wallerman, J.; Fransson, J.E.S. Forest variable estimation using photogrammetric matching of digital aerial images in combination with a high-resolution DEM. Scand. J. For. Res. 2012, 27, 692–699. [Google Scholar] [CrossRef]
  33. Järnstedt, J.; Pekkarinen, A.; Tuominen, S.; Ginzler, C.; Holopainen, M.; Viitala, R. Forest variable estimation using a high-resolution digital surface model. ISPRS J. Photogramm. Remote Sens. 2012, 74, 78–84. [Google Scholar] [CrossRef]
  34. White, J.; Wulder, M.; Vastaranta, M.; Coops, N.; Pitt, D.; Woods, M. The Utility of Image-Based Point Clouds for Forest Inventory: A Comparison with Airborne Laser Scanning. Forests 2013, 4, 518–536. [Google Scholar] [CrossRef] [Green Version]
  35. Ma, Q.; Su, Y.; Guo, Q. Comparison of Canopy Cover Estimations from Airborne LiDAR, Aerial Imagery, and Satellite Imagery. IEEE J. Sel. Top. Appl. Earth Obs. Remote Sens. 2017, 10, 4225–4236. [Google Scholar] [CrossRef]
  36. Bondarchuk, S.N. Study of the Young Growth of Main Forest-forming Coniferous Species in the Primary Forests of the Sikhote-Alin Nature Reserve. Achiev. Life Sci. 2015, 9, 37–50. [Google Scholar] [CrossRef] [Green Version]
  37. Hwang, S.-R.; Lee, M.-J.; Lee, I.-P. Detection of Individual Trees and Estimation of Mean Tree Height using Airborne LIDAR Data. J. Korea Spat. Inf. Soc. 2012, 20, 27–38. [Google Scholar]
  38. Shin, P.; Sankey, T.; Moore, M.; Thode, A. Evaluating Unmanned Aerial Vehicle Images for Estimating Forest Canopy Fuels in a Ponderosa Pine Stand. Remote Sens. 2018, 10, 1266. [Google Scholar] [CrossRef] [Green Version]
  39. Wu, X.; Shen, X.; Cao, L.; Wang, G.; Cao, F. Assessment of Individual Tree Detection and Canopy Cover Estimation using Unmanned Aerial Vehicle based Light Detection and Ranging (UAV-LiDAR) Data in Planted Forests. Remote Sens. 2019, 11, 908. [Google Scholar] [CrossRef] [Green Version]
  40. Korhonen, L.; Korhonen, K.; Rautiainen, M.; Stenberg, P. Estimation of forest canopy cover: A comparison of field measurement techniques. Silva Fenn. 2006, 40, 577–588. [Google Scholar] [CrossRef] [Green Version]
Figure 1. (a) The location of the study area marked on the forest type map, (b) The ground control points and the fieldwork points on an Unmanned Aerial Vehicle (UAV) orthoimages, (c) Aerial LIDAR Scanner’s (ALS’s) Digital Elevation Models hillshade (d) LL photo in a fieldwork, (e) Abies holophylla (AH) photo in a fieldwork.
Forests 11 00241 g001
Figure 2. Research flowchart.
Forests 11 00241 g002
Figure 3. (a) Tree height and (b) canopy cover density statistics based on Normalized UAV and ALS point clouds (Hmean, Hmax, H25, H50, H75, H95, CC2m, CCmean, CC3, CC5, CC7, and CC9 based on Table 2.).
Forests 11 00241 g003
Figure 4. Scatter plot for a comparing the measured tree height using Hmax and H95 from UAV and ALS with Fieldwork result. a) Hmax-UAV; b) Hmax-ALS; c) H95 -UAV; d) H95-ALS
Forests 11 00241 g004
Figure 5. Differences in tree heights between tree height class and ALS Hmax according to stand. (AH: Abies holophylla, EB: Etc. broadleaf, LL: Larix kaempferi, MM: Mixed forest, PD: Pinus densiflora, PK: Pinus koraiensis, PO: Populous, QA: Quercus acutissima, QM: Quercus mongolica, QQ: Etc. Quercus, QV: Quercus variabilis).
Forests 11 00241 g005
Table 1. Aerial Light Detection and Ranging (LIDAR) Scanner and UAV point clouds statistic.
ItemPoint CountPercent (%)Z Min (m)Z Max (m)Density
(point·m−2)
ALSUAVALSUAVALSUAVALSUAVALSUAV
1st12,447,16316,031,828 67.59100.00198.0198.6384.1384.313.217.0
2nd5,094,477 27.66 198.0 380.2 5.4
3rd830,550 4.51 198.1 374.4 0.9
4th42,842 0.23 202.1 367.7 0.0
Single7,355,06416,031,82839.94100.00198.0198.6383.3384.37.817.0
All18,415,03216,031,828100.00100.00198.0198.6384.1384.319.517.0
Table 2. Standard tree metrics [16] collected using UAV and ALS.
Tree Height (Above 2m from Ground)Canopy Cover Density (Above 2m from Ground)
Standard MetricDescriptionStandard MetricDescription
PercentilesH25Above 25th heightPercentilesCC3Above 25th canopy cover
H50Above 50th heightCC5Above 50th canopy cover
H75Above 75th heightCC7Above 75th canopy cover
H95Above 95th heightCC9Above 95th canopy cover
HmaxMax. heightCC2mCanopy cover above 2m
HmeanMean heightCCmeanCanopy cover above mean height
Table 3. Tree age, diameter at breast height, tree height and canopy cover density class definitions used in the forest type map of South Korea.
Tree AgeClassClass DefinitionDiameter at Breast HeightClassClass Definition
1st11~10years oldSeedling0< 6cm
2nd211~20years oldSmall 16~18cm
3rd321~30years oldMedium218~30cm
4th431~40years oldLarge 3> 30cm
5th541~50years oldTree Height 2 m interval Class rounded down
6th651~60years oldCanopy cover densityClassClass definition
7th761~70years oldLowA50% Lower cover
8th871~80years oldMediumB50%~70% cover
9th9Upper 81 years oldHighC70% upper cover
Table 4. Correlation between tree height data determined using UAV and ALS point clouds.
Tree Height CorrelationUAV
H25H50H75H95HmaxHmean
ALSH250.4780.5270.5550.5510.5460.535
H500.5880.6590.7070.7070.7040.670
H750.6740.7640.8260.8320.8300.777
H950.7090.8100.8820.8920.8920.824
Hmax0.7090.8120.8860.8980.8980.826
Hmean0.6220.6960.7450.7450.7410.708
Table 5. Correlations between UAV and ALS canopy cover density point clouds.
Canopy Cover CorrelationUAV
CC2mCCmeanCC3CC5CC7CC9
ALSCC3 0.106−0.009 0.246 0.275 0.263−0.246
CC5 0.228 0.002−0.064 0.035 0.160 0.090
CC7 0.235 0.024−0.035−0.075−0.020 0.219
CC9 0.192−0.071−0.005−0.038−0.126 0.208
CC2m 0.305−0.070−0.133−0.149 0.019 0.321
CCmean−0.003 0.324 0.224 0.076 0.087−0.035
Table 6. Descriptive statistics of field measurements of forest attributes.
FieldworkMeanMedianStdevMinMaxMeanMedianStdevMinMax
CCAH (N = 20) C: 100%PD (N = 40) C: 100%
HGT15.715.01.813.218.814.514.42.310.321.8
DBH26.426.05.916.042.037.239.07.922.051.0
AGE40.641.53.132.045.061.057.011.841.087.0
CCLL (N = 30) C: 100% PK (N = 20) C: 100%
HGT25.927.24.219.032.118.118.20.417.318.7
DBH37.938.55.723.047.026.827.03.921.034.0
AGE49.851.54.838.056.042.242.00.841.043.0
DBH (cm: diameter at breast height), HGT: (m: Lorey’s mean tree height), AGE (year: tree age), CC (canopy cover density).
Table 7. Tree height correlation coefficients between UAV and fieldwork and ALS and fieldwork.
Tree Height Fieldwork
(N = 110)
HmaxH95
UAVALSUAVALS
Correlation0.8650.8990.8670.898
Res. Mean/Stdev2.073 ± 2.702−0.020 ± 2.3971.932 ± 2.708−0.117 ± 2.440
Res. Min/Max−4.8009.400−6.5007.300−4.9009.300−6.7007.300
Table 8. Zero offset linear regression for tree heights measured using UAV, ALS, and fieldwork.
Field WorkUnstandardized Coeff.Standard Coeff. Betat95% Confidence for B
BStdevLower Upper
ByUAVALSUAVALSUAVALSUAVALSUAVALSUAVALS
Hmax1.0830.9780.0150.0120.990.9970.9879.451.0530.9531.1141.002
H951.0760.9700.0150.0130.990.9970.7277.111.0460.9451.1060.995
Table 9. Comparison of the canopy cover density CC2m and CCmean calculated by fieldwork, UAV, and ALS.
Canopy Cover Density (Unit: %)AH(N = 20)LL(N = 30)PD(N = 40)PK(N = 20)
Field WorkValueClassValueClassValueClassValueClass
>70.0 C>70.0C>70.0C>70.0C
ALSUAVALSUAVALSUAVALSUAVALSUAVALSUAVALSUAVALSUAV
CC2m77.095.6CC64.688.3BC83.182.3CC84.696.9CC
CCmean62.295.6BC53.586.2BC27.948.2AB81.696.9CC
Table 10. Differences between the fieldwork data and the forest type map records.
Na
me
Tree Height(m) (Class1), Value)Canopy Cover Density(%) (Class2), Value)
FieldworkMapDiff ClassFieldworkMapDiff Class
ClassValueClassValueClassValueClassValueClassValueClassValue
AH715.7511214.4CCSame
LL1225.9919313.9CCSame
PD714.5613113.2CCSame
PK918.249515.0CCSame
(1) “Value/2 and rounded down” for tree height classification on Table 3; (2) Canopy cover density classification on Table 3.
Table 11. Comparison of tree heights according to the forest type map and fieldwork (unit: m).
Fieldwork.
Tree Height
unit: m
Forests 11 00241 i001
AH
Forests 11 00241 i002
LL
Forests 11 00241 i003
PD
Forests 11 00241 i004
PK
Forest Type Map1018128
Use byALSUAVALSUAVALSUAVALSUAV
Hmax16.2 + 3.918.7 ± 2.817.7 ± 5.622.4 ± 4.413.4 ± 4.414.5 ± 4.614.9 ± 3.817.4 ± 3.2
H9516.3 ± 3.118.5 ± 2.917.9 ± 4.822.3 ± 4.414.1 ± 3.014.3 ± 4.615.2 ± 2.717.3 ± 3.2
diff.6.2 – 6.38.5 – 8.7−0.1 – −0.34.3 – 4.41.4 – 2.12.3 – 2.56.9 – 7.29.3 – 9.4
Table 12. Tree height correlations among ALS, UAV, and Forest type map.
Tree HeightForest Type Map
Tree Height
ALSUAV
HmaxH95HmeanHmaxH95Hmean
Forest type map
tree height
1.000−0.199−0.151−0.286−0.186−0.189−0.207
ALSHmax−0.1991.0000.9440.9830.8860.8840.870
H95−0.1510.9441.0000.9270.8600.9590.836
Hmean−0.2860.9830.9271.0000.8920.8910.886
UAVHmax−0.1860.8860.8600.8921.0001.0000.995
H95−0.1890.8840.9590.8911.0001.0000.996
Hmean−0.2070.8700.8360.8860.9950.9961.000
Table 13. Differences in canopy cover density between the forest type map and ALS and UAV measurements.
Canopy Cover Density ClassALS CC2mUAV CC2mALS CCmeanUAV CCmean
ClassCountsA1)B1)C1)ABCABCABC
Forest type
map
A2)21(a)1(b)0(c)002110101
B2)158(d)5(a)2(b)22111320636
C2)6716(f)34(d)17(a)29566250221629
Differences(a) Same27.4%69.0%3.6%39.3%
(b) −1, (d) 13.6%, 50.0%13.1%, 13.1%1.2%, 21.4%7.1%, 26.2%
(c) −2, (f) 20.0%, 19.0%2.4%, 2.4%0.0%, 73.8%1.2%, 26.2%
(1) Classified “A, B, C” on Table 3, (2) based on Table 2 classification.

