Article

Widely Targeted Metabolomic and Transcriptomic Analyses of a Novel Albino Tea Mutant of “Rougui”

1
College of Horticulture, Fujian Agriculture and Forestry University/Key Laboratory of Tea Science in Universities of Fujian Province, Fuzhou 350002, China
2
Wuyishan Manting Rock-essence Tea Research Institute, Wuyishan, Fujian 354300, China
3
Wuyishan Lantang Rock-essence Tea Research Institute, Wuyishan, Fujian 354300, China
4
College of Pharmacy, Fujian University of Traditional Chinese Medicine, Fuzhou, Fujian 350002, China
*
Authors to whom correspondence should be addressed.
These authors contributed equally to this work.
Forests 2020, 11(2), 229; https://doi.org/10.3390/f11020229
Submission received: 6 January 2020 / Revised: 15 February 2020 / Accepted: 17 February 2020 / Published: 18 February 2020
(This article belongs to the Section Forest Ecophysiology and Biology)

Abstract

:
Albino tea mutants with specific shoot colors (white or yellow) have received increasing attention from researchers due to their unique phenotypes, beneficial metabolites, and special flavor. In this study, novel natural yellow leaf mutants of the same genetic background of “Rougui” were obtained, and the transcriptome and metabolite profiles of the yellow leaf mutant (YR) and original green cultivar (GR) were investigated. A total of 130 significantly changed metabolites (SCMs) and 55 differentially expressed genes (DEGs) were identified in YR compared to GR. The leaf coloration of YR was primarily affected by pigment metabolism including of chlorophyll, carotenoids, and flavonoids, and the co-expression of three heat shock proteins (HSPs) and four heat shock transcription factors (HSFs) may also regulate leaf coloration by affecting chloroplast biogenesis. Of the 130 SCMs, 103 showed clearly increased abundance in YR, especially nucleotides and amino acids and their derivatives and flavonoids, suggesting that YR may be an ideal albino tea germplasm for planting and breeding. Our results may help to characterize the leaf coloration and metabolic mechanism of albino tea germplasm.

1. Introduction

The tea plant (Camellia sinensis (L.) O. Kuntze) is an economical woody crop that is widely cultivated worldwide. Usually, the young green shoots of tea plants are processed into tea, which is rich in secondary metabolites such as polyphenols, amino acids, volatiles, and caffeine [1]. Recently, tea mutants with specific shoot color (white or yellow) have begun to receive increasing attention from tea researchers and manufacturers due to their unique phenotypes and metabolites, and their good economic and research value [2].
Mutants with white or yellow leaf color variations have been widely identified in herbaceous and woody plants, including rice [3], Arabidopsis [4], maize [5], ginkgo [6], and birch [7]. Chlorophyll dominates the main pigment content of normal green leaves, so these leaf color mutations are considered to be mainly caused by chlorophyll decomposition. In tea plants, based on the response to the environment, albino teas are mainly divided into two types, namely temperature-sensitive and light-sensitive, and their young shoots appear white or yellow in color. For example, “Anji Baicha” is a widely studied temperature-sensitive albino tea mutant with white shoots that turns green when the temperature is above 20 °C [8]. “Huangjinya” and “Yu-Jin-Xiang” are typical light-sensitive mutants with yellow shoots under strong light and return to green once the light intensity is reduced [9,10,11]. Previous studies have found that the shoots of albino cultivars contain higher levels of amino acids and lower levels of catechins, carotenoids, chlorophyll, and total content of most endogenous free tea aromatics than green tea cultivars [2,12,13,14,15]. However, most tea plant materials are not suitable materials for studying the molecular mechanisms of leaf color because of their different genetic backgrounds [16,17].
The total number of structurally different metabolites in plants has been reported to exceed 200,000 [18]. Therefore, performing accurate, high-throughput metabolite profiling is important for monitoring physiological changes in plants. Widely targeted metabolomics is a new method for the accurate detection of hundreds of target metabolites, extensively used in plants such as Arabidopsis [19], rice [20], tomato [21], ginkgo [22], and apple [23] to investigate the roles of their metabolites in plant growth and development. Transcriptome analysis of the yellow-leaf tea mutants “ZH1” and Huangjinya revealed that the yellow-leaf color was mainly regulated by genes related to the biosynthesis of phenylpropanoids, flavonoids, and carotenoids [10,17]. Furthermore, the integration of widely targeted metabolomics and transcriptomics has proven to be effective in revealing the biosynthetic mechanisms of key differential functional pathways in plants [21,22,23].
“Rougui” is a tea cultivar originating from Wuyi Mountain, Fujian Province, China, cultivated in many tea areas in Fujian and other provinces in China, and was approved by the Fujian Crop Variety Approval Committee in 1985 with number MS1985001. In this study, we obtained natural yellow-leaf mutants of the same genetic background of Rougui. An integration analysis of widely targeted metabolomics and transcriptomics was performed to provide a broad overview of the metabolic and transcriptional differences between the Rougui original green-leaf cultivar and its yellow-leaf mutant. These results will enhance our understanding of the metabolic mechanisms and molecular basis of leaf coloration in tea plants.

2. Materials and Methods

2.1. Tea Plant Materials

The normal green-leaf cultivar Rougui (GR) and its natural yellow-leaf mutant (YR) were grown in the field (Wuyishan City, Fujian, China; 27°39′20″ N, 117°58′13″ E). Two germplasms were watered and fertilized under the same conditions. Tea young shoots with one bud and two leaves from GR and YR were collected in the spring, and immediately frozen in liquid nitrogen and stored at −80 °C until further experiments were performed. Three independent biological replicates were employed.

2.2. Measurement of Chlorophyll a, Chlorophyll b, and Carotenoid Contents

Chlorophyll a (Chl a), chlorophyll b (Chl b), and carotenoids were extracted with 95% ethanol in 100 mg of ground samples of one bud and two leaves from GR and YR. The extracts were filtered and observed using a UV-3200 spectrophotometer (Mapada, China) at 665 nm (Chl a), 649 nm (Chl b), and 470 nm (total carotenoids). The Chl a and Chl b contents and ratio and the carotenoid content were determined according to methods previously reported [24].

2.3. Metabolite Extraction

The freeze-dried samples were extracted as in a previously reported method [20]. The quality control sample (mix) was inserted into each of the two test samples to monitor the repeatability.

2.4. Metabolite Analysis by Liquid Chromatography–Electrospray Ionization–Tandem Mass Spectrometry (LC-ESI-MS/MS)

Metabolite profiling was carried out using an LC-ESI-MS/MS system (HPLC, Shim-pack UFLC SHIMADZU CBM30A system; MS, Applied Biosystems 6500 Q TRAP). Chromatographic separation was conducted on a Waters ACQUITY UPLC HSS T3 C18 HPLC column (1.8 µm, 2.1 mm × 100 mm) using mobile phase A (deionized water with 0.04% acetic acid) and mobile phase B (acetonitrile with 0.04% acetic acid). The gradient program was as follows: 95:5 v/v at 0 min, 5:95 v/v at 11 min, 5:95 v/v at 12 min, 95:5 v/v at 12.1 min, 95:5 v/v at 15 min. The temperature was set to 40 °C and the flow rate was maintained at 0.4 mL/min.
Mass data acquisition was conducted via electrospray ionization (ESI) and the operation parameters were set as follows: turbo spray temperature was 500 °C; ion spray voltage was 5500 V; ion source gas I was set at 55 psi, gas II was set at 60 psi, curtain gas was set at 25 psi. Instrument tuning and mass calibration were performed with 10 and 100 μmol/L polypropylene glycol solutions in triple quadrupole (QQQ) and linear ion trap (LIT) modes, respectively. Declustering potential (DP) and collision energy (CE) for individual multiple reaction monitoring (MRM) transitions were performed via declustering potential (DP) and collision energy (CE) optimization [20]. A specific set of MRM transitions for each period were monitored based on the metabolites eluted within this period.

2.5. Qualitative and Quantitative Analysis

Referring to previous methods [20,21], we identified metabolites by comparing the fragmentation patterns, the retention time, and the accurate m/z value to the standards in the self-compiled database (MetWare, Wuhan, China) [20] and the public databases. Principle component analysis (PCA) and orthogonal partial least squares discrimination analysis (OPLS-DA) of identified metabolites were performed using the R package (https://www.r-project.org/). Based on the variable importance in project (VIP) score obtained by the OPLS-DA model [25], metabolites with VIP ≥ 1.0, fold change ≥ 1.5 or fold change ≤ 0.67, and p-value ≤ 0.05 were defined as significantly changed metabolites (SCMs).

2.6. RNA Isolation and Transcriptome Sequencing

Total RNAs was extracted from GR and YR using the RNAprep pure plant kit (DP441, TIANGEN, Beijing, China). The transcriptome libraries were generated using 3 μg RNA per sample and sequenced using 150 bp paired-end Illumina HiSeq4000. Clean data were obtained by removing reads containing adapter, poly-N, and low quality reads from the raw data. The filtered reads were uniquely mapped to the tea plant genome (http://tpia.teaplant.org/index.html) [1,26] using Hisat2 software [27]. FeatureCounts [28] was used to count the read numbers mapped to each gene, and fragments per kilobase million (FPKM) was calculated to quantify gene expression. The DESeq2 R package [29] was adopted to determine the differentially expressed genes (DEGs). The resulting p-values were adjusted using Benjamini and Hochberg’s method for controlling the false discovery rate (FDR). Genes with FDR ≤ 0.05 and fold change ≥ 1.5 or fold change ≤ 0.67 were considered DEGs. The DEGs were further subjected to gene ontology (GO) and Kyoto Encyclopedia of Genes and Genomes (KEGG) enrichment analyses using the clusterProfiler software [30].

2.7. Quantitative Real-Time PCR (qRT-PCR) Analysis

To validate the reliability of transcriptome results, qRT-PCR tests were performed. cDNA synthesis and qRT-PCR were performed according to a previously reported method [31]. The glyceraldehyde-3-phosphate dehydrogenase gene CsGAPDH (GE651107) was selected as an internal control, and the primers of validated genes used for qRT-PCR analysis were designed in Primer3Plus (http://www.bioinformatics.nl/cgi-bin/primer3plus/primer3plus.cgi) and are listed in Supplementary Table S1. All samples were analyzed in three biological replicates. The relative expression levels were calculated using the 2−ΔΔCT method [32].

3. Results

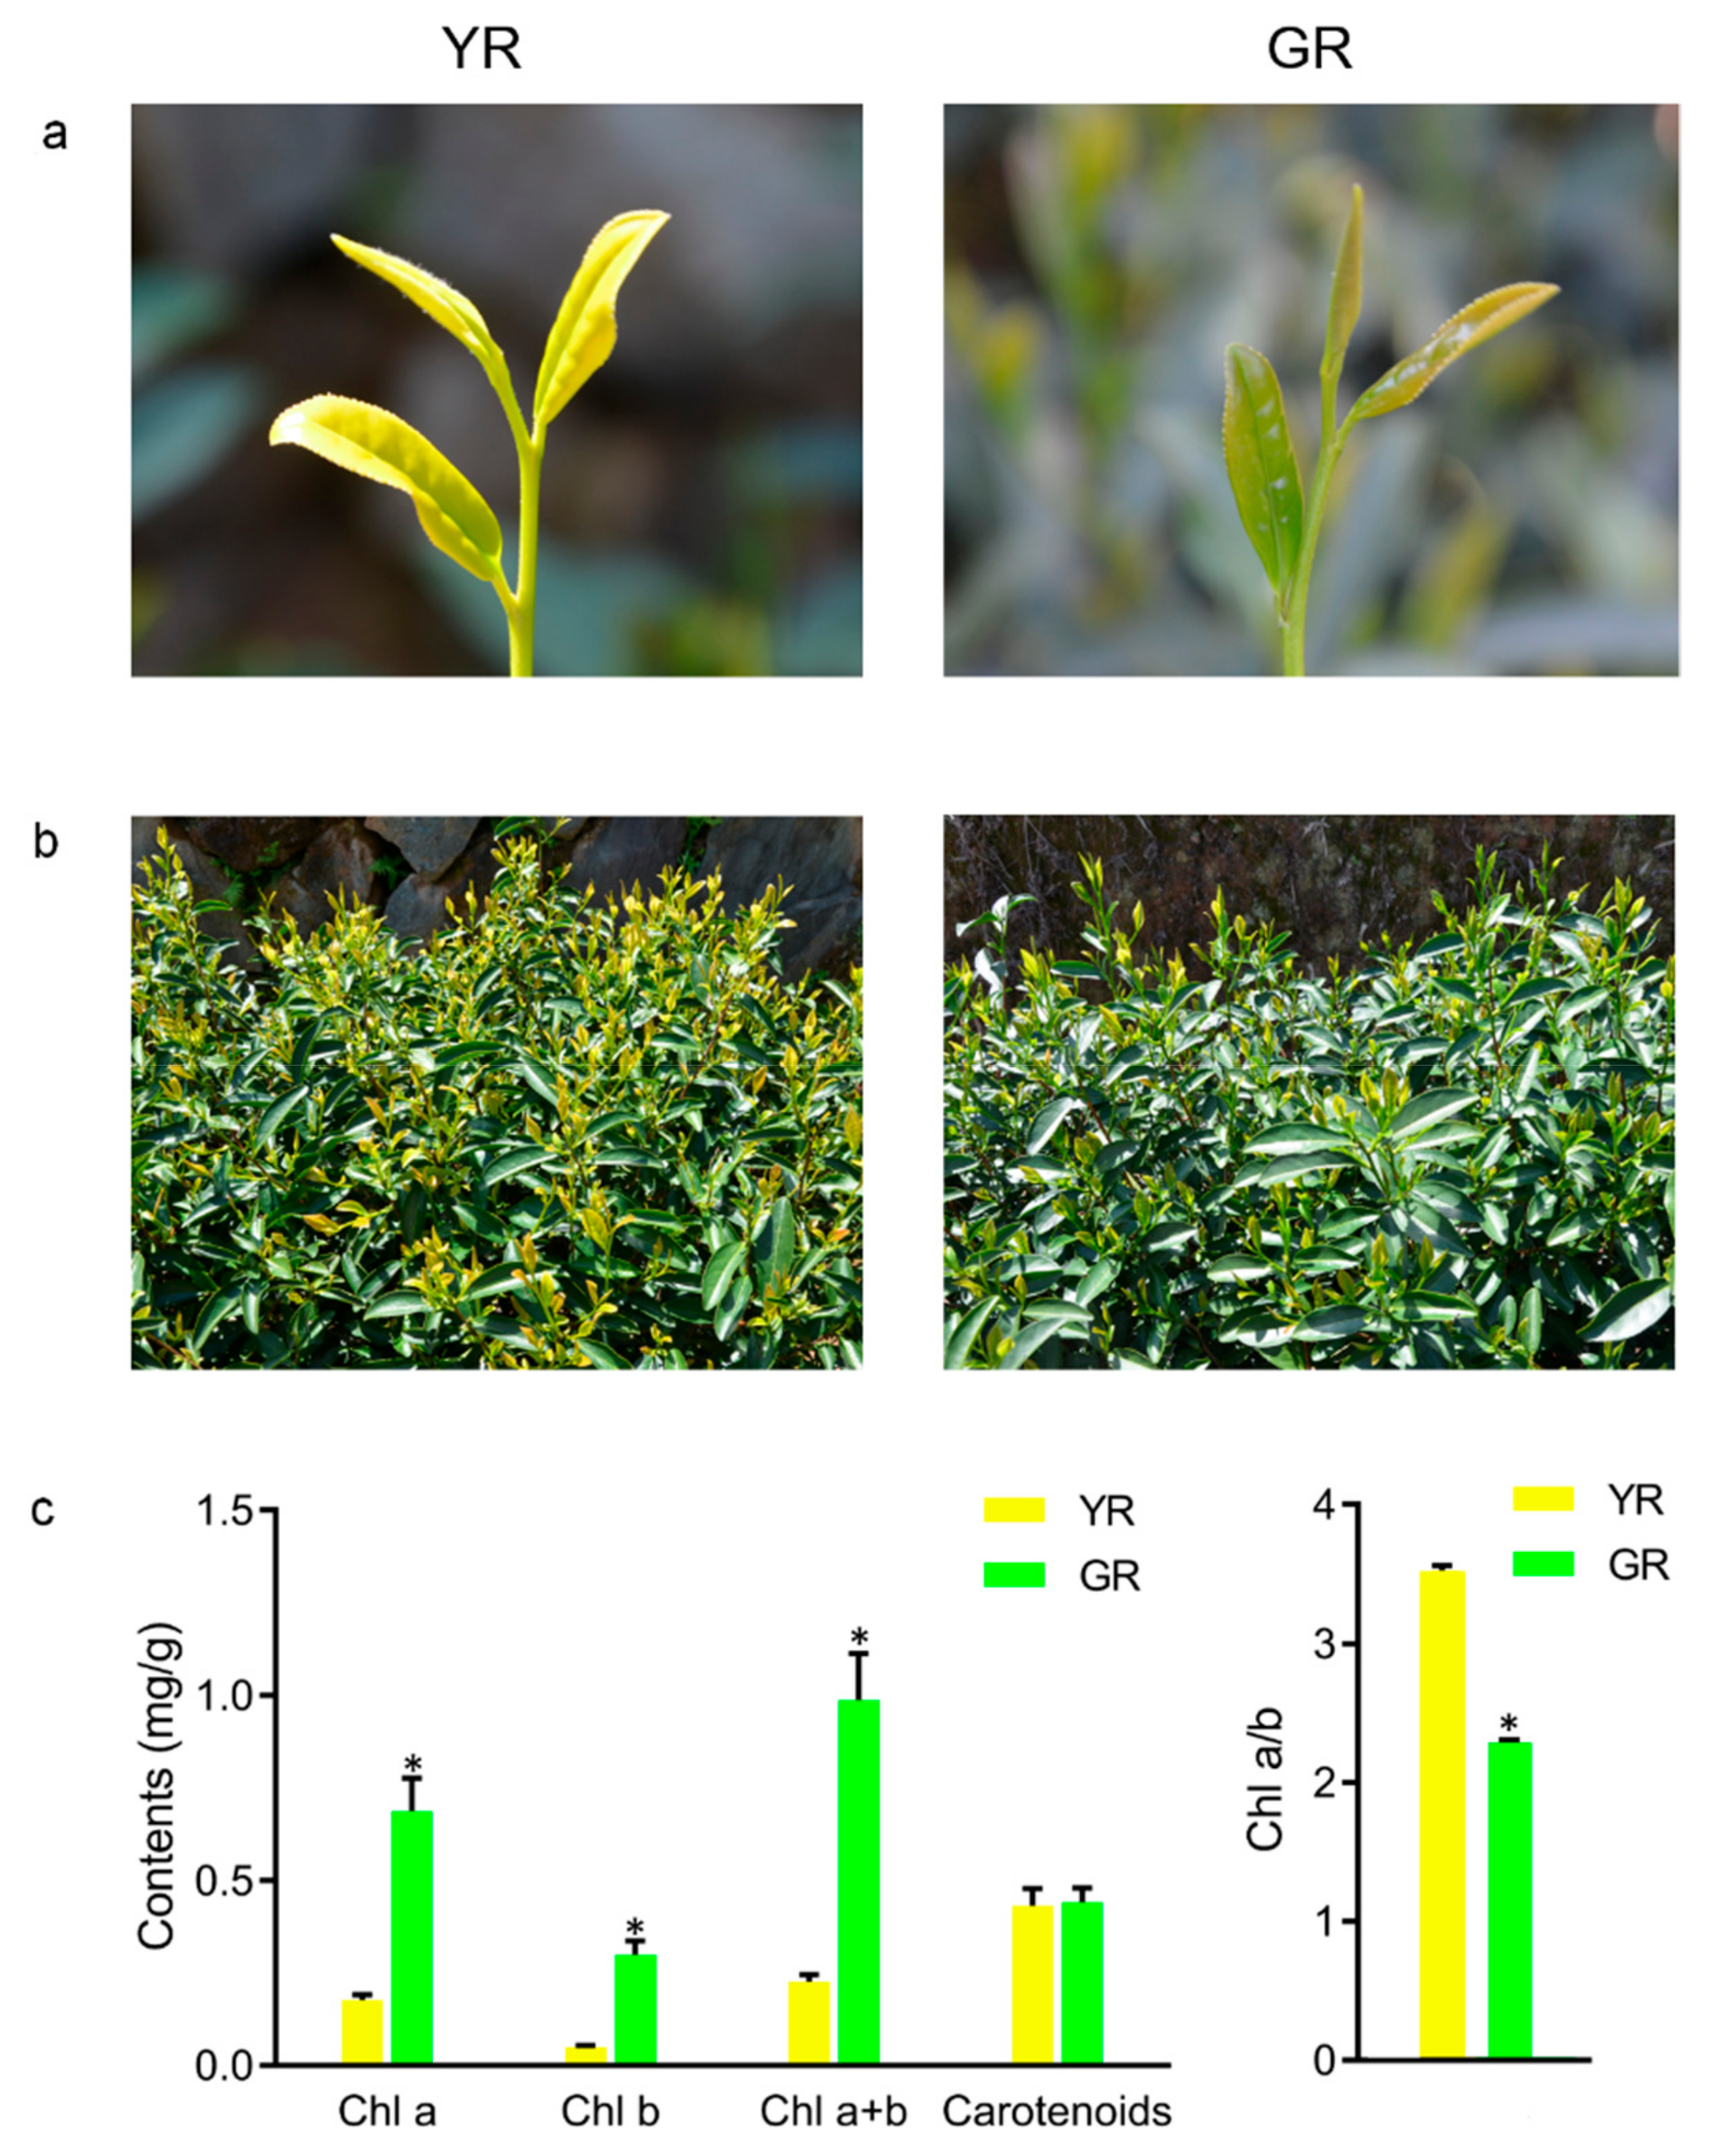
3.1. Phenotypic Characteristics of YR and GR

The yellow-leaf mutant YR presented a significantly lighter leaf color and lower Chl a and Chl b contents than its original cultivar GR (1). The Chl a/b ratio of YR was also significantly higher than GR (Figure 1c). However, no significant difference was found in carotenoid content between YR and GR (Figure 1c), indicating that the decrease in Chl a and Chl b contents might be the main cause of the leaf color mutation of YR.

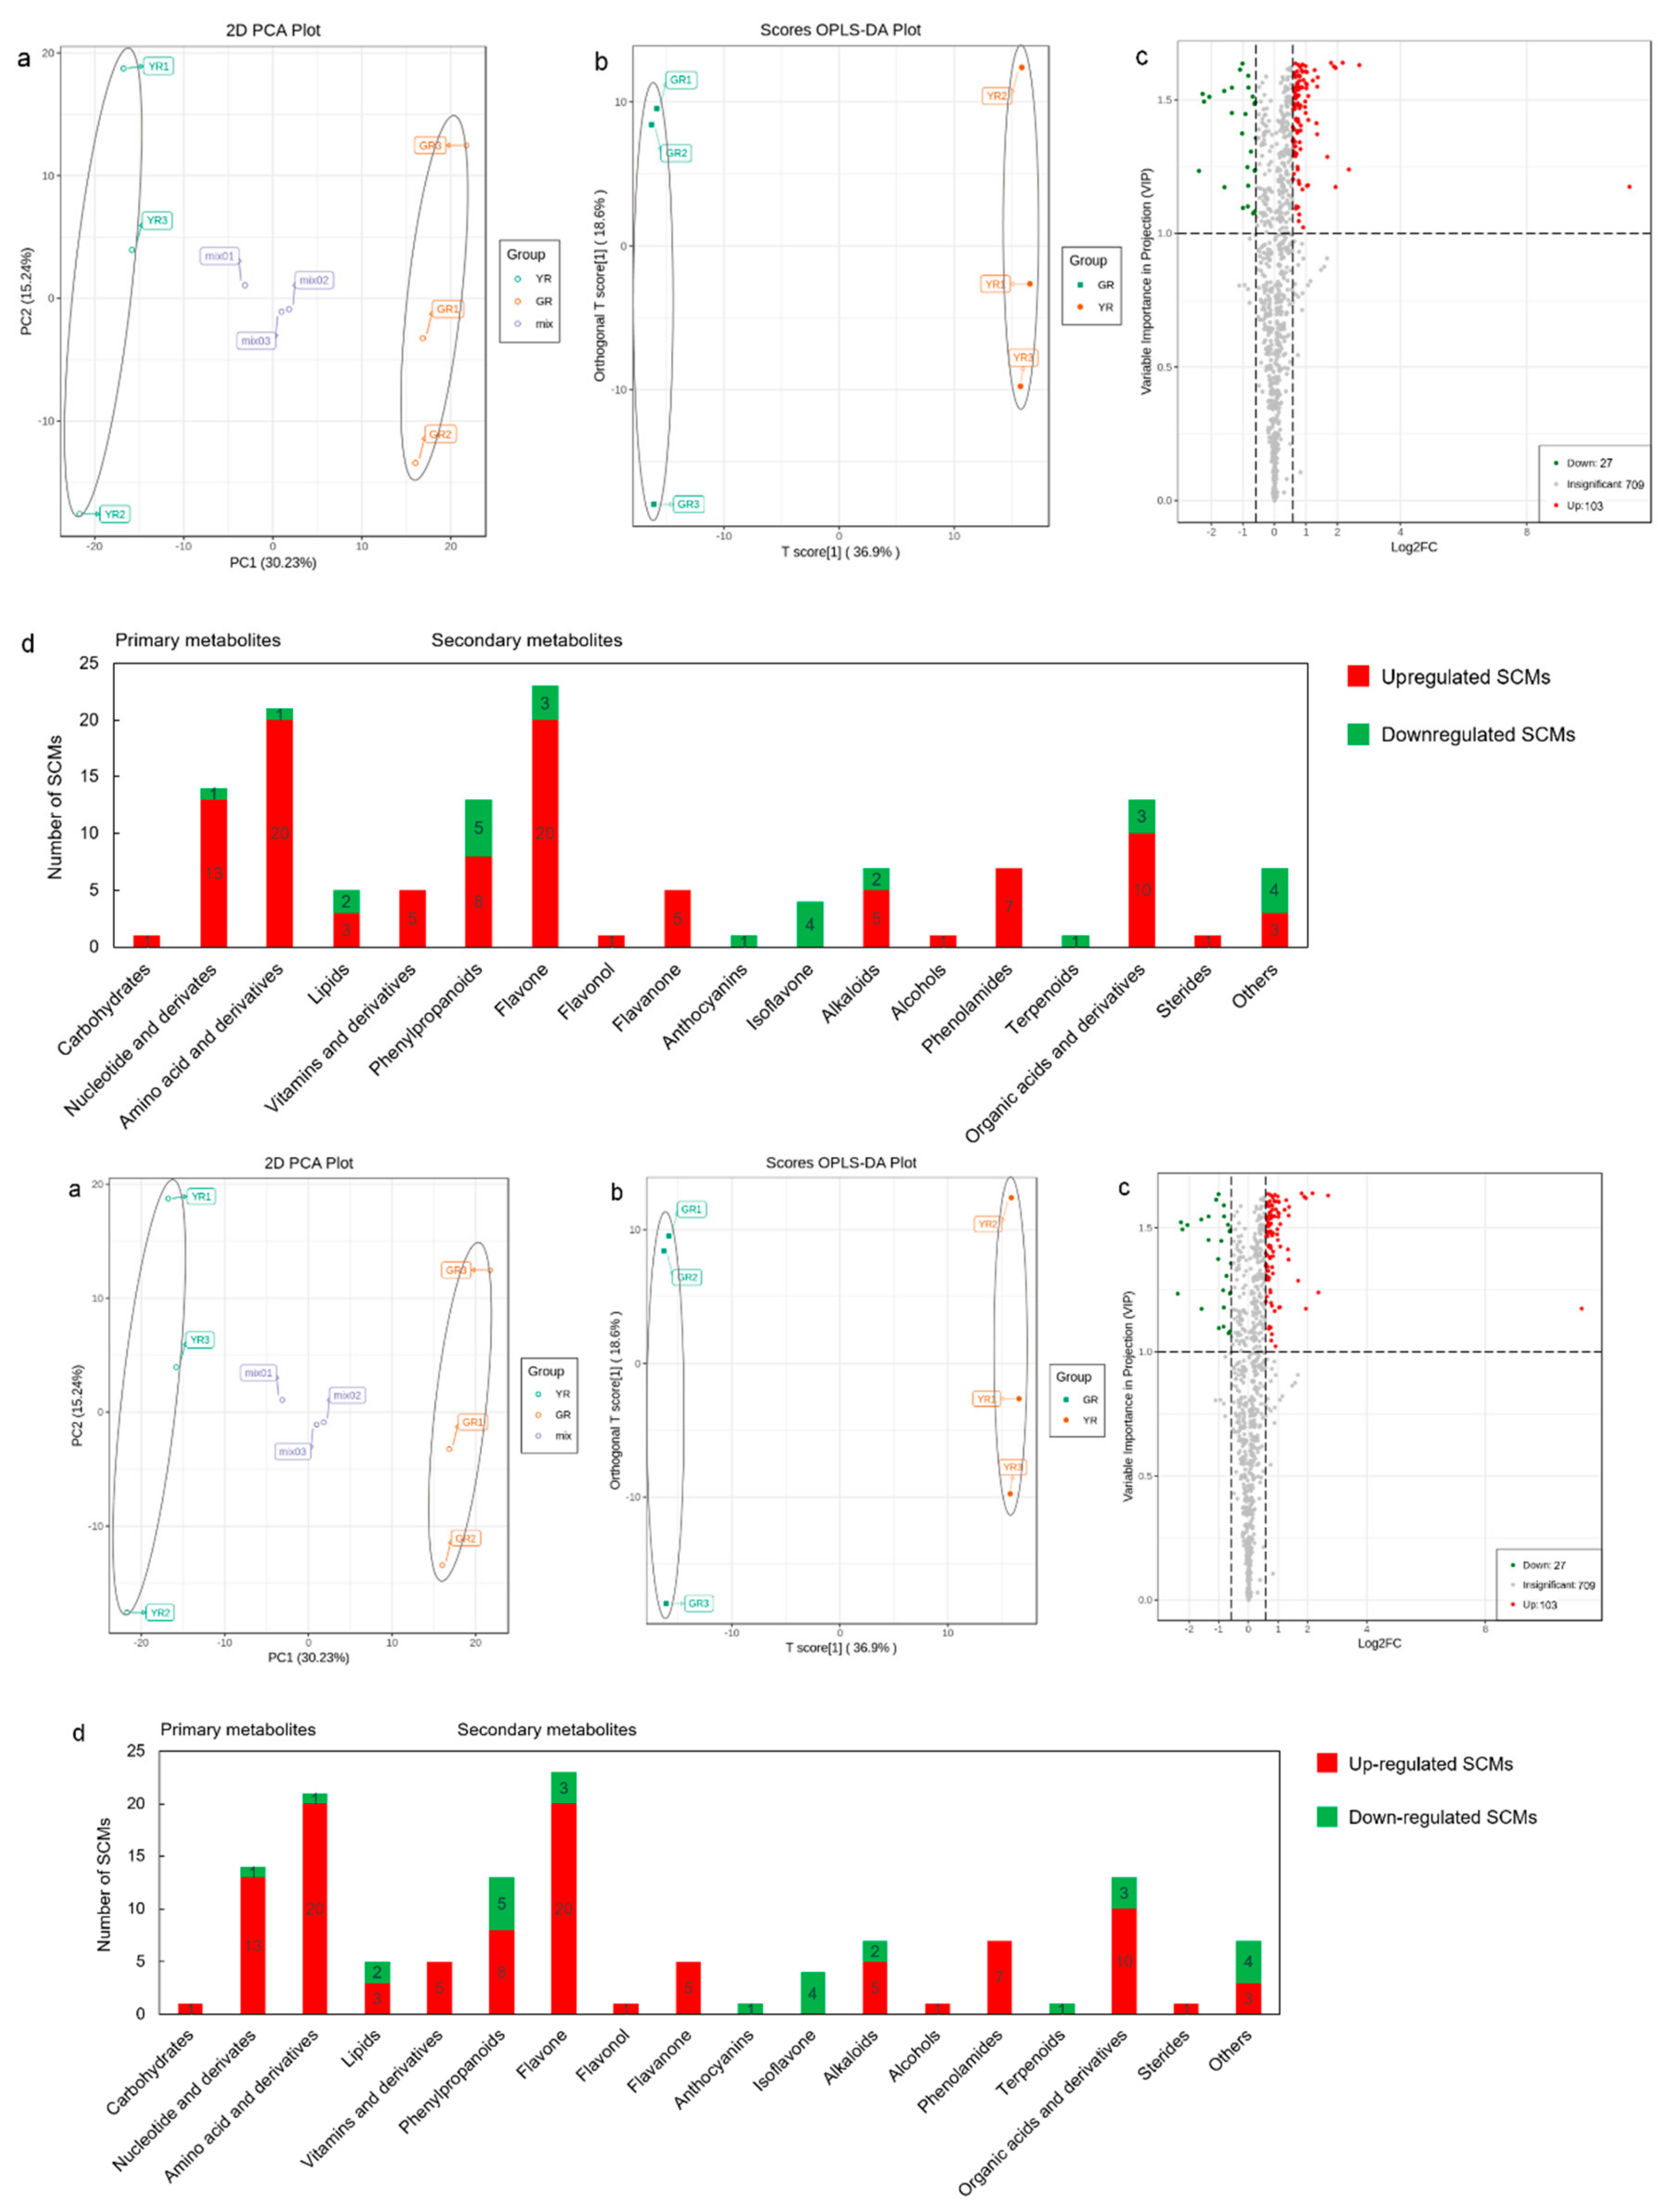
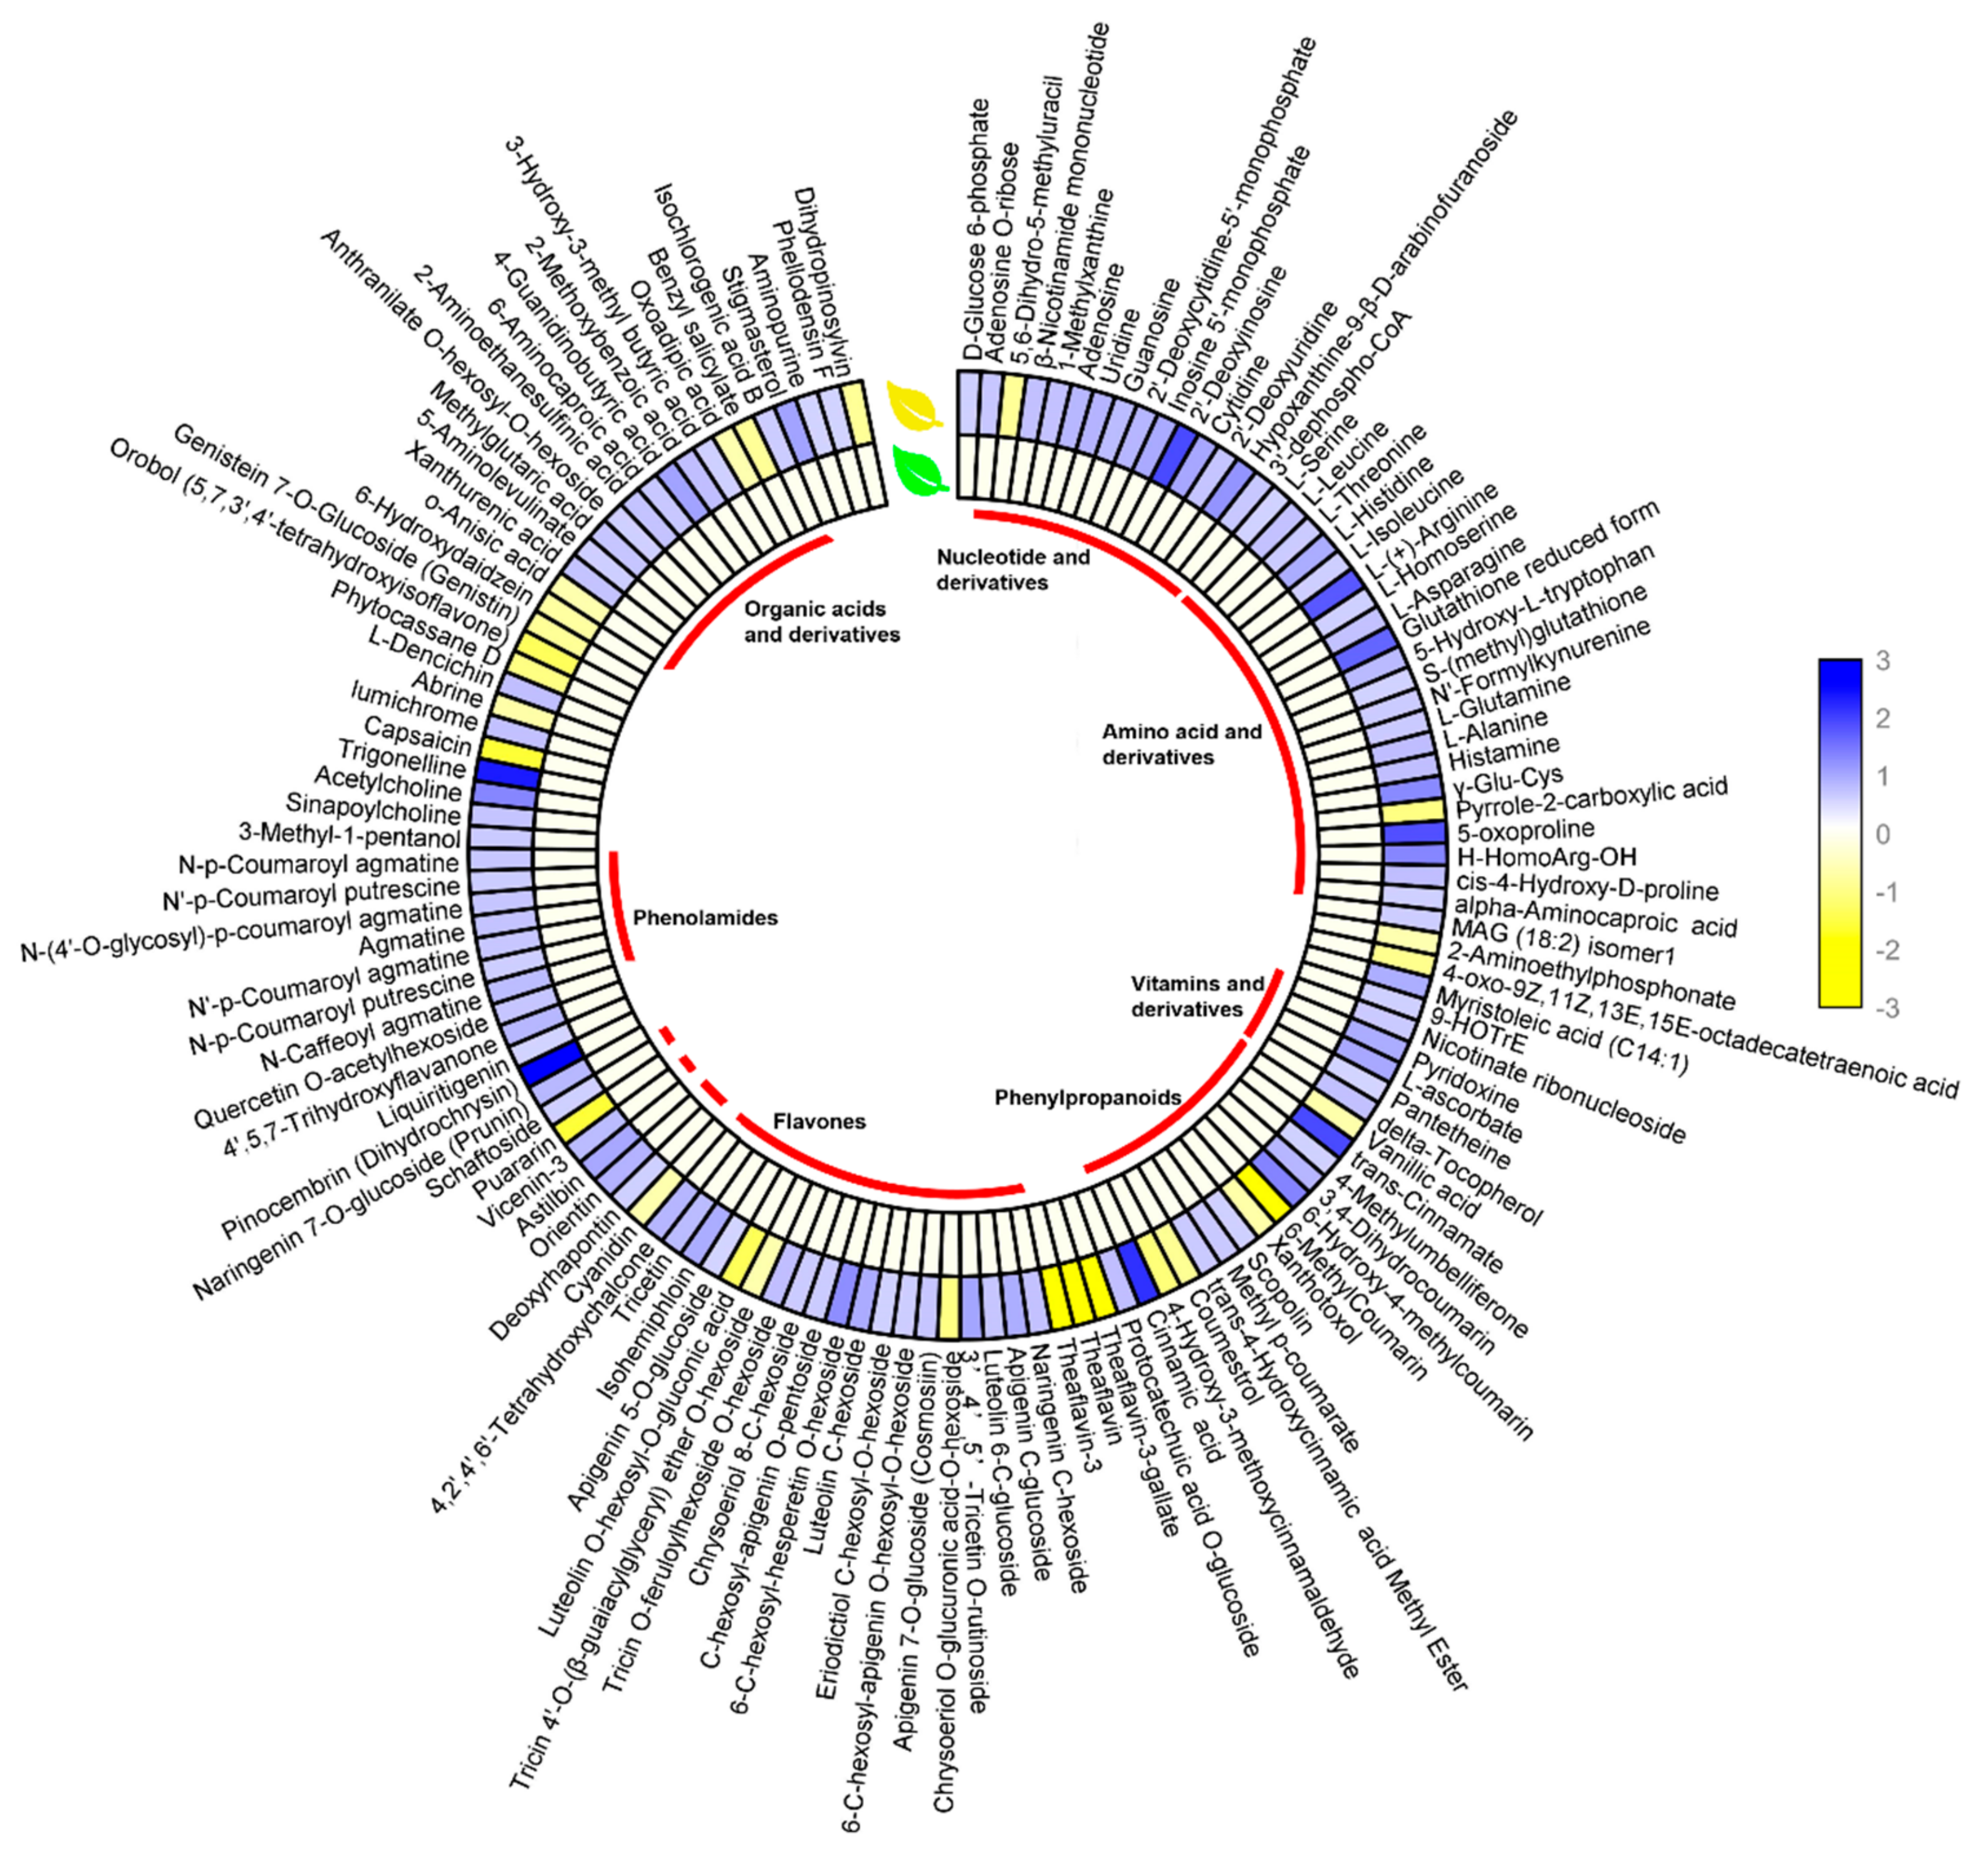
3.2. Metabolite Changes Between the Young Shoots of YR and GR

A total of 839 metabolites were detected and quantified in the young shoots of YR and GR. PCA and OPLS-DA analysis revealed that the metabolite profiles of YR and GR were clearly separated (Figure 2a,b). Based on the metabolite VIP values and fold changes, the volcano plot showed that the number of upregulated metabolites was much greater than the number of downregulated (Figure 2c). A total of 130 (15.5%) significantly changed metabolites (SCMs) were identified in the metabolite profiles from YR compared to GR. Among these, the abundances of 103 SCMs were markedly increased, and 27 were downregulated. These SCMs can be generally grouped into 18 categories, including amino acids and derivatives, nucleotides and derivatives, lipids, vitamins and derivatives, phenylpropanoids, flavones, alkaloids, phenolamides, organic acids and derivatives, etc. (Figure 2d and Supplementary Table S2). Notably, the abundances of SCMs from most categories, especially nucleotides and amino acids and their derivatives and flavones were significantly increased, while anthocyanin, isoflavones, and terpenoids were reduced in YR compared to GR.
To more clearly observe the fold changes in the SCM levels of YR and GR, TBtools [33] was used to generate a heat map of 130 SCMs (Figure 3), with blue representing elevated levels of metabolites and yellow representing decreased. Fourteen nucleotides and derivatives were found to be differentially accumulated in YR and GR, 13 of which were significantly increased in YR, including adenosine, guanosine, cytidine, uridine, and 1-methylxanthine, while the level of 5,6-dihydro-5-methyluracil was decreased. Amino acids and their derivatives influence the flavor and aroma of tea. Compared with the young shoots of GR, 20 of the 21 significantly changed amino acids and their derivatives were increased in YR, including l-serine, l-leucine, l-threonine, l-histidine, l-isoleucine, l-(+)-arginine, l-homoserine, l-asparagine, l-alanine, l-glutamine, and glutathione, and pyrrole-2-carboxylic acid was decreased. The levels of all significantly changed vitamins and their derivatives were increased in YR, especially l-ascorbate, which was a 2.05-fold increase. Thirteen SCMs belonged to phenylpropanoids, and eight of these were markedly increased in YR, especially cinnamic acid and trans-cinnamic acid, which were increased by 3.85 and 4.49-fold, respectively. Of the 23 significantly changed flavones, 19 showed markedly higher abundances in YR than those in GR, including 6-c-hexosyl-hesperetin o-hexoside, 3’,4’,5’-tricetin o-rutinoside, luteolin c-hexoside, apigenin c-glucoside, and isohemiphloin. Interestingly, seven significantly changed phenolamides were markedly elevated in YR. Organic acids and derivatives also affect the tea taste and aroma. Compared to GR, 13 organic acids and derivatives were detected to be significantly changed in YR, including 10 increased and 3 decreased. The most decreased was benzyl salicylate, which was decreased almost 2-fold.

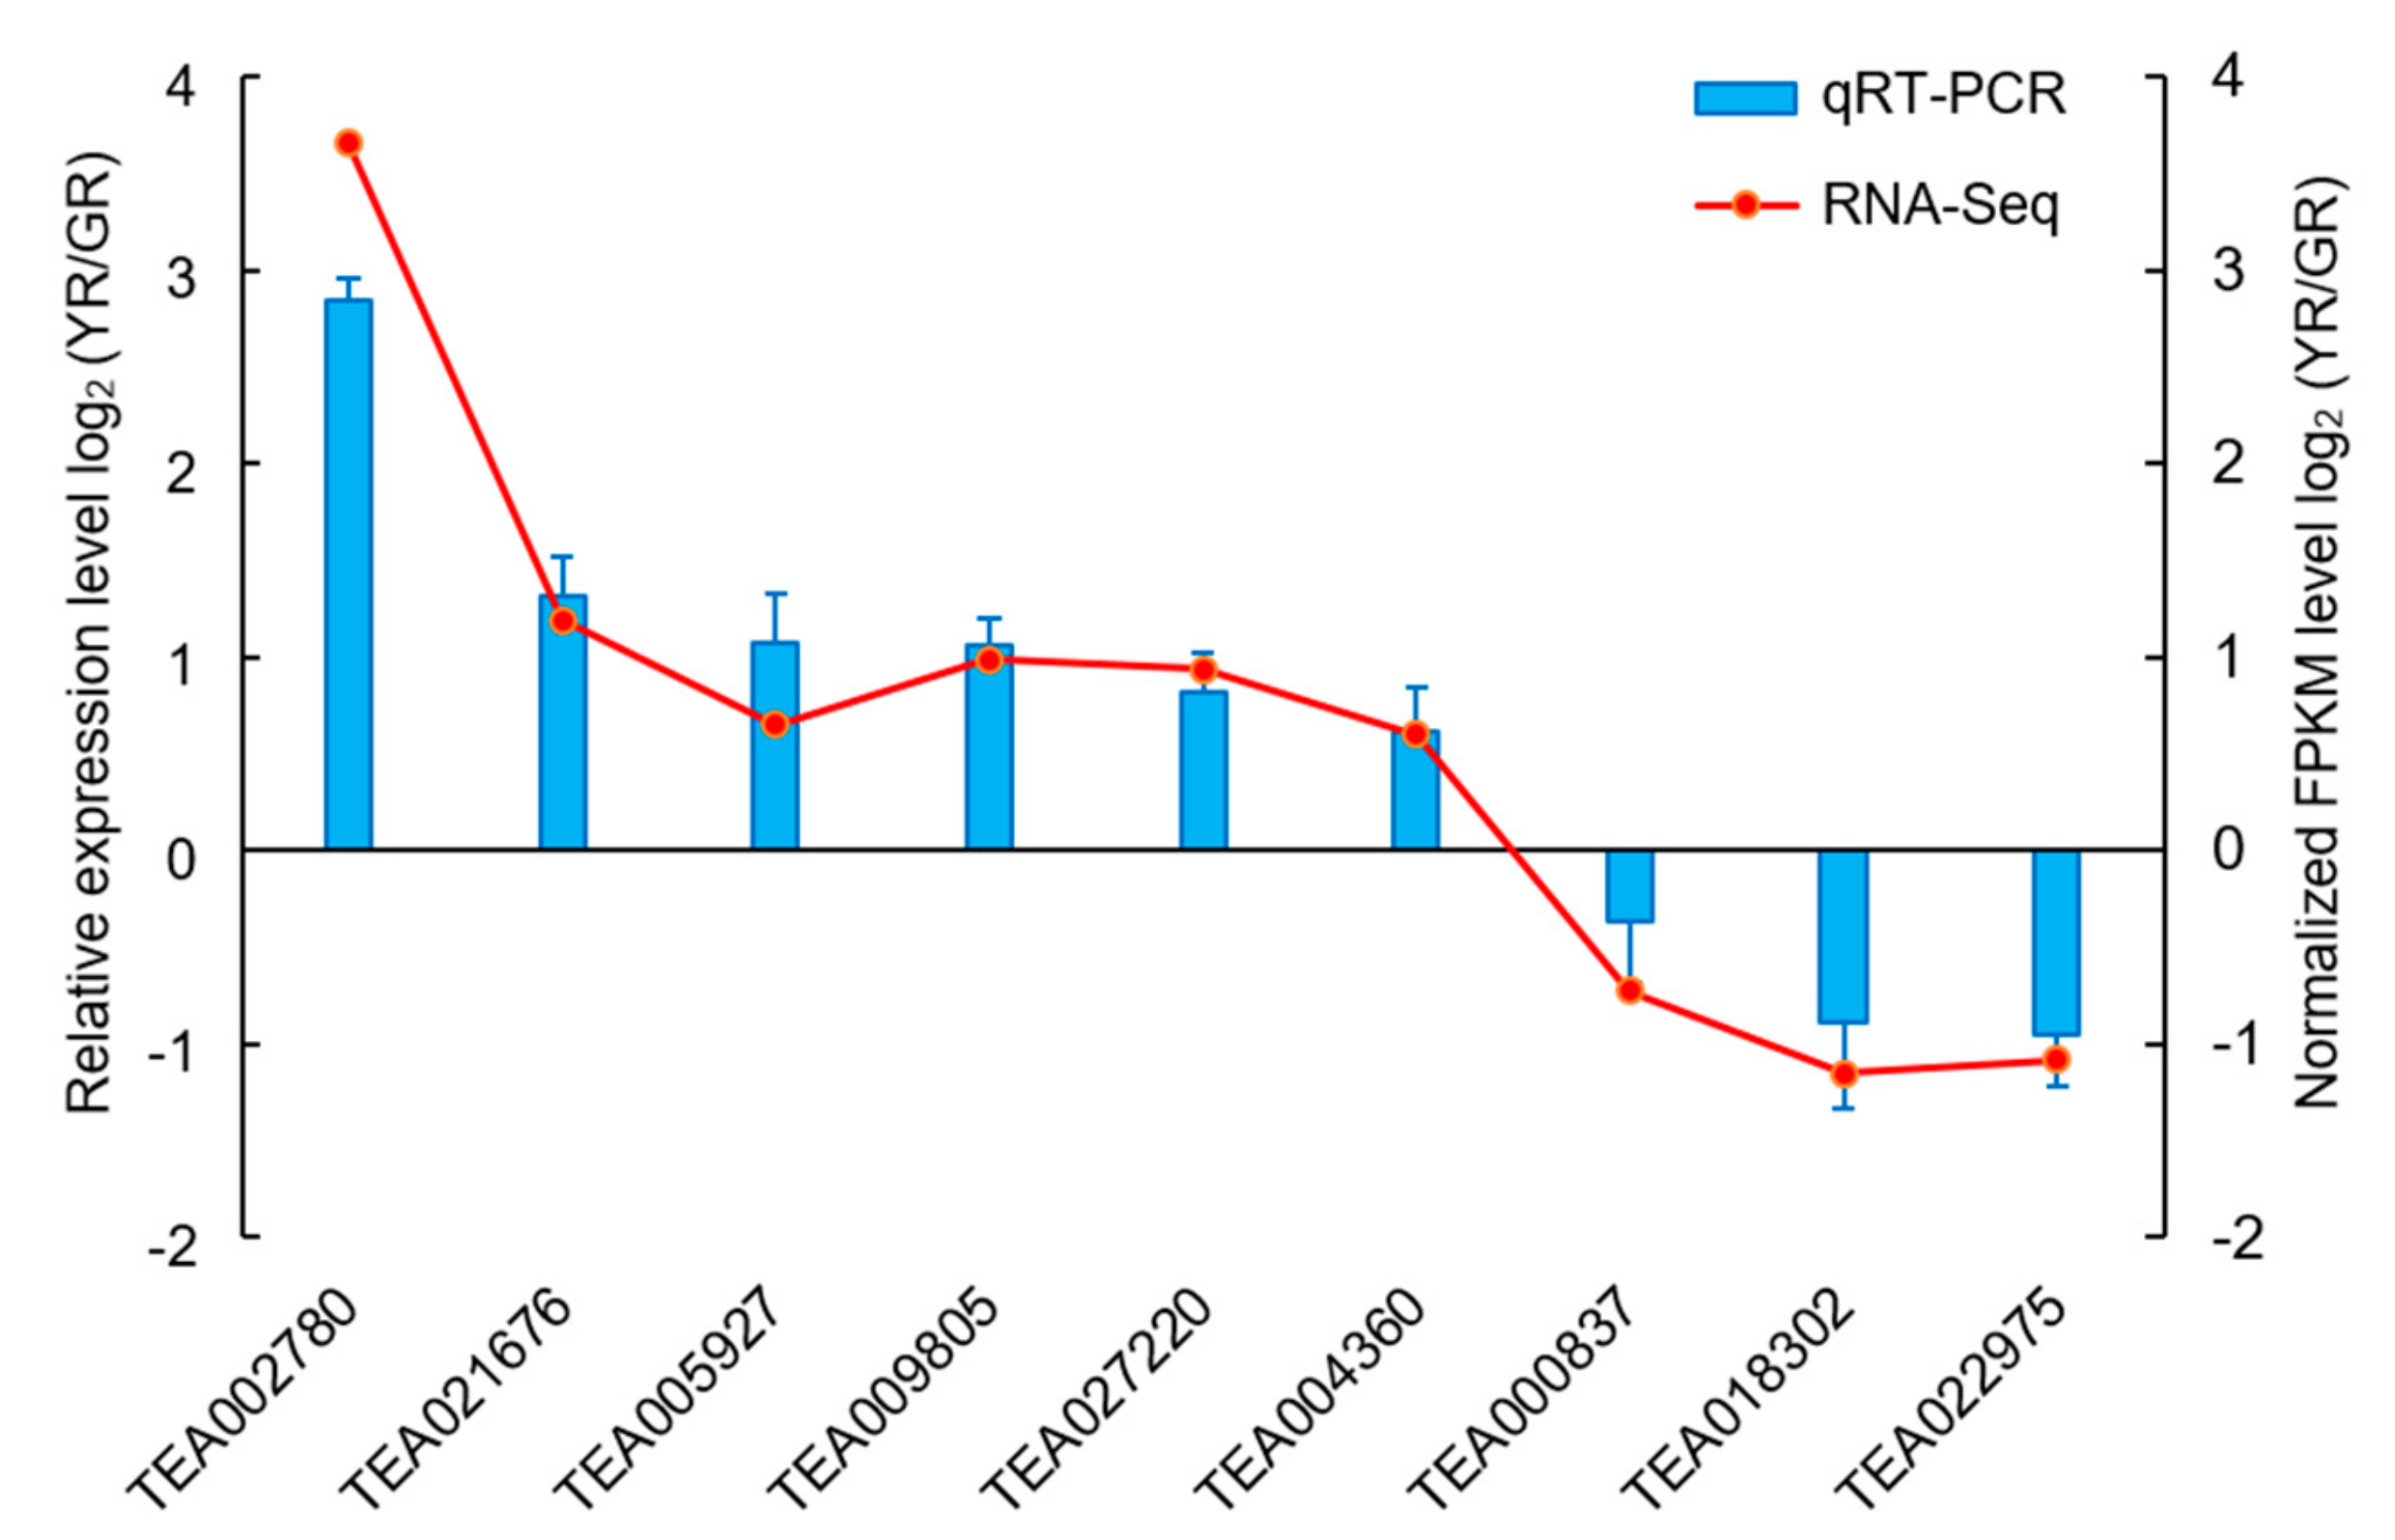
3.3. DEG Identification and Verification

To identify differentially expressed genes (DEGs) between the young shoots of YR and GR, a transcriptomic comparison was carried out. As shown in Table 1, a total of 46.36–64.35 million raw reads were obtained, and the Q30 of the raw reads ranged from 93.98% to 94.47%, indicating the high quality of the transcriptome data. A total 41.28–57.38 million reads were mapped to the tea plant genome (http://tpia.teaplant.org/index.html) [1] with an alignment efficiency in the range of 89.57%–90.28%. All transcriptome data sets were stored in the NCBI SRA database under the accession number PRJNA561281. A total of 55 DEGs, including 37 upregulated and 18 downregulated genes, were identified in the young shoots of YR compared to GR (Supplementary Table S3). GO enrichment analysis showed that DEGs were divided into three major categories and 26 subcategories (Supplementary Figure S1). In the biological process aspect, “metabolic process” and “cellular process” were the top enriched terms, whereas in the cellular component aspect, most of the DEGs were enriched in “cell” and “cell part”, and in the molecular function aspect, most of the DEGs were participants in “binding” and “catalytic activity”. Pathway analysis indicated that DEGs were enriched in 26 KEGG pathways. The top 20 pathway enrichment analyses indicated that most of the identified DEGs act on multiple metabolic processes related to energy metabolism, amino acid metabolism, nucleotide metabolism, lipid metabolism, carbohydrate metabolism, and secondary metabolism (Figure 4). The pathways annotated by these DEGs were closely related to the classification of SCMs, indicating that these mRNAs regulate the changes in the abundance of metabolites of young shoots between YR and GR.
The reliability of the transcriptome data was further verified by random selection of nine DEGs for qRT-PCR analysis (Figure 5). The results indicated that the expression patterns from qRT-PCR testing were well correlated with sequencing results.

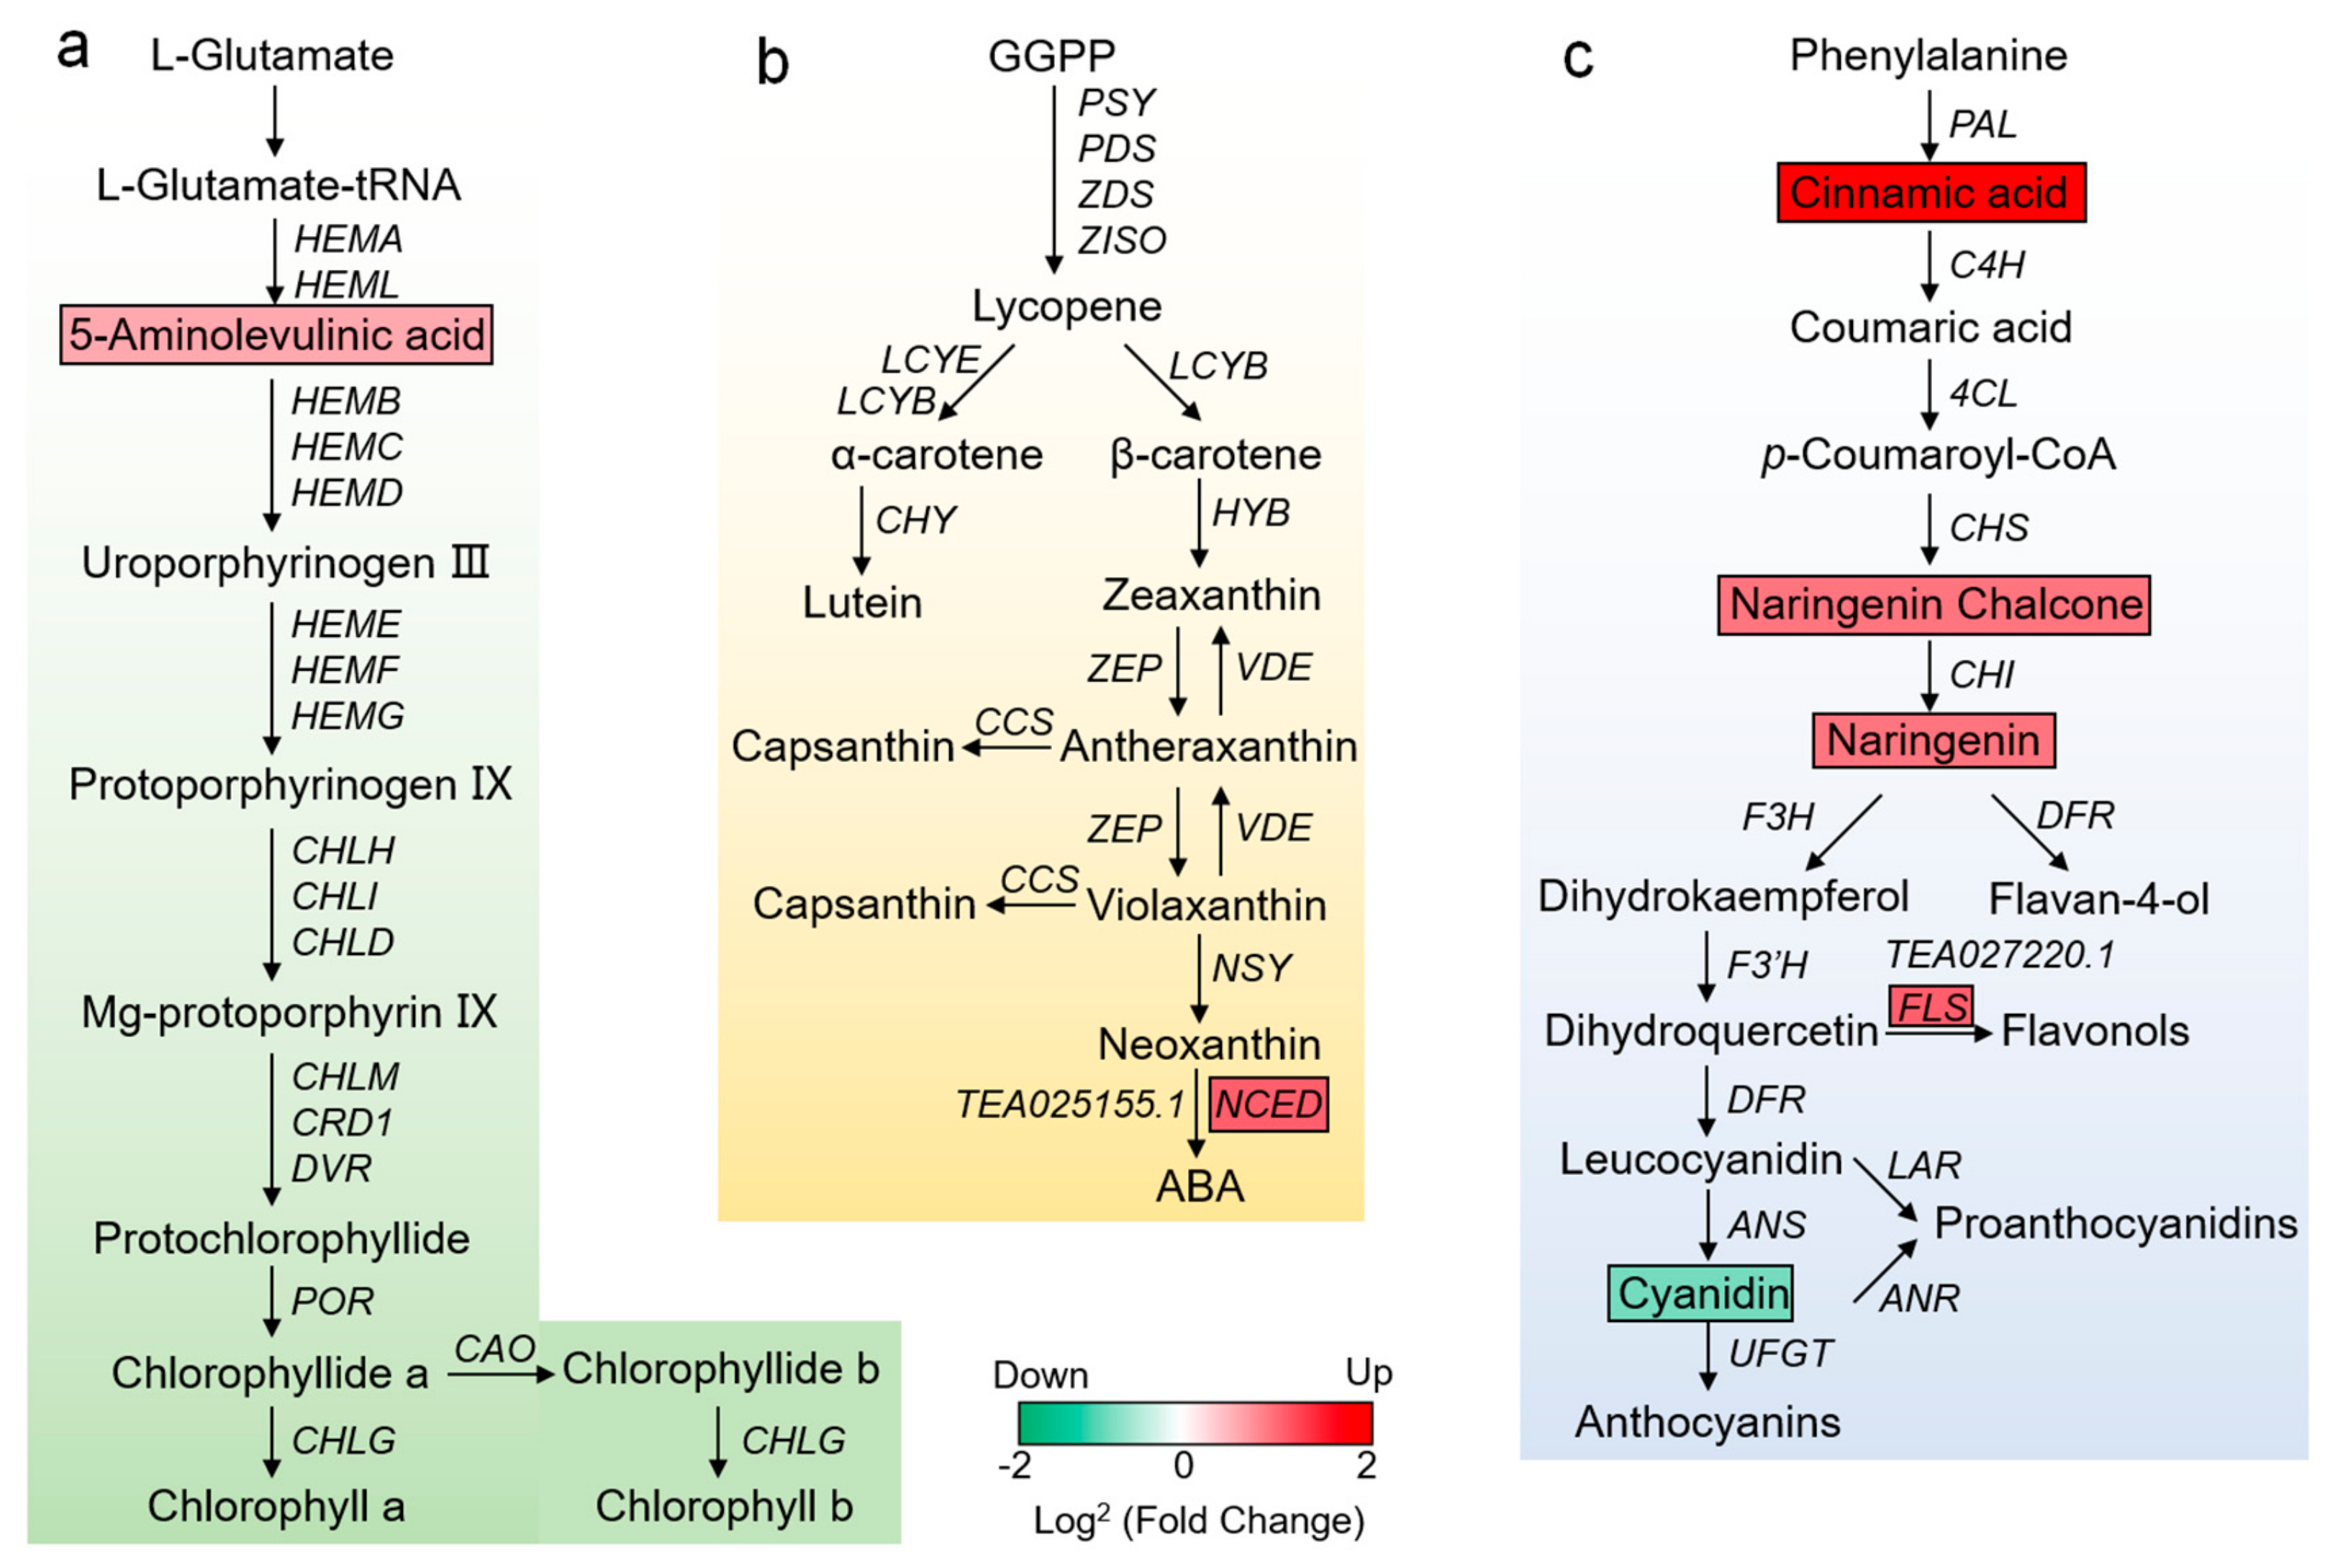
3.4. Analysis of DEGs and SCMs Related to Pigment Metabolism in YR and GR

The leaf coloration of plants is affected by many leaf pigments, including chlorophyll, carotenoids, and flavonoids. Normal green leaves are attributed to the synthesis of chlorophyll. Here, the level of 5-aminolevulinic acid (ALA), a universal precursor of chlorophyll and heme, was increased 1.56-fold in YR (Figure 6a). The synthesis of ALA is the rate-limiting step in chlorophyll biosynthesis. Therefore, an increase in ALA abundance might affect the chlorophyll metabolism of YR.
In carotenoid metabolism, although there was no significant difference in total carotenoid content between YR and GR, the carotenoid composition may vary and influence leaf coloration. Interestingly, a 9-cis-epoxycarotenoid dioxygenase encoding gene (NCED, TEA025155.1), the rate-limiting enzyme that controls the conversion of carotenoids to ABA, was upregulated 1.88-fold in YR (Figure 6b), which might regulate carotenoid degradation.
In the flavonoid metabolic pathway, the abundance of the key synthetic precursor cinnamic acid in YR was increased 4.49-fold compared with GR (Figure 6c). Subsequent synthetic steps, including naringenin chalcone and naringenin, and most flavonoid compounds (flavones, flavanones, and flavonols) were markedly accumulated in YR. Flavonol synthase (FLS, TEA027220.1), a key enzyme in the flavonoid biosynthesis pathway, was also upregulated 1.91-fold. Furthermore, in the pathway for synthesis of anthocyanin, cyanidin was significantly reduced in YR.

3.5. Analysis of Transcription Factors (TFs) and Chloroplast-Biogenesis-Related Genes in YR and GR

Transcription factors (TFs) are essential regulators that bind to specific DNA sequences to activate or inhibit the expression of target genes, thereby influencing multiple biological processes. In this study, all DEGs were uploaded to PlantTFDB (http://planttfdb.cbi.pku.edu.cn) to analyze potential TFs. As a result, 10 DEGs were annotated as TFs and divided into seven different families (Table 2). The most abundant TFs were heat shock transcription factors (HSF, four TFs), all of which showed upregulated expression in YR. The other six TFs belonged to six different TF families, including ERF, GRAS, WRKY, NAC, SBP, and TCP.
Heat shock proteins (HSPs) are regulated by HSFs and play a crucial role in chloroplast biogenesis. Here, three differentially expressed HSPs and four HSFs were upregulated in young shoots of YR compared with GR (Table 2). Thus, we suggest that the upregulation of these genes may regulate leaf color by affecting chloroplast biogenesis.

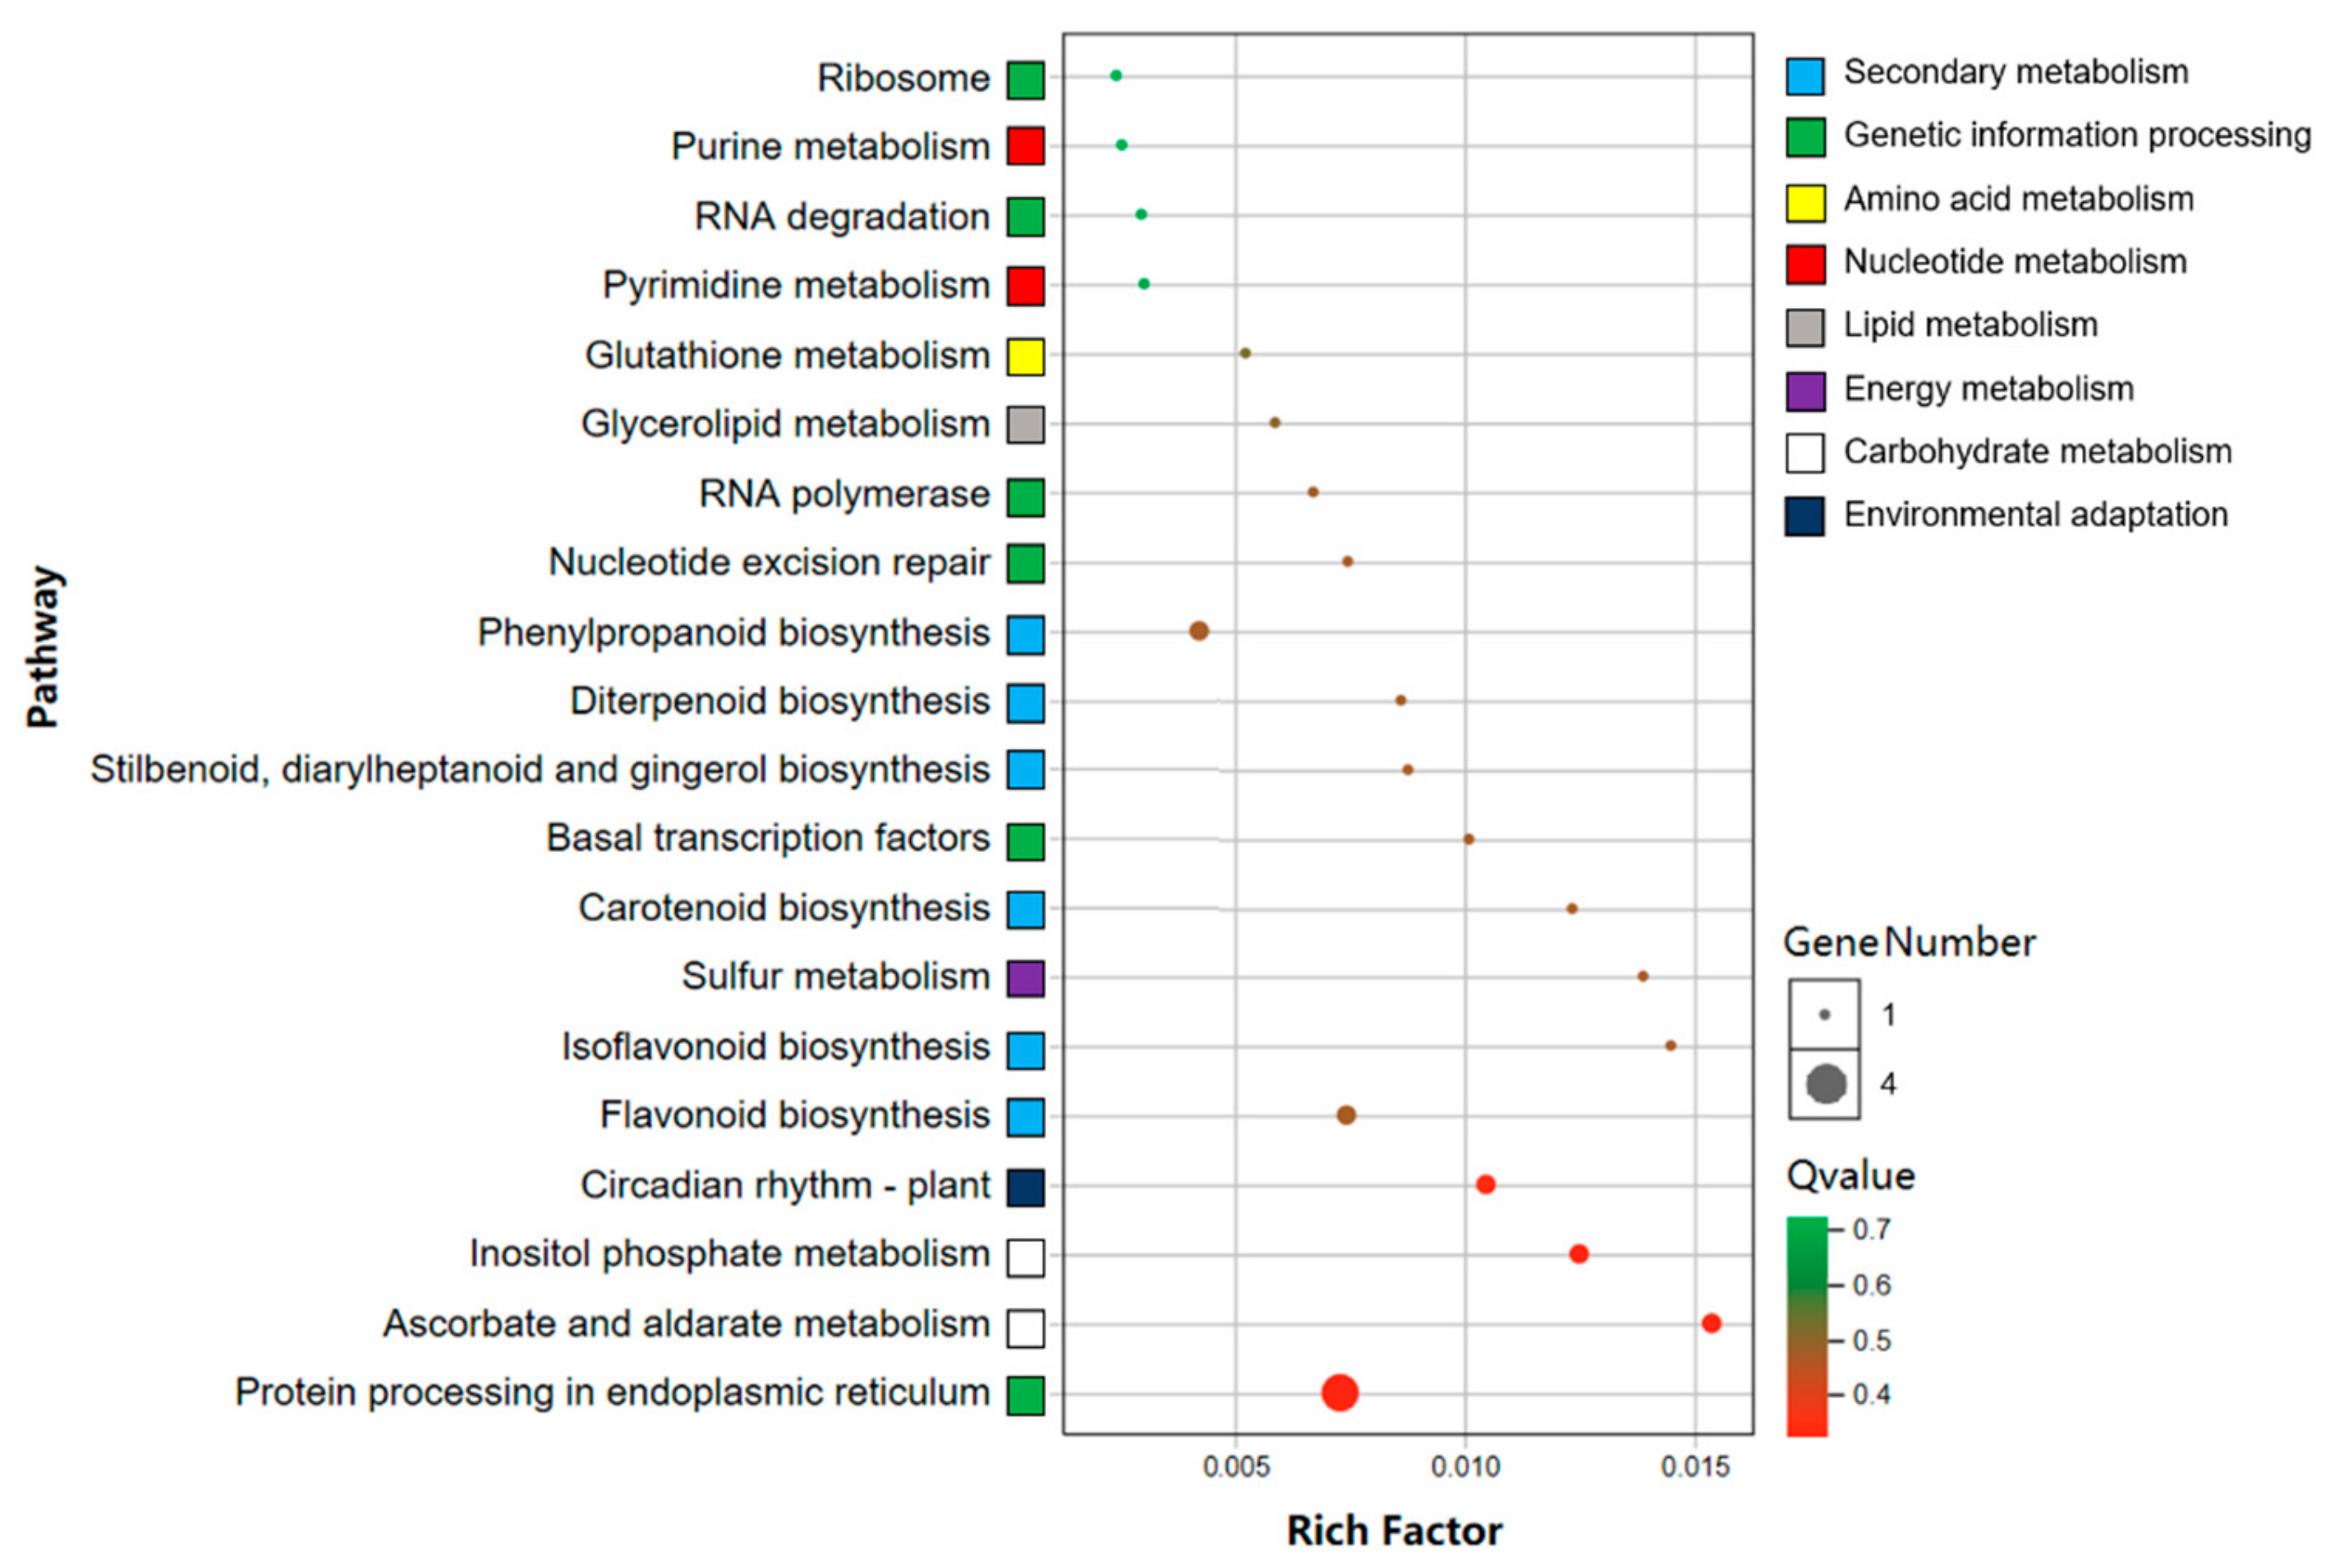
3.6. Conjoint Analysis of DEGs and SCMs Associated with other Metabolic Pathways in YR and GR

By combining the KEGG pathways of DEGs and SCMs, we found that the alterations of YR compared to GR were also associated with six metabolic pathways, including ascorbate and aldarate metabolism, inositol phosphate metabolism, starch and sucrose metabolism, phenylpropanoid biosynthesis, glutathione metabolism, and sulfur metabolism pathways (Table 3). Two downregulated inositol oxygenase-encoding genes (MIOX) were annotated to the inositol phosphate metabolism and ascorbate and aldarate metabolism pathways, while levels of l-ascorbate and D-glucose 6-phosphate were increased. The levels of two DEGs and three SCMs associated with phenylpropanoid biosynthesis were significantly increased. In the glutathione metabolic pathway, the transcriptional level of glutathione s-transferase (GST) was upregulated 2.23-fold, and the four metabolites were also markedly increased.

4. Discussion

The molecular mechanism and chemical composition of tea plant germplasms with unique leaf color have attracted increasing research attention. However, the detection methods of the compounds and the genetic background of the materials limit further research [14,17]. In this study, natural yellow-leaf mutants of the Rougui cultivar were obtained, and a combination of high-throughput and high-sensitivity widely targeted metabolomics and transcriptomics was performed using young shoots from YR and GR to gain insight into the differences in chemical components and gene regulation.
Chlorophyll and carotenoids are the core pigments that capture light energy in plant leaves. In higher plants, yellow leaf coloration depends mainly on the biosynthesis and transport of chlorophyll and carotenoids [6,34]. Previous studies have demonstrated that many albino tea leaves have significantly reduced chlorophyll, and some also have an increased Chl a/b ratio [10,12,13]. In line with this, less Chl a and Chl b and an increased Chl a/b ratio were detected in YR compared to GR (Figure 1c). The biosynthesis of Chl b regulates the photosynthetic antenna size and the light-harvesting efficiency [35], while the Chl a/b ratio is usually related to photosynthetic capacity [36]. Therefore, the increase of Chl a/b ratio and the decrease of chlorophyll content in YR suggested that there might be less light-harvesting efficiency than GR and that this might influence leaf coloration. Interestingly, Huangjinya, one of the most widely investigated yellow-leaf tea mutants, has a significantly increased Chl a/b ratio compared to the green-leaf cultivar ’Fuding dabaicha’ [12], but no significant difference was found compared to ’Longjingchangye’ [10]. The key precursor of chlorophyll biosynthesis, ALA, was markedly increased in YR (Figure 6a). ALA is also a precursor of porphyrins, which are involved in the metabolism of plant pigments [37]. Therefore, we suggest that the increase in ALA may influence leaf coloration at the physiological level by affecting the synthesis of pigments.
Carotenoids are a large class of pigments that are red, orange, or yellow, and their biosynthesis is coordinated with chlorophyll synthesis in the chloroplast and is essential for photoprotection [38]. It has been demonstrated that the yellow-leaf phenotypes of Huangjinya largely depend on the cultivar’s significantly decreased carotenoids [10,39]. Changes in the composition of various carotenoids, especially the markedly increased zeaxanthin, might be responsible for the color change of albino tea cultivars [12], and these changes also occur in a spontaneous yellow-leaf mutant of winter wheat [34]. Thus, although there was no significant difference in total carotenoid content between YR and GR, the carotenoid composition may vary and affect leaf coloration. In particular, NCED, a rate-limiting enzyme that controls the conversion of carotenoids to ABA, catalyzes the cleavage of violaxanthin and neoxanthin to form xanthine and C-25 apo-aldehydes [40], was upregulated 1.88-fold in YR (Figure 6b), and may regulate the degradation of carotenoids and contribute to the alteration of carotenoid components.
Flavonoids are also involved in leaf coloration, including anthocyanin, flavones, and flavonols [6]. Accumulation of flavonoids influences the pigmentation in Arabidopsis mutants [41]. The role of naringenin chalcone as a yellow pigment in yellow flower coloration has been revealed in previous reports [42,43]. Notably, many flavones, flavonols, and flavanones on the flavonoid metabolic pathway were significantly increased in YR (Figure 6c), including naringenin chalcone and naringenin, which might be involved in conferring a yellow color on leaves. Flavonoid metabolism is catalyzed by a battery of enzymes. The leaf coloration of Huangjinya is largely determined by flavonoids and, except for CsF3′5′H and CsLDOX, the transcription levels of all genes in flavonoid metabolism in yellow leaves are higher than those after shading [10]. However, only FLS was found to be markedly higher in YR than in GR (Figure 6c), indicating that the two yellow-leaf phenotypes are determined by different molecular mechanisms.
Chloroplast biogenesis affects the coloration of plant leaves, and the destruction of chloroplasts leads to abnormal leaf color [44,45]. Increased evidence indicates that HSPs act as protective proteins maintaining cell homeostasis in plants and play a crucial role in chloroplast biogenesis [46,47,48]. The involvement of HSPs with leaf coloration by mediating chloroplast development has been observed in many plants. For instance, inactivation of a HSP100 family member clpC1 in Arabidopsis causes leaf yellowing and growth retardation by affecting chloroplast function [49]. Inhibition of two HSP70 family members, cpHsc70-1 and cpHsc70-2, produces a white and stunted appearance, and the chloroplasts in transgenic Arabidopsis have an altered morphology with few or no thylakoid membranes [50]. Rice OsHsp70CP1 is important for chloroplast differentiation from proplastids, and its T-DNA inserted mutant has a chlorosis phenotype under a constant high temperature [51]. Furthermore, HSFs can regulate the expression of HSPs by binding to specific palindromic sequences (5′-AGAAnnTTCT-3′) in many HSPs promoters [52,53,54]. Interestingly, three differentially expressed HSPs and 4 HSFs were upregulated together in young shoots of YR (Table 2). This specific transcriptional pattern was also found in previous research [34]. Thus, we suggest that the co-expression of HSPs and HSFs may regulate leaf coloration by affecting the chloroplast biogenesis.
The preciousness of albino tea germplasm is associated with its beneficial metabolites, good flavor, unique leaf color, and rareness [12]. In this study, the first application of widely targeted metabolomics identified a large number of metabolites in the young shoots of YR and GR, of which 130 were significantly altered (Figure 2d and Supplementary Table S2). Interestingly, the abundance of 103 SCMs increased significantly in YR, especially nucleotides and amino acids and their derivatives, and flavones. Nucleotides and their derivatives are crucial functional and nutritional molecules that human body can absorb from food [55,56], and some of them are positively correlated with the umami taste of tea [57]. Previous studies on albino tea metabolites have not focused on the changes in nucleotides and their derivatives. Here, 14 nucleotides and their derivatives were found to be differentially accumulated in YR and GR, 13 of which were significantly increased in YR, including adenosine, guanosine, cytidine, and uridine. Adenosine may be the most abundant nucleotide in fresh tea leaf, and is involved in the biosynthesis of caffeine [58,59]. Amino acids and their derivatives are the most studied compounds in albino tea. Consistent with previous studies [12,60], the levels of 20 amino acids and their derivatives were increased markedly in YR, affecting the umami taste and aroma of tea infusions [61]. Conjoint analysis of DEGs and SCMs (Table 3) showed that glutathione on the glutathione metabolic pathway, an α-amino acid that protects cells from oxidation [62], was increased 3.21-fold in YR, whereas the expression of GST was upregulated 2.23-fold. L-ascorbate is an organic compound with antioxidant effects, and its green tea extract inhibits atherosclerosis [63]. Here, l-ascorbate and its two synthetically related MIOX genes were found to be significantly changed (Table 3) and the increased level of l-ascorbate is beneficial to the nutritional value of YR. Flavonoids also contribute to the quality of tea [64], and have antioxidative [65], antihypertensive [66], antidiabetic [67], and other activities. It is notable that most of the significantly altered flavones, flavonols, and flavanones showed an obviously increased abundance in YR, suggesting that the albino tea mutant YR may have high application value.
In conclusion, the leaf coloration of YR was mainly affected by pigment metabolism and chloroplast biogenesis. Most of the significantly altered metabolites showed increased abundance in YR, especially nucleotides and amino acids and their derivatives and flavonoids, suggesting that this new mutant may be an ideal albino tea germplasm for planting and breeding.

5. Conclusions

In conclusion, the leaf coloration of YR was mainly affected by pigment metabolism and chloroplast biogenesis. Most of the significantly altered metabolites showed increased abundance in YR, especially nucleotides and amino acids and their derivatives and flavonoids, suggesting that this new mutant may be an ideal albino tea germplasm for planting and breeding.

Supplementary Materials

The following are available online at https://www.mdpi.com/1999-4907/11/2/229/s1, Figure S1: GO enrichment analysis of Differentially expressed genes, Table S1: The primers for qRT-PCR, Table S2: Significantly changed metabolites in YR compared with GR, Table S3: Differentially expressed genes in YR compared with GR.

Author Contributions

N.Y., J.Y., P.W. and Y.Z. conceived and designed the research. B.L. and S.L. cultivated and provided the tea plant germplasm, P.W., Y.Z., Y.G., and X.C. performed the experiments. P.W., Y.Z., S.J., F.Z., and Y.S. analyzed the data. P.W. and Y.Z. wrote the manuscript. All authors have read and agreed to the published version of the manuscript.

Funding

This research was funded by the Fujian Province “2011 Collaborative Innovation Center”, Chinese Oolong Tea Industry Innovation Center (Cultivation) special project (J2015-75), Fujian Agriculture and Forestry University Science and Technology Innovation Special Fund (CXZX2017181), the Earmarked Fund for China Agriculture Research System (CARS-19), the Scientific Research Foundation of Graduate School of Fujian Agriculture and Forestry University, and the Scientific Research Foundation of Horticulture College of Fujian Agriculture and Forestry University (2018B02 and 2019B02).

Conflicts of Interest

The authors declare no conflict of interest.

References

  1. Wei, C.; Yang, H.; Wang, S.; Zhao, J.; Liu, C.; Gao, L.; Xia, E.; Lu, Y.; Tai, Y.; She, G. Draft genome sequence of Camellia sinensis var. sinensis provides insights into the evolution of the tea genome and tea quality. Proc. Natl. Acad. Sci. USA 2018, 115, E4151–E4158. [Google Scholar] [CrossRef] [Green Version]
  2. Dong, F.; Zeng, L.; Yu, Z.; Li, J.; Tang, J.; Su, X.; Yang, Z. Differential accumulation of aroma compounds in normal green and albino-induced yellow tea (Camellia sinensis) leaves. Molecules 2018, 23, 2677. [Google Scholar] [CrossRef] [Green Version]
  3. Zhou, K.; Ren, Y.; Lv, J.; Wang, Y.; Liu, F.; Zhou, F.; Zhao, S.; Chen, S.; Peng, C.; Zhang, X. Young Leaf Chlorosis 1, a chloroplast-localized gene required for chlorophyll and lutein accumulation during early leaf development in rice. Planta 2013, 237, 279–292. [Google Scholar] [CrossRef] [PubMed]
  4. Rissler, H.M.; Collakova, E.; Dellapenna, D.J.; Pogson, B.J. Chlorophyll biosynthesis. Expression of a second Chl I gene of magnesium chelatase in Arabidopsis supports only limited chlorophyll synthesis. Plant Physiol. 2002, 128, 770–779. [Google Scholar] [CrossRef]
  5. Zhong, X.M.; Sun, S.F.; Li, F.H.; Wang, J.; Shi, Z.S. Photosynthesis of a yellow-green mutant line in maize. Photosynthetica 2015, 53, 499–505. [Google Scholar] [CrossRef]
  6. Li, W.; Yang, S.; Lu, Z.; He, Z.; Ye, Y.; Zhao, B.; Wang, L.; Jin, B. Cytological, physiological, and transcriptomic analyses of golden leaf coloration in Ginkgo biloba L. Hortic. Res. 2018, 5, 12. [Google Scholar] [CrossRef] [PubMed] [Green Version]
  7. Gang, H.; Liu, G.; Chen, S.; Jiang, J. Physiological and transcriptome analysis of a yellow-green leaf mutant in birch (Betula platyphylla × B. Pendula). Forests 2019, 10, 120. [Google Scholar] [CrossRef] [Green Version]
  8. Du, Y.; Chen, H.; Zhong, W.; Wu, L.; Ye, J.; Lin, C.; Zheng, X.; Lu, J.; Liang, Y. Effect of temperature on accumulation of chlorophylls and leaf ultrastructure of low temperature induced albino tea plant. Afr. J. Biotechnol. 2008, 7, 1881–1885. [Google Scholar] [CrossRef]
  9. Li, N.; Yang, Y.; Ye, J.; Lu, J.; Zheng, X.; Liang, Y. Effects of sunlight on gene expression and chemical composition of light-sensitive albino tea plant. Plant Growth Regul. 2016, 78, 253–262. [Google Scholar] [CrossRef]
  10. Song, L.; Ma, Q.; Zou, Z.; Sun, K.; Yao, Y.; Tao, J.; Kaleri, N.A.; Li, X. Molecular link between leaf coloration and gene expression of flavonoid and carotenoid biosynthesis in Camellia sinensis cultivar ’Huangjinya’. Front. Plant Sci. 2017, 8, 803. [Google Scholar] [CrossRef] [Green Version]
  11. Liu, G.F.; Han, Z.X.; Feng, L.; Gao, L.P.; Gao, M.J.; Gruber, M.Y.; Zhang, Z.L.; Xia, T.; Wan, X.C.; Wei, S. Metabolic flux redirection and transcriptomic reprogramming in the albino tea cultivar ’Yu-Jin-Xiang’ with an emphasis on catechin production. Sci. Rep. 2017, 7, 45062. [Google Scholar] [CrossRef] [Green Version]
  12. Feng, L.; Gao, M.J.; Hou, R.Y.; Hu, X.Y.; Zhang, L.; Wan, X.C.; Wei, S. Determination of quality constituents in the young leaves of albino tea cultivars. Food Chem. 2014, 155, 98–104. [Google Scholar] [CrossRef]
  13. Li, C.F.; Ma, J.Q.; Huang, D.J.; Ma, C.L.; Jin, J.Q.; Yao, M.Z.; Chen, L. Comprehensive dissection of metabolic changes in albino and green tea cultivars. J. Agric. Food Chem. 2018, 66, 2040–2048. [Google Scholar] [CrossRef]
  14. Ma, Q.; Li, H.; Zou, Z.; Arkorful, E.; Lv, Q.; Zhou, Q.; Chen, X.; Sun, K.; Li, X. Transcriptomic analyses identify albinoassociated genes of a novel albino tea germplasm ’Huabai 1’. Hortic. Res. 2018, 5, 54. [Google Scholar] [CrossRef] [Green Version]
  15. Lu, M.; Han, J.; Zhu, B.; Jia, H.; Yang, T.; Wang, R.; Deng, W.W.; Zhang, Z.Z. Significantly increased amino acid accumulation in a novel albino branch of the tea plant (Camellia sinensis). Planta 2019, 249, 363–376. [Google Scholar] [CrossRef]
  16. Wang, L.; Yue, C.; Cao, H.; Zhou, Y.; Zeng, J.; Yang, Y.; Wang, X. Biochemical and transcriptome analyses of a novel chlorophyll-deficient chlorina tea plant cultivar. BMC Plant Biol. 2014, 14, 352. [Google Scholar] [CrossRef] [PubMed] [Green Version]
  17. Wang, L.; Cao, H.; Chen, C.; Yue, C.; Hao, X.; Yang, Y.; Wang, X. Complementary transcriptomic and proteomic analyses of a chlorophyll-deficient tea plant cultivar reveal multiple metabolic pathway changes. J. Proteom. 2016, 130, 160–169. [Google Scholar] [CrossRef]
  18. Wurtzel, E.T.; Kutchan, T.M. Plant metabolism, the diverse chemistry set of the future. Science 2016, 353, 1232. [Google Scholar] [CrossRef] [PubMed] [Green Version]
  19. Albinsky, D.; Sawada, Y.; Kuwahara, A.; Nagano, M.; Hirai, A.; Saito, K.; Hirai, M.Y. Widely targeted metabolomics and coexpression analysis as tools to identify genes involved in the side-chain elongation steps of aliphatic glucosinolate biosynthesis. Amino Acids 2010, 39, 1067–1075. [Google Scholar] [CrossRef] [PubMed]
  20. Chen, W.; Gong, L.; Guo, Z.; Wang, W.; Zhang, H.; Liu, X.; Yu, S.; Xiong, L.; Luo, J. A novel integrated method for large-scale detection, identification, and quantification of widely targeted metabolites: Application in the study of rice metabolomics. Mol. Plant 2013, 6, 1769–1780. [Google Scholar] [CrossRef] [Green Version]
  21. Zhu, G.; Wang, S.; Huang, Z.; Zhang, S.; Liao, Q.; Zhang, C.; Lin, T.; Qin, M.; Peng, M.; Yang, C. Rewiring of the fruit metabolome in tomato breeding. Cell 2018, 172, 249–261. [Google Scholar] [CrossRef] [PubMed] [Green Version]
  22. Meng, J.; Wang, B.; He, G.; Wang, Y.; Tang, X.; Wang, S.; Ma, Y.; Fu, C.; Chai, G.; Zhou, G. Metabolomics integrated with transcriptomics reveals redirection of the phenylpropanoids metabolic flux in Ginkgo biloba. J. Agric. Food Chem. 2019, 67, 3284–3291. [Google Scholar] [CrossRef]
  23. Zhou, K.; Hu, L.; Li, Y.; Chen, X.; Zhang, Z.; Liu, B.; LI, P.; Gong, X.; Ma, F. MdUGT88F1-mediated phloridzin biosynthesis regulates apple development and Valsa canker resistance. Plant Physiol. 2019, 180, 2290–2305. [Google Scholar] [CrossRef] [PubMed] [Green Version]
  24. Wellburn, A.R.; Lichtenthaler, H. Formulae and program to determine total carotenoids and chlorophylls a and b of leaf extracts in different solvents. Adv. Photosynth. Res. 1984, 2, 9–12. [Google Scholar]
  25. Thévenot, E.A.; Roux, A.; Xu, Y.; Ezan, E.; Junot, C. Analysis of the human adult urinary metabolome variations with age, body mass index, and gender by implementing a comprehensive workflow for univariate and OPLS statistical analyses. J. Proteome Res. 2015, 14, 3322–3335. [Google Scholar] [CrossRef]
  26. Xia, E.H.; Li, F.D.; Tong, W.; Li, P.H.; Wu, Q.; Zhao, H.J.; Ge, R.H.; Li, R.P.; Li, Y.Y.; Zhang, Z.Z. Tea Plant Information Archive (TPIA): A comprehensive genomics and bioinformatics platform for tea plant. Plant Biotechnol. J. 2019, 17, 1938–1953. [Google Scholar] [CrossRef] [PubMed]
  27. Kim, D.; Langmead, B.; Salzberg, S.L. HISAT: A fast spliced aligner with low memory requirements. Nat. Methods 2015, 12, 357–360. [Google Scholar] [CrossRef] [PubMed] [Green Version]
  28. Liao, Y.; Smyth, G.K.; Shi, W. featureCounts: An efficient general purpose program for assigning sequence reads to genomic features. Bioinformatics 2014, 30, 923–930. [Google Scholar] [CrossRef] [PubMed] [Green Version]
  29. Love, M.I.; Huber, W.; Anders, S. Moderated estimation of fold change and dispersion for RNA-seq data with DESeq2. Genome Biol. 2014, 15, 550. [Google Scholar] [CrossRef] [PubMed] [Green Version]
  30. Yu, G.; Wang, L.G.; Han, Y.; He, Q.Y. clusterProfiler: An R package for comparing biological themes among gene clusters. Omics 2012, 16, 284–287. [Google Scholar] [CrossRef]
  31. Wang, P.J.; Guo, Y.C.; Chen, X.J.; Zheng, Y.C.; Sun, Y.; Yang, J.F.; Ye, N.X. Genome-wide identification of WOX genes and their expression patterns under different hormone and abiotic stress treatments in tea plant (Camellia sinensis). Trees 2019, 33, 1129–1142. [Google Scholar] [CrossRef]
  32. Livak, K.J.; Schmittgen, T.D. Analysis of relative gene expression data using real-time quantitative PCR and the 2(-Delta Delta C(T)) Method. Methods 2001, 25, 402–408. [Google Scholar] [CrossRef]
  33. Chen, C.; Xia, R.; Chen, H.; He, Y. TBtools, a Toolkit for Biologists integrating various HTS-data handling tools with a user-friendly interface. BioRxiv 2018, 289660. [Google Scholar] [CrossRef]
  34. Wu, H.; Shi, N.; An, X.; Cong, L.; Zhang, L. Candidate genes for yellow leaf color in common wheat (Triticum aestivum L.) and major related metabolic pathways according to transcriptome profiling. Int. J. Mol. Sci. 2018, 19, 1594. [Google Scholar] [CrossRef] [PubMed] [Green Version]
  35. Tanaka, R.; Koshino, Y.; Sawa, S.; Ishiguro, S.; Okada, K.; Tanaka, A. Overexpression of chlorophyllide a oxygenase (CAO) enlarges the antenna size of photosystem II in Arabidopsis thaliana. Plant J. 2001, 26, 365–373. [Google Scholar] [CrossRef] [PubMed]
  36. Tanaka, R.; Tanaka, A. Tetrapyrrole biosynthesis in higher plants. Annu. Rev. Plant Biol. 2007, 58, 321–346. [Google Scholar] [CrossRef] [PubMed]
  37. Hotta, Y.; Tanaka, T.; Takaoka, H.; Takeuchi, Y.; Konnai, M. New physiological effects of 5-aminolevulinic acid in plants: The increase of photosynthesis, chlorophyll content, and plant growth. Biosci. Biotechnol. Biochem. 1997, 61, 2025–2028. [Google Scholar] [CrossRef] [PubMed]
  38. Demmig-Adams, B.; Adams, W.W. The role of xanthophyll cycle carotenoids in the protection of photosynthesis. Trends Plant Sci. 1996, 1, 21–26. [Google Scholar] [CrossRef]
  39. Fan, Y.G.; Zhao, X.X.; Wang, H.Y.; Tian, Y.Y.; Xiang, Q.Z.; Zhang, L.X. Effects of light intensity on metabolism of light-harvesting pigment and photosynthetic system in Camellia sinensis L. cultivar ’Huangjinya’. Environ. Exp. Bot. 2019. [Google Scholar] [CrossRef]
  40. Schwartz, S.H.; Tan, B.C.; Gage, D.A.; Zeevaart, J.A.; Mccarty, D.R. Specific oxidative cleavage of carotenoids by VP14 of maize. Science 1997, 276, 1872–1874. [Google Scholar] [CrossRef] [Green Version]
  41. Appelhagen, I.; Jahns, O.; Bartelniewoehner, L.; Sagasser, M.; Weisshaar, B.; Stracke, R. Leucoanthocyanidin Dioxygenase in Arabidopsis thaliana: Characterization of mutant alleles and regulation by MYB–BHLH–TTG1 transcription factor complexes. Gene 2011, 484, 61–68. [Google Scholar] [CrossRef]
  42. Nakayama, T.; Yonekura-Sakakibara, K.; Sato, T.; Kikuchi, S.; Fukui, Y.; Fukuchi-Mizutani, M.; Ueda, T.; Nakao, M.; Tanaka, Y.; Kusumi, T. Aureusidin synthase: A polyphenol oxidase homolog responsible for flower coloration. Science 2000, 290, 1163–1166. [Google Scholar] [CrossRef]
  43. Ono, E.; Fukuchi-Mizutani, M.; Nakamura, N.; Fukui, Y.; Yonekura-Sakakibara, K.; Yamaguchi, M.; Nakayama, T.; Tanaka, T.; Kusumi, T.; Tanaka, Y. Yellow flowers generated by expression of the aurone biosynthetic pathway. Proc. Natl. Acad. Sci. USA 2006, 103, 11075–11080. [Google Scholar] [CrossRef] [PubMed] [Green Version]
  44. Li, Y.; Zhang, Z.; Peng, W.; Wang, S.A.; Ma, L.; Li, L.; Yang, R.; Ma, Y.; Wang, Q. Comprehensive transcriptome analysis discovers novel candidate genes related to leaf color in a Lagerstroemia indica yellow leaf mutant. Genes Genom. 2015, 37, 851–863. [Google Scholar] [CrossRef]
  45. Yang, H.Y.; Xia, X.W.; Fang, W.; Fu, Y.; An, M.M.; Zhou, M.B. Identification of genes involved in spontaneous leaf color variation in Pseudosasa japonica. Genet. Mol. Res. 2015, 14, 11827–11840. [Google Scholar] [CrossRef]
  46. Schroda, M.; Vallon, O.; Wollman, F.A.; Beck, C.F. A chloroplast-targeted heat shock protein 70 (HSP70) contributes to the photoprotection and repair of photosystem II during and after photoinhibition. Plant Cell 1999, 11, 1165–1178. [Google Scholar] [CrossRef] [PubMed] [Green Version]
  47. Timperio, A.M.; Egidi, M.G.; Zolla, L. Proteomics applied on plant abiotic stresses: Role of heat shock proteins (HSP). J. Proteom. 2009, 71, 391–411. [Google Scholar] [CrossRef]
  48. Waters, E.R. The evolution, function, structure, and expression of the plant sHSPs. J. Exp. Bot. 2013, 64, 391. [Google Scholar] [CrossRef] [Green Version]
  49. Sjögren, L.L.; Macdonald, T.M.; Sirkka, S.; Clarke, A.K. Inactivation of the clpC1 gene encoding a chloroplast Hsp100 molecular chaperone causes growth retardation, leaf chlorosis, lower photosynthetic activity, and a specific reduction in photosystem content. Plant Physiol. 2004, 136, 4114–4126. [Google Scholar] [CrossRef] [Green Version]
  50. Latijnhouwers, M.; Xu, X.M.; Møller, S.G. Arabidopsis stromal 70-kDa heat shock proteins are essential for chloroplast development. Planta 2010, 232, 567–578. [Google Scholar] [CrossRef]
  51. Kim, S.R.; An, G. Rice chloroplast-localized heat shock protein 70, OsHsp70CP1, is essential for chloroplast development under high-temperature conditions. J. Plant Physiol. 2013, 170, 854–863. [Google Scholar] [CrossRef] [PubMed]
  52. Nover, L.; Scharf, K.D. Heat stress proteins and transcription factors. Cell Mol. Life Sci. 1997, 53, 80–103. [Google Scholar] [CrossRef] [PubMed]
  53. Wilkerson, D.C.; Skaggs, H.S.; Sarge, K.D. HSF2 binds to the Hsp90, Hsp27, and c-Fos promoters constitutively and modulates their expression. Cell Stress Chaperones 2007, 12, 283–290. [Google Scholar] [CrossRef] [PubMed]
  54. Xue, G.P.; Drenth, J.; Mcintyre, C.L. TaHsfA6f is a transcriptional activator that regulates a suite of heat stress protection genes in wheat (Triticum aestivum L.) including previously unknown Hsf targets. J. Exp. Bot. 2015, 66, 1025–1039. [Google Scholar] [CrossRef] [Green Version]
  55. Van Buren, C.T.; Rudolph, F. Dietary nucleotides: A conditional requirement. Nutrition 1997, 13, 470–472. [Google Scholar] [CrossRef]
  56. Martin, D.; Schlimme, E.; Tait, D. NUCLEOSIDES AND NUCLEOTIDES IN MILK. Encycl. Dairy Sci. 2011, 10, 971–979. [Google Scholar]
  57. Yang, C.; Hu, Z.; Lu, M.; Li, P.; Tan, J.; Chen, M.; Lv, H.; Zhu, Y.; Zhang, Y.; Guo, L. Application of metabolomics profiling in the analysis of metabolites and taste quality in different subtypes of white tea. Food Res. Int. 2018, 106, 909–919. [Google Scholar] [CrossRef]
  58. Koshiishi, C.; Kato, A.; Yama, S.; Crozier, A.; Ashihara, H. A new caffeine biosynthetic pathway in tea leaves: Utilisation of adenosine released from the S-adenosyl-L-methionine cycle. FEBS Lett. 2001, 499, 50–54. [Google Scholar] [CrossRef] [Green Version]
  59. Zhao, F.; Qiu, X.; Ye, N.; Jiang, Q.; Wang, D.; Peng, Z.; Chen, M. Hydrophilic interaction liquid chromatography coupled with quadrupole-orbitrap ultra high resolution mass spectrometry to quantitate nucleobases, nucleosides, and nucleotides during white tea withering process. Food Chem. 2018, 266, 343–349. [Google Scholar] [CrossRef]
  60. Zhang, Q.; Liu, M.; Ruan, J. Integrated transcriptome and metabolic analyses reveals novel insights into free amino acid metabolism in Huangjinya tea cultivar. Front. Plant Sci. 2017, 8, 291. [Google Scholar] [CrossRef] [Green Version]
  61. Alcázar, A.; Ballesteros, O.; Jurado, J.M.; Pablos, F.; Martín, M.J.; Vilches, J.L.; Navalón, A. Differentiation of green, white, black, Oolong, and Pu-erh teas according to their free amino acids content. J. Agric. Food Chem. 2007, 55, 5960–5965. [Google Scholar] [CrossRef] [PubMed]
  62. Meister, A. Glutathione metabolism. Methods Enzymol. 1995, 251, 3–7. [Google Scholar] [PubMed]
  63. Ivanov, V.; Roomi, M.T.; Niedzwiecki, A.; Rath, M. Anti-atherogenic effects of a mixture of ascorbic acid, lysine, proline, arginine, cysteine, and green tea phenolics in human aortic smooth muscle cells. J. Cardiovasc. Pharmacol. 2007, 49, 140–145. [Google Scholar] [CrossRef] [PubMed] [Green Version]
  64. Sultana, T.; Stecher, G.; Mayer, R.; Trojer, L.; Qureshi, M.N.; Abel, G.; Popp, M.; Bonn, G.K. Quality assessment and quantitative analysis of flavonoids from tea samples of different origins by HPLC-DAD-ESI-MS. J. Agric. Food Chem. 2008, 56, 3444–3453. [Google Scholar] [CrossRef]
  65. Jeng, T.L.; Shih, Y.J.; Wu, M.T.; Sung, J.M. Comparisons of flavonoids and anti-oxidative activities in seed coat, embryonic axis and cotyledon of black soybeans. Food Chem. 2010, 123, 1112–1116. [Google Scholar] [CrossRef]
  66. Ikarashi, N.; Toda, T.; Hatakeyama, Y.; Kusunoki, Y.; Kon, R.; Mizukami, N.; Kaneko, M.; Ogawa, S.; Sugiyama, K. Anti-hypertensive effects of acacia polyphenol in spontaneously hypertensive rats. Int. J. Mol. Sci. 2018, 19, 700. [Google Scholar] [CrossRef] [Green Version]
  67. Kawser Hossain, M.; Abdal Dayem, A.; Han, J.; Yin, Y.; Kim, K.; Kumar Saha, S.; Yang, G.M.; Choi, H.Y.; Cho, S.G. Molecular mechanisms of the anti-obesity and anti-diabetic properties of flavonoids. Int. J. Mol. Sci. 2016, 17, 569. [Google Scholar] [CrossRef] [PubMed] [Green Version]
Figure 1. Phenotype and pigment contents of green-leaf cultivar Rougui (GR) and its yellow-leaf mutant (YR). (a) Leaf color changes between yellow-leaf mutant YR and its original cultivar GR. (b) Performance of YR and GR in the field. (c) Chl a, Chl b, Chl a + b, and total carotenoid contents and the Chl a/b ratio of young shoots with one bud and two leaves from YR and GR. Error bars indicate the standard error of the mean (n = 3). Student’s t test was employed and asterisks indicate significant differences between YR and GR (p < 0.05).
Forests 11 00229 g001
Figure 2. Multivariate statistical analysis of metabolites from YR and GR. (a) PCA score plot of metabolites between the young shoots of YR and GR. (b) OPLS-DA score plot of metabolites between the young shoots of YR and GR. (c) Volcano plot of metabolites between the young shoots of YR and GR. (d) The 130 SCMs were divided into 20 categories, of which 103 were upregulated.
Forests 11 00229 g002
Figure 3. The heatmap of the fold changes of SCMs between the young shoots of YR and GR. The color bar represents the normalized fold change values. Six categories with elevated SCM levels are marked, including nucleotides and derivatives, amino acids and derivatives, vitamins and derivatives, phenylpropanoids, flavones, phenolamides, and organic acids and derivatives.
Forests 11 00229 g003
Figure 4. Top 20 KEGG pathways enriched in DEGs.
Forests 11 00229 g004
Figure 5. Validation of the transcription levels for randomly selected DEGs by qRT-PCR.
Forests 11 00229 g005
Figure 6. DEGs and SCMs involved in pigment metabolism pathways. (a) Chlorophyll biosynthesis pathway. (b) Carotenoid biosynthesis pathway. (c) Flavonoid biosynthesis pathway. Rectangles marked with green and red backgrounds represent reduced and increased levels of DEGs and SCMs, respectively.
Forests 11 00229 g006
Table 1. The quality of the transcriptomes.
SampleRaw ReadsClean ReadsQ30 (%)GC (%)Mapped Reads
YR-155,732,05255,070,78294.4545.0449,715,811 (90.28%)
YR-250,415,11649,803,89094.4144.7944,611,657 (89.57%)
YR-356,617,69855,996,14894.4745.0350,435,426 (90.07%)
GR-146,363,71645,786,04094.4445.0741,279,330 (90.16%)
GR-264,345,87663,608,84494.4445.0157,375,551 (90.20%)
GR-353,805,93653,119,88293.9845.1447,935,221 (90.24%)
Table 2. Differentially expressed TFs and heat shock proteins (HSPs) in the young shoots of YR and GR.
Gene IDDescriptionFamilyYR/GR
TEA005927.1Heat shock transcription factor A6BHSF1.57
TEA012764.1HSF family proteinHSF2.50
TEA022795.1Heat shock transcription factor B2AHSF1.58
TEA023633.1Heat shock transcription factor A2HSF2.21
TEA023493.1ERF family proteinERF2.08
TEA021676.1SCARECROW-like 13GRAS2.28
TEA002467.1WRKY DNA-binding protein 33WRKY1.52
TEA026168.1NAC domain containing protein 25NAC0.12
TEA006753.1Squamosa promoter binding protein-like 3SBP0.66
TEA028581.1TEOSINTE BRANCHED, cycloidea and PCF 14TCP0.66
TEA004360.117.3 kDa class I heat shock proteinsHSP1.52
TEA016722.1Heat shock 70 kDa protein 4HSP701.89
TEA027790.1Heat shock protein 83HSP901.90
Table 3. DEGs and SCMs involved in other metabolic pathways.
Pathway Nameko IDGenes (Fold Change)Metabolites (Fold Change)
Ascorbate and aldarate metabolismko00053Inositol oxygenase (0.60)L-ascorbate (2.05)
Inositol oxygenase (0.45)
Inositol phosphate metabolismko00562Inositol oxygenase (0.60)D-Glucose 6-phosphate (1.55)
Inositol oxygenase (0.45)
Starch and sucrose metabolismko00500Trehalose 6-phosphate phosphatase (0.67)D-Glucose 6-phosphate (1.55)
Phenylpropanoid biosynthesisko00940Peroxidase (2.17)Sinapoylcholine (1.67)
Shikimate O-hydroxycinnamoyltransferase (12.64)Cinnamic acid (3.85)
Scopolin (1.55)
Methoxycinnamaldehyde (0.47)
Glutathione metabolismko00480Glutathione S-transferase (2.23)Glutathione (3.21)
L-ascorbate (2.05)
γ-Glu-Cys (2.52)
5-oxoproline (3.69)
Sulfur metabolismko00920Adenylyl-sulfate reductase (0.47)L-Serine (1.52)
L-Homoserine (1.55)

