Article

Impact of Urban Vegetation on Outdoor Thermal Comfort: Comparison between a Mediterranean City (Lecce, Italy) and a Northern European City (Lahti, Finland)

1
Dipartimento di Scienze e Tecnologie Biologiche ed Ambientali, University of Salento, 73100 Lecce, Italy
2
Faculty of Technology, LAB University of Applied Sciences, Mukkulankatu 19, 15210 Lahti, Finland
3
School of Computing, Engineering and Built Environment, Glasgow Caledonian University, Glasgow G4 0BA, UK
4
Fagus Lab S.r.l., 00168 Roma, Italy
5
Atmospheric Pollution Division, Environmental Department, CIEMAT, 28040 Madrid, Spain
*
Author to whom correspondence should be addressed.
Forests 2020, 11(2), 228; https://doi.org/10.3390/f11020228
Submission received: 13 December 2019 / Revised: 12 February 2020 / Accepted: 13 February 2020 / Published: 18 February 2020
(This article belongs to the Special Issue Nature-Based Solutions in Urban Forestry Planning and Management)

Abstract

:
This paper is devoted to the application of the modelling approach, as one of the methods for the evaluation of thermal comfort, to neighborhoods located in two cities characterized by a different climate, i.e., a Mediterranean city in southern Italy (Lecce) and a northern European city in southern Finland (Lahti). The impact of the presence of vegetation in both places is evaluated and compared, further considering alternative scenarios for thermal comfort improvement. The thermal comfort condition is expressed in terms of indices (mean radiant temperature (MRT) and predicted mean vote (PMV)). Results show that at pedestrian level the presence of vegetation lead to an improvement of thermal comfort in summer of about 2 points in both neighborhoods. This improvement is also evident observing the spatial distribution of MRT with a difference of 7 °C in the Lecce neighborhood and 3 °C in Lahti. In winter, thermal discomfort is observed in the presence of vegetation with a difference of 1.3 °C in the Lecce neighborhood and 1.5 °C in Lahti in terms of MRT. However, trees and green cover have the important potential to offset climate change impact and to make urban environments less thermally stressful. This study aims to guide urban planners towards a motivated and necessary transaction towards new green infrastructure whose effect should, however, be analyzed and investigated case by case.

1. Introduction

In the face of rapid changes to global climate [1] as well as increasing urbanization [2], the role of cities in both mitigating the changes to climate as well as adapting to cope with the negative consequences of such changes is receiving great attention [3]. Given the superimposing effect of microclimate variations due to urbanization (the so-called urban heat island effect [4]), the importance of making urban space attractive and accessible has the double benefit of climate change mitigation as well as social, cultural and economic benefits [5]. Furthermore, the optimization of the outdoor environment could also save heating and air-conditioning energy consumption by buildings, leading to reductions in carbon emissions, thus positively contributing to tackling climate change itself [6].
There are several ways comfort, usability and attractiveness of outdoor spaces could be enhanced. The key principle is to integrate local climate with urban form and the fabric of the building [7]. These could be achieved by the manipulation of settlement geometry, street orientation and external factors [8] as well as climatically linking the inside of buildings with the outside [9]. Perhaps the greatest benefit to outdoor comfort is achieved by the introduction of green infrastructure (e.g., [10,11,12,13,14]). In general, green infrastructure provides health and climate-related ecosystem services in urban environments. In this way, the role of vegetation is related to the following environmental improvements ([15,16]):
  • microclimate: increasing urban vegetation induces decreasing air and surface temperatures. In particular, trees influence the thermal environment by providing shade, intercepting radiation with their canopy and reducing surface temperature, followed by heat transference through convection from warmer areas. Additional cooling is provided by the conversion of radiation into latent heat and evapotranspiration [17,18];
  • pollutant dispersion: vegetation modifies wind-flow patterns in the streets;
  • deposition and absorption of pollutants: urban vegetation increases the pollutants removed from air by means of deposition or uptake via leaf stomata;
  • noise attenuation: trees can attenuate traffic noise, in particular close to roads or open busy streets.
In contrast, the presence of vegetation may induce adverse effects such as the direct emission of biogenic volatile compounds (precursor of the formation of secondary pollutants like ozone) and pollen.
In this context, the aim of this paper is to quantify the effect of vegetation on thermal comfort (in terms of mean radiant temperature (MRT) and predicted mean vote (PMV)) in real urban environments. Specifically, two different neighborhoods in cities with different climate conditions are studied, a Mediterranean city in southern Italy and a Northern European city in Southern Finland. For each neighborhood three vegetation scenarios in winter and summer are analyzed with the objective of assessing the influence of vegetation on outdoor thermal comfort and providing helpful knowledge to urban planners that can improve living conditions in the urban environment.

2. Outdoor Thermal Comfort

2.1. Thermal Comfort and Vegetation

Thermal comfort is “a condition of mind which expresses satisfaction with the thermal environment” [19]. Given the subjective nature of this definition, Höppe [20] suggested there could be two additional bases to define comfort: thermo-physiological and heat balance of the human body. Although indoor comfort has been studied for a long time, studies on outdoor comfort only began to increase around the early 2000s [21], and as such developments in the field remain experimental in nature.
Outdoor spaces are important to sustainable cities because they encourage pedestrian traffic and outdoor activities, and contribute greatly to urban liveability. The influence of thermal comfort on outdoor activities is a complex issue comprising both climatic and behavioral aspects, as recently underlined by Chen and Ng [22] in their review of the behavioral aspects of outdoor thermal comfort focusing on perceptions of outdoor thermal comfort and the use of outdoor space in the context of urban planning. In fact, while thermal comfort indoors is influenced by four ‘environmental’ variables (air temperature, air velocity, humidity and mean radiant temperature) as well as two ‘subjective’ variables (level of clothing insulation on the body and metabolic rate [23]), there is no clear agreement on the factors influencing outdoor comfort beyond those of the indoors. Höppe [20] argued that psychological aspects are more important to outdoor comfort than the indoors. Outdoor comfort is more difficult to measure than that indoors since the outdoor environment is much more complex; the spatial and temporal microclimatic variations of meteorological variables are often very large. The lack of climate control in outdoor spaces makes measurements difficult [21].
Urban vegetation is recommended as a heat-mitigation strategy in cities [24,25,26]. This strategy is considered better than using high albedo materials on the ground for improving pedestrians’ thermal comfort [17,18]. Outdoor thermal comfort is altered by vegetation through evapotranspiration processes, sun reflection, solar protection (shading) and alteration of wind flow. Specifically, vegetation provides transpirational cooling because the absorbed solar energy causes an increase of latent heat (water from vegetation is evaporated into the atmosphere) thus cooling the leaf surfaces and the air around them. These processes are usually modelled by means of a volumetric cooling power per unit volume vegetation as a function of the leaf area density (LAD) [27,28,29]. In addition, the presence of vegetation increases the overall short-wave reflectivity of the city. Therefore, vegetation absorbs and stores less heat than building materials. Moreover, tree shading prevents the rise of air and surface temperature because trees intercept solar radiation [30].

2.2. Methods and Indices for the Evaluation

The outdoor thermal comfort evaluation is usually carried out following two methods in combination: micro-meteorological measurements or modelling and guided user questionnaire survey. The first method includes physical measurements or modelling of the microclimatic conditions at the immediate surroundings of the subjects. The four main physical parameters that characterize the thermal environment and the thermal comfort sensation are air temperature, relative humidity, wind and solar radiation. The second method consists, instead, of a questionnaire survey addressing the subjects’ thermal comfort sensation and also record of subjects’ demographic background (height, weight, gender and age) during the survey. The thermal comfort sensation can be recorded in any one of the thermal comfort scales, such as, for example, the American Society of Heating, Refrigeration and Air conditioning Engineers (ASHRAE) scale and the Bedford scale [31]. A subject’s thermal comfort sensation votes are obtained by face-to-face interviews while a subject’s demographic background, clothing and activities are observed and recorded by the interviewer while conducting the survey. The results of the questionnaire survey are correlated with the micro-meteorological data obtained from measurements or modelling to analyze the general thermal comfort conditions in the outdoor spaces of that place and the comfort requirement of the local people [32].
Several outdoor thermal comfort indices currently exist and Blazejczyk et al. [33] listed more than 100 thermal comfort indices, but the vast majority of these were developed for indoor conditions. Reviewing the most common comfort indices used in outdoor comfort studies, Johansson et al. [21] found only two indices that were specifically developed for the outdoors: the Physiologically Equivalent Temperature (PET) [34] and the Universal Thermal Climate Index (UTCI) [33,35]. PET is based on the four environmental variables mentioned earlier, while keeping clothing and activity rate constant. UTCI, on the other hand, is independent of clothing insulation (assumed to be a function of air temperature and wind speed, using an adaptive clothing model [36]) with activity rate “standardized” (for a walking person at 1.1 m/s speed, expending 135 W/m2 of energy). Nevertheless, Johansson et al. [21] found several indoor comfort indices commonly used in outdoor studies as well (such as PMV [19]; the Standard Effective Temperature (SET) and the Effective Temperature (ET) [37]). They also provided an overview of instruments and methods in outdoor thermal comfort measurements, while Cheung and Jim [13] systematic reviewed outdoor neutral temperature. Comprehensive reviews of available tools for modelling outdoor human comfort and thermal stress, physical equations that drive these models, and their applicability based on climate and the findings of previous research were given by Coccolo et al. [38] and Binarti et al. [39].
The increasing attention on outdoor comfort in recent years has led to wider geographical coverage, from sub-Arctic [40] to hot, dry climate (Fez, Morocco) [41], to the tropics (Dhakka [42]; Rio de Janeiro, [43]; Putra Jaya, Malaysia, [44]). A comprehensive review of outdoor comfort and thermal stress was recently presented by Coccolo et al. [38].

3. Application of the Modelling Method
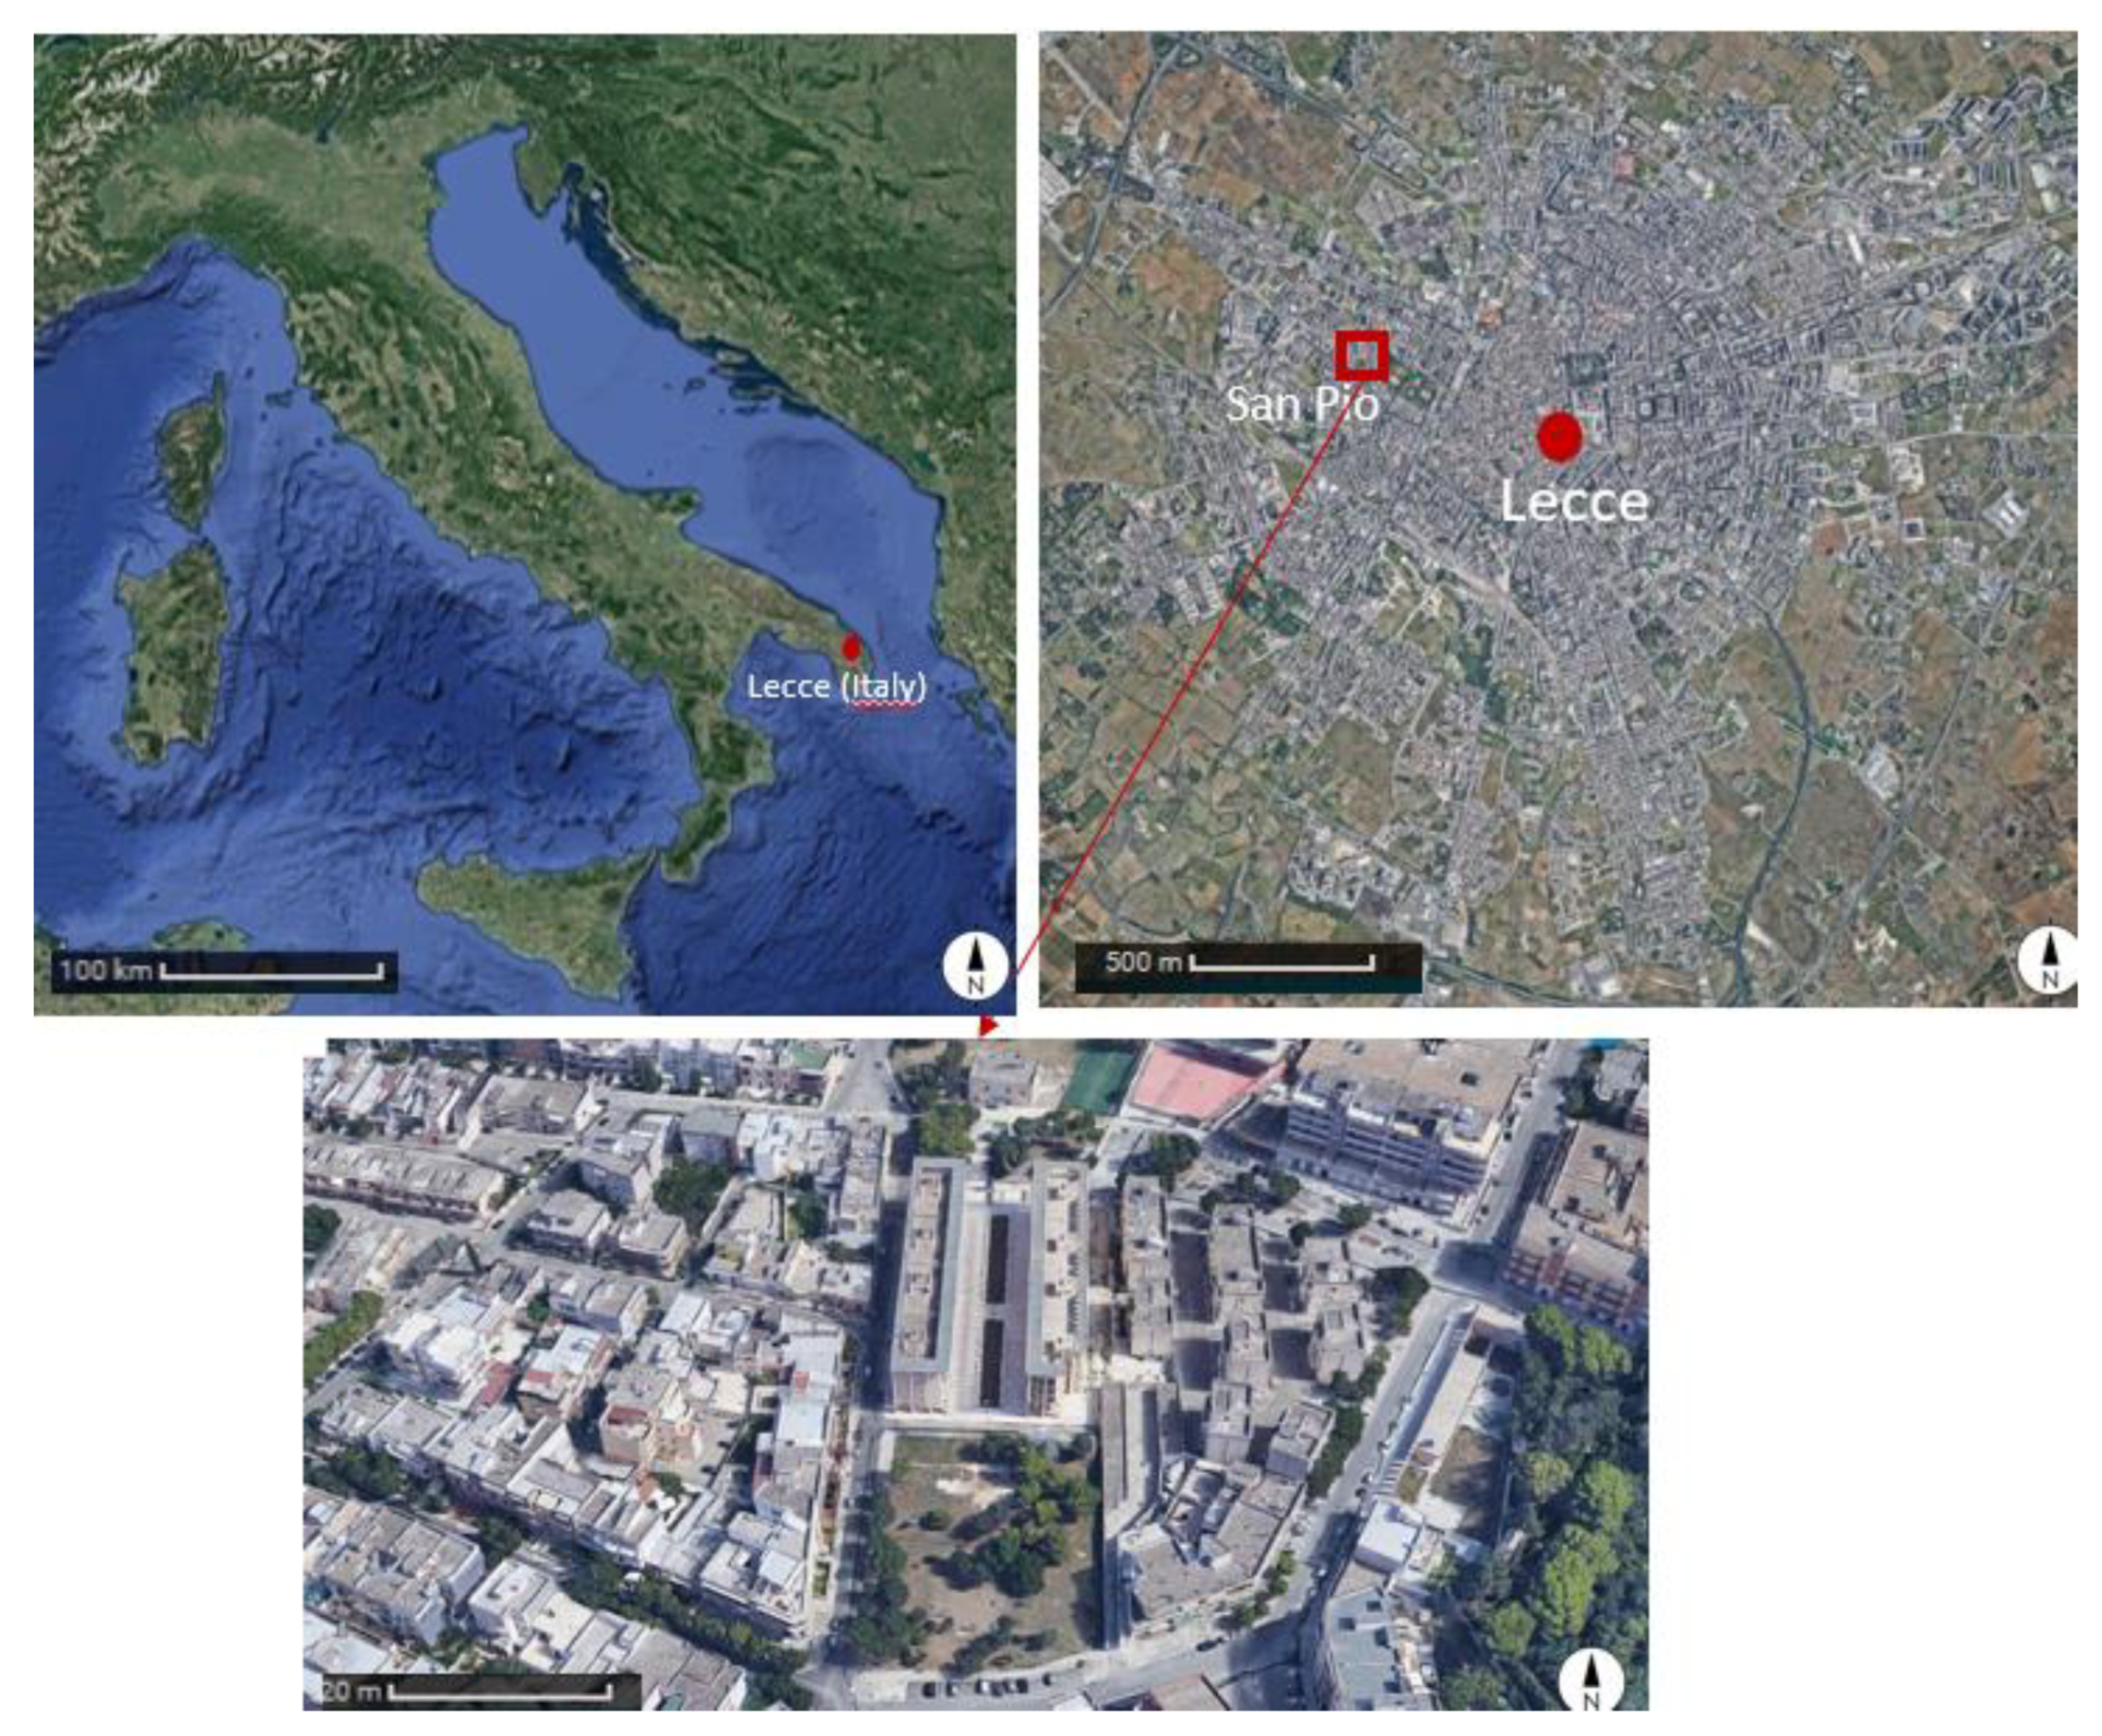
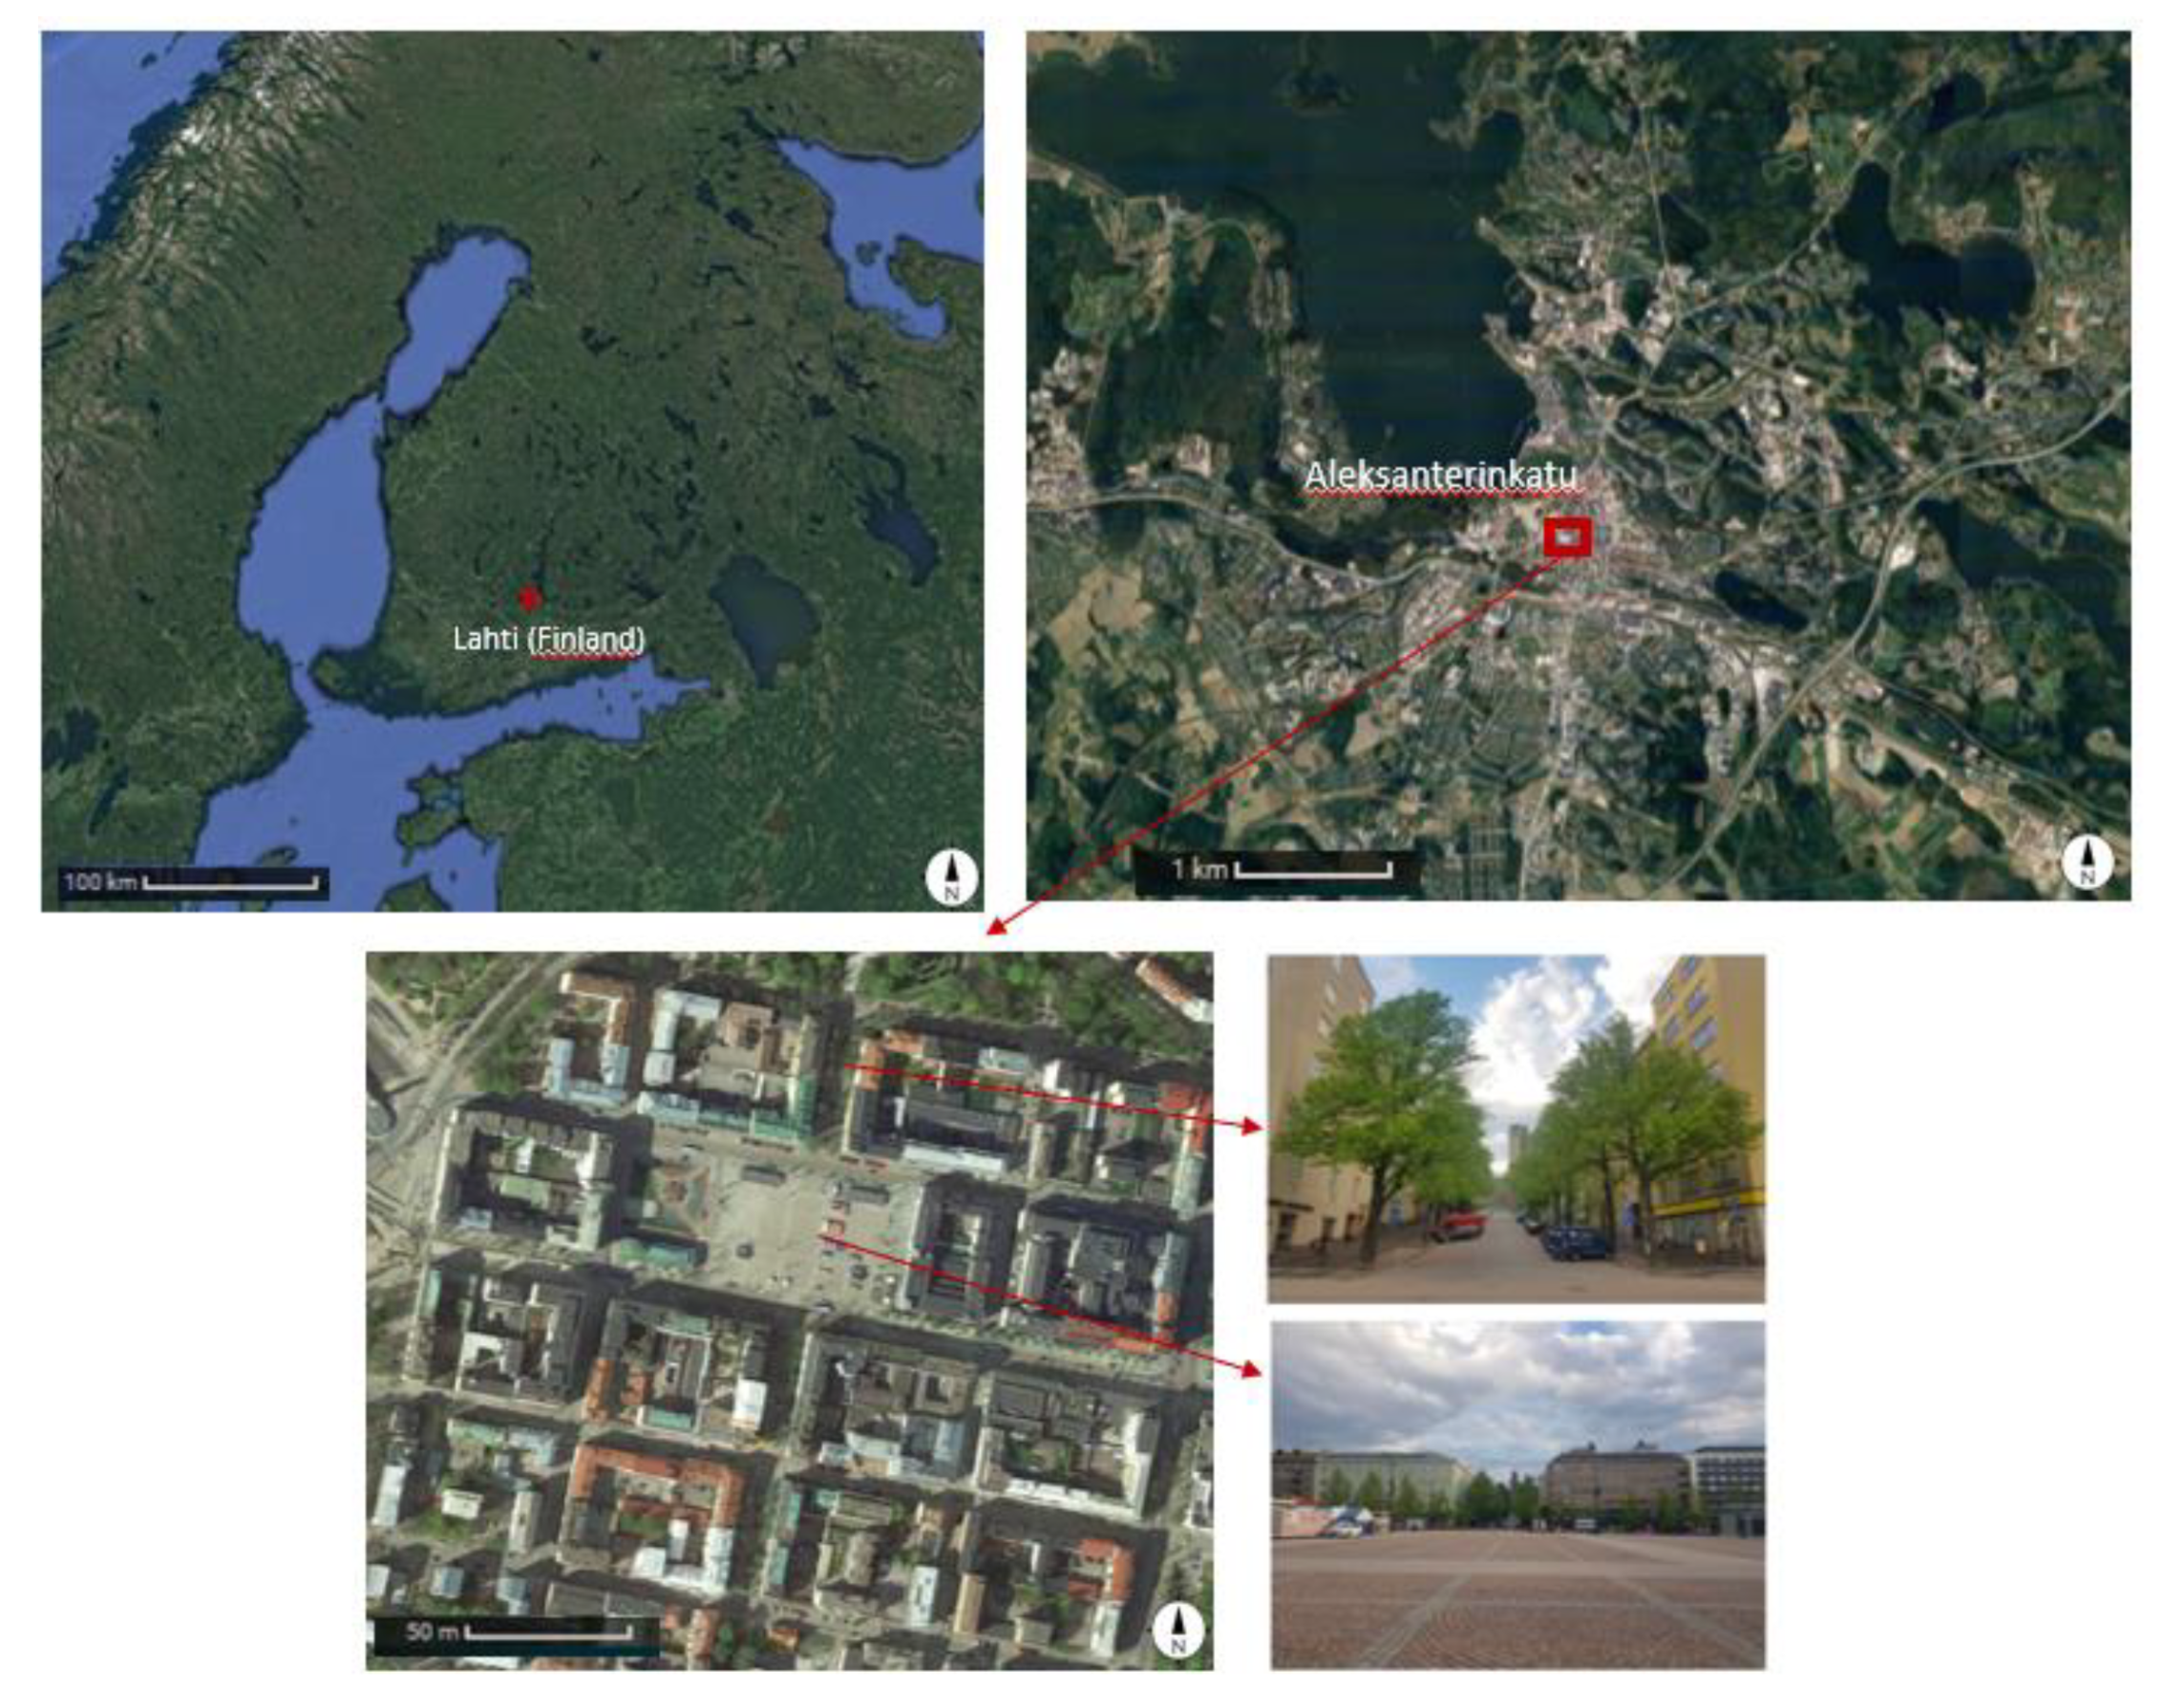
3.1. Study Areas

The neighborhoods analyzed here are located in Lecce (southern Italy) and Lahti (southern Finland), two medium-sized cities representative of Mediterranean and European Northern cities in terms of architectural design and climate. The two neighbourhoods are San Pio in Lecce (Figure 1) and Aleksanterinkatu in Lahti (Figure 2). Both sites are centrally located and highly populated, therefore they are important objects of study. The details about building arrangement and height were acquired through computer-aided design (CAD) files already available for the two cities.
Lecce (UTM coordinates: 40°21′7.24″ N, 18°10′8.9″ E) (Figure 1, top), with about 95,000 inhabitants (http://demo.istat.it/pop2019/index.html), is built on a flat land, approximately 40–50 m a.s.l. In the Köppen–Geiger classification, Lecce belongs to the Warm Mediterranean Climate Csa class, with dry and hot summers, due to the domination of subtropical high-pressure systems, and mild and wet winters with moderate and changeable temperatures. The selected neighborhood is located about 13 km west from the Adriatic sea and about 25 km east from the Ionian sea. The Mediterranean region is potentially vulnerable to climatic changes because it is affected by interactions between mid-latitude and tropical processes being in a transition zone between the arid climate of North Africa and the temperate and rainy climate of central Europe [45]. The area has already been investigated in Maggiotto et al. [46] and was found to be characterized by higher air temperatures compared to surrounding areas. For these reasons, it is interesting to study possible climate change mitigation strategies in this area. The urban morphology is characterized by two- to three-story buildings and narrow street canyons. The selected neighborhood (San Pio) is located on the western side of the city (Figure 1, top and bottom) and, as mentioned, it has been considered interesting to study since it is a very busy residential area, not far from the city center, inhabited by students and families. It is also currently involved in a local urban regeneration project. Buildings, despite the different heights ranging between 4 m to 16 m with an average height of 9 m, are distributed in a rather regular pattern covering 33% of the area. There are 36 trees and hedges species covering 9% of the area, with the most abundant being Tilia sp. (deciduous), Pinus halepensis Mill. (evergreen), Magnolia grandiflora L. (evergreen), Quercus ilex L. subsp. ilex (evergreen). Trees heights range between 3 m and 14 m, while hedge heights range between 2 m and 3 m.
Lahti (UTM coordinates: 60°59′1.291′′ N, 25°39′1.141′′ E) has about 119,000 inhabitants. It is located roughly 70 km to the north of the average coastline of the Gulf of Finland. In Köppen’s climate classification, it belongs to the Warm Summer Continental Climate Dfb class, with warm to hot summers and cold winters. It is situated in the region of Päijät-Häme, which is dominated by several lakes. Lake area begins on the northern side of the city where Lake Vesijärvi (located about 1 km north-east from the selected neighbourhood) is connected with one of the biggest Finnish inland lakes, Lake Päijänne (located about 12 km north-east from the selected neighbourhood), that has a significant impact on the climate of the region, especially in winter when it stays unfrozen for a long period. The coldest month on the region is usually February during which the average temperature is between −7 °C and −8 °C. July is typically the warmest month of the year and the temperature is on average +16.5 °C in the whole region [47,48,49]. The urban morphology is characterised by a regular grid plan with asphalted streets and 4 to 8 story stone houses [47]. The selected neighbourhood (Aleksanterinkatu) is located in the city centre (Figure 2, top). Similar to the Lecce neighbourhood, the buildings, despite the different heights ranging between 13 m and 20 m with an average height of 16 m, are distributed in a rather regular pattern covering 22% of the area. Rows of Tilia cordata Mill. (deciduous) with an average height of 15 m are present, covering 5% of the area (Figure 2, bottom).
Table 1 lists all the species identified during ad hoc field campaigns (see Section 3.3) in both neighbourhoods. Please note that in San Pio some individuals of the same species (indicated by different numbers in the table) are morphologically different and, therefore, characterized by different LADs.

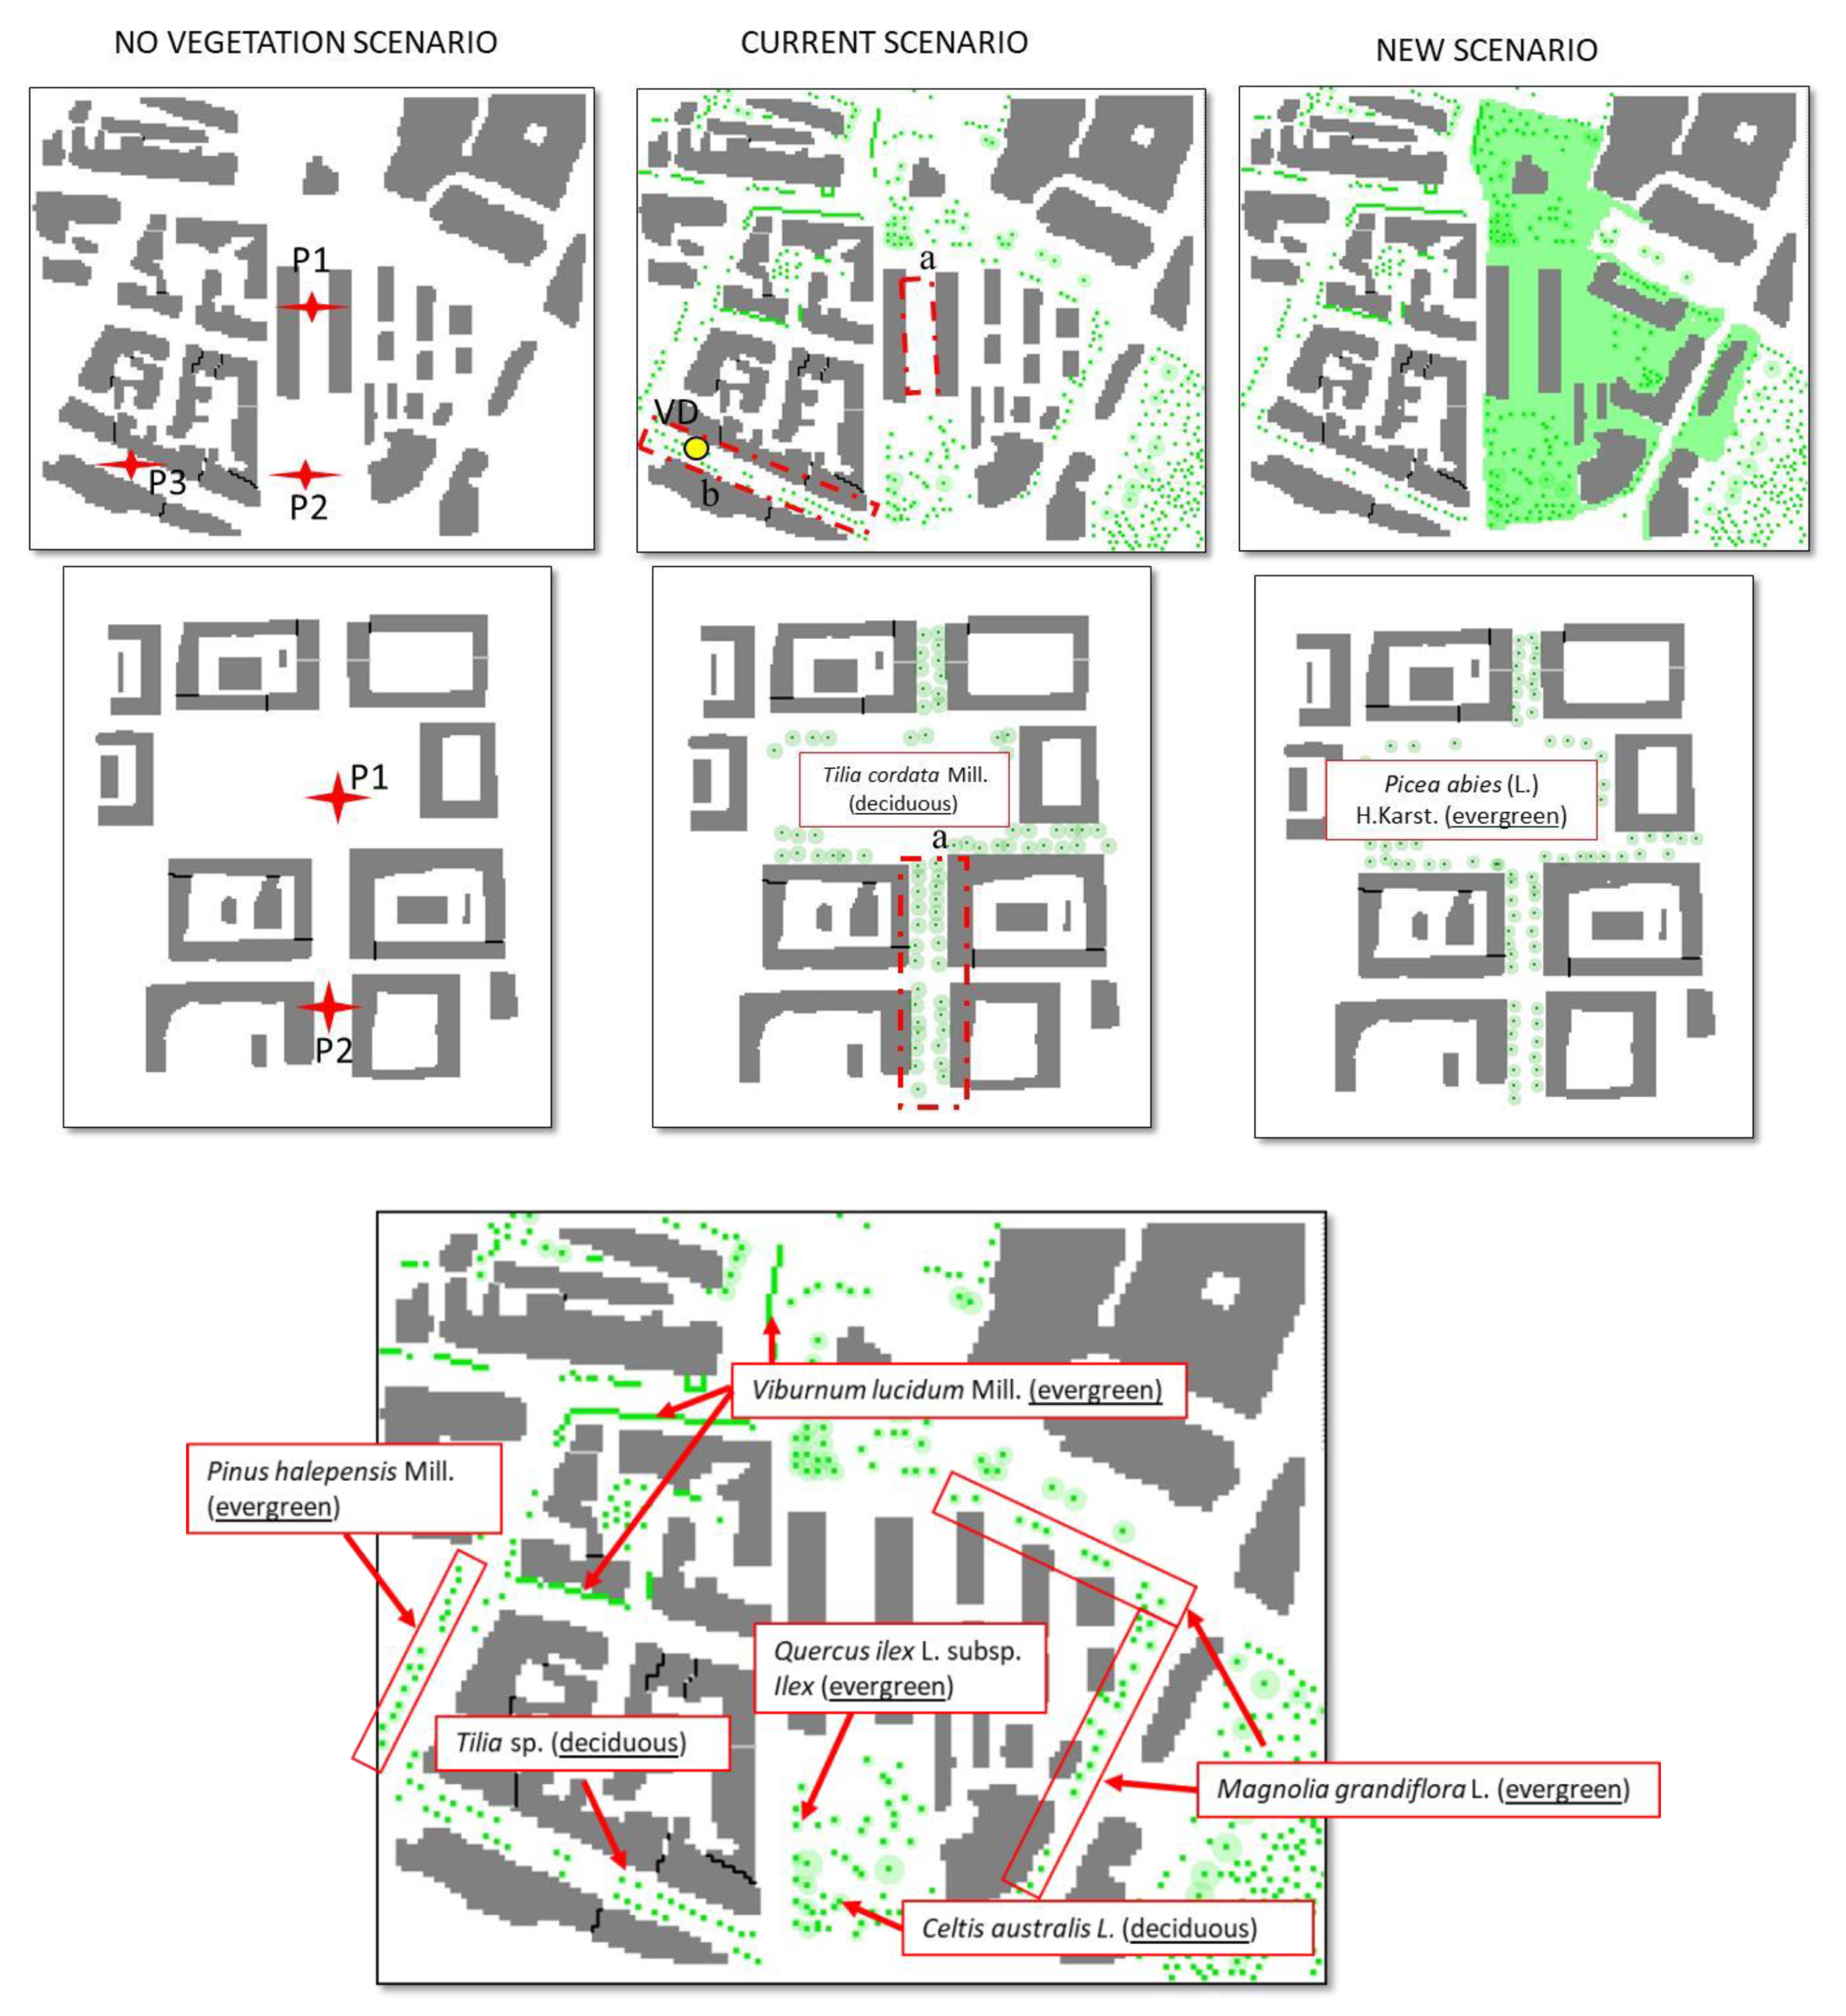
3.2. Scenarios Investigated

The two neighbourhoods are characterized by several street canyons. In this study, the focus is on the street canyons highlighted in red in Figure 3. In San Pio, the street canyon aspect ratio H/W (where H is the mean height of the buildings and W the mean width of the street) is equal to 1.8 for the street canyon “a” and 1 for the street canyon “b”. In Aleksanterinkatu, the street canyon “a” has an aspect ratio H/W of 1. Further several points shown in the figure are considered since they fall within areas of interest: in San Pio P1 and P3 are located in street canyons “a” and “b”, respectively, while P2 is located in the pocket park “Parco Corvaglia”, which is a traffic-free open space different from the surrounding areas and characterized by several types of vegetation (evergreen and deciduous trees) and soil (aerate soil bounded by a concrete sidewalk). In Aleksanterinkatu, P1 is located in the traffic-free square, while P2 is located in the street canyon “a”. The selected points enable the investigation of the impact of vegetation on air temperature and thermal comfort in summer and winter under different local microclimate (Lecce and Lahti), taking into consideration leaf types (deciduous vs. evergreen) and LAD for vegetation, and street canyons vs. open space for urban geometry.
For both neighbourhoods, three scenarios are investigated (Figure 3): (i) a no vegetation scenario for comparison and evaluation of the effects of vegetation, (ii) the current scenario and (iii) a new scenario. In particular, for San Pio (Figure 3 top and bottom), following a local urban regeneration project which consists in the reconstruction of some decaying buildings and green repaving, concrete surfaces are replaced by grass in one area, the distribution of buildings (+2% respect to the current one) is changed in a specific area at the right of the map where 7 evergreen Quercus ilex subsp. ilex are added; further in the street canyon “b” one row of deciduous trees (Tilia sp.) is removed. In the street, in fact, the local municipality intends to remove such trees because their roots are causing damage to the road and the sidewalks. The new scenario has 2% more vegetation with respect to the current one. For Aleksanterinkatu (Figure 3 middle), Tilia cordata (LAD = 0.5 m2m–3) is replaced by a 11 m high Picea abies (evergreen) with a LAD equal to 1.00 m2m–3. In this way, as well as evaluating the effect of two different species which strongly characterise the landscape of the study area, it is possible to evaluate the effect of the presence of tree crown in winter, being Picea abies an evergreen species.

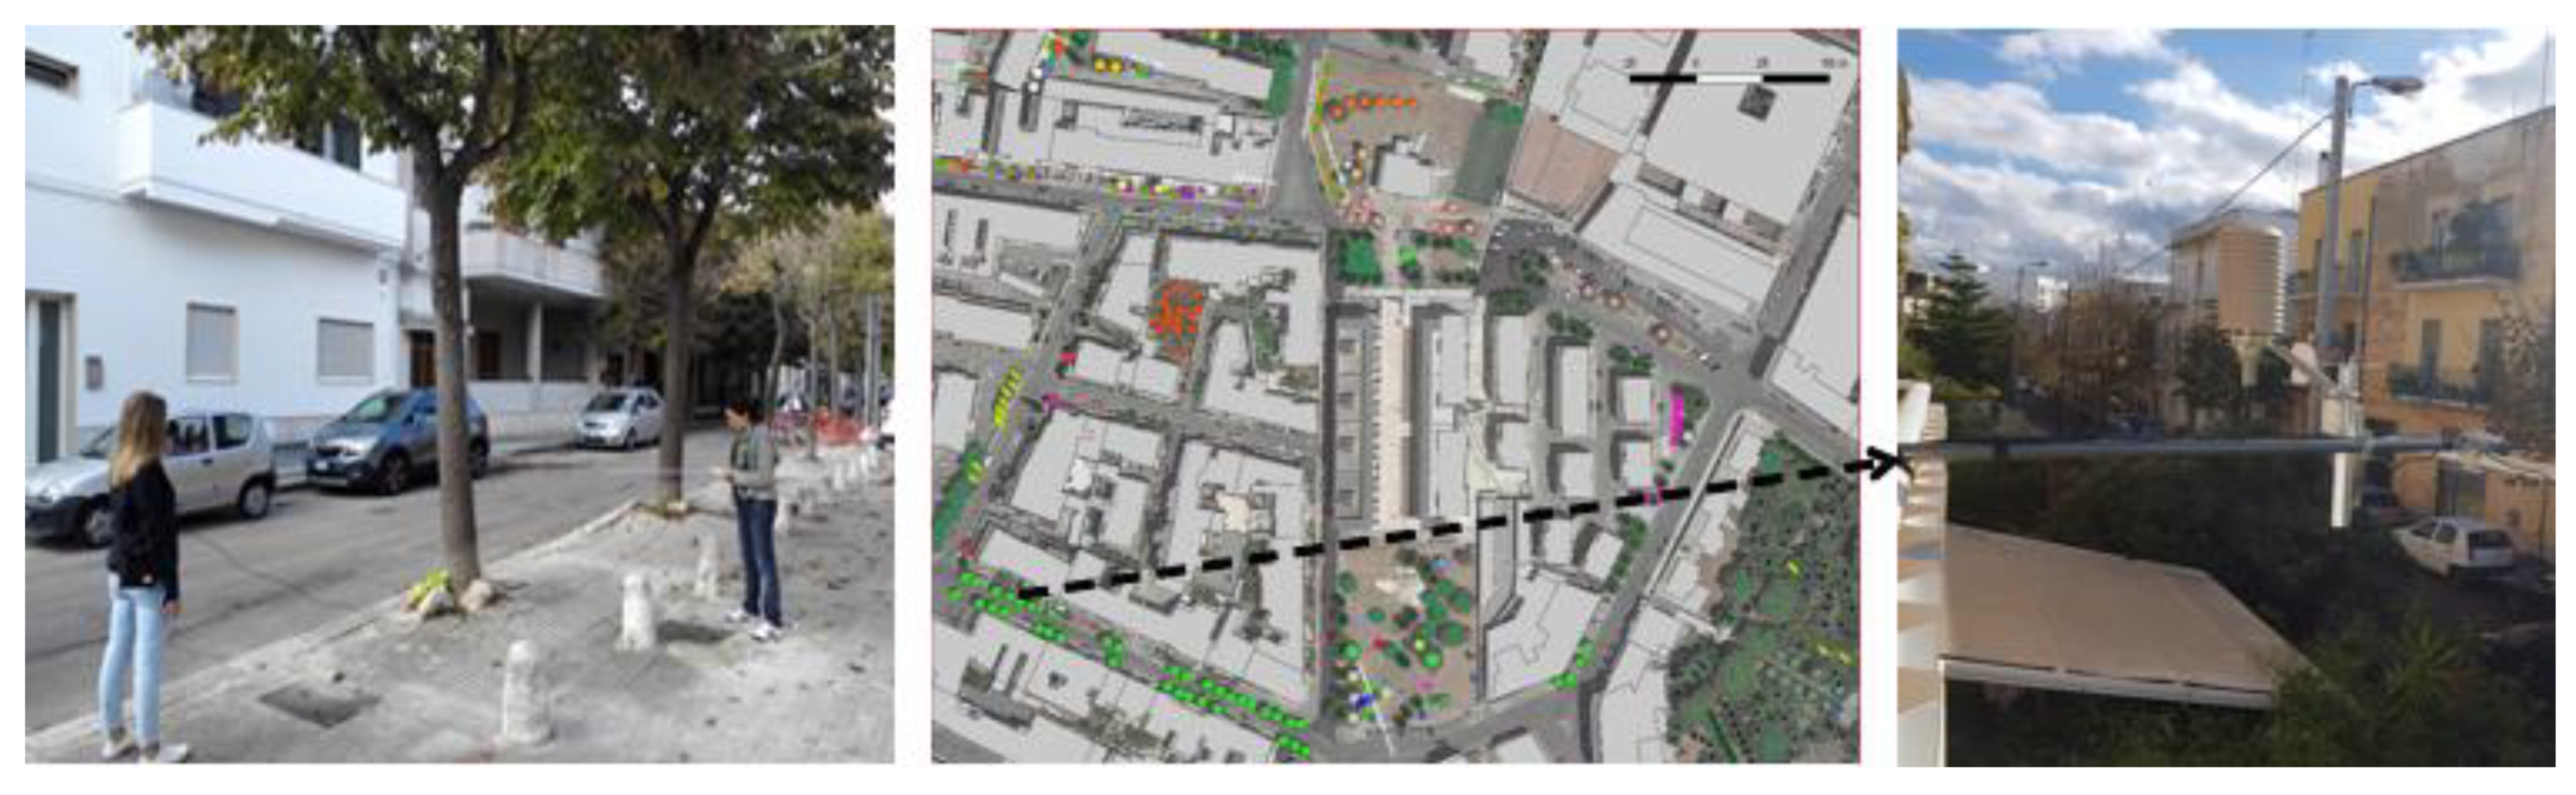
3.3. Field Measurements

The height and the width of all trees and hedges present in both neighborhoods (current scenarios) were measured and/or estimated using the comparative method with subjects of known height. LAD was only estimated for San Pio using an Accu-PAR LP80 ceptometer. Specifically, the leaf area index (LAI) of tree crowns was calculated considering the change in photo-synthetically active radiation (PAR) acquired by the ceptometer above (where the sensor measured unobstructed PAR) and below (where it was supposed that the LAI is maximum) the crown (Figure 4, left). All measurements were taken parallel to the ground. Ten replicas were undertaken to avoid the influence of incorrect values, due to other shadows, or being taken out of the canopy. The measurements were taken at midday in two sunny days to prevent the influence of the solar zenith angle. The LAD was thus estimated dividing LAI by the depth of the tree crown (Table 1). For Aleksanterinkatu, the values of LAD already available in the database of the ENVI-met model employed in this study (see Section 3.4) were used.
In order to validate ENVI-met simulations, air temperature Tair and relative humidity (Rh) measurements were carried out continuously in San Pio in the period 22 November–18 December 2018 using a Vaisala HMP45C thermo-hygrometer (Figure 4, right). The sensor was mounted on the banister of a balcony at the first floor of a building, 5 m above ground level (a.g.l.) to be representative of the urban canyon conditions. This was considered a reasonable compromise overcoming some of the inherent difficulties in positioning instruments in urban street canyons such as security from vandalism and limited access. The sensor was connected to a Campbell CR3000 data logger which stored 10 min average values.

Experimental Limitations

In Lecce, meteorological measurements in the summer period July–August were not performed due to the unavailability of any other appropriate location, but they are scheduled for summer 2020. In Aleksanterinkatu, meteorological instruments and the ceptometer were not available in the selected periods, but measurements are planned in the near future.

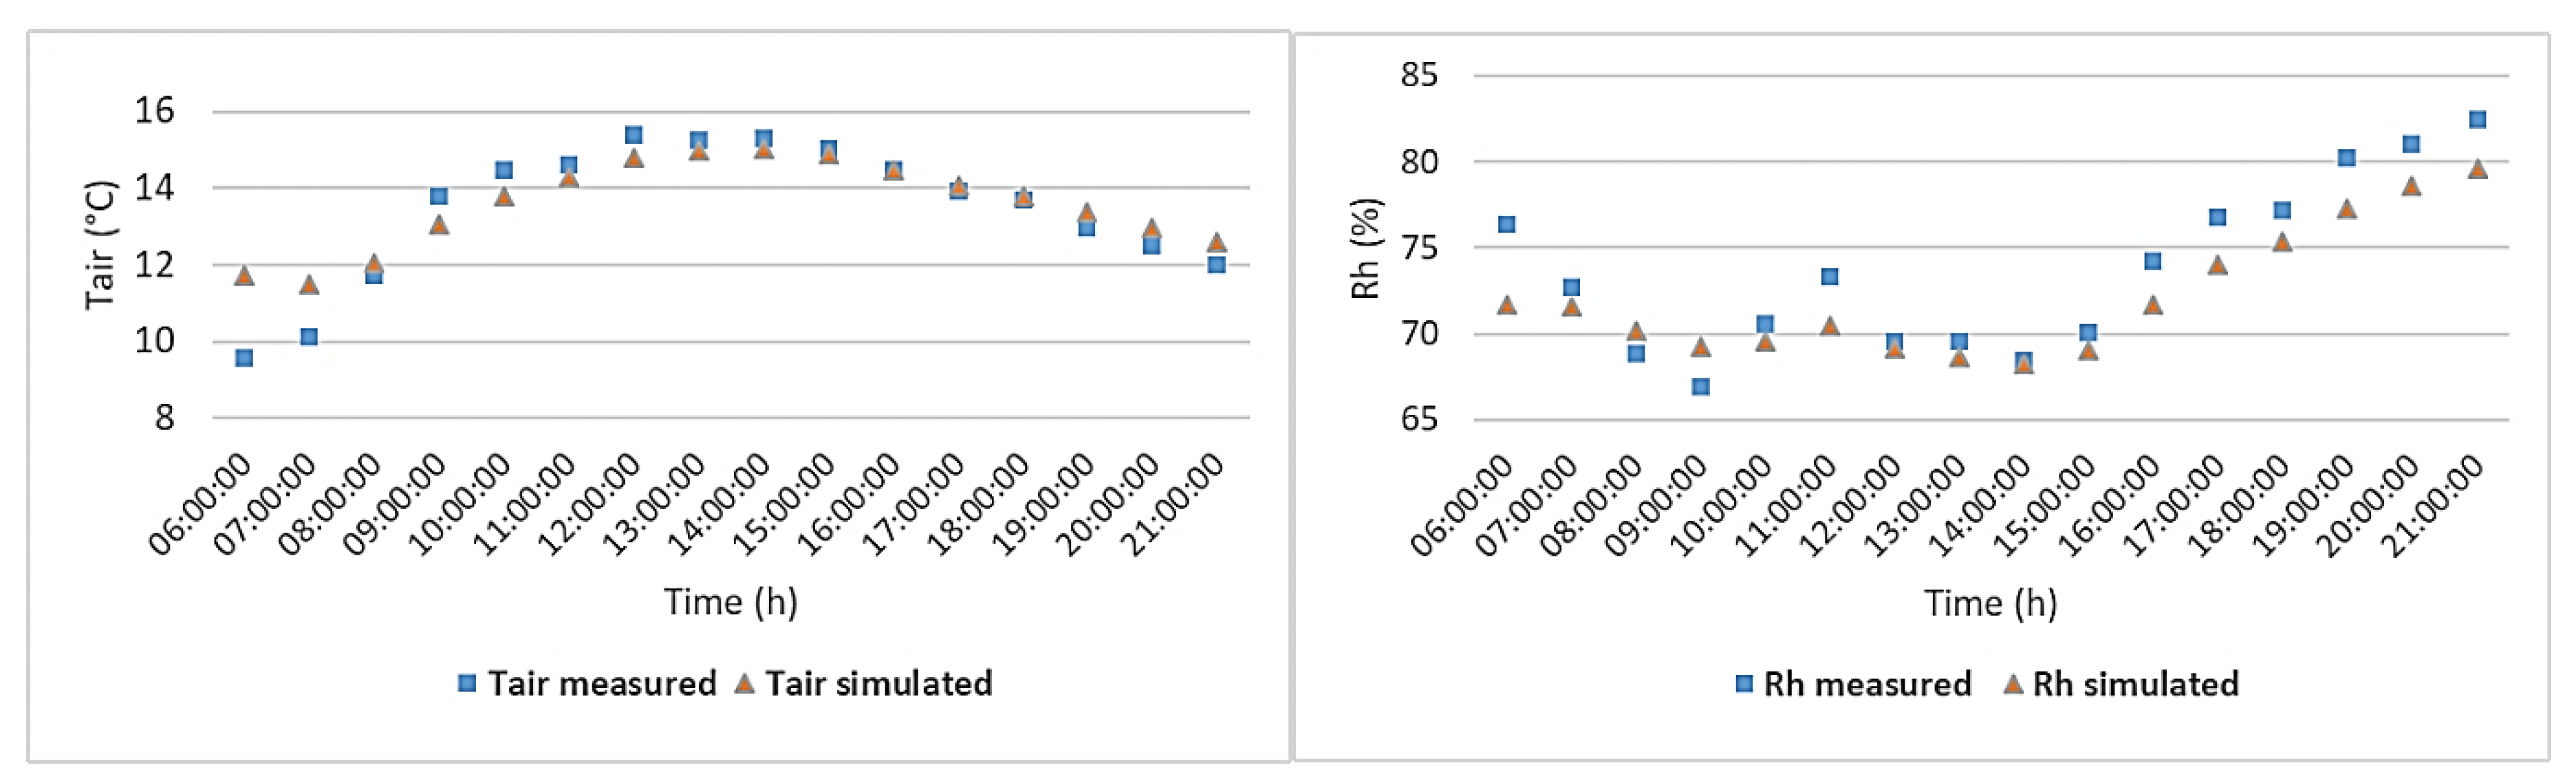
3.4. Modelling Set-Up and Evaluation

With the aim of showing the application of the modelling method to evaluate the outdoor thermal comfort and compare the effect of vegetation in both neighbourhoods, modelling simulations were performed using the computational fluid dynamics (CFD) and microclimate model ENVI-met. ENVI-met is a prognostic non-hydrostatic model for the simulation of surface-plant-air interactions composed by a 3D main model and in addition a one dimensional (1D) atmospheric boundary layer (ABL) model which extends from the ground surface up to 2500 m. ENVI-met has a typical horizontal resolution from 0.5 m to 5 m and a typical time frame of 24 h to 48 h with a time step of 1 s to 5 s, which meet the criteria for the accurate simulation of physical processes, suitable for microclimate studies at the neighbourhood scale. The atmospheric system solves Reynolds-averaged Navier–Stokes equations using a 1.5 order turbulence closure k-ε model. See the ENVI-met official website (https://www.envi-met.com/) for a complete documentation.
The 3D simulation area (computational domain) of the San Pio neighbourhood had a dimension of 350 m (x direction) × 282 m (y direction), while the Aleksanterinkatu neighbourhood had a dimension of 400 m (x direction) x 450 m (y direction), with a vertical height of 60 m both. The areas, which include buildings and vegetation described in Section 3.1, Section 3.2 and Section 3.3, were meshed with a grid resolution of 2 m × 2 m × 2 m, except for the lowest five cells (close to the ground) whose vertical resolution was 0.4 m. To improve model accuracy and stability, 5 nesting grids were also employed. Hourly air temperature and relative humidity were forced at the model boundary to drive the simulation with meteorological input obtained from a 10 m-high ARPA-Puglia (the Regional Agency for Environmental Protection of the Apulia region) meteorological station for the San Pio neighbourhood and from a 10 m high Finnish Meteorological Institute (FMIdata®) meteorological station for the Aleksanterinkatu neighbourhood. These stations are located over a distance of about 4 km from the study areas. The hottest summer day and the coldest winter day with the prevailing wind speeds and directions were chosen considering the winter period 22 November–20 December 2018 (field campaign period) and the summer period June–August 2019 for San Pio, and the winter period January–March 2019 and the summer period June–July 2019 for Aleksanterinkatu. The cyclic-type method was selected for the lateral boundary conditions (LBC) because the study areas are located in the city with a similar layout. For each case, ENVI-met was run for a 16 h period, starting at 05:00. Details about initial and boundary conditions used in ENVI-met simulations are collected in Table 2.
For validation purposes, Figure 5 shows the time evolution of Tair and Rh obtained from measurements and simulations at the VD position (see Figure 3, bottom) for the current scenario. The comparison shows that ENVI-met was able to reproduce the Tair and Rh behaviour, with a lower overestimation after 16:00. Excluding the first 4 h (spin up), the correlation coefficient R is equal to 0.9 for both the meteorological variables. Please note that such evaluation of ENVI-met simulations is limited to the winter season in Lecce. It is worth underlining that the recent review by Tsoka et al. [50] concluded that ENVI-met studies have evaluated the model performance during summer rather than in winter, with Tair the most widely evaluated variable with the existing evidence suggesting the model can generally accurately capture the diurnal profile of the parameter. Concerning MRT, the model was found to accurately simulate the daytime peak MRT values, a feature of high importance when it comes to the investigation of pedestrians’ thermal comfort analysis as undertaken in the present paper. We thus considered the ENVI-met set-up employed here acceptable for the purpose of the paper.

3.5. Thermal Comfort Indices

In this study, MRT and PMV indices were calculated by ENVI-met at pedestrian level (1.4 m a.g.l.). MRT is defined as “the temperature of a uniform, black enclosure that exchanges the same amount of heat by radiation with the occupant as the actual surroundings” (ASHRAE Standard 55–92 Thermal environmental conditions for human occupancy). Specifically, it considers all short- and long-wave radiation fluxes issued from solar irradiation and from surroundings with different surface temperatures [51] and its spatial distribution is found to be influenced by the location and spatial pattern of vegetation. MRT is defined as [52]:
MRT = [ ( T g + 273.15 ) 4 + 1335 × 10 8 v 0.71 ε D 0.4 × ( T g T air ) ] 1 4 273.15
where Tg = globe temperature (°C), v = wind velocity (m s−1), Tair = air temperature (°C), D = globe diameter =  40 mm and ε  =  globe emissivity  =  0.97.
Using the simulated Tair, Rh, wind velocity (v) and MRT, the outdoor PMV was calculated for the evaluation of the thermal sensation based on the heat balance of the human body [53]. It takes into consideration also the personal factors of heat resistance of clothing and human activity. PMV was originally developed for steady-state indoor situations, but by extending the energy flux related parts of the model with solar and longwave radiation and allowing wind speeds above an indoor room situation, PMV can also be applied to outdoor situations [32,33]. Outdoor PMV ranges from −4 (very cold) to 4 (very hot), with 0 being neutral. These values differ from the theoretical limits (−3; +3) (ASHRAE Standard 55–92 Thermal environmental conditions for human occupancy) because the application of the PMV equation to outdoor conditions, in summer heat stress situations or in extremely cold conditions, can easily produce PMV values above +4 (+8 and more) and below −4 (−8 and less) [14,54,55,56].

4. Results from the Modelling Method

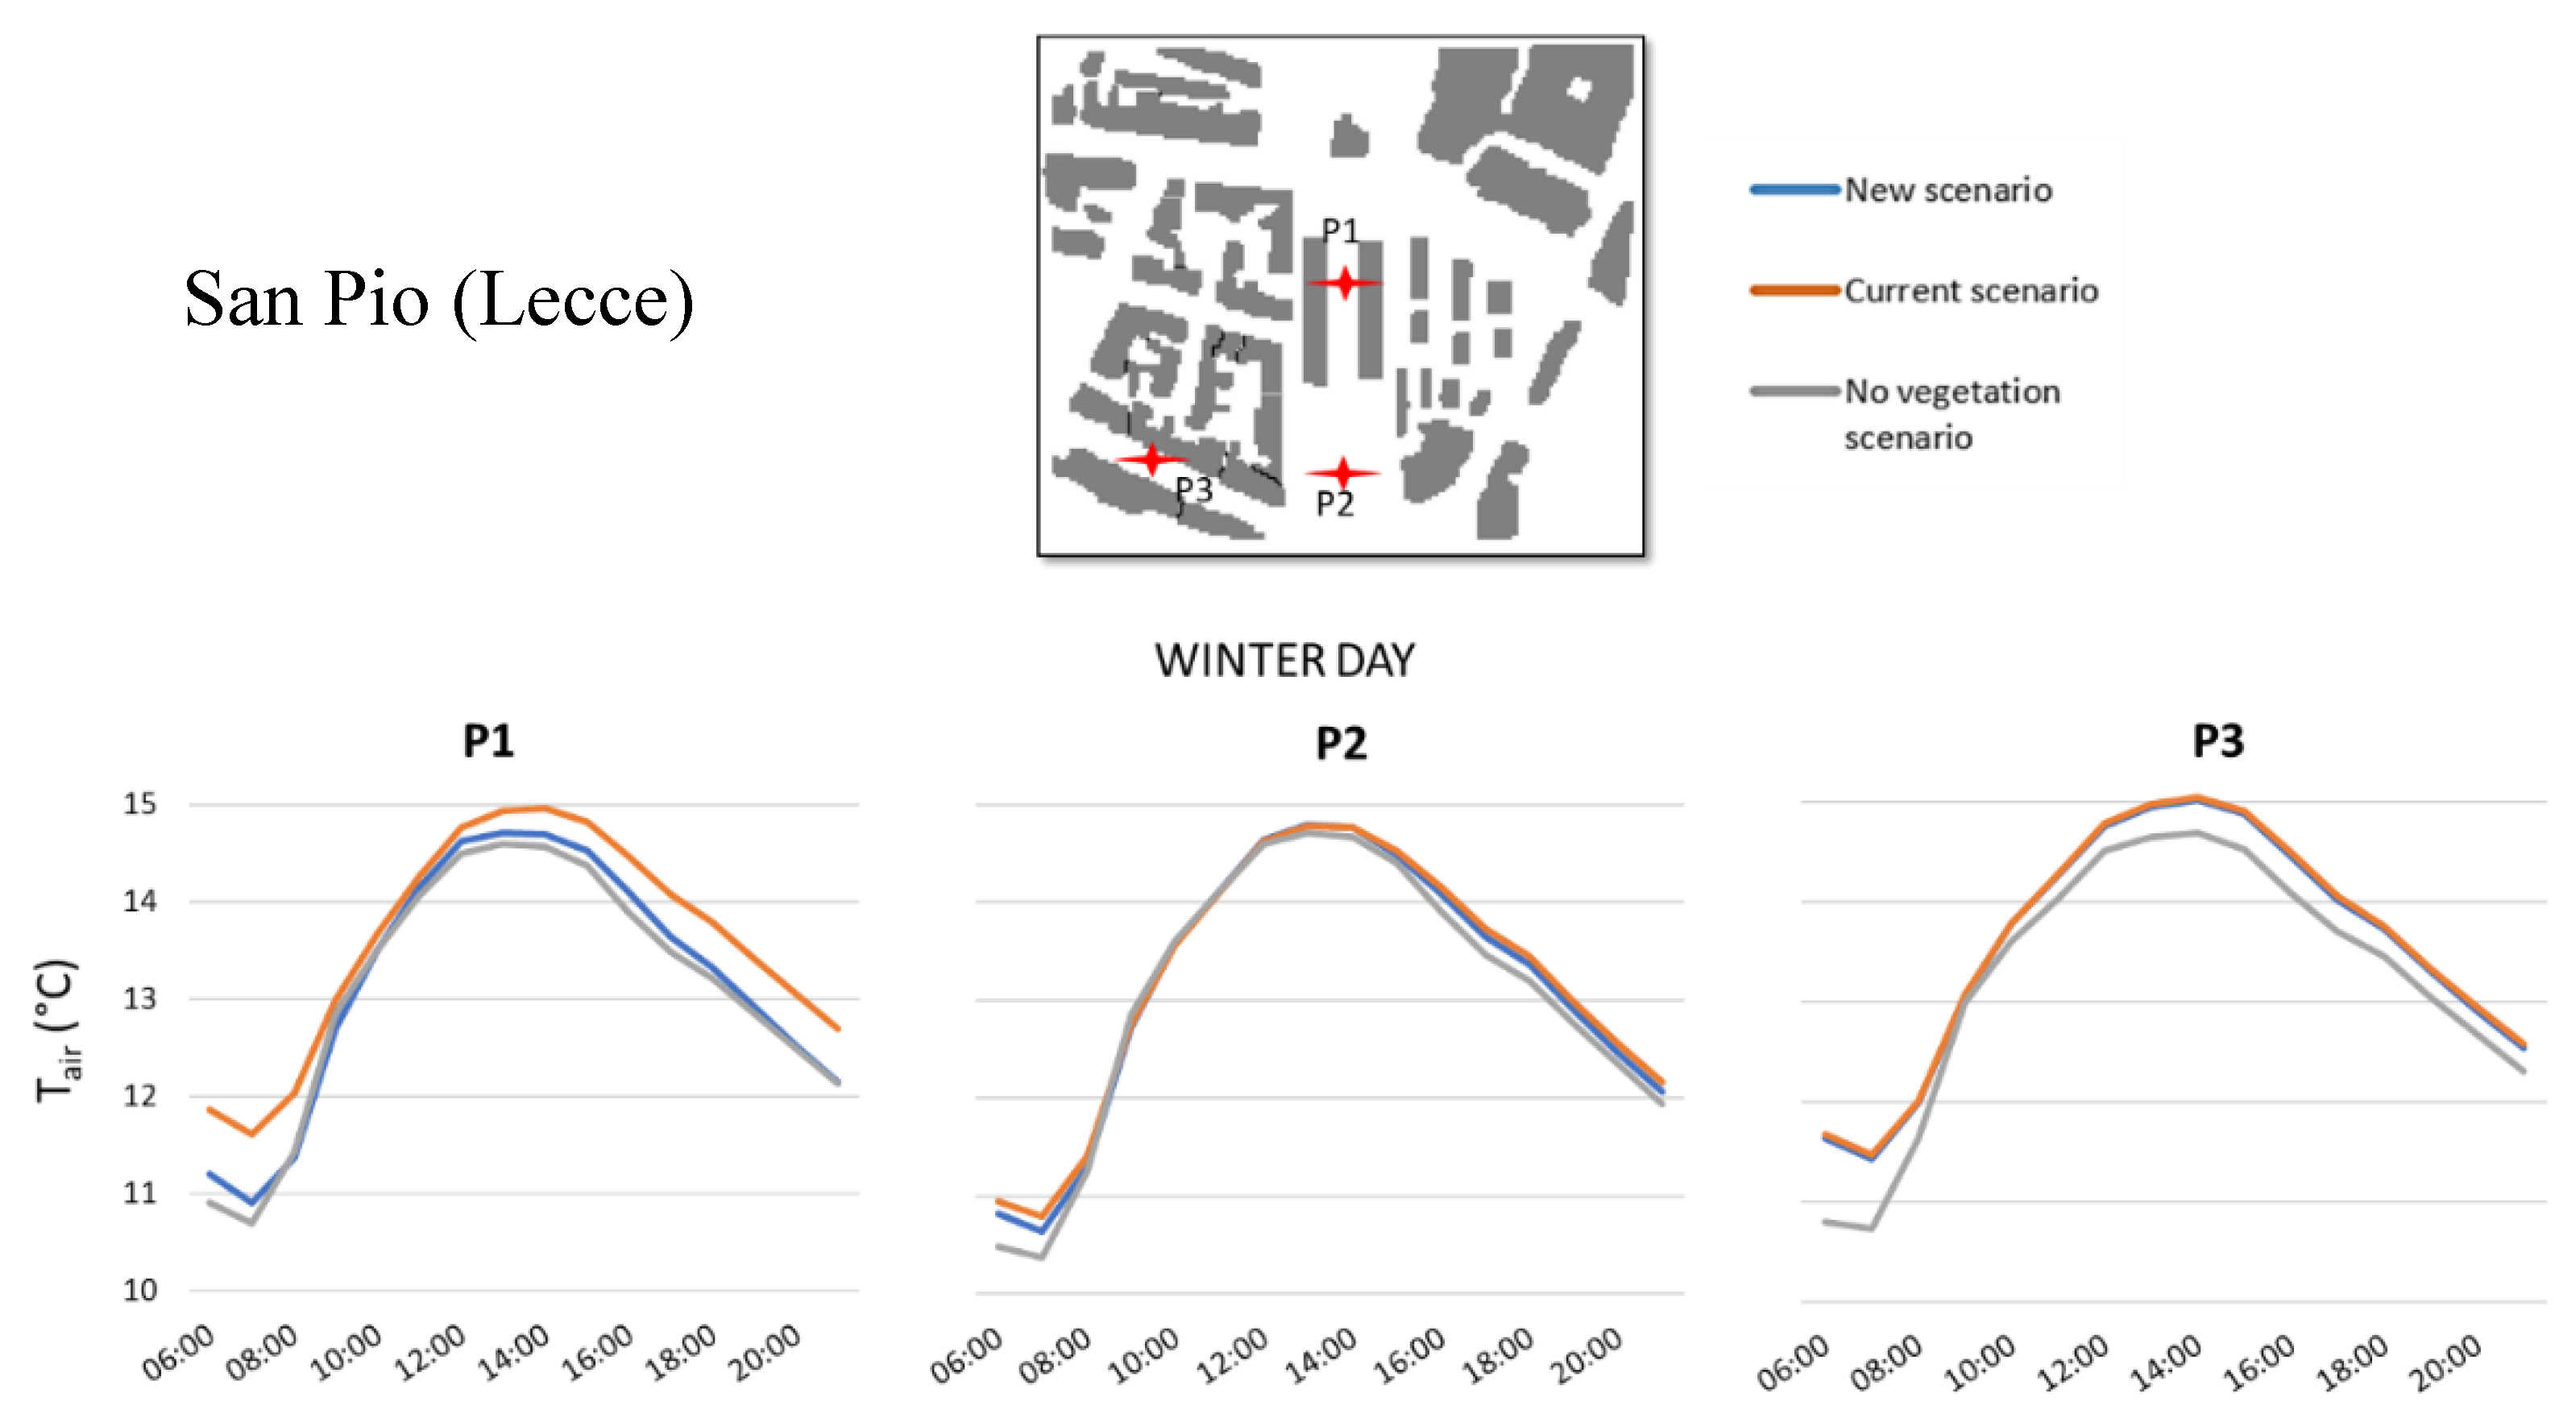
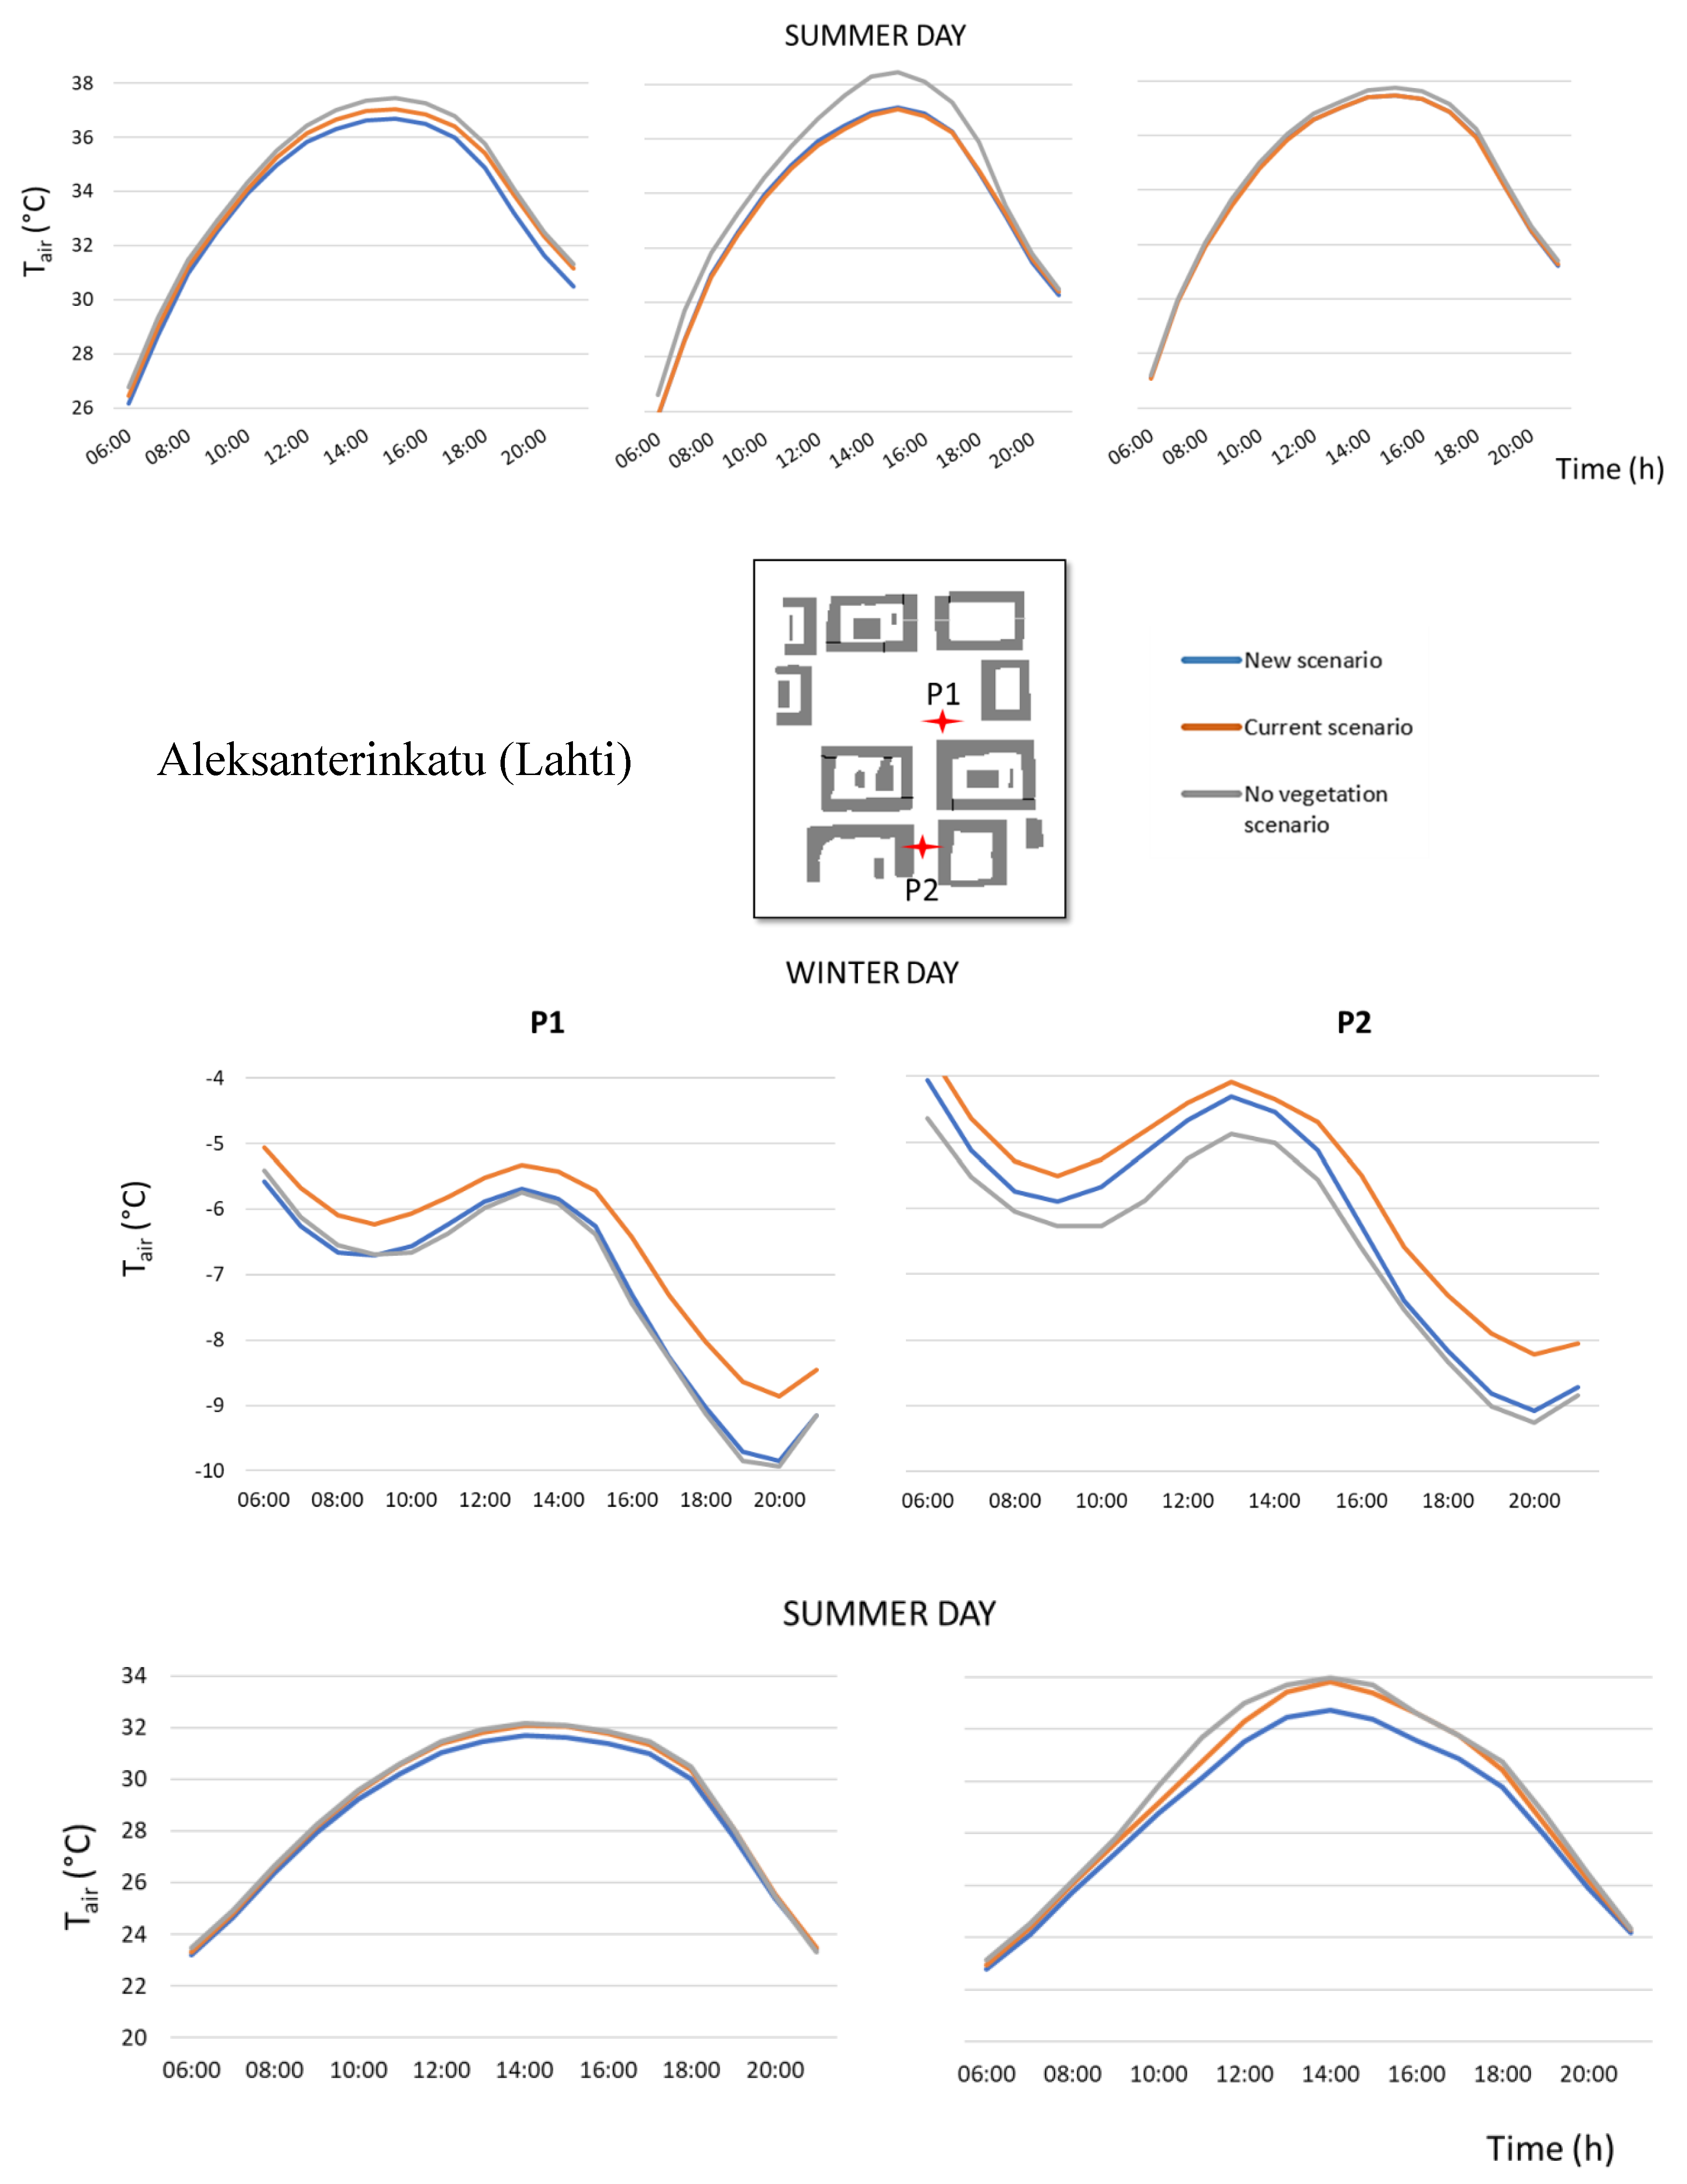
4.1. Time Evolution of Air Temperature

Figure 6 shows the time evolution of Tair calculated at P1, P2 and P3 in San Pio and P1 and P2 in Aleksanterinkatu (see Figure 3) in the chosen summer and winter days. In general, at each point, both in San Pio and in Aleksanterinkatu, Tair is higher in winter days and lower in summer days in the presence of vegetation with respect to the other scenarios.
Specifically, in the winter day San Pio shows Tair higher in the current scenario with maximum differences with respect to the no vegetation case of 0.6 °C, 0.2 °C and 0.4 °C at points P1, P2 and P3, respectively, at 15:00. The time evolution for the new scenario does not change at P2 and P3, while it changes at P1 where the maximum increase with respect to the no vegetation case is 0.2 °C. In Aleksanterinkatu, Tair of current scenario is about 1 °C higher during the entire period at P1 and P2, while in the new scenario at P1 the time evolution is similar to that without vegetation and at P2 there is a maximum increase of 0.7 °C at 11.00 that tends to decrease during the evening.
In the summer day, in San Pio at P2, where there is the pocket park “Parco Corvaglia”, a maximum decrease of 1.4 °C can be noted in the presence of vegetation (i.e., in the current and new scenarios) compared with the no vegetation scenario at 15:00. At P1, such a decrease in the presence of vegetation is less evident, with a maximum decrease of 0.4 °C in the current scenario and of 0.9 °C in the new scenario, both from 15:00 to the late afternoon. At P3, the maximum decrease in the presence of vegetation is about 0.3 °C in the mid-afternoon, and the current and the new scenarios are similar. In Aleksanterinkatu, the new scenario has the lowest Tair in both points with a maximum decrease of 1.6 °C at P2 at 11.00 in comparison with that of 0.9 °C in the current scenario.
The results above can be summarized as follows:
  • in winter, at P1 in the new scenario (i.e., after the introduction of grass in the current empty street canyon “a”) of San Pio and at P2 in the current and new scenarios (i.e., in the presence of deciduous trees and after the introduction of evergreen trees in the street canyon “a”) of Aleksanterinkatu show a similar Tair time evolution, i.e., the presence of vegetation induces a decrease of Tair during all day. The presence of trees (current and new scenarios) induces a decrease of Tair also in the street canyon “b” in San Pio. This suggests that in winter time, independent on the different local microclimate (Lecce and Lahti), on the street orientation and aspect ratio and on the LAD, the presence of vegetation (trees or grass) may induce a decrease of Tair and this should thus be avoided. Furthermore, the presence of vegetation in an open space does not affect Tair in San Pio (see P2 where no differences were found also in the presence of grass), while it does in Aleksanterinkatu by increasing Tair (see P1) but for trees with larger LAD, suggesting that in open space trees with larger LAD are preferable to mitigate the cold winter;
  • in summer, the effect of the presence of vegetation on the decrease of Tair in San Pio is more significant in the open space (see P2) rather than in the street canyons (see P1 and P3), and the introduction of grass does not have additional influence with respect to trees. In Aleksanterinkatu the effect is more evident in the street canyon (see P2) where the lower LAD of evergreen trees in the new scenario are more favourable in decreasing Tair than the deciduous trees with larger LAD. This suggests that in summer the presence of vegetation may induce a decrease of Tair in both street canyons and open space, with trees of lower LAD preferable inside street canyons.

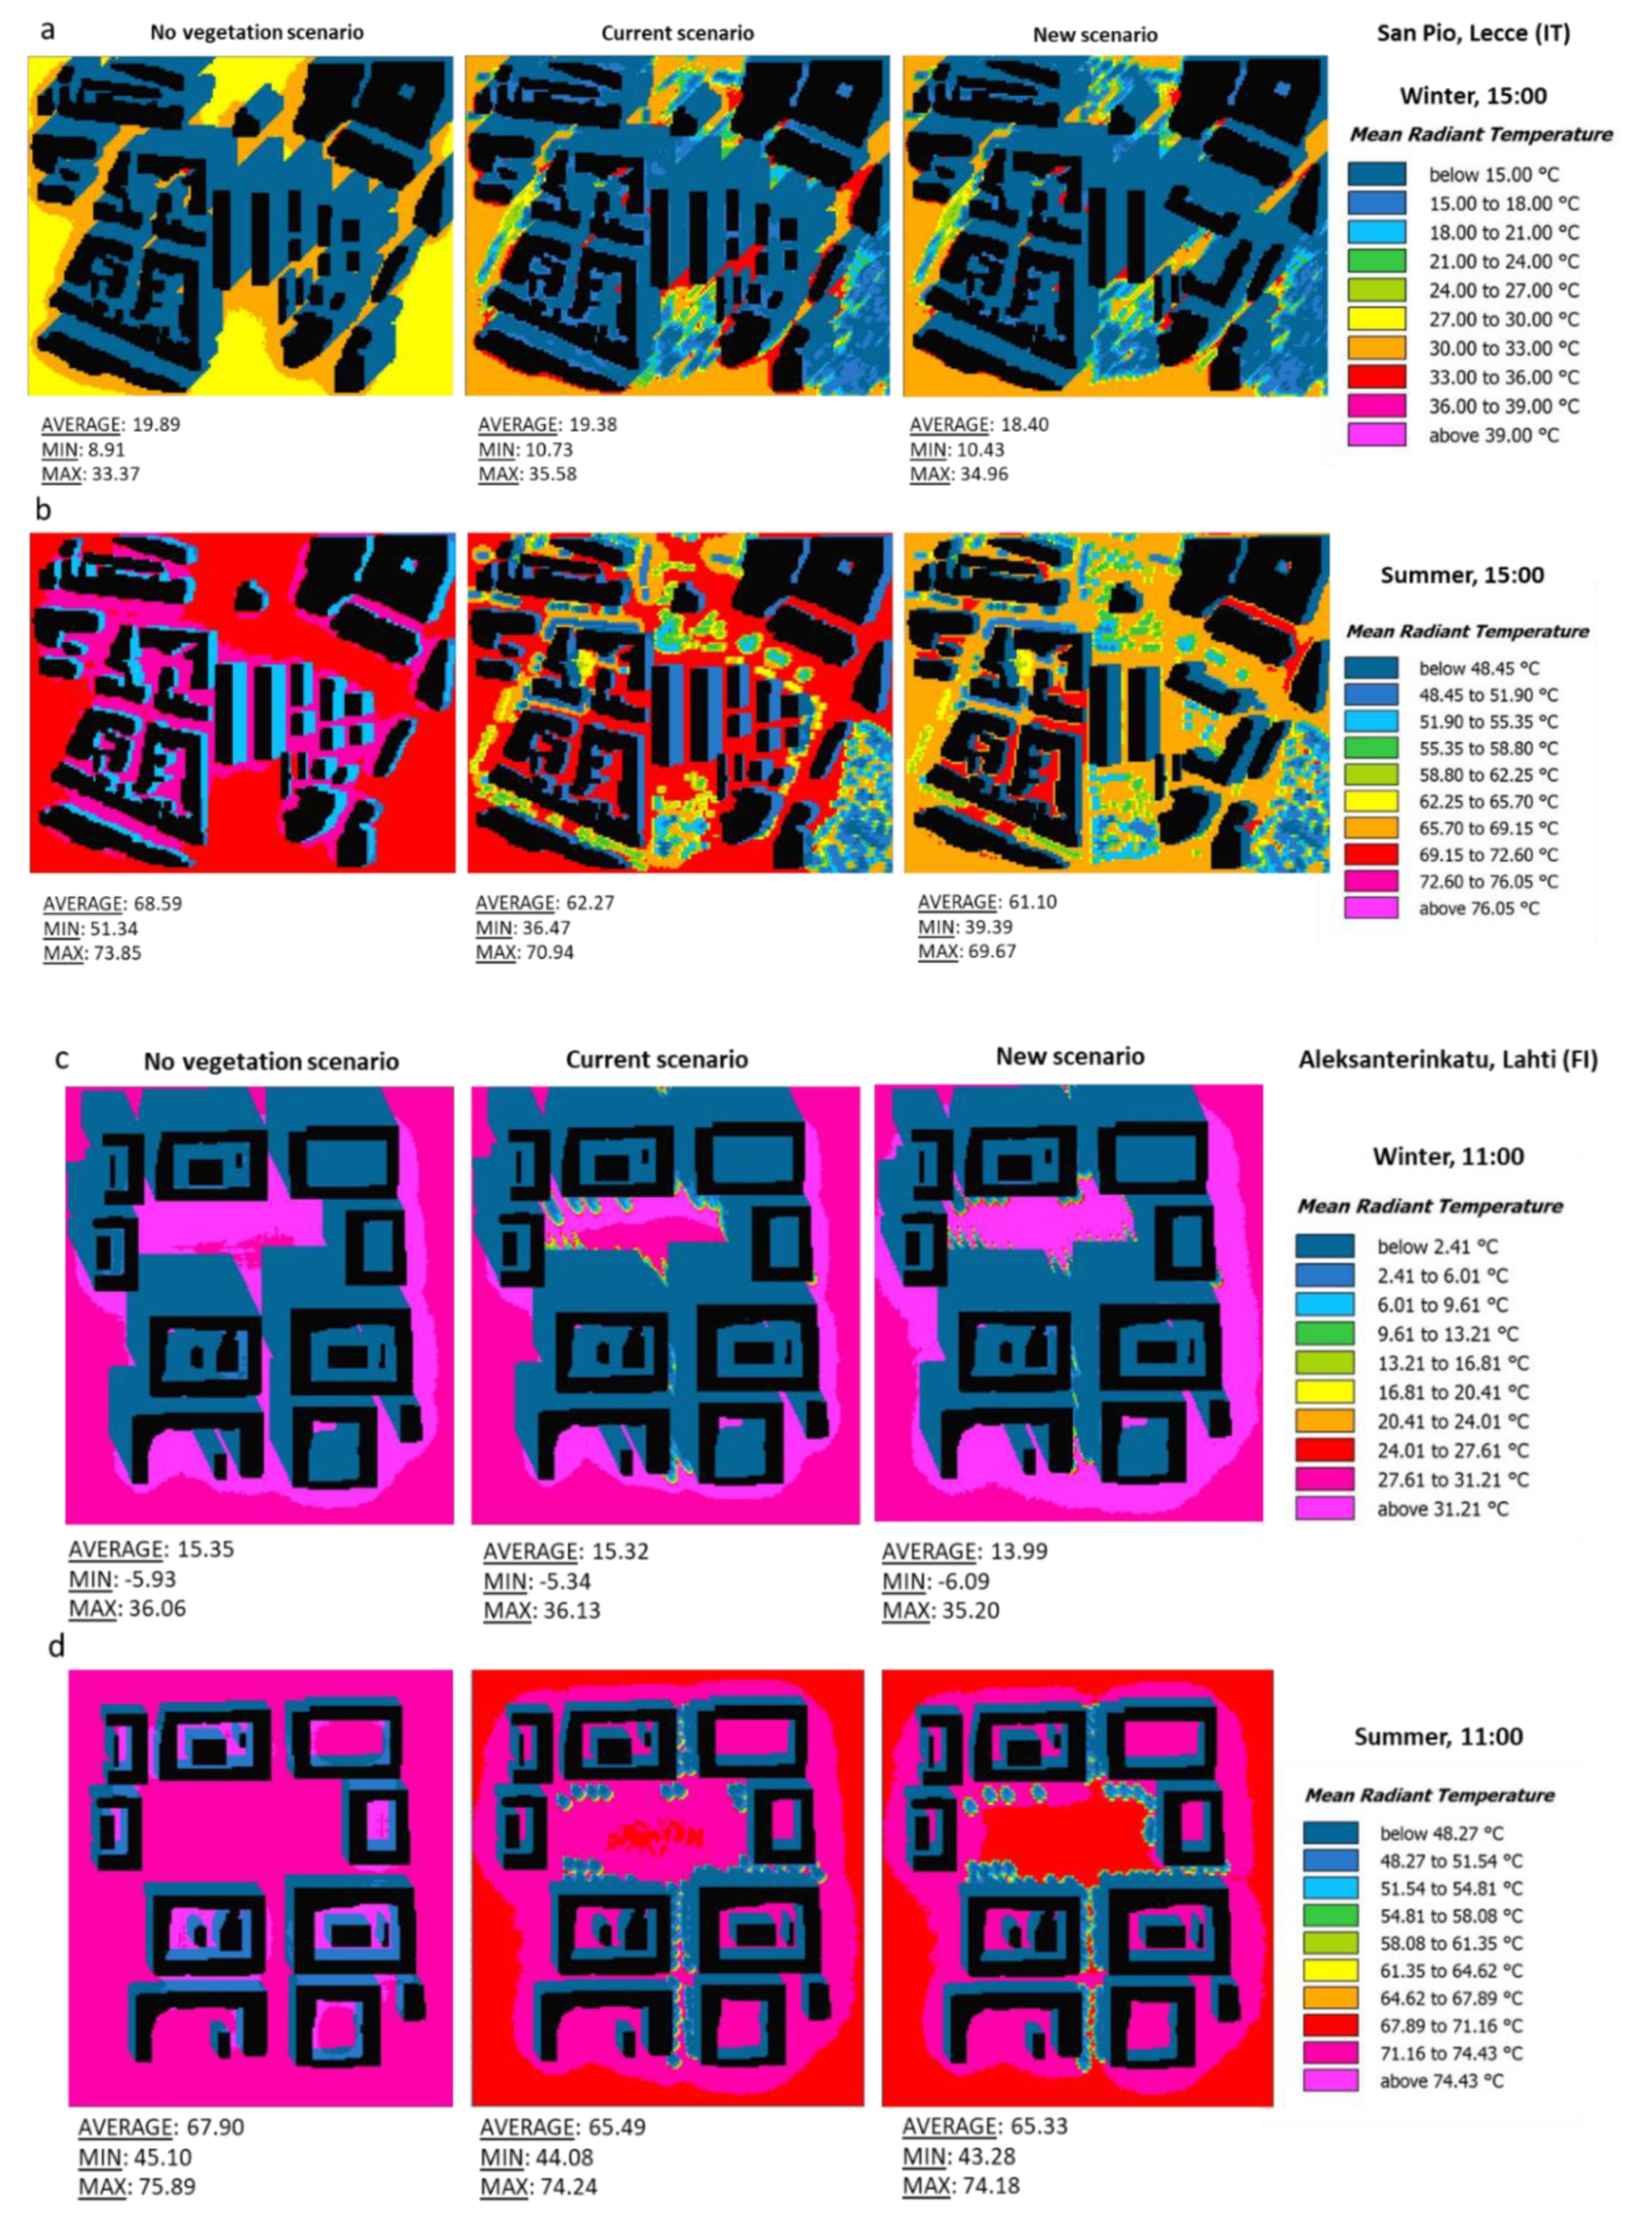
4.2. Spatially Averaged Values of Microclimate Variables

The analysis above has shown maximum differences of Tair, between no vegetation and vegetation scenarios, which are more evident at 15:00 in San Pio and at 11:00 in Aleksanterinkatu, in both winter and summer days (see Section 4.1). Thus here the analysis is extended to the investigation of the spatial distribution of MRT and PMV at those hours to better understand how tree morphology, locations and species, combined with different urban geometries, influence the outdoor thermal comfort.
Figure 7 shows the spatial distribution of MRT, where it can be noted that in general the addition of vegetation reduces the spatially-averaged values of MRT in both winter and summer days. This reduction is evident in Aleksanterinkatu in the summer day, with a decrease of about 3 °C for the new scenario with respect to the no vegetation scenario, in the the open area (square) due to limited shade sources. Also in San Pio, a difference of about 7 °C is found in the summer day in the presence of vegetation.
In the winter day, the presence of the evergreen Picea abies in Aleksanterinkatu leads to an averaged decrease of about 1.3 °C compared with the current scenario with the deciduos Tilia cordata which differs little from the scenario without vegetation. Similarly, in San Pio in the current scenario and no vegetation scenario average values of MRT are similar, while in the new scenario a decrease of about 1.5 °C is found.
The results above can be summarized as follows:
  • in winter, the presence of vegetation induces a decrease of MRT over the entire neighbourhood (not only locally where the vegetation is located), with a significant decrease especially in the open spaces, i.e., in “Parco Corvaglia” in San Pio (both in the current and new scenarios, thus independent of the presence of grass in the new scenario) and in the square in Aleksanterinkatu (both in the current and new scenarios, thus independent of the LAD), while in the investigated street canyons no particular differences are found. This suggests that in winter time, independent of the different local climate (Lecce and Lahti), on the street orientation and aspect ratio and on the LAD, the presence of trees may induce a decrease of MRT, especially in open spaces;
  • in summer, the effect of the presence of vegetation on the decrease of MRT in San Pio is more significant both in the street canyons and in the open space (“Parco Corvaglia”), especially in the new scenario, i.e., with the introduction of grass. In Aleksanterinkatu the effect is also evident, especially in the square, but no significant difference is found between the current scenario and the new scenario, with a slight improvement in the latter due to lower LAD. This suggests that in summer the presence of vegetation may induce a decrease of MRT in both street canyons and open spaces (where not only trees but also grass has a significant influence), with a preference for trees of lower LAD.
The spatial distribution of PMV is shown in Figure 8 and Table 3 shows the PMV values at each extracted point. Despite the observed decrease in spatially averaged values of MRT in winter in both neighbourhoods, especially in the new scenarios, it can be noted that the presence of vegetation leads to an overall improvement of thermal comfort more significant in summer.
In the winter day, on average, a slight improvement in both neighbourhoods is observed in the presence of vegetation. In San Pio, the improvement in the presence of vegetation (both in the current and new scenarios, thus independent of the presence of grass) is more evident looking at the maximum and minimum values and occurs especially within the street canyons (P1 and P3) due to the effect on Tair and Rh (through shading and evapotranspiration) and v (through obstruction to the wind). Anyway, in the “Parco Corvaglia (see P2), where there is more vegetation, a slight deterioration of thermal comfort of 0.3 and 0.4 is observed in the current and new scenarios, respectively, probably due to the increase of Rh. At 20:00 (not shown here), the average values are 2.6 (no vegetation), 2.4 (current and new scenarios), indicating that the trapping effect of vegetation induces an increase of temperature also during the night and thus an improvement of thermal comfort. In Aleksanterinkatu, a more evident improvement in the street canyon (see P2) of about 0.3 can be appreciated in the presence of vegetation (both in the current and new scenarios, with a slight improvement for lower LAD).
In the summer day, in Aleksanterinkatu there is a reduction of average PMV values of about 0.2 in the presence of vegetation, while, in San Pio, of about 0.5 for the current scenario and 0.6 for the new scenario. Here, by observing the values at the extraction points, a significant positive effect of vegetation on thermal comfort at P2 (Parco Corvaglia) is found with a decrease, and so an improvement of thermal comfort, of 1.9 in the current scenario and 2.0 in the new scenario. At P3, this improvement is better in the current scenario because in the new one a row of Tilia sp. was removed. In the same way, in Aleksanterinkatu there is a decrease of 0.8 in the current scenario and 1.6 in the new scenario at P2 (street canyon).
Comparing the effects of the evergreen and deciduous trees in Aleksanterinkatu, in the street canyon “a” where there is the highest concentration of vegetation it is noteworthy that thermal comfort (PMV) in summer is better in the presence of the evergreen species Picea abies by about 0.2 than in the presence of the deciduous species Tilia cordata. On the other hand, in winter, the effect is the opposite. Also in San Pio, considering the evergreen species Quercus ilex subsp. ilex and the deciduous species Celtis australis (see Figure 3) (characterized by the same LAD) in the pocket park “Parco Corvaglia”, both species have a similar positive effect on thermal comfort in summer, with an improvement of 1.5 compared to the no vegetation scenario; while in winter a deterioration of PMV (0.1) occurs in the presence of the evergreen species. Furthermore, the evergreen hedge Viburnum lucidum has a positive effect in summer compared to the no vegetation scenario, with an improvement of 1.5 and a negative effect in winter with a deterioration of 0.1.
The results above can be summarized as follows:
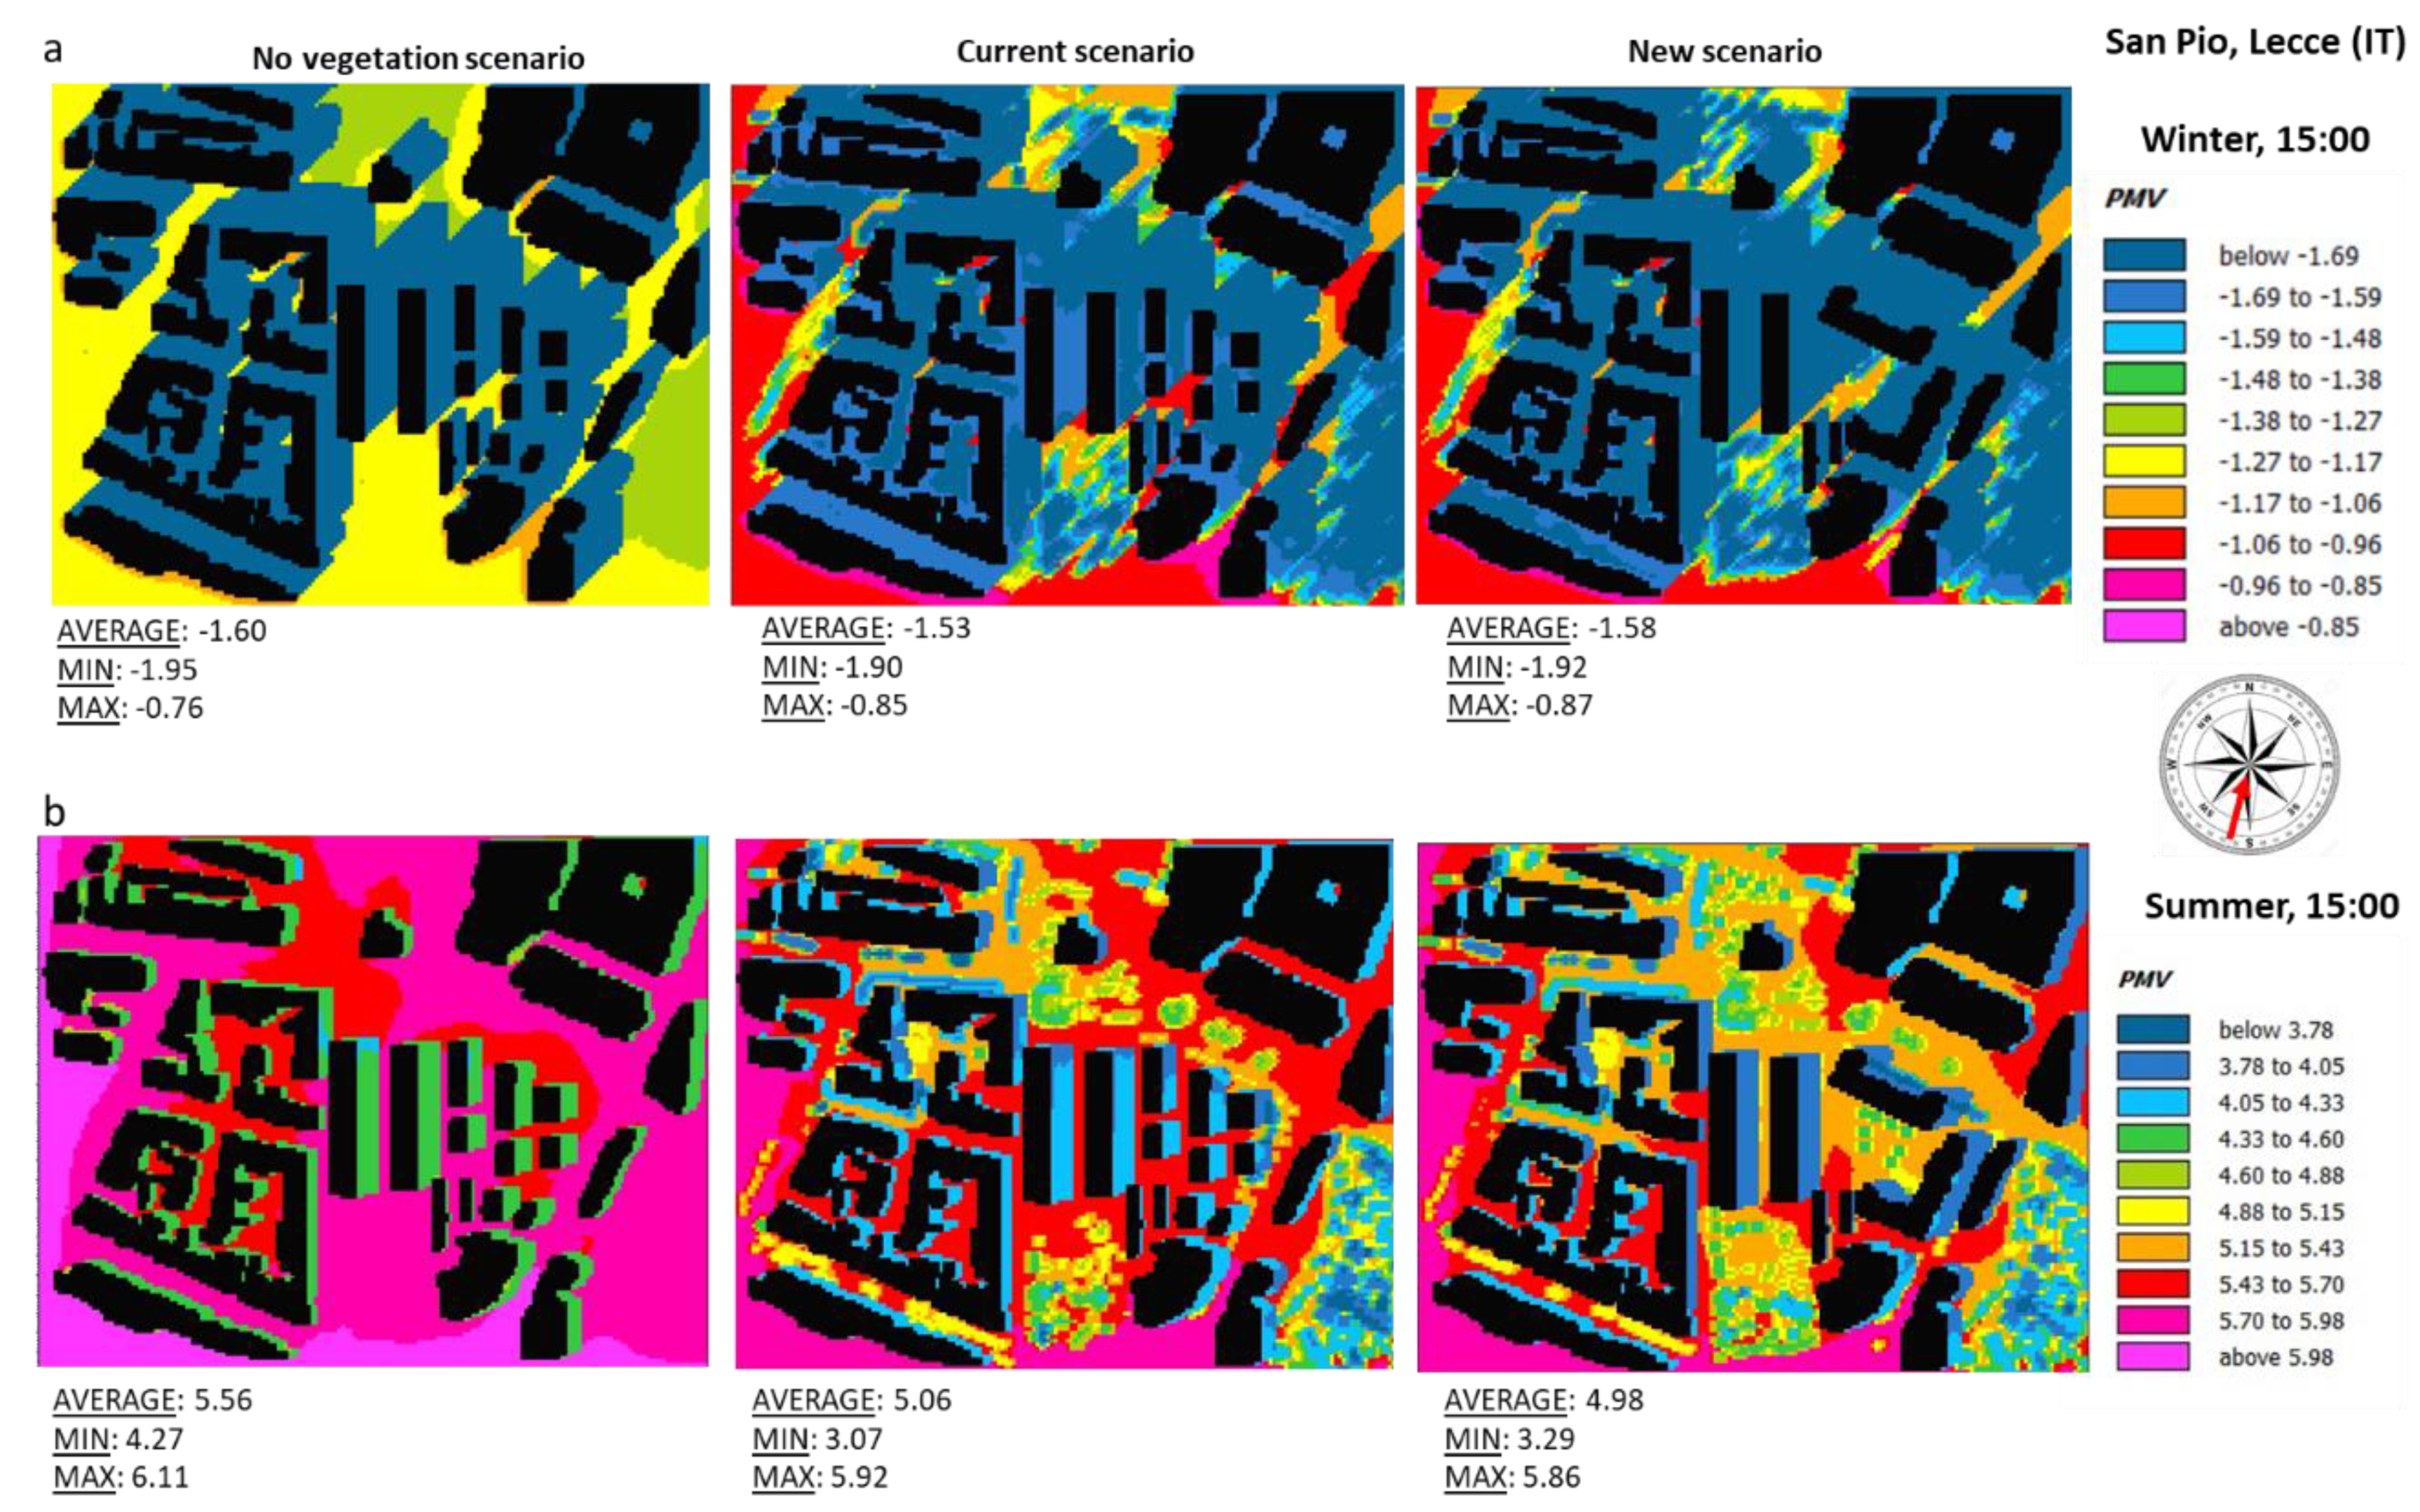
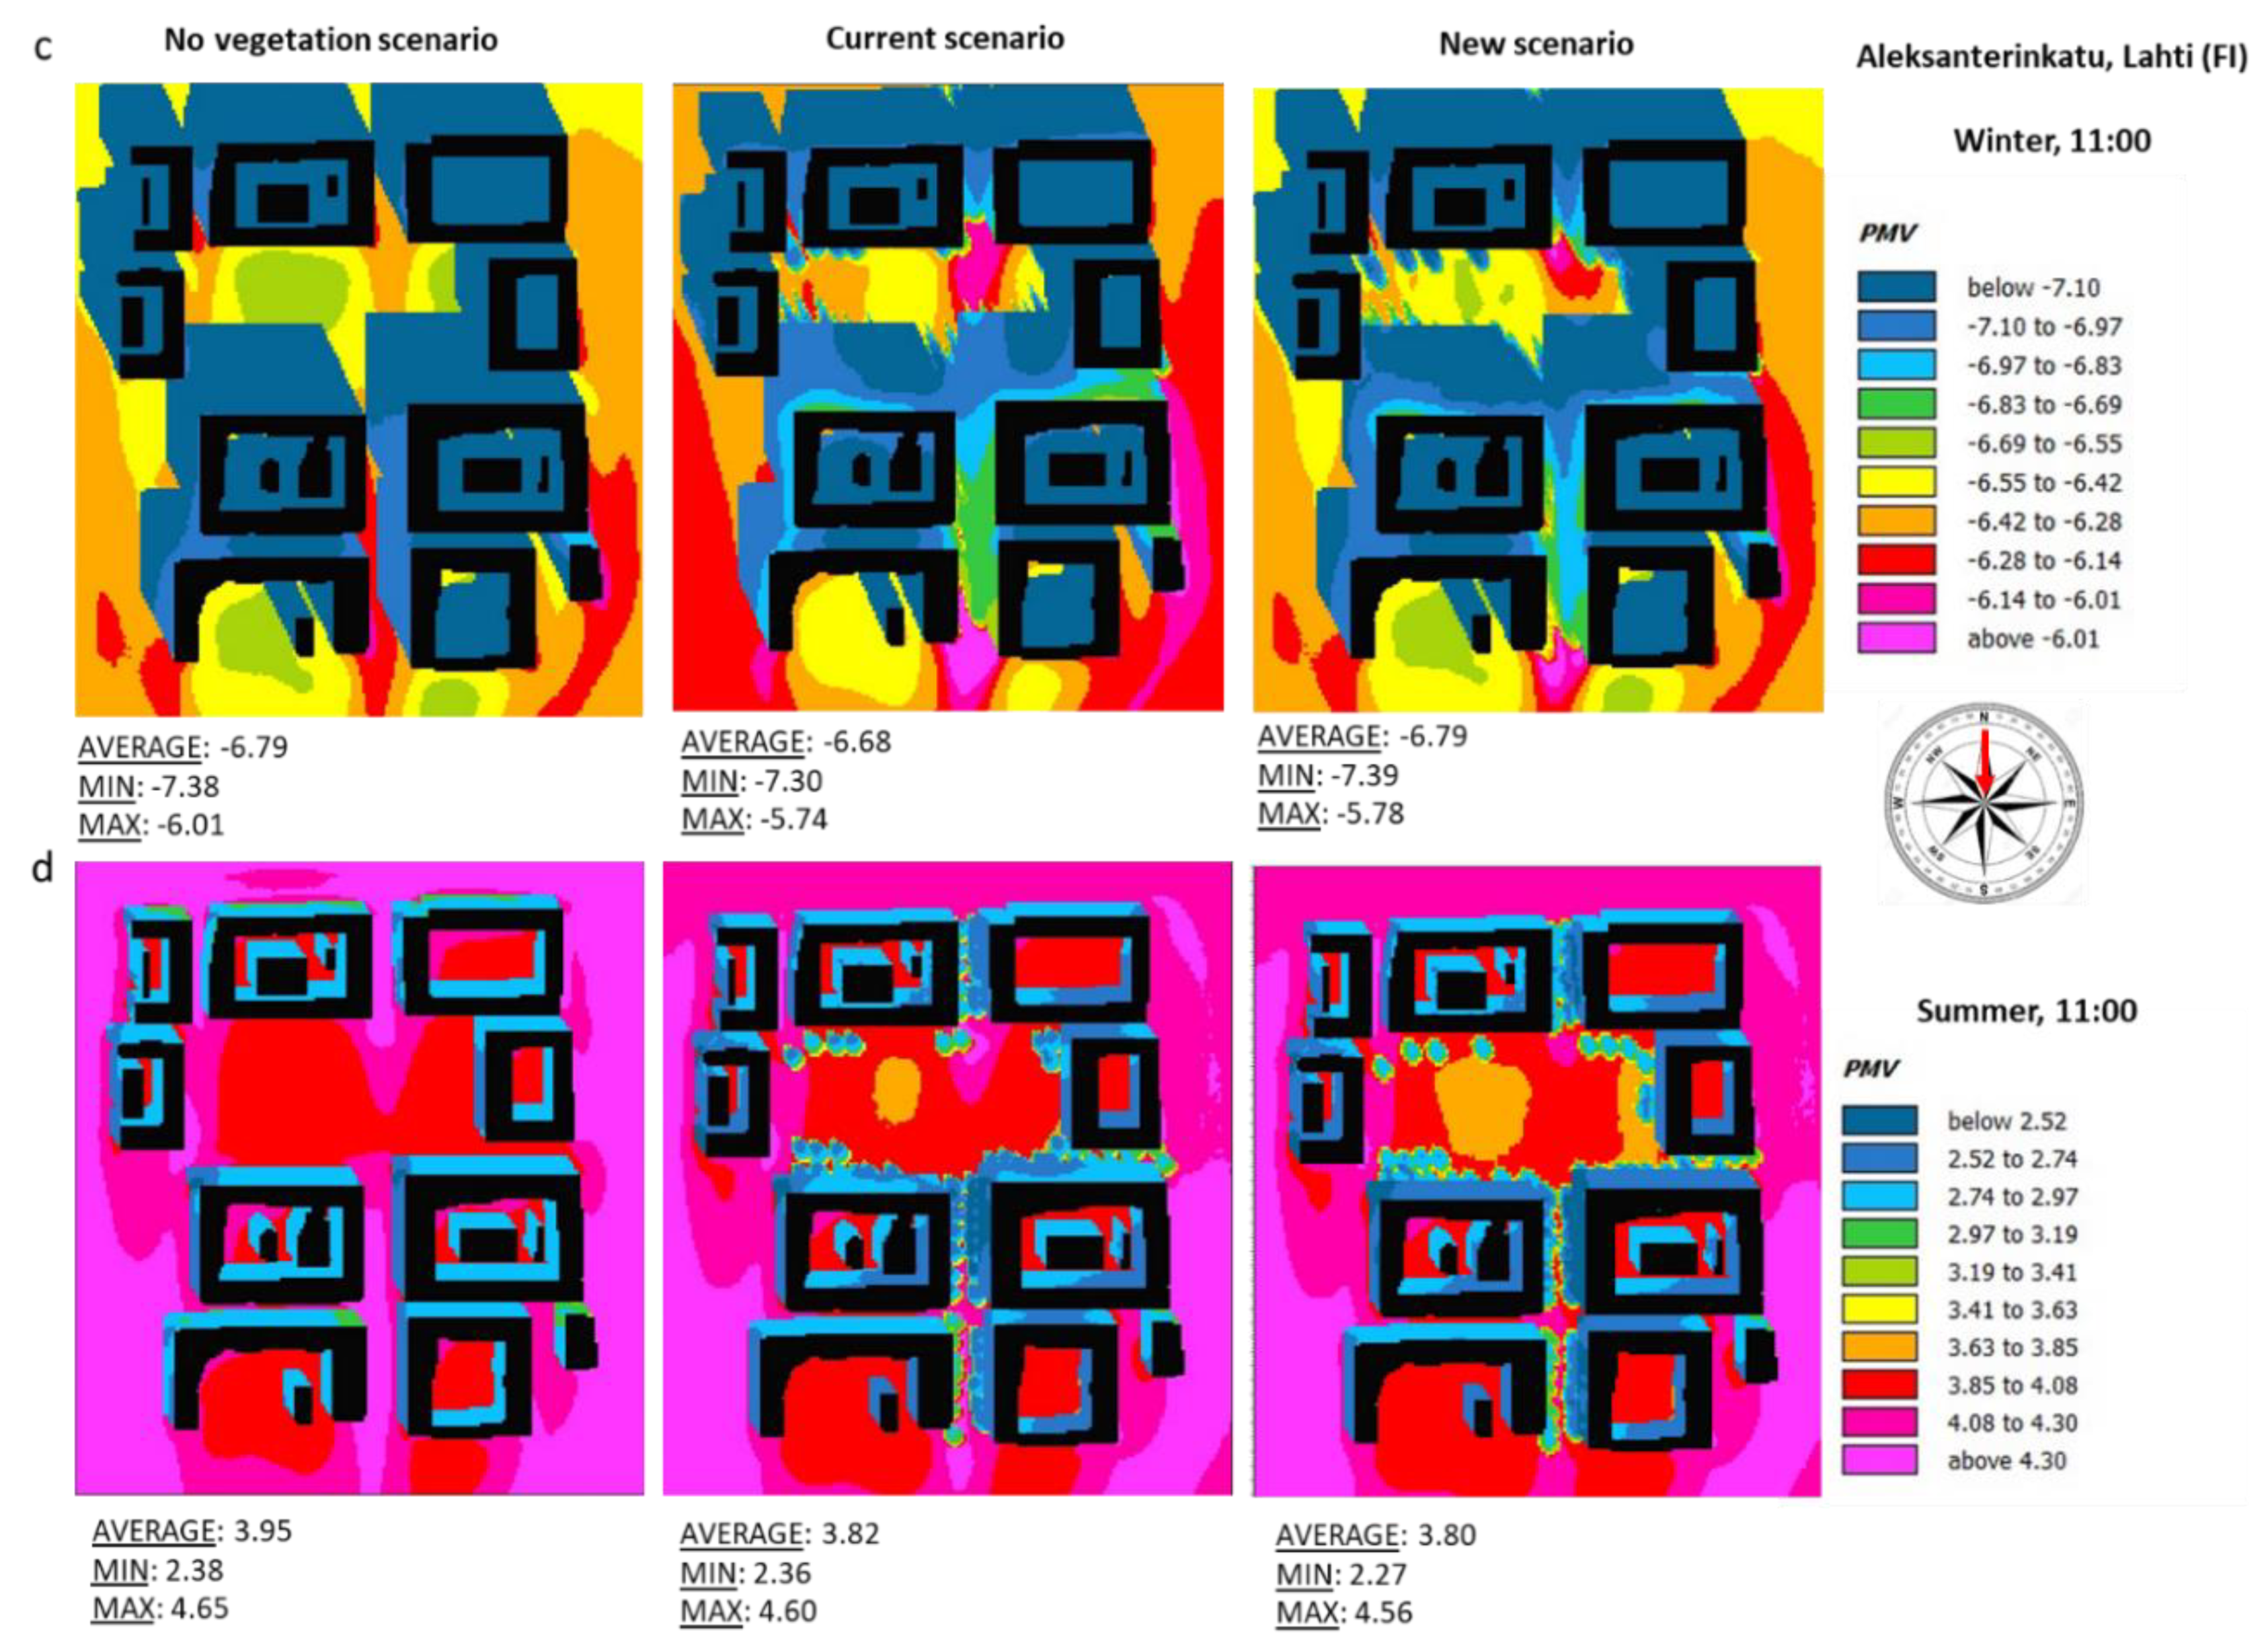
  • in winter, both in San Pio and Aleksanterinkatu, on average PMV is only slightly positively affected by the presence of vegetation. However, local impacts are observed, both in the street canyons and in the open spaces. Specifically, the presence of vegetation induces an improvement of PMV in the street canyons independent on the different local microclimate (Lecce and Lahti), the street orientation and the LAD. Furthermore, the presence of vegetation in an open space negatively affect PMV in the “Parco Corvaglia” in San Pio (where no differences were found also in the presence of grass), while it positively affects PMV in the square in Aleksanterinkatu, slightly more for trees with larger LAD, suggesting that in open space trees with larger LAD are preferable to improve the thermal comfort;
  • in summer, the effect of the presence of vegetation on the decrease of average values of PMV is more significant than in winter. Great improvements are observed in the open spaces, especially for lower LAD trees, with no particular influence of grass with respect to trees. This suggests that in summer the presence of vegetation (especially trees) may induce a decrease of PMV in both street canyons and open space, with trees of lower LAD preferable inside street canyons.

5. Discussion

The analysis of results has shown that the vegetation has, in general, a positive effect on air temperature mitigation and thermal comfort improvement both in summer and winter. This is in accordance with literature studies, i.e., trees and other plants help cool the environment, making vegetation an effective way to ameliorate the microclimate and enhance the human thermal comfort.
Specifically, this study has shown that:
  • increasing vegetation cover in urban areas leads to effectively marked reductions in MRT especially in summer. MRT is in fact the most affected parameter by tree-shading effect and radiative fluxes (especially direct shortwave radiation), as recently also observed by several authors [14,57,58] reporting the mitigating effect of plants on MRT;
  • in winter, in both neighborhoods located in different climate zones, there is a better thermal comfort (in terms of the improvement of PMV) with vegetation in the street canyons. Locally, thermal discomfort caused by the vegetation is evident in the pocket park “Parco Corvaglia” in San Pio (Lecce). This effect is not due to the reduction of Tair that is mostly higher in the presence of vegetation, but to the decrease of MRT, which plays the most important role in thermal comfort [59]. In Aleksanterinkatu (Lahti), not having similar clusters of vegetation, such thermal discomfort cannot be observed, and a better comfort in the presence of deciduous species is observed, which provides less shade than evergreen species;
  • the presence of green covers instead of the concrete surface moderates radiant heat load leading to an improvement of thermal comfort during summer days. In fact, in the new scenario in San Pio, the use of grass in some areas decreases the reflection of incoming solar radiation leading to an important reduction of MRT and PMV;
  • the observed winter thermal discomfort in the presence of vegetation appears less important than the improvement of thermal comfort observed in summer in both neighborhoods.
As found in the literature, the comparison carried out here between different tree locations and species, pavements and arrangement scenarios reveals the importance of considering several parameters in urban green planning. Different types of green infrastructures (parks, street trees or green roofs) are commonly used in urban areas. Urban parks, like those analyzed in this paper (“Parco Corvaglia” in Lecce and partially the square in Lahti), present a lower temperature than their surroundings, with a greater effect in summer [17,24,60]. This phenomenon is known as “park cool island” (PCI). The temperature difference depends on the size and shape of park, type of vegetation and local meteorology and can be found during the night and day periods. The review of Givoni [24] found a temperature difference of up to 1 °C to 7 °C and the review of Taleghani [17] distinguished between night and day periods. It was found that PCI intensity ranges from 0.5 °C to 10 °C with an average value of 1.15 °C during the night time, while during the day time it ranges from 0.3 °C to 7 °C with an average around 0.94 °C.
Finally, as shown in the present paper, the study of the impact of street trees is more complex because in addition to trees’ attributes, the cooling effects also depends on the surrounding characteristics like building height and density, location of trees within the street or surface materials [24]. For example, Taleghani et al. [59] showed that the courtyard provides the most comfortable microclimate in the Netherlands in June compared to other urban forms. Lobaccaro et al. [61], through a study in Bilbao, found that the orientation and aspect ratio strongly affected the magnitude and duration of the thermal peaks at pedestrian level, with the vegetation elements improving the thermal comfort. This suggests that there is not a general mitigation strategy using vegetation which could be applied for all scenarios, but ad hoc studies are necessary to optimize the benefits of introducing vegetation for thermal comfort improvement purposes [24,25,26].

6. Conclusions

This study evaluated the effects of vegetation on microclimate and thermal comfort in two neighbourhoods characterized by a different climate, i.e., a Mediterranean city in southern Italy (Lecce) and a northern European city in southern Finland (Lahti) using the CFD and microclimate model ENVI-met. The neighbourhoods studied are located in residential areas of the cities that are particularly important, and frequented and inhabited by families and young students. According to this study, urban greenery planners are advised to:
  • focus on urban regeneration interventions that involve the restoration of large concrete areas to green areas. In particular, grass planting, together with trees, may improve thermal comfort and thus contribute to improving urban resilience to climate change;
  • in areas of northern Europe where winter is colder, deciduous species with larger LAD for a better thermal comfort are preferred;
  • in Mediterranean areas, plant deciduous species together with evergreen species in equal numbers in order to balance the different effects on thermal comfort in summer and winter. In this regard, the recently proposed MOCI (Mediterranean Outdoor Comfort Index) empirical index for the evaluation of outdoor thermal comfort of the Mediterranean population is worthy of application [62,63].
Future studies will quantify the annual total benefit (which can be quantified as summer comfort–winter discomfort) based on several measurement days across the two sites and, moreover, they will focus the attention to the effect of other meteorological conditions (i.e., wind speed and direction) and other effects of vegetation, for example on air quality and ventilation.

Author Contributions

Conceptualization, E.G. and R.B.; Formal analysis, E.G., R.B. and J.L.S.; Methodology, E.G., R.B., E.A. and R.E.; Resources, E.A., F.I. and L.P.; Software, E.G. and R.E.; Writing—original draft, E.G., R.E. and J.L.S.; Writing—review and editing, R.B. and J.L.S. All authors have read and agreed to the published version of the manuscript.

Funding

The first author (Elisa Gatto) acknowledges the PhD financial support of the Italian Ministry of University and Research (MIUR) by the PON project “Dottorati Innovativi con caratterizzazione Industriale-project code DOT1412034–Borsa n. 2”, PhD course in “Scienze e Tecnologie Biologiche ed Ambientali”–XXXIII cycle-University of Salento.

Conflicts of Interest

The authors declare no conflict of interest.

References

  1. IPCC. Climate Change 2013: The Physical Science Basis. In Contribution of Working Group I to the Fifth Assessment Report of the Intergovernmental Panel on Climate Change; Cambridge University Press: Cambridge, UK; New York, NY, USA, 2013; p. 1535. [Google Scholar]
  2. United Nations. World Urbanization Prospects: The 2014 Revision; United Nations: Geneva, Switzerland, 2014. [Google Scholar]
  3. Matzarakis, A.; Amelung, B. Physiological equivalent temperature as indicator for impacts of climate change on thermal comfort of humans. In Seasonal Forecasts, Climatic Change and Human Health; Springer: Dordrecht, The Netherlands, 2008; pp. 161–172. [Google Scholar]
  4. Parker, D.E. Urban heat island effects on estimates of observed climate change. Wiley Interdisciplinary Rev. Clim. Chang. 2010, 1, 123–133. [Google Scholar] [CrossRef]
  5. Cheung, P.K.; Jim, C.Y. Comparing the cooling effects of a tree and a concrete shelter using PET and UTCI. Build. Environ. 2018, 130, 49–61. [Google Scholar] [CrossRef]
  6. Fang, Z.; Lin, Z.; Mak, C.M.; Niu, J.; Tse, K.-T. Investigation into sensitivities of factors in outdoor thermal comfort indices. Build. Environ. 2018, 128, 129–142. [Google Scholar] [CrossRef]
  7. Rajapaksha, U.; Hyde, R. Barriers to and opportunities for advanced passive cooling in sub-tropical climates. Arch. Sci. Rev. 2012, 55, 49–60. [Google Scholar] [CrossRef]
  8. Steane, M.A.; Steemers, K. Environmental Diversity in Architecture; Routledge: Abington, UK, 2004; ISBN 041531478X. [Google Scholar]
  9. Lenzuni, P.; Freda, D.; Del Gaudio, M. Classification of thermal environments for comfort assessment. Ann. Occup. Hyg. 2009, 53, 325–332. [Google Scholar] [CrossRef] [PubMed] [Green Version]
  10. Shashua-Bar, L.; Pearlmutter, D.; Erell, E. The influence of trees and grass on outdoor thermal comfort in a hot-arid environment. Int. J. Clim. 2011, 31, 1498–1506. [Google Scholar] [CrossRef]
  11. Emmanuel, R.; Loconsole, A. Green infrastructure as an adaptation approach to tackling urban overheating in the Glasgow Clyde Valley region, UK. Landsc. Urban. Plan. 2015, 138, 71–86. [Google Scholar] [CrossRef] [Green Version]
  12. Klemm, W.; Heusinkveld, B.G.; Lenzholzer, S.; van Hove, B. Street greenery and its physical and psychological impact on thermal comfort. Landsc. Urban. Plan. 2015, 138, 87–98. [Google Scholar] [CrossRef]
  13. Cheung, P.K.; Jim, C.Y. Global pattern of human thermal adaptation and limit of thermal neutrality: Systematic analysis of outdoor neutral temperature. Int. J. Clim. 2018, 38, 5037–5049. [Google Scholar] [CrossRef]
  14. Rui, L.; Buccolieri, R.; Gao, Z.; Ding, W.; Shen, J. The Impact of Green Space Layouts on Microclimate and Air Quality in Residential Districts of Nanjing, China. Forests 2018, 9, 224. [Google Scholar] [CrossRef] [Green Version]
  15. Salmond, J.A.; Tadaki, M.; Vardoulakis, S.; Arbuthnott, K.; Coutts, A.; Demuzere, M.; Dirks, K.N.; Heaviside, C.; Lim, S.; Macintyre, H.; et al. Health and climate related ecosystem services provided by street trees in the urban environment. Environ. Health 2016, 15, 95–111. [Google Scholar] [CrossRef] [PubMed] [Green Version]
  16. Livesley, S.J.; McPherson, E.G.; Calfapietra, C. The urban forest and ecosystem services: Impacts on urban water, heat, and pollution cycles at the tree, street, and city scale. J. Environ. Qual. 2016, 45, 119–124. [Google Scholar] [CrossRef] [PubMed]
  17. Taleghani, M. Outdoor thermal comfort by different heat mitigation strategies- A review. Renew. Sustain. Energy Rev. 2018, 81, 2011–2018. [Google Scholar] [CrossRef]
  18. Santamouris, M.; Ding, L.; Fiorito, F.; Oldfield, P.; Osmond, P.; Paolini, R.; Prasad, D.; Synnefa, A. Passive and active cooling for the built environment—Analysis and assessment of the cooling potential of mitigation technologies using performance data form 220 large scale projects. Sol. Energy 2017, 154, 14–33. [Google Scholar] [CrossRef]
  19. ASHRAE. Thermal Environmental Conditions for Human Occupancy; ASHRAE: Atlanta, GA, USA, 2010. [Google Scholar]
  20. Höppe, P. Different aspects of assessing indoor and outdoor thermal comfort. Energy Build. 2002, 34, 661–665. [Google Scholar] [CrossRef]
  21. Johansson, E.; Thorsson, S.; Emmanuel, R.; Krüger, E. Instruments and methods in outdoor thermal comfort studies—The need for standardization. Urban. Clim. 2014, 10, 346–366. [Google Scholar] [CrossRef] [Green Version]
  22. Chen, L.; Ng, E. Outdoor thermal comfort and outdoor activities: A review of research in the past decade. Cities 2012, 29, 118–125. [Google Scholar] [CrossRef]
  23. Fanger, P.O. Thermal Comfort: Analysis and Applications in Environmental Engineering; McGraw-Hill: New York, NY, USA, 1970. [Google Scholar]
  24. Givoni, B. Impact of planted areas on urban environmental quality: A review. Atmos Environ. 1991, 25, 289–299. [Google Scholar] [CrossRef]
  25. Jamei, E.; Rajagopalan, P.; Seyedmahmoudian, M.; Jamei, Y. Review on the impact of urban geometry and pedestrian level greening on outdoor thermal comfort. Renew. Sust. Energy Rev. 2016, 54, 1002–1017. [Google Scholar] [CrossRef]
  26. Santos Nouri, A.; Costa, J.P.; Santamouris, M.; Matzarakis, A. Approaches to Outdoor Thermal Comfort Thresholds through Public Space Design: A Review. Atmosphere 2018, 9, 108. [Google Scholar] [CrossRef] [Green Version]
  27. Gromke, C.; Blocken, B.; Janssen, W.; Merema, B.; van Hooff, T.; Timmermans, H. CFD analysis of transpirational cooling by vegetation: Case study for specific meteorological conditions during a heat wave in Arnhem, Netherlands. Build. Environ. 2015, 83, 11–26. [Google Scholar] [CrossRef]
  28. Buccolieri, R.; Santiago, J.L.; Rivas, E.; Sanchez, B. Review on urban tree modelling in CFD simulations: Aerodynamic, deposition and thermal effects. Urban Forest. Urban Green. 2018, 31, 212–220. [Google Scholar] [CrossRef]
  29. Yang, Y.; Gatto, E.; Gao, Z.; Buccolieri, R.; Morakinyo, T.E.; Lan, H. The “plant evaluation model” for the assessment of the impact of vegetation on outdoor microclimate in the urban environment. Build. Environ. 2019, 159. [Google Scholar] [CrossRef]
  30. Gunawardena, K.R.; Wells, M.J.; Kershaw, T. Utilising green and bluespace to mitigate urban heat island intensity. Sci. Total Environ. 2017, 584, 1040–1055. [Google Scholar] [CrossRef] [PubMed]
  31. Nasir, R.A.; Ahmed, S.S.; Ahmed, A.Z. Psychological Adaptation of Outdoor Thermal Comfort in Shaded Green Spaces in Malaysia. Procedia Soc. Behav. Sci. 2012, 68, 865–878. [Google Scholar] [CrossRef] [Green Version]
  32. Mukherjee, M.; Mahanta, S. Outdoor thermal comfort. A review on the concepts, parameters and methods to evaluate thermal comfort in outdoor spaces. Archit. Time Space People 2014, 16–22. Available online: https://www.coa.gov.in/show_img.php?fid=109 (accessed on 1 December 2019).
  33. Blazejczyk, K.; Epstein, Y.; Jendritzky, G.; Staiger, H.; Tinz, B. Comparison of UTCI to selected thermal indices. Int. J. Biometeorol. 2012, 56, 515–535. [Google Scholar] [CrossRef] [Green Version]
  34. VDI 3787. Part 2, Environmental Meteorology – Methods for the Human Biometeorological Evaluation of Climate and Air Quality for Urban and Regional Planning at Regional Level: Part I; Climate; Beuth Verlag: Berlin, Germany, 2008. [Google Scholar]
  35. Havenith, G.; Fiala, D.; Blazejczyk, K.; Richards, M.; Bröde, P.; Holmér, I.; Rintamaki, H.; Benshabat, Y.; Jendritzky, G. The UTCI-clothing model. Int. J. Biometeorol. 2011, 56, 461–470. [Google Scholar] [CrossRef] [Green Version]
  36. Fiala, D.; Havenith, G.; Bröde, P.; Kampmann, B.; Jendritzky, G. UTCI-Fiala multi-node model of human heat transfer and temperature regulation. Int. J. Biometeorol. 2012, 56, 429–441. [Google Scholar] [CrossRef] [Green Version]
  37. ASHRAE. Handbook of Fundamentals; American Society of Heating, Refrigerating and Air-Conditioning Engineers Inc.: Atlanta, GA, USA, 2001. [Google Scholar]
  38. Coccolo, S.; Kämpf, J.; Scartezzini, J.-L.; Pearlmutter, D. Outdoor human comfort and thermal stress: A comprehensive review on models and standards. Urban Clim. 2016, 18, 33–57. [Google Scholar] [CrossRef]
  39. Binarti, F.; Koerniawan, D.M.; Triyadi, S.; Utami, S.S.; Matzarakis, A. A review of outdoor thermal comfort indices and neutral ranges for hot-humid regions. Urban Clim. 2020, 31, 100531. [Google Scholar] [CrossRef]
  40. Yang, B.; Olofsson, T.; Nair, G.; Kabanshi, A. Outdoor thermal comfort under subarctic climate of north Sweden—A pilot study in Umeå. Sustain. Cities Soc. 2017, 28, 387–397. [Google Scholar] [CrossRef]
  41. Johansson, E. Influence of urban geometry on outdoor thermal comfort in a hot dry climate: A study in Fez, Morocco. Build. Environ. 2006, 41, 1326–1338. [Google Scholar] [CrossRef]
  42. Sharmin, T.; Steemers, K.; Humphreys, M. Outdoor thermal comfort and summer PET range: A field study in tropical city Dhaka. Energy Build. 2019, 198, 149–159. [Google Scholar] [CrossRef]
  43. Krüger, E.; Patricia Drach, P.; Bröde, P. Outdoor comfort study in Rio de Janeiro: Site-related context effects on reported thermal sensation. Int. J. Biometeorol. 2016, 61, 463–475. [Google Scholar] [CrossRef] [PubMed]
  44. Qaid, A.; Lamit, H.B.; Ossen, D.R.; Shahminan, R.N.R. Urban heat island and thermal comfort conditions at micro-climate scale in a tropical planned city. Energy Build. 2016, 133, 577–595. [Google Scholar] [CrossRef]
  45. Giorgi, F.; Lionello, P. Climate change projections for the Mediterranean region. Glob. Planet. Chang. 2008, 63, 90–104. [Google Scholar] [CrossRef]
  46. Maggiotto, G.; Buccolieri, R.; Santo, M.A.; Leo, L.S.; Di Sabatino, S. Validation of temperature-perturbation and CFD-based modelling for the prediction of the thermal urban environment: The Lecce (IT) case study. Environ. Model. Softw. 2014, 60, 69–83. [Google Scholar] [CrossRef]
  47. Suomi, J. Extreme temperature differences in the city of Lahti, southern Finland: Intensity, seasonality and environmental drivers. Weather Clim. Extrem. 2018, 19, 20–28. [Google Scholar] [CrossRef]
  48. Kersalo, J.; Pirinen, P. Suomen maakuntien ilmasto. Ilmatieteen laitos, Helsinki. Ilmatieteen Laitok. Rap. 2009, 8, 185s. [Google Scholar]
  49. Pirinen, P.; Simola, H.; Aalto, J.; Kaukoranta, J.-P.; Karlsson, P.; Ruuhela, R. Tilastoja Suomen ilmastosta 1981–2010. (Climatological statistics of Finland 1981–2010) Ilmatieteen laitos, Helsinki. Ilmatieteen Laitok. Rap. 2012, 1, 83s. [Google Scholar]
  50. Tsoka, S.; Tsikaloudaki, A.; Theodosiou, T. Analyzing the ENVI-met microclimate model’s performance and assessing cool materials and urban vegetation applications—A review. Sustain. Cities Soc. 2018, 43, 55–76. [Google Scholar] [CrossRef]
  51. Matzarakis, A.; Rutz, F.; Mayer, H. Modelling radiation fluxes in simple and complex environments: Basics of the RayMan model. Int. J. Biometeorol. 2010, 54, 131–139. [Google Scholar] [CrossRef] [PubMed] [Green Version]
  52. Thorsson, S.; Lindberg, F.; Eliasson, I.; Holmer, B. Different methods for estimating the mean radiant temperature in an outdoor urban setting. Int. J. Clim. 2007, 27, 1983–1993. [Google Scholar] [CrossRef]
  53. Jendritzky, G.; Nübler, W. A model analysing the urban thermal environment in physiologically significant terms. Arch. Meteorol. Geophys. Bioclimatol. Ser. B 1981, 29, 313–326. [Google Scholar] [CrossRef]
  54. Salata, F.; Golasi, I.; Vollaro, R.d.L.; Vollaro, A.d.L. Urban microclimate and outdoor thermal comfort. A proper procedure to fit ENVI-met simulation outputs to experimental data. Sustain. Cities Soc. 2018, 26, 318–343. [Google Scholar] [CrossRef]
  55. Karakounos, I.; Dimoudi, A.; Zoras, S. The influence of bioclimatic urban redevelopment on outdoor thermal comfort. Energy Build. 2018, 158, 1266–1274. [Google Scholar] [CrossRef]
  56. Ouali, K.; Harrouni, K.E.; Abidi, M.L.; Diab, Y. Analysis of Open Urban Design as a tool for pedestrian thermal comfort enhancement in Moroccan climate. J. Build. Eng 2020, 28, 101042. [Google Scholar] [CrossRef]
  57. Morakinyo, T.E.; Kong, L.; Lau, K.-L.L.; Yuan, C.; Ng, E. A study on the impact of shadow-cast and tree species on in-canyon and neighborhood’s thermal comfort. Build. Environ. 2017, 115, 1–17. [Google Scholar] [CrossRef]
  58. Park, M.; Hagishima, A.; Tanimoto, J.; Narita, K. Effect of urban vegetation on outdoor thermal environment: Field measurement at a scale model site. Build. Environ. 2012, 56, 38–46. [Google Scholar] [CrossRef]
  59. Taleghani, M.; Kleerekoper, L.; Tenpierik, M.; van den Dobbelsteen, A. Outdoor thermal comfort within five different urban forms in the Netherlands. Build. Environ. 2015, 83, 65–78. [Google Scholar] [CrossRef]
  60. Aram, F.; García, E.H.; Solgi, E.; Mansournia, S. Urban green space cooling effect in cities. Heliyon 2019, 5, e01339. [Google Scholar] [CrossRef] [PubMed] [Green Version]
  61. Lobaccaro, G.; Acero, J.A.; Martinez, G.S.; Padro, A.; Laburu, T.; Fernandez, G. Effects of Orientations, Aspect Ratios, Pavement Materials and Vegetation Elements on Thermal Stress inside Typical Urban Canyons. Int. J. Env. Res. Public Health 2019, 16, 3574. [Google Scholar] [CrossRef] [Green Version]
  62. Salata, F.; Golasi, I.; de Lieto Vollaro, R.; de Lieto Vollaro, A. Outdoor thermal comfort in the Mediterranean area. A transversal study in Rome, Italy. Build. Environ. 2016, 96, 46–61. [Google Scholar] [CrossRef]
  63. Golasi, I.; Salata, F.; De Lieto Vollaro, E.; Coppi, M.; De Lieto Vollaro, A. Thermal Perception in the Mediterranean Area: Comparing the Mediterranean Outdoor Comfort Index (MOCI) to Other Outdoor Thermal Comfort Indices. Energies 2016, 9, 550. [Google Scholar] [CrossRef] [Green Version]
Figure 1. Top: position of the city of Lecce in southern Italy with a focus on the study area (referred to as San Pio hereinafter). Bottom: 3D view of San Pio neighbourhood (modified from Google Earth).
Forests 11 00228 g001
Figure 2. Top: position of the city of Lahti located in southern Finland with a focus on the study area located in the city centre (referred to as Aleksanterinkatu hereinafter. Bottom: 3D view of Aleksanterinkatu neighbourhood (modified from Google Earth) and street pictures showing Tilia cordata Mill. and the square.
Forests 11 00228 g002
Figure 3. Investigated scenarios of the San Pio neighbourhood in Lecce (top) and the Aleksanterinkatu neighbourhood in Lahti (middle), with indication of the deciduous and evergreen species in Aleksanterinkatu, the investigated points P1, P2 and P3, the measurement position denoted by the yellow dot “VD” in the current scenario of San Pio and the investigated street canyons denoted by the red dotted line. Some evergreen species, deciduous species and hedge species present in the current scenario of San Pio (bottom) (base maps from Spaces tool of ENVI-met model, see Section 3.4).
Forests 11 00228 g003
Figure 4. San Pio neighbourhood. Lead area index (LAI) measurements with the ceptometer (left) and map (middle) with indication of the position (VD in Figure 3) of the thermo-hygrometer (right) employed for the validation of ENVI-met simulations (see Section 3.4).
Forests 11 00228 g004
Figure 5. Time evolution of air temperature Tair (left) and relative humidity Rh (right) measured and obtained from ENVI-met at the measurement position VD in San Pio (Lecce).
Forests 11 00228 g005
Figure 6. Profiles of air temperature Tair obtained at points P1, P2 and P3 in San Pio (top) and P1 and P2 in Aleksanterinkatu (bottom) in the investigated summer and winter days. The extraction data points are indicated with a red star in the maps.
Forests 11 00228 g006aForests 11 00228 g006b
Figure 7. Spatial distribution of mean radiant temperature (MRT) at 15:00 in San Pio (a,b) and at 11:00 in Aleksanterinkatu (c,d) at height of 1.4 m for the no vegetation scenario (left), current scenario (middle) and new scenario (right) in winter and summer days.
Forests 11 00228 g007
Figure 8. Spatial distribution of predicted mean vote (PMV) at 15:00 in San Pio (a,b) and at 11:00 in Aleksanterinkatu (c,d) at height of 1.4 m for the no vegetation scenario (left), current scenario (middle) and new scenario (right) in winter and summer days.
Forests 11 00228 g008aForests 11 00228 g008b
Table 1. List of species identified within the two neighbourhoods with indication of the leaf area density (LAD).
SpeciesLAD (m2m−3)SpeciesLAD (m2m−3)
San Pio Neighbourhood (Lecce, Italy)
Casuarina equisetifolia L.1.0Phothinia x fraseri Dress.1.7
Cedrus atlantica (Endl.) G.Manetti ex Carrière0.5Phytolacca dioica L.0.8
Celtis australis L.0.6Picea abies (L.) H.Karst.0.3
Tilia sp.0.3Pinus halepensis Mill. (1)0.3
(2)0.2
(3)0.4
Ceratonia siliqua L.0.5Pinus pinaster Aiton subsp. Pinaster1.0
Cercis siliquastrum L. subsp. Siliquastrum0.3Pittosporum tobira (Thunb.) W.T.Aiton1.7
Chamaerops humilis L.0.9Populus nigra var. italica Münchh.0.1
Citrus × aurantium L.0.3Nerium oleander L. subsp. oleander1.2
Cupressus sempervirens L.0.5Morus alba L.0.4
Eriobotrya japonica (Thunb.) Lindl.0.4Prunus sp.0.3
Eucalyptus camaldulensis Dehnh. subsp. camaldulensis0.2Punica granatum L.0.3
Hesperocyparis arizonica (Greene) Bartel0.1Quercus ilex L. subsp. ilex (1)0.2
(2)0.4
(3)0.6
Hesperocyparis macrocarpa (Hartw. ex Gordon) Bartel0.4Olea europea L.0.8
Laurus nobilis L.0.9Quercus ithaburensis Decne. subsp. macrolepis (Kotschy) Hedge & Yalt.0.1
Ligustrum japonicum Thunb.1.6Rhamnus alaternus L. subsp. Alaternus1.2
Lycianthes rantonnei (Carrière) Bitter0.8Phoenix dactylifera L.0.7
Magnolia grandiflora L.0.2Salix babylonica L.0.1
Schinus molle L. (1)0.3Viburnum lucidum Mill.2.4
(2)0.1
Aleksanterinkatu neighbourhood (Lahti, Finland)
Picea abies (L.) H.Karst. (added for the “new scenario”)0.5Tilia cordata Mill.1.0
Table 2. Initial and boundary conditions used in ENVI-met simulations.
ParameterDefinitionValue
Simulation TimeStart Date3 December 2018 (winter case)
7 July 2019 (summer case)
Lecce
18 February 2018 (winter case)
17 July 2018 (summer case)
Lahti
Start of simulation (h)05:00
Total simulation time16 h (4 h spin-up + 12 h)
Meteorological conditionsWind speed0.9 m/sLecce
1.1 m/sLahti
Wind direction210°Lecce
Lahti
Temperature of atmosphere (forced)Daily profile
Relative humidity (%) (forced)Daily profile
Roughness, solar radiation and cloudsRoughness length 0.1 (urban area)
Cover of low clouds (octas)1.00 (clear sky)
Cover of medium clouds0.00 (clear sky)
Cover of high clouds0.00 (clear sky)
SoilInitial temperature (K) and relative humidity
(%) of upper layer 0–0.2 m
293–50 (default values)
Initial temperature (K) and relative humidity
(%) of middle layer 0.2–0.5 m
293–60 (default values)
initial temperature (K) and relative humidity
(%) of deep layer below 0.5 m
293–60 (default values)
Computational domain and gridGrid cells (x,y,z)175 × 141 × 30Lecce
200 × 225 × 30Lahti
δx x δy x δz2 m × 2 m × 2 m (equidistant: 5 cells close to the ground)
Nesting grids5
Boundary conditionsCyclic
Table 3. PMV values in San Pio and Aleksanterinkatu at the extraction points indicated in Figure 6.
PMV Values
No Vegetation ScenarioCurrent ScenarioNew Scenario
San Pio
(Lecce, IT)
P1P2P3P1P2P3P1P2P3
Summer 5.785.885.795.56 Forests 11 00228 i0013.94 Forests 11 00228 i0025.20 Forests 11 00228 i0015.14 Forests 11 00228 i0013.86 Forests 11 00228 i0025.54 Forests 11 00228 i001
Winter −1.87−1.26−1.85−1.68 Forests 11 00228 i001 −1.61 Forests 11 00228 i003−1.65 Forests 11 00228 i001−1.77 Forests 11 00228 i001 −1.64 Forests 11 00228 i003−1.70 Forests 11 00228 i001
Aleksanterinkatu
(Lahti, FI)
P1P2-P1P2-P1P2-
Summer 4.104.54-4.00 Forests 11 00228 i0013.70 Forests 11 00228 i002-3.90 Forests 11 00228 i0012.95 Forests 11 00228 i002-
Winter −7.17−7.01-−7.00 Forests 11 00228 i001−6.70 Forests 11 00228 i001-−7.11 Forests 11 00228 i001−6.64 Forests 11 00228 i001-
Forests 11 00228 i001: indicates a positive effect of vegetation on thermal comfort; Forests 11 00228 i002: indicates a very positive effect of vegetation on thermal comfort; Forests 11 00228 i003 indicates a negative effect of vegetation on thermal comfort.

