Article

Urban Green Corridors Analysis for a Rapid Urbanization City Exemplified in Gaoyou City, Jiangsu

College of Environment and Surveying and Mapping, China University of Mining and Technology, Xuzhou 310058, China
*
Author to whom correspondence should be addressed.
Forests 2020, 11(12), 1374; https://doi.org/10.3390/f11121374
Submission received: 17 November 2020 / Revised: 14 December 2020 / Accepted: 16 December 2020 / Published: 21 December 2020
(This article belongs to the Section Forest Ecology and Management)

Abstract

:
The undergoing trend and development towards urbanization and the consequences of socio-ecological and climate change are increasing the pressure on cities worldwide. The planning of urban green and blue spaces is essential for sustainable urban development, especially for the conservation of urban ecosystems in fast-growing cities. In this context, the spatial-explicit and ecological connectivity analyses of urban green infrastructure are helpful tools for planning and the evaluation of spatial patterns and their changes for the sustainability of urban development. The aim of this study is to understand the influence of urban expansion on the urban green corridors. In this paper, we present an analysis of ecological networks for green infrastructure planning at the city level, making the most out of morphological spatial pattern analysis (MSPA) techniques and social-ecological analysis methods. The findings reveal the changes of spatial patterns of urban green and blue areas in Gaoyou city and disclose its ecological corridors and connectivity from 1990 to 2012. The urban green corridors analysis method proposed here can be used in other cities and allow for the production of spatially detailed urban ecological connectivity assessment and monitoring. Recommendations to enhance and conserve green corridors and ecological networks such as reserving networks in the east of the example city have been concluded. The conclusion obtained using our spatial analysis method can be used in other municipalities to serve as spatial-explicit tools for urban green spaces and land use planning.

1. Introduction

Cities, especially those in rapidly growing processes of urbanization in Asia [1], are increasingly the spotlights of a large number of classical and emerging disciplines that study social-ecological systems [2,3,4,5,6] in the aim of disclosing the structures, spatial patterns and landscape corridors within urban areas [7,8]. To capture the characteristics of urban green areas, studies incorporate integrated analyses in the spatial coverage of urban green and blue areas, and their composition, structure and functioning have been a crucial component to inform urban planners and land use policy makers [9]. Simultaneously, Green Infrastructure (GI) has evolved and been widely employed [10], and it has been defined and interpreted in different ways, especially as ecological networks [11] of natural and semi-natural areas and approaches for the strategic planning of networks of green and blue spaces that meet multiple environmental, social and economic objectives in urban environments on various scales [12,13,14]. It has been widely recognized as one of the key concepts for promoting urban sustainability and optimizing urban and regional spatial planning [7,12,15,16]. Therefore, this paper stands on these bases and aims to investigate the central idea of urban GI, i.e., the urban corridors evolvement in a rapid urbanization city.
In the realm of the last two decades, urban green corridors and its analyzing methods have been widely used in European countries such as Austria and Hungary [17], the United States [18,19,20], as well as in Asian countries such as China, e.g., its megacities [21,22], and south India [23,24], as well as other fast growing urban areas in Africa [25,26,27]. These studies have contributed to advance the theoretical foundations of urban green corridors analysis and to understand the state-of-the-art of urban green corridors in landscape planning in practices, under different contexts and respective spatial plans. However, there are rather rare empirical analyses on a municipal scale for urban ecological connectivity and scarce for changes of urban green corridors. Few studies have been undertaken for cities under huge changes and potential pressure. As one of most dynamic regions in urbanization [28], there is a large number of Chinese cities that should not be overlooked [29,30] and ought to be explored in depth with explicit attention to pattern relationships and changes and to emphasize the connectivity [31].
Indeed, there are a growing number of studies on urban ecological processes (e.g., [32,33,34,35,36]) and most studies have provided useful insights into ecological considerations as well as urban GI for climate adaptation to urban growth, function and configurations. However, a study focusing on the changes of urban green corridors at the city level in fast urbanization regions such as China is missing. Furthermore, a cohesive, well-described analysis on spatial pattern changes of urban GI is demanding not only in China but also on a municipal spatial scale globally. This paper thus aims to fill in this gap to reveal the changes of green spaces for the fastest urbanization period.
Considering that an in-depth analysis regarding the ecological connectivity and changes of green spaces is lacking, especially at the city level in Chinese fast-growing regions, this paper intends to fill the gaps in the application of urban GI concept and unlock the changes of spatial patterns in one Chinese typical city. Under the background of advancing Chinese ecological civilization, urban greening and ecological development have been recognized as goals at multiple levels in China, i.e., national, provincial and city. For a rapid developing city such as Gaoyou, it is significant to grasp the changes of urban green infrastructure in the past decades, considering that these changes have profound impacts on the entire ecosystem. Moreover, urban green spaces provide multiple ecosystem services, including provisioning, regulation and cultural services and so on. The various ecosystem services provided by urban green spaces give residents the accessibility to urban nature [37,38] whilst improving their physical and psychological well-being. For example, urban parks could be not only significant corridors for climate change adaptation but also substantially decrease individual exposures on several health hazards as proved by Moreira, Polizel, Santos, Bensenor, Lotufo and Mauad [38].
In this paper, we analyze first the morphological spatial patterns for the year of 1990, 2000, and 2012 to provide integrative information on the changing patterns of urban green and blue spaces in Gaoyou city. Based on this information, we compare and explore the changes of spatial patterns of urban green areas in the city of Gaoyou to disclose and reflect the ecological corridors and connectivity at a municipal level from 1990 to 2012. By doing so, this paper aims to optimize the ecological networks of urban GI planning in a fast-developing city, i.e., Gaoyou. For a pilot city in urban greening in China, this study plays an example role for Chinese ecological civilization. It is of great importance to guide fast urbanization into the direction of protecting and improving species diversity to prevent urban green areas from fragmentation and establish the networks between isolated ecological patterns. It may stimulate progress in developing GI strategies and adaptive evaluation methods to inform GI planning and implementation.

2. Materials and Methods

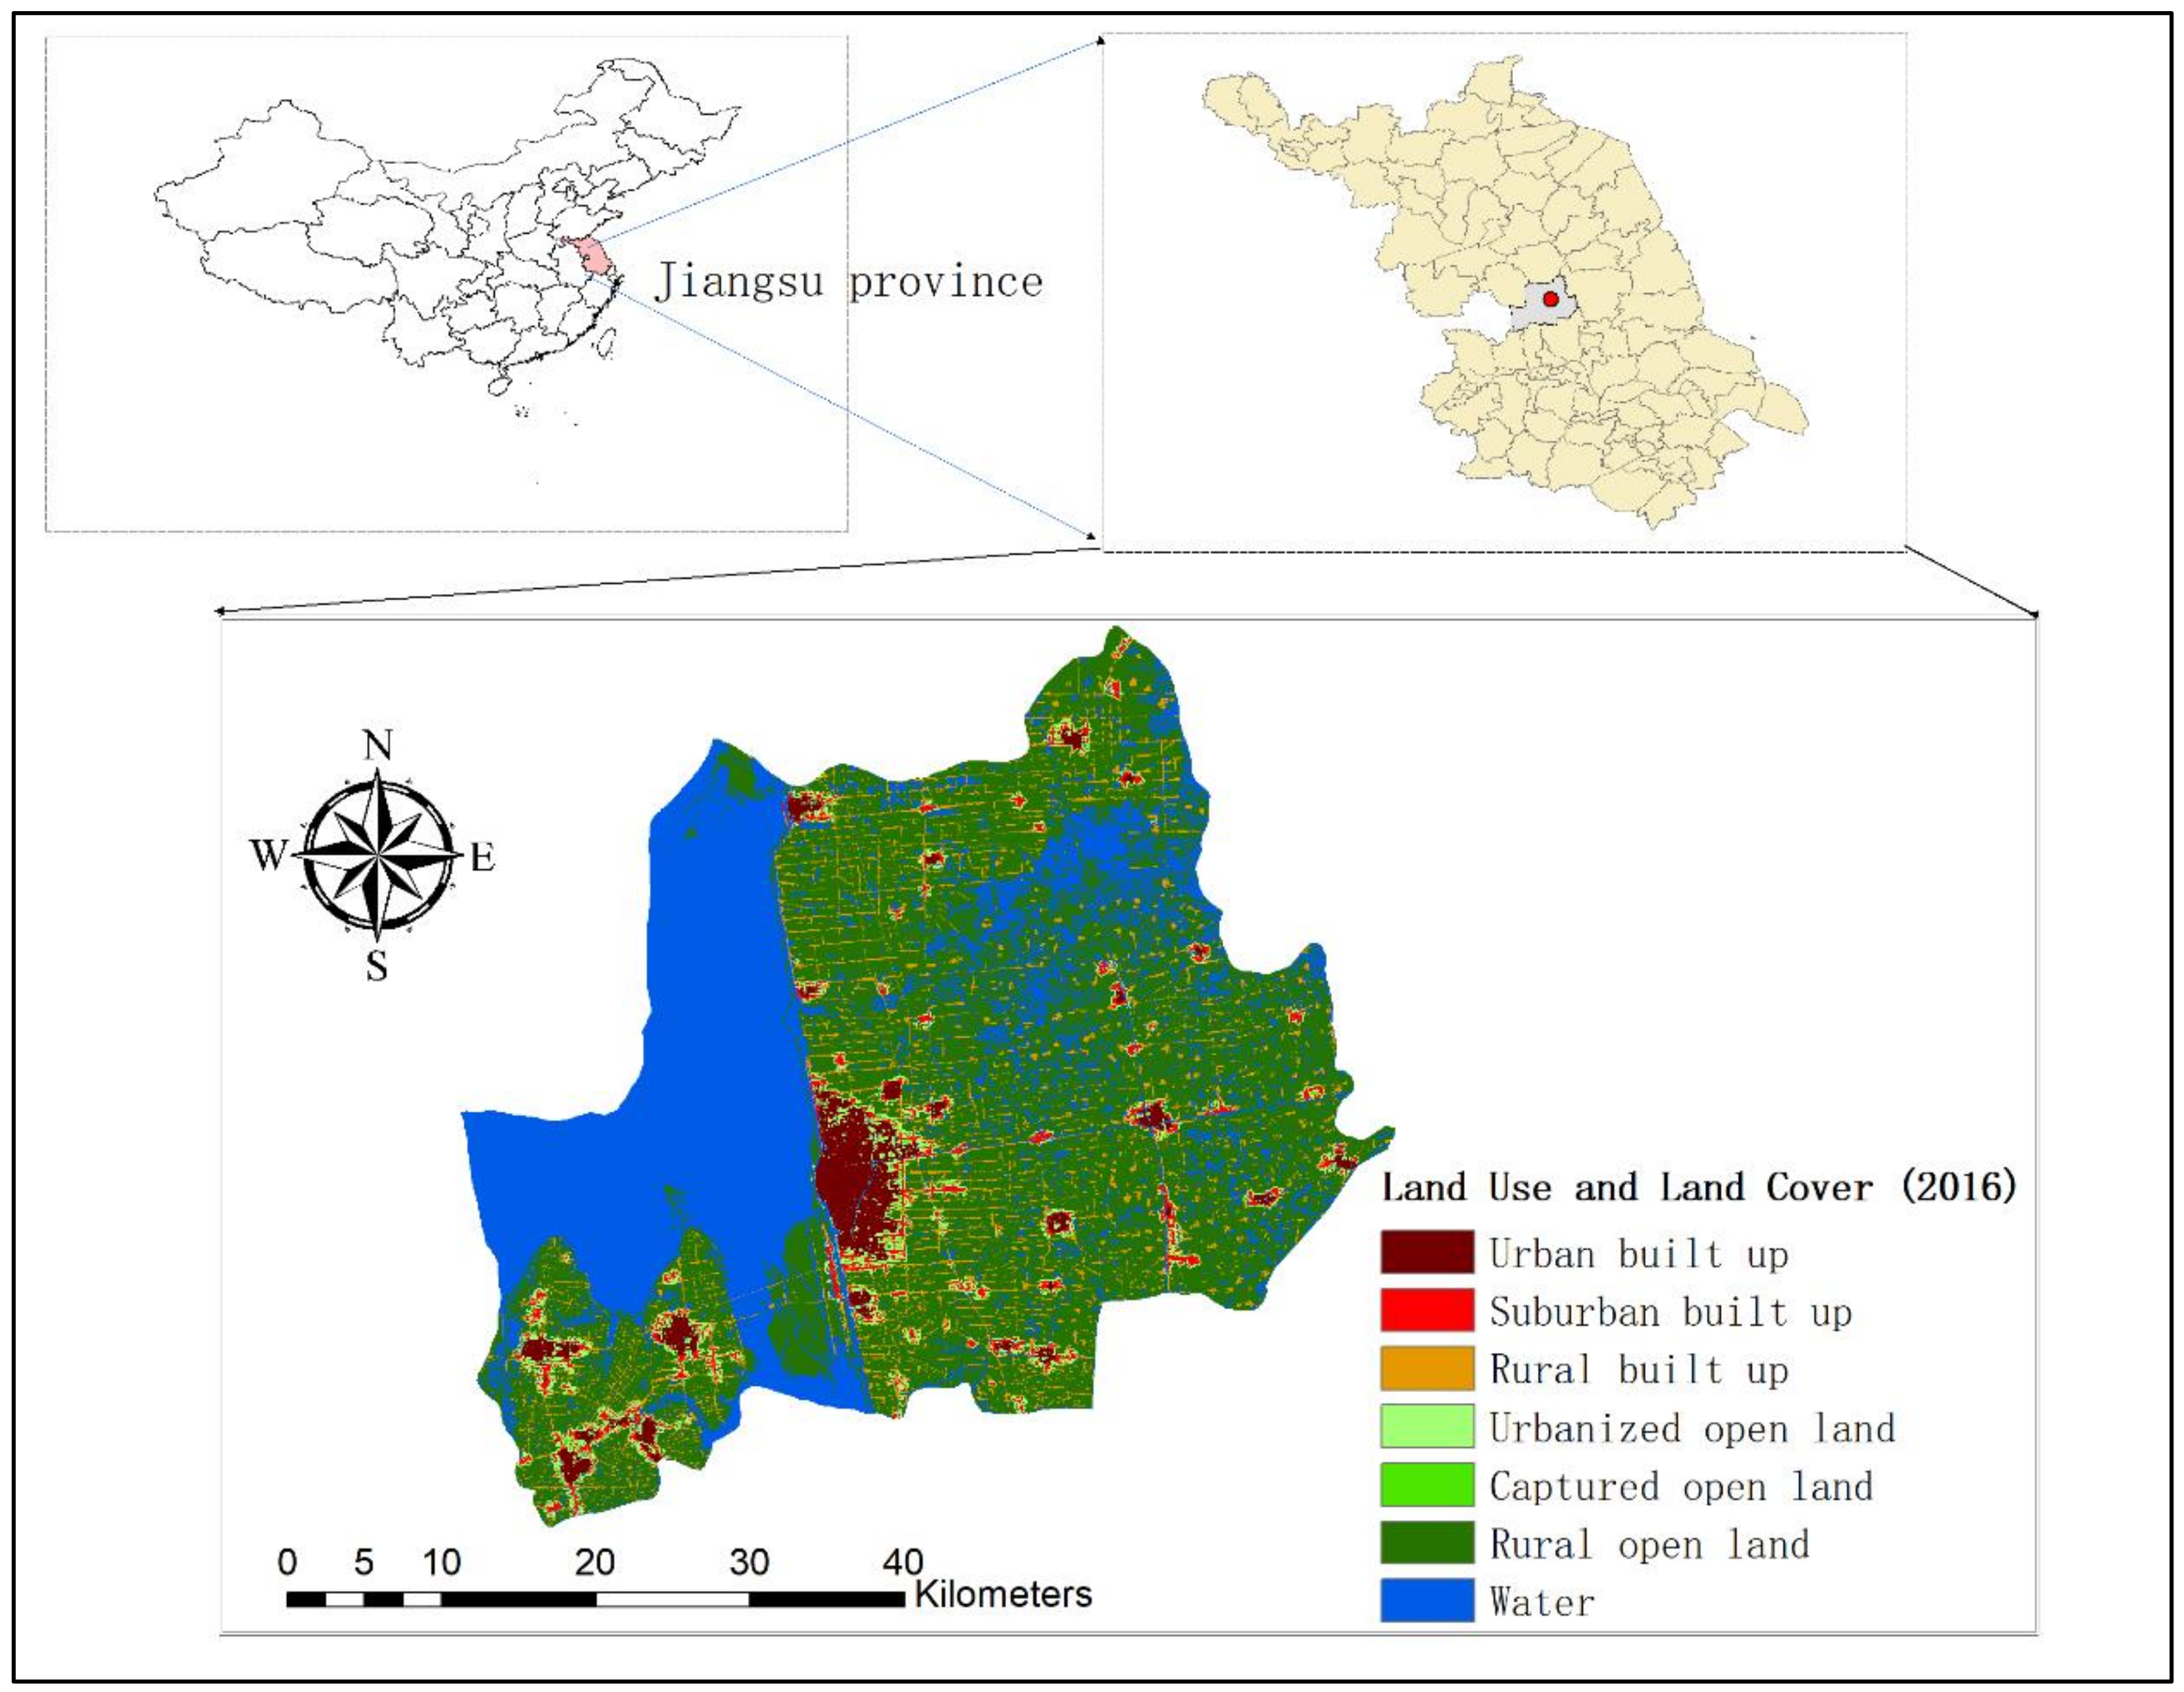
2.1. Outline of Study Area and Data Description

For the purpose of our study, we selected one typical city, Gaoyou, in Jiangsu province. It is a rapidly growing city, which has been expanded a total of 4207 ha of built-up area in urban extent between 2000 and 2016 [39]. As shown in Figure 1, it is located in the central west of Jiangsu province. The population of Gaoyou, Jiangsu in 2000 was 70,291, decreasing at an average annual rate of −2.3% since 1990, when its population was 86,595. However, the population of Gaoyou in 2016 was 186,351, increasing at an average annual rate of around 6% since 2000 [39]. It makes this city very special and worth being studied in terms of its sustainability in urban development. To define and depict the study area, we use the latest provincial and city boundaries of China in the year of 2019. As you can see in Figure 1, Gaoyou is a county-level city located in the central of Jiangsu province within one of the biggest lakes, Gaoyou lake. Geographically, it is located at 34°12′20″ N and 117°17′02″ E. 34.2058 altitude and 117.2841 longitude.
This study area is typical of urban land use with mixed environments in Jiangsu province. The city of Gaoyou is selected considering the following characteristics: (1) it is one of the most typical examples of a World Heritage City within a long history and several national tourism labs; (2) within a thousand years of history in urban and rural development, it has been recognized as the 47th developed city in economics in China; (3) it has been named as the ecological city in China concerning its high coverage of green areas as well as its rich resources in developing tourism.

2.2. Preprocessing Method for Land Use and Land Cover Datasets

To analyze the ecological connectivity of areas of interests, a thorough evaluation of the classification methods of spatial data and their application is essential for the data preprocessing. In this study, we compared and made a preliminary evaluation of several data from multi-sources at first. The preliminary evaluation includes several parts. In the end, data collected from Atlas of Urban Expansion [39,40] is employed as the spatial dataset for pattern analysis, considering that its preprocessing processes are explicitly clear and appropriate for our method. For example, Landsat Classification Study area boundaries were superimposed on Landsat scenes corresponding to the three time periods, i.e., the year of 1990, 2000 and 2016. The intersected area, with an additional 1 km buffer, was selected for classification. It is significant to extract three types of land cover categories from the Landsat images: water, built-up, and other/open space. Water refers to any Landsat pixel that is comprised of surface water, including oceans, lakes, ponds, reservoirs, rivers, streams, canals, pools, and flooded wetlands. Built-up refers to any Landsat pixel that is comprised of structures or surfaces constructed by humans, including buildings, roads, parking lots, racetracks, railroads, and docks. Other/open space refers to any Landsat pixel comprised of vegetated surfaces and barren lands, including forests, agricultural crops, fallow agricultural fields, wetlands, grass lands, desert lands, beaches, mountaintops, and other land cover types that are neither water nor built-up. For a review of remote sensing concepts and methods and an explanation of the unsupervised classification technique employed in detail, including post classification processing and editing, see Angel, Blei, Parent, Lamson-Hall, Galarza-Sanchez, Civco and Thom [39], and Angel et al. [40].
The collected data were derived and prepared for the spatial analysis as shown in Table 1. For further processing, we reviewed and understood each class of used spatial data to customize the Urban Expansion Dataset into patterns analysis. The meaning of each class in data source and our evidence for the reclassification have been thoroughly listed in Table 1. This reclassification, as one crucial preprocessing step, has been undertaken three times for each year using the same method.

2.3. Methodology for Morphological Spatial Patterns Analysis

To analyze the ecological connectivity and green corridors in Gaoyou, we derived the data introduced in Section 2.2 and then customized the morphological spatial pattern analysis (MSPA) approach following the guidelines and MSPA tutorials [41,42,43,44,45]. First, reclassifications of urban land use and cover dataset have been made, respectively, for the year of 1990, 2000 and 2012 using the same methods. The outputs of the reclassifications were employed as the input data for the spatial analysis, incorporating both the green and grey infrastructure in Gaoyou city. Moreover, in accordance with the results shown in the Atlas of Urban Expansion, i.e., most of the street widths in the research of interest are around 10 m from 1990 to 2016, we used the width of 10 m for ecological connectivity analysis in Gaoyou as well. Both the MSPA GUIDOS software version 3.0 [42] and R package were used to firstly undertake the MSPA analysis for Gaoyou and then to visualize results from MSPA toolbox. In the end, all of spatial patterns have been colored according to the standard symbology advised in the manual guide [41,42].

3. Results

In this section, results from the aforementioned methods will be presented from two aspects. First, the morphological spatial patterns of urban green infrastructure in Gaoyou for 1990, 2000 and 2016, respectively. Second, a comparable analysis on the changes of patterns from core areas to islands from 1990 to 2016, as well as the underlying land use changes and urbanization policies. Both serve to discover the ecological connectivity and dynamics of urban green spaces in a rapid developing city.

3.1. Changes of Morphological Spatial Patterns of Green Infrastructure in Gaoyou from 1990 to 2016

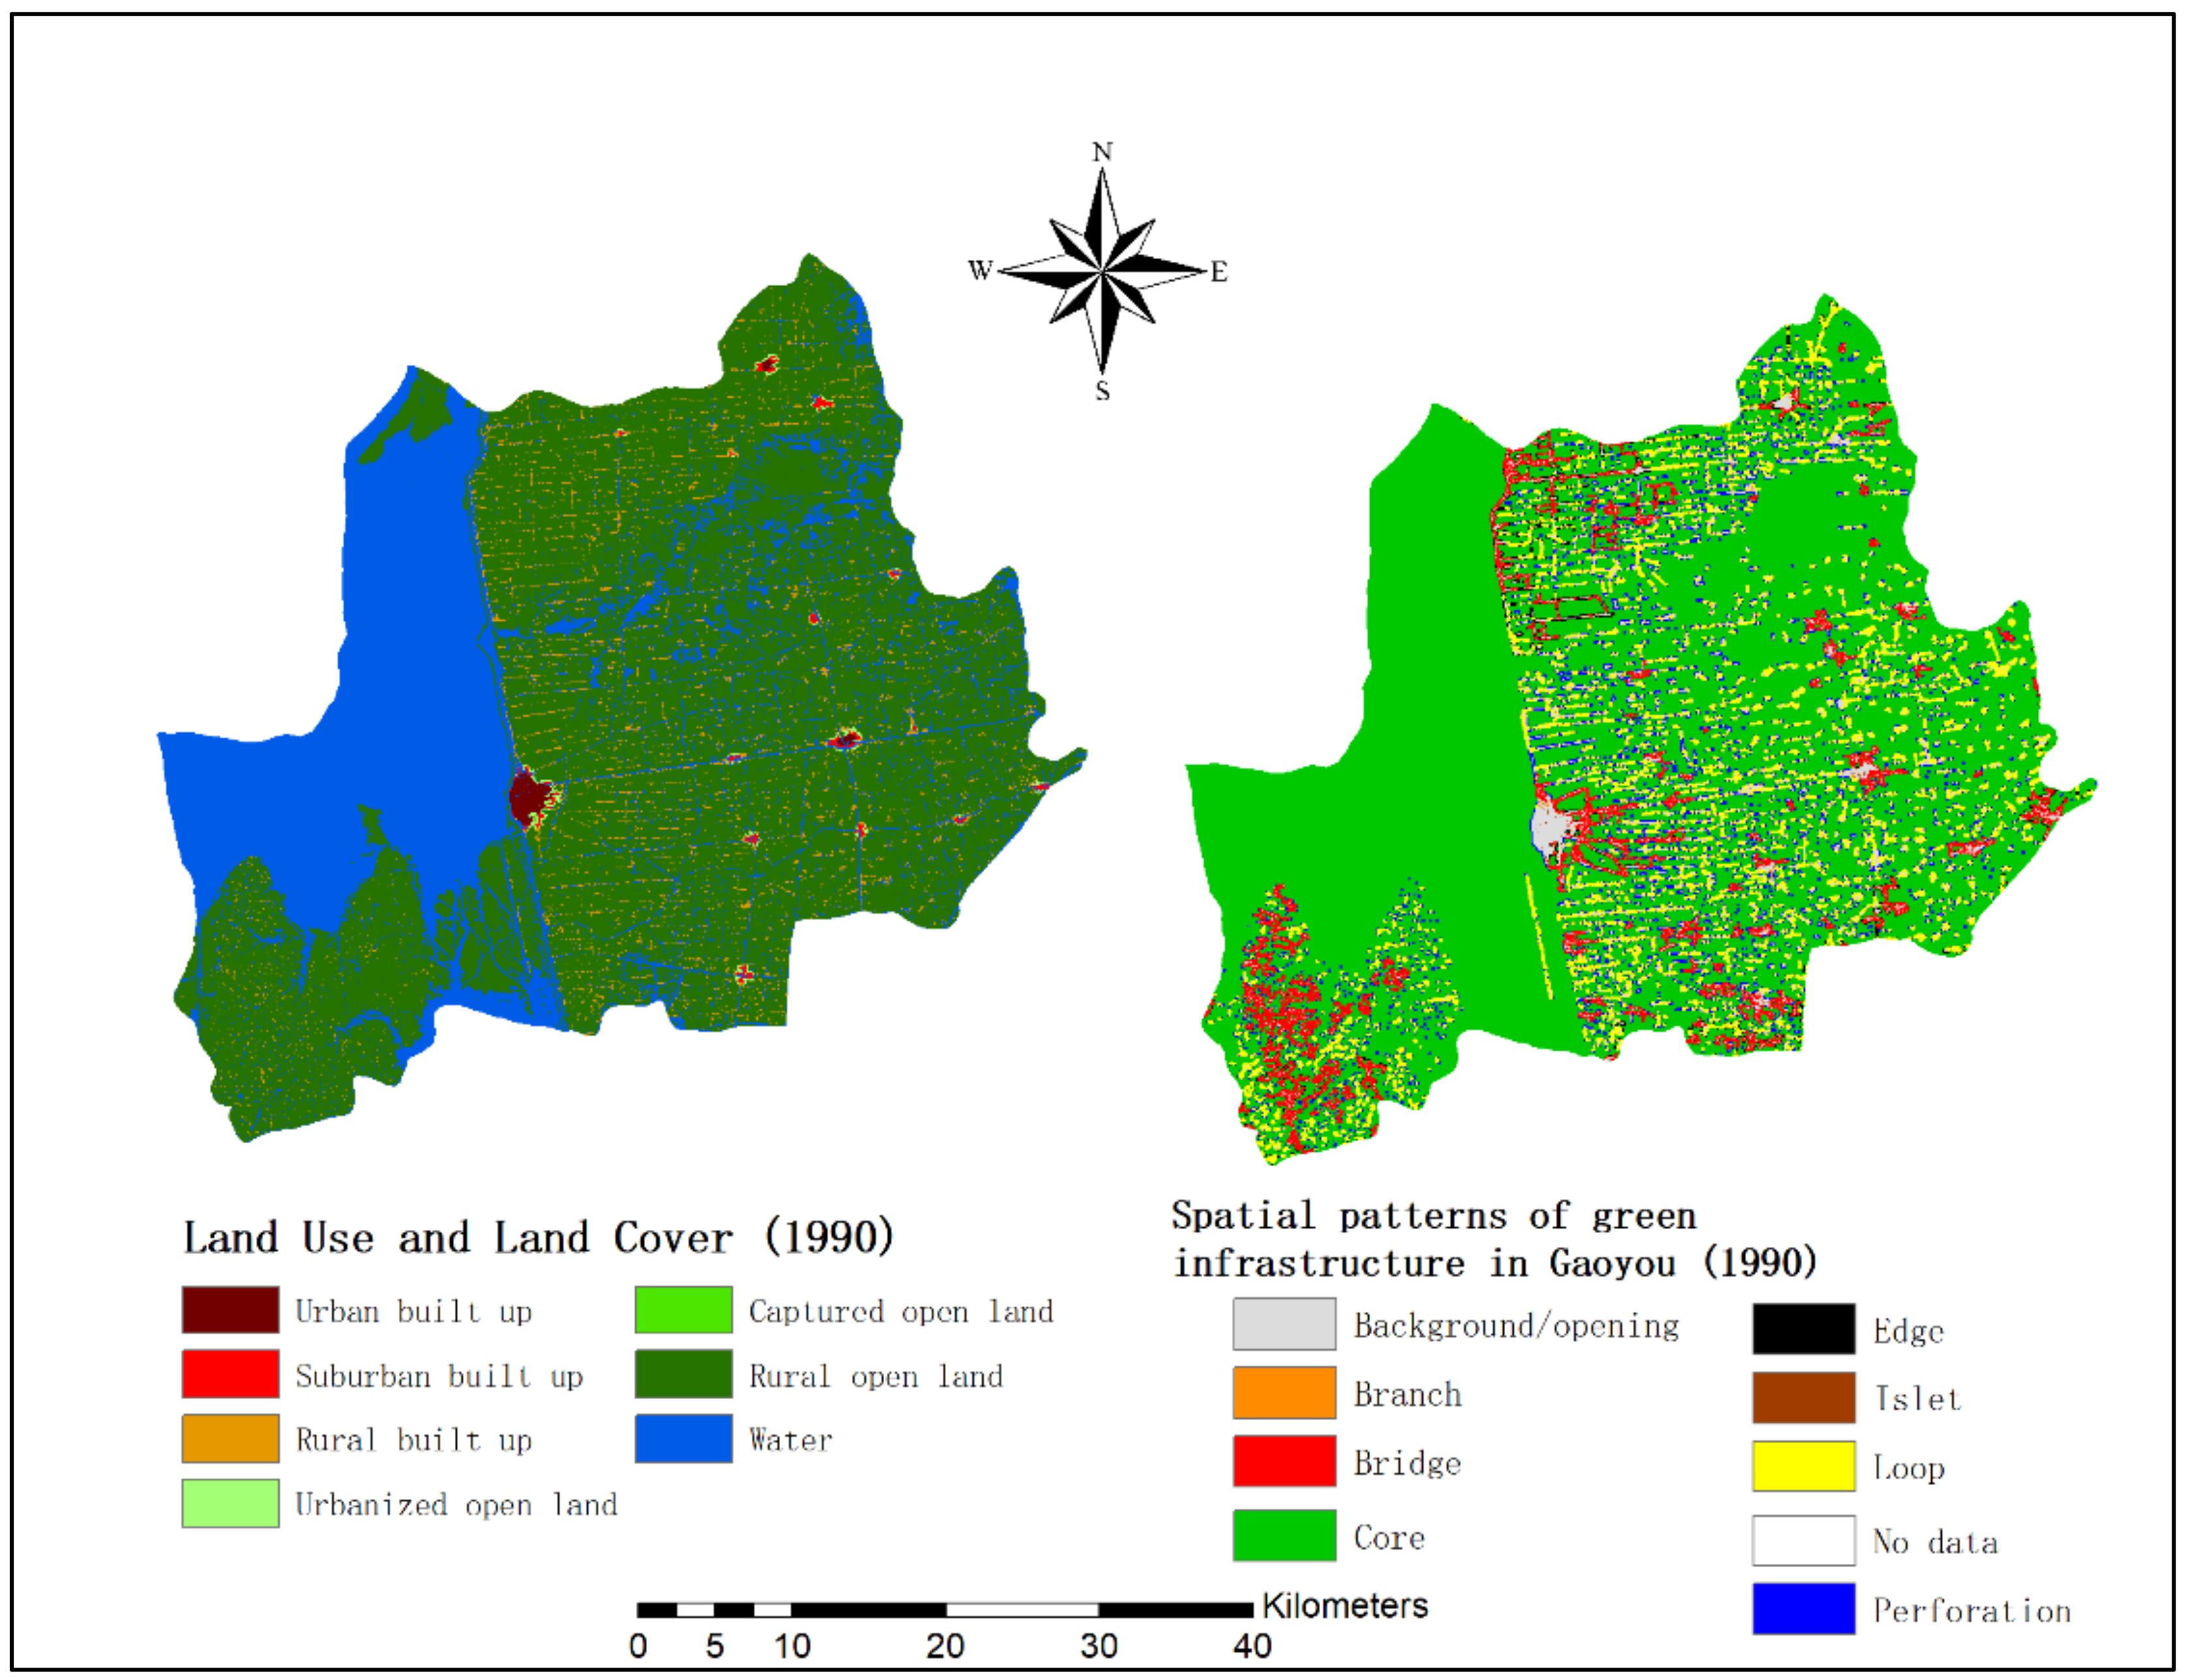
3.1.1. Morphological Spatial Patterns of Green Infrastructure for 1990 in Gaoyou City

The primary spatial patterns of green infrastructure in 1990 are core, perforation, bridge and loop patterns, in the order of proportions. As results for 1990, both the urban land use and cover and spatial patterns of green infrastructure in Gaoyou are presented in Figure 2. In the year of 1990, it can be found that there is a large proportion of green and blue areas. There are several bridges connected the city center with other green areas. The green corridors alongside the main roads from city center to the rural areas are well connected and spreading into the eastern direction. What is worth mentioning here is that there are plenty of well-connected green bridges in the west-southern part of the city center. However, there are very few branches and islets, which implies a potential level of fragmentation in green spaces.

3.1.2. Morphological Spatial Patterns of Green Infrastructure for 2000 in Gaoyou City

The primary spatial patterns of green infrastructure in 2000 (Figure 3) are core, edge, perforation, and bridge patterns. The spatial patterns of green infrastructure in 2000 show great differences in core, edge, bridge, and perforation areas, compared to patterns in 1990. It can be observed that there is a substantial loss of green and blue areas, in the north, south and west southern of the city center. However, it follows with a massive increase in green corridors, which indicates a high level of ecological connectivity. The growth of edge patterns happened mainly in the city center and its south areas. Most of the branch patterns exist in the city center. They are mostly planted and constructed green spaces in the city center in the decade of 1990–2000. What is outstanding is that there is one long green corridor connected from the west-south part of the city to the city center.

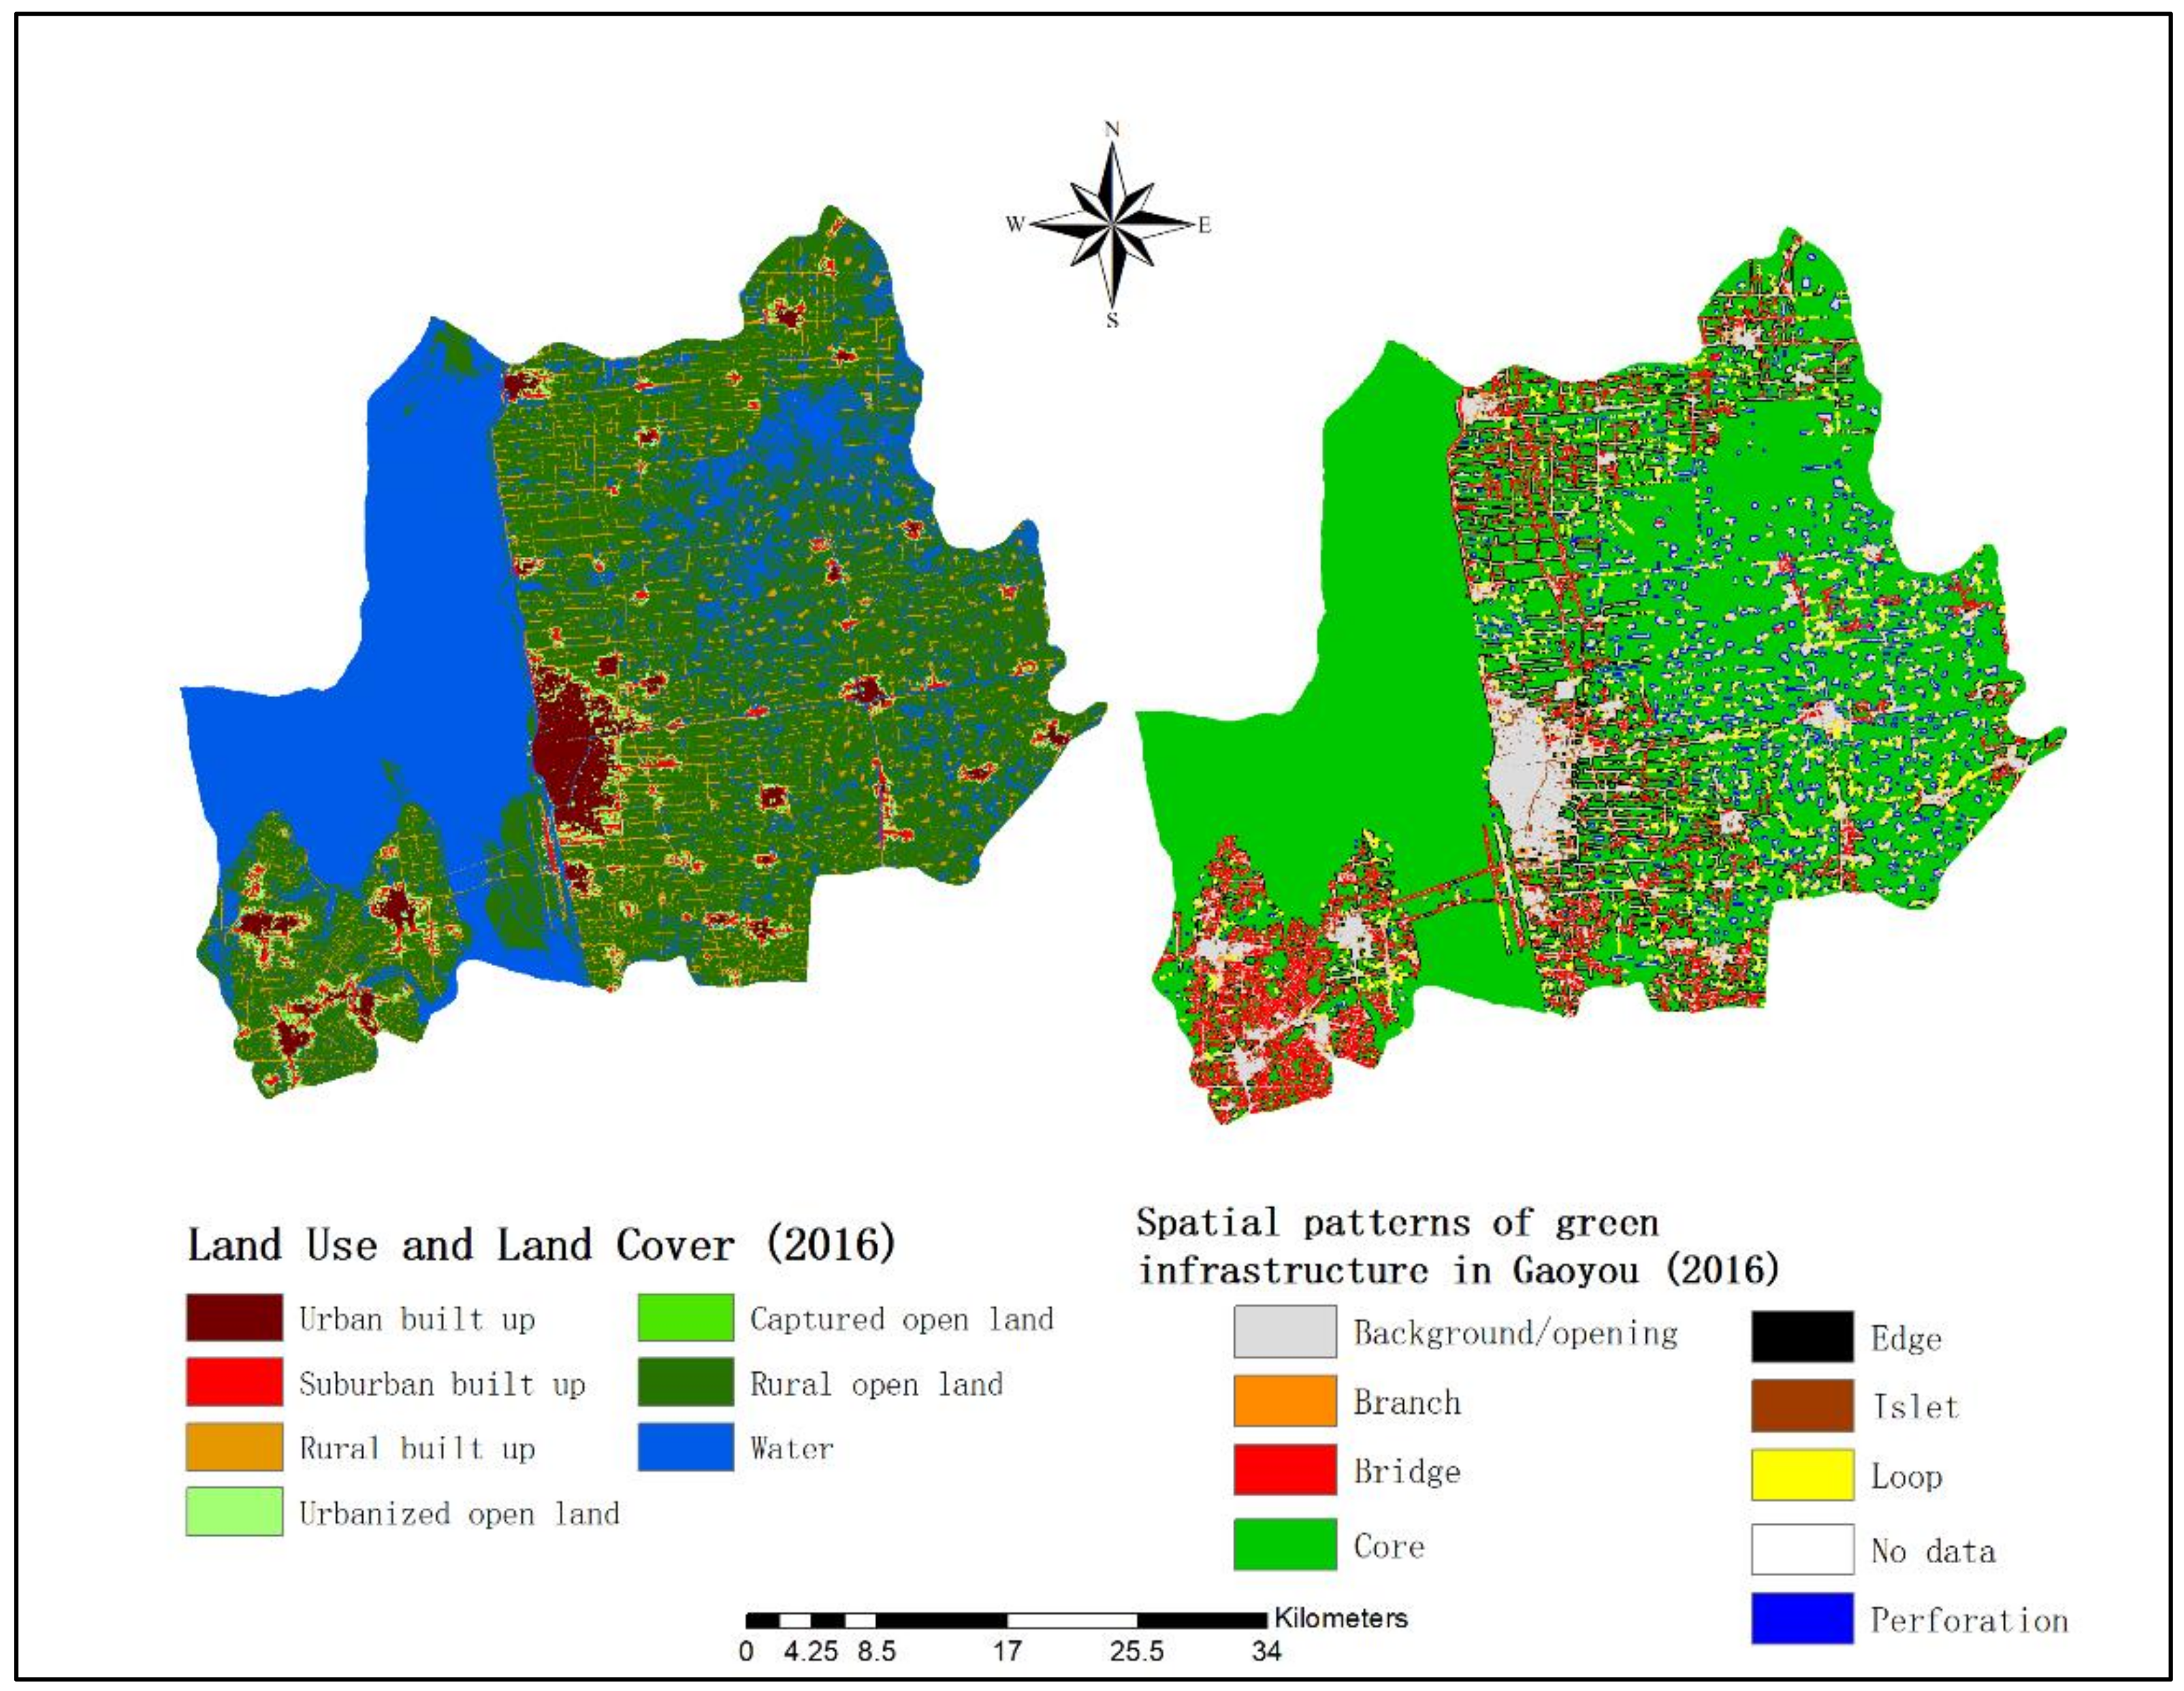
3.1.3. Morphological Spatial Patterns of Green Infrastructure for 2016 in Gaoyou City

As shown in Figure 4, the primary spatial patterns of green infrastructure in 2016 are core, edge, perforation, and bridge patterns. The percentage of branch areas is greater than the self-connected loops. It indicates a trend of fragmentation, especially in the small green areas. There is another additional green corridor between two city centers. A large number of perforations and loops are spreading in the central east part of Gaoyou city. Most of the edges are in the central south of Gaoyou and all of them are in small sizes. What is obvious is that the bridges in the west south obviously cluster together around the suburban built-up areas.

3.2. The Morphological Spatial Patterns of Gaoyou City from 1990 to 2016

The morphological spatial pattern changes of Gaoyou are, respectively, analyzed in the years of 1990, 2000, and 2016. It includes three special time for Gaoyou in its process of urbanization and spatial planning. To better understand the change of spatial patterns of GI in Gaoyou from 1990 to 2016, the proportions of each pattern have been presented in Figure 5, grouped in years. The proportions of spatial patterns in Gaoyou from 1990 to 2016 are substantially decreasing in the patterns of core, edge, and perforation. The differences in bridge patterns are greatly increasing from 1990 to 2000 but slightly decreasing from 2000 to 2016. Both the branch and islet patterns increase quite slowly. However, the loop patterns slightly decrease from 1990 to 2016. The enormous loss of core patterns indicates a substantial decrease in green and blue areas in large sizes from 1990 to 2016. Most of the bridge patterns in Gaoyou were built between 1990 and 2000. Some of the bridges were changed into edges during the years of 2000 to 2016. The interruptions of green corridors and increase in branch patterns show an evident trend of fragmentations in green spaces in Gaoyou city. The fragmentations of urban green spaces in Gaoyou happened mostly in the eastern part of the city.
As shown in Figure 5, the connected core areas are decreasing from 1990 to 2016, it is noticeable that there is a high potential of fragmentation in urban green and blue areas in Gaoyou. Similarly, the number of isolated patterns, i.e., perforation, is decreasing. These findings indicate the presence of many small-isolated areas within current ecological networks, although there is a shrinking trend.

4. Discussion

4.1. Ecological Connectivity Assessment for Gaoyou City

In this section, we give an integrative assessment of ecological connectivity for Gaoyou city, in terms of its fast-developing period (1990–2016). We used MSPA to classify the urban green and blue areas within municipal boundaries as structural classes of GI depending on their size and shape. The patterns composed of bridge, branch, edge and loop are mostly link areas. Generally, link areas correspond to linear elements of the landscape, such as the rivers or linear urban green spaces including woodlots and roadside vegetation [31]. To evaluate the ecological connectivity in Gaoyou, we conducted our methodology in the same parameters to avoid the biases and interventions due to the technical approach. The connected core areas are decreasing from 1990 to 2016, it is noticeable that there is a high potential of fragmentation in urban green and blue areas in Gaoyou. Similarly, the number of isolated patterns, i.e., perforation is decreasing. The findings of reductions in the fragmented patterns (perforation) indicate the presence of many small-isolated areas within current ecological networks, although there is a shrinking trend. Therefore, it provides evidence that the local initiatives in the ecological civilization play a significant role in this progress of urban ecological networking development.

4.2. Urban Expansion vs. Green Corridor Conservation

Using spatial analysis on the Urban Expansion project and the customized MSPA method enables us to analyze the urban growth conditions in Gaoyou city whilst considering the changes of spatial patterns of urban green and blue spaces. For a fast-growing city, municipal administration should be informed regarding urban development and its sustainability. The use of ecological networks analysis on different patterns of green infrastructure presents a strategic approach [7] to support land use policies and urban planning.
As a science-based analysis, this paper outlines the land use changes of Gaoyou’s urban expansion in the last decade and its effects on local ecological networking in green and blue spaces. It could be observed that urban expansion has happened throughout the city from city center to west-southern and east-northern directions. Its expansion is not like spreading from the center, rather the splitting over in each small rural area. The urban growth model in Gaoyou city is more likely a well-connected net within several centers, compared to other studies regarding the monocentric development [46] and models [47]. It has avoided itself from the monocentre urbanization model in most of Chinese cities like Beijing, Tianjin and Shanghai, etc. It has greatly benefited from the Chinese new-type urbanization policy and the great initiative of Chinese ecological civilization. There is evidence (Figure 2, Figure 3, and Figure 4) that the urban expansion of Gaoyou city has kept most of its green corridors, especially in the aim of enhancing ecological connectivity. The roadside vegetation and street trees are connected between two centers. The substantial growth in green bridges from 1990 to 2000, mostly in the west-south of the city center, should be acknowledged as contributions in biodiversity and multiple ecosystem services such as recreational services for citizens and provision services for the habitats of local species. On the contrary, the east part of Gaoyou city ought to be given special attention on its fragmentations of green spaces resulting from the land take of suburban development. The drivers of fast fragmentation in green spaces include the constructions of several local factories and increasing demand of residential areas as well as the fast-built settlements and commercial buildings. As shown in Figure 2, Figure 3, and Figure 4, due to the economic-dominant drivers, this kind of fragmentation in green spaces is mostly surrounded by the town centers such as the center in the southwestern and in the middle of Gaoyou city center.

4.3. The Relationships between the Ecological Connectivity and Urban Expansion in Gaoyou

A growing bunch of studies have addressed the fact that the added value of green networks and green corridors [11,31,48,49,50] are much better than those of the sum of the green spaces individually. Ecological networks recognized in this study, such as bridges, branches and loops that fully comprise green and blue spaces, can provide connectivity of natural fauna and flora and/or serve as a controlled buffer or lines in urban expansion [11]. The findings on the different levels of ecological connectivity in the west-southern and east-northern parts of Gaoyou city in Section 3 have highlighted the significances of green corridors in controlling rapid urban expansion. They have proved to be better affected by and contributed to in the ecological connectivity than the individual green spaces and thus may enhance biodiversity through conserving the linkages between different ecosystems. As shown in Section 3.2, the green corridors in the west-southern part of the city have connected three sub-urban built-up centers and to some extent prevent the whole urban green spaces from being overly paved. It provides substantial opportunities for the local species and also protects this urbanized town from uncontrolled sprawl. The significant role of green corridors in urban expansion has been identified and hence should be highly recommended in the spatial planning and land use policies for the similar towns in China. As for the green corridors between two city centers ought to be protected and expanded further to enhance the ecological connectivity of these regions. As for their substantive contributions to the biodiversity and ecosystem services such as regulating urban heat climate and water flooding, providing recreational and cultural services for urban inhabitants, more in-depth studies are needed to include the questionnaires and experience knowledge of local users or the local wild plant and animal species. This kind of study may enrich the investigations of multiple functions of green corridors, but it is beyond the research focus of this paper.
This paper deploys a transferable methodology to evaluate the ecological corridors at city level, which can be further enhanced by being applied to other urban settings. We give suggestions regarding ecological corridors in the east of Gaoyou city based on the evidence extracted at a 30 m spatial resolution; however, the physical continuity of respective ecological corridors and their actual uses can be hardly underscored in this paper due to the lack of very-high-resolution (VHR) scale datasets in our exemplification. This drawback can be compensated by using higher-quality spatial datasets (e.g., VHR images) and correlate with the inputs from other stakeholders in the upcoming studies, but it is beyond the central scope of this paper. It has, to some extent, limited our discussion in concrete optimization solutions, for which further research in the aim of practical tools and detailed strategies will be promising and worth investigating in future studies.

5. Conclusions

Environmental planning and land use policies must be evidence and science based [51]. Conclusively, we give recommendations to city managers for enhancing and conserving green corridors and ecological networks such as reserving networks in the east of the example city, under the guidance of our spatial pattern analysis. The methodology deployed in this paper ultimately presents the way to analyze urban green corridors and address the issue of ecological connectivity for the sustainability of urban development. From this point of view, the study findings should be considered in the selection or creation of future land use planning and regarded as a potential tool of urban greening monitoring and evaluation. It may serve as a novel tool of the Masterplan of Gaoyou city, especially in the thematic mapping for ecological networks. The methodology used in this paper can benefit for fast growing cities not only in China but also those rapid urbanization towns and growing cities in other Asian countries. The findings proposed in this study could help, on the one hand, to map existing green infrastructure on a city scale, and, on the other hand, to provide relevant spatial-explicit information to support decision making in land use and spatial planning processes.

Author Contributions

Conceptualization, Z.P. and H.W.; methodology, H.W.; software, H.W.; validation, H.W.; formal analysis, H.W.; investigation, H.W.; resources, H.W.; data curation, H.W.; writing—original draft preparation, H.W.; writing—review and editing, Z.P. and H.W.; visualization, H.W.; supervision, H.W.; project administration, H.W. All authors have read and agreed to the published version of the manuscript.

Funding

This research received no external funding.

Acknowledgments

This article is part of the project “National soil Survey—Collection of land use survey information for key industry enterprises” (2010–2020). It is being conducted by the China University of mining and technology. School of environment and mapping. The first author would like to express her gratitude for the research support from the entire working group and the anonymous reviewers for their constructive suggestions for paper revision.

Conflicts of Interest

The authors declare no conflict of interest.

References

  1. Shoyama, K.; Kamiyama, C.; Morimoto, J.; Ooba, M.; Okuro, T. A review of modeling approaches for ecosystem services assessment in the Asian region. Ecosyst. Serv. 2017, 26, 316–328. [Google Scholar] [CrossRef]
  2. Breuste, J.; Niemelä, J.; Snep, R.P.H. Applying landscape ecological principles in urban environments. Landsc. Ecol. 2008, 23, 1139–1142. [Google Scholar] [CrossRef]
  3. Badiu, D.; Iojă, I.-C.; Pătroescu, M.; Breuste, J.; Artmann, M.; Niță, M.R.; Grădinaru, S.R.; Hossu, C.A.; Onose, D.A. Is urban green space per capita a valuable target to achieve cities’ sustainability goals? Romania as a case study. Ecol. Indic. 2016, 70, 53–66. [Google Scholar] [CrossRef]
  4. Haase, D.; Larondelle, N.; Andersson, E.; Artmann, M.; Borgström, S.; Breuste, J.; Gomez-Baggethun, E.; Gren, Å.; Hamstead, Z.; Hansen, R. A quantitative review of urban ecosystem service assessments: Concepts, models, and implementation. Ambio 2014, 43, 413–433. [Google Scholar] [CrossRef] [Green Version]
  5. McPhearson, T.; Pickett, S.T.A.; Grimm, N.B.; Niemelä, J.; Alberti, M.; Elmqvist, T.; Weber, C.; Haase, D.; Breuste, J.; Qureshi, S. Advancing Urban Ecology toward a Science of Cities. Bioscience 2016, 66, 198–212. [Google Scholar] [CrossRef] [Green Version]
  6. Angelstam, P.; Andersson, K.; Annerstedt, M.; Axelsson, R.; Elbakidze, M.; Garrido, P.; Grahn, P.; Jönsson, K.I.; Pedersen, S.; Schlyter, P.; et al. Solving Problems in Social–Ecological Systems: Definition, Practice and Barriers of Transdisciplinary Research. Ambio 2013, 42, 254–265. [Google Scholar] [CrossRef] [Green Version]
  7. Wang, J.; Pauleit, S.; Banzhaf, E. An Integrated Indicator Framework for the Assessment of Multifunctional Green Infrastructure—Exemplified in a European City. Remote Sens. 2019, 11, 1869. [Google Scholar] [CrossRef] [Green Version]
  8. Gonzalez, O.M.R. The green areas of San Juan, Puerto Rico. Ecol. Soc. 2014, 19. [Google Scholar] [CrossRef] [Green Version]
  9. Ziter, C. The biodiversity-ecosystem service relationship in urban areas: A quantitative review. Oikos 2016, 125, 761–768. [Google Scholar] [CrossRef]
  10. Firehock, K. A Short History of the Term Green Infrastructure and Selected Literature. 2010. Available online: http://www.gicinc.org/PDFs/GI%20History.pdf (accessed on 21 December 2020).
  11. Ferrari, B.; Quatrini, V.; Barbati, A.; Corona, P.; Masini, E.; Russo, D. Conservation and enhancement of the green infrastructure as a nature-based solution for Rome’s sustainable development. Urban Ecosyst. 2019, 22, 865–878. [Google Scholar] [CrossRef]
  12. European Environment Agency (EEA). Green Infrastructure and Territorial Cohesion. The Concept of Green Infrastructure and Its Integration into Policies Using Monitoring Systems; Technical Report 18; European Environment Agency: Copenhagen, Danmark, 2011; Available online: http://www.eea.europa.eu/publications/green-infrastructure-and-territorial-cohesion (accessed on 19 October 2019).
  13. European Commission. Green infrastructure (GI)—Enhancing Europe’s Natural Capital; European Commission: Brussels, Belgium, 2013. [Google Scholar]
  14. European Commission (EC). The Multifunctionality of Green Infrastructure. Science for Environment Policy In Depth Reports. , March 2012. Available online: https://ec.europa.eu/environment/nature/ecosystems/docs/Green_Infrastructure.pdf (accessed on 21 December 2020).
  15. Naumann, S.; Anzaldua, G.; Gerdes, H.; Frelih-Larsen, A.; Davis, M.; Berry, P.; Burch, S.; Eci, M.S. Assessment of the potential of ecosystem-based approaches to climate change adaptation and mitigation in Europe. In Final Report to the European Commission; DG Environment: 2011. Contract no. 070307/2010/580412/SER/B2; Ecologic Institute and Environmental Change Institute, Oxford University Centre for the Environment: Oxford, UK, 2011. [Google Scholar]
  16. Tzoulas, K.; Korpela, K.; Venn, S.; Yli-Pelkonen, V.; Kaźmierczak, A.; Niemelä, J.; James, P. Promoting ecosystem and human health in urban areas using Green Infrastructure: A literature review. Landsc. Urban Plan. 2007, 81, 167–178. [Google Scholar] [CrossRef] [Green Version]
  17. Kuttner, M.; Hainz-Renetzeder, C.; Hermann, A.; Wrbka, T. Borders without barriers—Structural functionality and green infrastructure in the Austrian-Hungarian transboundary region of Lake Neusiedl. Ecol. Indic. 2013, 31, 59–72. [Google Scholar] [CrossRef]
  18. Weber, T.; Sloan, A.; Wolf, J. Maryland’s Green Infrastructure Assessment: Development of a comprehensive approach to land conservation. Landsc. Urban Plan 2006, 77, 94–110. [Google Scholar] [CrossRef]
  19. Weber, T.; Wolf, J. Maryland’s Green Infrastructure—Using landscape assessment tools to identify a regional conservation strategy. Environ. Monit. Assess. 2000, 63, 265–277. [Google Scholar] [CrossRef]
  20. Weber, T.C.; Blank, P.J.; Sloan, A. Field validation of a conservation network on the Eastern Shore of Maryland, USA, using breeding birds as bio-indicators. Environ. Manag. 2008, 41, 538–550. [Google Scholar] [CrossRef]
  21. Li, F.; Wang, R.; Paulussen, J.; Liu, X. Comprehensive concept planning of urban greening based on ecological principles: A case study in Beijing, China. Landsc. Urban Plan. 2005, 72, 325–336. [Google Scholar] [CrossRef]
  22. Chang, Q.; Li, S.; Wang, Y.; Wu, J.; Xie, M. Spatial process of green infrastructure changes associated with rapid urbanization in Shenzhen, China. Chin. Geogr. Sci. 2013, 23, 113–128. [Google Scholar] [CrossRef]
  23. Mallegowda, P.; Rengaian, G.; Krishnan, J.; Niphadkar, M. Assessing Habitat Quality of Forest-Corridors through NDVI Analysis in Dry Tropical Forests of South India: Implications for Conservation. Remote Sens. 2015, 7, 1619–1639. [Google Scholar] [CrossRef] [Green Version]
  24. Lakerveld, R.P.; Lele, S.; Crane, T.; Fortuin, K.; Springate-Baginski, O. The social distribution of provisioning forest ecosystem services: Evidence and insights from Odisha, India. Ecosyst. Serv. 2015, 14, 56–66. [Google Scholar] [CrossRef] [Green Version]
  25. Linard, C.; Tatem, A.J.; Gilbert, M. Modelling spatial patterns of urban growth in Africa. Appl. Geogr. 2013, 44, 23–32. [Google Scholar] [CrossRef]
  26. Patel, S.; Giordano, T. Environmental assessments for the greening of public infrastructure in South Africa. Dev. S. Afr. 2014, 31, 721–743. [Google Scholar] [CrossRef]
  27. Van Assche, K. Green infrastructure for sustainable urban development in Africa. Plan. Perspect. 2013, 28, 321–323. [Google Scholar] [CrossRef]
  28. Schewenius, M.; McPhearson, T.; Elmqvist, T. Opportunities for Increasing Resilience and Sustainability of Urban Social–Ecological Systems: Insights from the URBES and the Cities and Biodiversity Outlook Projects. Ambio 2014, 43, 434–444. [Google Scholar] [CrossRef] [PubMed] [Green Version]
  29. Xie, G.; Zhang, C.; Zhen, L.; Zhang, L. Dynamic changes in the value of China’s ecosystem services. Ecosyst. Serv. 2017, 26, 146–154. [Google Scholar] [CrossRef]
  30. Wei, Y.D.; Li, W. Reforms, Globalization, and Urban Growth in China: The Case of Hangzhou. Eurasian Geogr. Econ. 2002, 43, 459–475. [Google Scholar] [CrossRef]
  31. Patru-Stupariu, I.; Angelstam, P.; Elbakidze, M.; Huzui, A.; Andersson, K. Using forest history and spatial patterns to identify potential high conservation value forests in Romania. Biodivers. Conserv. 2013, 22, 2023–2039. [Google Scholar] [CrossRef]
  32. Han, B.; Liu, H.; Wang, R. Urban ecological security assessment for cities in the Beijing–Tianjin–Hebei metropolitan region based on fuzzy and entropy methods. Ecol. Model. 2015, 318, 217–225. [Google Scholar] [CrossRef]
  33. Nassauer, J.I.; Raskin, J. Urban vacancy and land use legacies: A frontier for urban ecological research, design, and planning. Landsc. Urban Plan. 2014, 125, 245–253. [Google Scholar] [CrossRef]
  34. Wang, J.; Li, W. Urban ecological zone based on ecological security: A case study of ecologcial belt in northwest Hangzhou. City Plan. Rev. 2009, 3, 25–31. [Google Scholar]
  35. Zhang, X.; Hes, D.; Wu, Y.; Hafkamp, W.; Lu, W.; Bayulken, B.; Schnitzer, H.; Li, F. Catalyzing sustainable urban transformations towards smarter, healthier cities through urban ecological infrastructure, regenerative development, eco towns and regional prosperity. J. Clean. Prod. 2016, 122, 2–4. [Google Scholar] [CrossRef] [Green Version]
  36. Hawken, S.; Metternicht, G.; Chang, C.; Liew, S.; Gupta, A. Remote sensing of urban ecological infrastructure in Desakota environments: A review of current approaches. In Proceedings of the 35th Asian Conference on Remote Sensing (ACRS 2014), Nay Pyi Taw, Myanmar, 27–31 October 2014. [Google Scholar]
  37. Senetra, A.; Krzywnicka, I.; Mielke, M. An analysis of the spatial distribution, influence and quality of urban green space—A case study of the Polish city of Tczew. Bull. Geogr. Socio-Econ. Ser. 2018, 42, 129–149. [Google Scholar] [CrossRef] [Green Version]
  38. Moreira, T.C.; Polizel, J.L.; Santos, I.d.S.; Bensenor, I.; Lotufo, P.A.; Mauad, T. Green Spaces, Land Cover, Street Trees and Hypertension in the Megacity of São Paulo. Int. J. Environ. Res. Public Health 2020, 17, 725. [Google Scholar] [CrossRef] [PubMed] [Green Version]
  39. Angel, S.; Blei, A.M.; Parent, J.; Lamson-Hall, P.; Galarza-Sanchez, N.; Civco, D.L.; Thom, K. Atlas of Urban Expansion—2016 Edition; Areas and Densities: Cambridge, MA, USA, 2016. [Google Scholar]
  40. Angel, S.; Blei, A.M.; Civco, D.L.; Parent, J. Atlas of Urban Expansion; Lincoln Institute of Land Policy: Cambridge, MA, USA, 2012. [Google Scholar]
  41. Vogt, P.; Ferrari, J.R.; Lookingbill, T.R.; Gardner, R.H.; Riitters, K.H.; Ostapowicz, K. Mapping functional connectivity. Ecol. Indic. 2009, 9, 64–71. [Google Scholar] [CrossRef]
  42. Vogt, P.; Riitters, K. GuidosToolbox: Universal digital image object analysis. Eur. J. Remote Sens. 2017, 50, 352–361. [Google Scholar] [CrossRef]
  43. Vogt, P.; Riitters, K.H.; Iwanowski, M.; Estreguil, C.; Kozak, J.; Soille, P. Mapping landscape corridors. Ecol. Indic. 2007, 7, 481–488. [Google Scholar] [CrossRef]
  44. Vogt, P.; Riitters, K.H.; Estreguil, C.; Kozak, J.; Wade, T.G.; Wickham, J.D. Mapping Spatial Patterns with Morphological Image Processing. Landsc. Ecol. 2006, 22, 171–177. [Google Scholar] [CrossRef]
  45. Wickham, J.D.; Riitters, K.H.; Wade, T.G.; Vogt, P. A national assessment of green infrastructure and change for the conterminous United States using morphological image processing. Landsc. Urban Plan. 2010, 94, 186–195. [Google Scholar] [CrossRef]
  46. Mills, D.E. Growth, speculation and sprawl in a monocentric city. J. Urban Econ. 1981, 10, 201–226. [Google Scholar] [CrossRef]
  47. Kraus, M. Monocentric Cities. Companion Urban Econ. 2007, 3, 97–108. [Google Scholar] [CrossRef]
  48. Barredo, J.I.; Caudullo, G.; Dosio, A. Mediterranean habitat loss under future climate conditions: Assessing impacts on the Natura 2000 protected area network. Appl. Geogr. 2016, 75, 83–92. [Google Scholar] [CrossRef]
  49. Meerow, S.; Newell, J.P. Spatial planning for multifunctional green infrastructure: Growing resilience in Detroit. Landsc. Urban Plan. 2017, 159, 62–75. [Google Scholar] [CrossRef]
  50. Snäll, T.; Lehtomäki, J.; Arponen, A.; Elith, J.; Moilanen, A. Green Infrastructure Design Based on Spatial Conservation Prioritization and Modeling of Biodiversity Features and Ecosystem Services. Environ. Manag. 2016, 57, 251–256. [Google Scholar] [CrossRef] [PubMed] [Green Version]
  51. Hong, S.-K.; Song, I.-J.; Byun, B.; Yoo, S.; Nakagoshi, N. Applications of biotope mapping for spatial environmental planning and policy: Case studies in urban ecosystems in Korea. Landsc. Ecol. Eng. 2005, 1, 101–112. [Google Scholar] [CrossRef]
Figure 1. Location of Gaoyou city, in Jiangsu province. Coverage of green areas as well as its rich resources in developing tourism.
Forests 11 01374 g001
Figure 2. Morphological spatial patterns of green infrastructure in Gaoyou, 1990.
Forests 11 01374 g002
Figure 3. Morphological spatial patterns of green infrastructure in Gaoyou, 2000.
Forests 11 01374 g003
Figure 4. Morphological spatial patterns of green infrastructure in Gaoyou, 2016.
Forests 11 01374 g004
Figure 5. Comparison spatial patterns of green infrastructure for 1990, 2000 and 2016 in Gaoyou city.
Forests 11 01374 g005
Table 1. Transformation of Land Use and Land Cover (LULC) types from the Atlas of Urban Expansion into two groups, i.e., fore/background input data for morphological spatial pattern analysis (MSPA).
LULC ClassesDefinitionsGI ElementsInput Classes for MSPA
Urban built upPixels, where the majority (>50%) of pixels within the Walking Distance Circle (1 km2) are built upNoneBackground
Suburban built upPixels, where 25–50% of pixels within the Walking Distance Circle (1 km2) are built-upNoneBackground
Rural built upPixels, where <25% of pixels within the Walking Distance Circle (1 km2) are built-up.NoneBackground
Urbanized open landall open space pixels within 100 m of urban and suburban built-up pixelsForests, agricultural crops, fallow agricultural fields, wetlands, grass lands, desert lands, parks, etc.Foreground
Captured open landopen space pixels, clusters of open space pixels that completely surrounded by fringe open space pixels less than 200 hectares in areaForests, agricultural crops, fallow agricultural fields, wetlands, grass lands, etc.Foreground
Rural open landall open space pixels that were neither fringe nor capturedAgricultural lands, grasslands, rivers and other open spaces in the rural areas.Foreground
WaterAll Landsat pixels that were comprised of surface waterSurface water include oceans, lakes, ponds, reservoirs, rivers, streams, canals, pools, and flooded, wetlands, etc.Foreground
Publisher’s Note: MDPI stays neutral with regard to jurisdictional claims in published maps and institutional affiliations.

