1. Introduction
Forests are a crucial part of the solution to addressing the global climate crisis both because of their natural ability to absorb carbon dioxide (CO
2) from the atmosphere, and because of the contribution of CO
2 emissions from deforestation and forest degradation to global emissions [
1,
2].
One strategy for decreasing CO
2 emissions is to provide developing countries with results-based financial incentives to reduce emissions from deforestation and forest degradation, and to enhance removals (carbon sequestration) through afforestation, reforestation, or forest growth. This strategy was initially implemented as a market-based mechanism in the early 1990s at the project level (i.e., area in the order of thousands of hectares, and boundaries aligned to specific interventions, such as protected areas). Through such projects emissions would be reduced, and removal of CO
2 from forests enhanced, through the implementation of various mitigation measures; these emission reductions (ERs) could then be sold in the form of carbon credits to buyers who would use them to compensate for their emissions. Project-level initiatives under the voluntary market soon led to the adoption of this strategy under the United Nations Framework Convention on Climate Change (UNFCCC), and it was called REDD+ (Reducing Emissions from Deforestation and Forest Degradation, conservation, sustainable management of forests, and enhancement of forest carbon stocks) [
3]. This strategy focuses on results-based payments that are given to countries without requiring transfer of the title to emission reductions (that is, it is not a market-based mechanism), and it brought the focus from the project level to the national or subnational (jurisdictional) levels, i.e., jurisdictional REDD+ (i.e., areas in the order of millions of hectares and boundaries aligned to specific political boundaries such as nations, states, or regions). This resulted in the implementation of several bilateral or multilateral programs that sought to pilot REDD+ non-market-mechanisms (such as REDD Early Movers, and various bilateral agreements) and market-based mechanisms of jurisdictional REDD+ (for example, the Forest Carbon Partnership Facility).
These REDD+ mechanisms are currently recognized under Article 5 of the Paris Agreement as one of the tools that can be used to enable countries to achieve their nationally determined contributions [
4]. Although REDD+ market-based mechanisms are not explicitly mentioned under Article 6, it is expected that carbon credits from jurisdictional REDD+ could be transacted under Article 6.2, which covers trading among countries; but it is likely that it will not be part of the project-level mechanism (Sustainable Development Mechanism) which was decided under Article 6.4. Moreover, both jurisdictional and non-jurisdictional REDD+ credits could be transacted in other compliance or voluntary markets, but the link to the Paris Agreement is yet to be defined.
One of the potential markets is the International Civil Aviation Organization’s (ICAO) Carbon Offsetting and Reduction Scheme for International Aviation (CORSIA), which is designed to help the aviation industry reach its “aspirational goal” of making all growth in international flights after 2020 “carbon neutral” through compensation with carbon credits among other things. CORSIA opened applications for various standards and GHG programs to become “CORSIA-eligible” and generate carbon credits that can be used under CORSIA for the 2021–2023 compliance cycle. The assessment of the first two rounds of applications occurred in 2019, and 2020 concluded with the approval of two GHG programs that generate ERs from REDD programs, and the conditional approval of one more [
5,
6]. Yet the process was plagued by concerns from various stakeholders regarding environmental integrity in connection with issues of permanence, leakage, additionality, and baselines.
The process of application under CORSIA, and the acceptance of forest carbon credits generated debate and controversy [
7]. Chagas et al. concluded that the permanence of forest carbon credits remains the main challenge for their eligibility [
8]. They also provided a detailed analysis of how various standards that accept forest carbon credits do address issues such as additionality, baseline setting, permanence, and uncertainty, and concluded that forest carbon credits, under certain circumstances, may be included in carbon markets, including CORSIA [
9]. The World Wildlife Fund also recently discussed the quality of carbon credits and provided the main criteria for determining a high-quality credit, including covering aspects of baseline setting, additionality, and uncertainty [
10]. All these analyses concur with the need to address the issue of permanence, and indicate that the baseline establishment and uncertainty of carbon credits can be problematic; yet they are based on what is accepted under existing standards without questioning their requirements.
The objective of the current analysis is to discuss the environmental integrity of emission reductions (ERs) sourced from REDD programs, (i.e., a set of policies, measures and frameworks that enables the reduction in emissions from deforestation and forest degradation, their accounting and crediting at jurisdictional level such as a nation, state or region) and to compare these with greenfield on-grid renewable energy projects (i.e., a set of measures that enables the reduction in emissions by replacing electricity generated with fossil fuels with electricity generated with renewable sources such as wind or hydro), namely wind and hydro power projects, which are considered by markets as the gold standard in terms of environmental integrity. This analysis concentrates exclusively on REDD programs and does not include in the discussion project-level REDD or activities that enhance removals of atmospheric CO2 such as afforestation, reforestation, or enhancement of forest growth (the ‘+’ of REDD+); it only focuses on the ER from deforestation and forest degradation generated by REDD programs.
2. Analysis
2.1. Crediting Approaches in Jurisdictional REDD and in Renewable Energy Projects Compared
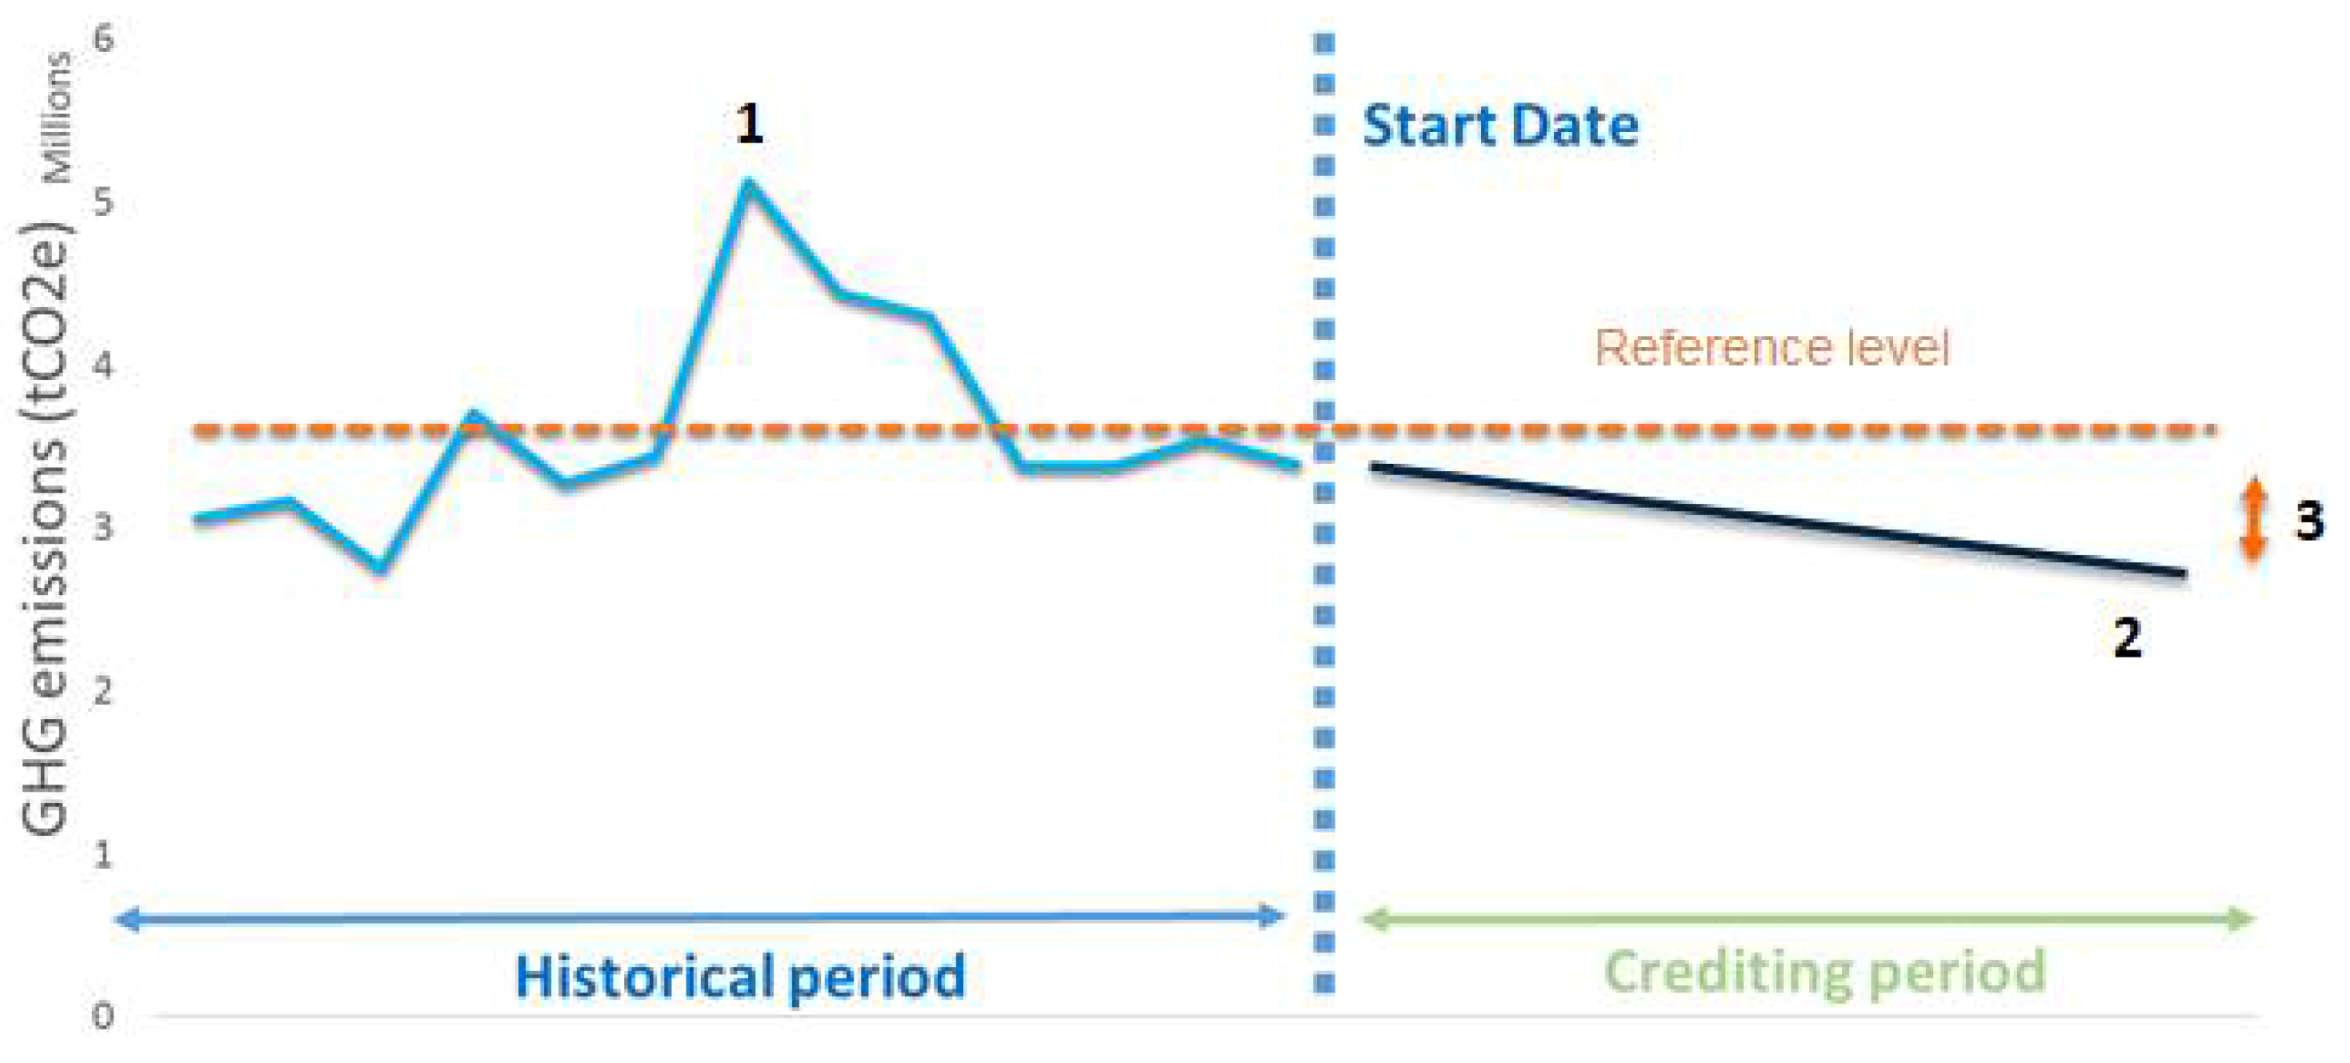
The overall approach for crediting REDD programs consists of deducting the baseline emissions (in tons of CO
2 equivalent, or tCO
2e) from the monitored emissions in the program scenario to arrive at the performance level (see
Figure 1). The baseline is supposed to reflect the emissions that would have occurred in a “business as usual” scenario; it is based on historical data, in many cases represented as the average historical emissions during a specific reference period [
11,
12]. The reference period must be close to the beginning of the crediting period in order to ensure that it is representative of the crediting period, and it usually covers a period of between 5 and 15 years [
11,
12]. In REDD programs, emissions in the baseline and program scenarios are estimated for the whole REDD program area for the carbon pools and gases defined within the scope by the REDD program proponent, in accordance with the requirements of the standard being used. The emissions for both periods are estimated by a combination of activity data (for example, in hectares per year) and emission factors (tCO
2e per hectare). The activity data is estimated using remote sensing methods that detect changes in forest cover or, when forest degradation is considered, by proxies (for example, logging intensities ([
1,
13,
14]); whereas the emission factors are based mostly on terrestrial inventories in the region of interest [
11].
In the case of renewable energy projects, ERs are credited by assuming that the project activity will displace CO
2 emissions from electricity generated by fossil-fuel powered plants. In this context, displacement occurs when the electricity supplied by renewable energy sources replaces the generation of equivalent electricity by existing fossil-fuel power plants [
15]. Electricity (MWh) is supplied to a specific electricity grid that is fed by a mixture of sources of electricity, including both renewable (hydro, wind), and nonrenewable (nuclear, fossil fuel-based) sources. This mixture of sources has on average an emission intensity that is expressed as an emission factor [
16]. Emission factors are estimated through a combined margin approach [
16], as the weighted average of an operating margin (i.e., emission factor of current operations; represents the sources that will be displaced in the near-term effect of the renewable energy project), and a build margin (i.e., emission factor considering future additions to the grid; represents the sources that will be displaced in the long-term by the renewable energy project) [
17]. The
operating margin can be calculated in various ways, but the most common method, used, for instance, in Chinese projects, is based on three parameters:
net electricity supplied to the grid by all power plants serving the system (not including low-cost/must-run power plants/units, which will not be displaced by the renewable energy plant);
the fuel consumption of each plant; and its
conversion to emissions, using net calorific values and emission factors provided generally by the Intergovernmental Panel on Climate Change (IPCC) Guidance and Guidelines [
17]. The
build margin is estimated using inputs similar to those used for the operating margin, but only considers the set of power plants most recently added to the grid (which represents what will be added to the grid in the future). These two margins are then combined to create a weighted average where, for renewable energy projects, the former has a weight of 0.75 and the latter has a weight of 0.25, according to the Clean Development Mechanism (CDM) 2018. These emission factors are estimated based on three years of historical data, but the data can go back several years, since recent official statistics may not always be disclosed. For example, some renewable energy projects in China that were registered under the CDM in 2017 used data going back to 2009–2011 [
18]. The emission reductions (ERs) are then calculated by multiplying the net electricity fed into the grid as a result of project implementation (MWh) by the emission factor (tCO
2/MWh).
2.2. Environmental Integrity of Emission Reductions
A carbon market-based mechanism has environmental integrity if the transfer of credits through that mechanism leads to the same, or lower aggregated global emissions [
7]. Climate benefits are not less than the amount of tons that are credited. Environmental integrity is ensured through accounting that avoids double-counting (the same unit is used twice to offset emissions)
, as well as through the quality of the ER estimates [
7]. Assuming that double-counting is addressed adequately, the main aspects to be considered, then, are:
permanence (ERs are permanent, and they cannot be reversed);
additionality (ERs are the result of real actions that would not have occurred without the mitigation measures implemented); a
reference level or baseline that reflects, conservatively, a business-as-usual scenario;
uncertainty (the quantification of ERs is both precise (meaning that random errors are reduced as far as is practical, and in accordance with the standard used), and accurate (meaning that systematic errors are avoided)); and
leakage (the displacement of emissions resulting from the implementation of mitigation measures is accounted for).
2.3. Permanence
2.3.1. Concept of Permanence
According to UNFCCC, the term reversal “is usually defined as the non-permanence of emission reductions or enhanced removals that are caused by natural or human-induced activities (climatic variations, natural disasters, or when drivers of emissions and/or reduced removals are not permanently addressed)” [
19]. Others define permanence as the longevity of carbon pools and their carbon stocks over time [
20]. If nonpermanent ERs are not canceled or replaced, then the environmental integrity of the GHG initiative is negatively affected, because gases are emitted back into the atmosphere when the mitigation action ends, or its effectiveness is reduced [
21]. The idea that forests are more vulnerable to reversals because the carbon stored there can be rereleased (even though REDD is not about storing carbon) if, for example, the forest is burnt, has caused some investors to hesitate to be involved in REDD, even though the purpose of REDD is not about storing carbon. This hesitation is due to a sense that the permanence of carbon units produced in REDD can be made vulnerable in ways that might not affect carbon units from other sectors [
22]. This has resulted in standards operating under jurisdictional REDD to assume that the ERs from REDD could also be, in some instances, nonpermanent, and that remedies should therefore be applied.
According to Federici et al., permanence is closely related to the time scale and duration of the mitigation project or program [
21]. The shorter it is, the fewer the possibilities to monitor, compensate, and ensure the reliability of reversals occurring beyond the monitoring period. Since project and program activities are generally implemented for shorter periods of time, their mitigation results may indeed be nonpermanent. Several mechanisms have been created to address the issue of the permanence of initiatives with a limited time scale (less than 100 years). The first mechanism to be proposed, under UNFCC’s Clean Development Mechanism (CDM), relied on the use of temporary credits, which resulted in a lack of fungibility with credits from other sectors, and their nonacceptance in compliance markets like the EU Emission Trading Scheme. In order to address this challenge, other mechanisms have been proposed, such as the use of “buffer reserves,” which is the approach currently used for REDD+ projects and programs under market-based mechanisms [
9]. The permanence of ERs from afforestation and reforestation activities has been questioned because carbon removed from the atmosphere in the sink could be reversed, in the same way that occurs with carbon capture and storage (see
Table 1). However, it could be argued that ERs from REDD do not have this issue because they do not involve sinks, but a reduction in GHG sources [
23].
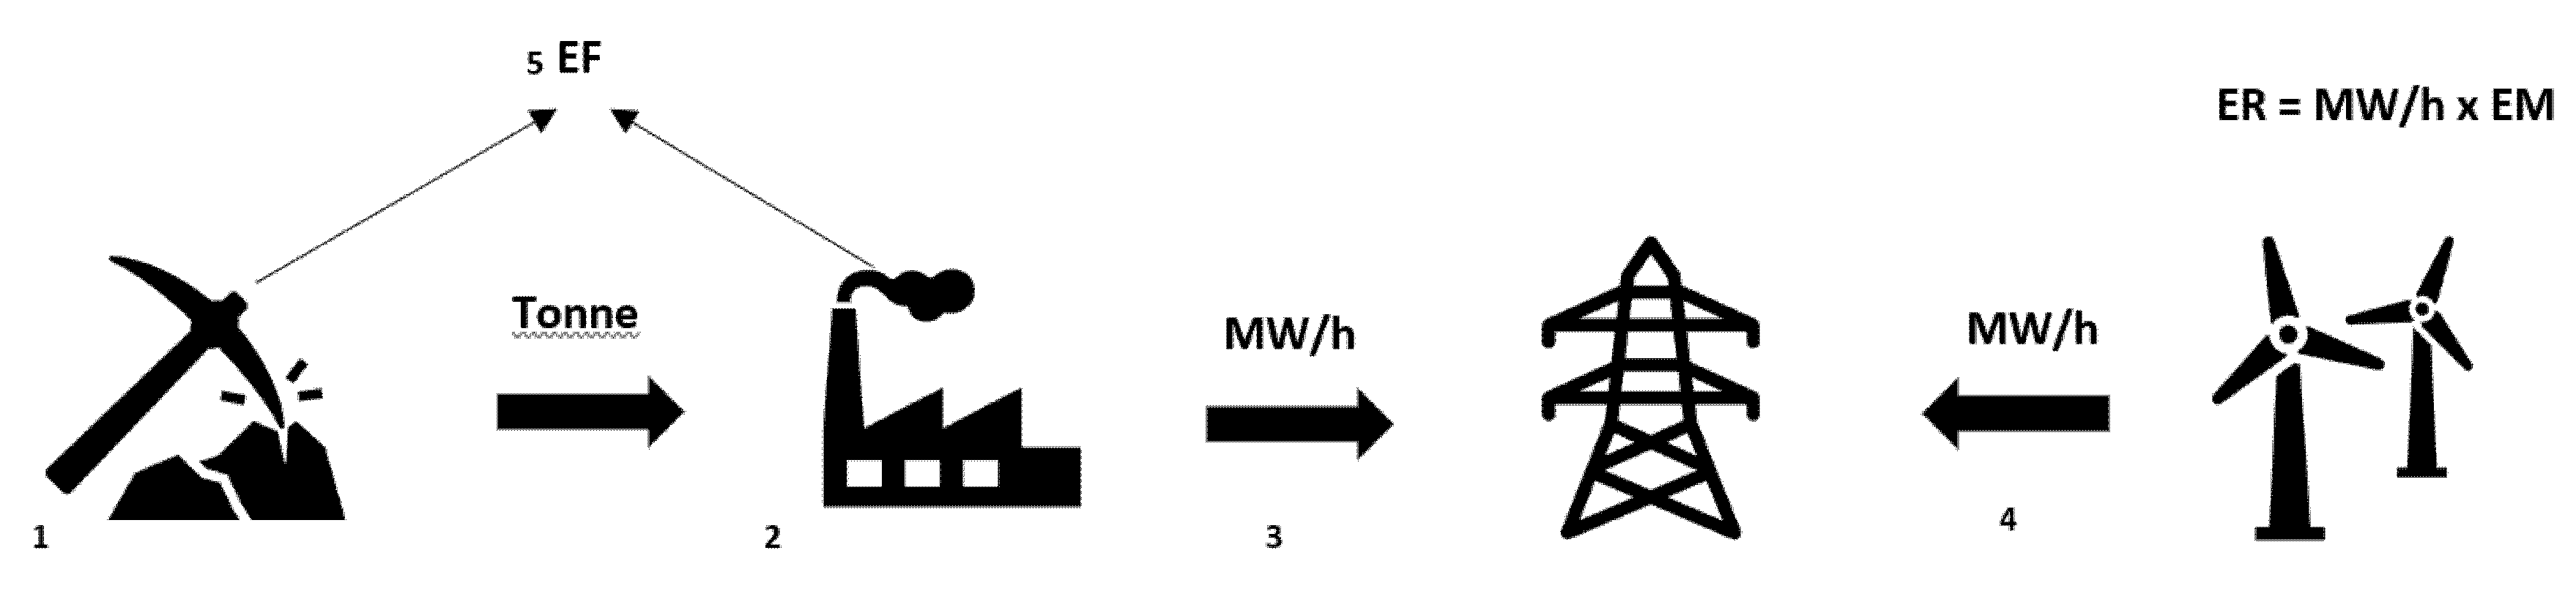
ERs from renewable energy projects are assumed to be permanent because the risk of reversals is considered to be negligible. However, if the process of ER generation from a renewable energy project is seen as a whole, including the fossil-fuel mining sites upstream and the carbon stocks (as shown in
Figure 2), it could be argued that a renewable energy project is not really different from a REDD program’s mitigation measure in terms of permanence. When the renewable energy project is in operation (for example, when the wind is blowing, and the turbines of a wind farm are operational), carbon stocks in the form of fossil fuels will remain in the ground and fewer emissions will be generated; but if the project is not in operation (for example, when the wind is not blowing or the wind farm’s turbines are not operational), carbon stocks in the form of fossil fuels will be extracted, and more emissions will be generated (
Figure 2). It could be said that projects and programs that reduce emissions, such as both renewable energy projects and REDD programs, are only delaying their release, since fossil fuels or biomass stocks will remain unused only until someone finds it convenient to use them [
21].
Nevertheless, in the case of REDD programs, the difference between emissions in the baseline and the project scenario could be negative, leading to “negative” ERs; whereas in renewable energy projects this would never occur, since the nonoperation of the renewable energy project should not make performance worse. However, if the accounting boundary from the renewable energy project is extended to the whole electricity grid it is connected to, and fossil-fuel consumption is in an upward trend (common trend in developing countries), it could be argued that the non-operation or reduced operation of a renewable energy project could result in “negative” ERs as fossil-fuels saved would be rereleased. Moreover, “negative” ERs in REDD programs could result from a variety of factors; for example, if the mitigation measures under a REDD program have been implemented, and a “negative” ER is achieved, it could simply mean that the baseline is too conservative [
22].
ERs sourced from REDD programs are to be reported with reference to discrete periods (annually or biennially), the reported ERs achieved during one such period can be considered permanent, since non-performance occurring during subsequent periods are neither dependent upon, nor directly attributable to performance during one such period in the same way that lack of performance in previous periods cannot be considered as cause for performance during one such period. The ERs reported should be bound to the specific timeframe for which they were assessed. Once these are accounted for, it can be argued that they are permanent, since no overlap or correlation can occur, or can be proven with those of a subsequent period [
2,
21]. Yet this circumstance is overlooked or misrepresented by the current standards, which impose buffer accounts on REDD implementers. One way around this problem could be shifting from partial (covering few years) to accumulated performance assessment, done at the end of the crediting period.
2.3.2. Natural Disturbances as a Source of Reversals
One of the primary sources of reversals identified under REDD programs is the risk of natural disturbances that could affect carbon stocks and reverse emission reductions. According to the Kyoto Protocol, natural disturbances that can affect REDD programs are nonanthropogenic events that can cause significant emissions, and that are beyond the control of the REDD program proponent. These include forest fires, pest and plant diseases, extreme weather (floods, wind storms, frost), ocean acidification, and geological events [
24].
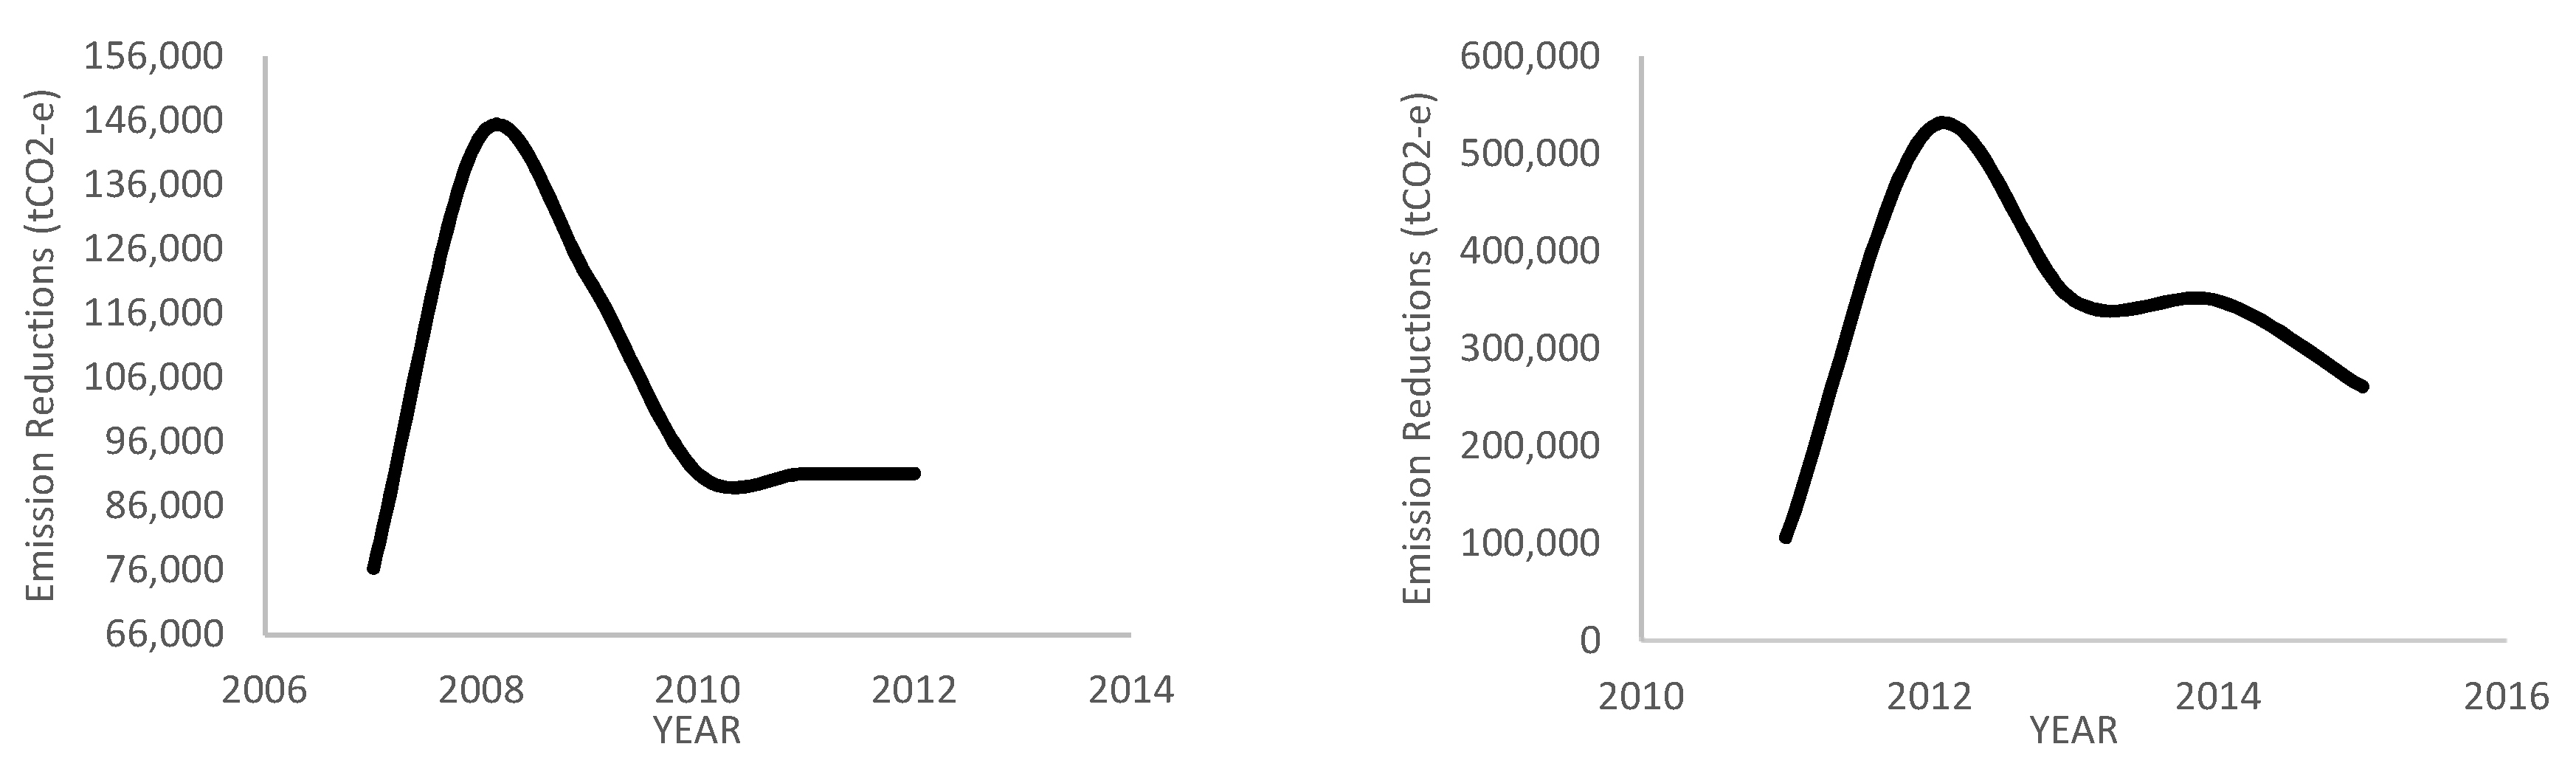
However, it is important to note that ERs in renewable energy projects could also suffer the impact of natural disturbances that would reduce their effectiveness and/or cause reversals in their mitigation measures. For example, the effectiveness of wind projects in China was considerably impacted because of unexpected fluctuations in wind speed from 2013 to 2015 [
22,
25]. The same impact was seen in a project in Morocco [
26], where from 2010 to 2012 a renewable energy project had to have technical modifications, which caused a reduction in its effectiveness. In both instances, the reduced effectiveness of the projects required energy outputs to be compensated for by the use of fossil fuels (
Figure 3).
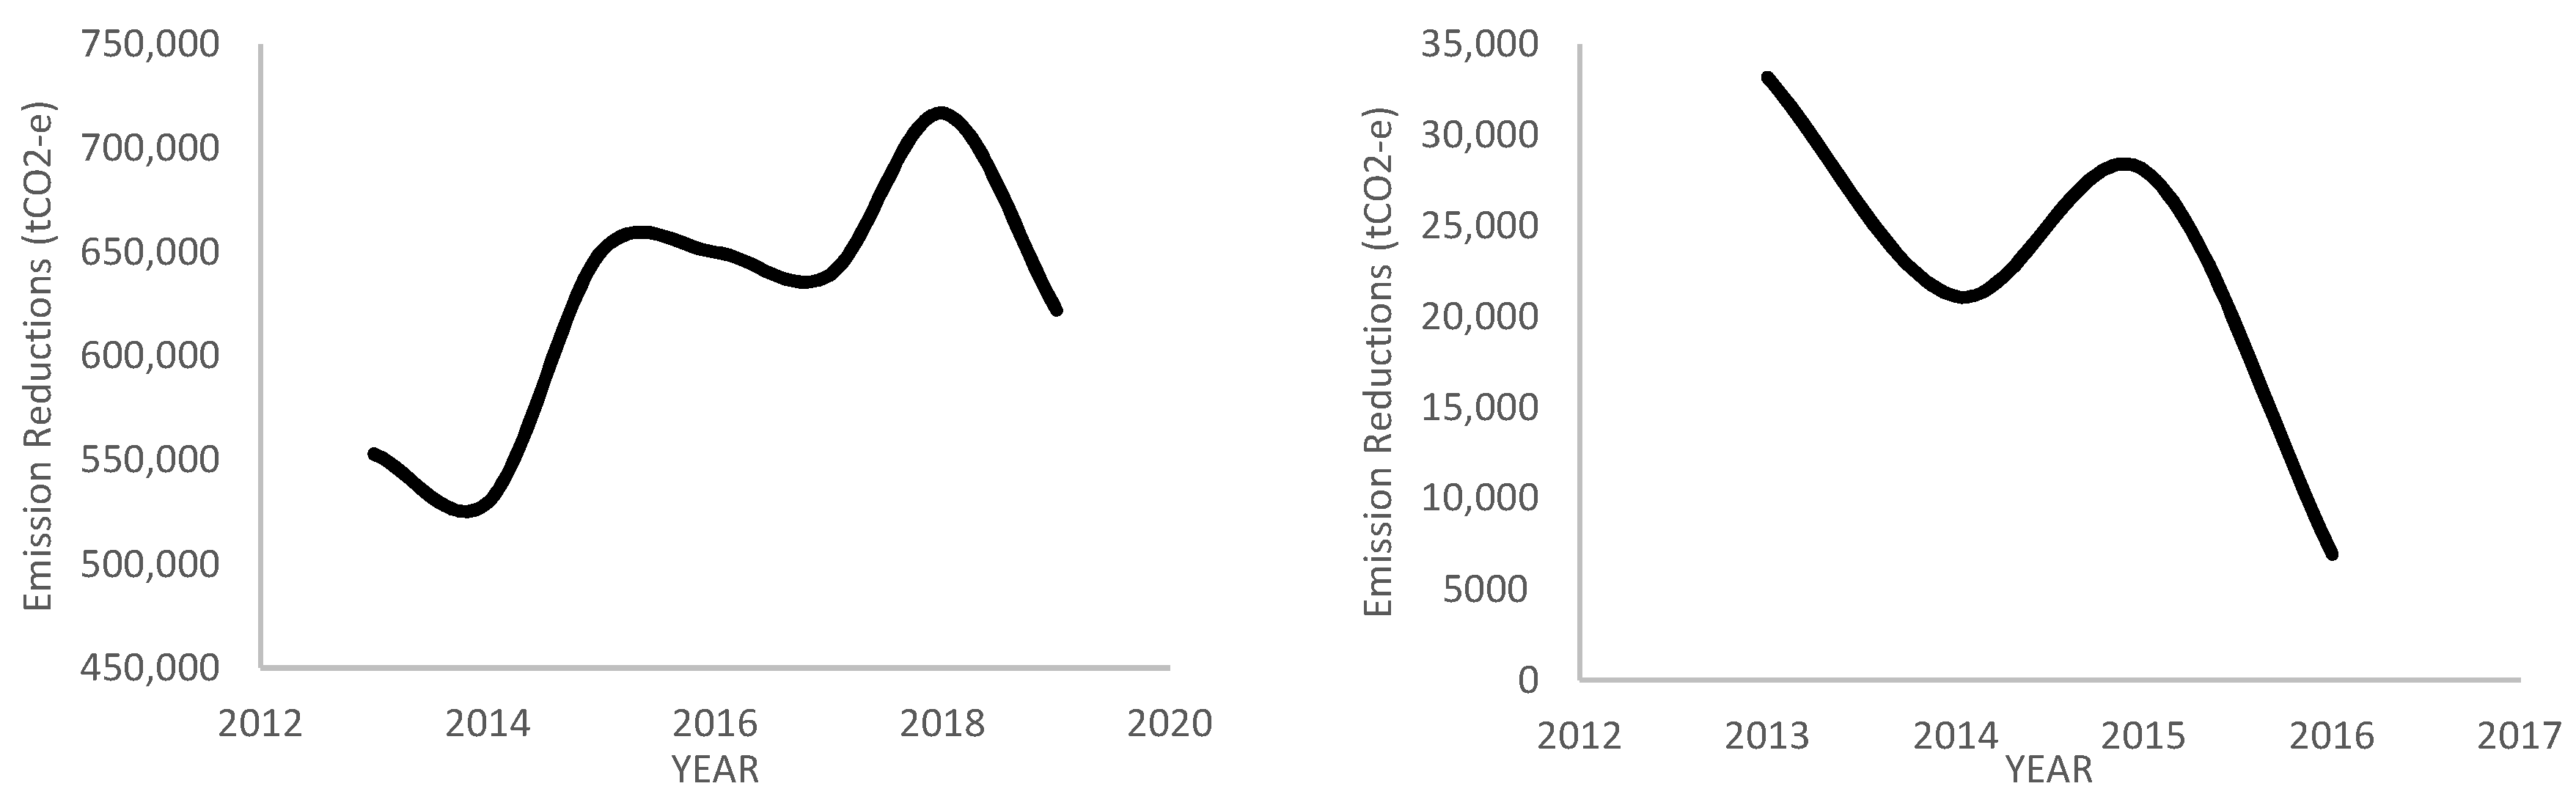
Hydropower projects are also very vulnerable to the variability of climatic conditions such as droughts, which can significantly reduce their efficiency, especially when seasonal drought events are extended due to the impacts of climate change, as shown in examples studied in Myanmar [
27] and Fiji [
28] (
Figure 4).
Moving from the project level to the subnational or national level, similar examples of reversals have been found in the electricity sector. Herrera-Estrada et al. found that climatic conditions such as droughts could increase GHG emissions in the United States as a result of an increase in the emissions from gas and coal power plants [
29]. In practice, this would mean that the capacity to keep fossil fuels underground could be reversed as a result of natural disturbances, in the same way it can happen under REDD.
Another aspect to consider is that the losses in forests due to natural disturbances can be reversed through natural regeneration, since forests quite naturally store carbon stocks toward a long-term average level at equilibrium, despite natural disturbances [
21]. This highlights the need for understanding the time frames and dimensions of natural forest dynamics, and tailoring accounting frameworks accordingly, so that these variabilities do not confuse the accounting (which certainly happens with annual/biennial accounting). Although natural disturbances could have a permanent impact on renewable energy projects and other sectors, forests are unique in their capacity to recover from disturbances in the long term. Based on this fact, some have argued for using similar time frames as those that are used for the climate normal: an average moving window of 30 years.
2.4. Additionality
Additionality refers to the requirement that ERs would not have happened in the absence of the proposed mitigation measures. It is a critical principle in market-based mechanisms, and as such it needs to be demonstrated or agreed upon with reference to the main standards.
Additionality in REDD programs relies on defining baselines that set a benchmark that represents a business-as-usual scenario, so that any emissions below that benchmark that result from the mitigation actions are to be considered as additional. As is explained in the next section, the use of conservative baselines attempts to ensure that the ERs from REDD programs are additional and real, and that they have an actual effect on the atmosphere.
The additionality of a renewable energy project is assessed through the use of additionality-demonstration tools that help illustrate the existence of barriers that would impede the implementation of the project without access to carbon finance. These barriers are related to the lack of profitability, access to investment, capacity, and so on. However, concerns have been raised about the robustness of the demonstrated additionality. Cames et al. argued that carbon revenues have a limited impact on profitability and the elimination of barriers in renewable energy projects such as wind and hydropower [
30]. Hence, the additionality of renewable energy projects could affect the environmental integrity of the ERs sourced from these projects; issue which would not exist in ERs from REDD programs.
2.5. Establishing Robust Baselines
The quality of emission reductions is closely related to the ambition and scope of the mitigation target [
7]; the more ambitious the target, the higher the quality of the ER. In the context of the accounting and generation of ERs for offsetting, the target is to be set below the baseline so as to be able to generate ERs (target = baseline).
Baselines set under REDD programs are mostly conservative; they represent an ambitious target that would support the quality of the ER. Some of the reasons for this include:
Use of historical averages: A large number of REDD programs use historical average emissions for setting their historical baselines. More than 80 percent of REDD reference levels submitted to UNFCCC use historical average emissions [
11], and most of the standard-setting requirements for REDD programs [
31,
32,
33,
34] require the use of historical average emissions for establishing baselines. This is despite the upward trend in deforestation and forest degradation that is being observed in various countries, especially in the African region [
35,
36].
Discounts and conservative approaches: Standards also set requirements such as plain discounts [
29]; discounts based on the uncertainty of the baseline [
31]; and requirements to cap the upward adjustment of average historical emissions to ensure the conservativeness of crediting baselines, and to consider downward trends [
34]. Furthermore, significant improvement in spatial, temporal, and spectral resolution, and the signal-to-noise ratio of satellite sensors has increased the capacity to detect forest change over time; therefore, it is likely that the remote sensing methods used for baseline establishment will underestimate activity data more than monitoring would [
37,
38] rendering baselines conservative.
Carbon pools and gases that would generate additional ER are neglected. REDD programs restrict the scope of the accounting to carbon pools, sources, and gases for which high-quality information is available. Although REDD generates ER from the soil organic carbon pool, this pool is usually not considered by REDD programs [
12,
39]. This would further confirm the conservativeness of the established baseline (the reported ER).
“Foregone removals” are not accounted for. Moreover, none of the countries that have submitted REDD baselines under UNFCCC or other bilateral/multilateral programs have considered the effect of “foregone removals”. A forest that is deforested or degraded loses its capacity as a sink to capture CO
2 from the atmosphere, since either the area of the forest has been reduced, or the net growth is reduced when extractions are higher than additions [
40]. These “foregone removals”, which represent the amount of removal of atmospheric CO
2 had there not been deforestation and forest degradation, are also not accounted for, another way in which baselines and ERs from REDD programs are conservative.
As explained in
Section 2.1 above, renewable energy project’s baselines assume that the electricity delivered to a grid in the baseline scenario would have otherwise been generated by the functioning of existing and new connected power plants. The renewable energy project will then generate a number of ERs for every MWh that it delivers to the grid. As shown in
Figure 2, although these projects specify a target of generation based on ex ante emissions, they may not be achieved due to annual or interannual variations in the productivity of alternative systems such as wind and hydro power. If this “target” is not achieved, it would have to be partly compensated for with electricity from power plants operating in the grid; yet the project would still generate ERs for the electricity generated below that target. In principle, this should not be a problem, since emissions in the project scenario would be lower than in the baseline scenario. The problem is rather one of attribution: whether there has been a real contribution to reducing emissions because fossil fuels are being kept underground, or whether it is because the renewable energy project is meeting new demands for electricity.
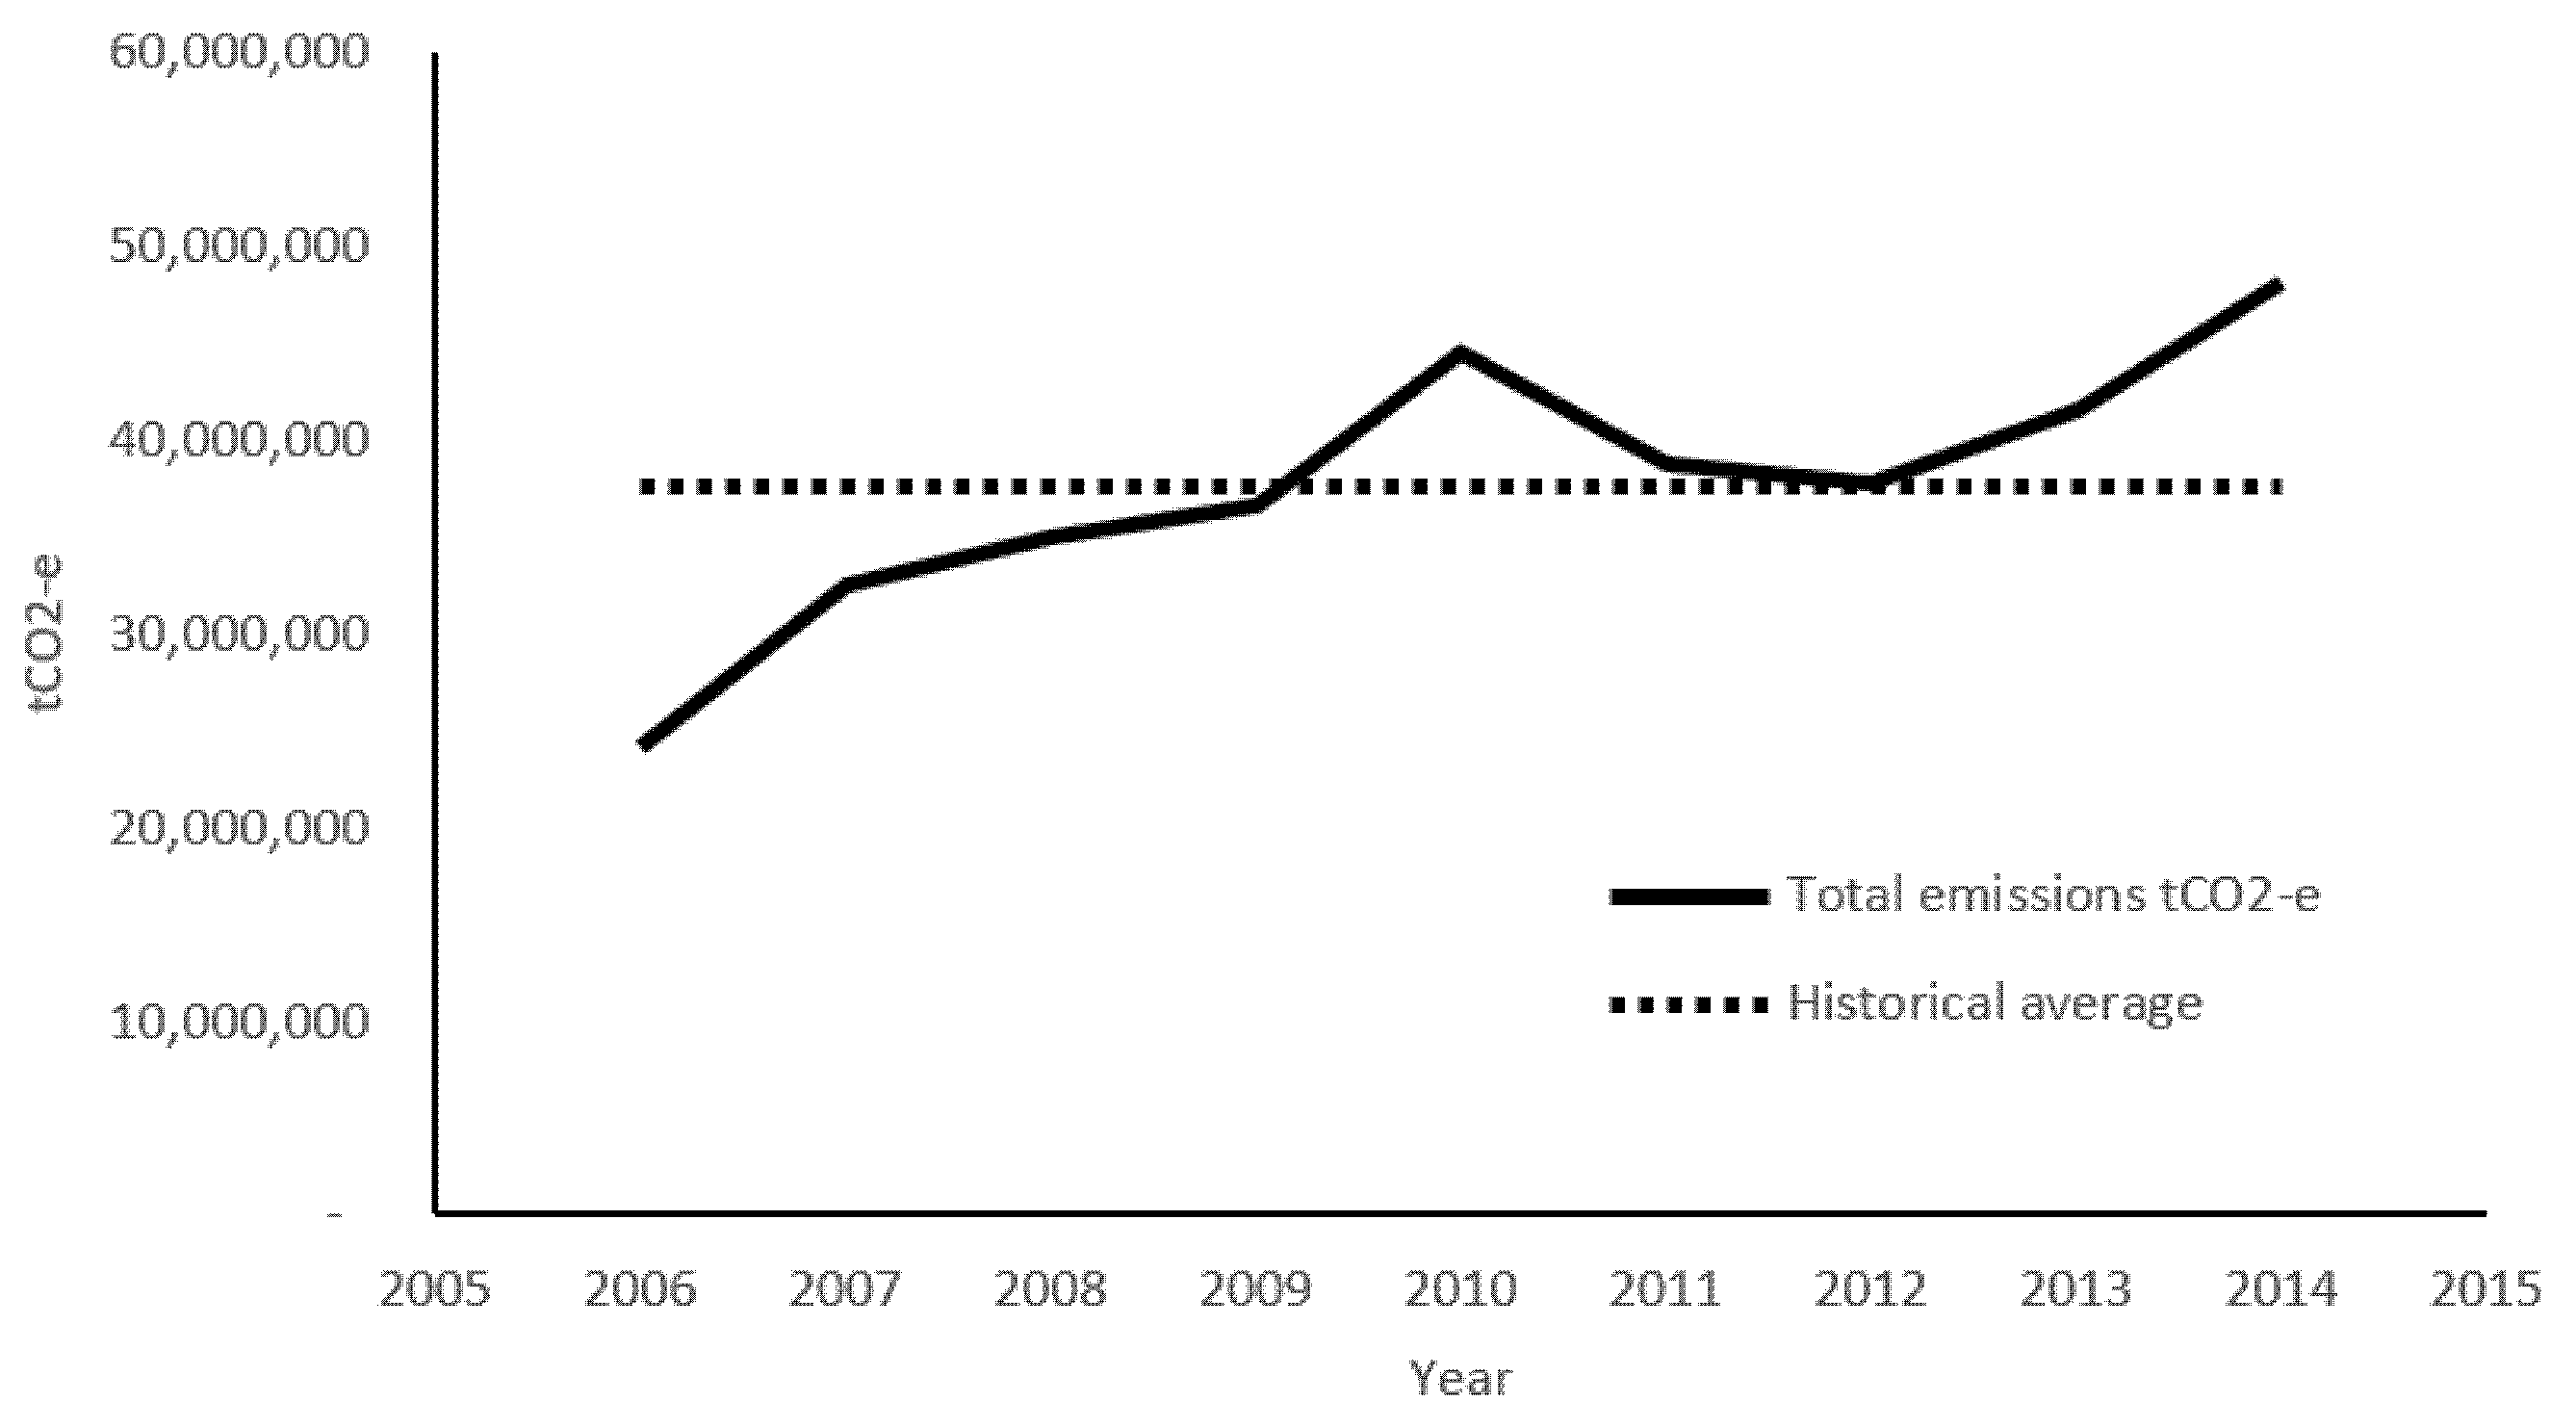
Baselines in REDD programs and renewable energy projects are based on very different approaches which do not always enable direct comparison. However, if we move from the level of a renewable energy project to the jurisdictional level or the electricity grid level by extending its accounting boundary, it would be possible to apply the same principles of REDD program baseline setting and make the comparison. One example is the Gansu Province in China, which has about 16 CDM wind projects, which have operated since 2009 [
18]. Although the CDM projects generated a total amount of 5,307,000 million ERs during the period 2005–2016, the overall emissions from the power sector in the province continued to increase [
41,
42]. In fact, Gansu has some of the highest rates of underutilization of wind farms, since local governments prefer energy derived from coal to clean energy [
43]. This trend is common in many countries: even when clean energy technology increases, most energy grids will continue to rely on additional energy sources to satisfy the growing demand for energy [
44].
If the baseline setting approach used for REDD programs had been used in Gansu Province (see dotted line in
Figure 5), the same level of ERs would not have been generated, despite the ERs generated at the project level. Moreover, the upward trend in emissions in Gansu province would suggest that the renewable energy projects might be meeting new demand in electricity not displacing existing sources. All of this puts into question the ambition of the target, and in turn the quality of the ERs generated in Gansu as well as from other renewable energy projects located in the province. In this case, more additionality testing is necessary in order to prevent the international transfer of hot air, or other non-quality offsets [
45].
Looking at the example above, it is also important to note what the atmosphere “sees” under REDD programs and under renewable energy projects. Under REDD programs, since the baselines are usually based on historical emissions, every ER would mean that the atmosphere has “seen” an actual reduction in emissions; that is, the ER is helping to solve the problem. However, under a renewable energy project, one ER would not necessarily mean that the atmosphere is “seeing” a reduction in emissions; it might be rather, that is “seeing” a reduction in prospective emissions: that is, the ER is making the problem less harmful.
2.6. Uncertainty
2.6.1. Concept of Uncertainty
One issue that is commonly pointed out regarding ERs from the forestry sector, and more specifically from REDD+, is the level of uncertainty of the emission reductions [
8,
9,
46]. The uncertainty of emissions estimates in GHG inventories from the forestry sector tends to be greater than that from other sectors due to necessary differences in methods, and the intrinsic variability of carbon stocks.
Uncertainty is defined by the IPCC 2006 Guidelines as the “lack of knowledge of the true value of a variable that can be described as a probability density function characterizing the range and likelihood of possible values [
47]”. It is composed of two components: random error and systematic error. The former is defined as the random variation above or below a mean value: it is the inverse of precision, it can usually be quantified, and it is related to measurement and estimation [
47]. The latter is defined as the lack of agreement between the true value and the mean value: it is the inverse of accuracy, it can rarely be quantified, and it is usually related to errors linked to conceptualizations (that is, assumptions), models, and inputs [
47]. The IPCC Guidelines require random error to be quantified and propagated, whereas systematic error has to be prevented; yet systematic errors may have the most significant impacts on the overestimation of ERs [
47].
2.6.2. Random Errors
Random errors in calculating emissions and ERs from REDD programs are usually high, since they rely on statistical approaches to determine both the area of deforestation and forest degradation and the amount of carbon per area unit: they can range from 1 to 250 percent [
46]. Although REDD programs usually include the main sources of the random errors (statistical uncertainty) in their uncertainty analysis, some sources are recurrently not included [
46]; yet the impact on the uncertainty of ERs is unclear, and random errors tend to compensate for each other [
48].
On the other hand, a renewable energy project relies on measured data of the electricity generated by the project, through electricity meters that have a high level of accuracy and are regularly calibrated, which makes random uncertainty negligible. However, as explained in
Section 2.1, emission factors require statistics in electricity generation, fuel consumption, calorific values, and emission factors. All of these are simply assumed to be exact, yet they still have random errors, especially the three last parameters. However, the expectation is that they will tend to compensate for each other to a certain extent, and random errors of these parameters are lower than in REDD programs. These issues could affect the comparability of the estimates, with serious implications regarding offsets among sectors.
2.6.3. Systematic Errors
Systematic errors in the estimation of ERs can have a more significant impact than random errors, since they are related to divergence from the real value; they can be the source of large systematic overestimations. On the other hand, as stated above, random errors tend to compensate for each other to a certain extent.
Systematic errors could be related to the lack of the representativeness of the data or inputs (for example, a lack of representativeness of the sample). As explained in
Section 2.1, ER estimation in a renewable energy project is based on emission factors that rely heavily on IPCC default values for the calorific content and emission factors of fossil fuels, which usually are not representative. Moreover, they may be based on data that are several years old and which would neither represent the emission factor in the business-as-usual scenario nor recognize the loss of efficiency of infrastructure as it ages. Carbon standards for the accounting of REDD programs include provisions for addressing these issues by requiring Tier 2 data (national values resulting from statistically derived and unbiased samples) for the parameters that contribute most significantly to ERs, and by requiring that the baseline periods are close enough to the commencement of the program in order to have an accurate representation of the business-as-usual scenario [
31,
32,
33,
34].
Systematic errors could also be related to the conceptualization of the estimation approach. As explained in
Section 2.1, ERs from REDD programs are based on the monitoring of fluxes in forests in the program area; therefore, the resource is being directly monitored and the monitoring relies on simple calculations. However, as is also explained in
Section 2.1, in renewable energy projects the actual fluxes of emissions or fossil fuels stored underground are not monitored; instead a proxy is used, whereby a MWh of electricity from the renewable energy project is assumed to displace a certain amount of fossil fuel being emitted. This proxy is the most practical way to estimate ER, since estimating ER at the level of the grid for its subsequent attribution to the renewable energy project would be challenging. However, the implications of using a proxy instead of direct monitoring should be considered. For instance, this would not solve the question of whether electricity supplied by the renewable energy project is actually displacing fossil fuels, as there is no actual monitoring of the resource. Moreover, the emission factors rely on complex calculations, with several assumptions that could be a source of systematic errors.
Methods for the quantification of ER from REDD programs, which are based on the direct estimation of fluxes using representative national derived data, simple calculations, and the use of conservative baselines tend to result in a low level of systematic errors. Systematic errors in renewable energy projects, however, due to the use of unrepresentative data, or the use of proxy methods to estimate ER could result in a high level of systematic errors.
It is suggested that in analyzing the uncertainty of ER, the uncertainty should be viewed in a broad sense, considering both random errors and systematic errors; and acknowledging that there is a trade-off between these two types of errors.
2.7. Leakage
Leakage can be defined as the unplanned loss of carbon benefits due to the displacement of activities or markets outside the boundary of the accounting area that results in an increase in GHG emissions [
49]. Most standards require leakage to be assessed and mitigated by applying mitigation actions based on the risk of activities that are being shifted outside the implementation area [
31].
In renewable energy projects, it is assumed that no other leakage emissions exist, since emissions arising from activities such as upstream emissions from fossil fuel use (extraction, processing, transport, etc.) may be neglected [
16]. If the boundary of the project is extended beyond the electricity grid to the site where fossil fuels are being extracted, and the analysis is done for the whole system, an additional risk of emissions displacement could be identified (see
Figure 2). As explained in
Section 2.1, renewable energy projects use proxies to estimate ER and do not monitor the actual source of emissions or the fluxes from the fossil-fuel stocks, so it is not possible to confirm whether the extraction of fossil fuels has actually been reduced. In such a case, there could be fossil fuel that would have been burned in the baseline scenario of the project but is actually burned elsewhere. This has happened in Australia, where there was a reduction from 80 to 62 percent in the use of coal for energy production in the period 2005–2017, due to an increase in the generation of energy from natural gas and renewables [
50]; but coal exports in Australia increased by 40 percent in the same period, putting into question whether the renewables have had an actual effect on the atmosphere [
51].
Leakage can also occur due to the displacement of drivers or market forces to areas not covered under the scope of implementation [
8]. Due to the scale of implementation, under REDD programs it is expected that leakage outside the implementation area will be more difficult, since the area is usually several million hectares in size, encompassing whole countries in many cases. Simply put: what would constitute leakage from a REDD intervention would simply constitute internal displacement at the REDD program level [
12]. Therefore, the resulting emissions would be captured by the forest monitoring system that is covering the whole REDD program area. Some even argue, from a structural perspective, that due to the larger perimeter/area ratio of jurisdictions as compared to projects, the risk of displacement outside of a REDD program area is expected to be comparatively low. In any case, there is a need for measures that can help prevent displacement and minimize the risk of leakage.
Under REDD programs, it is usually assumed that leakage could be significant if the programs do not cover the whole country [
8]; this has resulted in several standards proposing various approaches to addressing these emissions, ranging from awarding discounts to requiring the mitigation of potential emissions through program design [
31,
32,
33,
34]. However, a review of the literature does not show a careful analysis of the risks of leakage in REDD programs, or any evidence of this existing. One example of this is Brazil, where it has been hypothesized that the soy moratorium in 2006 and the zero-deforestation cattle agreements in 2009 would have caused the displacement of emissions from Amazonia to Cerrado [
52]. However, the reported results by Brazil for both biomes show that this might not have happened to the degree that was hypothesized, since emissions have gone down in both jurisdictions [
39].
3. Conclusions and Recommendations
When comparing emission reductions (ERs) from REDD programs and from renewable energy projects, it is frequently assumed that the ERs from REDD programs are of lower quality. This is usually based on the fact that ERs from energy projects are generally considered the “gold standard”. This conclusion has been reached through the identification of weaknesses that are considered to affect only REDD programs, along with the failure to recognize some of the specific weaknesses of renewable energy projects as compared to REDD programs. However, if a balanced assessment is carried out, using a generally unassuming approach, as we have done in this analysis, additional weaknesses and strengths are identified for both types. As discussed in this paper, the environmental integrity (impact) of ERs sourced from renewable energy projects has some flaws that do not exist in REDD programs, and REDD programs have some strengths in terms of environmental integrity that do not exist in renewable energy projects. Furthermore, we have shown that some of the concerns regarding the environmental integrity of REDD programs could also apply to renewable energy projects.
One general recommendation to policy makers, GHG programs, and users is that they apply a holistic approach in the assessment of environmental integrity when comparing ER sourced from REDD programs and from renewable energy projects. As we have shown, it should be recognized that ERs from these two credit sources have both weaknesses and strengths, but they are each real, fungible, and permanent.
Some of our specific conclusions and recommendations include:
ERs from REDD programs should be considered permanent since they represent an activity that seeks to reduce emissions, not enhance removals or carbon sequestration. If permanence is understood to mean that carbon stocked or stored would not be released, ERs from a REDD program are permanent in the same way as ERs from a renewable energy project, since the moment that a renewable energy project becomes less effective, carbon stored in the form of fossil fuels will be released, especially if there are upward trends in fossil-fuel consumption in the grid it is connected to. This is no different than what takes place in REDD programs. “Negative” ERs can occur under REDD, but if mitigation measures have been implemented, they would be explained by either an inaccurate baseline or an excessively conservative estimate.
“Reversals” due to natural disturbances can also occur in renewable energy projects, and indeed in the energy sector as a whole. In the same way that a forest fire could cause carbon stocks to be reemitted into the atmosphere, a bad hydrological year, a lack of wind, or other factors could also mean that fossil fuels that had been “saved” are actually emitted. Moreover, one strength of REDD programs is the fact that forests can recover from natural disturbances through regeneration, which over the long term would compensate for any “reversals” in the short and mid-term.
Additionality in REDD programs and in renewable energy projects has different meanings, and different ways of being demonstrated; but renewable energy projects do have some weaknesses. For example carbon finance does not have a large impact on the decision to proceed with a renewable energy project.
Baselines under renewable energy projects have some weaknesses that need to be highlighted, since they are not supported by ambitious targets; and due to the increase in emissions in the electricity sector, it cannot actually be confirmed that the atmosphere is “seeing” a reduction in emissions as a result of these projects. REDD programs, on the other hand, rely on ambitious targets that are defined by their conservative baselines, which represent the historical average of emissions. Therefore, in REDD programs, ERs would be “seen” by the atmosphere as actual reductions, and they would be conservative.
Uncertainty of ER should be seen as a combination of random errors (e.g., statistical uncertainty) and systematic errors. The random errors under REDD programs are expected to be larger than under renewable energy projects, but random errors in renewable energy projects are largely underestimated, since multiple parameters are assumed to be exact. Systematic errors in renewable energy projects could also cause large overestimations, and are typically neglected in methodologies and are usually addressed under REDD programs. An overemphasis of standards in the reduction in random errors is limiting; systematic errors should also be recognized.
REDD programs mitigate the risk of leakage thanks to the large areas they cover, and their ability to monitor ERs at the level of the whole jurisdiction. In renewable energy projects, the actual source of resources (stocks, or fluxes of fossil fuels) or emissions is not monitored, so it is not possible to know if the fossil fuel that was not used has been displaced elsewhere.


