Article

Quantitative Genetic Variation in Bark Stripping of Pinus radiata

1
School of Natural Sciences, University of Tasmania, Private Bag 55, Hobart, TAS 7001, Australia
2
ARC Training Centre for Forest Value, University of Tasmania, Hobart, TAS 7001, Australia
3
Hancock Victoria Plantations, Churchill 3842, Australia
4
Timberlands Pacific Pty Ltd., Launceston 7250, Australia
5
SCION Research, Rotorua 3010, New Zealand
*
Author to whom correspondence should be addressed.
Forests 2020, 11(12), 1356; https://doi.org/10.3390/f11121356
Submission received: 10 November 2020 / Revised: 8 December 2020 / Accepted: 16 December 2020 / Published: 18 December 2020

Abstract

:
Bark stripping by mammals is a major problem for conifer forestry worldwide. In Australia, bark stripping in the exotic plantations of Pinus radiata is mainly caused by native marsupials. As a sustainable management option, we explored the extent to which natural variation in the susceptibility of P. radiata is under genetic control and is thus amenable to genetic improvement. Bark stripping was assessed at ages four and five years in two sister trials comprising 101 and 138 open-pollinated half-sib families. A third younger trial comprising 74 full-sib control-pollinated families was assessed at two and three years after planting. Significant additive genetic variation in bark stripping was demonstrated in all trials, with narrow-sense heritability estimates between 0.06 and 0.14. Within sites, the amount of additive genetic variation detected increased with the level of bark stripping. When strongly expressed across the two sister trials, the genetic signal was stable (i.e., there was little genotype × environment interaction). No significant non-additive effect (specific combining ability effect) on bark stripping was detected in the full-sib family trial, where it was estimated that up to 22.1% reduction in bark stripping might be achieved by selecting 20% of the less susceptible families. Physical traits that were genetically correlated, and likely influenced the amount of bark removed from the trees by the marsupials, appeared to depend upon tree age. In the older trials, these traits included bark features (presence of rough bark, rough bark height, and bark thickness), whereas in the younger trial where rough bark was not developed, it was the presence of obstructive branches or needles on the stem. In the younger trial, a positive genetic correlation between prior height and bark stripping was detected, suggesting that initially faster growing trees exhibit more bark stripping than slower growing trees but later develop rough bark faster and became less susceptible. While the presence of unexplained genetic variation after accounting for these physical factors suggests that other explanatory plant traits may be involved, such as chemical traits, overall the results indicate that selection for reduced susceptibility is possible, with potential genetic gains for deployment and breeding.

1. Introduction

Herbivores are important determinants of plant productivity in managed and natural plant systems [1]. In managed conifer forests, browsing may have significant economic impacts through deleterious effects on tree growth, reproduction, and survival [2]. Potential strategies for forest, tree, or herbivore management to reduce these impacts are costly and difficult to implement on a large scale [3,4]. The exploitation of natural resistance is, however, a potential strategy for managing browsing damage [5]. In conifers, natural resistance leading to variation in herbivore damage among and within populations, as well as within individuals and tissues, has been reported [6,7]. This variation, if genetically based, is key to the evolution of resistance mechanisms [8,9] and a prerequisite for genetic improvement in tree breeding and deployment populations [10,11]. The response to selection, and thus genetic gain in the next generation, depends on the presence of additive genetic variation in the population, which is determined by the phenotypic variation and the narrow-sense heritability of the trait [10]. Significant additive genetic variation in resistance to herbivore damage has been detected in several conifers [12,13,14].
Despite the potential to exploit genetic variation in resistance to herbivores to improve productivity in conifers, other factors can constrain the expression of genetic increase in resistance. Genetic gain can, for example, be constrained if the expression of resistance varies according to environmental conditions. Such genotype by environment interaction (G×E) can result in a change in variances or the relative resistance rankings of plant genotypes in different environments [15,16,17,18]. The nature of genetic correlations among traits is also important. If two traits are favorably correlated, selection on one trait can simultaneously improve the other by indirect selection [10]. Conversely, adverse correlations between traits of interest makes the simultaneous genetic improvement of both traits a challenge, especially where this involves a trade-off, which may occur, for instance, if there is a metabolic cost to resistance [19]. Additionally, the patterns of resistance to herbivory can change as trees develop, which may be related to the toughening of plant tissues or an increase in secondary metabolites with age [20,21,22].
The presence of genetic variation in resistance to insect herbivores appears to be widespread in many conifer systems [12,23,24,25], and some operational breeding programs exploit this to reduce the impacts of insect herbivores [26]. However, there is limited evidence of genetically based variation in susceptibility to mammalian herbivory. A few studies have indicated the existence of genetic variation in needle herbivory by mammals [22,27,28,29] but not for bark damage. Mammalian bark stripping has been reported on various conifers, including Pinus radiata, where it impacts the forest industry through its effect on growth, reproduction, and survival as well as its effect on the timber quality resulting from wood decay [6,30,31,32]. However, most studies of mammalian bark stripping in conifers have been undertaken at the phenotypic level, and at this stage there are no studies at the genetic level. Since investment in defenses may vary with plant tissues [33], and genetic correlations in resistance to different herbivores may not be universal [34,35]; our lack of understanding of the genetic basis to bark stripping by mammalian herbivores is a significant gap in our knowledge of conifer management.
Pinus radiata (D. Don, Pinales: Pinaceae) is a softwood species native to California and the Mexican islands [36] but is widely planted as an exotic, with over 4 million hectares grown globally [37]. In Australia, it is the major softwood plantation species, covering approximately 772,400 ha [38]. The plantations are distributed across five states—New South Wales, Victoria, South Australia, Tasmania, and Western Australia—and contributed up to 16.8 million cubic meters of saw logs between 2015 and 2019 [38]. Tree breeding programs aimed at improving the growth, form, health, and wood traits of P. radiata have been ongoing in Australia and New Zealand since the 1950s [39,40]. The genetic improvement of health has focused on resistance to diseases, especially Dothistroma needle blight and insect pests such as Monterey pine aphid, Essigella californica [18,41,42]. Variation in resistance to insect pests and pathogens has been shown to have a strong additive genetic basis [23,41,43,44]. In Tasmania, bark stripping by native marsupials (wallabies and kangaroos) has compromised plantation productivity and product recovery, resulting from the reduced growth, rotting, and death of affected trees [38]. Little is known of the genetic basis of the variation in damage to assess whether plantations can be genetically improved to reduce damage. P. radiata is the only pine species grown commercially in Tasmania, covering 75,900 ha and producing over 17,013 m3 of sawlog and 142,547 tonnes of pulpwood per year [45]. Bark stripping, especially by the Bennett’s wallaby (Macropus rufogriseus) that occurs between the ages of 1 and 6 years, has become the most important pest problem [6,38,46], affecting up to 40% of the Tasmanian plantations, with up to 80% of trees affected in some plantations [6]. Given that the financial costs of managing mammalian herbivores through fencing and culling in P. radiata plantations are high [47], the potential for genetic variation in resistance to bark stripping to sustainably reduce damage is of interest.
This study aimed to:
(1)
determine the extent to which bark stripping is under additive genetic control and if genetic differences are stable across sites and tree age;
(2)
determine the genetic correlation between the level of bark stripping, growth, stem and bark traits;
(3)
estimate possible genetic gains in reducing bark stripping damage from the field-based selection of the least damaged families.

2. Materials and Methods
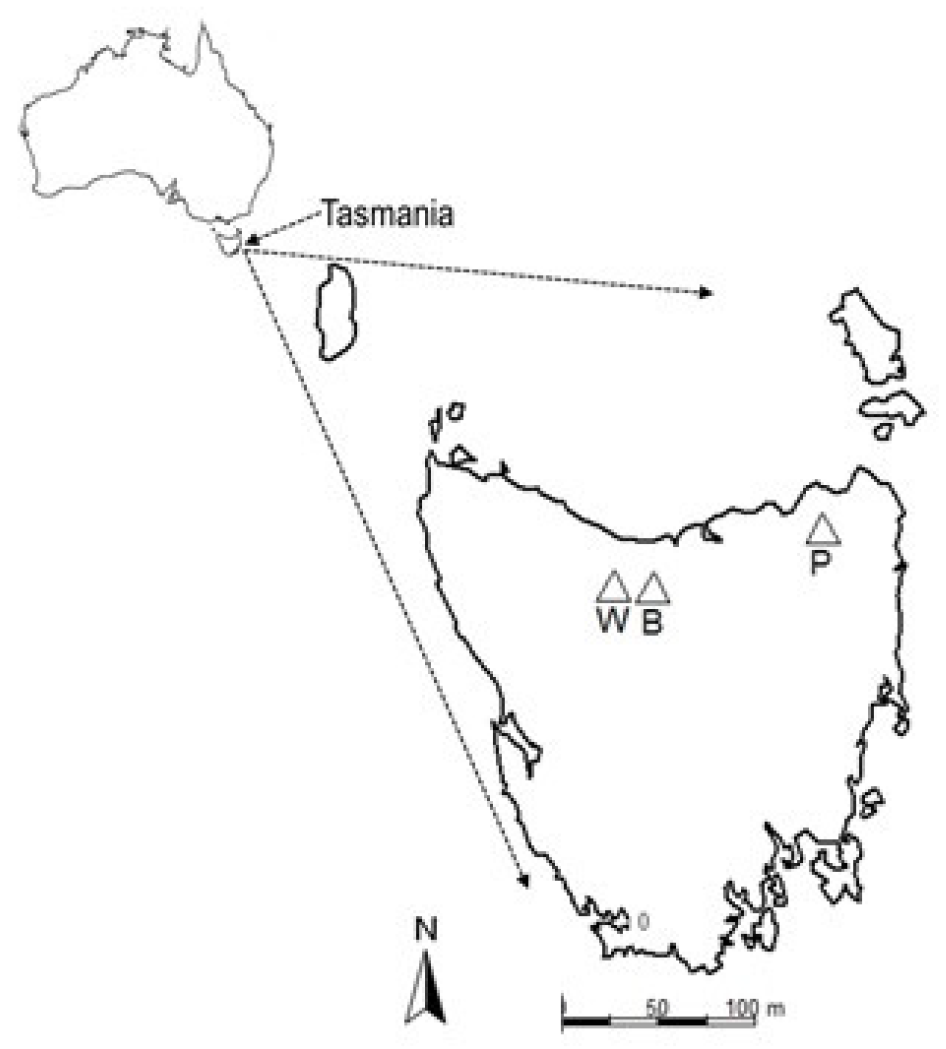
2.1. Family Trials

The field trials used in this study were established in Tasmania (Figure 1) by Timberlands Pacific Pty Ltd. with seeds from the Radiata Pine Breeding Company (New Zealand). Three trials were studied—Beulah, Payanna, and Wilmot (Table 1). The progeny planted in Beulah and Payanna consisted of fourth-generation half-sib (open-pollinated; OP) families from selections in the breeding program, while that of Wilmot was established from third-generation full-sib (cross-pollinated; CP) families. The Wilmot CP families (n = 74 families) were derived from 55 parents and 54 unique grandparents. The OP families at Beulah (n = 101 families) and Payanna (n = 138 families) were assumed to be half-sibs [48] and were derived from 101 and 138 mothers and 194 and 195 grandparents, respectively, highlighting the high pedigree diversity of the populations in the study and that the results were not biased by a few founder ancestors (Table 1). The progeny were from parents that were selected for vigor, stem form, wood properties, and branch characteristics [39,40].
The trials planted at Beulah and Payanna were planted in the same year, with 98 common families plus 3 families which were unique to Beulah and 40 families which were unique to Payanna. The genotype by environment interaction (G×E) was tested based on these two trials. The younger Wilmot trial did not have parents in common with those represented in the other two trials but had some common ancestry deeper in the pedigree. All the trials were replicated in a randomized incomplete block design, with families represented as single tree plots within each block. Seedlings were raised in pots and were planted in rows, at a spacing of 3 m by 3 m. Since the trials were established in clear-cut coupes formerly dominated by Pinus radiata, the remaining post-harvest debris was gathered to form wind rows which separated different sets of blocks within each trial.
In Tasmania, the major bark stripping pest of P. radiata—the Bennett’s wallaby (Macropus rufogriseus) [46]—varies in population density depending on location. The amount of alternative wallaby food may also vary in the different sites, although the presence of other food may not reduce bark stripping [49]. The Beulah and Wilmot field trials were situated in mid-north Tasmania, where the density of the Bennett’s wallaby is estimated at approximately 32.0 animals/km2 [50]. The Payanna field trial was situated in the north-east, where the estimated density of the Bennett’s wallaby is approximately 26.9 animals/km2 [50]. Apart from operational culling [50], the field trials at Beulah and Payanna were freely accessible by the animals. The Wilmot site was, however, fenced for the first two years of growth. After two years, the gates to the trial were opened during winter for approximately 2 months to allow the marsupial herbivores access to a subset of 20 of 26 replicates (6 replicates spread throughout the trial remained independently fenced). The gates were closed to stop browsing when browsing was evident across all 20 replicates. However, after the first bark stripping assessment animals breached the fence and accessed the trees. Further bark stripping was also scored.

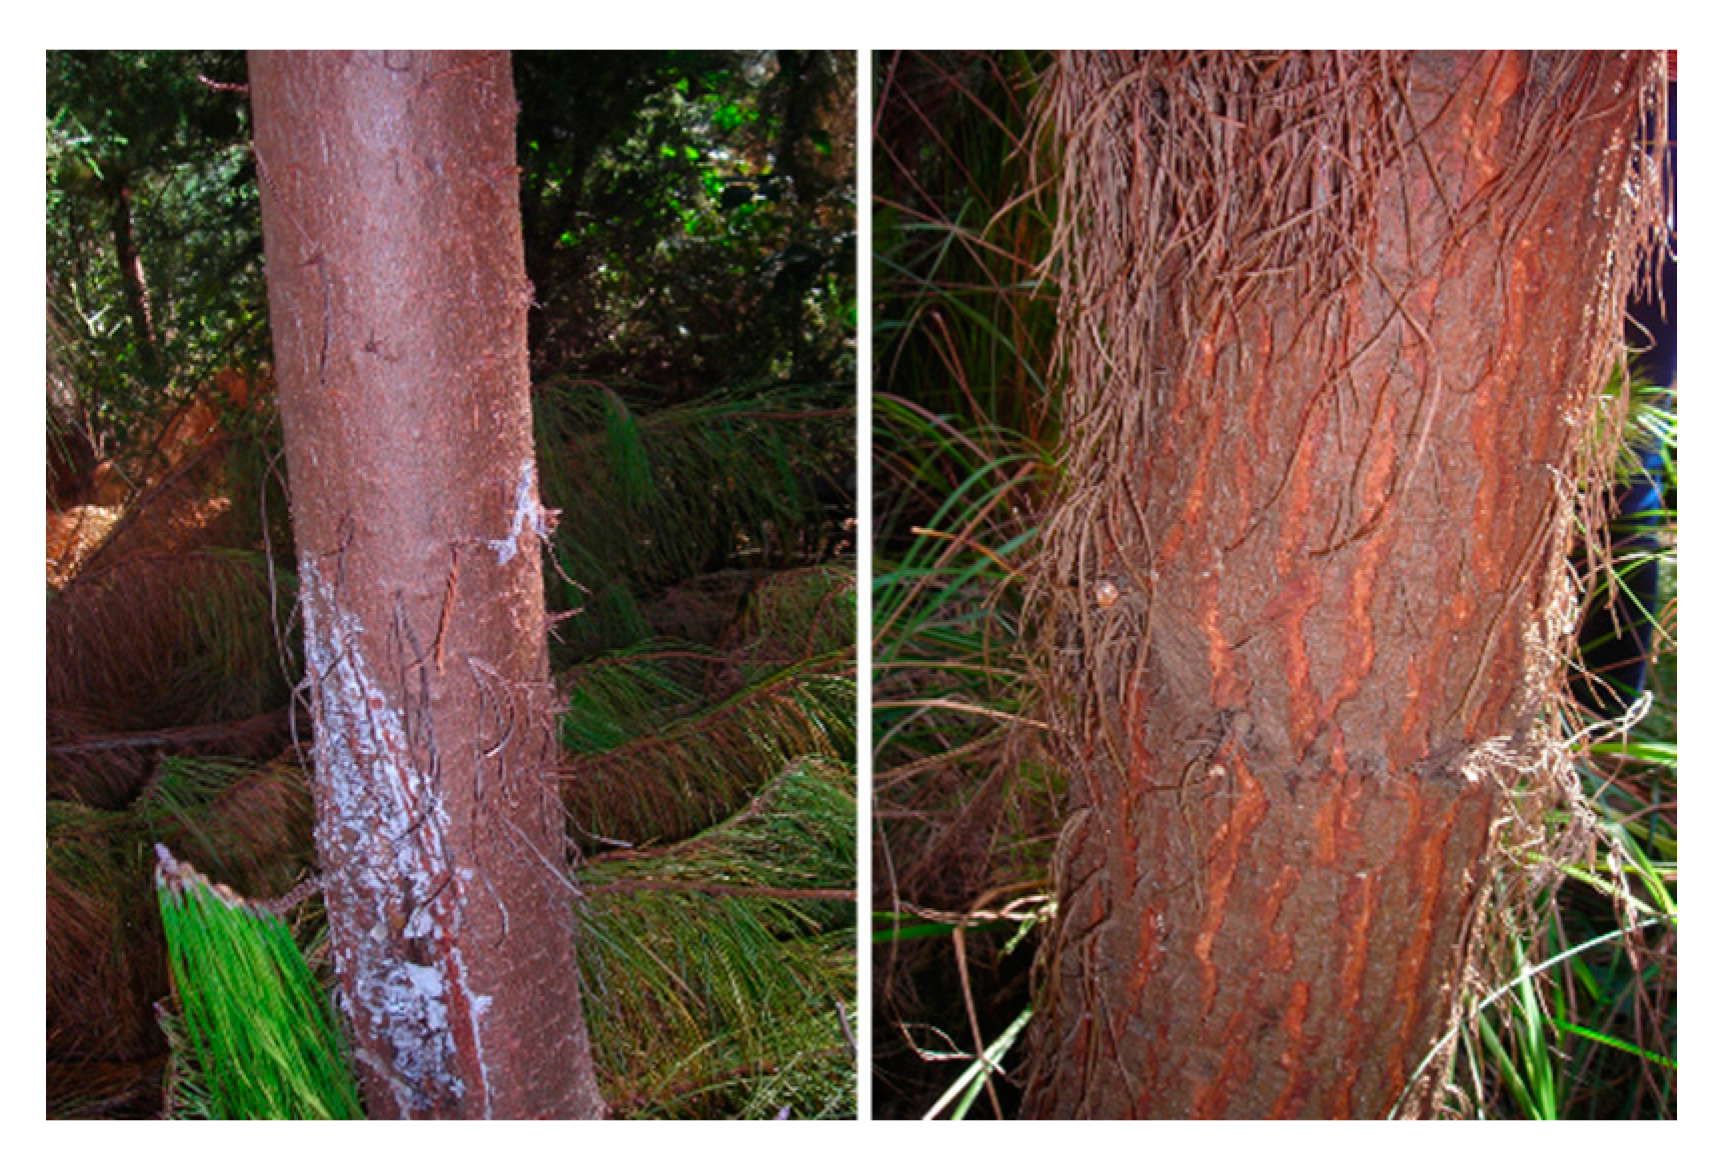
2.1.1. Assessment of Bark Stripping Damage and Related Traits

Bark stripping damage on the stems of the P. radiata trees was recorded visually on individual plants in the field trials. At Beulah and Payanna, the damage was scored on an ordered categorical scale, assigning zero (0) to plants with no evidence of bark stripping, 1 = < 20% of the circumference stripped, 2 = 20–50% of the circumference stripped, and 3 = 50–100% of the circumference stripped. At Wilmot, more categories were included—i.e., 3 = 50–75%, 4 = > 75%, 5 = 100% damage (completely ring barked). Except for the scores 0 and 100, the remaining scores were converted to class mid-point values for the final analyses. Other tree traits including tree height, basal diameter (BD), diameter at breast height (DBH = 1.3 m), bark thickness, the presence/absence of rough bark, stem access, and survival were also assessed (Table 2, Table 3 and Table 4). Rough bark was assessed by the visual inspection of the presence or absence of bark fissures (e.g., Figure 2), and, when present, rough bark height was measured as the height from the ground to the top of the rough bark on the side of the stem with the highest rough bark cover. Bark thickness was estimated at 1.3 m with a custom-made bark probe and was not corrected for DBH. Stem access describes the presence of stem needles and obstructive branches in the first 1 m of the stem, which may prevent ready access to the bark. This trait was subjectively assessed in a categorical decile scale, where 0 = all stem covered with needles and branches, 10 = up to 10 cm covered, 20 = up to 20 cm covered, until 100 where no needles or branches were found within 1 m. Stem access was important only in the younger Wilmot trial. In the older trials, the stem needles were dead and few trees had sparse branches on the stem within 1 m from the ground. Tree survival at all trials was assessed at the time of the first bark stripping assessment. Some variables were assessed multiple times (Table 2, Table 3 and Table 4). The first assessment at Payanna and Beulah was made at 4 years and then at 5 years after planting. At the Wilmot trial, the first, second, and third assessments were made at 2, 3, and 5 years after planting, respectively. For bark stripping, recurrent assessments included old damage, except where the tree had completely healed with no clear signs of earlier damage, and, therefore, the two scores are not independent.

2.1.2. Linear Models

All the univariate and bivariate linear mixed models were run in ASReml-R [51]. First, univariate models were fitted to generate variance components that were used to test the presence of additive genetic variation. The general linear mixed model is represented as:
y =  + Zu + e,
where y is the vector of phenotypic observations for the traits that were assessed from each site (Table 2, Table 3 and Table 4); β is a vector of fixed effects, and this included the mean and missing values (mv) except where covariates were fitted (see results); u is the vector of random effects, which included replicates, blocks within replicates, tree (additive genetic effect—estimated using the relationship matrix derived from the pedigree file for trial trees and their ancestors), and specific combining ability (fitted by including the full-sib family identity in the model) terms; and e is a vector of random residuals. X and Z correspond to design matrices relating the observations in y to the fixed and random effects in β and u, respectively. The joint distribution of the random terms was assumed to be multivariate normal, with means and (co)variances defined as:
[ u e ] N ( [ 0 0 ] , [ G 0 0 R ] ) ,
where 0 is a null matrix and G and R are (co)variance matrices for effects in u and e, respectively [52,53,54]. Where rough bark height was fitted in the model, all the trees without rough bark were fitted as missing values for the trait being modelled.

2.2. Spatial Analyses

The presence of spatial heterogeneity in data may cause inaccurate estimation of genetic parameters [55]. There are diverse approaches for accounting for spatial effects [56]. However, to detect spatial effects in this study, a spatial term was introduced in the linear mixed models by fitting a two-dimensional spatial term [52,56,57]. To set the spatial term, every tree was uniquely identified by a row and column position within each trial, setting the absent, dead, and filler trees to missing values [52]. The missing values (mv) were included as a fixed factor in the models [53]. The spatial term was then partitioned into spatially correlated (ξ) and uncorrelated (η) residuals. The spatially correlated error (ξ) was modelled using a first-order separable autoregressive model in the row and column directions [44,51,58]. However, in addition to the two-dimensional separable first-order autoregressive spatial model, an independent residual (nugget-ψI150) was also added as a random term with the following form:
σ 2Σ = σ 2pcolΣprow) + ψI150,
where σ 2 is the spatial variance, ⊗ is the Kronecker product, and (p) is a first-order autoregressive correlation matrix with autocorrelation p for columns (col) and rows (row) [51].
To test the improvement of the models after fitting the spatial autocorrelation structure to the residuals, the spatial model was compared with the corresponding reduced model that did not fit a spatially correlated residual using a two-tailed likelihood ratio test (LRT) with 3 degrees of freedom [57].
For a visual inspection of the presence of small-scale spatial effects, semi-variograms of the residuals from the above spatial models were generated in R v. 3.6.0 [59] using the sp and gstat packages. The variograms were generated for selected scores of bark stripping and height, but the importance of spatial models was tested for all the variables that were assessed (see results). Flat variograms are expected for randomly distributed data. If spatial dependence is present, semivariance will be small at short distances, will increase at intermediate distances, and will reach an asymptote at longer distances [55]. The direction of strongest spatial correlation in each site was used to generate the variogram although there was spatial autocorrelation in all directions (results not shown). Of the five common spatial models (linear, exponential, spherical, Gaussian, and Matern), the Matern model was selected as the most suitable, suggesting the presence of irregular spatial patterns in both height and bark stripping [60].

2.3. Estimation of Additive Genetic Variation and Heritability within Sites

Because of spatial effects (see results), spatial models were used to obtain variance components to enable testing of the presence of additive genetic variation and for specific combining ability (SCA) for each trait that was assessed [51]. To test whether the additive genetic or SCA variation were greater than zero, the reduced models were compared with respective full models using one-tailed log likelihood ratio tests (LRT) with one degree of freedom [51]. For open-pollinated Payanna and Beulah trials where the SCA term was not fitted in the model, the reduced models excluded the additive genetic variation. For the control-pollinated Wilmot trial, where the additive and SCA terms were in the model, the random terms were sequentially dropped from the model, starting with the SCA term and then the additive genetic term.
For the binary trait, rough bark, a generalized linear mixed model with a binomial distribution and logistic link function was used to estimate variance components [51]. The importance of the random factors in the binomial models were evaluated using the Akaike information criterion [61].
For all models, individual narrow-sense heritability (h2) was estimated from univariate spatial models, that included all the design terms as described above as the additive genetic variance (σa2) divided by the sum of σa2 and spatially independent error variance (σe2) [51] as below:
h 2 = σ a 2 σ a 2 + σ e 2
The SCA term was excluded in the final models of the Wilmot trial because it was not significant for all traits (see results; Table 4). For the binary trait, the residual error variance on the underlying logistic scale, which is 3.28987 [51], was used in the heritability estimations. Estimates of the associated standard error for the estimated heritability were obtained from the average information matrix, using a Taylor series approximation [51]. The presence of additive genetic variation for survival was not tested due to the high survival in all the three trials.
Bivariate models were then fitted to determine the correlation of traits between trials (Type B) and within trials (Type A). Equation (1) was modified into a general bivariate model below:
[ y 1 y 2 ] = [ X 1 0 0 X 2 ] [ β 1 β 2 ] + [ Z 1 0 0 Z 2 ] [ U 1 U 2 ] + [ e 1 e 2 ]
where y1 and y2 = vectors of measurements; X1 and X2 = incidence matrices of 0’s and 1’s, relating measurements and fixed effects; β1 and β2 = unknown fixed quantities including the underlying means for each trait; Z1 and Z2 = incidence matrices relating measurements and random effects; u1 and u2 = vectors of the unknown additive genetic effects; and e1 and e2 = vectors of unknown random errors.

2.4. Type B Genetic Correlations

In evaluating the genotype by environment (G×E) interaction, type B genetic correlations are used to assess the relative performance of traits measured in different environments [62]. The across-site additive genetic correlation of bark stripping, height, DBH and bark traits was assessed for Payanna and Beulah. This was carried out by treating the same trait at the two sites as different traits in a bivariate model [63]. The fixed term was only the mean while the random terms comprised the additive genetic (i.e., tree) term and site-specific replicates and incomplete blocks terms. The unstructured design matrix fitted allowed covariation between additive genetic variation, but a diagonal matrix was fitted for replicates and incomplete block levels. Spatial models were not used at this stage. The additive genetic correlation ( r a ) was estimated as:
r a = c o v a ( x , y ) σ a x 2 σ a y 2 ,
where cova(x,y) is the additive genetic covariance between traits x and y, σ2ax is the additive genetic variance components for trait x, and σ2ay is the additive genetic variance components for trait y. Standard errors of the genetic correlations were estimated as mentioned above [51].
To test whether the genetic correlations were significantly different from zero, a full model was compared with the respective reduced model that had the additive covariances fixed to zero using a two-tailed LRT with one degree of freedom. To test whether genetic correlations were equal to one (perfect correlation), a full model was compared with the respective model that had the additive covariances fixed to one using a one-tailed likelihood ratio test (LRT) with one degree of freedom.

2.5. Phenotypic and Type A Genetic Correlations

Within sites (Type A), additive genetic (ra) and Pearson’s phenotypic correlations among traits were estimated directly from non-spatial bivariate models as defined above (Equation (4)) with the mean as the fixed term and the design (replicates and incomplete blocks) as well as the additive genetic effects as random terms. The SCA term was not included in the model used for the Wilmot estimates. The models allowed covariation at the additive genetic variation, residual, replicates, and incomplete block levels. For binomial traits, the genetic correlations were estimated on the observed binary scale [64]. To test whether the genetic correlations were significantly different from zero, a full model was compared with the model where additive covariance was fixed to zero using a two-tailed LRT with one degree of freedom [51]. Testing that the Pearson’s phenotypic correlations were not equal to zero was performed in R using the function cor.test.
To test if the measured physical traits fully explained the additive genetic variation in bark stripping, linear models (Equation (1)) were re-run with the traits that significantly correlated with bark stripping included as covariates (see results). As previously mentioned, the significance of the additive genetic variation in bark stripping from zero was tested with one-tailed LRT. The random term included the replicates, blocks within replicates and the additive genetic variation.
To test the performance consequences of bark stripping at Wilmot, genetic correlations of bark stripping assessed at year 2 and year 3 with the diameter at year 5 and change in height between consecutive years were estimated. This height change was assessed as the difference between height measurements taken in the different years, where ΔHt2−3 = height year 3 minus height year 2 and ΔHt3−5 = height year 5 minus height year 3.

2.6. Estimation of Genetic Gain

To determine the family rankings for the estimation of genetic gain for a single backward selection event, family best linear unbiased predictors (BLUPs) were estimated for all trials using univariate family models with the spatial term. The additive tree term was not included in the model at this stage, and thus the differences among families in these new models refers to the among family variance directly, which in the case of Wilmot includes the additive genetic and SCA effects estimated in the initial model. Genetic gain was estimated at the family level since the parents of the families are already available in seed orchards and can be used to generate new seed for selected families for deployment.
The predicted percentage genetic gain (reduction in bark stripping) from the backward selection of families was calculated as the average BLUPs of the selected less susceptible families for each trial divided by the population mean, multiplied by 100 [53]. Genetic gain was predicted for selection of a different proportion of families at each of the sites. Predictions were based on assessments at year 5 (2016) for Payanna and Beulah and the year 2 assessment (2017) for Wilmot that exhibited the highest heritability estimates.

3. Results

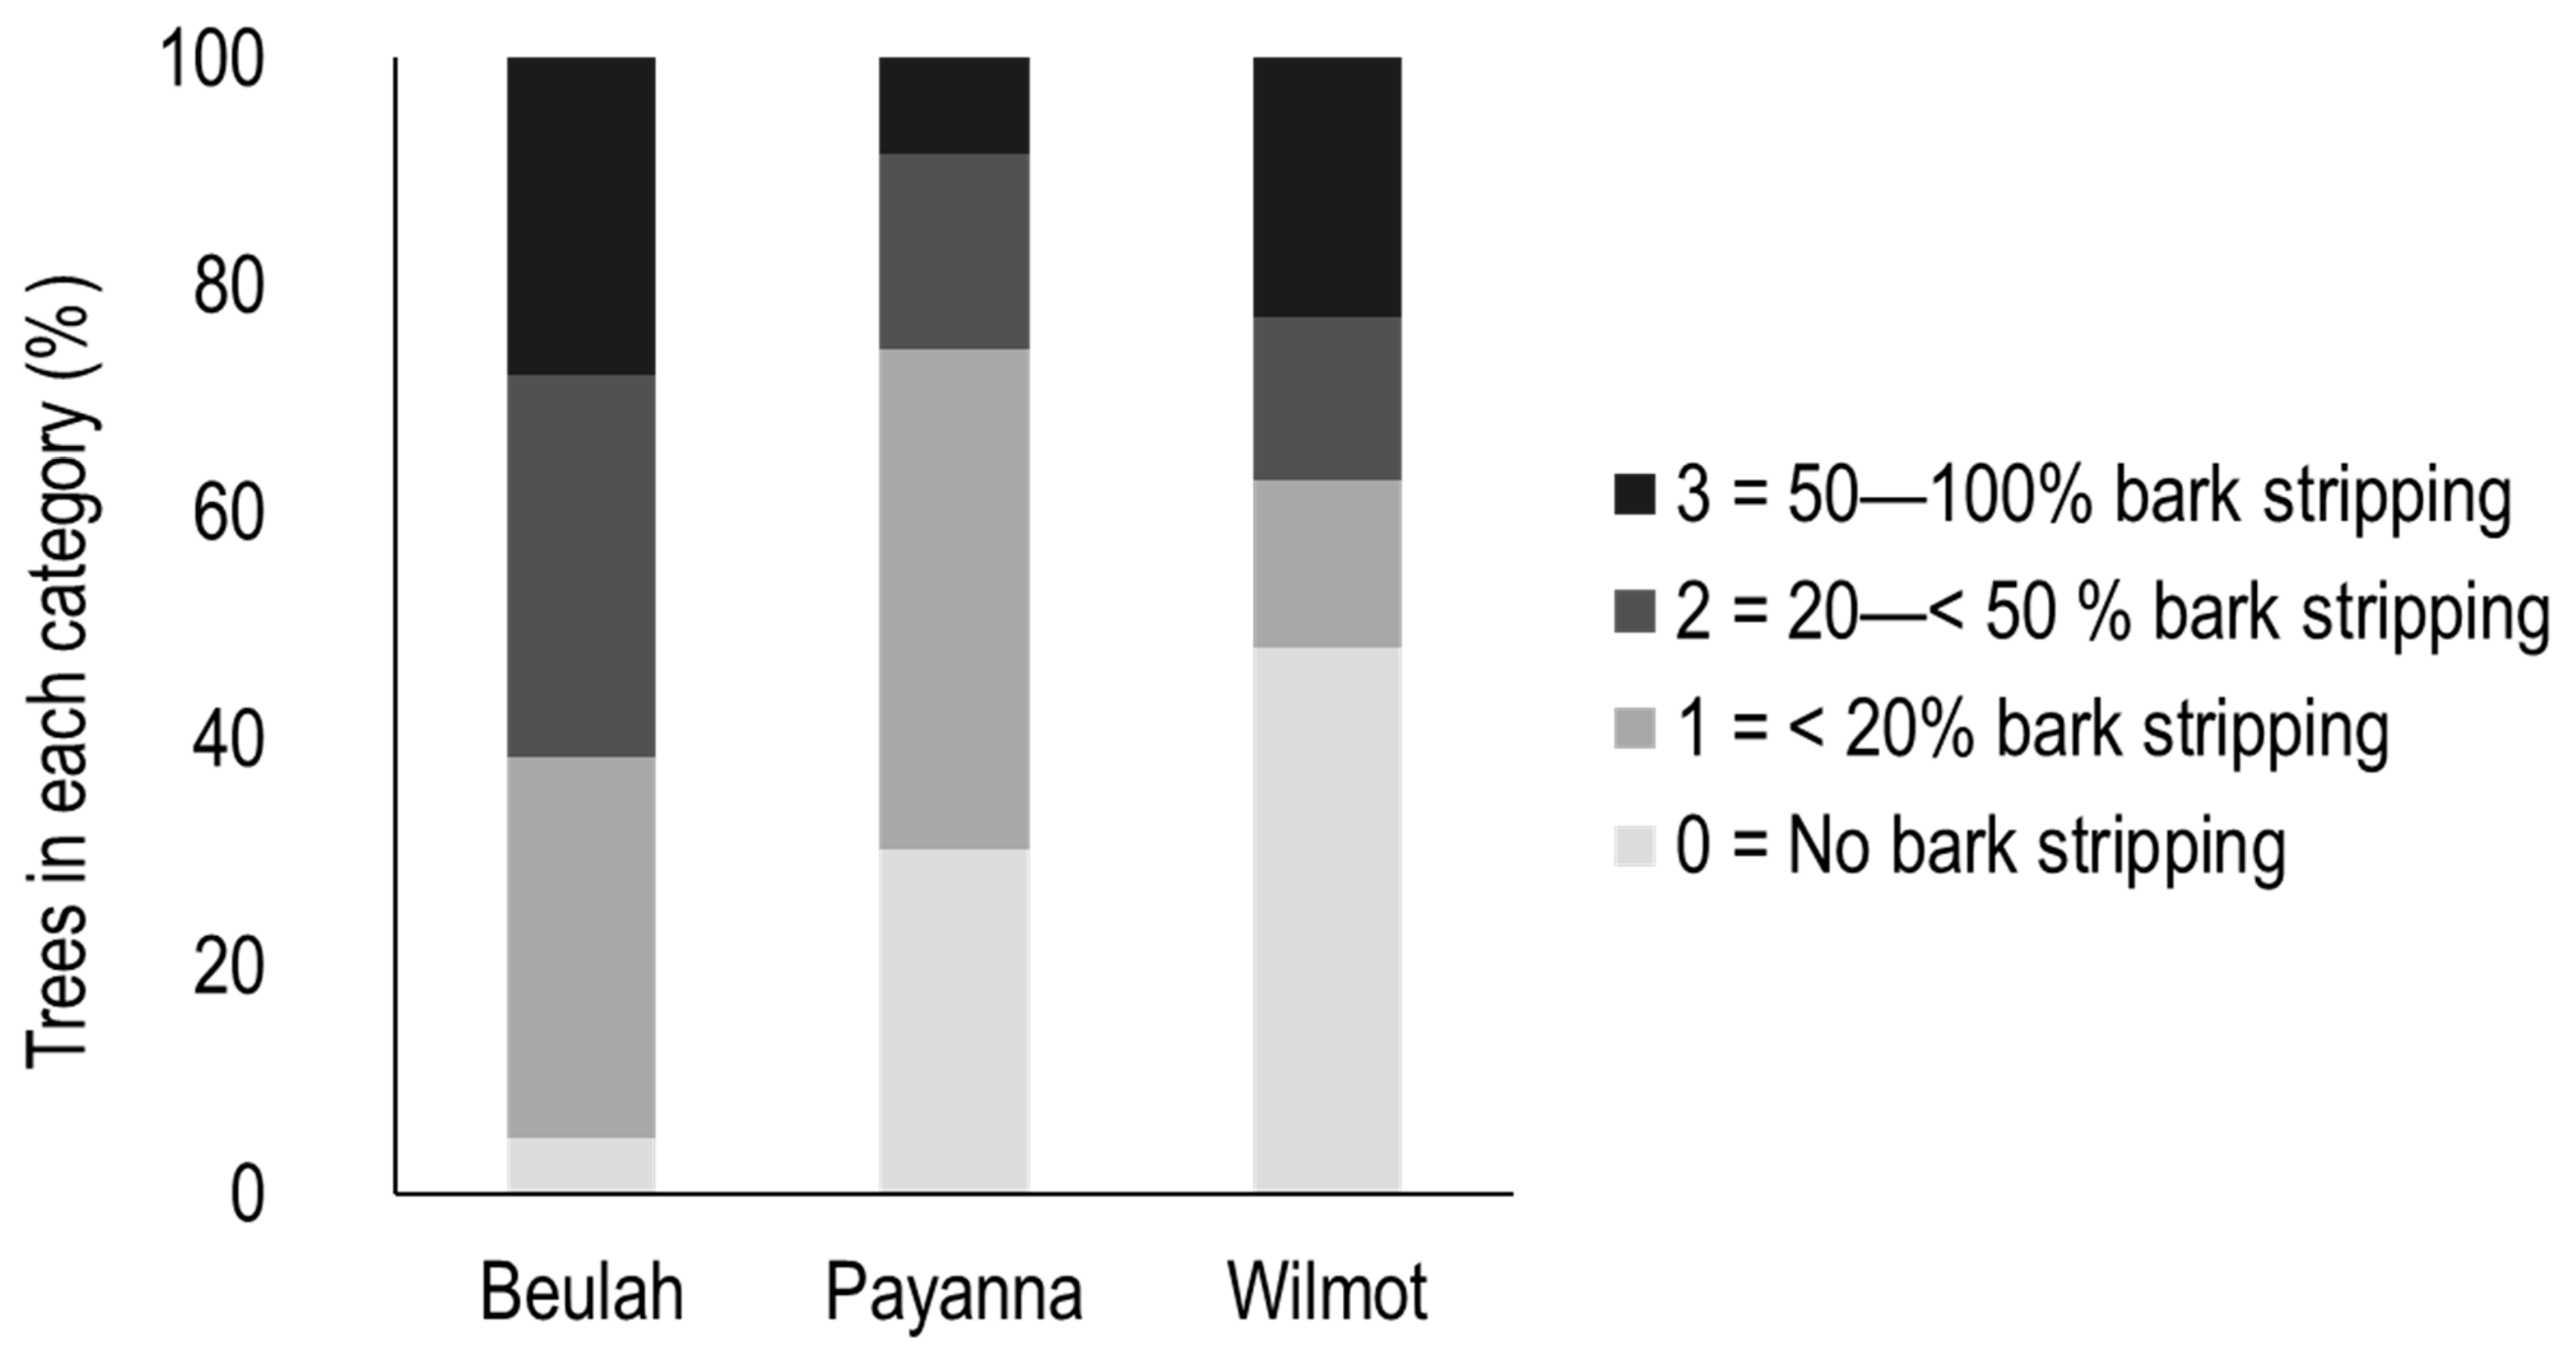
3.1. Differences between Sites in Bark Stripping and Associated Traits

The percentage of trees exhibiting bark stripping was variable across sites, with 95%, 70%, and 52% of the trees experiencing some level of back stripping at Beulah (n = 2002), Payanna (n = 2668) and Wilmot (n = 1372), respectively (Figure 3). Consistently, the amount of bark removed at Beulah (Table 2) was higher than the other two sites (Table 3 and Table 4). Within the two older trials, the mean bark stripping was greater in the second assessment (Table 2 and Table 3). However, in the younger Wilmot trial lower levels were observed in the second assessment, possibly due to fast wound recovery in young trees. Beulah, which had the highest levels of bark stripping, had trees that were shorter at age 4 years ( x ¯   = 391 ± 89 cm) than the sister trial at Payanna ( x ¯   = 573 ± 94 cm) (Table 2 and Table 3). The DBH of the trees in Beulah was also lower than that of Payanna.
The bark traits assessed were different between the older (Beulah and Payanna) and younger (Wilmot) trials. The young Wilmot trees had no rough bark and the bark was too thin to be assessed even at the time of the 2nd assessment at age of 3 years. At 4 years of age, 1% of the trees in Payanna had rough bark compared with 5.3% at Beulah, but by 5 years of age 76% and 42.6%, respectively, of the trees had rough bark. Of the trees with rough bark at Payanna and Beulah, the mean height of rough bark on Payanna trees ( x ¯ =   93.5 ± 60.4 cm) was higher than at Beulah ( x ¯ =   47.9 ± 64.3 cm) (Table 3 and Table 4). These differences in bark development at age 5 years may reflect different growth rates, with the faster growing trial at Payanna having a greater rough bark development.

3.2. Spatial Effects

The variation in traits assessed was not randomly distributed within the blocks of the three field trials, as evidenced by the high significance of the spatial term of the various models (Table 2, Table 3 and Table 4). For bark stripping, more damage occurred at the edge of the blocks possibly due to cover for the marsupials provided by the windrows (Supplementary Figure S1). For purposes of illustration, Supplementary Figure S2 shows that plants in close proximity tended to be bark stripped at similar levels to those of plants that are spatially separated.

3.3. Additive Genetic Variation for Bark Stripping

There was significant (p < 0.001) additive genetic variation for bark stripping at all trials for at least one of the yearly measurements, and heritability estimates ranged between 0.06–0.14 (Table 2, Table 3 and Table 4). The lowest additive genetic variation and lowest heritability estimates were associated with the first bark stripping assessment at Payanna (p < 0.05; Table 3) and the second assessment in Beulah and the younger Wilmot trial (p < 0.05; Table 4). Within sites, the time of assessment was important in detecting significant additive genetic variation for bark stripping, and in part this appeared to reflect the intensity of damage. At Payanna, for example, the amount of bark stripping in the first assessment (age 4 years) was lower than in the following year (means of 8% versus 16%, respectively) (Table 2 and Table 3), and exhibited less additive genetic variation and lower heritability, suggesting few trees being visited by the animals. However, bark stripping across years was highly additively genetically correlated at Beulah (ra = 0.78 ± 0.16), Payanna (ra = 0.91 ± 0.23) and Wilmot (ra = 0.99 ± 0.27), indicating either a confounding of the previous years’ damage or that the family choice by the animals was consistent across years.
Most other traits showed significant additive genetic variation in one or all trials (Table 2, Table 3 and Table 4). There was significant additive genetic variation for height in all trials (p < 0.001). The trait with the highest heritability estimate in both of the older trials was rough bark height; for the cohort of trees that had rough bark and in the younger trial, bark strip height had the highest heritability. The SCA effects estimated from the full-sib family trial at Wilmot were insignificant for all traits, including bark stripping (Table 4).

3.4. Genetic × Environment Interaction

The additive genetic correlations for the same traits (Type B) assessed in the two sister trials—Beulah and Payanna—are shown in Table 5. There was no significant across-site genetic correlation for bark stripping at year 4 (ra = 0.23 ± 0.39), likely due to a low genetic signal with the low damage level observed at Payanna. However, with the cumulative and new damage at year 5, the heritability increased at Payanna and a significant and high positive across-site additive genetic correlation was observed for bark stripping (ra = 0.76 ± 0.25). This indicates a high correspondence of family ranks between the two trials at this age. Similarly, high correlations were obtained for the year 5 rough bark (ra = 0.74 ± 0.42) and the height at year 4 (ra = 0.91 ± 0.32).

3.5. Traits Associated with Bark Stripping

The phenotypic (0.34 to 0.71) and genetic (0.78 to 1.00; Type A) correlations between the various measures or ages of bark stripping were generally highly significantly positively correlated within a trial (Table 6, Table 7 and Table 8). The phenotypic and genetic correlations of bark stripping with growth traits—height and stem diameter—varied from positive to negative (Table 6, Table 7 and Table 8). In general, bark stripping was significantly negatively correlated with stem diameter at the phenotypic level, and while this trend was still evident at the genetic level these correlations were not significant. The association with height was more variable. At the phenotypic level, the correlation was generally negative, but the genetic correlation tended to be negative in the older trials (Table 6 and Table 7). The exception was the year 5 bark stripping at Beulah, which was significantly positively correlated with height (ra = 0.33 ± 0.34), possibly due to the tendency for rough bark height to negatively genetically correlate with height at this age (see below). In the younger Wilmot trial, the phenotypic correlation between bark stripping and height was evident at the onset of bark stripping (age 2 years), but this subsequently became significantly negative consistent, with an adverse effect of bark stripping. In contrast, the genetic correlations between bark stripping and height were generally positive, indicating that families that were initially faster growing had more bark stripping, although this was only significantly greater than zero in the case of 3-year bark stripping and 2-year height.
In the older trials, bark stripping was phenotypically significantly negatively correlated with year 5 bark thickness, the presence of rough bark, and the rough bark height, with one exception (Payanna bark stripping at age 4 years versus 5 year rough bark height, possibly because there were very few trees with rough bark at age 4) (Table 6 and Table 7). This negative association was also evident at the genetic level, with significant negative correlations of year 5 bark stripping with bark thickness (ra = −0.48 ± 0.22), rough bark (ra = −0.47 ± 0.19),, and rough bark height (ra = −0.37 ± 0.17) but only in Payanna (Table 7), suggesting that these traits influence the level of bark stripping at the phenotypic and genetic levels. Compared to Beulah, we noted a rapid increase in the amount of rough bark between 4 and 5 years (77% of the trees in Payanna had rough bark in year 5 compared to 42% at Beulah), emphasizing importance of this trait in minimizing bark stripping, but this depends on its extent in the population. In the younger Wilmot trial, rough bark had not developed at the time of bark stripping. However, in this case, both the 2- and 3-year bark stripping and 2-year bark strip height were highly significantly positively correlated with stem access at the phenotypic (0.31 to 0.42) and genetic (0.87 to 1.00) levels (Table 8).
The genetic correlation between bark stripping for year 2 and 3 and height or DBH for year 5 in Wilmot was negative, suggesting a tendency for bark stripping to reduce performance. A negative genetic correlation was detected between year 5 diameter and bark stripping for year 2 (ra = −0.84 ± 0.16) and year 3 (ra = −0.77 ± 0.22). Similarly, a nonsignificant negative correlation between the first height increment (ΔHt2-3) and bark stripping for year 2 (ra = −0.35 ± 0.27) and year 3 (ra = −0.26 ± 0.29) was detected, indicating a reduction in performance in the initial years of bark stripping, with recovery in the later years.
To test if the observed additive genetic variation in bark stripping could be fully explained by tree physical traits, linear models were run with traits that significantly genetically correlated with bark stripping (i.e., height, stem access, rough bark, and bark thickness) as covariates (Table 9). However, the additive genetic variation in bark stripping was still significant after accounting for this covariation at the phenotypic level. In the younger Wilmot trial, for example, after simultaneously including stem access as a covariate in the model for year 2 bark stripping, the additive genetic variation was still significant (LRT χ2 = 15.6, p < 0.001) but heritability reduced from h2 = 0.09 ± 0.03 to h2 = 0.06 ± 0.02. Similarly, in Payanna, the additive genetic variation for bark stripping was significant after accounting for covariation with selected traits (Table 9).

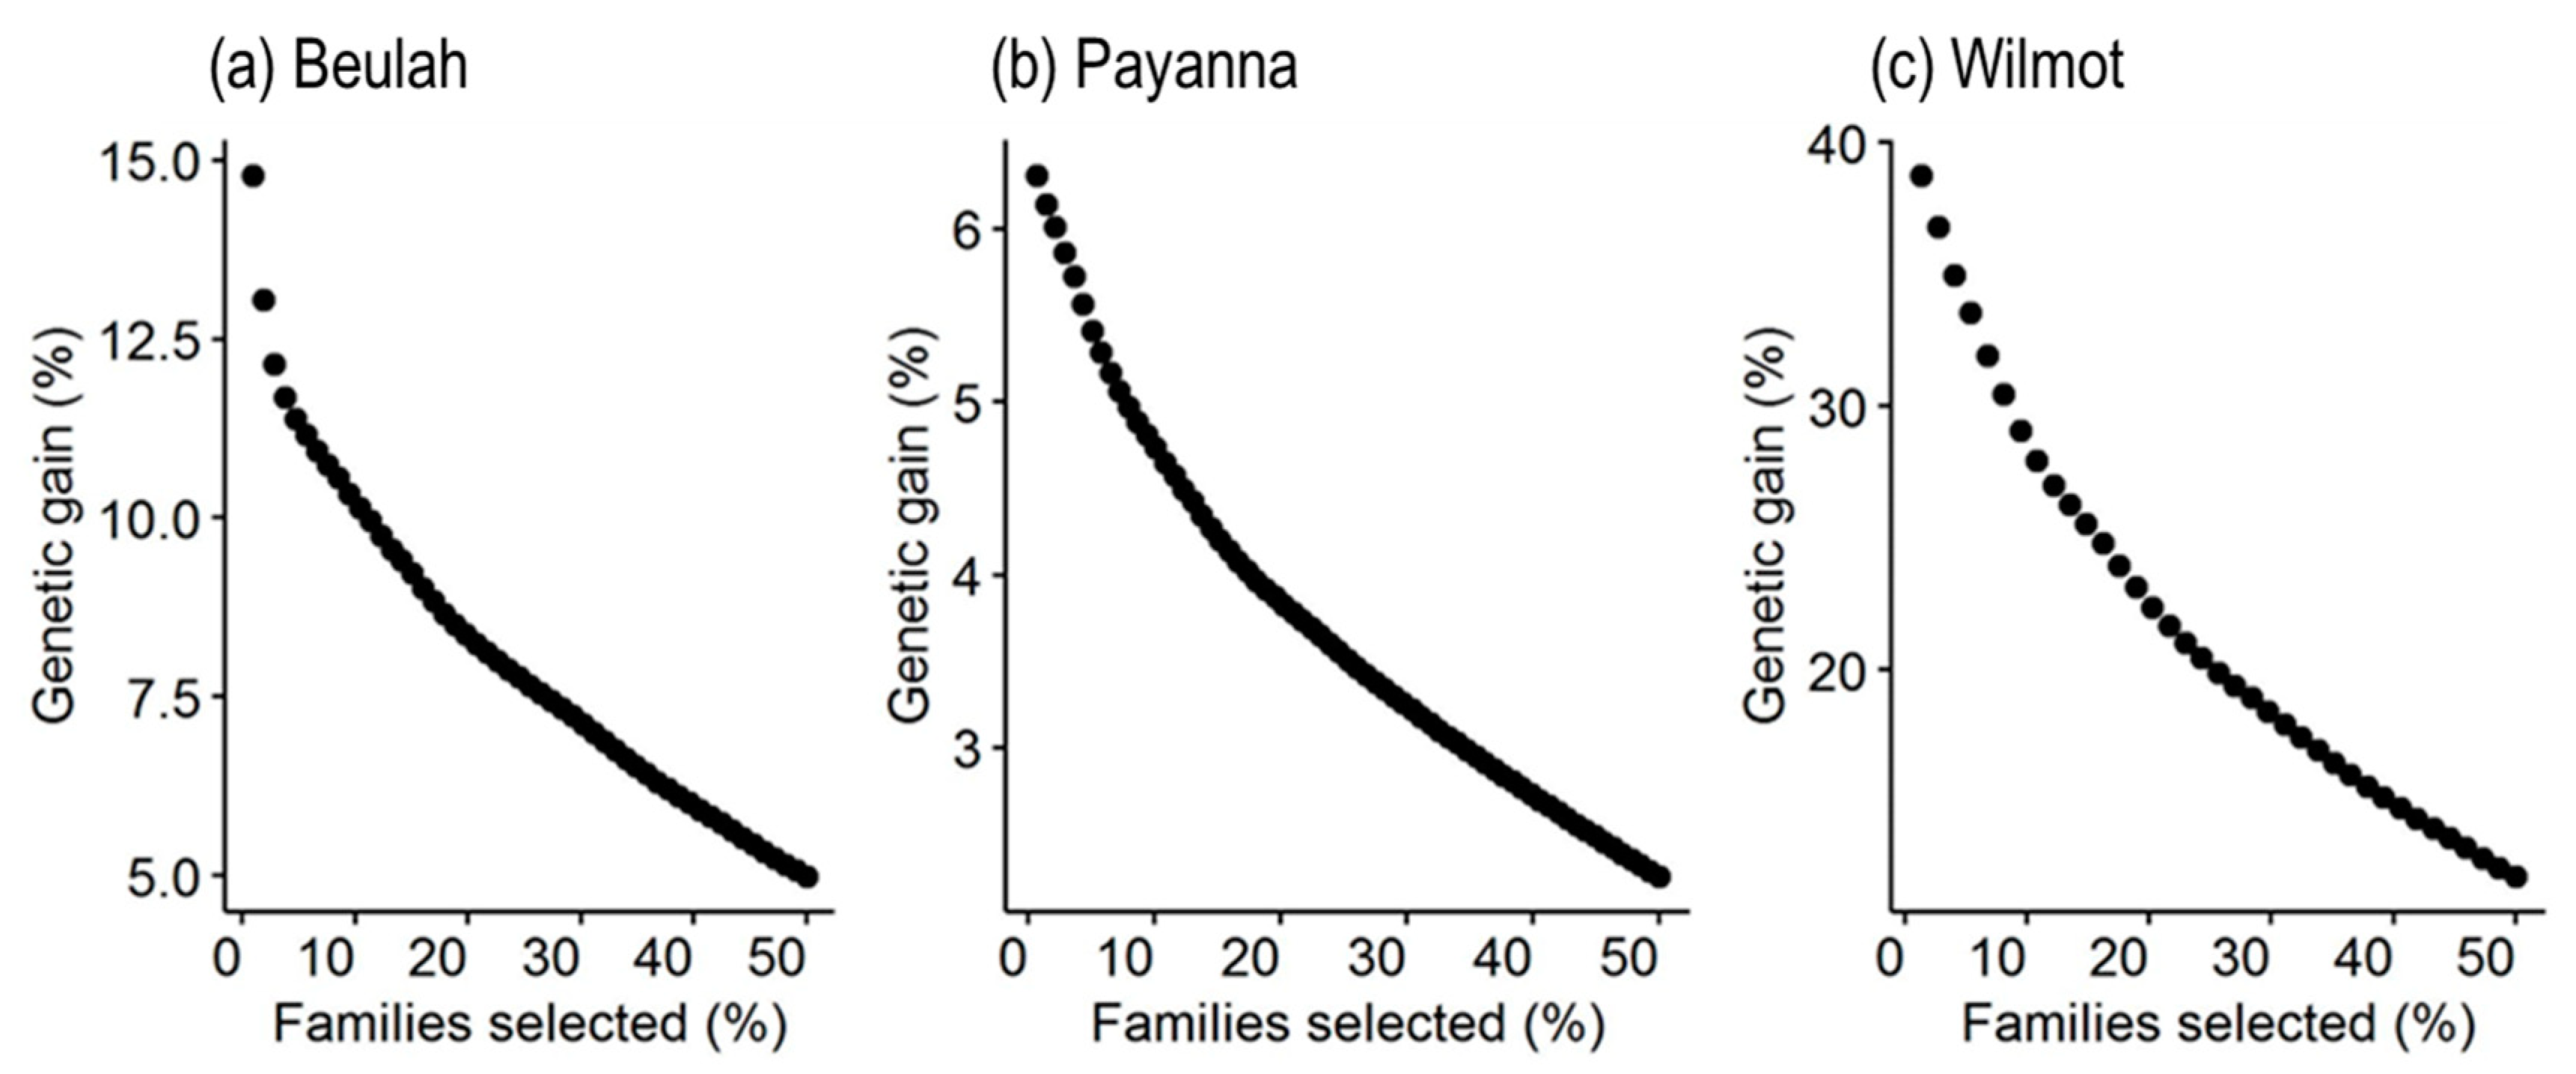
3.6. Estimation of Genetic Gain

Depending on the number of families selected, an up to 37% reduction in bark stripping was predicted to be achievable based on family selection using their best linear unbiased predictions (BLUPs) (Figure 4). However, selecting 20% of the least susceptible families in each trial resulted in an expected gain in the reduction in bark stripping of 7.9% at Beulah, 3.8% at Payanna, and 22.1% at Wilmot. The highest predicted genetic gain was from family selection in the younger, full-sib progeny at the Wilmot trial. The half sib-OP families at Payanna and Beulah gave relatively low genetic gain predictions.

4. Discussion

Using three field-based genetic trials established with a large number of Pinus radiata families, we show the existence of additive genetic variation in susceptibility to bark stripping damage by marsupial herbivores, which, when well-expressed, appears relatively stable across sites. Plantation age, bark features, and the presence of needles or branches covering the stem were important correlates with the amount of bark removed from the trees by the marsupials. Importantly, these physical traits are under significant additive genetic control and can thus also be enhanced through selection. An up to 22.1% reduction in bark stripping can be achieved by selecting 20% of the less susceptible families, although the stability of the less susceptible families, when planted separately, needs further testing. This is the first study, to our knowledge, to demonstrate genetic gain through the selection of families less susceptible to bark stripping.
The estimated narrow-sense heritability of bark stripping (0.06 to 0.14) was within the lower range of what has been reported for the damage of conifer bark from insect herbivores (0.02–0.40) [12,13,23,65,66,67]. Similarly, it is in the lower range of the narrow-sense heritabilities reported for resistance to needle pathogens (h2 = 0.05 to 0.69) in Australian P. radiata plantations [18]. Estimates were also markedly lower than what has been reported for mammalian browsing on the needles of Pseudotsuga menziesii Mirb. (h2 = 0.73) [29]. Since P. radiata has not coevolved with the marsupials and animals have generally had a relatively minor impact on the natural P. radiata stands in California, its place of origin, the presence of genetic variation could be a by-product of variation in resistance traits to other native biotic threats.
Within a particular site, the results indicated the stability of genetic variation in damage across different years depicted by the high positive genetic correlation of the damage between years. This may show that the families damaged in one year are consistently damaged in the subsequent year or this may be an effect of confounding damage from the previous year, as the subsequent scores included old damage. However, the plant traits that correlate with bark stripping are likely to change with age, as depicted by the marked increase in trees developing rough bark between 4 and 5 years in the older trials. In this case, the changes in rough bark are relatively consistent among the families for each year, but the stability of the genetic signal for bark stripping between periods of contrasting developmental stages (for example, at 2 years before rough bark development vs. 5 years) is unknown. In the different years, the genetic estimates are likely to be in part influenced by the amount of bark stripping. For most biotic stresses, the differentiation between susceptibility categories becomes clearer with the increase in damage intensity, since high damage levels reduce the possibility of random escape from damage [12,40,68,69]. However, cumulative damage estimates are contingent upon the survival of the trees and the rate of bark recovery after the initial damage. At the Wilmot site, for example, the cumulative bark stripping was lower possibly due to the faster recovery of the younger trees with low damage. The threshold damage to enable the differentiation of the genotypes is not known, since susceptible individuals may appear resistant if they are located in areas of low bark stripping intensity, and conversely the resistance in less susceptible genotypes can be overcome in regions of high-intensity damage. Therefore, to correctly identify less susceptible genotypes, selected families should be tested in areas of high bark stripping intensity to determine whether extreme browsing intensity does not lead to the browsing of resistant families.
When genetic variation is well expressed (age 5 years), the bark stripping in Beulah and Payanna was strongly genetically correlated, signaling low G×E and reflecting the fact that the genes influencing bark stripping and their expression are similar in different environments. Indeed, this is consistent with the negative genetic correlation between fifth year bark stripping and rough bark height in both trials, suggesting an underlying common mechanism. In this case, the relative resistance of different families was not dependent on the environment, so the families that received relatively less bark stripping in Payanna were less bark-stripped in Beulah. Studies have shown strong positive genetic correlations between trials for damage by insect herbivores in P. radiata [41] and in spruce [12,26,70], even when the pest was at a low density [26]. However, in the present case the high genetic correlations for bark stripping were only true for trials of the same age that had similar physical features to deter bark stripping (e.g., well-developed rough bark), and the extent to which G×E is affected when the families are at different development stages needs to be tested.
This study provides evidence that physical traits play a role in moderating bark stripping preferences in the field. The role of the physical traits appears to vary depending on the age of the trees. In older trees (>3 years), the physical traits of the bark (i.e., thick and rough bark) may offer protection against bark stripping. In the younger trees < 3 years, because the bark features are not well developed the presence of obstructive needles and low branches are a significant explanatory factor. In P. radiata, bark thickness is positively correlated with age, height, and DBH [71]. The negative association of bark stripping with rough bark development in P. radiata has been previously noted [6]. Studies in other conifers have also indicated the importance of rough and thick bark [72,73,74,75] and other physical features, such as obstructive branches on the stem [74], in deterring mammalian herbivores. Thick bark may be difficult to detach but has also been associated with a high density of resin canals and gritty-textured sclereids [76,77]. These traits often occur simultaneously, but the relative importance of each trait is not known. In contrast to the negative association observed for mammal damage, damage by insects has been positively correlated with rough bark in conifer species [78], which highlights that resistance strategies may be herbivore-specific. Rough bark supports wood-boring insects, as the fissures are a safe place for oviposition or protection from natural enemies and environmental extremes. It is possible that these organisms may distract bark stripping mammals which could further contribute to reducing susceptibility. The bark features were genetically variable, with possibly no genetic constraints to their selection indicated by the tendency for positive genetic correlations among these traits. Similarly, the bark features showed a low G×E interaction, and this may in part explain the low G×E for bark stripping.
Height was also genetically correlated with bark stripping, although the trend contrasted in the trials of different ages. In the young population (Wilmot), the herbivores appeared to be attracted to faster growing trees, in contrast to the two older plantations where faster growing trees were less damaged. A comparison of the relative size of trees damaged by insect and mammalian herbivores in other P. radiata studies [79] and in other conifer [13,67,70] and non-conifer [80] species suggests that trees most often damaged are those which are larger, dominant and growing most rapidly. Damage to larger trees has been correlated with high sap volume, phloem thickness, and sap sweetness [81]. Additionally, faster growing trees have been reported to invest less in defense [82]. In young trees, bigger trees possibly give more bark per unit stripping than smaller trees and could possibly produce more sugars. In contrast, the results showed that in older conifer plantations animals prefer smaller trees, possibly with less developed bark features, as evidenced by the positive genetic and phenotypic correlation between rough bark or bark thickness with height and DBH. It is also possible, however, that the smaller trees have remained thin as a result of consecutive bark stripping, depicted from the strong negative correlation of initial bark stripping with later DBH. The selectivity of smaller trees by bark stripping mammals is common in mature conifer plantations [72,74,83].
It has also been suggested that fast growing trees should be able to recover more quickly than slow growing trees [84], an aspect of tolerance. In this study, tolerance may be indicated by the positive correlation between early bark stripping and later height. Heritable variation in tolerance against mammalian and insect herbivory has been observed in other Pinus spp [85,86], where trees appear not to employ resistance strategies but counter the effects of the browsing through compensatory growth. For commercial P. radiata plantations intended for timber production, tolerance will be less desirable, since bark stripping exposes tissues to fungal attack with subsequent rotting, which may reduce timber quality [30]. In contrast with height, there was a negative genetic correlation between early bark stripping and later diameter, suggesting that heavily damaged trees were putting on less volume than the less damaged families. However, the presence of residual variation, which could not be explained by physical or growth traits, suggests the possible involvement of chemical features in driving differences in bark stripping. This is yet to be tested.
While the capturing of genetic gain in reduced bark stripping could be achieved by cloning selected trees based on their breeding or deployment values, this would require rejuvenation, vegetative propagation, and subsequent clonal testing [87], which will have a long time lag. Given that the families are derived from seed orchard parents, the rapid deployment of families of low susceptibility to bark stripping is an obvious path to rapidly capture genetic gain from the current trials. However, the predicted genetic gains from such backward family selection assumes that the family ranking for bark stripping do not change in different environments, as this study suggests. In this case, the genetic gain for reducing susceptibility to bark stripping is estimated to be between 3.8% and 22.1% when 20% of the most resistant families are selected for deployment. This is in the genetic gain range that has been estimated for herbivory in conifers [29]. In Pseudotsuga menziesii, based on selecting 10% of the most resistant families against deer browsing, genetic gain was estimated at 11% [29]. Similarly, against the pine weevil in Picea abies H. Karst. genetic gain varied between 8% and 50% [12]. However, the genetic gain will be influenced by the proportion of the less susceptible families selected and applies to current field setting. Whether or not the less susceptible families retain their rank when grown separately needs to be tested. According to the associational resistance theory, resistant plants may appear more resistant in the presence of a more susceptible plant that can easily be eaten by the animals [88]. If the marsupials use the bark as a supplementary rather than an alternative feed, as suggested by Smith, Ratkowsky [49], the damage in monocultures may persist. Alternatively, deploying more resistant P. radiata plants may shift the browsing pressure onto other more susceptible non-plantation species in the coupe [49], which could have additional positive effects by reducing interspecific plant competition with the P. radiata [89].

5. Conclusions

This paper illustrates that variation in bark stripping is under low but significant additive genetic control and, when well expressed, the genetic signal appears to be relatively stable across different environments. This provides an opportunity for selection for reduced susceptibility with potential genetic gains for deployment and breeding. Based on phenotypic and genetic correlations, several physical plant traits were identified as being likely to contribute to the variation in bark stripping. Initial variation in damage may be affected directly by plant size and accessibility, but later factors such as bark thickness and bark texture become important. The presence of unexplained genetic variation after accounting for these physical factors suggests that other characteristics, such as endogenous chemicals, may also be involved in explaining the variation in the bark stripping of P. radiata.

Supplementary Materials

The following are available online at https://www.mdpi.com/1999-4907/11/12/1356/s1: Figure S1: Heat maps of bark stripping scores from the three field sites based on assessments for year 5 (2016) at Beulah and Payanna and for year 2 (2017) at Wilmot, Figure S2: Semivariograms of the residuals generated from the spatial models showing the small-scale spatial variation in bark stripping (above) and height (below) for (a) Beulah, (b) Payanna. and (c) Wilmot after adjusting for random genetic, replicate. and incomplete blocks within replicate effects using mixed models. If spatial dependence is present, semivariance will be small at short distances, will increase at intermediate distances, and will reach an asymptote at longer distances. Estimates are based on assessments at year 5 (2016) at Beulah and Payanna and at year 2 (2017) for Wilmot, except for the height variogram for Payanna that used the year 4 height, since only one height measurement was taken for this trial.

Author Contributions

Funding acquisition and conceptualization: J.M.O.-W., B.M.P., H.D., D.A., and S.E.; Project administration and supervision: J.M.O.-W. and B.M.P.; Investigation: J.S.N., H.F., and J.N.; Data curation and analysis: J.S.N., J.M.O.-W., and B.M.P.; original draft preparation: J.S.N.; Writing, review and editing: J.S.N., J.M.O.-W., B.M.P., H.F., J.N., H.D., D.A., and S.E.; Management of field trials: D.A. All authors have read and agreed to the published version of the manuscript.

Funding

Funding for this project was under Australian Research Council (ARC) Linkage Grant LP140100602 and the Scion MBIE Strategic Science Investment Fund, contract number C04X1703.

Acknowledgments

We thank the Radiata Pine Breeding Company for the provision of genetic material. Judith Ssali Nantongo also acknowledges the receipt of a Tasmania Graduate Research Scholarship.

Conflicts of Interest

The authors declare no conflict of interest.

References

  1. Schowalter, T.D. Insect Ecology: An Ecosystem Approach, 4th ed.; Academic Press: Cambridge, MA, USA, 2006; p. 762. [Google Scholar]
  2. Ward, A.I.; White, P.C.L.; Smith, A.; Critchley, C.H. Modelling the cost of roe deer browsing damage to forestry. For. Ecol. Manag. 2004, 191, 301–310. [Google Scholar] [CrossRef]
  3. Kimball, B.A.; Pfund, F.; Gourley, M.; Griffin, D.L.; Russell, J.H. Silvicultural Attempts to Induce Browse Resistance in Conifer Seedlings. Int. J. For. Res. 2011, 2011, 1–7. [Google Scholar] [CrossRef] [Green Version]
  4. Nichols, C.P.; Drewe, J.A.; Gill, R.; Goode, N.; Gregory, N. A novel causal mechanism for grey squirrel bark stripping: The Calcium Hypothesis. For. Ecol. Manag. 2016, 367, 12–20. [Google Scholar] [CrossRef]
  5. Telford, A.; Cavers, S.; Ennos, R.A.; Cottrell, J.E. Can we protect forests by harnessing variation in resistance to pests and pathogens? Forestry 2014, 88, 3–12. [Google Scholar] [CrossRef] [Green Version]
  6. Miller, A.; O’Reilly-Wapstra, J.; Potts, B. Genetic Variation in Bark Stripping among Pinus radiata; National Centre for Future Forest Industries: Hobart, Australia, 2014; p. 30. [Google Scholar]
  7. Zas, R.; Björklund, N.; Nordlander, G.; Cendán, C.; Hellqvist, C.; Sampedro, L. Exploiting jasmonate-induced responses for field protection of conifer seedlings against a major forest pest, Hylobius abietis. For. Ecol. Manag. 2014, 313, 212–223. [Google Scholar] [CrossRef] [Green Version]
  8. Ehrlich, P.R.; Raven, P.H. butterflies and plants: A study in coevolution. Evolution 1964, 18, 586–608. [Google Scholar] [CrossRef]
  9. Maron, J.L.; Agrawal, A.A.; Schemske, D.W. Plant–herbivore coevolution and plant speciation. Ecology 2019, 100, e02704. [Google Scholar] [CrossRef]
  10. Falconer, D.S.; Mackay, T.F.C. Introduction to Quantitative Genetics, 4th ed.; Prentice Hall: Harlow, UK, 1996; p. 464. [Google Scholar]
  11. White, T.W.; Adams, W.T.; Neale, D.B. Forest Genetics; CABI Publishing: Cambridge, MA, USA, 2007; p. 704. [Google Scholar]
  12. Zas, R.; Björklund, N.; Sampedro, L.; Hellqvist, C.; Karlsson, B.; Jansson, S.; Nordlander, G. Genetic variation in resistance of Norway spruce seedlings to damage by the pine weevil Hylobius abietis. Tree Genet. Genomes 2017, 13, 111. [Google Scholar] [CrossRef] [Green Version]
  13. Zas, R.; Sampedro, L.; Prada, E.; Fernández-López, J. Genetic variation of Pinus pinaster Ait. seedlings in susceptibility to the pine weevil Hylobius abietis L. Ann. For. Sci. 2005, 62, 681–688. [Google Scholar] [CrossRef] [Green Version]
  14. O’Reilly-Wapstra, J.M.; Iason, G.R.; Fitzsimmons-Thoss, V. The role of genetic and chemical variation of Pinus sylvestris seedlings in influencing slug herbivory. Oecologia 2006, 152, 82–91. [Google Scholar] [CrossRef]
  15. Wise, M.J.; Rausher, M.D. Evolution of resistance to a multiple-herbivore community: Genetic correlations, diffuse coevolution, and constraints on the plant’s response to selection. Evolution 2013, 67, 1767–1779. [Google Scholar] [CrossRef] [PubMed]
  16. O’Reilly-Wapstra, J.M.; Potts, B.M.; McArthur, C.; Davies, N.W. Effects of nutrient variability on the genetic-based resistance of Eucalyptus globulus to a mammalian herbivore and on plant defensive chemistry. Oecologia 2004, 142, 597–605. [Google Scholar] [CrossRef] [PubMed]
  17. Klápště, J.; Meason, D.F.; Dungey, H.S.; Telfer, E.J.; Silcock, P.; Rapley, S. Genotype-by-environment interaction in coast redwood outside natural distribution—Search for environmental cues. BMC Genet. 2020, 21, 15. [Google Scholar] [CrossRef] [PubMed] [Green Version]
  18. Li, Y.; Dungey, H.S.; Carson, M.; Carson, S. Genotype by environment interaction for growth and Dothistroma resistance and clonal connectivity between environments in radiata pine in New Zealand and Australia. PLoS ONE 2018, 13, e0205402. [Google Scholar] [CrossRef]
  19. Sampedro, L.; Moreira, X.; Zas, R. Costs of constitutive and herbivore-induced chemical defences in pine trees emerge only under low nutrient availability. J. Ecol. 2011, 99, 818–827. [Google Scholar] [CrossRef] [Green Version]
  20. Barton, K.E.; Koricheva, J. The Ontogeny of Plant Defense and Herbivory: Characterizing General Patterns Using Meta-Analysis. Am. Nat. 2010, 175, 481–493. [Google Scholar] [CrossRef] [Green Version]
  21. Lawrence, R.; Potts, B.M.; Whitham, T.G. Relative importance of plant ontogeny, host genetic variation, and leaf age for a common herbivore. Ecology 2003, 84, 1171–1178. [Google Scholar] [CrossRef]
  22. Russell, J. Deployment of deer-resistant western redcedar (Thuja plicata). In National Proceedings: Forest and Conservation Nursery Associations—2007; Dumroese, R.K., Riley, L.E., Eds.; U.S. Department of Agriculture, Forest Service, Rocky Mountain Research Station: Fort Collins, CO, USA, 2008; pp. 149–153. [Google Scholar]
  23. Moreira, X.; Zas, R.; Sampedro, L. Additive genetic variation in resistance traits of an exotic pine species: Little evidence for constraints on evolution of resistance against native herbivores. Heredity 2013, 110, 449–456. [Google Scholar] [CrossRef] [Green Version]
  24. Raffa, K.F.; Smalley, E.B. Interaction of pre-attack and induced monoterpene concentrations in host conifer defense against bark beetle-fungal complexes. Oecologia 1995, 102, 285–295. [Google Scholar] [CrossRef]
  25. Wainhouse, D.; Staley, J.T.; Jinks, R.; Morgan, G. Growth and defence in young pine and spruce and the expression of resistance to a stem-feeding weevil. Oecologia 2008, 158, 641–650. [Google Scholar] [CrossRef]
  26. Alfaro, R.I.; King, J.N.; Brown, R.; Buddingh, S.M. Screening of Sitka spruce genotypes for resistance to the white pine weevil using artificial infestations. For. Ecol. Manag. 2008, 255, 1749–1758. [Google Scholar] [CrossRef]
  27. Dimock, E.J., II; Silen, R.R.; Allen, V.E. Genetic resistance in Douglas-fir to damage by snowshoe hare and black-tailed deer. For. Sci. 1976, 22, 106–121. [Google Scholar]
  28. Duncan, A.J.; Hartley, S.E.; Thurlow, M.; Young, S.; Staines, B.W. Clonal variation in monoterpene concentrations in Sitka spruce (Picea sitchensis) saplings and its effect on their susceptibility to browsing damage by red deer (Cervus elaphus). For. Ecol. Manag. 2001, 148, 259–269. [Google Scholar] [CrossRef]
  29. Silen, R.R.; Randall, W.K.; Mandel, N.L. Estimates of genetic parameters for deer browsing of Douglas-fir. For. Sci. 1986, 32, 178–184. [Google Scholar]
  30. Cukor, J.; Vacek, Z.; Linda, R.; Vacek, S.; Marada, P.; Šimůnek, V.; Havránek, F. Effects of Bark Stripping on Timber Production and Structure of Norway Spruce Forests in Relation to Climatic Factors. Forests 2019, 10, 320. [Google Scholar] [CrossRef] [Green Version]
  31. Iijima, H.; Nagaike, T. Susceptible conditions for debarking by deer in subalpine coniferous forests in central Japan. For. Ecosyst. 2015, 2, 33. [Google Scholar] [CrossRef] [Green Version]
  32. Welch, D.; Scott, D. Bark-stripping damage by red deer in a Sitka spruce forest in western Scotland IV. Survival and performance of wounded trees. Forestry 1998, 71, 225–235. [Google Scholar] [CrossRef] [Green Version]
  33. Moreira, X.; Zas, R.; Sampedro, L. Differential Allocation of Constitutive and Induced Chemical Defenses in Pine Tree Juveniles: A Test of the Optimal Defense Theory. PLoS ONE 2012, 7, e34006. [Google Scholar] [CrossRef] [Green Version]
  34. Moreira, X.; Lundborg, L.; Zas, R.; Carrillo-Gavilán, A.; Borg-Karlson, A.-K.; Sampedro, L. Inducibility of chemical defences by two chewing insect herbivores in pine trees is specific to targeted plant tissue, particular herbivore and defensive trait. Phytochemistry 2013, 94, 113–122. [Google Scholar] [CrossRef] [Green Version]
  35. Iason, G.R.; O’Reilly-Wapstra, J.M.; Brewer, M.J.; Summers, R.W.; Moore, B.D. Do multiple herbivores maintain chemical diversity of Scots pine monoterpenes? Philos. Trans. R. Soc. B Biol. Sci. 2011, 366, 1337–1345. [Google Scholar] [CrossRef]
  36. Eldridge, K.G. Seed Collections of Pinus radiata and P. muricata in California. In Forest Genetic Resources Information; FAO: Canberra, Australia, 1979; pp. 44–45. [Google Scholar]
  37. Mead, D.J. Sustainable Management of Pinus radiata Plantations; Food and Agriculture Organization of the United Nations (FAO): Rome, Italy, 2013; p. 246. [Google Scholar]
  38. ABARES. Australia’s State of the Forests Report; Australian Government Department of Agriculture and Water Resources: Canberra, Australia, 2018; p. 56. [Google Scholar]
  39. Wu, H.X.; Eldridge, K.G.; Matheson, A.C.; Powell, M.P.; McRae, T.A. Successful introduction and breeding of radiata pine to Australia. In Growing Forest Values, Proceedings of ANZIF 2007 Conference, Coffs Harbour, NSW, Australia, 3–7 June 2007; Institute of Foresters of Australia and New Zealand Institute of Forestry: Canberra, Australia, 2007; pp. 506–517. [Google Scholar]
  40. Dungey, H.S.; Brawner, J.T.; Burger, F.; Carson, M.; Henson, M.; Jefferson, P.; Matheson, A.C. A New Breeding Strategy for Pinus radiata in New Zealand and New South Wales. Silvae Genet. 2009, 58, 28–38. [Google Scholar] [CrossRef] [Green Version]
  41. Sasse, J.; Elms, S.; Kube, P. Genetic resistance in Pinus radiata to defoliation by the pine aphid Essigella californica. Aust. For. 2009, 72, 25–31. [Google Scholar] [CrossRef]
  42. Ivković, M.; Baltunis, B.; Gapare, W.; Sasse, J.; Dutkowski, G.; Elms, S.; Wu, H. Breeding against dothistroma needle blight of radiata pine in Australia. Can. J. For. Res. 2010, 40, 1653–1660. [Google Scholar] [CrossRef]
  43. Graham, N.J.; Suontama, M.; Pleasants, T.; Li, Y.; Bader, M.K.-F.; Klápště, J.; Dungey, H.S.; Williams, N.M. Assessing the genetic variation of tolerance to red needle cast in a Pinus radiata breeding population. Tree Genet. Genomes 2018, 14, 55. [Google Scholar] [CrossRef] [Green Version]
  44. Suontama, M.; Li, Y.; Low, C.B.; Dungey, H.S. Genetic improvement of resistance to cyclaneusma needle cast in Pinus radiata. Can. J. For. Res. 2019, 49, 128–133. [Google Scholar] [CrossRef]
  45. Downham, R.; Gavran, M. Australian Plantation Statistics 2018 Update; Australian Government Department of Agriculture and Water Resources: Canberra, Australia, 2018. [Google Scholar]
  46. Page, D.E.; Close, D.C.; Beadle, C.L.; Wardlaw, T.J.; Mohammed, C. Seasonal dynamics in understorey abundance and carbohydrate concentration in relation to browsing and bark stripping of Tasmanian Pinus radiata plantations. For. Ecol. Manag. 2013, 296, 98–107. [Google Scholar] [CrossRef]
  47. Department of Primary Industries Parks Water and Environment. A Planning Toolkit for Managing Browsing and Grazing Losses from Wallabies and Brushtail Possums on Farms in Tasmania; Tasmanian Government: Launceston, Tasmania, 2018. [Google Scholar]
  48. Bannister, M.H. An early progeny trial in Pinus radiata 1. Juvenile characters. N. Z. J. Bot. 1969, 7, 316–335. [Google Scholar] [CrossRef]
  49. Smith, A.H.; Ratkowsky, D.A.; Wardlaw, T.J.; Mohammed, C. Ease of Access to An Alternative Food Source Enables Wallabies to Strip Bark in Tasmanian Pinus radiata Plantations. Forests 2020, 11, 387. [Google Scholar] [CrossRef] [Green Version]
  50. Department of Primary Industries Parks Water and Environment. Annual State-Wide Spotlight Surveys, Tasmania 2018/19: Regional Summary: Priority Harvested Species; Tasmanian Government: Habart, Australia, 2019. [Google Scholar]
  51. Butler, D.G.; Cullis, B.R.; Gilmour, A.R.; Gogel, B.J. ASReml-R Reference Manual; Queensland Government Department of Primary Industries and Fisheries: Brisbane, Australia, 2009; p. 149. [Google Scholar]
  52. Costa e Silva, J.; Dutkowski, G.W.; Gilmour, A.R. Analysis of Early Tree Height in Forest Genetic Trials Is Enhanced by Including a Spatially Correlated Residual. Can. J. For. Res. 2001, 31, 1887–1893. [Google Scholar] [CrossRef]
  53. Dungey, H.S.; Williams, N.M.; Low, C.B.; Stovold, G.T. First evidence of genetic-based tolerance to red needle cast caused by Phytophthora pluvialis in radiata pine. N. Z. J. For. Sci. 2014, 44, 31. [Google Scholar] [CrossRef] [Green Version]
  54. Isik, F.; Holland, J.; Maltecca, C. Genetic Data Analysis for Plant and Animal Breeding; Springer International: Cham, Switzerland, 2007; p. 400. [Google Scholar]
  55. Zas, R.; Solla, A.; Sampedro, L. Variography and kriging allow screening Pinus pinaster resistant to Armillaria ostoyae in field conditions. Forestry 2007, 80, 201–209. [Google Scholar] [CrossRef] [Green Version]
  56. Cappa, E.P.; Muñoz, F.; Sanchez, L. Performance of alternative spatial models in empirical Douglas-fir and simulated datasets. Ann. For. Sci. 2019, 76, 53. [Google Scholar] [CrossRef]
  57. Dutkowski, G.W.; Silva, J.C.E.; Gilmour, A.R.; Wellendorf, H.; Aguiar, A. Spatial analysis enhances modelling of a wide variety of traits in forest genetic trials. Can. J. For. Res. 2006, 36, 1851–1870. [Google Scholar] [CrossRef]
  58. Dungey, H.S.; Russell, J.H.; Silva, J.C.E.; Low, C.B.; Miller, M.A.; Fleet, K.R.; Stovold, G.T. The effectiveness of cloning for the genetic improvement of Mexican white cypress Cupressus lusitanica (Mill.). Tree Genet. Genomes 2012, 9, 443–453. [Google Scholar] [CrossRef]
  59. R Core Team. R: A Language and Environment for Statistical Computing; R Foundation for Statistical Computing: Vienna, Austria, 2018. [Google Scholar]
  60. Haskard, K.A.; Cullis, B.R.; Verbyla, A.P. Anisotropic matern correlation and spatial prediction using REML. J. Agric. Biol. Environ. Stat. 2007, 2, 147–160. [Google Scholar] [CrossRef] [Green Version]
  61. Burnham, K.P.; Anderson, D.R. Multimodel inference: Understanding AIC and BIC in model selection. Sociol. Methods Res. 2004, 33, 261–304. [Google Scholar] [CrossRef]
  62. Burdon, R.D. Genetic correlation as a concept for studying genotype-environment interaction in forest tree breeding. Silvae Genet. 1977, 26, 168–175. [Google Scholar]
  63. Yamada, Y. Genotype by environment interaction and genetic correlation of the same trait under different environments. Jpn. J. Genet. 1962, 37, 498–509. [Google Scholar] [CrossRef] [Green Version]
  64. Olausson, A.; Rönningen, K. Estimation of Genetic Parameters for Threshold Characters. Acta Agric. Scand. 1975, 25, 201–208. [Google Scholar] [CrossRef]
  65. De la Mata, R.; Hood, S.M.; Sala, A. Insect outbreak shifts the direction of selection from fast to slow growth rates in the long-lived conifer Pinus ponderosa. Proc. Natl. Acad. Sci. USA 2017, 114, 7391–7396. [Google Scholar] [CrossRef] [Green Version]
  66. Yanchuk, A.; Murphy, J.C.; Wallin, K.F. Evaluation of genetic variation of attack and resistance in lodgepole pine in the early stages of a mountain pine beetle outbreak. Tree Genet. Genomes 2008, 4, 171–180. [Google Scholar] [CrossRef]
  67. King, J.N.; Yanchuk, A.D.; Kiss, G.K.; Alfaro, R.I. Genetic and phenotypic relationships between weevil (Pissodes strobi) resistance and height growth in spruce populations of British Columbia. Can. J. For. Res. 1997, 27, 732–739. [Google Scholar] [CrossRef]
  68. King, J.N.; Alfaro, R.I. Developing Sitka Spruce Populations for Resistance to the White Pine Weevil: Summary of Research and Breeding Program; Ministry of Forests and Range: Victoria, BC, Canada, 2009. [Google Scholar]
  69. Dieters, M.J.; Hodge, G.R.; White, T.L. Genetic parameter estimates for resistance to rust (Cronartium quercuum) infection from full-sib tests of slash pine (Pinus elliottii), modelled as functions of rust incidence. Silvae Genet. 1996, 45, 235–242. [Google Scholar]
  70. Mottet, M.-J.; Deblois, J.; Perron, M. High genetic variation and moderate to high values for genetic parameters of Picea abies resistance to Pissodes strobi. Tree Genet. Genomes 2015, 11, 58. [Google Scholar] [CrossRef]
  71. Murphy, G.E.; Cown, D. Within-tree, between-tree, and geospatial variation in estimated Pinus radiata bark volume and weight in New Zealand. N. Z. J. For. Sci. 2015, 45, 18. [Google Scholar] [CrossRef] [Green Version]
  72. Jiang, Z.; Ueda, H.; Kitahara, M.; Imaki, H. Bark stripping by sika deer on veitch fir related to stand age, bark nutrition, and season in northern Mount Fuji district, central Japan. J. For. Res. 2005, 10, 359–365. [Google Scholar] [CrossRef]
  73. Nopp-Mayr, U.; Reimoser, F.; Voelk, F. Predisposition assessment of mountainous forests to bark peeling by red deer (Cervus elaphus L.) as a strategy in preventive forest habitat management. Wildl. Biol. Pract. 2011, 7, 66–89. [Google Scholar] [CrossRef]
  74. Månsson, J.; Jarnemo, A. Bark-stripping on Norway spruce by red deer in Sweden: Level of damage and relation to tree characteristics. Scand. J. For. Res. 2013, 28, 117–125. [Google Scholar] [CrossRef]
  75. Kuiters, A.T.; Van Der Sluijs, L.; Wytema, G. Selective bark-stripping of beech, Fagus sylvatica, by free-ranging horses. For. Ecol. Manag. 2006, 222, 1–8. [Google Scholar] [CrossRef]
  76. King, J.N.; Alfaro, R.I.; Lopez, M.G.; Van Akker, L. Resistance of Sitka spruce (Picea sitchensis (Bong.) Carr.) to white pine weevil (Pissodes strobi Peck): Characterizing the bark defence mechanisms of resistant populations. Forestry 2011, 84, 83–91. [Google Scholar] [CrossRef]
  77. Van Akker, L.; Alfaro, R.I.; Brockley, R. Effects of fertilization on resin canal defences and incidence of Pissodes strobi attack in interior spruce. Can. J. For. Res. 2004, 34, 855–862. [Google Scholar] [CrossRef] [Green Version]
  78. Ferrenberg, S.; Mitton, J.B. Smooth bark surfaces can defend trees against insect attack: Resurrecting a ‘slippery’ hypothesis. Funct. Ecol. 2014, 28, 837–845. [Google Scholar] [CrossRef]
  79. Zas, R.; Sampedro, L.; Moreira, X.; Martíns, P. Effect of fertilization and genetic variation on susceptibility of Pinus radiata seedlings to Hylobius abietis damage. Can. J. For. Res. 2008, 38, 63–72. [Google Scholar] [CrossRef] [Green Version]
  80. Mayle, B.A.; Proudfoot, J.; Poole, J. Influence of tree size and dominance on incidence of bark stripping by grey squirrels to oak and impact on tree growth. Forestry 2009, 82, 431–444. [Google Scholar] [CrossRef]
  81. Kenward, R.E.; Dutton, J.C.F.; Parish, T.; Doyle, F.I.B.; Walls, S.S.; Robertson, P.A. Damage by grey squirrels. I. Bark-stripping correlates and treatment. Q. J. For. 1996, 90, 135–142. [Google Scholar]
  82. Ferrenberg, S.; Kane, J.M.; Langenhan, J.M. To grow or defend? Pine seedlings grow less but induce more defences when a key resource is limited. Tree Physiol. 2015, 35, 107–111. [Google Scholar] [CrossRef] [Green Version]
  83. Akashi, N.; Terazawa, K. Bark stripping damage to conifer plantations in relation to the abundance of sika deer in Hokkaido, Japan. For. Ecol. Manag. 2005, 208, 77–83. [Google Scholar] [CrossRef]
  84. Gianoli, E.; Salgado-Luarte, C. Tolerance to herbivory and the resource availability hypothesis. Biol. Lett. 2017, 13, 20170120. [Google Scholar] [CrossRef] [Green Version]
  85. O’Reilly-Wapstra, J.M.; Moore, B.D.; Brewer, M.J.; Beaton, J.; Sim, D.; Wiggins, N.L.; Iason, G.R. Pinus sylvestris sapling growth and recovery from mammalian browsing. For. Ecol. Manag. 2014, 325, 18–25. [Google Scholar] [CrossRef]
  86. Zas, R.; Moreira, X.; Sampedro, L. Tolerance and induced resistance in a native and an exotic pine species: Relevant traits for invasion ecology. J. Ecol. 2011, 99, 1316–1326. [Google Scholar] [CrossRef] [Green Version]
  87. Lush, J.L. Family Merit and Individual Merit as Bases for Selection. Part I. Am. Nat. 1947, 81, 241–261. [Google Scholar] [CrossRef]
  88. Barbosa, P.; Hines, J.; Kaplan, I.; Martinson, H.; Szczepaniec, A.; Szendrei, Z. Associational Resistance and Associational Susceptibility: Having Right or Wrong Neighbors. Annu. Rev. Ecol. Evol. Syst. 2009, 40, 1–20. [Google Scholar] [CrossRef] [Green Version]
  89. Watt, M.S.; Whitehead, D.; Mason, E.G.; Richardson, B.; Kimberley, M.O. The influence of weed competition for light and water on growth and dry matter partitioning of young Pinus radiata, at a dryland site. For. Ecol. Manag. 2003, 183, 363–376. [Google Scholar] [CrossRef]
Figure 1. A map of Australia showing the location of Tasmania and the location of the three Pinus radiata family trials within Tasmania: P = Payanna; B= Beulah; and W = Wilmot.
Forests 11 01356 g001
Figure 2. Smooth (left) and rough bark (right) of 4-year-old Pinus radiata.
Forests 11 01356 g002
Figure 3. The percentage of trees in each bark stripping category at the three field trials—Beulah (in 2016, age 5 years), Payanna (in 2016, age 5 years), and Wilmot (in 2017, age 2 years).
Forests 11 01356 g003
Figure 4. Predicted genetic gain (%) in reduction in the average amount of bark stripping as a function of the proportion of families selected in the different sites. Estimates are based on bark stripping for year 5 (2016) at (a) Beulah and (b) Payanna and at year 2 (2017) for (c) Wilmot.
Forests 11 01356 g004
Table 1. Details of the three Pinus radiata genetic trials used for the study indicating the location and date of planting as well as the trial design, pedigree information, and assessment information. All trials were replicated in a randomized incomplete block design, with open-pollinated (OP) or cross-pollinated (CP) families represented as single tree plots within each block. For each trial, the number of replicates and incomplete blocks as well as the families, parents, grandparents, and total number of trees are indicated. The total number of trees denotes the trees that were alive at the time of assessment. Selected traits (see results) were measured multiple times and the age at which the assessments were performed is shown.
Genetic TrialLatitude (°)Longitude (°)Elevation (m)Date PlantedReplicatesIncomplete BlocksFamiliesParentsGrand ParentsNumber of Trees AssessedTime of First Assessment
(Age Years)
Time of Second Assessment
(Age Years)
Time of Third Assessment
(Age Years)
Beulah41°.29′50.22° S146°.25′12.43° E33620112575101 (OP)10119420022015 (4 years)2016 (5 years)
Payanna41°.06′47.29° S147°.43′12.19° E17020112080138 (OP)13819526682015 (4 years)2016 (5 years)
Wilmot41°.27′14.83° S146°.06′35.30° E5802015267874 (CP)555413722017 (2 years)2018 (3 years)2020 (5 years)
Table 2. Statistics for each trait assessed at Beulah. SD = standard deviation; h2 (se) = narrow-sense heritability and its associated standard error estimated with univariate spatial models. The significance of the additive genetic variation and the spatial effect on the model are also presented. For the binary trait rough bark (marked *), + signifies that the parameter was important based on the Akaike Information Criteria. Genetic variation was not estimated (NE) for survival, since it was high for most families.
TraitYear AssessedAge of Trees (Years)Number of Trees AssessedMeanMinimumMaximumSDh2 (se)Significance of Additive Genetic VariationSignificance of Spatial Model
Bark stripping (%)20154195736.440.0075.0026.890.14 ± 0.05<0.001<0.001
Bark stripping (%)20165200240.080.0075.0026.550.13 ± 0.04<0.001<0.001
Height (cm)201542032391.1840.00707.0089.380.18 ± 0.05<0.001<0.001
Height (cm)201652002473.921.00807.00117.290.13 ± 0.05<0.001<0.001
DBH (cm)2016519758.671.0014.902.460.09 ± 0.04<0.05<0.001
Bark thickness (mm)2016513556.672.5013.501.260.10 ± 0.03<0.01<0.001
Rough bark *2016520020.420.001.000.490.09 ± 0.03−46.82 +−72.14 +
Rough bark height (cm)2016584747.882.00420.0063.211.00 ± 0.06<0.0010.372
Survival2016526990.720.001.000.45NENENE
Table 3. Statistics for each trait assessed at Payanna. SD = standard deviation; h2 (se) = narrow-sense heritability and its associated standard error estimated with univariate spatial models. The significance of the additive genetic variation and the spatial effect on the model are also presented. For the binary trait rough bark (marked *), + signifies that the parameter was important based on the Akaike Information Criteria. Genetic variation was not estimated (NE) for survival, since it was high for most families.
TraitYear AssessedAge (Years)Sample SizeMeanMinimumMaximumSDh2 (se)Significance of Additive Genetic VariationSignificance of Spatial Model
Bark stripping (%)2015426478.210.0075.0015.990.07 ± 0.03<0.050.270
Bark stripping (%)20165266816.770.0075.0021.210.14 ± 0.04<0.001<0.001
Height (cm)201542648573.92130.00827.0094.060.10 ± 0.04<0.001<0.001
DBH (cm)2016517277.903.0019.506.480.03 ± 0.000.205<0.001
Bark thickness (mm)2016517276.010.0016.001.780.11 ± 0.04<0.010<0.001
Rough bark *2016516940.770.001.000.420.07 ± 0.04−29.90 +−35.12 +
Rough bark height (cm)20165132793.545.00350.0060.260.53 ± 0.10<0.001<0.050
Survival2016527600.970.001.000.18NENENE
Table 4. Statistics for each trait assessed at Wilmot. SD = standard deviation; h2 (se) = narrow-sense heritability and its associated standard error estimated with univariate spatial models. The significance of the additive genetic variation and specific combining ability (SCA) and the spatial effect on the model are also presented. Genetic variation was not estimated (NE) for survival, since it was high for most families.
TraitYear AssessedAge (years)Sample SizeMeanMinimumMaximumSDh2 (se)Significance of Additive Genetic VariationSignificance of SCA EffectSignificance of Spatial Model
Bark stripping (%)20172137223.960.00100.0033.180.09 ± 0.03<0.001>0.05<0.001
Bark stripping (%)20183126922.500.00100.0025.100.06 ± 0.03<0.05>0.05<0.001
Bark strip height (cm)201727062.191.007.001.450.12 ± 0.04<0.001>0.05<0.001
Height (cm)201721372147.4010.00248.0033.510.07 ± 0.04<0.001>0.05<0.001
Height (cm)201831275231.0930.00382.0051.170.08 ± 0.04<0.001>0.05<0.001
Height (cm)202051230544.3340.00780.0099.080.11 ± 0.04<0.001>0.05<0.001
Basal diameter (cm)201721402.991.005.300.780.04 ± 0.05>0.05>0.05<0.001
DBH (cm)202051230103.405.00190.0042.970.03 ± 0.02<0.01>0.05<0.001
Stem access20172137149.490.00100.0026.260.09 ± 0.03<0.05>0.05<0.001
Survival2017213720.860.001.000.40NENENENE
Table 5. Across-site (Type-B) additive genetic correlations (ra) for each trait assessed in both Beulah and Payanna and the corresponding standard error (se). The two sister trials share 98 families and were the same age. The chi-square value (χ2) and the p-value that the genetic correlation is equal to zero (P[ra = 0]) are indicated. When significantly different from zero (p < 0.05), the significance of the genetic correlation from 1 (P[ra = 1]) is also presented. A “+” indicates that the difference of the genetic correlation for the binary rough bark from 0 or 1 was important based on the AIC.
Traitrase(ra)χ2[ra = 0]P[ra = 0]P[ra = 1]
Bark stripping (year 4)0.230.390.44>0.05
Bark stripping (year 5)0.760.2510.00<0.01<0.01
Height (year 4)0.910.3214.50<0.001<0.001
Rough bark (year 5)0.740.4223.80−10.72 +−22.53 +
Rough bark height (year 5)0.250.211.50>0.05
Bark thickness (year 5)0.530.852.70>0.05
Table 6. Phenotypic (above diagonal) and additive genetic Type A (below diagonal) correlations of traits assessed at the Beulah trial with the standard errors given in parentheses. The significance of the difference of the correlations from zero are indicated: *** = p < 0.001, ** = p < 0.01, * = p < 0.05. NA = not applicable, as only assessed on a specific cohort of individuals.
Bark Stripping
(Year 4)
Bark Stripping
(Year 5)
Height
(Year 4)
Height
(Year 5)
Bark Thickness
(Year 5)
DBH
(Year 5)
Rough Bark
(Year 5)
Rough Bark Height
(Year 5)
Bark stripping (year 4) 0.42 (0.02) ***−0.26 (0.02) ***−0.29 (0.02) ***−0.18 (0.02) ***−0.26 (0.02) ***−0.08 (0.02) ***−0.17 (0.03) ***
Bark stripping (year 5)0.78 (0.16) *** −0.32 (0.02) ***−0.40 (0.02) ***−0.25 (0.02) ***−0.42 (0.02) ***−0.25 (0.02) ***−0.25 (0.03) ***
Height (year 4)−0.19 (0.25)−0.09 (0.02) 0.86 (0.01) ***0.49 (0.02) ***0.79 (0.01) ***0.31 (0.02) ***0.13 (0.03) ***
Height (year 5)−0.09 (0.27)0.33 (0.34) 0.98 (0.04) *** 0.50 (0.02) ***0.80 (0.01) ***0.33 (0.02) ***0.10 (0.03) **
Bark thickness (year 5)−0.24 (0.28)−0.37 (0.29)0.24 (0.25)0.03 (0.33) 0.57 (0.02) ***0.34 (0.02) ***0.34 (0.03) ***
DBH (year 5)−0.26 (0.02)−0.04 (0.37)0.78 (0.12) *0.73 (0.15)0.40 (0.30) 0.33 (0.02) ***0.17 (0.03) ***
Rough bark (year 5)−0.27 (0.22)−0.25 (0.22)0.12 (0.21)−0.05 (0.24)0.31 (0.23)0.21 (0.27) NA
Rough bark height (year 5)−0.39 (0.27)−0.52 (0.26)0.02 (0.01)0.02 (0.018)0.10 (0.02)0.37 (0.09) *NA
Table 7. Phenotypic (above diagonal) and genetic Type A (below) correlations of the traits that were assessed in the Payanna trial with the standard errors given in parentheses. The significance of the difference of the correlations from zero are indicated: *** = p < 0.001, ** = p < 0.01, * = p < 0.05. NA = not applicable as only assessed on subset of individuals which had developed rough bark.
Bark Stripping
(Year 4)
Bark Stripping
(Year 5)
Height
(Year 4)
Bark Thickness
(Year 5)
DBH
(Year 5)
Rough Bark
(Year 5)
Rough Bark Height
(Year 5)
Bark stripping (year 4) 0.34 (0.02) ***−0.30 (0.02) ***−0.18 (0.02) ***0.01 (0.02)−0.12 (0.02) ***0.00 (0.02)
Bark stripping (year 5)0.91 (0.23) ** −0.28 (0.02) ***−0.21 (0.02) ***−0.11 (0.02) ***−0.29 (0.02) ***−0.17 (0.03) ***
Height (year 4)−0.12 (0.34)−0.20 (0.24) 0.36 (0.02) ***0.22 (0.06) ***0.23 (0.02) ***0.19 (0.03) ***
Bark thickness (year 5)−0.34 (0.51)−0.48 (0.22) *0.24 (0.27) −0.02 (0.02)0.26 (0.02) ***0.29 (0.03) ***
DBH (year 5)−0.34 (0.33)−0.40 (0.34)0.89 (0.27) **0.56 (0.42) 0.02 (0.02)0.32 (0.03) ***
Rough bark (year 5)0.05 (0.31)−0.47 (0.19) *−0.41 (0.28)0.52 (0.25)−0.58 (0.57) NA
Rough bark height (year 5)−0.16 (0.25)−0.37 (0.17) *0.05 (0.21)0.70 (0.17) **0.11 (0.37)NA
Table 8. Phenotypic (above diagonal) and genetic Type A (below) correlations of the traits that were assessed in the Wilmot trial with the standard errors given in parentheses. The significance of the difference of the correlations from zero are indicated: *** = p < 0.001, ** = p < 0.01, * = p < 0.05. ΔHt2−3= Height (year 3) minus Height (year 2), and ΔHt3−5 = Height (year 5) minus Height (year 3).
Bark Stripping
(Year 2)
Bark Stripping
(Year 3)
Height
(Year 2)
Height
(Year 3)
Height
(Year 5)
Diameter at 10 cm
(Year 2)
DBH
(Year 5)
Stem Access
(Year 2)
Bark Strip Height
(Year 2)
ΔHt2-3ΔHt3-5
Bark stripping (year 2) 0.71 (0.02) ***040 (0.03) ***−0.24 (0.03) ***0.43 (0.04) ***−0.23 (0.08) **−0.54 (0.02) ***0.41 (0.02) ***0.89(0.02) ***−0.46 (0.02) ***0.45 (0.04) ***
Bark stripping (year 3)1.00 (0.04) ** −0.82 (0.31) *−0.24 (0.03) ***0.50 (0.04) ***−0.29 (0.55)−0.29 (0.03) ***1.00 (0.09) ***0.62 (0.02) ***−0.39 (0.03) ***0.52 (0.04) ***
Height (year 2)0.56 (0.32)0.00 (0.03) 0.80 (0.02) ***0.53 (0.02) ***0.70 (0.06) ***0.49 (0.02) ***−0.11 (0.03) ***0.10 (0.03) ***0.59 (0.03) ***0.48 (0.03) ***
Height (year 3)0.12 (0.)0.34 (0.41)0.79 (0.17) * 0.69 (0.18) ***0.65 (0.07) ***0.81 (0.01) ***0.40 (0.38)−0.17 (0.03)0.75 (0.01) ***0.63 (0.03) ***
Height (year 5)0.42 (0.26)0.38 (0.32)0.45 (0.28)0.77 (0.16) ** −0.82 (1.60)0.44 (0.30)0.49 (0.27)0.53 (0.23)0.49 (0.02) ***0.89 (0.01) ***
Diameter at 10 cm (year 2)−0.05 (0.57)−0.27 (0.07) *0.22 (0.55)−0.20 (0.62)0.47 (0.05) *** 0.72 (0.02) ***−0.20 (0.55)0.03 (0.56)−0.12 (0.08) ***0.34 (0.06) ***
DBH (year 5)−0.84 (0.16) **−0.74 (0.24) *−0.44 (0.42)0.49 (0.29)0.90 (0.01) ***0.75 (0.29) −0.66 (0.24)−0.88 (0.15) **0.62 (0.02) ***0.72 (0.01) ***
Stem access (year 2)0.95 (0.10) ***0.36 (0.03) ***−0.76 (0.25) *−0.28 (0.03) ***0.50 (0.04) ***−0.24 (0.08) **−0.42 (0.03) *** 0.42 (0.02) ***−0.34 (0.03) ***0.50 (0.04) ***
Bark strip height (year 2)0.97 (0.02) ***0.98 (0.02) ***0.66 (0.28)0.27 (0.33)0.34 (0.03) ***−0.13 (0.08)−0.47 (0.02) ***0.87 (0.13) *** −0.44 (0.03) ***0.35 (0.04) ***
ΔHt2−3−0.35 (0.27)−0.20 (0.35)0.38 (0.33)0.89 (0.10) **0.65 (0.22) *−0.15 (0.59)0.68 (0.23)−0.18 (0.33)−0.25 (0.29) 0.53 (0.03) ***
ΔHt3−50.47 (0.27)0.38 (0.31)0.33 (0.34)0.53 (0.27)0.94 (0.04) ***−0.99 (0.76)0.19 (0.37)0.47 (0.27)0.55 (0.22)0.44 (0.29)
Table 9. Genetic estimates for bark stripping derived from models that accounted for covariation in tree physical traits in Payanna and Wilmot trials. No significant correlations between bark stripping and physical traits were detected in Beulah. Shown are the chi-square value (χ2) and probability for the one-tailed likelihood ratio test (LRT) that the additive variance (Va) in bark stripping is greater than zero and its narrow-sense heritability (h2) and its associated standard error (se) estimated with univariate spatial models. The heritability estimates calculated without fitting covariates are given in Table 2, Table 3 and Table 4.
Covariates Added to Model 1LRT χ2
[Va > 0]
p-Value
[Va > 0]
h2 ± se
Payanna
y = Bark stripping (year 5), covariates =bark thickness (year 5), rough bark height (year 5) and rough bark101.8<0.0010.12 ± 0.02
Wilmot
y = Bark stripping (year 2), covariate = stem access (year 2) 15.6<0.0010.06 ± 0.02
y = Bark stripping (year 3), covariates = height (year 2) and stem access (year 2) 228.0<0.0010.03 ± 0.02
Publisher’s Note: MDPI stays neutral with regard to jurisdictional claims in published maps and institutional affiliations.

