Article

Seed Sourcing Strategies Considering Climate Change Forecasts: A Practical Test in Scots Pine

by
Eduardo Notivol
1,2,*,†,
Luis Santos-del-Blanco
3,4,†,
Regina Chambel
3,
Jose Climent
3,4 and
Ricardo Alía
3,4,*
1
Department of Forest Resources, Agrifood Research and Technology Centre of Aragon (CITA), Avda. Montañana 930, 50059 Zaragoza, Spain
2
ETSI de Montes, Forestal y del Medio Natural de la Universidad Politécnica de Madrid (UPM), 28040 Madrid, Spain
3
INIA-CIFOR, Department of Ecology and Forest Genetics, Ctra. Coruña km 7.5, 28040 Madrid, Spain
4
Sustainable Forest Management Research Institute, University of Valladolid, Av. Madrid s/n, 34004 Palencia, Spain
*
Authors to whom correspondence should be addressed.
Those authors contributed equally.
Forests 2020, 11(11), 1222; https://doi.org/10.3390/f11111222
Submission received: 19 October 2020 / Revised: 10 November 2020 / Accepted: 17 November 2020 / Published: 20 November 2020

Abstract

:
Research Highlights: We experimentally tested different seed sourcing strategies (local, predictive, climate-predictive, climate-adjusted, composite and admixture) under a climate change high emissions scenario using a Scots pine multi-site provenance test. Background and Objectives: There is an urgent need to conserve genetic resources and to support resilience of conifer species facing expected changes and threats. Seed sourcing strategies have been proposed to maximize the future adaptation and resilience of our forests. However, these proposals are yet to be tested, especially in long-lived organisms as forest trees, due to methodological constraints. In addition, some methods rely on the transfer of material from populations matching the future conditions of the sites. However, at the rear edge of the species, some specific problems (high fragmentation, high genetic differentiation, role of genetic drift) challenge the theoretical expectations of some of these methods. Materials and Methods: We used a Scots pine multi-site provenance test, consisting of seventeen provenances covering the distribution range of the species in Spain tested in five representative sites. We measured height, diameter and survival at 5, 10 and 15 years after planting. We simulated populations of 50 trees by bootstrapping material of the provenance test after removing the intra-site environmental effects, simulating different seed sourcing strategies. Results: We found that local and predictive methods behaved better than methods based on the selection of future climate-matching strategies (predictive-climate and climate-adjusted) and those combining several seed sources (composite and admixture seed sourcing strategies). Conclusions: Despite the theoretical expectations, for Scots pine, a forest tree species at its rear edge of its distribution, seed-sourcing methods based on climate matching or a combination of seed sources do not perform better than traditional local or predictive methods or they are not feasible because of the lack of future climate-matching populations.

1. Introduction

Forests are essential to the provision of ecosystem services, products and environmental assets of a country or region, providing important incomes when globally accounting for all indicators [1]. As a result, forests, and particularly conifer forests, have been widely exploited and transformed by different human activities, namely forestry, e.g., cultivation, management [2], to increase some of these income sources. Furthermore, forests have been affected by land-use changes, e.g., agriculture, land development, or different natural hazards, e.g., forest fires, disturbances related to climate change, resulting in an enhanced vulnerability of many populations or even species. Therefore, the need for conservation and sustainable use of forest genetic resources has been increasingly claimed over the last decades [3].
There is an urgent need to conserve genetic resources and to support the resilience of conifer species facing expected changes and threats. Past changes could have already affected the adaptability of the populations to the ongoing rapid climatic changes [4], but also could have resulted in adaptive lags of some European forest tree species [5].
Reforestation or restoration are major forestry activities, where seeds or plants are used to establish a future forest. For the last decades, there has been an increasing concern to improve resilience of future forests. A key tool to achieve this aim is the use of genetically-variable material, as this is related to future adaptation and provision of goods and services [6]. As a consequence, great efforts are being done to define and take into account genetic features of the material deployed in forestry.
Selecting the most productive seed source for a given area has been a traditional approach by forest managers. At present, information on genetic variability and the predictions provided by climate change science enable different seed sourcing strategies to maximize the future adaptation and resilience of our forests [7,8,9,10,
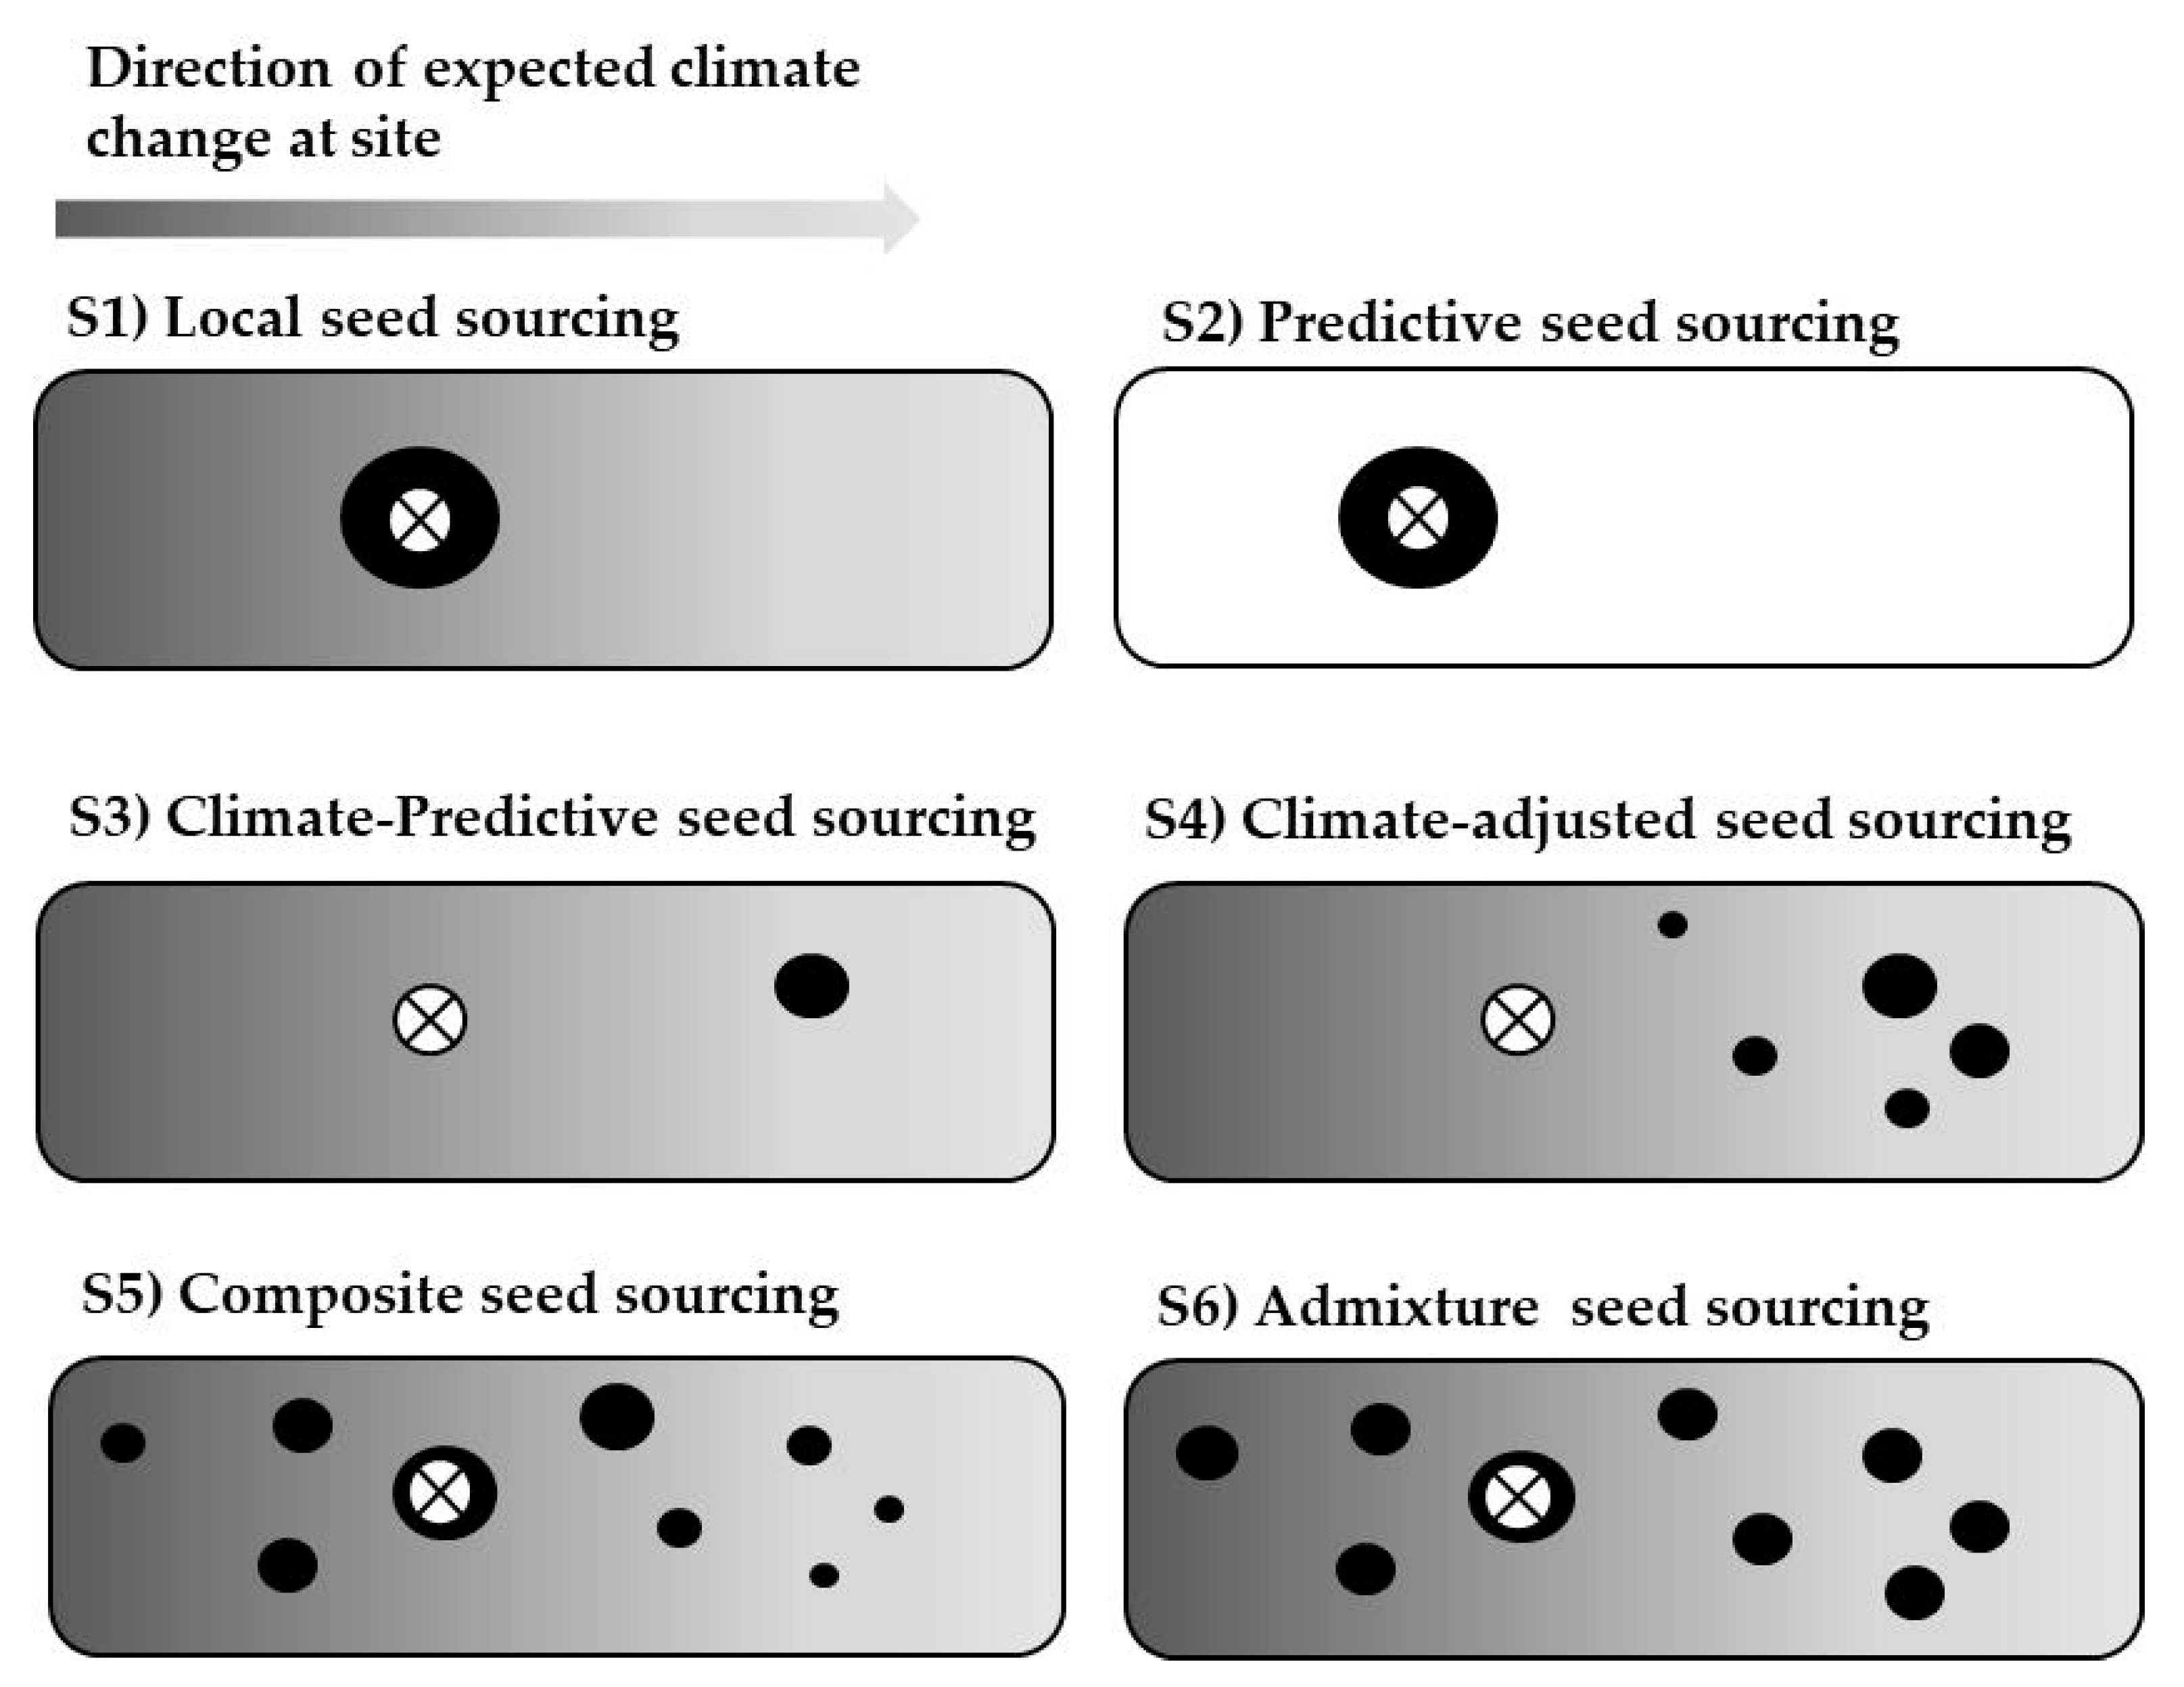
11]. Among the possible strategies, local, predicted, composite, admixture, and climate-adjusted seed sourcing have been widely promoted (see Materials and Methods for a detailed description).
These different strategies are difficult to test and compare against each other in forest conifers. Their long lifespan and wide distribution ranges impose some limitations in field tests in regards to obtaining seedlots based on the different strategies, establishing the material in common garden tests, and recording the results after a significant testing period. However, multi-site provenance tests have demonstrated their value to address many evolutionary and ecological questions related to adaptation [12,13], as different populations can be studied under common environmental conditions, and therefore taking advantage to simulate different seed sourcing strategies based on the results at a given time after planting.
Here, we used Scots pine (Pinus sylvestris L.) provenance tests located in Spain as a study case. We departed from the hypothesis that provenance tests constitute a representative sample to analyze the performance of different populations of a given species. Then, we used a set of Scots pine provenance tests covering the natural range of the species in Spain to evaluate different seed sourcing strategies under climate change scenarios.
Scots pine in Spain is at the southern edge of its distribution [14], and this in turn has implications for the fragmentation of the populations and genetic differentiation among populations [15,16,17], but also for the genetic variation in adaptive traits [17,18]. The species has a low degree of domestication and remarkable phenotypic and genetic differences in important traits among populations, despite high levels of gene flow [19]. Scots pine is a very important species in afforestation and restoration programs in Spain. It is the third species in Spain in terms of planted area, with 20,000 kg/seed/year and 1218 ha/year and with 17 regions of provenance for marketing of reproductive material [20]. Previous studies have reported genetic variation for traits related to growth, survival and branching among the Spanish provenances and a significant genotype–environment interaction for height and diameter [18]. Therefore, the study area provides an excellent case study to address how the species genetic variation in growth traits affects the outcome of seed sourcing strategies. In addition, it can potentially inform us of the implications for genetic conservation at the distribution limit of a widely distributed species.
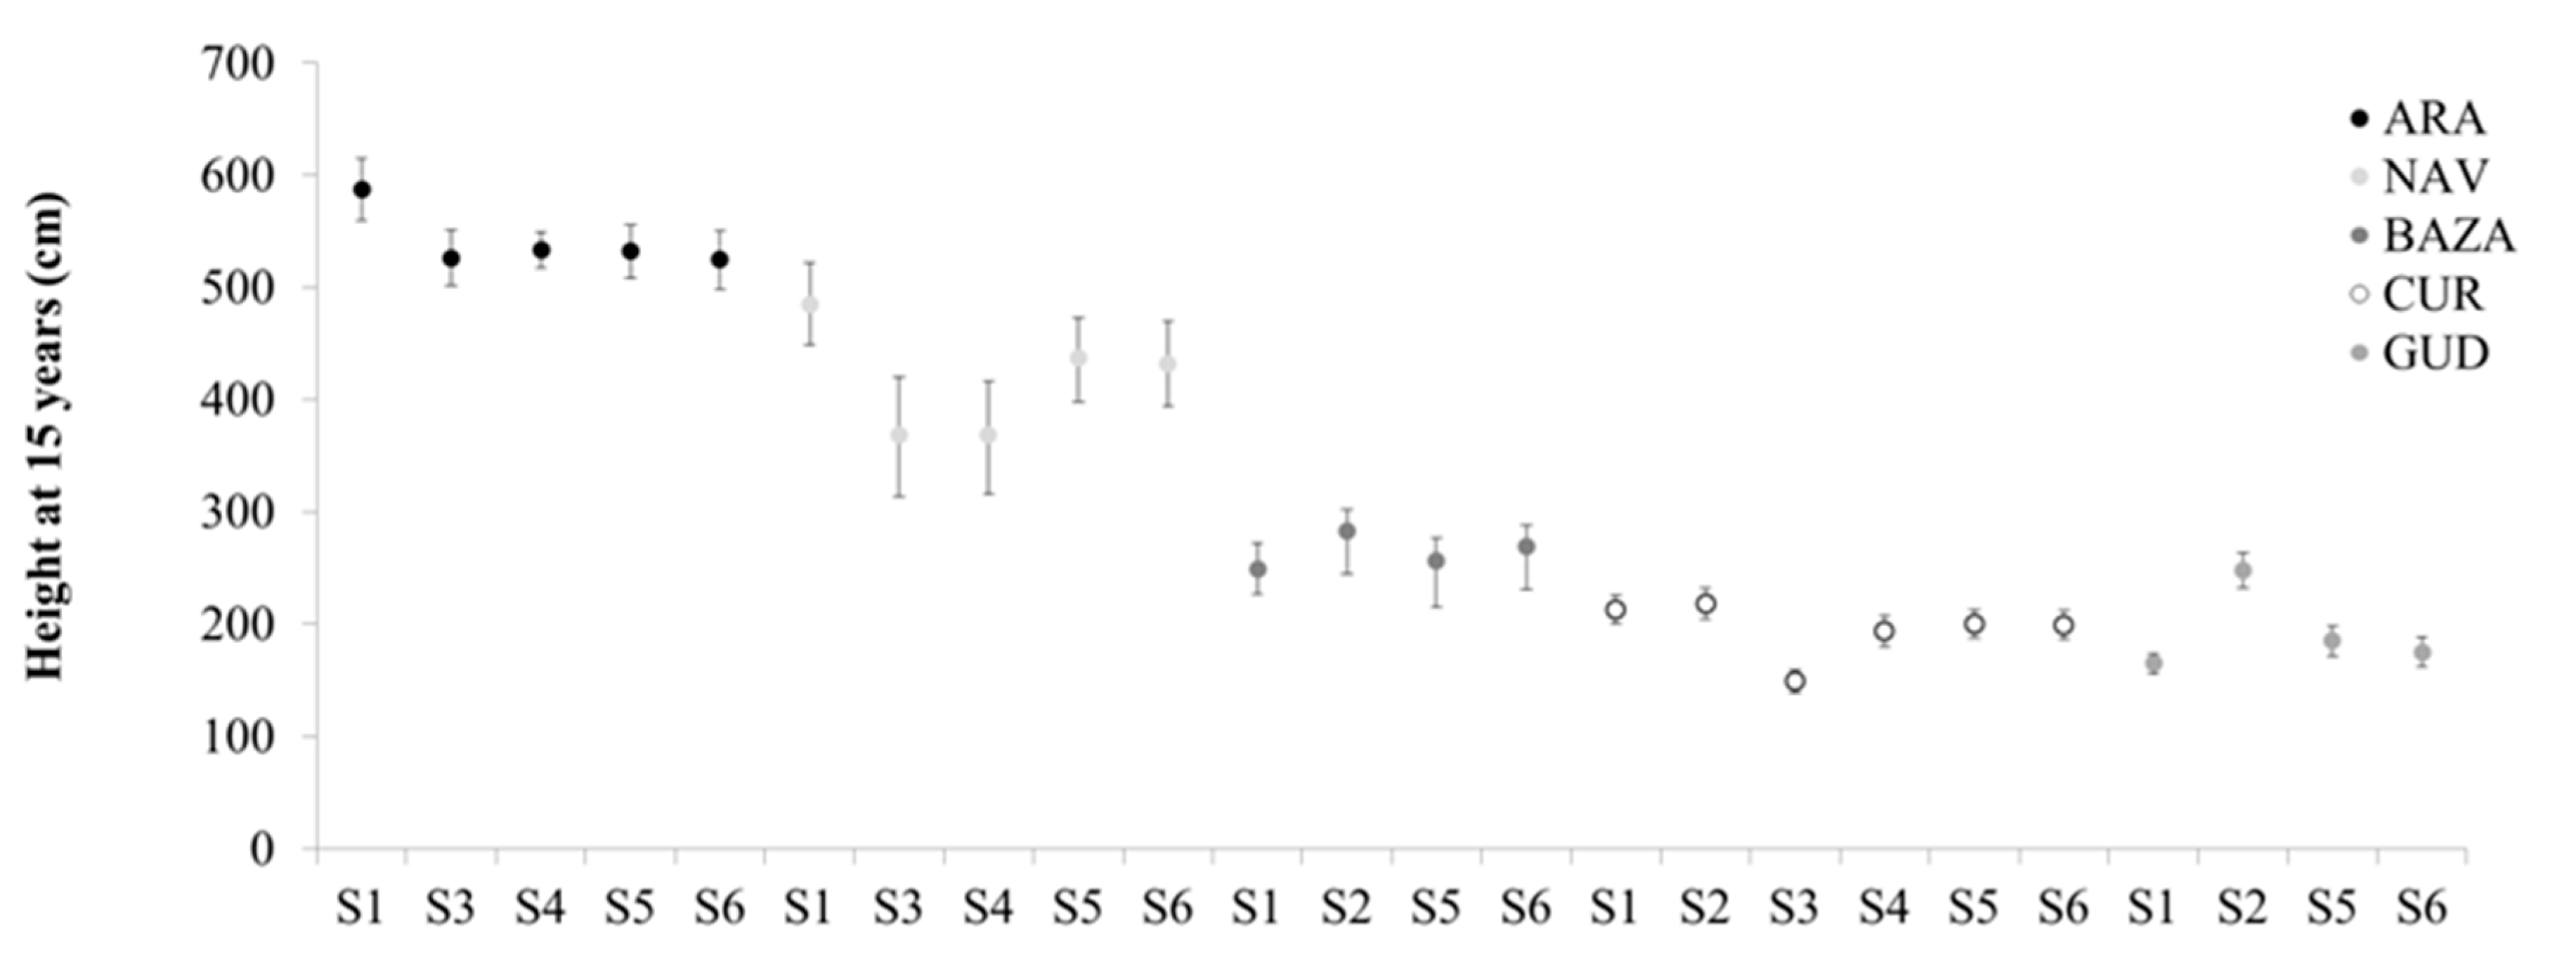
The aims of this work are: (i) to analyse the levels of variation of the species for height, diameter and survival, (ii) to analyse different seed sourcing strategies (local, predicted composite, admixture and climate-adjusted) under different environments and climate change scenarios, and (iii) to propose measures for the conservation and sustainable use of the populations in Spain. Firstly, we analyzed the gain of the different strategies in traits related to adaptation (height growth and their annual components, and survival) in five different provenance tests. Secondly, we integrated this information and the existing knowledge regarding Scots pine, to analyse the strategies for the conservation of its genetic resources. We believe this case study would be useful for other widely distributed species in their distribution edge.
The main aim of this work is to experimentally test different seed sourcing strategies under the climate change high emission scenario RCP 8.5 (business as usual) in order to increase adaptation and resilience of future forests. Our conclusion is that, for Scots pine, a forest tree species in the rear-edge of distribution, the proposed methods do not provide better results than the ones traditionally used in forestry (local and predictive methods). We show that depending of the structure of variation of the species and the future climatic predictions, the theoretical expectations of the climate-adjusted, composite and admixture methods would not be met.

2. Materials and Methods

2.1. Plant Material

We used information from a multi-site provenance test (Table 1), with populations covering the distribution range in Spain as well as populations from Germany (see [18] for details on the setting up and early results). In this study we use the populations from Spain only (Figure 1, and Online Supplementary Material Table S1). Each provenance test included a population that was considered as “local”.
Some seed sourcing strategies rely on genetic similarity indices as a criterion for the selection of provenances. A seedlot (25 seeds) of each population (except for 151-Castell de Cabrés) was genotyped using 7 CpSSR (see [16] for details). CpSSR, chloroplast simple sequence repeat markers, have a paternal inheritance in conifers, and are suitable for the estimation of pollen gene flow among populations [21]. We computed the pairwise differentiations (PhiST), obtained by AMOVA using Genalex 6.5 software [22].

2.2. Climatic Scenarios

For each provenance and site, we obtained the average value of five climatic indices commonly used and defined in the WorldClim database [23] for the periods 1974–1989 (representing the conditions when the seed was collected), 1990–2005 (corresponding to the available trial measurements) and for the period 2025–2050 and 2075–2098 using the high emissions scenario representative concentration pathway (RCP8.5). These five indices were: MAT (bio1, Mean annual Temperature), MDR (bio2: Mean Diurnal Range, i.e., Mean of monthly (max temp-min temp)), TS (bio4: Temperature Seasonality (standard deviation ×100)), MTWQ (bio10: Mean Temperature of Warmest Quarter) and PDQ (bio17: Precipitation of Driest Quarter) (See Appendix A for details).
Climatic data of sites and provenances were extracted from the B4EST-DT geo-web service [https://ibbr.cnr.it/b4est/] according to their corresponding coordinates. This tool provides data by downscaling algorithms of the climatic indices on a 5 km grid using the UKCP18 (United Kingdom Climatic Projections) datasets (1900–2098) [24]. The dataset was firstly generated by combining the CRU-TS (Climatic Research Unit gridded Time Series) [25].

2.3. Traits Analyzed and Common Garden Analysis

We used information from total height (HT), diameter (DBH, at 1.3 m) and survival (SUR) measurements of each tree assessed at age 5, 10 and 15 years after planting (two years more after seeding).
For each trait and site we used the remlf90 procedure of BreedR [26] in order to remove fine-scale spatial variation and generate phenotypic data devoid of that source of variation. We used the spline correction option, and whenever this was not significant (ARA, BAZ and CUR), a block correction was performed.
Then, we performed a combined analysis of sites using spatially-corrected individual measurements [18] according to the model:
Yijkl = μ + Si × Pj + B(S)k + U(S/B)l + eijkl
where Y is the vector containing the variable values, μ is the general mean, S is the study site, P is the provenance, B is the block within the site, U is the experimental unit within the block and site, which consists of four contiguous trees, and e is the random error term. All variables were coded as random. Significance of random factors was tested by means of Likelihood Ratio Tests (LRTs). We also obtained age–age correlations and trait correlations at the individual tree level after corrections.

2.4. Seed Sourcing Strategies

We considered six different seed-sourcing strategies for each site (see Figure 2):
S1.
Local seed sourcing: We identified the local provenance corresponding to each trial site: ARA (hu2), BAZ (gr), CUR (le), GUD (cu) and NAV (sg2).
S2.
Predictive seed sourcing. Proposes the use of naturally occurring genotypes that are experimentally determined to be adapted to projected conditions. We selected the best performing provenance at each site, provided that this was not the local one. Whenever this was the case, scenarios S1 and S2 concurred.
S3.
Climate-predictive seed sourcing: We selected seed sources from areas where current climate matches that of the testing sites in future scenarios (2050 predictions) [29].
S4.
Climate-adjusted seed sourcing. We combined trees from provenances sourced from across the predicted gradient of climate change, including genetic material that is likely to contribute to future climate resilience. The contribution of different provenances was not even but biased toward the direction of predicted climatic change [27], i.e., provenances sourced from places with predicted climates closer to future environmental conditions than the local provenance itself contributed to the mix, but the contribution was proportional to future climatic suitability. Smoothed fits were conducted for the period 1974–2098 for each of the five climatic indices in all the testing sites and provenances to define the expected climatic gradients and the suitability of the populations to the future climatic conditions. Then, each provenance was classified as suitable or not for each climatic index in the future (Table A3). Provenances with three or more matches were retained and their final contribution was proportional to the times that each provenance was classified as suitable.
S5.
Composite seed sourcing: We combined trees from different provenances in order to increase genetic diversity and to reflect gene flow among populations. This method aims to mimic natural patterns of gene flow by mixing seeds from multiple provenances, but with a contribution inversely proportional to the genetic pair-wise distance between each provenance and the local provenance, i.e., progressively fewer trees as the distance of the collection site from the planting site increases, but ecogeographically matching the sources [30]. Pairwise population differentiation (Online Supplementary Material Table S2) was used as a proxy of gene flow.
S6.
Admixture seed sourcing. We combined trees from all available provenances to increase genetic diversity regardless of gene flow. We constructed a simulated population with equal number of individuals from each provenance. Similar to composite seed sourcing, this strategy combines provenances, but simply aims to sample a wide variety of genetic sources, without considering the location of the source population relative to the planting site [11].
For each strategy (S1–S6), we created 1000 synthetic populations of n = 50 trees, according to the restrictions of the strategy. Individual tree values corrected by environmental effects, were bootstrapped (with replacement) among all the suitable individuals of the site we were evaluating. The procedure was carried out with an ad hoc script in R. For each synthetic population, we computed the mean and variance for each of the traits (HT, DBH and SUR) at age 5 (height only), 10 and 15. We also estimated the 5% and 95% percentiles and the percentile of values of each scenario that were greater than the mean of scenario S1. This was done for all possible combinations of trial site (5), phenotypic variable (6) and scenario (5 or 6), with a total of 172 combinations. The comparison among scenarios was studied according to the distribution of the values defined by the percentiles.

2.5. Data Accessibility

Raw data belongs to the GENFORED database (www.genfored.es) and they are accessible at zenodo repository (https://doi.org/10.5281/zenodo.4280004).

3. Results

3.1. Combined Analysis and Genetic Variation of Scots Pine Populations

We found strong poristive correlations (significant at p < 0.001) among variables, and among years (Table 2), both at the individual level and plot levels.
The combined analysis of the five sites and for all the variables considered indicates a significant variation among populations and sites for height and diameter (Table 3), but not for survival where the population term was not significant (p = 0.50). For survival there were significant differences among populations in the BAZ site, but only for the first evaluation at 5 years. Site was the most important factor influencing the performance of different provenances, with bold site-to-site differences. ARA provided a better performance than the other ones, and GUD had a higher mortality and a reduced height and diameter for all provenances. Site by provenance interaction was significant for height and diameter at all ages. This can be interpreted as differences in phenotypic plasticity of the provenances. As the values at the different ages were consistently similar (see Annex 2), here we only included the results for the last measurement at age 15 after planting.
The sites differed greatly in survival after planting (Table 4) indicating a different proportion of selected trees among sites (from 0.445 in GUD at age 15 to 0.906 in BAZ). However, this selected proportion is similar for the different populations tested.

3.2. Seed Sourcing Strategies

According to the predictions by 2050, the expected future conditions will increase the mean annual temperature, the mean diurnal range, the temperature seasonality, the mean temperature of the warmest quarter, and will decrease the precipitation of the driest quarter (See Annex 1 for details). In general, by 2050, some of the populations will still be suitable for the future conditions of the different sites (Table 5 and Table A3) considering at least three of the climatic indices, but not by 2100. It is interesting to notice that at BAZ, the southernmost population, there will not be any suitable provenance. On the contrary, at ARA and CUR, there will still be different populations suitable under these conditions. Provenance “gr” from the Southern limit of distribution would be suitable for all the sites except its own (the local one). This included the GUD testing site, where provenance “gr” was not included in the trial.
Threrefore, no populations can be considered in the scenarios climate predicted and climate-adjusted in the BAZ site nor in the GUD site. In this last case because the provenance from gr was not tested.
The overall analysis of the means and variances of bootstrapped synthetic populations indicated that seed sourcing methods differed for the different traits analysed (p < 0.001). Considering the five trial sites, predictive and local seed sourcing was superior to the other methods for height and diameter mean (Table 6). Composite and admixture seed sourcing did not behave in a superior fashion for the mean of any variable, but did have a greater variance for height. Survival was not considered for the analysis as there were no significant differences among populations, and therefore we assumed that all the populations behaved similarly, even under constant site conditions.
However this general pattern varied somewhat depending on the trial site, so that the optimal sampling strategy could be better defined by taking into account site effects (Online Supplementary Material Tables S3 and S4, and Figure 3 for HT15). There were two sites (ARA and NAV) where local seed sourcing performed better in terms of height and diameter. At the CUR testing site, local seed sourcing had a very similar performance to predictive seed sourcing. Then at two other testing sites (BAZ and GUD), local seed sourcing was outperformed by the predictive strategy, and behaved similarly to the other tested strategies (Figure 3). Climate adjusted seed sourcing behaved better than the other two methods based on the combiantion of seed sources (composite and admixture), having a greater mean height and similar variance in the estimations.

4. Discussion

This paper analyses for the first time the outcome of different seed sourcing strategies under climate change scenarios in Scots pine by using information on provenance tests established in multi-site common environments. The age of evaluation (15 years after planting) is an adequate period for the material to acclimatise to the local conditions of each experimental site. The results also indicate the stability of the estimation across years, and the high correlation among the traits considered. These traits are important to estimate the production and future adaptation of the species, and therefore are essential in the selection of seed sources in afforestation and restoration programs.
The interpretation of the results should consider different aspects of the study, related to the type of adaptation/acclimation evaluated, namely phenotypic plasticity. In addition, the evaluation period and its relationship with the expected climatic changes in the future, the area of study and the influence of the sample sizes should be considered in the estimation of seed sourcing strategies.
Phenotypic plasticity is a process mainly related to the future response of the species to different climatic conditions when the plants are already established in common garden experiments. The results indicate the existence of a significant site effect for all the traits considered, and a significant provenance and site x provenance interaction for height and diameter, but not for survival. This is in accordance with previous results reported with the same material at age 5 [18]. These results confirm the importance of phenotypic plasticity in growth traits. That is, the acclimation to site conditions at the species level as a whole, but also the differences in phenotypic plasticity at the provenance level [31].
A second process of adaptation related to the survival of better adapted trees is of minor importance in this study. We need to take into consideration that mortality, like in most provenance tests, was artificially reduced by planting nursery-cultivated healthy seedlings, and therefore blurring any selection effect at very early stages of development (1–2 years). We have reduced the mortality artificially in this stage, because as in most of the provenance tests, the focus was placed on the evaluation of established seedlings during the duration of the experiment. Firstly, the selected proportion of trees, indicated by the survival in the different sites, differed among sites, with values close to 0.44 in one of the sites (GUD), and close to 0.90 in the other sites. Therefore the selection intensity was too low—compared to that observed at the seedling stage in some conifers [32] and also in artificial selection programs of the species [33]—to expect significant future adaptation. Secondly, natural selection will operate within populations, where standing genetic variation (intra-population genetic variation for the strategies based on one population, or a combination of among and within population genetic variation for the strategies based on the mix of different populations) should take into consideration such levels of variation [4,34,35,36] that are quite important in Scots pine [37]. The effects of this selection would be observed in a second generation from the material established in the sites. In Scots pine, this period is around 120 years in the study area [38], similar to the furthest climatic scenario predicted (2100). Thirdly, because there are no differences among provenances in survival (there was no bias in provenance selection due to mortality), seed sourcing strategies will not depend on these differences for the future adaptation of this species at its southern range.
While the time scale of this work comparing strategies of seed sourcing was set at 2050, it is noteworthy to warn that no provenance will be suitable for the next century if the climate change follows the high emission scenario. This situation has severe implications and negative consequences for the conservation of genetic diversity, not only for Scots pine but also for a wider set of biodiversity when losing a key component of the forest habitat.
Scots pine has a different pattern of variation at its northern edge of distribution, where a clinal pattern has been detected for neutral and adaptive traits, compared to the rear edge of distribution in Spain, where the populations are highly fragmented and genetic drift may have played an important role in the distribution of neutral and adaptive variation [16,17,39]. These contrasting patterns influence seed transfer recommendations. In northern countries like Sweden and Finland, a movement of seeds from southern to northern areas has been suggested based on the future performance [40,41]. In Spain, however, this strategy is not recommended as local provenances are only showing the best performance in the areas where the conditions for local adaptation [42] are met. These are ARA and NAV sites where large population sizes and extensive gene flow is detected [21] in contrast to other marginal populations where genetic drift could have played a major role [43,44]. Therefore, local seed sourcing methods are superior to the other methods in only two of the sites.
Predictive seed sourcing is based on the selection of the best performing provenance (whenever it is not local), and therefore it is based on the results already available. This is the method most used based on provenance tests. By definition, this method will always provide the best results, sometimes paired with other single-source strategies like local or climate-predictive. However, there are two major drawbacks that limit its practical application. First, as it is not known a priori which provenance will be the best at each particular afforestation or restoration site, provenance tests with a comprehensive set of provenances need to be extensively replicated. Second, this is a post hoc method, for which phenotypic data collected several years after planting are needed.
Climate-based seed sourcing methods behave intermediately compared to the local/predictive seed sourcing methods. The predicted effects of climate change on the species in the Iberian peninsula include an increase in both tree growth and mortality [45]. When considering intra-population variation, data-driven models indicate that Scots pine populations from southern Spain would have higher relative survival in northern territories (that will be warmer) under future climate scenarios than under current conditions, and Scots pine populations from the northern Iberian Range would have the largest decrease in suitable area and the lowest survival over different climatic conditions [
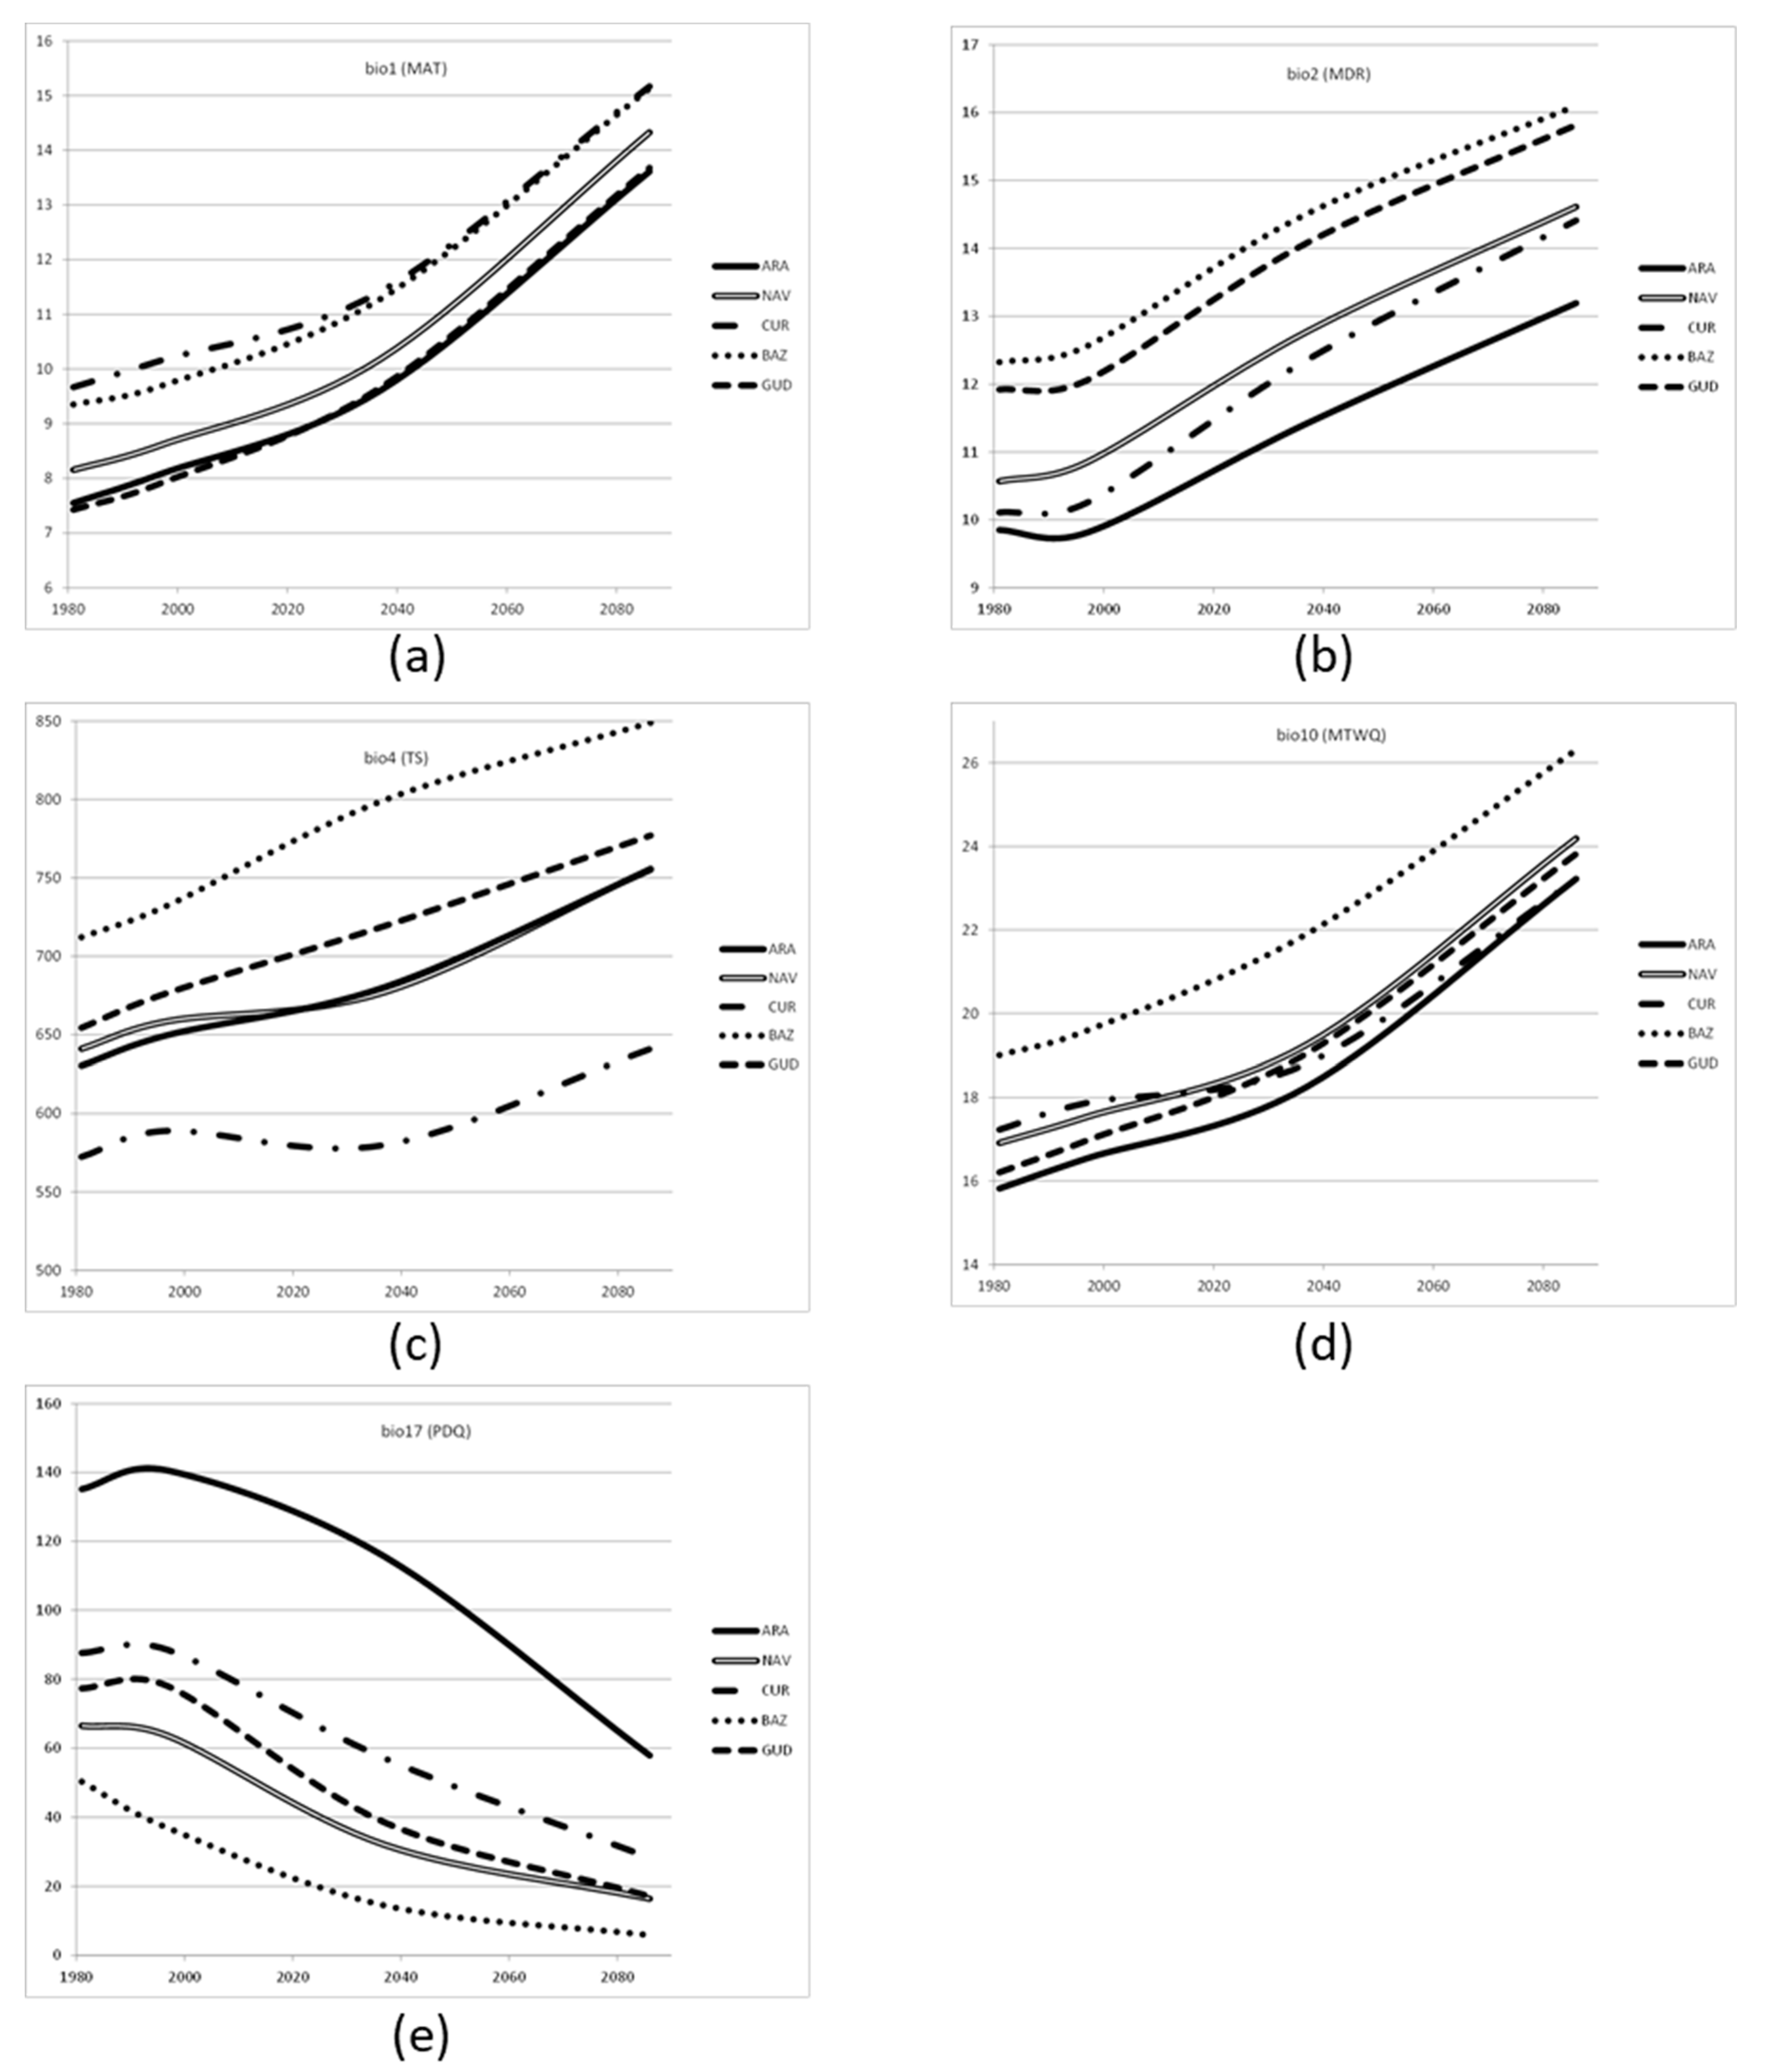
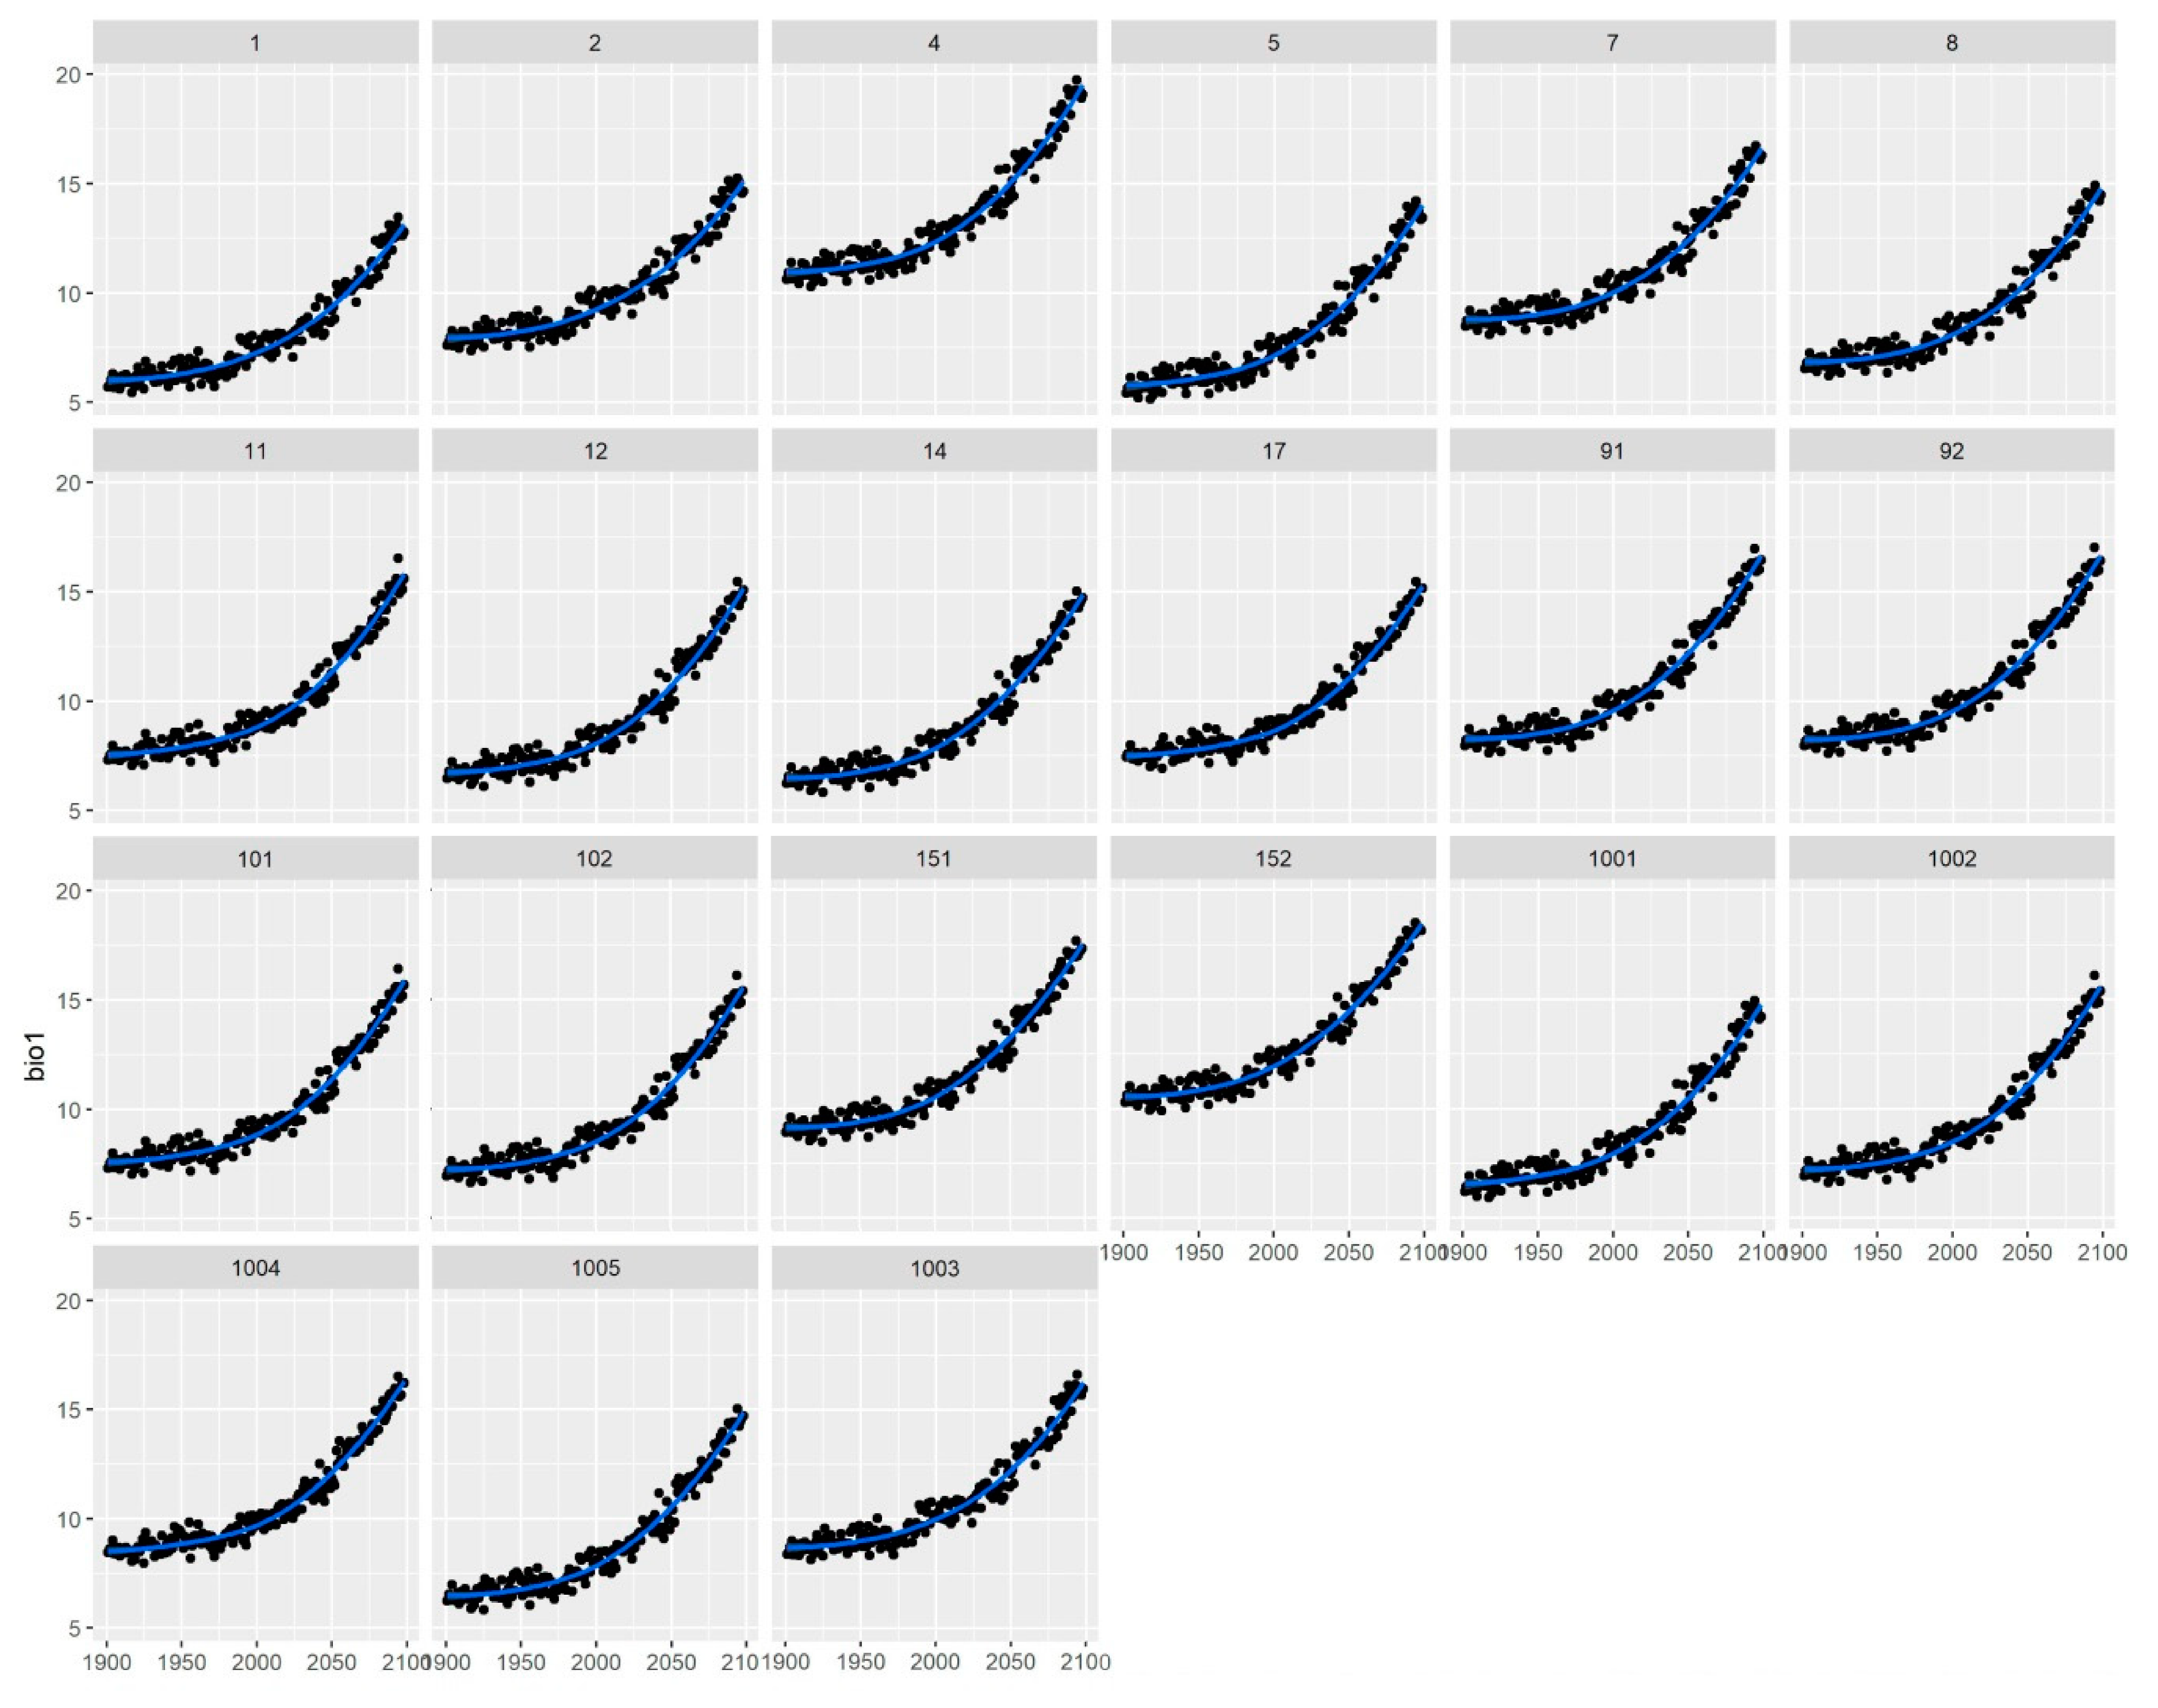
46]. The provenance tests reported in this study have been measured in the period 1995–2005, where the climates in the different sites have followed the trend expected in the climate change scenarios (Table 1). However, these changes are still small compared to those predicted at the 2100 period, and therefore, we can expect an underestimation of the results with these two methods (Climate-predictive and Climate-adjusted).
Composite, Admixture and Climate-adjusted seed sourcing have been suggested in the context of rapid climate change [27] but this has not been tested against other methods [28]. This is, to our knowledge, the first attempt to test different seed sourcing strategies using experimental data in a forest tree species. We would expect a higher variance in the traits, as a proxy of the standing genetic variation. Our results suggest that the combination of different seed sources does not provide a clear advantage to the methods based on one sole population. Another aspect not considered in our study is the possibility of a combination of alleles from different populations to produce new combinations for natural selection to occur. However, it is possible that some outbreeding depression might occur as a result of these new combinations [47,48]. Therefore we need to take these results with caution, as the context (early estimation under the climate change scenario, non-significant variation among provenances in survival) can hinder some of the advantages of these methods as proposed by different authors [7,8,9,10,11]. These methods can also have some risks in the conservation of the genetic resources of the species in the long term [49], and therefore we will need to show clear advantages over traditional methods to implement them at an operational scale in conditions like the ones tested in our study.

5. Conclusions

We tested different seed sourcing strategies in Scots pine by using a multi-site provenance test established in Spain. Our results suggest that in forest tree species such as Scots pine, with high levels of intra-population variability, and low inter-population variation, the methods based on the selection of one population (local and predictive seed sourcing methods) provide better performance (mean and variance in height and diameter), compared to the admixture and composite methods based on the combination of different seed sources. In addition, we propose that at the rear edge of distribution of the species, climate-adjusted methods are not suitable due to the absence of populations that follow the predicted climate gradient. This information should be taken into account in forest policies at national and/or EU level by adapting the transfer guidelines of FRM as in the ones provided by EUFORGEN [50]. In Spain, the National Strategy of FGR [51] should take into consideration those results in order to improve the recommendations for future climatic scenarios.

Supplementary Materials

The following are available online at https://www.mdpi.com/1999-4907/11/11/1222/s1, Table S1: Information on the origin of seed samples, the representation at the trial sites, and characteristics of the climate in the four periods considered in the study, Table S2: Pairwise population differentiation. The estimation was made using the Phist estimate implemented in Genalex (Peakall and Smouse, 2012) based in 7 CpSSR data in the populations of Scots pine, Table S3: Bootstrap analysis of the scenarios for the variable HT15. (50-trees samples), Table S4: Bootstrap analysis of the scenarios for the variable DBH15 (50-trees samples).

Author Contributions

R.A. and E.N.: conceived and design the research; R.C. and J.C.: contributed materials; L.S.-d.-B., R.A. and E.N. analyzed the data. All the authors wrote the paper. All authors have read and agreed to the published version of the manuscript.

Funding

This research was supported by the Project AEG 17-048 established in the frame of the measure 15.2 “support to the conservation and use of forest genetic resources” and under Regulation (EU) No 1305/2013 of the European Parliament and of the Council of 17 December 2013 on support for rural development by the European Agricultural Fund for Rural Development (EAFRD) with 75% co-financing. This study was funded by the European Union Horizon 2020 research and innovation programme under grant agreement No 773383 (B4EST project), and the Ministry of Science (RTI2018-094691-B-C32).

Acknowledgments

We are thankful to Maurizio Marchi (CNR-IBBR, Italy) and the B4EST climate downscaling tool for providing climate data. Most data used in this study are integrated in the Spanish Network of Forest Genetic Trials (GENFORED). We thank all persons and institutions involved in establishing and measuring field trials and maintaining the network.

Conflicts of Interest

The authors declare no conflict of interest. The funders had no role in the design of the study; in the collection, analyses, or interpretation of data; in the writing of the manuscript, or in the decision to publish the results.

Appendix A

Climatic Scenarios and Suitability of the Provenances

The B4EST Downscaling Tool (B4EST-DT) [https://ibbr.cnr.it/b4est/] outputs more than 80 climatic variables and indices over the whole time period (1900–2098). The climatic variables comprise raw climatic variables Tmin, Tmax, Prec with monthly resolution and the 19 bioclimatic parameters from the WorldClim database. Data served is produced by downscaling procedures on a 5 km grid using the UKCP18 datasets. For the five selected indices in this work, average values in four periods were obtained for the corresponding coordinates of the provenances analysed and plantation sites of the provenance tests. The four periods are: 1974–1989 representing the conditions when the seed was collected, 1990–2005 corresponding to the available trial measurements and for the period 2025–2050 and 2075–2098 using the high emissions scenario representative concentration pathway (RCP8.5).
Figure A1 and Table A1 show the trend of climate in the periods considered for the locations of the five trials. Provenance data are available in Table A2.
Figure A1. Projection of the climatic indices for the period 1980–2100 using the B4EST-DT geo-web service [https://ibbr.cnr.it/b4est/]. (a) bio1, MAT: Mean Annual Temperature, (b) bio2, MDR: Mean Diurnal Range, i.e., mean of monthly (max temp-min temp)), (c) bio4, TS: Temperature Seasonality (standard deviation ×100)), (d) bio10, MTWD: Mean Temperature of Warmest Quarter), (e) bio17, PDQ: Precipitation of Driest Quarter.
Forests 11 01222 g0a1
Table A1. Mean of the climatic indices for the different periods considered in the study for the location of the provenance test sites.
Period
1974–19881990–0052025–20502075–2098
Sitebio1 (MAT) 1
ARA7.558.089.6113.61
BAZ9.359.6911.2815.13
CUR9.6710.1611.4215.17
GUD7.427.919.6613.68
NAV8.158.6110.1814.33
bio2 (MDR) 2
ARA9.859.8111.4213.19
BAZ12.3212.5614.5116.10
CUR10.1110.2512.3514.41
GUD11.9212.05914.0815.81
NAV10.5710.8512.7714.61
bio4 (TS) 3
ARA630.39649.8625680.38755.14
BAZ712.13732.525799.72848.90
CUR572.41589.04579.98641.05
GUD654.38676.74719.36776.99
NAV641.02658.67677.21755.74
bio10 (MTWQ) 4
ARA15.8216.5418.2523.22
BAZ19.0019.5921.9026.31
CUR17.2317.8718.8023.20
GUD16.2016.9719.0423.82
NAV16.9117.5419.2524.19
bio17 (PDQ) 5
ARA135.16140.53115.5357.94
BAZ50.3536.8714.485.90
CUR87.6288.4557.0828.32
GUD77.3577.9438.5317.17
NAV66.5263.5832.06216.47
1 bio1, MAT: Mean Annual Temperature, 2 bio2, MDR: Mean Diurnal Range, i.e., mean of monthly (max temp − min temp)), 3 bio4, TS: Temperature Seasonality (standard deviation ×100)), 4 bio10, MTWD: Mean Temperature of Warmest Quarter), 5 bio17, PDQ: Precipitation of Driest Quarter.
Table A2. Mean of the Provenance’s climatic indices for the different period considered in the study.
Codebio1 (MAT) 1bio2 (MDR) 2bio4 (TS) 3
1974–19881990–20051974–19881990–20051974–19881990–2005
Le6.957.439.599.73555.66571.01
Bu8.99.410.3510.56549.19566.78
Hu111.9112.4510.5410.48662.38683.51
Hu26.757.289.699.64631.6650.66
B 9.6810.1611.9112.12651.59672.24
So7.768.2611.4111.67624.99644
Gu19.199.711.2711.56648.29668.82
Gu29.179.6711.1311.41649.4669.87
Sg18.538.9510.3410.6640.99657.41
Sg28.168.6110.5710.85642.04659.67
Av8.518.8910.8811.05651.16665.38
Te17.78.1612.8913.14654.57675.45
Te27.437.9211.9212.06654.4676.7
Cs10.0810.611.1811.27648.45669.28
T11.5112.0410.1210.14628.75650.1
Gr8.328.6612.4412.68718.01738.23
bio10 (MTWQ) 4bio17 (PDQ) 5
Le14.3714.97118.57122.16
Bu16.1516.78115.28113.16
Hu120.5221.381.4187.51
Hu215.0515.77141.39147.94
B 18.3119.0270.4771.36
So16.1516.8392.2292.4
Gu117.9118.6467.867.38
Gu217.918.6467.3466.46
Sg117.317.8761.657.67
Sg216.9317.5567.0863.96
Av17.2917.7852.9946.81
Te116.4917.2173.7471.41
Te216.2116.9777.4978.14
Cs18.6919.4759.5358.18
T19.7920.5663.4864.68
Gr18.0818.6755.0740.47
1 bio1, MAT: Mean Annual Temperature, 2 bio2, MDR: Mean Diurnal Range, i.e., mean of monthly (max temp − min temp)), 3 bio4, TS: Temperature Seasonality (standard deviation ×100)), 4 bio10, MTWD: Mean Temperature of Warmest Quarter), 5 bio17, PDQ: Precipitation of Driest Quarter.
For Climate-adjusted seed sourcing the contribution of the different provenances are based on the suitability of the populations in the light of current conditions for the future climate conditions of the plantation sites. The mix of provenances is proportional to the number of matches (suitability) of the five climatic indices. The suitability is accepted for every index if the current value is better or the same as the value predicted for the year 2050, (i.e., if the bio1 (MAT) of a provenance in 2020 is 10 °C and in a testing site in 2050 the predicted value of this index is 8 °C, in this case the provenance computes one positive match because the Tª adaptation is assured, but if the predicted value were 11 °C, it would not).
The values for these sets of comparisons have been obtained from smoothed fits for the period 1974–2098 (and zoomed for the 2020–2025 time lapse) for each of the five climatic indices in all the testing sites and provenances from the raw data obtained from the B4EST Downscaling Tool (B4EST-DT) [https://ibbr.cnr.it/b4est/]. Figure A2 shows examples for the index bio1 (MAT).
Figure A2. Smooth fits of bio1 (MAT) annual raw values from B4EST-DT for the period 1900–2098 for all provenances and test sites.
Forests 11 01222 g0a2
Table A3. Provenances matching the future scenario (2050) for each site. Asterisks indicate provenances not included in the trial site, but are included here for easier comparisons among sites.
Provenance
SiteIndexLeBuHu1Hu2BSoGu1Gu2Sg1Sg2AvTe1Te2CsTGr
ARAbio1 1 1 1 11
bio2 2 1111 1111 1
bio4 3 1 111 1
bio10 4 1 1 11 111
bio17 5 1 111111111111
sum0040423311233534
BAZbio1
bio2
bio4
bio10 1
bio17
sum00100 *0000000 *0000
CURbio1 1 11
bio2 1111 1111 1
bio4 1111 111111111
bio10 1 1 11 111
bio17 1 1 1
sum0031322321322434
GUDbio1 1 1 11
bio2
bio4 1
bio10 1 111
bio17 1 1
sum0020 *1 *0000 *0 *10 *0 *223 *
NAVbio1 1 1 11
bio2 11 1
bio4 1 111 1
bio10 1 111
bio17
sum003 *0100000022323
1 bio1, MAT: Mean annual Temperature, 2 bio2, MDR: Mean Diurnal Range, i.e., Mean of monthly (max temp-min temp)), 3 bio4, TS: Temperature Seasonality (standard deviation ×100)), 4 bio10, MTWD: Mean Temperature of Warmest Quarter), 5 bio17, PDQ: Precipitation of Driest Quarter.

References

  1. Campos, P.; Caparrós, A.; Oviedo, J.L.; Ovando, P.; Álvarez-farizo, B.; Díaz-balteiro, L.; Carranza, J.; Beguería, S.; Díaz, M.; Herruzo, A.C.; et al. Bridging the Gap Between National and Ecosystem Accounting Application in Andalusian Forests, Spain. Ecol. Econ. 2019, 157, 218–236. [Google Scholar] [CrossRef]
  2. Ratnam, W.; Rajora, O.P.; Finkeldey, R.; Aravanopoulos, F.; Bouvet, J.M.; Vaillancourt, R.E.; Kanashiro, M.; Fady, B.; Tomita, M.; Vinson, C. Genetic effects of forest management practices: Global synthesis and perspectives. For. Ecol. Manag. 2014, 333, 52–65. [Google Scholar] [CrossRef] [Green Version]
  3. Loo, J.; Souvannavong, O.; Dawson, I.K. Seeing the trees as well as the forest: The importance of managing forest genetic resources. For. Ecol. Manag. 2014, 333, 1–8. [Google Scholar] [CrossRef] [Green Version]
  4. Alberto, F.J.; Aitken, S.N.; Alía, R.; González-Martínez, S.C.; Hänninen, H.; Kremer, A.; Lefèvre, F.; Lenormand, T.; Yeaman, S.; Whetten, R.; et al. Potential for evolutionary responses to climate change—Evidence from tree populations. Glob. Chang. Biol. 2013, 19, 1645–1661. [Google Scholar] [CrossRef] [Green Version]
  5. Fréjaville, T.; Vizcaíno-Palomar, N.; Fady, B.; Kremer, A.; Benito Garzón, M. Range margin populations show high climate adaptation lags in European trees. Glob. Chang. Biol. 2020, 26, 484–495. [Google Scholar] [CrossRef]
  6. Alía, R.; Alba, N.; Chambel, M.R.; Barba, D.; Iglesias, S. Genetic quality of forest reproductive materials in Land restoration programmes. In Innovative Approaches in Forest Restoration; Vallejo, V.R., Bautista, S., Aaronson, J., Eds.; CEAM: Valencia, Spain, 2009; pp. 89–103. [Google Scholar]
  7. Thomas, E.; Jalonen, R.; Loo, J.; Boshier, D.; Gallo, L.; Cavers, S.; Bordács, S.; Smith, P.; Bozzano, M. Genetic considerations in ecosystem restoration using native tree species. For. Ecol. Manag. 2014, 333, 66–75. [Google Scholar] [CrossRef] [Green Version]
  8. Havens, K.; Vitt, P.; Still, S.; Kramer, A.T.; Fant, J.B.; Schatz, K. Seed Sourcing for Restoration in an Era of Climate Change. Nat. Areas J. 2015, 35, 122–133. [Google Scholar] [CrossRef]
  9. Bucharova, A.; Bossdorf, O.; Hölzel, N.; Kollmann, J.; Prasse, R.; Durka, W. Mix and match: Regional admixture provenancing strikes a balance among different seed-sourcing strategies for ecological restoration. Conserv. Genet. 2019, 20, 7–17. [Google Scholar] [CrossRef]
  10. Kramer, A.T.; Crane, B.; Downing, J.; Hamrick, J.L.; Havens, K.; Highland, A.; Jacobi, S.K.; Kaye, T.N.; Lonsdorf, E.V.; Ramp Neale, J.; et al. Sourcing native plants to support ecosystem function in different planting contexts. Restor. Ecol. 2019, 27, 470–476. [Google Scholar] [CrossRef]
  11. Breed, M.F.; Stead, M.G.; Ottewell, K.M.; Gardner, M.G.; Lowe, A.J. Which provenance and where? Seed sourcing strategies for revegetation in a changing environment. Conserv. Genet. 2013, 14, 1–10. [Google Scholar] [CrossRef]
  12. Matyas, C. Climatic adaptation of trees: Rediscovering provenance tests. Euphytica 1996, 92, 45–54. [Google Scholar] [CrossRef]
  13. Matyas, C. Modelling climate change effects with provenance test data. Tree Physiol. 1994, 14, 797–804. [Google Scholar] [CrossRef] [PubMed] [Green Version]
  14. Hampe, A.; Petit, R.J. Conserving biodiversity under climate change: The rear edge matters. Ecol. Lett. 2005, 8, 461–467. [Google Scholar] [CrossRef] [PubMed] [Green Version]
  15. Prus-Glowacki, W.; Stephan, B.R.; Bujas, E.; Alía, R.; Marciniak, A. Genetic differentiation of autochthonous populations of Pinus sylvestris (Pinaceae) from the Iberian peninsula. Plant Syst. Evol. 2003, 239, 55–66. [Google Scholar] [CrossRef]
  16. Soto, A.; Robledo-Arnuncio, J.J.; González-Martínez, S.C.; Smouse, P.E.; Alía, R. Climatic niche and neutral genetic diversity of the six Iberian pine species: A retrospective and prospective view. Mol. Ecol. 2010, 19, 1396–1409. [Google Scholar] [CrossRef] [Green Version]
  17. Notivol, E.; Garcia-Gil, M.R.; Alía, R.; Savolainen, O. Genetic variation of growth rhythm traits in the limits of a latitudinal cline in Scots pine. Can. J. For. Res. 2007, 37, 540–551. [Google Scholar] [CrossRef]
  18. Alía, R.; Moro, J.; Notivol, E.; Moro-serrano, J. Genetic variability of Scots pine (Pinus sylvestris L.) provenances in Spain: Growth traits and survival. Silva Fenn. 2001, 35, 27–38. [Google Scholar] [CrossRef] [Green Version]
  19. Savolainen, O.; Pyhäjärvi, T.; Knürr, T. Gene Flow and Local Adaptation in Trees. Annu. Rev. Ecol. Evol. Syst. 2007, 38, 595–619. [Google Scholar] [CrossRef]
  20. Alía, R.; Garcia del Barrio, J.M.; Iglesias, S.; Mancha, J.A.; de Miguel, J.; Nicolás, J.L.; Pérez, F.; Sánchez de Ron, D. Regiones de Procedencia de Especies Forestales de España; O.A. Parques Nacionales: Madrid, Spain, 2009; ISBN 9788480147590. [Google Scholar]
  21. Robledo-Arnuncio, J.J.; Smouse, P.E.; Gil, L.A.; Alía, R. Pollen movement under alternative silvicultural practices in native populations of Scots pine (Pinus sylvestris L.) in central Spain. For. Ecol. Manag. 2004, 197, 245–255. [Google Scholar] [CrossRef]
  22. Peakall, R.; Smouse, P.E. GenALEx 6.5: Genetic analysis in Excel. Population genetic software for teaching and research-an update. Bioinformatics 2012, 28, 2537–2539. [Google Scholar] [CrossRef] [Green Version]
  23. Fick, S.E.; Hijmans, R.J. WorldClim 2: New 1-km spatial resolution climate surfaces for global land areas. Int. J. Climatol. 2017, 37, 4302–4315. [Google Scholar] [CrossRef]
  24. Met Office. UK Climate Projections: Headline Findings; Met Office: Exeter, UK, 2019; pp. 1–12. [Google Scholar]
  25. Harris, I.; Osborn, T.J.; Jones, P.; Lister, D. Version 4 of the CRU TS monthly high-resolution gridded multivariate climate dataset. Sci. Data 2020, 7, 1–18. [Google Scholar] [CrossRef] [PubMed] [Green Version]
  26. Muñoz, F.; Sanchez, L. BreedR: Statistical Methods for Forest Genetic Resources Analysts; R-Package software. Available online: https://github.com/famuvie/breedR (accessed on 19 November 2020).
  27. Prober, S.M.; Byrne, M.; McLean, E.H.; Steane, D.A.; Potts, B.M.; Vaillancourt, R.E.; Stock, W.D. Climate-adjusted provenancing: A strategy for climate-resilient ecological restoration. Front. Ecol. Evol. 2015, 3, 1–5. [Google Scholar] [CrossRef] [Green Version]
  28. Byrne, M.; Prober, S.; McLean, L.; Steane, D.; Stock, W.; Potts, B.; Vaillancourt, R. Adaptation to Climate in Widespread e Ucalypt Species; Gold Coast: National Climate Change Adaptation Research Facility: Gold Coast, Australia, 2013. [Google Scholar]
  29. Sgrò, C.M.; Lowe, A.J.; Hoffmann, A.A. Building evolutionary resilience for conserving biodiversity under climate change. Evol. Appl. 2011, 4, 326–337. [Google Scholar] [CrossRef] [PubMed]
  30. Broadhurst, L.M.; Lowe, A.; Coates, D.J.; Cunningham, S.A.; McDonald, M.; Vesk, P.A.; Yates, C. Seed supply for broadscale restoration: Maximizing evolutionary potential. Evol. Appl. 2008, 1, 587–597. [Google Scholar] [CrossRef]
  31. Chambel, M.R.; Climent, J.M.; Alía, R.; Valladares, F. Phenotypic plasticity: A useful framework for understanding adaptation in forest species. For. Syst. 2005, 14, 334–344. [Google Scholar] [CrossRef]
  32. Vizcaíno-Palomar, N.; Revuelta-Eugercios, B.; Zavala, M.A.; Alía, R.; Gonzalez-Martínez, S.C.; González-Martínez, S.C. The Role of Population Origin and Microenvironment in Seedling Emergence and Early Survival in Mediterranean Maritime Pine (Pinus pinaster Aiton). PLoS ONE 2014, 9, e109132. [Google Scholar] [CrossRef] [Green Version]
  33. Mullin, T.J.; Lee, S. Best Practice for Tree Breeding in Europe; Mullin, T.J., Lee, S., Eds.; Skogforsk: Uppsala, Sweden, 2013. [Google Scholar]
  34. Aitken, S.N.; Yeaman, S.; Holliday, J.A.; Wang, T.; Curtis-McLane, S. Adaptation, migration or extirpation: Climate change outcomes for tree populations. Evol. Appl. 2008, 1, 95–111. [Google Scholar] [CrossRef]
  35. Chevin, L.-M.; Lande, R.; Mace, G.M. Adaptation, plasticity, and extinction in a changing environment: Towards a predictive theory. PLoS Biol. 2010, 8, e1000357. [Google Scholar] [CrossRef] [Green Version]
  36. Chevin, L.-M.; Collins, S.; Lefèvre, F. Phenotypic plasticity and evolutionary demographic responses to climate change: Taking theory out to the field. Funct. Ecol. 2013, 27, 967–979. [Google Scholar] [CrossRef] [Green Version]
  37. Bastien, C.; Alía, R. What might be useful measures of genetic variability for adaptive tratis within populations of Scots pine? For. Syst. 2000, 9, 97–110. [Google Scholar]
  38. Rojo-Alboreca, A.; García-Villabrille, J.D.; Corral-Rivas, J.J.; Alía, R.; Montero, G. A new approach to defining rotation ages on the basis of productive and technological aspects. Application to natural Pinus sylvestris L. stands in central Spain. For. Syst. 2017, 26, 13. [Google Scholar] [CrossRef] [Green Version]
  39. Robledo-Arnuncio, J.J.; Collada, C.; Alía, R.; Gil, L.A. Genetic structure of montane isolates of Pinus sylvestris L. in a Mediterranean refugial area. J. Biogeogr. 2005, 32, 595–605. [Google Scholar] [CrossRef]
  40. Berlin, M.; Persson, T.; Jansson, G.; Haapanen, M.; Ruotsalainen, S.; Bärring, L.; Gull, B.A. Scots pine transfer effect models for growth and survival in Sweden and Finland. Silva Fenn. 2016, 50, 1–21. [Google Scholar] [CrossRef] [Green Version]
  41. Berlin, M.; Almqvist, C.; Haapanen, M.; Högberg, K. Common Scots Pine Deployment Recommendations for Sweden and Finland. Skogforsk Report. Uppsala, 2019. Available online: https://www.skogforsk.se/english/news/2019/common-scots-pine-deployment-recommendations-for-sweden-and-finland (accessed on 19 November 2020).
  42. Leimu, R.; Fischer, M. A Meta-Analysis of Local Adaptation in Plants. PLoS ONE 2008, 3, e4010. [Google Scholar] [CrossRef] [PubMed] [Green Version]
  43. Robledo-Arnuncio, J.J.; Alía, R.; Gil, L.A. Increased selfing and correlated paternity in a small population of a predominantly outcrossing conifer, Pinus sylvestris. Mol. Ecol. 2004, 13, 2567–2577. [Google Scholar] [CrossRef]
  44. Robledo-Arnuncio, J.J.; Gil, L.A. Patterns of pollen dispersal in a small population of Pinus sylvestris L. revealed by total-exclusion paternity analysis. Heredity 2005, 94, 13–22. [Google Scholar] [CrossRef]
  45. Benito-Garzón, M.; Ruiz-Benito, P.; Zavala, M.A. Interspecific differences in tree growth and mortality responses to environmental drivers determine potential species distributional limits in Iberian forests. Glob. Ecol. Biogeogr. 2013, 22, 1141–1151. [Google Scholar] [CrossRef]
  46. Benito-Garzón, M.; Alía, R.; Robson, T.M.; Zavala, M.A. Intra-specific variability and plasticity influence potential tree species. Glob. Ecol. Biogeogr. 2011, 20, 766–788. [Google Scholar] [CrossRef] [Green Version]
  47. Unger, G.M.; Heuertz, M.; Vendramin, G.G.; Robledo-Arnuncio, J.J. Assessing early fitness consequences of exotic gene flow in the wild: A field study with Iberian pine relicts. Evol. Appl. 2016, 9, 367–380. [Google Scholar] [CrossRef] [Green Version]
  48. Robledo-Arnuncio, J.J.; Unger, G.M. Measuring Viability Selection From Prospective Cohort Mortality Studies: A Case Study in Maritime Pine. Evol. Appl. 2019, 12, 863–877. [Google Scholar] [CrossRef] [PubMed] [Green Version]
  49. Koskela, J.; Lefèvre, F.; Schueler, S.; Kraigher, H.; Olrik, D.C.; Hubert, J.; Longauer, R.; Bozzano, M.; Yrjana, L.; Alizoti, P.; et al. Translating conservation genetics into management: Pan-European minimum requirements for dynamic conservation units of forest tree genetic diversity. Biol. Conserv. 2013, 157, 39–49. [Google Scholar] [CrossRef] [Green Version]
  50. Konnert, M.; Fady, B.; Gömöry, D.; A’Hara, S.; Wolter, F.; Ducci, F.; Koskela, J.; Bozzano, M.; Maaten, T.; Kowalczyk, J. Use and Transfer of Forest Reproductive Material: In Europe in the Context of Climate Change; European Forest Genetic Resources Programme (EUFORGEN), Bioversity International: Rome, Italy, 2015; ISBN 9789292550318. [Google Scholar]
  51. MIMAM. Estrategia de Conservación y uso Sostenible de los Recursos Genéticos Forestales; Dirección General para la Biodiversidad, Ministerio de Medio Ambiente: Madrid, Spain, 2006; ISBN D.L.: BI-2.749-07. [Google Scholar]
Figure 1. Location of population and sites used in this study.
Forests 11 01222 g001
Figure 2. Seed sourcing strategies used in this study (modified from [27,28]). The cross indicates the site (provenance test) and the circles indicate the populations used as seed sources. The size of the circle indicates the contribution of each population to the seed sourcing strategy.
Forests 11 01222 g002
Figure 3. Values for the different scenarios of the Height at 15 years in the different sites. [Code for the seed-sourcing scenarios, S1: Local, S2: Predictive, S3: Predictive-Climate, S4: Climate-Adjusted, S5: Composite, S6: Admixture].
Forests 11 01222 g003
Table 1. Location and two climatic indices of the sites for different periods (see Appendix A for details).
Period
1974–19891990–20052025–20502075–2098
SiteALT 1LAT 2LONG 3MAT 4PDQ 5MATPDQMATPDQMATPDQ
ARA137042°44′ N00°37′ W7.5135.18.1140.59.6115.513.657.9
BAZ185037°21′ N02°56′ W9.350.39.736.911.314.515.15.9
CUR115042°46′ N06°21′ W9.787.610.188.411.457.115.228.3
GUD170040°27′ N00°35′ W7.477.37.977.99.738.513.717.2
NAV160041°02′ N03°49′ W8.166.58.663.610.232.014.316.5
1 ALT: Altitude (m), 2 LAT: Latitude (degrees), 3 LONG: Longitude (degrees), 4 MAT: Mean Annual Temperature (°C), 5 PDQ: Precipitation Driest Quarter (mm).
Table 2. Correlation among traits at the plot (above diagonal) and the individual (below diagonal) level.
HT5HT10HT15DBH10DBH15SUR15
HT5-0.7390.6400.6920.6510.453
HT100.743-0.9120.8490.8660.659
HT150.5770.927-0.7720.9050.698
DBH100.6640.9460.938-0.8320.350
DBH150.5400.8820.9230.845-0.549
Table 3. Variance explained per variable and corresponding percentage relative to total variance, HT, height measured in cm at 15 years; DBH15, diameter at breast height measured in cm at 15 years, SUR15, survival at 15 years. Significant factors (p < 0.05) are indicated in in bold. Residual variance for survival fitted with a binomial model with logistic link function is fixed to π2/3.
HT15DBH15SUR15
FactorVariance%Variance%Variance%
Site22,356.560.5%1409.1363.7%0.81116.2%
Provenance539.41.5%19.660.9%0.0090.2%
Site x provenance834.92.3%44.632.0%0.0040.1%
Block714.31.9%31.241.4%0.1282.5%
Experimental unit1854.55.0%116.415.3%0.77915.5%
Residual10,631.828.8%591.6326.7%3.29065.5%
Table 4. Survival rates at five Scots pine trial sites in Spain along 15 years after planting.
SiteNAge 5Age 10Age15
ARA9600.920.890.88
BAZ8960.980.910.91
CUR10240.970.800.68
GUD6400.600.480.45
NAV9600.910.890.88
Total44800.900.810.78
Table 5. Provenances within the range of future conditions up to 2050 of each experimental site for at least three of the climatic indices (in brackets, number of indices matching future conditions. See Appendix A for details and Table A3).
SiteProvenances Where Current Climate Matches Future Scenarios
ARAhu1 (4), b (4), te1 (3), te2 (3), gu1 (3), gu2 (3), cs (5), t (3), gr (4)
BAZ-
CURhu1 (3), b (3), gu2 (3), av (3), cs (4), t (3), gr (4)
GUD-
NAVcs (3), gr (3)
Table 6. Comparison of different methods for height and diameter at age 15.
HT15DBH15
MeanGroupVarianceGroupMeanGroupVarianceGroup
Local339.5b12073.84c64.33b635.55d
Predictive358.0a11948.67c76.07a708.32a
Climate-predictive327.1c12891.22a60.37c586.42e
Climate-adjusted322.2d12286.24b59.26d698.58a
Composite320.1e12335.81b58.66e678.08b
Admixture320.7e12723.13a58.88e658.29c
Publisher’s Note: MDPI stays neutral with regard to jurisdictional claims in published maps and institutional affiliations.

