Article

Analyzing the Joint Effect of Forest Management and Wildfires on Living Biomass and Carbon Stocks in Spanish Forests

1
INIA, Forest Research Centre, Ctra. La Coruña, km 7.5, 28040 Madrid, Spain
2
Ecología Forestal y Restauración, Departamento de Ciencias de la Vida, Universidad de Alcalá, Ctra. Madrid-Barcelona, km 33.4, 28005 Alcalá de Henares, Spain
3
Bioeconomy and Environment Unit, Natural Resources Institute Finland (Luke), Yliopistokatu 6, FI-80100 Joensuu, Finland
*
Author to whom correspondence should be addressed.
Forests 2020, 11(11), 1219; https://doi.org/10.3390/f11111219
Submission received: 18 September 2020 / Revised: 13 November 2020 / Accepted: 16 November 2020 / Published: 19 November 2020
(This article belongs to the Special Issue Forest Resources Assessments: Mensuration, Inventory and Planning)

Abstract

:
Research Highlights: This is the first study that has considered forest management and wildfires in the balance of living biomass and carbon stored in Mediterranean forests. Background and Objectives: The Kyoto Protocol and Paris Agreement request countries to estimate and report carbon emissions and removals from the forest in a transparent and reliable way. The aim of this study is to forecast the carbon stored in the living biomass of Spanish forests for the period 2000–2050 under two forest management alternatives and three forest wildfires scenarios. Materials and Methods: To produce these estimates, we rely on data from the Spanish National Forest Inventory (SNFI) and we use the European Forestry Dynamics Model (EFDM). SNFI plots were classified according to five static (forest type, known land-use restrictions, ownership, stand structure and bioclimatic region) and two dynamic factors (quadratic mean diameter and total volume). The results were validated using data from the latest SNFI cycle (20-year simulation). Results: The increase in wildfire occurrence will lead to a decrease in biomass/carbon between 2000 and 2050 of up to 22.7% in the medium–low greenhouse gas emissions scenario (B2 scenario) and of up to 32.8% in the medium–high greenhouse gas emissions scenario (A2 scenario). Schoolbook allocation management could buffer up to 3% of wildfire carbon loss. The most stable forest type under both wildfire scenarios are Dehesas. As regards bioregions, the Macaronesian area is the most affected and the Alpine region, the least affected. Our validation test revealed a total volume underestimation of 2.2% in 20 years. Conclusions: Forest wildfire scenarios provide more realistic simulations in Mediterranean forests. The results show the potential benefit of forest management, with slightly better results in schoolbook forest management compared to business-as-usual forest management. The EFDM harmonized approach simulates the capacity of forests to store carbon under different scenarios at national scale in Spain, providing important information for optimal decision-making on forest-related policies.

Graphical Abstract

1. Introduction

Forests store large amounts of carbon [1] and are a critical component of the global carbon cycle as they store over 80% of global terrestrial above-ground carbon [2]. According to the State of European Forests [3], in Europe, an average of 35.6% of carbon is stored in living biomass, comprised of above-ground biomass (28.5%) and below-ground biomass (7.1%) carbon pools. Thus, estimating carbon storage in trees as well as in harvested wood products is key to meeting the international information requirements related to the reduction of greenhouse gas (GHG) emissions [4]. Furthermore, under the Kyoto Protocol [5], the Paris Agreement [6], and Regulation 2018/841 of the European Union, countries are requested to estimate and report CO2 emissions and removals from forests [7].
The long lifespan of trees does not allow them to adapt to rapid environmental changes, so forests are particularly sensitive to global change. The associated disturbances will increase stress and decay and will also have severe implications for forest ecosystem dynamics [8]. Global change is likely to affect disturbance regimes, with an expected increase in frequency, size and severity of fires [9] along with outbreaks of insects and disease. Furthermore, global change will lead to increased frequency of extreme weather events, such as prolonged drought, storms and floods [10].
European-wide forest planning and decision-making require policy makers to forecast the long-term development of European forests under alternative management regimes. Forest management is one of the potential means to mitigate global change [11]. Wood production, forest resources and biodiversity show high sensitivity to management intensity [12]. Regeneration methods and thinning treatments that maintain a large proportion of mature trees are better, in terms of maintaining carbon stores, than those associated with more intensive removals [13]. Both carbon storage and wood production will help to mitigate global change, the former by storing carbon in the forest, the latter by substituting fossil-based materials and storing the carbon in the unused fossils and the by-products [14].
In Mediterranean forests, wildfires are one of the greatest concerns [15]. Several studies have revealed that wildfires are natural in Mediterranean areas worldwide and that some species and communities are adapted to or are the result of this disturbance [16]. However, forest wildfires are considered a major cause of erosion and soil degradation [17]. Like other ecosystem disturbances, forest wildfires are highly sensitive to climate because their behavior responds immediately to fuel moisture, which is affected by precipitation, relative humidity, air temperature, and wind speed. An increment in temperature over the Mediterranean basin, which is projected under several climate scenarios [18], will increase fuel dryness and reduce relative humidity, this effect becoming more severe in those regions where rainfall decreases [19]. Accordingly, an increase in extreme climatic events, causing prolonged droughts and hot spells, is expected to have a substantial impact on fire risk, severity and burned area in Mediterranean zones [20]. Consequently, wildfires may become more important in terms of determining the carbon sink capacity of Mediterranean forests [21].
Flexible models not only allow comparable estimates to be made for forest-related policies and management, but also provide support for international negotiations on the role of forests in European commitments to reduce greenhouse gases. Several flexible models have been developed that can be applied at European scale: European Forest Information Scenario Model (EFISCEN) [22,23,24], Global Forest Model (G4M) [25], Global Biosphere Management Model (GLOBIOM) [26] and outside Europe, the Carbon Budget Model of the Canadian Forest Sector (CBM-CFS3) [27].
The European Forestry Dynamics Model (EFDM) [28] was developed to simulate the development of the above-ground forest stock and estimate the volume of harvested wood for any given forested area. This model is particularly appropriate for this study because it is based on data from the European NFIs and considers different ecological, technical, and socio-economic constraints. The EFDM has been parameterized for uneven-aged [29] and ‘any-aged’ forest management, combining multiple Markov chain models [30,31]. Further studies have shown the possibility of parameterizing the EFDM to produce carbon-related metrics under climate-induced uncertainties [32]. A study developed by Vauhkonen et al. [31] showed the feasibility of using EFDM to establish future projections of the above-ground carbon and that associated with fellings in 23 European countries.
The objective of this study is to use the EFDM to forecast the living biomass and carbon of Spanish forests for the period (2000–2050) under three forest wildfires scenarios [33] and two different forest management regimes (business-as-usual allocation and schoolbook allocation). To evaluate the results, a validation process was carried out using available data from the latest Spanish National Forest Inventory (SNFI). We hypothesized that there will be a combined effect of, on the one hand, the increase in living biomass/carbon stored in the Spanish forests following the abandonment of traditional land uses and forest expansion, and on the other, the living biomass/carbon losses associated with both a more intensive management and an increase in forest wildfires based on future climatic scenarios. These forecasts provide key evidence for policy makers to disentangle the potential trade-offs between the effects of forest management and global change on Mediterranean forests. This is the first time that natural disturbances such as forest wildfires have been considered in the balance of living biomass and carbon stored in Mediterranean forests.

2. Materials and Methods

2.1. SNFI Data and Auxiliary Information

The SNFI is the primary source of forest data for national and large-area assessments because of the high number of monitored plots in the forests [34]. Since the Second SNFI, denoted SNFI2 (1986–1996), a continuous inventory has been conducted with permanent plots established in forested areas with an intensity of approximately of one plot per km2. Each plot is re-measured approximately every 10 years. A total of 81,024 sample plots measured in the Third Spanish National Forest Inventory (SNFI3, 1997–2007), were used as the input data for the EFDM (Figure 1). For validation purposes, the 13,667 plots measured to date in the Fourth Spanish National Forest Inventory (SNFI4, 2008-to date) were used (Table 1).
In each plot, trees are measured in four concentric circular subplots (5 m, 10 m, 15 m and 25 m radius) according to the diameter at breast height of the trees (dbh ≥ 7.5 cm, dbh ≥ 12.5 cm, dbh ≥ 22.5 cm and dbh > 42.5 cm, respectively). The following data are recorded in each plot: tree species, diameter at breast height, total height, and distance and azimuth from the plot center. SNFIs also record information on silvicultural practices, such as felled trees, soil preparation, pruning, and forest disturbances, such as forest fires or windthrows [35].
The EFDM is parameterized by matrices with dynamic and static dimensions or factors [36]. To analyze the dynamics of carbon storage in Spanish forests, SNFI plots were classified according to five static (forest type, known land-use restrictions, ownership, stand structure and bioclimatic region) and two dynamic factors (quadratic mean diameter and total volume) from SNFI field data recorded in each plot or using auxiliary cartographical information (Table 1).
One of the factors that most affects growth and management is forest species composition. The SNFI plots have been classified into seven different forest types: Broadleaf forests, Conifer forests, Mixed forests, Dehesas (open woodlands), Other Conifer forests, Conifer plantations, and Broadleaf plantations.
With regards to known land-use restrictions, forested areas can be subdivided into forest available for wood supply (FAWS) and forest not available for wood supply (FNAWS) [37]. The concept “Forests Available for Wood Supply” (FAWS) is defined as “forest where any legal, economic, or specific environmental restrictions do not have a significant impact on the supply of wood”; i.e., all forests except those with administrative restrictions. Therefore, “Forests Not Available for Wood Supply” (FNAWS) refers to “forest where legal, economic or specific environmental restrictions prevent any significant supply of wood” [38].
Ownership was classified as public or private according to data from the Spanish Nature Data Bank. Stand structure was classified as even or uneven-aged according to the Spanish Forest Inventory Service. The map of biogeographical regions of Europe was used as a reference for classification [39]. Spanish forests belong to four biogeographical regions: Alpine, Atlantic, Mediterranean and Macaronesian (Figure 1).
For forest wildfire scenarios, Vázquez de la Cueva et al. [33] developed estimates for future fire activity in peninsular Spain using regression models between monthly meteorological variables and the recorded fire activity in the period 1974–2005. With regards to results for the frequency of wildfires, a variable used in our modeling approach, the B2 scenario (characterized by medium–low greenhouse gas emissions, IPCC [40]) was found to cause a 2-fold increase and the A2 scenario (characterized by medium–high greenhouse gas emissions, IPCC [40]) a 2.5-fold increase in fire occurrence in peninsular Spain (see Vázquez de la Cueva et al. [33] for more detail).

2.2. EFDM Model

The EFDM [28] is a Markov chain and area-based matrix model, meaning that forest areas or strata (not trees or stands) are transiting between elements of a set of fixed states. The matrices represent forest areas classified according to ecological and socio-economic factors. The model simulates the development of the forest area distribution as a product of its initial state, proportions of areas expected to be managed according to different silvicultural practices, and the corresponding transition probabilities. The transition probabilities are conditioned by the activities, both of which can differ between factors. The parameterization of the Markov model is described in detail in Vauhkonen and Packalen [30].
Specific materials used in our simulations were:
  • Spanish Forest Map 1:50,000 [41] providing the cartographic base to assign the equivalent area to each plot.
  • The initial state (defined by the five static factors and two dynamics factors for each plot) was determined based on the SNFI3. The data processing involved the initial estimation and formatting of the data for the EFDM.
  • The dynamics of any-aged forest management were simulated by using the forest area classified in the quadratic mean diameter and volume matrix as an input for the EFDM, plus the five static factors. Starting from the statements provided by experts [28] and then following by an iterative process, static factors were weighted selecting those that minimized the error. The selected weights were as follows: forest type (1), bioclimatic region (0.4), known land-use restrictions (0.2), ownership (0.2) and stand structure (0.2).
  • Modeling the transitions due to natural processes was performed using pairwise observations from plots measured in both the SNFI2 and SNFI3 (51,676 plots out of 81,024 plots). These two data sets were also used to derive the transition probabilities matrix. Some plots, especially in the Atlantic bioregion, could not be included in the model because they were not re-measured in two consecutives inventories.
  • The activities applied in our simulations were “No Management”, “Thinning”, “Final Felling”, and “Wildfire”.
  • The activity probabilities were defined in two steps with two assumptions. First, the initial allocation of the harvests to the different types of forests was assumed to follow either the proportion of harvests carried out during the SNFI2–SNFI3 ten-year period (“business-as-usual allocation”, ABAU) or the application of future harvests in accordance with the specific silvicultural recommendations (“schoolbook allocation”, ASB) which are given in Serrada et al. [42] per species at national level. In a second step, the final values for the activity probabilities under both the allocations were obtained by iteratively adjusting the initial probabilities to produce the harvest levels in future, large-scale scenarios.
After running the EFDM, forest area for each time step in total volume, scaled-up to a hectare, is obtained for each stratum defined by the five static factors and two dynamic factors. From these results, standing volume, and fellings can be calculated.
Above- and below-ground biomass was calculated for all SNFI3 plots using species-specific allometric equations and diameter given by Montero et al. [43]. Biomass/volume ratios were then computed specifically for each stratum. Above- and below-ground biomass is calculated as follows:
W = R1 × V
where W: above- or below-ground tree biomass (dry weight, Mg), R1: biomass/volume ratio Mg m−3, and V: volume (m3).
Above- and below-ground carbon were also estimated through a similar process, using a species-specific carbon conversion factor (given by Montero et al. [43]) for the biomass previously calculated through allometric equations. Having calculated carbon/volume ratios for each stratum, above- and below-ground carbon is obtained:
C = R2 × V
where C: carbon (Mg), R2: carbon/volume ratio Mg m−3, and V: volume (m3).
Having derived projections for the future development of forests under both management allocations according to present scenario wildfire frequency, the simulations are then repeated, varying wildfire frequency proportions by 2 and 2.5 times the present frequency for B2 and A2 scenarios, respectively, given by Vázquez de la Cueva et al. [33]. It was assumed that wildfire severity was always severe, so the forests affected were forced to transition to the beginning of the rotation.
Therefore, a total of six combinations of management regimes and wildfire scenarios were considered in the study (Table 2).
To determine the accuracy of the model predictions, the relative bias (rBias, %) of the model was calculated [44] using the statistics:
r B i a s ( % ) = o b s i e s t i e s t i   ×   100   with   ideal   value   =   0
where esti: ith estimated value; obsi: ith observed value.

3. Results

3.1. Business-as-Usual Allocation (ABAU) Management

A comparison of the changes in living biomass and carbon stock in Spanish forests as a result of the effects of wildfire is shown in Figure 2 and Table 3. If present climatic conditions (Combination 1) are considered, the simulation of total carbon stock reveals an increase from 629.0 M Mg in 2000 to 1115.4 M Mg in 2050 (+77%). In the same period, total biomass goes up from 1325.8 M Mg to 2366.7 M Mg (+78%), the growing stock increases from 962.0 M m3 to 1844.0 M m3 (+91%), and harvesting from around 75 to 183 M m3 of roundwood over a ten-year period (+143%). Because biomass and carbon behavior are so similar, we limit the discussion below to the results for carbon.
Carbon sequestration varies significantly among static factors (Table 4) under the present scenario between 2000 and 2050. The greatest increases in carbon stock values (in percentages) are those for Other Conifer (+116%) and Conifer (+113%) forests, and the lowest values correspond to plantations (Broadleaf +44% and Conifer +41%) and Dehesas (+38%). We found similar carbon stock increments for FNAWS and FAWS (+78 and +77%), and ownership, with +79% for private forests and +75% for public forests. Even-aged forests (+97%) display a larger carbon stock increment than uneven-aged forests (+69%). Mediterranean areas present the highest increment, +95%, followed by Alpine areas (+59%). The increase in carbon stocks in Atlantic and Macaronesian areas is far lower, at +38% and +23% respectively.
The higher fire frequency under the B2 and A2 scenarios (2 and 2.5 times the present frequency, respectively) results in a declining trend in the carbon stocks. The B2 scenario (Combination 2) shows a total carbon stock of 972.8 M Mg (+55%) at the end of the simulation, which is 22.7% lower than was simulated in the present scenario. Under the A2 scenario (Combination 3), the final value is 908.9 M Mg (+44%), which is 32.8% lower than under the present conditions scenario.
The most affected forest type under the two climatic change scenarios which consider increased wildfire frequency (B2 and A2) is Mixed forests (−27% and −39%) followed closely by Broadleaf forests, Conifer forests and Broadleaf plantations (−25% and −36%). In contrast, Dehesas (−1.6% and −2.4%) display greater stability in the face of changing fire occurrence (more details in Appendix A, Figure A1, Figure A2, Figure A3, Figure A4, Figure A5, Figure A6 and Figure A7). As regards wood supply, there is little variation in availability, with carbon stocks decreasing in 2050 by around −23% for scenario B2 and −33% for scenario A2 for FAWS, whereas the decrease is −24% and −35% in the case of FNAWS. Changes in carbon stocks are very similar for private and public forests, with around −23% under the B2 scenario and −33% for the A2 scenario. Even-aged forests seem more affected by forest fires (−25% and −37%) than uneven-aged forests (−21% and −31%). The Macaronesian region is the most affected, the decrease being −32% under the B2 scenario, and −44% under the A2 scenario. The Alpine region, with −5% and −7% under the B2 and A2 scenarios, appears to be the least affected by changes due to forest wildfires (Table 4).

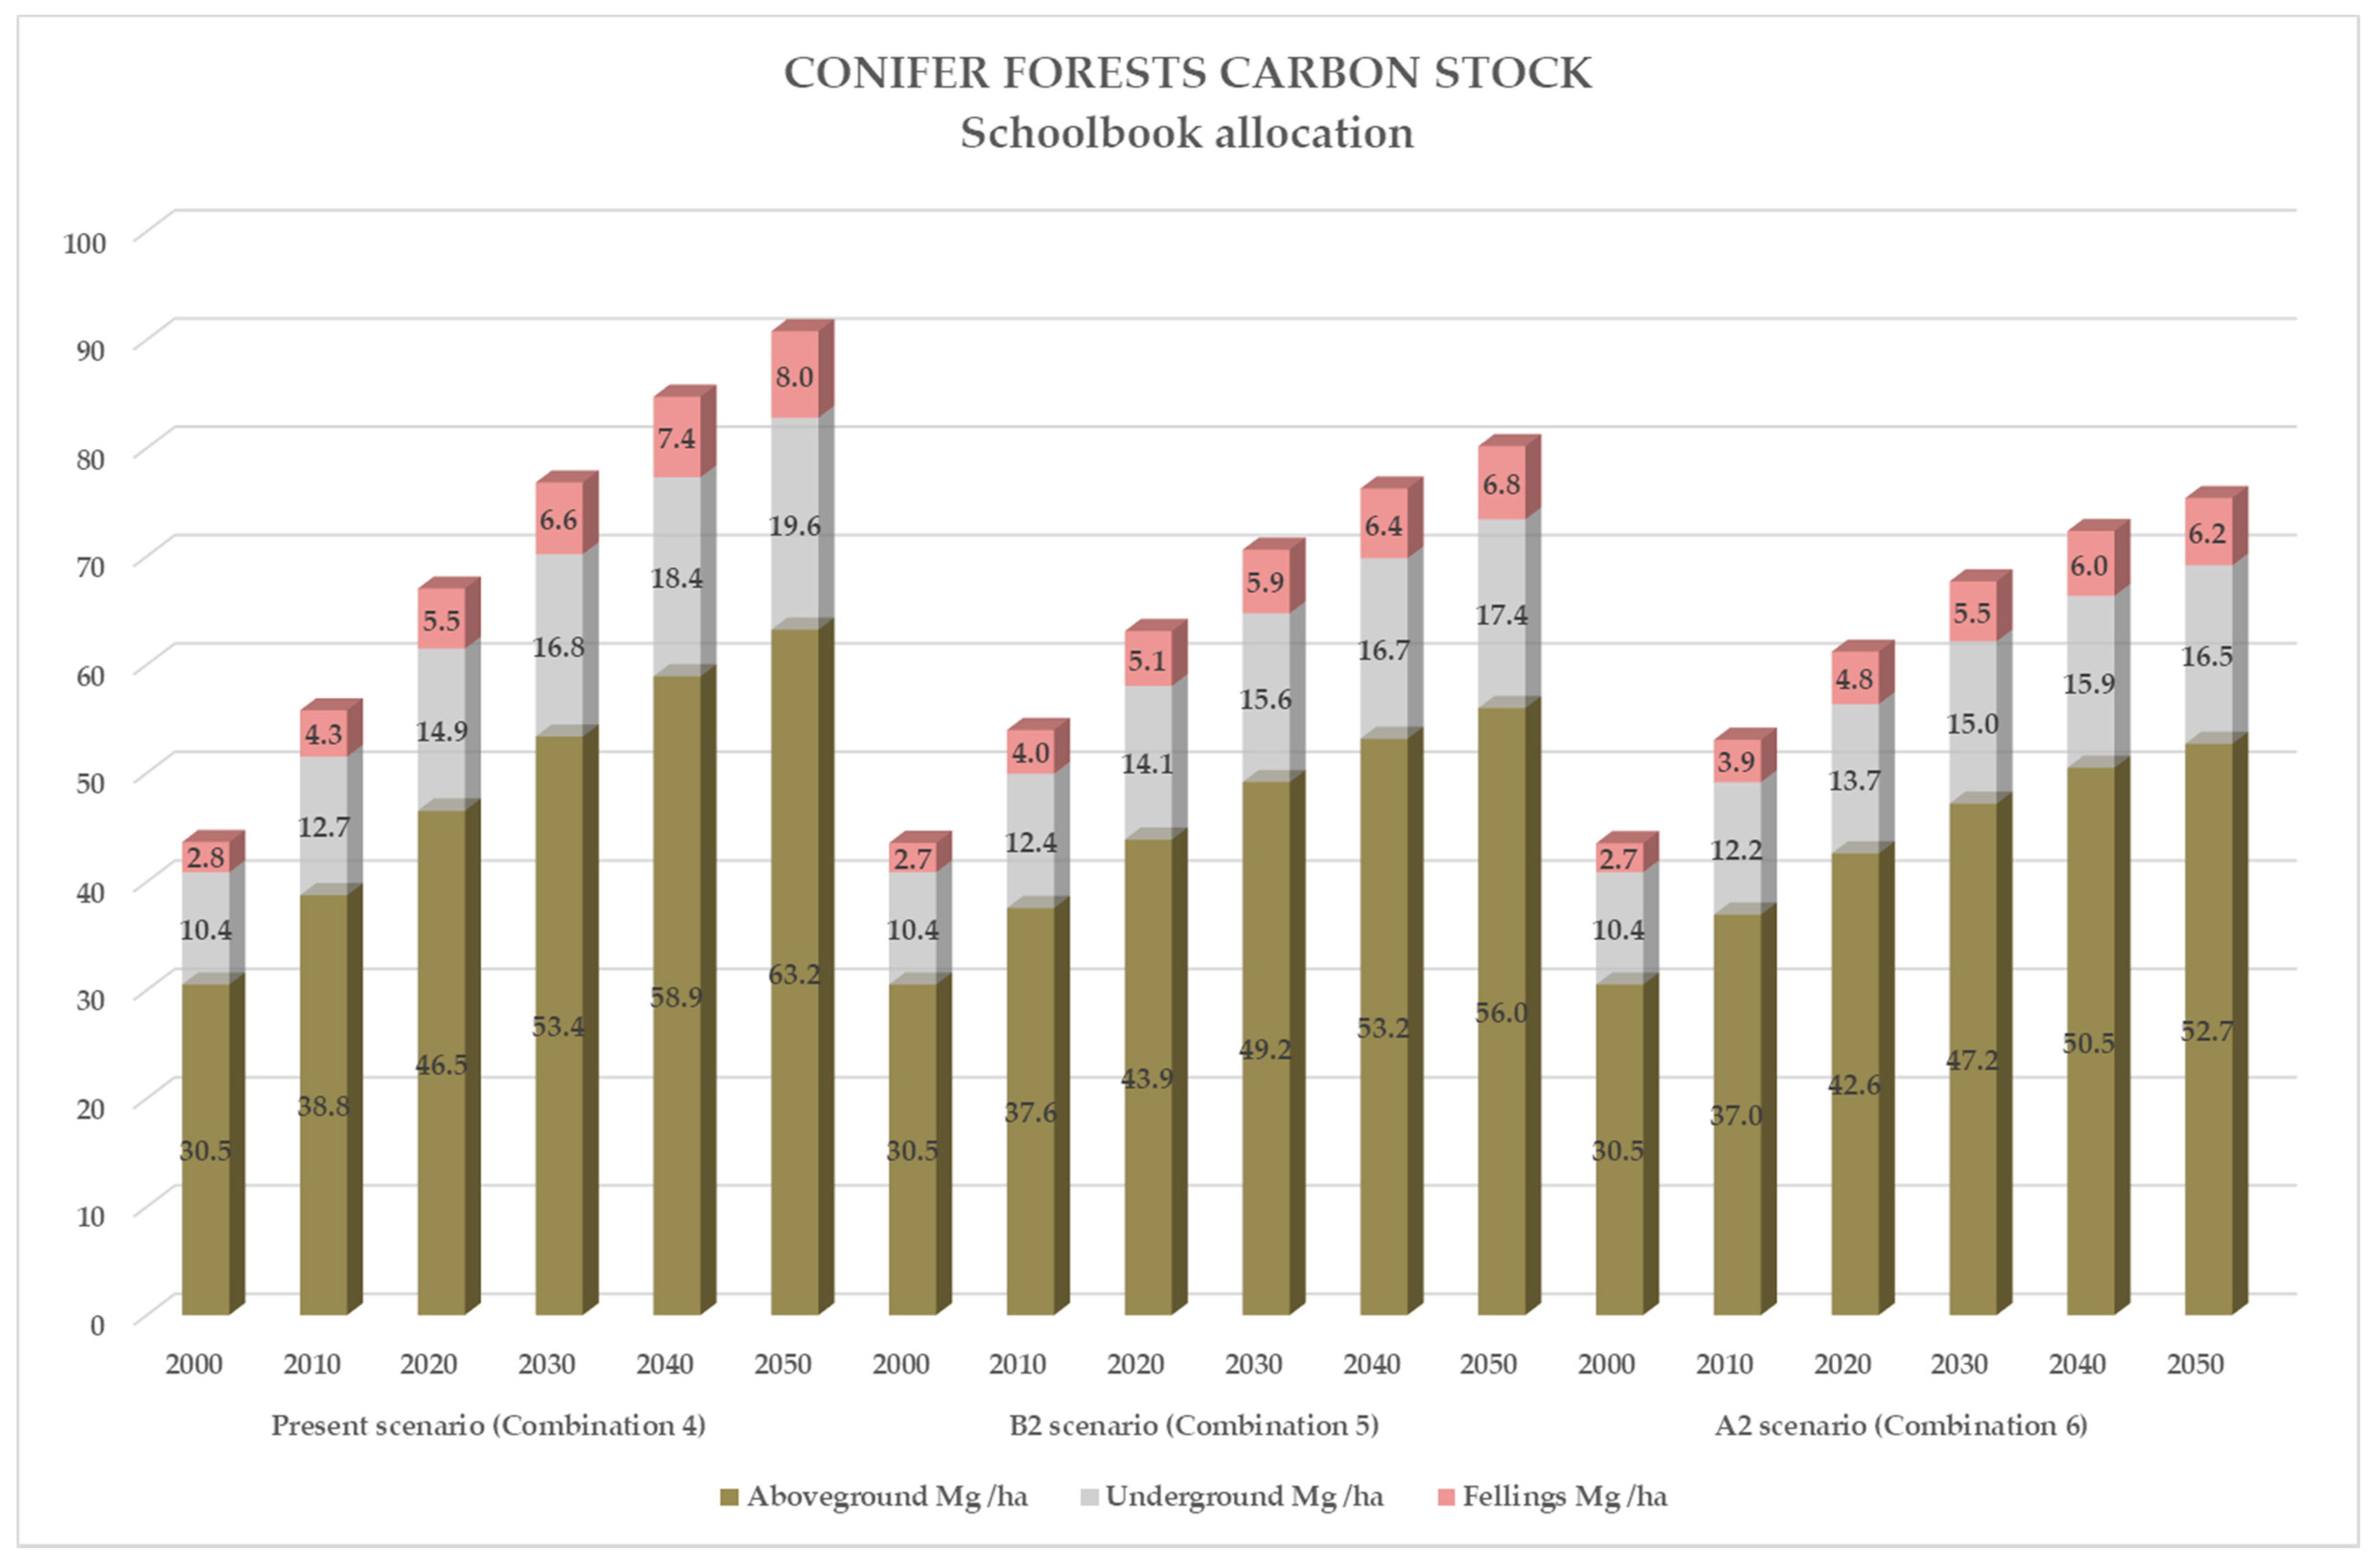
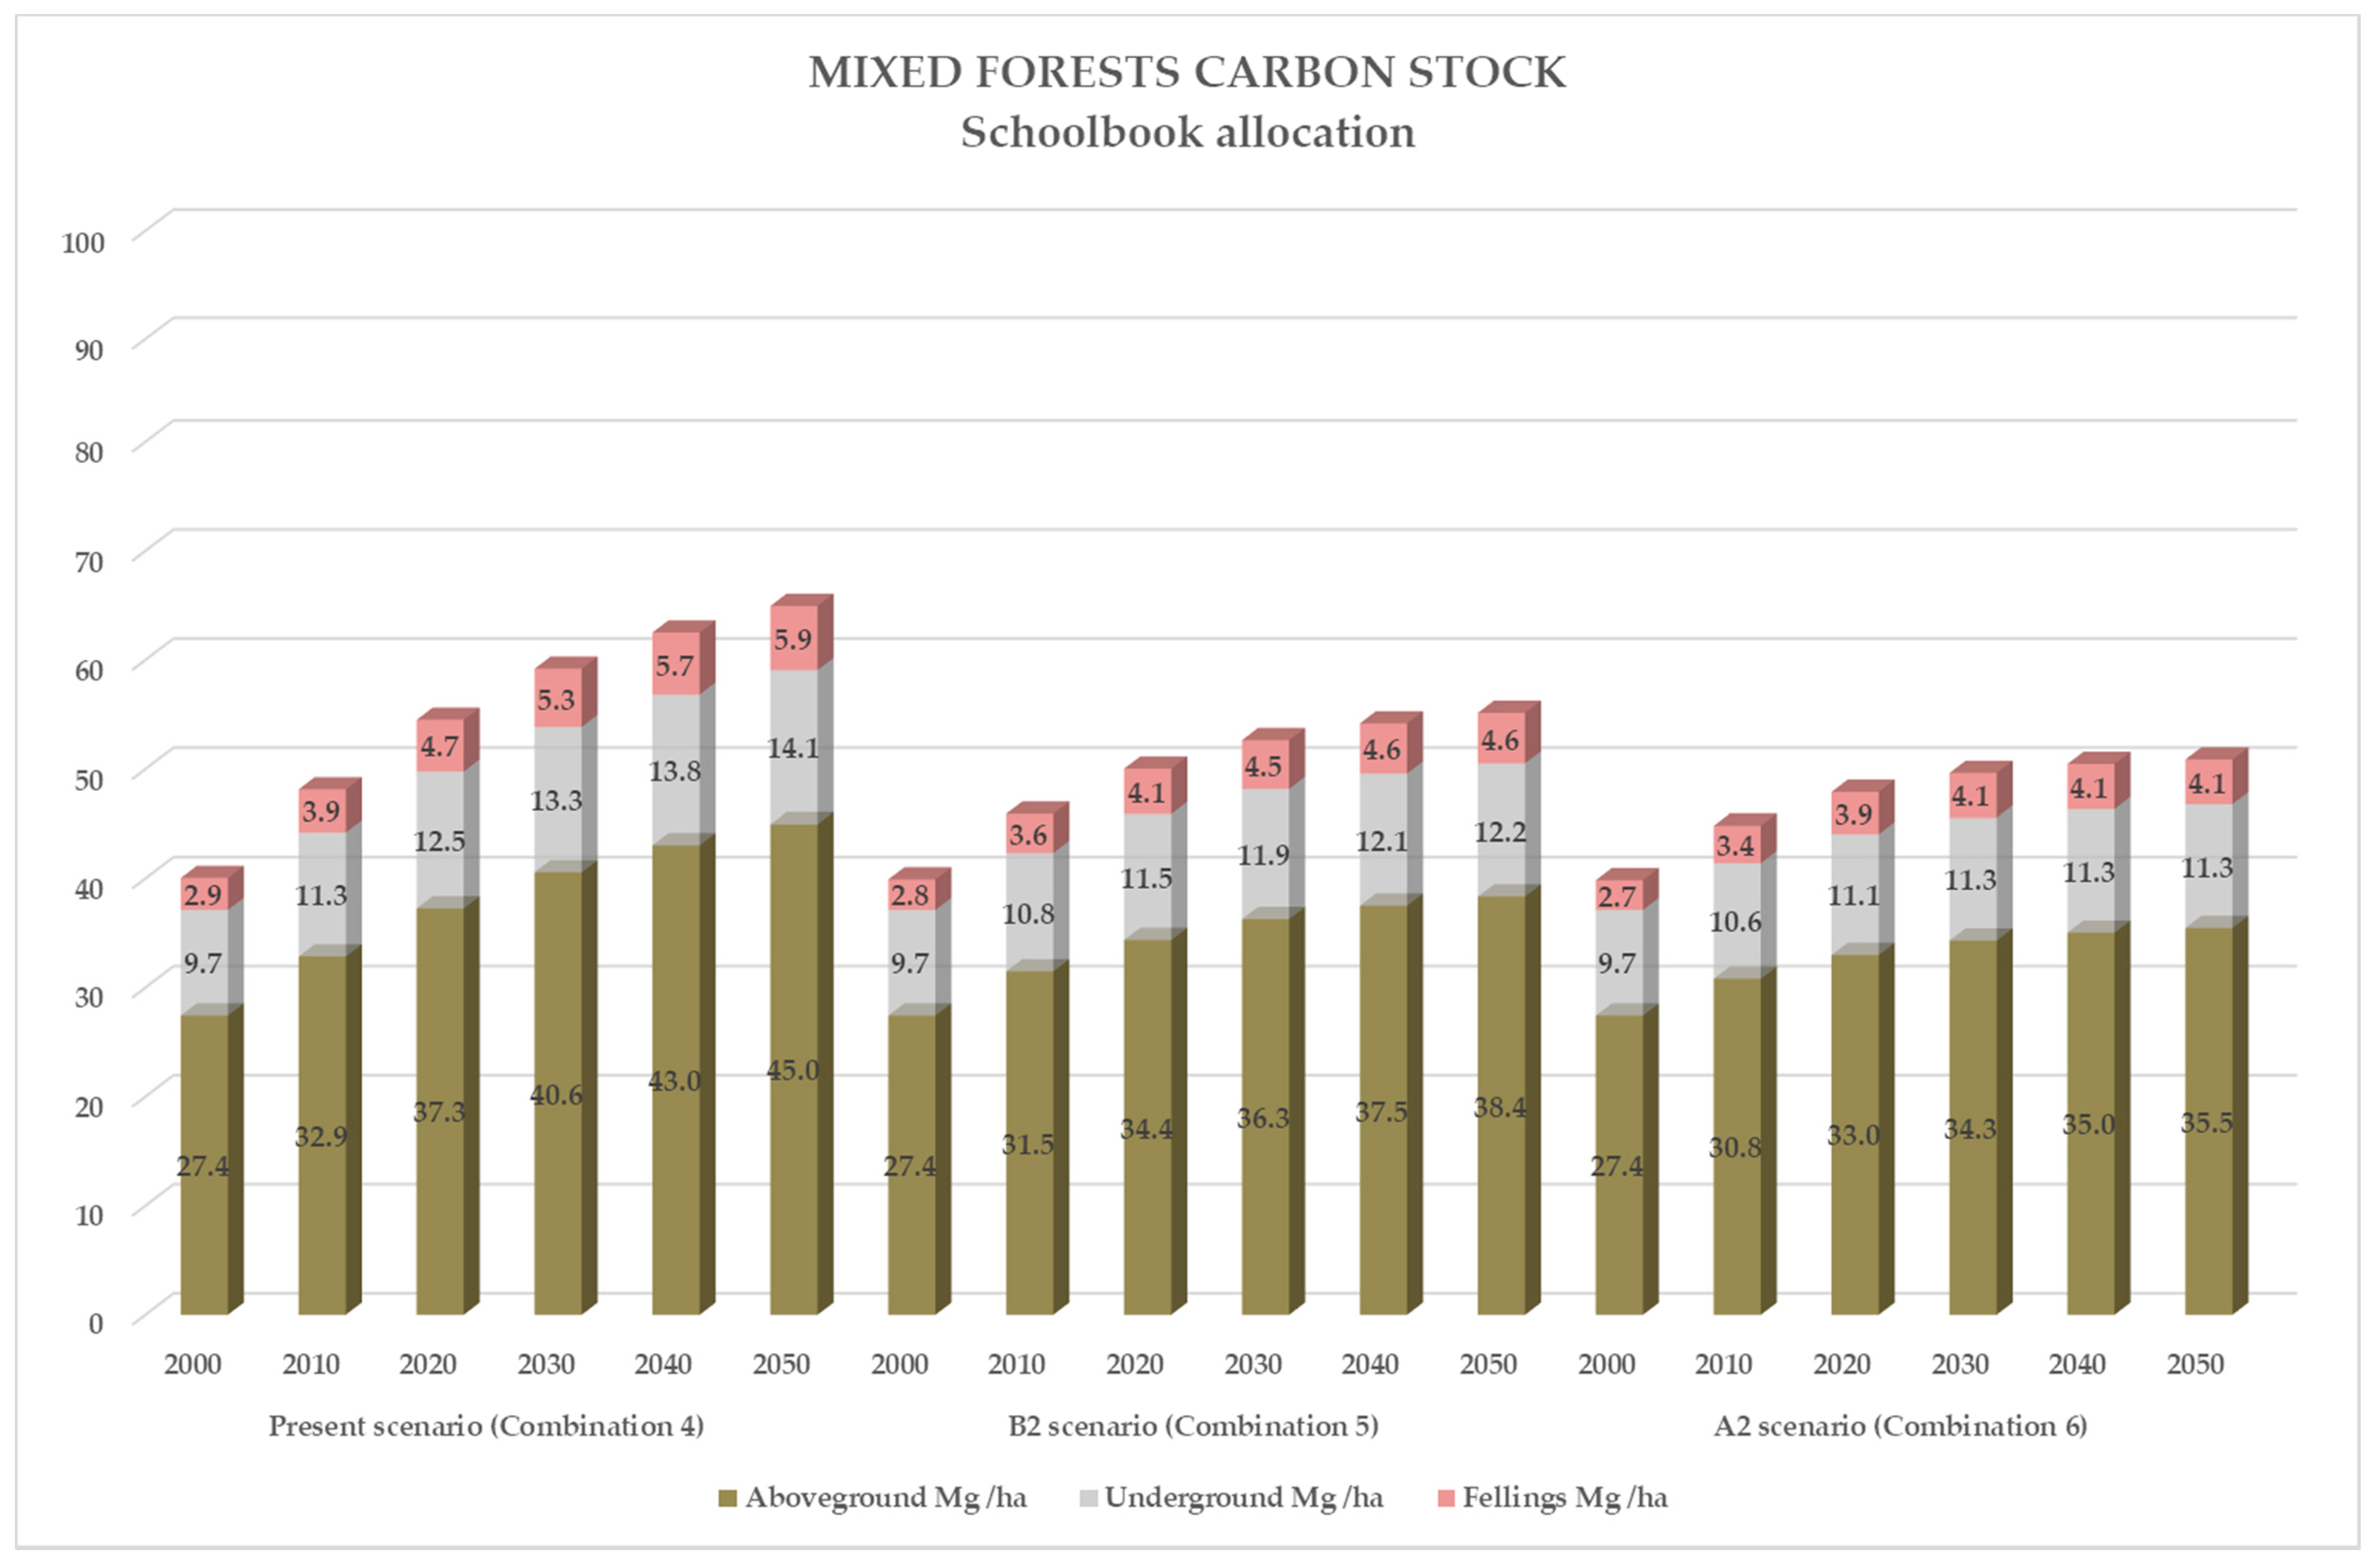
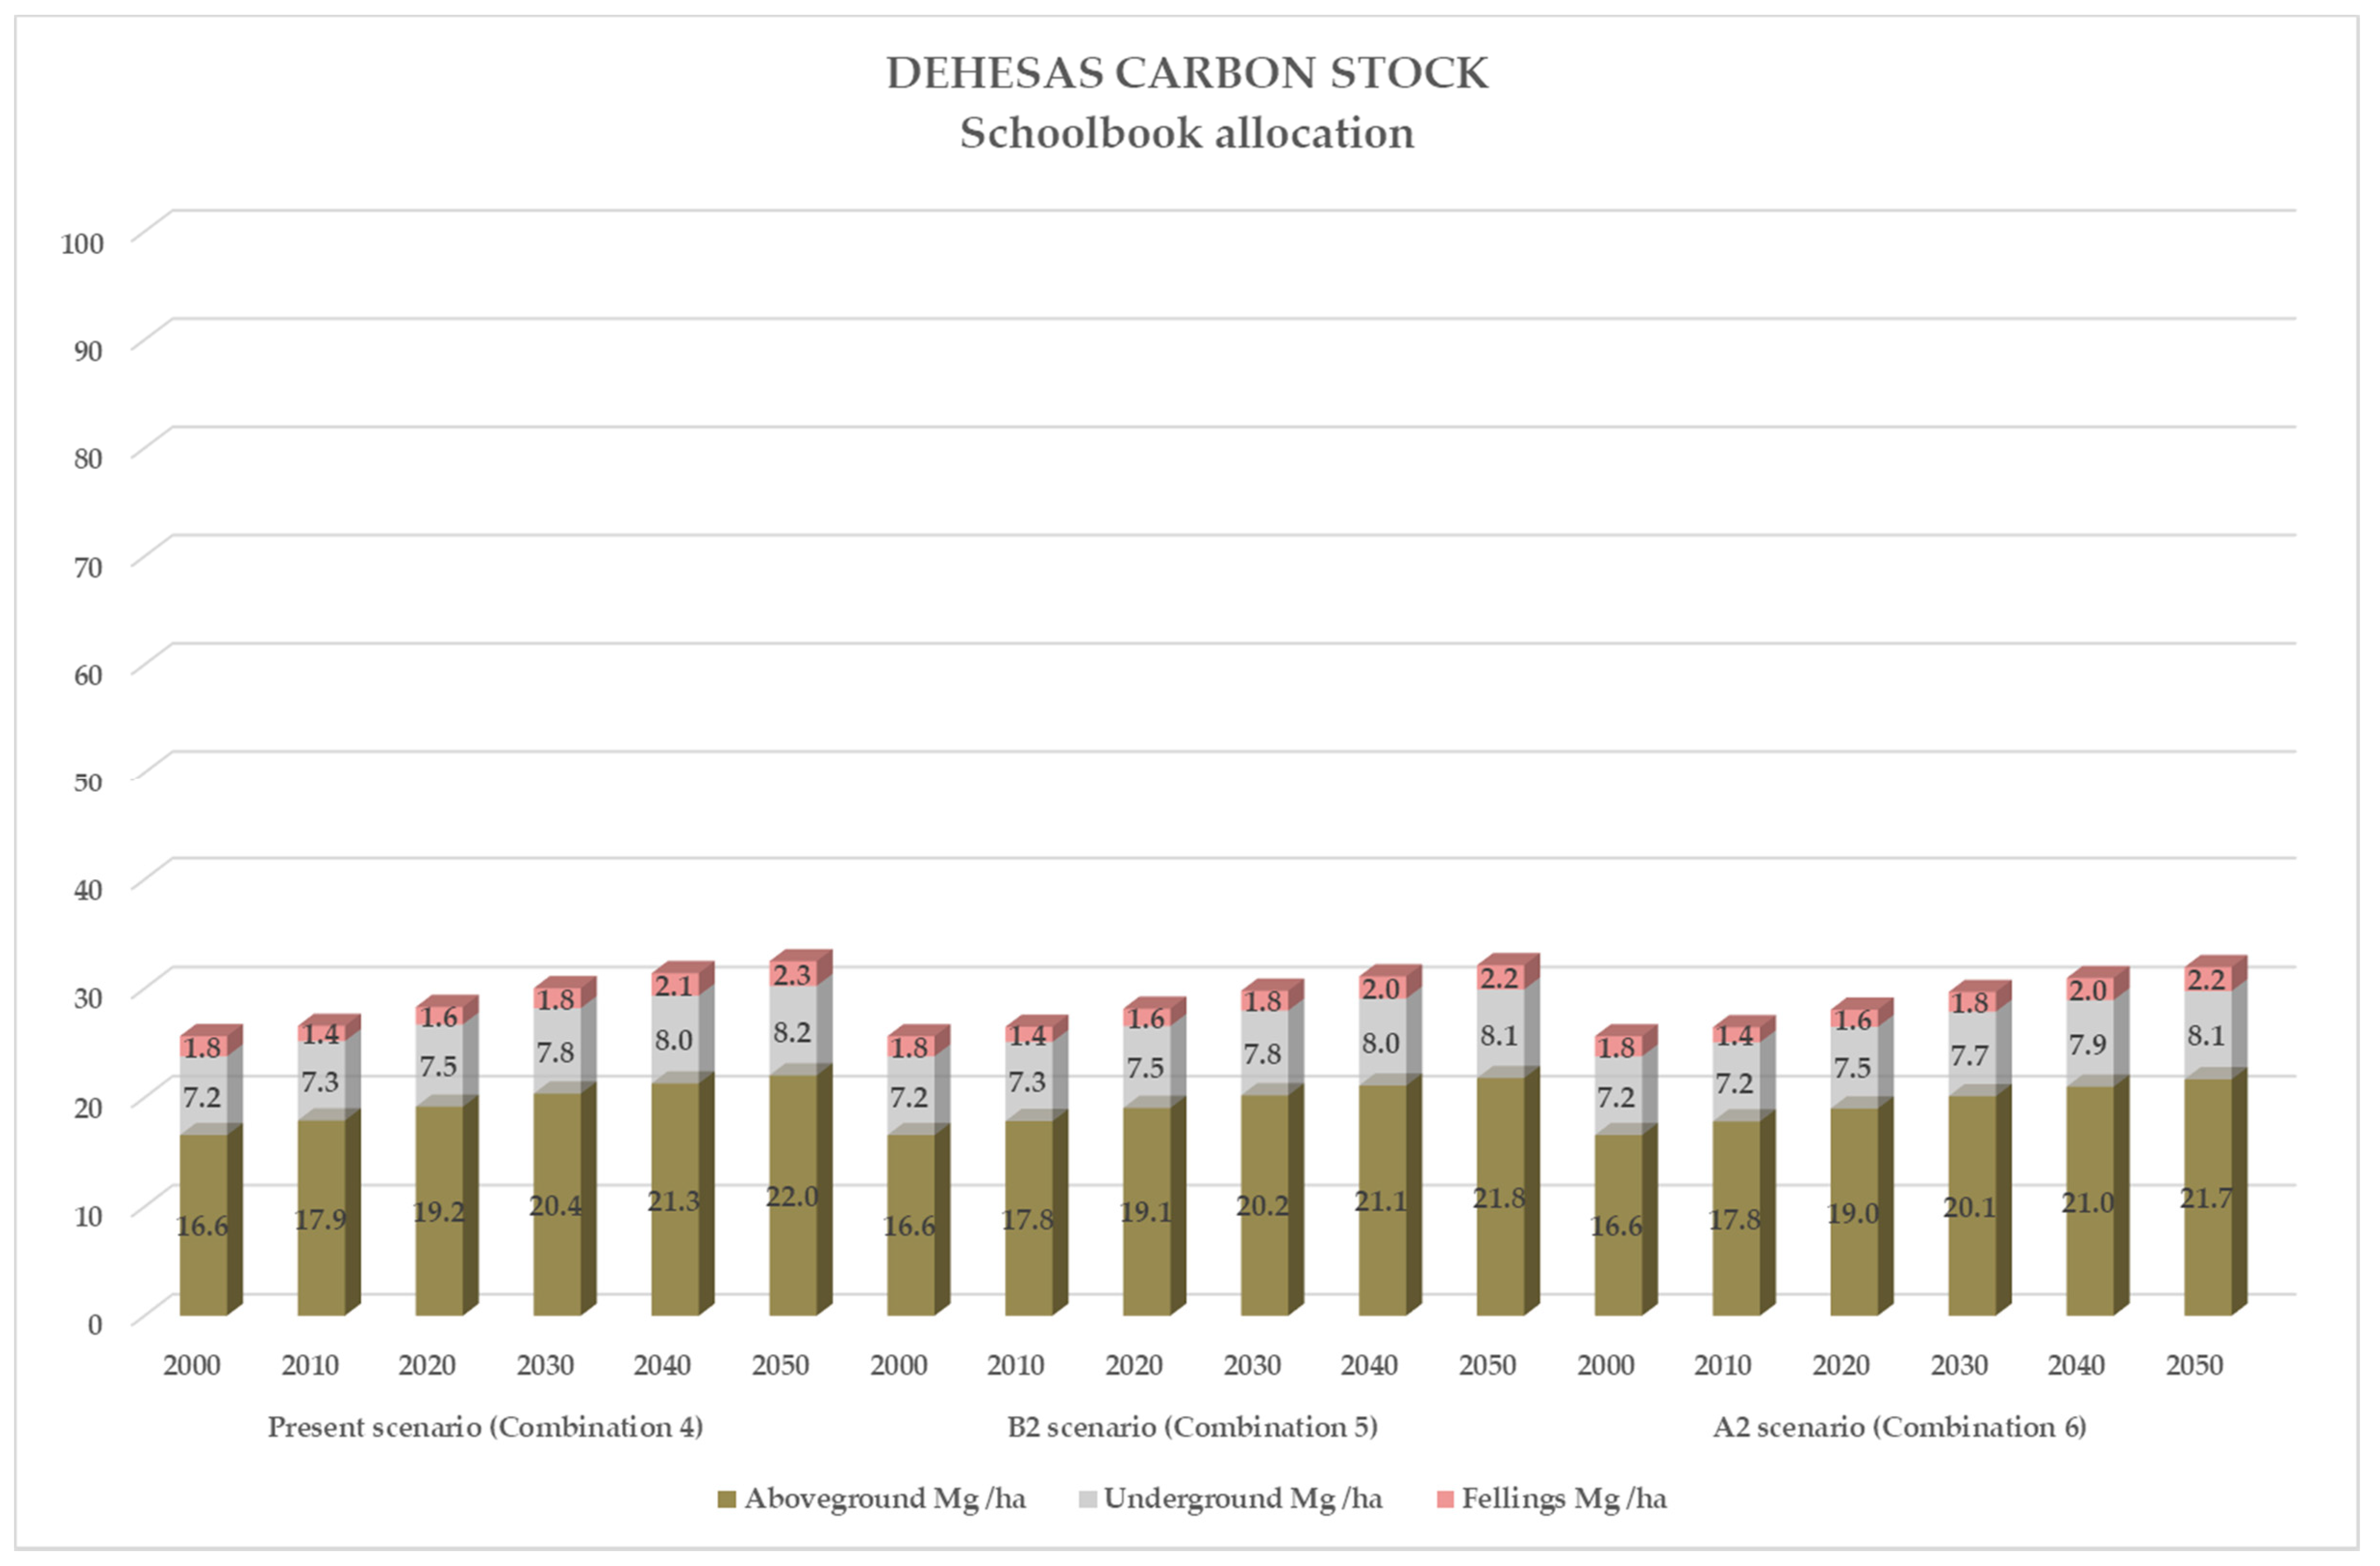
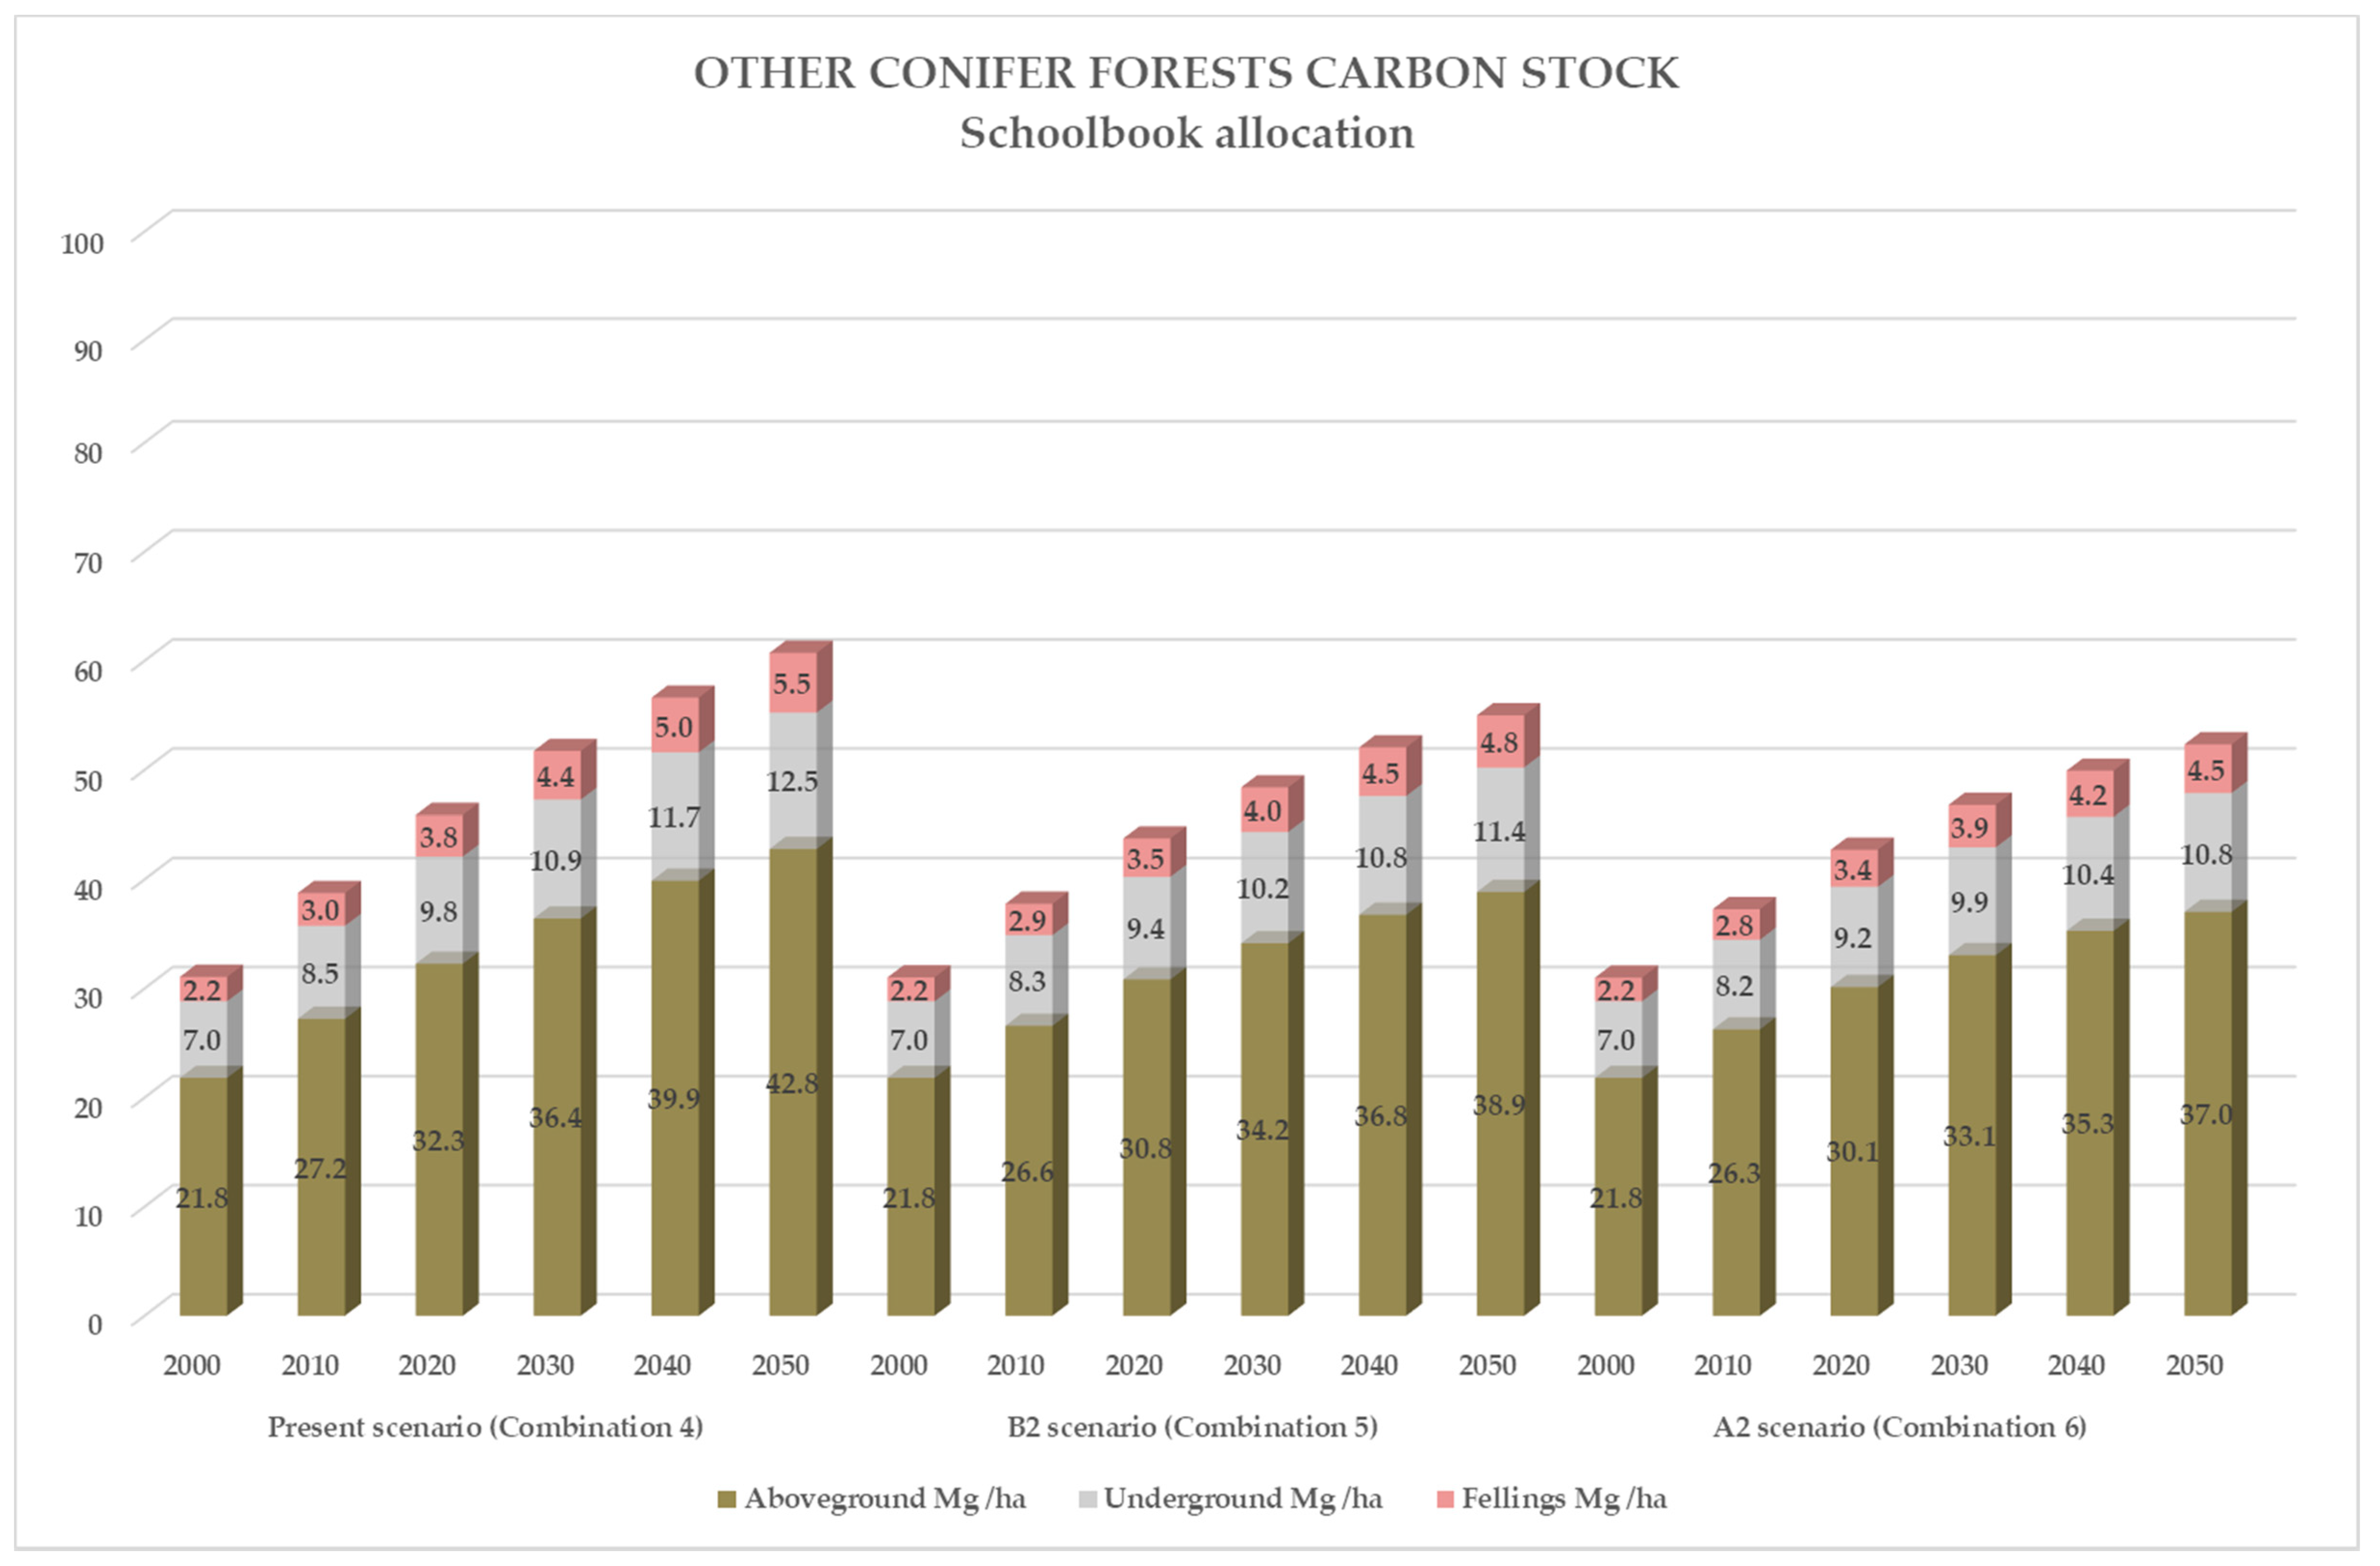
3.2. Schoolbook Allocation (ASB) Management

Figure 3 and Table 5 show carbon stock for time series over the present and future 50-year period for the three different wildfire scenarios under ASB management. Over recent decades, ABAU in Spain has been lower than that associated with the silvicultural recommendations, so ASB management means an increase in harvests and consequently, a decrease in growing stock.
Simulation of total carbon stock for Spanish forests under ASB management (Combination 4) indicates an increase from 642.1 M Mg in 2000 to 1103.7 M Mg in 2050 (+72%). Compared to ABAU, the ASB resulted in a −3.0% drop in growing carbon stock (above-ground and below-ground carbon) in 2050 (from 1044.3 M Mg C to 1013.1 M Mg C). The accumulated harvest in a ten-year period increases from around 75–183 M m3 to 102–230 M m3, an increase of 36% in the first ten-year period and 26% in 2050.
Among the different forest types (Table 6), the highest carbon stock increment values (in percentages) were for Conifer forests (+107%) and Other Conifer forests (+95%). The lowest values were in Conifer plantations (+20%) and Dehesas (27%) (more details in Appendix B, Figure A8, Figure A9, Figure A10, Figure A11, Figure A12, Figure A13 and Figure A14). Because of the strict no felling policy in FNAWS, the carbon stock is +92% higher, whereas the increment in FAWS is +70%. Public (+66%) and private (+77%) forests present different increments. The total carbon stock for even-aged forests (+78%) is higher than that for uneven-aged forests (+69%). The Mediterranean area presents the highest increment (+92%), followed by Alpine areas (+43%). Lower increments are found for the Atlantic and Macaronesian areas (+29% and +23%) between 2000 and 2050 under the present scenario.
The simulations of climate scenarios reveal lower carbon stocks under both scenarios, although the decrease is a little less than under the business-as-usual allocation. Under the B2 scenario (Combination 5), the total carbon stock is predicted to be 968.6 M Mg (+51%) by the end of the simulation, this being 20.7% lower than for the simulation of the present condition scenario. Under the A2 scenario (Combination 6), carbon stocks reach 908.5 M Mg (+42%), although this is 29.9% lower than under the present scenario.
Considering static factors, the results are similar to the business-as-usual allocation, but there are slight differences. As for forest types, the B2 and A2 scenarios have a greater effect on Broadleaf, Conifer, Mixed forests and Broadleaf plantations (around −24% and −34% in all cases). The two scenarios have little if any influence on Dehesas (−1% and −2%). FNAWS are more sensitive (−26% and −38% carbon stock in 2050 for B2 and A2 scenarios) than FAWS stands (−20% and −29%). As regards ownership, the results point to a similar decreasing trend in carbon stock under both scenarios, around −20% under the B2 scenario and −30% under the A2 scenario. Under the B2 scenario, even-aged and uneven-age forest carbon decreases by around −21%. This similarity is maintained under the A2 scenario, with around −30% in both cases. As occurred under ABAU, the Macaronesian area is the most affected under both the B2 and A2 scenarios (−33% and −45%), followed by the Mediterranean (−23% and −33%) and Atlantic (−19% and −27%) areas. The Alpine area presents a much smaller decrease, with −4% under the B2 scenario and −6% under the A2 scenario (Table 6).
Table 7 summarizes all the differences between management allocation in total carbon stock in 2050 considering static factors and the different scenarios. With the exceptions of FNAWS (as mentioned, with a strict no felling policy) and the Macaronesian region, all cases show slightly better results with the schoolbook allocation than with the business-as-usual allocation. Schoolbook allocation shows a total improvement of 2% in Present-B2 scenarios and 2.9% in Present-A2 scenarios against business-as-usual allocation. The greatest differences were found in Mixed forests (3.4% and 5%), Conifer plantations (3.7% and 6%) and even-aged stands (4.2% and 6.3%), respectively.

3.3. Validation

Table 8 presents the relative bias rBias (%) when EFDM is validated using the 13,667 plots currently available belonging to the SNFI4 using values from the SNFI2 as the initial state (20-year prediction). If we consider the total forest area, EFDM underestimates the total volume (M m3) by 2.2%. Analyzing forest types, Mixed forest stands out with a high relative bias (11.5%). For the rest of the forest types, except for Broadleaf plantations (7.7%), the relative bias is less than ±5%. Wood supply and ownership present a similar error (1.7–2.2%) in all cases, while for stand structure there are differences between even-aged (5.5%) and uneven-aged forests (0.2%). The Macaronesian area shows the greatest underestimation (13.4%), followed by the Atlantic area (8.4%). The relative bias for the Alpine (0.4%) and Mediterranean (−1.9%) areas are much lower.

4. Discussion

The Kyoto Protocol [5] requires every industrialized country to have a transparent and verifiable method for estimating the size and evolution of the carbon stored in forest ecosystems. More recently, the Paris Agreement [6] encourages action to be taken to implement and support both policy approaches and positive incentives for activities relating to reducing emissions. Alternative policy approaches are also proposed, such as joint mitigation and adaptation approaches for the integral and sustainable management of forests.
This is the first study to simulate the future living biomass and carbon stocks of the Spanish forests under any-aged management, using an area-based matrix model that considers different/alternative management and wildfires scenarios. The study focuses on harmonized definitions, assumptions, and methodology to account for the administrative restrictions affecting forest use.
A significant interaction was found between the disturbance effects of higher wildfire frequency (B2 and A2 scenarios) and decreasing forest management, which supports the hypothesis that warming and abandonment of forest management have a synergistic effect on the forest carbon balance, as reported in previous studies conducted in Spain [45,46]. The thinning response hypothesis [47] asserts that thinning does have a significant influence on stand volume stock at the end of the rotation period for a wide range of thinning intensities or stocking densities, whereas heavier thinning beyond the considered range reduces volume stock. Hence, although there are no large differences in total carbon stock, our results reveal the potential benefit of forest management regarding biomass and carbon stocks. Moreover, Ruiz-Peinado et al. [46] conclude that in Mediterranean areas, forest management is an effective way to maintain and enhance high carbon sequestration rates. Vauhkonen & Packalen [36] states that the carbon stored by Finnish forests can be higher by applying less intensive management systems, but the extensive shifts from conventional even-aged management to alternative management systems exhibited a strong impact on harvesting costs. In eastern North America (State of New York), a multicriteria decision analysis approach identified and quantified trade-offs among three important ecosystem services—timber, carbon and habitat quality—under commonly used management scenarios. The most intensive management yielded greater timber volumes but resulted in the weakest carbon and habitat quality scores. For carbon storage, No Management resulted in higher utilities than the two other scenarios [48].
One of the objectives of sustainable forest management is to reduce the competition among trees through silvicultural operations and release resources to the remaining trees [49]. In Spain, there has been a progressive abandonment of forest management operations over recent decades, which could have increased competition for resources (mainly water) and increased the vulnerability of forests to climate change [50]. With regards to the findings for the ASB management scenario, several studies have concluded that regeneration methods and thinning treatments that maintain a large proportion of mature trees are better, in terms of maintaining carbon stores, than those involving more intensive removals [51]. However, such treatments can provide the opportunity for long-term off-site carbon storage in forest products made from the felled wood [23]. In contrast, extended rotations with high stocking levels to maximize on-site stores lead to the lowest levels of live carbon increment [11] and higher carbon loss in the case of wildfire disturbance.
Regarding forest types, the results show Mixed forests to be one of the most affected by higher wildfire occurrence, although its complexity in terms of forest structure may foster self-regulation and provide greater adaptability to cope with increasing uncertainty due to global change [52]. Nevertheless, the stability of Dehesas is noteworthy under all scenarios, with a −2% variation under both management approaches. The open distribution of the mature oak tree population in the Dehesa woodlands protects them from the risk and severity of wildfires. The Spanish Dehesa is a noteworthy example of a managed, anthropogenic, Mediterranean ecosystem. Dehesas are agrosilvicultural open woodlands comprised mainly of Quercus sp., with holm oak (Quercus ilex L.) being the most common species, followed by Quercus suber L. These oak stands are not suited to traditional, intensive forestry because of the poor sandy soils and variable, dry Mediterranean climate [53,54].
Our findings show that the Macaronesian area (located in the Canary Islands) is the most affected by wildfires, with almost four times more occurrence than in the other three bioclimatic areas. According to the SNFI3, almost 12% of the plots located in the Macaronesian area experiences a wildfire between 1990 and 2000, as opposed to less than 3.5% in the other three areas. Our model shows that the effect of increasing forest wildfire occurrence on the Macaronesian area is particularly high, with carbon stock decreasing by −32% and −44% in 2050 under B2 and A2 scenarios, respectively. The frequency of wildfires in the Canary Islands has risen since the arrival of the human population to the islands [55] and the number of anthropogenic related fires quadrupled between 1970 and 2010 [56]. Burned subtropical cloud forests are more prone to increased wildfire events due to a greater presence of pioneer species, a higher density of trees, climatic variables which tend to range more widely throughout the day, and the long time span needed for recovery to a pre-fire state [57]. However, the Canary Island pine, which accounts for more than 30% of Macaronesian forest area, is characterized by its fire adaptation strategies [58].
The simulation results underestimate the values for all forest types in the validation data set. Simulation from SNFI2 data for the total area had a mean volume of 2.2% less than the SNFI4 real data (20-year simulation). Higher relative biases correspond to forests with broadleaf species (Broadleaf plantations and Mixed forests). Broadleaf plantations are particularly difficult to project because the rotation is usually around 12 years, close to the ten-year measurement carried out in the SNFI. Moreover, not all forest types considered, such as Dehesas or Other conifer forest, are well represented in the validation database. Other studies using the SNFI to analyze forest dynamics and ecological processes covering a wide regional or national scale, including high variability, also found low or moderate predictive ability [53,59,60].
The production of forest biomass as a carbon-neutral alternative for renewable energy production [61] can be increased by using specific biomass crops or by changing forest management in plantations of exotic or native species [62]. Broadleaf and Conifer plantations together make up just over 7% of the total area and accounted for almost 12% of total carbon in 2000. They are not greatly affected by forest wildfire scenarios under ABAU, which suggests that the production of biomass from Eucalyptus species as well as products from other fast-growing species used in plantations such as Pinus pinaster Ait. and Pinus radiata D. Don, will be maintained.
Our simulations considered carbon stocks in above- and below-ground forest biomass, focusing on standing living trees included in the Spanish NFIs. Tree biomass represents one of the main carbon sinks in forests [63], but shrub biomass could be also important in terms of carbon sequestration, particularly in the context of the Mediterranean basin [64]. In Spain, the amount of area covered by shrubs accounts for more than 35% of the forested land [65] and will likely increase in the future due to the abandonment of crops and disappearance of forests, caused by increased temperatures and drought and the probable increase in the occurrence of forest fires [64]. Other important carbon reserves not included in the current study are soils, litter, and dead wood, which should be included in the future to correctly model the total capacity of forests as carbon sinks.
In this research, the fire hazard under different climatic scenarios was accounted for using the forecasts reported by Vázquez de la Cueva et al. [33]. These authors only considered the direct effects of climate change on wildfire activity for different IPCC climate change scenarios, although any conclusions will be limited by not including the possible effect of other factors, besides that of climate change, on fire occurrence probability. Weather and climate are among the main factors influencing wildfire potential, but human activities such as land-use change [66] and socio-economic factors [67] greatly influence fire regimes. Additionally, fire has other direct effects on the vegetation that we have not considered, such as species distribution, migration, substitution or extinction [68]. Furthermore, apart from wildfire risk and severity, changes in climate are expected to affect other ecological processes in the Mediterranean basin which are not considered in this research. Some examples of these processes include regeneration, growth and mortality rates [69].
The EFDM is a well-developed research tool to support the assessment of forest policy effects through management and the generation of scenarios for sustainable management of forests in Europe at sub-national, national and international level [28]. Nevertheless, it should be stressed that EFDM simulation results are assumed to be deterministic, so uncertainties associated with the state of the space, activities, transition probabilities, and output coefficients are not considered [28,30]. Additionally, the EFDM assumes fixed cycles (10 years in our study), but the measurements can often go on for longer or shorter periods than that.
According to Regulation 2018/841 of the European Union, the forest reference level (FRL) must be estimated by each EU Member State considering similar forest management practices to those of the period 2000–2009. Forsell et al. [70] state that there is an interval of the FRL in which predictions may vary depending on several factors such as the ecological bioregions. They also show that assumptions related to climate change, such as forest fires and the allocation of forest management practices, have the greatest impacts on the FRL estimates, while the start year of the projection or the stratification of the forest have lower impacts on the FRL estimates. Our results show that national projections can differ considerably due to the effects of disturbances depending on the different scenarios considered, especially for the Macaronesian and Mediterranean bioregions.
Because of the harmonized approach, the results can be easily compared with other projections at European Member State level. Vauhkonen et al. (2019) presented future projections of the forest above-ground carbon in 23 European countries using EFDM. Their results varied between 105.6 Mg C ha−1 (Switzerland) and 31.8 Mg C ha−1 (Finland) in 2040, with a growth ratio up to 59% (Ireland) between 2015–2040. Our results show 45.4 Mg ha−1 of above-ground carbon in 2040 and a growth ratio of 29.2% between 2015–2040. Furthermore, they can also be compared with those computed for the same area using less harmonized approaches such as national projection models. Previous studies have focused on quantifying biomass and carbon stocks in Spanish forests. Montero et al. [43] developed the first species-specific allometric equations for above-ground and below-ground fractions to calculate tree biomass and carbon content. Their calculation was 1806 M Mg CO2 (492 M Mg C) in 1990 (from SNFI2 data) and an estimation of 2858 M Mg CO2 (779 M Mg C) in 2004 based on annual carbon increments. A study by González-Diaz et al. [71] quantifies the mean value for total carbon stored as 43.35 Mg C ha−1 for the SNFI3, dated in 2000, using the same species-specific allometric equations developed by Montero et al. (2005). Both estimations are slightly higher than those of our simulations, which were 629.0 M Mg C (38.6 Mg C ha−1) in 2000 and 764.9 M Mg C (46.9 Mg C ha−1) in 2010, where biomass/volume and carbon/volume ratios specific to static and dynamic factors were applied to calculate biomass and carbon instead. Nevertheless, the national living biomass carbon value reported by Spain for FOREST EUROPE [3] for 2010 was 569.56 (423.6 M Mg C for above-ground and 140.1 for below-ground), which is lower than our estimations. This comparison may provide useful insights into the influence that harmonizing may have on both national and international policy and decision-making.

5. Conclusions

The EFDM harmonized approach allows us to simulate the capacity of forests to store carbon under different management and wildfire scenarios at the national scale in Spain. The results can be easily compared with other projections either at individual European Member State level, groups of countries, or at European level. However, the EFDM underestimated the total volume (m3) by 2.2% in the tested validation for a 20-year simulation.
Since this is the first time that this type of model has been applied to Mediterranean forests, the consideration of forest wildfires has been key to achieving more realistic simulations. The most stable forest type under both wildfire scenarios would be Dehesas. Considering bioregions, the Macaronesian area is the most affected and the Alpine region, the least affected.
Regarding forest management regimes, the results show the potential benefit of forest management as regards biomass and carbon stocks, with slightly better results in ASB management compared to ABAU management.
The results for projected biomass and carbon stock variability under different forest wildfire and management scenarios provide valuable information, permitting optimal decision-making for the forest-based bioeconomy and ecosystem services and consequently, for forest-related policies.

Author Contributions

Conceptualization, P.A, I.A. and I.C.; formal analysis, P.A.; writing—original draft preparation, P.A.; writing—review and editing, P.A., I.A., L.H., D.M.-F., T.P. and I.C.; supervision, I.A. and I.C.; funding acquisition, I.A. and I.C. All authors have read and agreed to the published version of the manuscript.

Funding

This research was funded by the European Union’s Horizon 2020 research and innovation program (Grant No. 633464 “Distributed, Integrated and Harmonized Forest Information for Bioeconomy Outlooks (DIABOLO)”); by the Spanish National Funding Agency (Grant No. AGL2016-76769-C2-1-R. “Influencia del régimen de perturbaciones y la gestión en el balance de carbono, estructura y dinámica de las masas forestales”) and by the Spanish Ministry of Agriculture, Fishing and Food (Encomienda de gestión EG17-042 “Soporte científico a la generación de información Forestal”).

Acknowledgments

We are particularly grateful to Jari Vauhkonen who provided useful suggestions. We also thank all the reviewers and the editor for their critical and constructive comments.

Conflicts of Interest

The authors declare no conflict of interest.

Appendix A

Figure A1. Projected carbon stock from 2000 to 2050 for Broadleaf forests in Spain under three different wildfire scenarios and business-as-usual allocation (ABAU).
Forests 11 01219 g0a1
Figure A2. Projected carbon stock from 2000 to 2050 for Conifers forests in Spain under three different wildfire scenarios and business-as-usual allocation (ABAU).
Forests 11 01219 g0a2
Figure A3. Projected carbon stock from 2000 to 2050 for Mixed forests in Spain under three different wildfire scenarios and business-as-usual allocation (ABAU).
Forests 11 01219 g0a3
Figure A4. Projected carbon stock from 2000 to 2050 for Dehesas forests in Spain under three different wildfire scenarios and business-as-usual allocation (ABAU).
Forests 11 01219 g0a4
Figure A5. Projected carbon stock from 2000 to 2050 for Other Conifer forests in Spain under three different wildfire scenarios and business-as-usual allocation (ABAU).
Forests 11 01219 g0a5
Figure A6. Projected carbon stock from 2000 to 2050 for Conifer plantations in Spain under three different wildfire scenarios and business-as-usual allocation (ABAU).
Forests 11 01219 g0a6
Figure A7. Projected carbon stock from 2000 to 2050 for Broadleaf plantations in Spain under three different wildfire scenarios and business-as-usual allocation (ABAU).
Forests 11 01219 g0a7

Appendix B

Figure A8. Projected carbon stock from 2000 to 2050 for Broadleaf forests in Spain under three different wildfires scenarios and schoolbook allocation (ASB).
Forests 11 01219 g0a8
Figure A9. Projected carbon stock from 2000 to 2050 for Conifers forests in Spain under three different wildfires scenarios and schoolbook allocation (ASB).
Forests 11 01219 g0a9
Figure A10. Projected carbon stock from 2000 to 2050 for Mixed forests in Spain under three different wildfires scenarios and schoolbook allocation (ASB).
Forests 11 01219 g0a10
Figure A11. Projected carbon stock from 2000 to 2050 for Dehesas forests in Spain under three different wildfires scenarios and schoolbook allocation (ASB).
Forests 11 01219 g0a11
Figure A12. Projected carbon stock from 2000 to 2050 for Other Conifer forests in Spain under three different wildfires scenarios and schoolbook allocation (ASB).
Forests 11 01219 g0a12
Figure A13. Projected carbon stock from 2000 to 2050 for Conifer plantations in Spain under three different wildfires scenarios and schoolbook allocation (ASB).
Forests 11 01219 g0a13
Figure A14. Projected carbon stock from 2000 to 2050 for Broadleaf plantations in Spain under three different wildfires scenarios and schoolbook allocation (ASB).
Forests 11 01219 g0a14

References

  1. Pan, Y.; Birdsey, R.A.; Fang, J.; Houghton, R.; Kauppi, P.E.; Kurz, W.A.; Phillips, O.L.; Shvidenko, A.; Lewis, S.L.; Canadell, J.G.; et al. A large and persistent carbon sink in the world’s forests. Science 2011, 333, 988–993. [Google Scholar] [CrossRef] [PubMed] [Green Version]
  2. Dixon, R.K.; Solomon, A.M.; Brown, S.; Houghton, R.A.; Trexier, M.C.; Wisniewski, J. Carbon Pools and Flux of Global Forest Ecosystems. Science 1994, 263, 185–190. [Google Scholar] [CrossRef] [PubMed]
  3. FOREST EUROPE. State of Europe’s Forests. 2015. Available online: https://www.foresteurope.org/docs/fullsoef2015.pdf (accessed on 10 June 2020).
  4. UNFCCC United Nations Framework Convention on Climate Change. Available online: https://unfccc.int (accessed on 9 June 2020).
  5. UNFCC Kyoto Protocol Reference Manual. United Nations Framew. Conv. Clim. Chang. 2008. Available online: https://unfccc.int/sites/default/files/08_unfccc_kp_ref_manual.pdf (accessed on 9 September 2019).
  6. UNFCCC ADOPTION OF THE PARIS AGREEMENT—Conference of the Parties COP 21, Adopt, Paris Agreement. 2015. Available online: http://unfccc.int/resource/docs/2015/cop21/eng/l09r01.pdf (accessed on 9 September 2019).
  7. Forsell, N.; Korosuo, A.; Federici, S.; Gusti, M.; Rincón-Cristóbal, J.-J.; Rüter, S.; Sánchez-Jiménez, B.; Dore, C.; Brajterman, O.; Gardiner, J. Guidance on Developing and Reporting the Forest Reference Levels in Accordance with Regulation (EU) 2018/841. Available online: https://op.europa.eu/en/publication-detail/-/publication/5ef89b70-8fba-11e8-8bc1-01aa75ed71a1/language-en (accessed on 17 November 2020).
  8. Lindner, M.; Maroschek, M.; Netherer, S.; Kremer, A.; Barbati, A.; Garcia-Gonzalo, J.; Seidl, R.; Delzon, S.; Corona, P.; Kolström, M.; et al. Climate change impacts, adaptive capacity, and vulnerability of European forest ecosystems. For. Ecol. Manag. 2010, 259, 698–709. [Google Scholar] [CrossRef]
  9. McKenzie, D.; Gedalof, Z.; Peterson, D.L.; Mote, P. Climatic change, wildfire, and conservation. Conserv. Biol. 2004, 18, 890–902. [Google Scholar] [CrossRef]
  10. Dale, V.H.; Joyce, L.A.; Mcnulty, S.; Neilson, R.P.; Ayres, M.P.; Flaningan, M.D.; Hanson, P.J.; Irland, L.C.; Lugo, A.E.; Peterson, C.J.; et al. Climate Change and Forest Disturbances. Bioscience 2001, 51, 723–734. [Google Scholar] [CrossRef] [Green Version]
  11. D’Amato, A.W.; Bradford, J.B.; Fraver, S.; Palik, B.J. Forest management for mitigation and adaptation to climate change: Insights from long-term silviculture experiments. For. Ecol. Manag. 2011, 262, 803–816. [Google Scholar] [CrossRef]
  12. Biber, P.; Borges, J.G.; Moshammer, R.; Barreiro, S.; Botequim, B.; Brodrechtová, Y.; Brukas, V.; Chirici, G.; Cordero-Debets, R.; Corrigan, E.; et al. How sensitive are ecosystem services in European forest landscapes to silvicultural treatment? Forests 2015, 6, 1666–1695. [Google Scholar] [CrossRef] [Green Version]
  13. Taylor, A.R.; Wang, J.R.; Kurz, W.A. Effects of harvesting intensity on carbon stocks in eastern Canadian red spruce (Picea rubens) forests: An exploratory analysis using the CBM-CFS3 simulation model. For. Ecol. Manag. 2008, 255, 3632–3641. [Google Scholar] [CrossRef]
  14. Kindermann, G.E.; Schörghuber, S.; Linkosalo, T.; Sanchez, A.; Rammer, W.; Seidl, R.; Lexer, M.J. Potential stocks and increments of woody biomass in the European Union under different management and climate scenarios. Carbon Balance Manag. 2013, 8, 2. [Google Scholar] [CrossRef] [Green Version]
  15. De Luís, M.; García-Cano, M.; Cortina, J.; Raventós, J.; Gonzalez-Hidalgo, J.; Sanchez, J. Climatic trends, disturbances and short-term vegetation dynamics in a Mediterranean shrubland. For. Ecol. Manag. 2001, 147, 25–37. [Google Scholar] [CrossRef]
  16. Pausas, J.G.; Llovet, J.; Rodrigo, A.; Vallejo, R. Are wildfires a disaster in the Mediterranean basin?—A review. Int. J. Wildl. Fire 2009, 17, 713–723. [Google Scholar] [CrossRef]
  17. Rubio, J.L. Desertificación en la Comunidad Valenciana: Antecedentes históricos y situación actual de erosión. Rev. Valencia. D’Estudis Autonòmics 1987, 7, 231–258. [Google Scholar]
  18. Moss, R.H.; Edmonds, J.A.; Hibbard, K.A.; Manning, M.R.; Rose, S.K.; Van Vuuren, D.P.; Carter, T.R.; Emori, S.; Kainuma, M.; Kram, T.; et al. The next generation of scenarios for climate change research and assessment. Nature 2010, 463, 747–756. [Google Scholar] [CrossRef] [PubMed]
  19. Howden, S.; Moore, J.; McKeon, G.; Reyenga, P.; Carter, J.; Scanlan, J. Global Change Impacts on Fire Dynamics in the Mulga Woodlands of South-West Queensland; Working Paper Series 99/05; CSIRO Wildlife and Ecology: Canberra, Australia, 1999. [Google Scholar]
  20. Flannigan, M.D.; Krawchuk, M.A.; De Groot, W.J.; Wotton, B.M.; Gowman, L.M. Implications of changing climate for global wildland fire. Int. J. Wildl. Fire 2009, 18, 483–507. [Google Scholar] [CrossRef]
  21. Moriondo, M.; Good, P.; Durao, R.; Bindi, M.; Giannakopoulos, C.; Corte-Real, J. Potential impact of climate change on fire risk in the Mediterranean area. Clim. Res. 2006, 31, 85–95. [Google Scholar] [CrossRef]
  22. Nabuurs, G.J.; Päivinen, R.; Schanz, H. Sustainable management regimes for Europe’s forests—A projection with EFISCEN until 2050. For. Policy Econ. 2001, 3, 155–173. [Google Scholar] [CrossRef]
  23. Eriksson, L.O.; Sallnäs, O.; Ståhl, G. Forest certification and Swedish wood supply. For. Policy Econ. 2007, 9, 452–463. [Google Scholar] [CrossRef]
  24. Verkerk, P.J.; Anttila, P.; Eggers, J.; Lindner, M.; Asikainen, A. The realisable potential supply of woody biomass from forests in the European Union. For. Ecol. Manag. 2011, 261, 2007–2015. [Google Scholar] [CrossRef]
  25. Kindermann, G.; Obersteiner, M.; Sohngen, B.; Sathaye, J.; Andrasko, K.; Rametsteiner, E.; Schlamadinger, B.; Wunder, S.; Beach, R. Global cost estimates of reducing carbon emissions through avoided deforestation. Proc. Natl. Acad. Sci. USA 2008, 105, 10302–10307. [Google Scholar] [CrossRef] [Green Version]
  26. IIASA Globiom Model. Int. Institute Appl. Syst. Anal. 2014. Available online: http://www.globiom.org (accessed on 15 August 2020).
  27. Kurz, W.A.; Dymond, C.C.; White, T.M.; Stinson, G.; Shaw, C.H.; Rampley, G.J.; Smyth, C.; Simpson, B.N.; Neilson, E.T.; Trofymow, J.A.; et al. CBM-CFS3: A model of carbon-dynamics in forestry and land-use change implementing IPCC standards. Ecol. Modell. 2009, 220, 480–504. [Google Scholar] [CrossRef]
  28. Packalen, T.; Sallnäs, O.; Sirkiä, S.; Korhonen, K.; Salminen, O.; Vidal, C.; Robert, N.; Colin, A.; Belouard, T.; Schadauer, K. The European Forestry Dynamics Model: Concept, Design and Results of First Case Studies; Publications Office of the European Union: Luxembourg, 2014. [Google Scholar]
  29. Sallnäs, O.; Berger, A.; Räty, M.; Trubins, R. An area-based matrix model for uneven-aged forests. Forests 2015, 6, 1500–1515. [Google Scholar] [CrossRef] [Green Version]
  30. Vauhkonen, J.; Packalen, T. A Markov chain model for simulating wood supply from any-aged forest management based on National Forest Inventory (NFI) data. Forests 2017, 8, 307. [Google Scholar] [CrossRef] [Green Version]
  31. Vauhkonen, J.; Berger, A.; Gschwantner, T.; Schadauer, K.; Lejeune, P.; Perin, J.; Pitchugin, M.; Adolt, R.; Zeman, M.; Johannsen, V.K.; et al. Harmonised projections of future forest resources in Europe. Ann. For. Sci. 2019, 76, 79. [Google Scholar] [CrossRef] [Green Version]
  32. Vauhkonen, J.; Packalen, T. Uncertainties related to climate change and forest management with implications on climate regulation in Finland. Ecosyst. Serv. 2018, 33, 213–224. [Google Scholar] [CrossRef]
  33. Vázquez de la Cueva, A.; Quintana, J.R.; Cañellas, I. Fire activity projections in the SRES A2 and B2 climatic scenarios in peninsular Spain. Int. J. Wildl. Fire 2012, 21, 653–665. [Google Scholar] [CrossRef]
  34. Alberdi, I.; Vallejo, R.; Álvarez-González, J.G.; Condés, S.; González-Ferreiro, E.; Guerrero, S.; Hernández, L.; Martínez-Jauregui, M.; Montes, F.; Oliveira, N.; et al. The multi-objective Spanish National Forest Inventory. For. Syst. 2017, 26, e04S. [Google Scholar] [CrossRef]
  35. Alberdi, I.; Cañellas, I.; Condes, S. A long-scale biodiversity monitoring methodology for Spanish national forest inventory. Application to Álava region. For. Syst. 2014, 23, 93–110. [Google Scholar] [CrossRef]
  36. Vauhkonen, J.; Packalen, T. Shifting from even-aged management to less intensive forestry in varying proportions of forest land in Finland: Impacts on carbon storage, harvest removals, and harvesting costs. Eur. J. For. Res. 2019, 138, 219–238. [Google Scholar] [CrossRef] [Green Version]
  37. FOREST EUROPE, UNECE and FAO. State of Europe’s Forests 2011. Status and Trends in Sustainable Forest Management in Europe, 2011. Available online: http://www.unece.org/fileadmin/DAM/publications/timber/Forest_Europe_report_2011_web.pdf (accessed on 6 June 2020).
  38. Alberdi, I.; Michalak, R.; Fischer, C.; Gasparini, P.; Brändli, U.B.; Tomter, S.M.; Kuliesis, A.; Snorrason, A.; Redmond, J.; Hernández, L.; et al. Towards harmonized assessment of European forest availability for wood supply in Europe. For. Policy Econ. 2016, 70, 20–29. [Google Scholar] [CrossRef] [Green Version]
  39. Europe’s Biodiversity—Biogeographical Regions and Seas. Biogeogr. Reg. Eur. Introd. Eur. Environ. Agency 2002. Available online: https://www.eea.europa.eu/publications/report_2002_0524_154909 (accessed on 4 December 2019).
  40. IPCC. Special Report on Emissions Scenarios; Cambridge University Press: Cambridge, UK, 2000. [Google Scholar]
  41. MAGRAMA Mapa Forestal de España 1:50,000 (MFE). Available online: https://www.mapa.gob.es/es/desarrollo-rural/temas/politica-forestal/inventario-cartografia/mapa-forestal-espana/mfe_50.aspx (accessed on 25 September 2020).
  42. Serrada, R.; Montero, G.; Reque, J.A. Compendio de Selvicultura aplicada en España; INIA y FUCOVASA: Madrid, Spain, 2008. [Google Scholar]
  43. Montero, G.; Ruiz-Peinado, R.; Muñoz, M. Producción de Biomasa y Fijación de CO2 por los Bosques Españoles; Instituto Nacional de Investigación Agraria y Alimentaria INIA: Madrid, Spain, 2005. [Google Scholar]
  44. Vanclay, J.K. Sustainable timber harvesting: Simulation studies in the tropical rainforests of north Queensland. For. Ecol. Manag. 1994, 69, 299–320. [Google Scholar] [CrossRef] [Green Version]
  45. Vayreda, J.; Martinez-Vilalta, J.; Gracia, M.; Retana, J. Recent climate changes interact with stand structure and management to determine changes in tree carbon stocks in Spanish forests. Glob. Chang. Biol. 2012, 18, 1028–1041. [Google Scholar] [CrossRef]
  46. Ruiz-Peinado, R.; Bravo-Oviedo, A.; López-Senespleda, E.; Bravo, F.; del Río, M. Forest management and carbon sequestration in the Mediterranean region: A review. For. Syst. 2017, 26, eR04S. [Google Scholar] [CrossRef]
  47. Assmann, E. The Principles of Forest Yield Study. Studies in the Organic Production, Structure, Increment and Yield of Forest Stands; Elsevier: Amsterdam, The Netherlands, 1970. [Google Scholar] [CrossRef]
  48. Carpentier, S.; Filotas, E.; Handa, I.T.; Messier, C. Trade-offs between timber production, carbon stocking and habitat quality when managing woodlots for multiple ecosystem services. Environ. Conserv. 2017, 44, 14–23. [Google Scholar] [CrossRef] [Green Version]
  49. Olano, J.M.; Palmer, M.W. Stand dynamics of an Appalachian old-growth forest during a severe drought episode. For. Ecol. Manag. 2003, 174, 139–148. [Google Scholar] [CrossRef]
  50. Vila-Cabrera, A.; Martinez-Vilalta, J.; Vayreda, J.; Retana, J. Structural and climatic determinants of demographic rates of Scots pine forests across the Iberian Peninsula. Ecol. Appl. 2011, 21, 1162–1172. [Google Scholar] [CrossRef] [PubMed]
  51. Moreno-Fernández, D.; Díaz-Pinés, E.; Barbeito, I.; Sánchez-González, M.; Montes, F.; Rubio, A.; Cañellas, I. Temporal carbon dynamics over the rotation period of two alternative management systems in Mediterranean mountain Scots pine forests. For. Ecol. Manag. 2015, 348, 186–195. [Google Scholar] [CrossRef]
  52. Bolte, A.; Ammer, C.; Löf, M.; Madsen, P.; Nabuurs, G.J.; Schall, P.; Spathelf, P.; Rock, J. Adaptive forest management in central Europe: Climate change impacts, strategies and integrative concept. Scand. J. For. Res. 2009, 24, 473–482. [Google Scholar] [CrossRef]
  53. Moreno-Fernández, D.; Ledo, A.; Martín-Benito, D.; Cañellas, I.; Gea-Izquierdo, G. Negative synergistic effects of land-use legacies and climate drive widespread oak decline in evergreen Mediterranean open woodlands. For. Ecol. Manag. 2019, 432, 884–894. [Google Scholar] [CrossRef]
  54. Gea-Izquierdo, G.; Cañellas, I.; Montero, G. Site index in agroforestry systems: Age-dependent and age-independent dynamic diameter growth models for Quercus ilex in Iberian open oak woodlands. Can. J. For. Res. 2008, 38, 101–113. [Google Scholar] [CrossRef] [Green Version]
  55. Garzón-Machado, V.; del Arco Aguilar, M.J.; González, F.V.; Pérez-de-Paz, P.L. Fire as a threatening factor for endemic plants of the Canary Islands. Biodivers. Conserv. 2012, 21, 2621–2632. [Google Scholar] [CrossRef]
  56. ISTAC. Available online: http://www.gobiernodecanarias.org/istac (accessed on 15 February 2020).
  57. Bello-Rodríguez, V.; Gómez, L.A.; Fernández López, Á.; Del-Arco-Aguilar, M.J.; Hernández-Hernández, R.; Emerson, B.; González-Mancebo, J.M. Short- and long-term effects of fire in subtropical cloud forests on an oceanic island. Land Degrad. Dev. 2019, 30, 448–458. [Google Scholar] [CrossRef]
  58. Climent, J.; Tapias, R.; Pardos, J.A.; Gil, L. Fire adaptations in the Canary Islands pine (Pinus canariensis). Plant Ecol. 2004, 171, 185–196. [Google Scholar] [CrossRef]
  59. Trasobares, A.; Tomé, M.; Miina, J. Growth and yield model for Pinus halepensis Mill. in Catalonia, north-east Spain. For. Ecol. Manag. 2004, 203, 49–62. [Google Scholar] [CrossRef]
  60. Ruiz-Benito, P.; Lines, E.R.; Gómez-Aparicio, L.; Zavala, M.A.; Coomes, D.A. Patterns and Drivers of Tree Mortality in Iberian Forests: Climatic Effects Are Modified by Competition. PLoS ONE 2013, 8, e56843. [Google Scholar] [CrossRef] [PubMed] [Green Version]
  61. Karvonen, J.; Halder, P.; Kangas, J.; Leskinen, P. Indicators and tools for assessing sustainability impacts of the forest bioeconomy. For. Ecosyst. 2017, 4, 2. [Google Scholar] [CrossRef] [Green Version]
  62. Rodríguez-Soalleiro, R.; Eimil-Fraga, C.; Gómez-García, E.; García-Villabrille, J.D.; Rojo-Alboreca, A.; Muñoz, F.; Oliveira, N.; Sixto, H.; Pérez-Cruzado, C. Exploring the factors affecting carbon and nutrient concentrations in tree biomass components in natural forests, forest plantations and short rotation forestry. For. Ecosyst. 2018, 5, 35. [Google Scholar] [CrossRef] [Green Version]
  63. Beedlow, P.A.; Tingey, D.T.; Phillips, D.L.; Hogsett, W.E.; Olszyk, D.M. Rising Atmospheric CO2 and Carbon Sequestration in Forests. Front. Ecol. Environ. 2004, 2, 315. [Google Scholar] [CrossRef]
  64. Pasalodos-Tato, M.; Ruiz-Peinado, R.; del Río, M.; Montero, G. Shrub biomass accumulation and growth rate models to quantify carbon stocks and fluxes for the Mediterranean region. Eur. J. For. Res. 2015, 134, 537–553. [Google Scholar] [CrossRef]
  65. San Miguel, A.; Roig, S.; Cañellas, I. Fruticeticultura, Gestión de arbustedos y matorrales. In Compendio de Selvicultura aplicada en España; Serrada, R., Montero, G., Reque, J., Eds.; INIA y FUCOVASA: Madrid, Spain, 2008; pp. 877–907. [Google Scholar]
  66. Flannigan, M.D.; Stocks, B.J.; Wotton, B.M. Climate change and forest fires. Sci. Total Environ. 2000, 262, 221–229. [Google Scholar] [CrossRef]
  67. International Union of Forest Research Organizations. Global Fire Challenges in a Warming World; Robinne, F.-N., Burns, J., Kant, P., de Groot, B., Flannigan, M.D., Kleine, M., Wotton, D.M., Eds.; Occasional Paper No. 32; IUFRO: Vienna, Austria, 2018. [Google Scholar]
  68. Weber, M.G.; Flannigan, M.D. Canadian boreal forest ecosystem structure and function in a changing climate: Impact on fire regimes. Environ. Rev. 1997, 5, 145–166. [Google Scholar] [CrossRef]
  69. Gea-Izquierdo, G.; Viguera, B.; Cabrera, M.; Cañellas, I. Drought induced decline could portend widespread pine mortality at the xeric ecotone in managed mediterranean pine-oak woodlands. For. Ecol. Manag. 2014, 320, 70–82. [Google Scholar] [CrossRef]
  70. Forsell, N.; Korosuo, A.; Gusti, M.; Rüter, S.; Havlik, P.; Obersteiner, M. Impact of modelling choices on setting the reference levels for the EU forest carbon sinks: How do different assumptions affect the country-specific forest reference levels? Carbon Balance Manag. 2019, 14, 10. [Google Scholar] [CrossRef] [PubMed] [Green Version]
  71. González-Díaz, P.; Ruiz-Benito, P.; Ruiz, J.G.; Chamorro, G.; Zavala, M.A. A multifactorial approach to value supporting ecosystem services in Spanish forests and its implications in a warming world. Sustainability 2019, 11, 358. [Google Scholar] [CrossRef] [Green Version]
Figure 1. Distribution of bioclimatic regions and SNFI plots in Spain used in the study.
Forests 11 01219 g001
Figure 2. Projected carbon stock from 2000 to 2050 for all forests types under the three different wildfire scenarios and business-as-usual allocation (ABAU) in Spain.
Forests 11 01219 g002
Figure 3. Projected carbon stock (M Mg) from 2000 to 2050 for all forest types in Spain under three different wildfires scenarios and schoolbook allocation (ASB).
Forests 11 01219 g003
Table 1. Area and sampled National Forest Inventory (NFI) plots used to simulate and validate the EFDM model per static factor.
Simulation PlotsSimulation Area
(1000 ha)
Validation PlotsValidation Area
(1000 ha)
Forest type
Broadleaf forests28,9926144.548741031.1
Conifer forests28,0924834.44664757.8
Mixed forests70131248.81323334.5
Dehesas46792014.3777246.3
Other Conifer forests5116876.7615104.1
Conifer plantations3316518.8897145.2
Broadleaf plantations3816658.151796.0
Wood supply
FAWS73,30615,147.112,2112530.6
FNAWS77181148.51456184.3
Owner
Private49,56010,570.697092047.6
Public31,4645725.13958667.3
Stand structure
Even-aged22,6044157.93768703.9
Uneven-aged58,42012,137.898992011.0
Bioclimatic region
Alpine3103501.061898.4
Atlantic13,5392459.82946546.4
Macaronesian2414141.579143.9
Mediterranean61,96813,193.493122026.2
TOTAL81,02416,295.713,6672714.9
Table 2. Combinations of management regimes and wildfire scenarios considered in the study.
CombinationsManagement RegimesWildfire Scenarios
1Business-as-usual allocation (ABAU)Present
2Business-as-usual allocation (ABAU)B2
3Business-as-usual allocation (ABAU)A2
4Schoolbook allocation (ASB)Present
5Schoolbook allocation (ASB)B2
6Schoolbook allocation (ASB)A2
Table 3. Projected volume, biomass and carbon stock from 2000 to 2050 for all forests in Spain under three different wildfire scenarios and business-as-usual allocation (ABAU).
Present Scenario (Combination 1)B2 Scenario (Combination 2)A2 Scenario (Combination 3)
200020102020203020402050200020102020203020402050200020102020203020402050
Area1000 ha16,295.716,295.716,295.7
Volume (Growing stock)M m3962.01195.51400.01575.71723.41844.0962.01154.31308.41432.01528.81601.9962.01133.61264.21364.71440.01494.1
Volume (Fellings)M m375.1105.7130.8151.4168.6182.975.1101.6121.0135.5146.8155.675.199.6116.3128.1136.9143.5
Biomass (Aboveground)M Mg920.21121.41292.81439.61562.91663.6920.21078.81205.11307.01387.31448.4920.21057.51162.71244.71306.91352.2
Biomass (Underground)M Mg342.0403.1453.1494.0526.8552.7342.0387.3422.5449.6470.2485.5342.0379.4407.6428.7444.2455.3
Biomass (Fellings)M Mg63.688.4108.6125.1139.0150.463.684.699.9111.4120.3127.363.682.795.7105.0111.9117.0
Biomass (total)M Mg1325.81613.01854.52058.72228.72366.71325.81550.71727.51868.01977.82061.11325.81519.61666.11778.41863.01924.5
Carbon (Aboveground)M Mg436.8532.4613.4682.3739.6785.9436.8512.3572.1619.9657.1685.0436.8502.3552.1590.5619.3639.9
Carbon (Underground)M Mg162.1190.8213.9232.6247.2258.4162.1183.4199.6211.9221.0227.5162.1179.7192.6202.2209.0213.6
Carbon (Fellings)M Mg30.141.751.359.165.771.130.139.947.252.757.060.330.139.145.349.753.055.4
Carbon (total)M Mg629.0764.9878.6974.01052.61115.4629.0735.6818.9884.5935.1972.8629.0721.0790.0842.4881.3908.9
Mg/ha38.646.953.959.864.668.438.645.150.354.357.459.738.644.248.551.754.155.8
Table 4. Total biomass and carbon (M Mg) per static factor under the three different wildfire scenarios in 2000 and 2050 and business-as-usual allocation (ABAU) in Spain.
Total Biomass (M Mg)Total Carbon (M Mg)
2000205020002050
PresentPresentB2A2PresentPresentB2A2
Forest type
Broadleaf forests481.1782.5658.9604.2225.6359.2302.9277.9
Conifer forests428.1906.0797.6748.3208.7443.6390.8366.8
Mixed forests105.1190.4160.8147.849.387.974.468.5
Dehesas104.5148.6146.9146.049.067.766.966.5
Other Conifer forests54.4118.3106.8101.426.356.851.248.6
Conifer plantations65.391.283.579.931.344.140.338.5
Broadleaf plantations87.3129.6106.896.938.956.146.342.1
Wood supply
FAWS1233.02201.31918.81792.2585.71038.2906.1846.8
FNAWS92.8165.4142.3132.343.377.266.762.1
Owner
Private765.31383.91207.41128.6357.3640.8560.0523.9
Public560.4982.7853.7795.9271.7474.6412.8385.0
Stand structure
Even-aged394.0776.4674.9629.3186.8367.3320.0298.7
Uneven-aged931.71590.31386.21295.1442.2748.1652.8610.2
Bioclimatic region
Alpine74.9122.0118.4116.638.060.558.857.9
Atlantic359.9508.8425.6389.0166.7229.9193.0176.8
Macaronesian12.916.211.810.25.77.05.14.5
Mediterranean878.01719.61505.31408.5418.6818.0715.8669.6
TOTAL1325.82366.72061.11924.5629.01115.4972.8908.9
Table 5. Projected volume, biomass and carbon stock from 2000 to 2050 for all forests in Spain under three different wildfires scenarios and schoolbook allocation (ASB).
Present Scenario (Combination 4)B2 Scenario (Combination 5)A2 Scenario (Combination 6)
200020102020203020402050200020102020203020402050200020102020203020402050
Area1000 ha16,295.716,295.716,295.7
Volume (Growing stock)M m3962.31190.01389.71551.01681.61786.5962.01150.11301.41415.21500.71563.9962.01130.41259.31352.11418.71465.4
Volume (Fellings)M m3102.3133.6169.0195.3214.9230.098.7124.1151.5169.5181.6190.0102.3133.6169.0195.3214.9230.0
Biomass (Aboveground)M Mg920.31130.61301.21436.31543.51627.8920.21088.71215.61309.91379.51430.1920.21068.01174.41250.91304.81342.0
Biomass (Underground)M Mg342.0398.7449.8489.3520.4544.9342.0383.5420.5447.5467.5482.2342.0376.0406.4428.0443.3454.1
Biomass (Fellings)M Mg90.3113.1142.4165.4182.7196.087.2105.2127.8143.6154.6162.185.6101.4121.1134.0142.3147.7
Biomass (total)M Mg1352.61642.41893.52091.02246.62368.81349.31577.41763.81901.12001.52074.41347.71545.51701.91812.81890.41943.8
Carbon (Aboveground)M Mg436.9535.1614.0675.9724.6762.5436.8515.4573.9617.0648.4670.9436.8505.7554.7589.4613.6630.0
Carbon (Underground)M Mg162.1187.8210.5227.5240.6250.6162.1180.8196.9208.4216.6222.4162.1177.3190.4199.4205.6209.8
Carbon (Fellings)M Mg43.153.566.977.384.990.741.649.860.167.272.075.240.948.157.062.766.468.6
Carbon (total)M Mg642.1776.4891.4980.71050.11103.7640.5746.0831.0892.6937.0968.6639.8731.0802.1851.6885.6908.5
Mg/ha39.447.654.760.264.467.739.345.851.054.857.559.439.344.949.252.354.355.7
Table 6. Total biomass and carbon stock (M Mg) per static factor under three different wildfire scenarios in 2000 and 2050 and schoolbook allocation (ASB) in Spain.
Total BiomassTotal Carbon
2000205020002050
PresentPresentB2A2PresentPresentB2A2
Forest type
Broadleaf forests494.3815.4693.0638.7231.8365.0311.4287.6
Conifer forests433.0897.2791.9744.4211.2438.9387.7364.5
Mixed forests106.8176.1149.2137.550.181.269.063.6
Dehesas110.2148.0146.3145.551.665.564.764.4
Other Conifer forests56.4111.4101.096.127.353.348.245.9
Conifer plantations69.583.076.674.133.339.936.835.6
Broadleaf plantations82.4137.6116.3107.436.759.950.746.9
Wood supply
FAWS1262.22196.31926.01805.9599.91022.7898.6843.3
FNAWS90.4172.4148.4137.942.281.070.065.1
Owner
Private774.61397.71227.21151.8361.8639.0562.4528.4
Public578.0971.1847.2792.0280.2464.7406.2380.1
Stand structure
Even-aged399.0718.6629.6591.0189.4338.1296.9279.0
Uneven-aged953.71650.11444.81352.8452.7765.6671.7629.5
Bioclimatic region
Alpine78.5115.9112.5110.939.857.055.454.6
Atlantic367.4494.2416.5383.3170.3220.4186.7172.3
Macaronesian13.016.311.810.25.77.05.14.5
Mediterranean893.81742.31533.61439.4426.2819.3721.3677.1
TOTAL1352.62368.82074.41943.8642.11103.7968.6908.5
Table 7. Total carbon stock differences (%) between management allocations in 2050 per static factor and wildfire scenarios in Spain.
Business-as-Usual Allocation (ABAU)Schoolbook Allocation (ASB)
Present-B2 ScenariosPresent-A2 ScenariosPresent-B2 ScenariosPresent-A2 Scenarios
Forest type
Broadleaf forests−25.0%−36.0%−22.8%−32.9%
Conifer forests−25.3%−36.9%−23.9%−34.8%
Mixed forests−27.4%−39.5%−24.0%−34.5%
Dehesas−1.6%−2.4%−1.4%−2.1%
Other Conifer forests−21.2%−31.1%−18.1%−26.5%
Conifer plantations−12.1%−17.7%−8.4%−11.7%
Broadleaf plantations−25.1%−35.9%−24.4%−34.7%
Wood supply
FAWS−22.6%−32.7%−20.3%−29.4%
FNAWS−24.3%−34.9%−26.2%−37.7%
Owner
Private−22.6%−32.7%−20.8%−30.1%
Public−22.8%−33.0%−20.5%−29.7%
Stand structure
Even-aged−25.3%−36.7%−21.2%−30.4%
Uneven-aged−21.6%−31.2%−20.5%−29.7%
Bioclimatic region
Alpine−4.6%−6.8%−4.0%−5.9%
Atlantic−22.1%−31.8%−19.3%−27.5%
Macaronesian−32.5%−44.3%−33.1%−45.1%
Mediterranean−24.4%−35.4%−22.7%−32.9%
TOTAL−22.7%−32.8%−20.7%−29.9%
Table 8. Validation results using plots from the Fourth Spanish National Forest Inventory (SNFI4). Relative bias (%) for total volume per static factor using SNFI2 as initial state (20-year prediction).
Validation PlotsEFDM 2010 Volume
(M m3)
SNFI4 Volume
(M m3)
Relative Bias
20 Year (%)
Forest type
Broadleaf forests487481.584.84.2%
Conifer forests466486.283.3−3.3%
Mixed forests132327.130.311.5%
Dehesas7774.44.65.0%
Other Conifer forests61510.711.24.8%
Conifer plantations89732.732.90.8%
Broadleaf plantations51711.812.77.7%
Wood supply
FAWS12,211235.4240.52.2%
FNAWS145619.019.31.7%
Owner
Private9709176.3180.22.2%
Public395878.079.72.1%
Stand structure
Even-aged376895.6100.85.5%
Uneven-aged9899158.8159.00.2%
Bioclimatic region
Alpine61816.016.10.4%
Atlantic294689.697.18.4%
Macaronesian7915.36.113.4%
Mediterranean9312143.4140.6−1.9%
TOTAL13,667254.3259.82.2%
Publisher’s Note: MDPI stays neutral with regard to jurisdictional claims in published maps and institutional affiliations.

