Article

Population Genetic Diversity and Structure of Ancient Tree Populations of Cryptomeria japonica var. sinensis Based on RAD-seq Data

1
Graduate School of Life and Environmental Science, University of Tsukuba, Tsukuba 305-8572, Japan
2
College of Landscape and Architecture, Central South University of Forestry and Technology, Changsha 410004, China
3
Department of Forest Molecular Genetics and Biotechnology, Forestry and Forest Products Research Institute, Tsukuba 305-8687, Japan
4
Faculty of Life and Environmental Science, University of Tsukuba, Tsukuba 305-8572, Japan
*
Author to whom correspondence should be addressed.
Forests 2020, 11(11), 1192; https://doi.org/10.3390/f11111192
Submission received: 4 October 2020 / Revised: 1 November 2020 / Accepted: 6 November 2020 / Published: 12 November 2020
(This article belongs to the Special Issue Genetics and Improvement of Forest Trees)

Abstract

:
Research highlights: Our study is the first to explore the genetic composition of ancient Cryptomeria trees across a distribution range in China. Background and objectives: Cryptomeria japonica var. sinensis is a native forest species of China; it is widely planted in the south of the country to create forests and for wood production. Unlike Cryptomeria in Japan, genetic Chinese Cryptomeria has seldom been studied, although there is ample evidence of its great ecological and economic value. Materials and methods: Because of overcutting, natural populations are rare in the wild. In this study, we investigated seven ancient tree populations to explore the genetic composition of Chinese Cryptomeria through ddRAD-seq technology. Results: The results reveal a lower genetic variation but higher genetic differentiation (Ho = 0.143, FST = 0.1204) than Japanese Cryptomeria (Ho = 0.245, FST = 0.0455). The 86% within-population variation is based on an analysis of molecular variance (AMOVA). Significant excess heterozygosity was detected in three populations and some outlier loci were found; these were considered to be the consequence of selection or chance. Structure analysis and dendrogram construction divided the seven ancient tree populations into four groups corresponding to the geographical provinces in which the populations are located, but there was no obvious correlation between genetic distance and geographic distance. A demographic history analysis conducted by a Stairway Plot showed that the effective population size of Chinese Cryptomeria had experienced a continuing decline from the mid-Pleistocene to the present. Our findings suggest that the strong genetic drift caused by climate fluctuation and intense anthropogenic disturbance together contributed to the current low diversity and structure. Considering the species’ unfavorable conservation status, strategies are urgently required to preserve the remaining genetic resources.

1. Introduction

Cryptomeria (Cupressaceae) is a relic genus that was widely distributed throughout Eurasia during the Cenozoic era [1]. Today, there is only one extant species, Cryptomeria japonica (Linn. f.) D. Don, which has three recognized varieties. Two Japanese varieties, var. japonica and var. radicans, are found in the moist temperate region from Aomori Prefecture to Yakushima Island on the Japanese archipelago [2]; var. japonica mainly occurs on the Pacific Ocean side and var. radicans mainly on the Sea of Japan side. These two varieties are present in 44% of all Japanese planted forests [3], and the species is known as “the national tree” of Japan. The third variety, var. sinensis, is limited to southern China, with a few natural occurrences in Fujian (Nanping), Jiangxi (Lushan mountain), and Zhejiang (Tianmu mountain) provinces. However, these wild forests are hard to distinguish from an enormous number of artificial stands [4]. Planted forests in China are not as common as in Japan, but still play an important role in forestry in the south of the country. This species has been long cultivated in China, and the earliest historical document can be traced back to 1279, referring to the Tianmu mountains area. Some ancient trees are still well preserved in villages such as Fengshui forest, and they are supposed to bring fortune and happiness. Since the founding of modern China, the government has launched a series of greening campaigns. Because var. sinensis is a common and popular species, it has been widely planted throughout southern China for afforestation and to exploit as timber in the future. Recently, studies have revealed that Chinese Cryptomeria (Cryptomeria japonica var. sinensis Miquel) forests have great ecological benefits with respect to soil properties, water infiltration, and biodiversity, and also have substantial economic benefits in terms of wood production. However, we know little about its population genetics.
Knowledge of population genetic diversity and structure is of fundamental importance for conifer conservation and breeding programs [5]. Chen et al. [6] investigated the demographic structure of Chinese Cryptomeria on Tianmu mountain using microsatellites markers. This area contains the most famous and largest ancient tree population. Luo et al. [7] examined the genetic diversity of 96 clones from 12 provenances in seed orchards, using 26 polymorphic microsatellite loci. However, a large-scale study on natural or artificial resources of Chinese Cryptomeria has yet to be conducted.
Single-nucleotide polymorphisms (SNP) have proved to be the most abundant form of variation within a species at the genome level and can provide detailed insight into the genetic basis of a population [8]. Combined with Next-Generation Sequencing (NGS) technology, SNP markers are having substantial impacts on population genetics as well as plant breeding [9,10]. Among large-scale sequencing-based approaches, Restriction-site Associated DNA sequencing (RAD-seq) technology has been shown to be cost-effective for generating genome-wide markers for a large number of samples simultaneously [11,12,13,14]. This approach has great advantages, including generating a large quantity of data across the genome, having reasonable costs, needing simpler procedures for library construction, needing a short duration of experiment, having no requirements for a reference genome, and having a well-developed pipeline for data treatment and analysis [15,16].
In the present study, we employed ddRAD-seq (double digest RAD-seq) technology, based on 122 samples from seven ancient tree populations in China, to (1) evaluate the level of genetic diversity, (2) explore the genetic structure among current ancient tree populations, and (3) estimate the demographic history. We also used six natural Japanese populations to (4) compare the genetic diversity between Japanese and Chinese Cryptomeria. From this analysis, we hope to gain insight into the status of genetic resources of C. japonica var. sinensis, and put forward some suggestions for conservation strategies.

2. Materials and Methods

2.1. Population Sampling

We investigated the sites where natural forests supposedly occurred in China, according to previous studies [17]. Unfortunately, most forests have been exposed to severe disturbance as a result of human activities, and the species is now found in patches in villages and national forest parks. To avoid materials from unknown sources, only ancient trees with a DBH (diameter at breast height) greater than 100 cm were selected for this study. A total of 122 individuals from seven populations were collected, covering all the recorded natural forest sites. For each population, needles were collected from 10 to 22 mature trees from each population (Figure 1). The name, geographic location, altitude, and sample size for each population are listed in Table 1. We also used six natural populations of C. japonica from Japan, covering the whole natural distribution range and the most important forests, in order to compare the genetic diversity with Chinese populations [18] (Table S1).

2.2. DNA Extraction and RAD Sequencing

The total genomic DNA was extracted from fresh needles using a modified CTAB (cetyltrimethylammonium bromide) method [19]. Purified DNA was digested with PstI and SphI, ligated with Y-shaped adaptors, and amplified by PCR with KAPA HiFi polymerase (Kapa Biosystems, Wilmington, USA). After PCR amplification with adapter-specific primer pairs (Access Array Barcode Library for Illumina, Fluidigm, South San Francisco, USA), an equal amount of DNA from each sample was mixed and size-selected with the BluePippin agarose gel (Sage Science, Beverly, MA, USA). Approximately 450 bp library fragments were retrieved. Further details of the library preparation method are given by Ueno et al. [20]. The quality of the library was checked using a 2100 Bioanalyzer with a high-sensitivity DNA chip (Agilent Technologies, Waldbronn, Germany) and finally sequenced using an Illumina Hi-Seq X to generate paired-end reads 150 bp long.

2.3. SNP Calling and Filtering

SNPs were called by dDocent (version 2.17) [21], which is a pipeline containing a series of statistical tools. Because no reference genome was available for Cryptomeria japonica, a reference was constructed using the dDocent de novo assembly and optimized utilizing the reference optimization steps provided on the dDocent assembly tutorial. We followed the default settings of dDocent for mapping and SNP calling, and the resulting vcf-file was used for filtering by VCFtools [22] in the dDocent environment. Specifically, for the first filtering sites with >50% missing data across all individuals and sites with a minor allele count <3 and quality value <30 were excluded. Secondly, we removed individuals with >10% missing data, and further filtered SNPs with the following criteria: mean depth ≥20, the proportion of missing data >95%, a Minor Allele Frequency (MAF) ≥0.05. In addition, we removed sites that deviated greatly from the Hardy–Weinberg equilibrium within populations and thinned sites that were tightly linked at <1 kb intervals using VCFtools. For the stairway plot analysis, we included all SNPs located less than 1 kb apart with no MAF filtering.

2.4. Genetic Diversity and Genetic Differentiation

Neutral loci tests of the genotype data for all populations and markers were conducted using BayeScan [23] and the “Fsthet” package [24]. Genetic indices, such as the number of alleles (Na), number of effective alleles (Ne), observed heterozygosity (Ho), expected heterozygosity (He), and Fixation index (FIS) were estimated within each population using GenALEx 6.502 [25]. HP-Rare v.1.1 [26] was employed to calculate the allelic richness (Ar) and private allelic richness (pAr) with a minimum sample size of eight.
To examine differences between populations, genetic differentiation coefficients were calculated following Meirmans’s method [27] in GenALEx 6.502 and Weir and Cockerham’s method [28] in the R “hierfstat” package. Hierarchical analysis of molecular Variance (AMOVA) [29] was performed using GenALEx 6.502. Gene flows (Nm) based on FST and private alleles were calculated using GenALEx 6.502 and GENEPOP v4.3 [30]. Genetic distance matrices of pairwise population FST and pairwise population gene flow were also calculated in GenALEx 6.502.

2.5. Population Structure

We inferred the most likely number of genetic clusters using STRUCTURE v.2.3.4 [31]: 10 independent runs were performed at K = 1–10 with a burn-in period of 50,000 iterations and 100,000 MCMC repetitions, using no prior information, under the admixture and correlated allele frequencies models. The outputs of STRUCTURE were analyzed in Structure Harvester [32] to determine the most likely number of clusters according to ΔK [33] and mean LnP(K) [31]. CLUMPP v.1.1 [34] was then used to calculate the average pairwise similarity of runs based on the Greedy method, and finally the outputs of CLUMPP were visualized in Distruct v.1.1 [35].
The pairwise FST distance matrix was used to generate a dendrogram in MEGA v.7.0.26 [36] with the neighbor-joining method [37] and a network in SplitsTree v.4.14.8 [38] with the neighbor-net method [39]. In addition, we tested the correlations between genetic distance and geographic distance by correlating FST/(1 − FST) with geographic distance (km) in a Mantel test with 9999 permutations, as implemented in GenAIEx.
In order to assess the relationship structure within each population, we employed the COANCESTRY software to calculate the pairwise relatedness for all individuals with Wang estimator [40]. These relatedness coefficients(r) vary from 0 to 1, and a value of 0.5 indicates that individuals are first-order relatives, such as parents–offspring or full siblings. A value of 0.25 indicates second-order relatedness, such as half sibling, grandparents–grandchildren, avuncular, or double first cousins.

2.6. Demographic History

The variation in effective population size (Ne) over time was inferred using the composite likelihood approach with a multi-epoch model implemented in the Stairway plot software [41]. This method evaluates the difference between the observed site frequency spectrum (SFS) and its expectation under a specific demographic history [42]. The software was run using the two-epoch method, following the recommended 67% of sites for training and 200 bootstraps on the folded SFS. We excluded singletons from the estimation to minimize errors due to genotype calling. We assumed a mutation rate per generation of 1.50 × 10⁻⁹ based on a previous study by Moriguchi et al. [43]. Cryptomeria japonica is a long-lived species, and there are many ancient trees older than 1000 years in the wild. Suzuki and Susukida [44] estimated that 100 to 300 years were necessary for the regeneration of the natural forest on Yakushima Island, thus we set the generation time to 150, 200, or 300 years in different runs.

3. Results

3.1. Genetic Diversity and Differentiation

A total of 922 SNPs were obtained and used to assess the genetic diversity of seven populations of Chinese Cryptomeria. The SNP data were deposited in Dryad (DOI: https://doi.org/10.5061/dryad.nk98sf7rf); the loci did not depart from neutrality according to Bayescan. The number of alleles in each population ranged from 1.550 to 1.939, with an average of 1.789. The observed heterozygosity and expected heterozygosity were in the ranges Ho = 0.187 to 0.307 and He = 0.174 to 0.316, with an average of Ho = 0.269 and He = 0.253, respectively. The fixation index (FIS) for populations LS and WT indicated significant inbreeding, while populations YTG, WYS, and XTM exhibited significant excess heterozygosity. The allelic richness varied from 1.42 in population WT to 1.77 in population LS. Notably, population LS had a relatively higher private allelic richness of 0.03 and the other populations were lower (pAr = 0.01 or 0). Overall, the highest diversity within a population was in LS and the lowest was in WT (Table 2).
The overall population differentiation coefficient (FST) among all Chinese populations for the 922 loci was 0.119 (Meirmans’s method) and 0.134 (Weir and Cockerham’s method). Correspondingly, the gene flows (Nm) based on FST were 1.858 and 1.618 respectively, while the Nm based on private allele frequency was only 0.0811. The AMOVA results (Table 3) showed that the proportion of variation among populations was 12%; among individuals, it was 12%’ and within individual, it was 76%. The majority of variation occurred within individuals. The pairwise FST and pairwise Nm for each population in this study suggested significant differentiation in every pair of populations, and the gene flow varied widely between different pairs. The greatest gene flow occurred between populations TBY and WYS (7.846), and the lowest occurred between populations YTG and WT (0.696) (Table 4).
Six Japanese populations were also sequenced and merged with the Chinese populations into a CHN-JPN dataset. We obtained 183 SNPs from this dataset to compare the genetic diversity and structure between the Chinese and Japanese groups. Japanese populations (Na = 1.842, Ne = 1.393, He = 0.267, Ho = 0.245) showed higher genetic diversity than the Chinese populations (Na = 1.511, Ne = 1.232, He = 0.150, Ho = 0.143). Interestingly, the highest diversity population in China, LS, harbors a very similar level of diversity to the Japanese populations (Table S2). In addition, a higher genetic differentiation among Chinese populations (FST = 0.1204) was detected than among Japanese populations (FST = 0.0455).

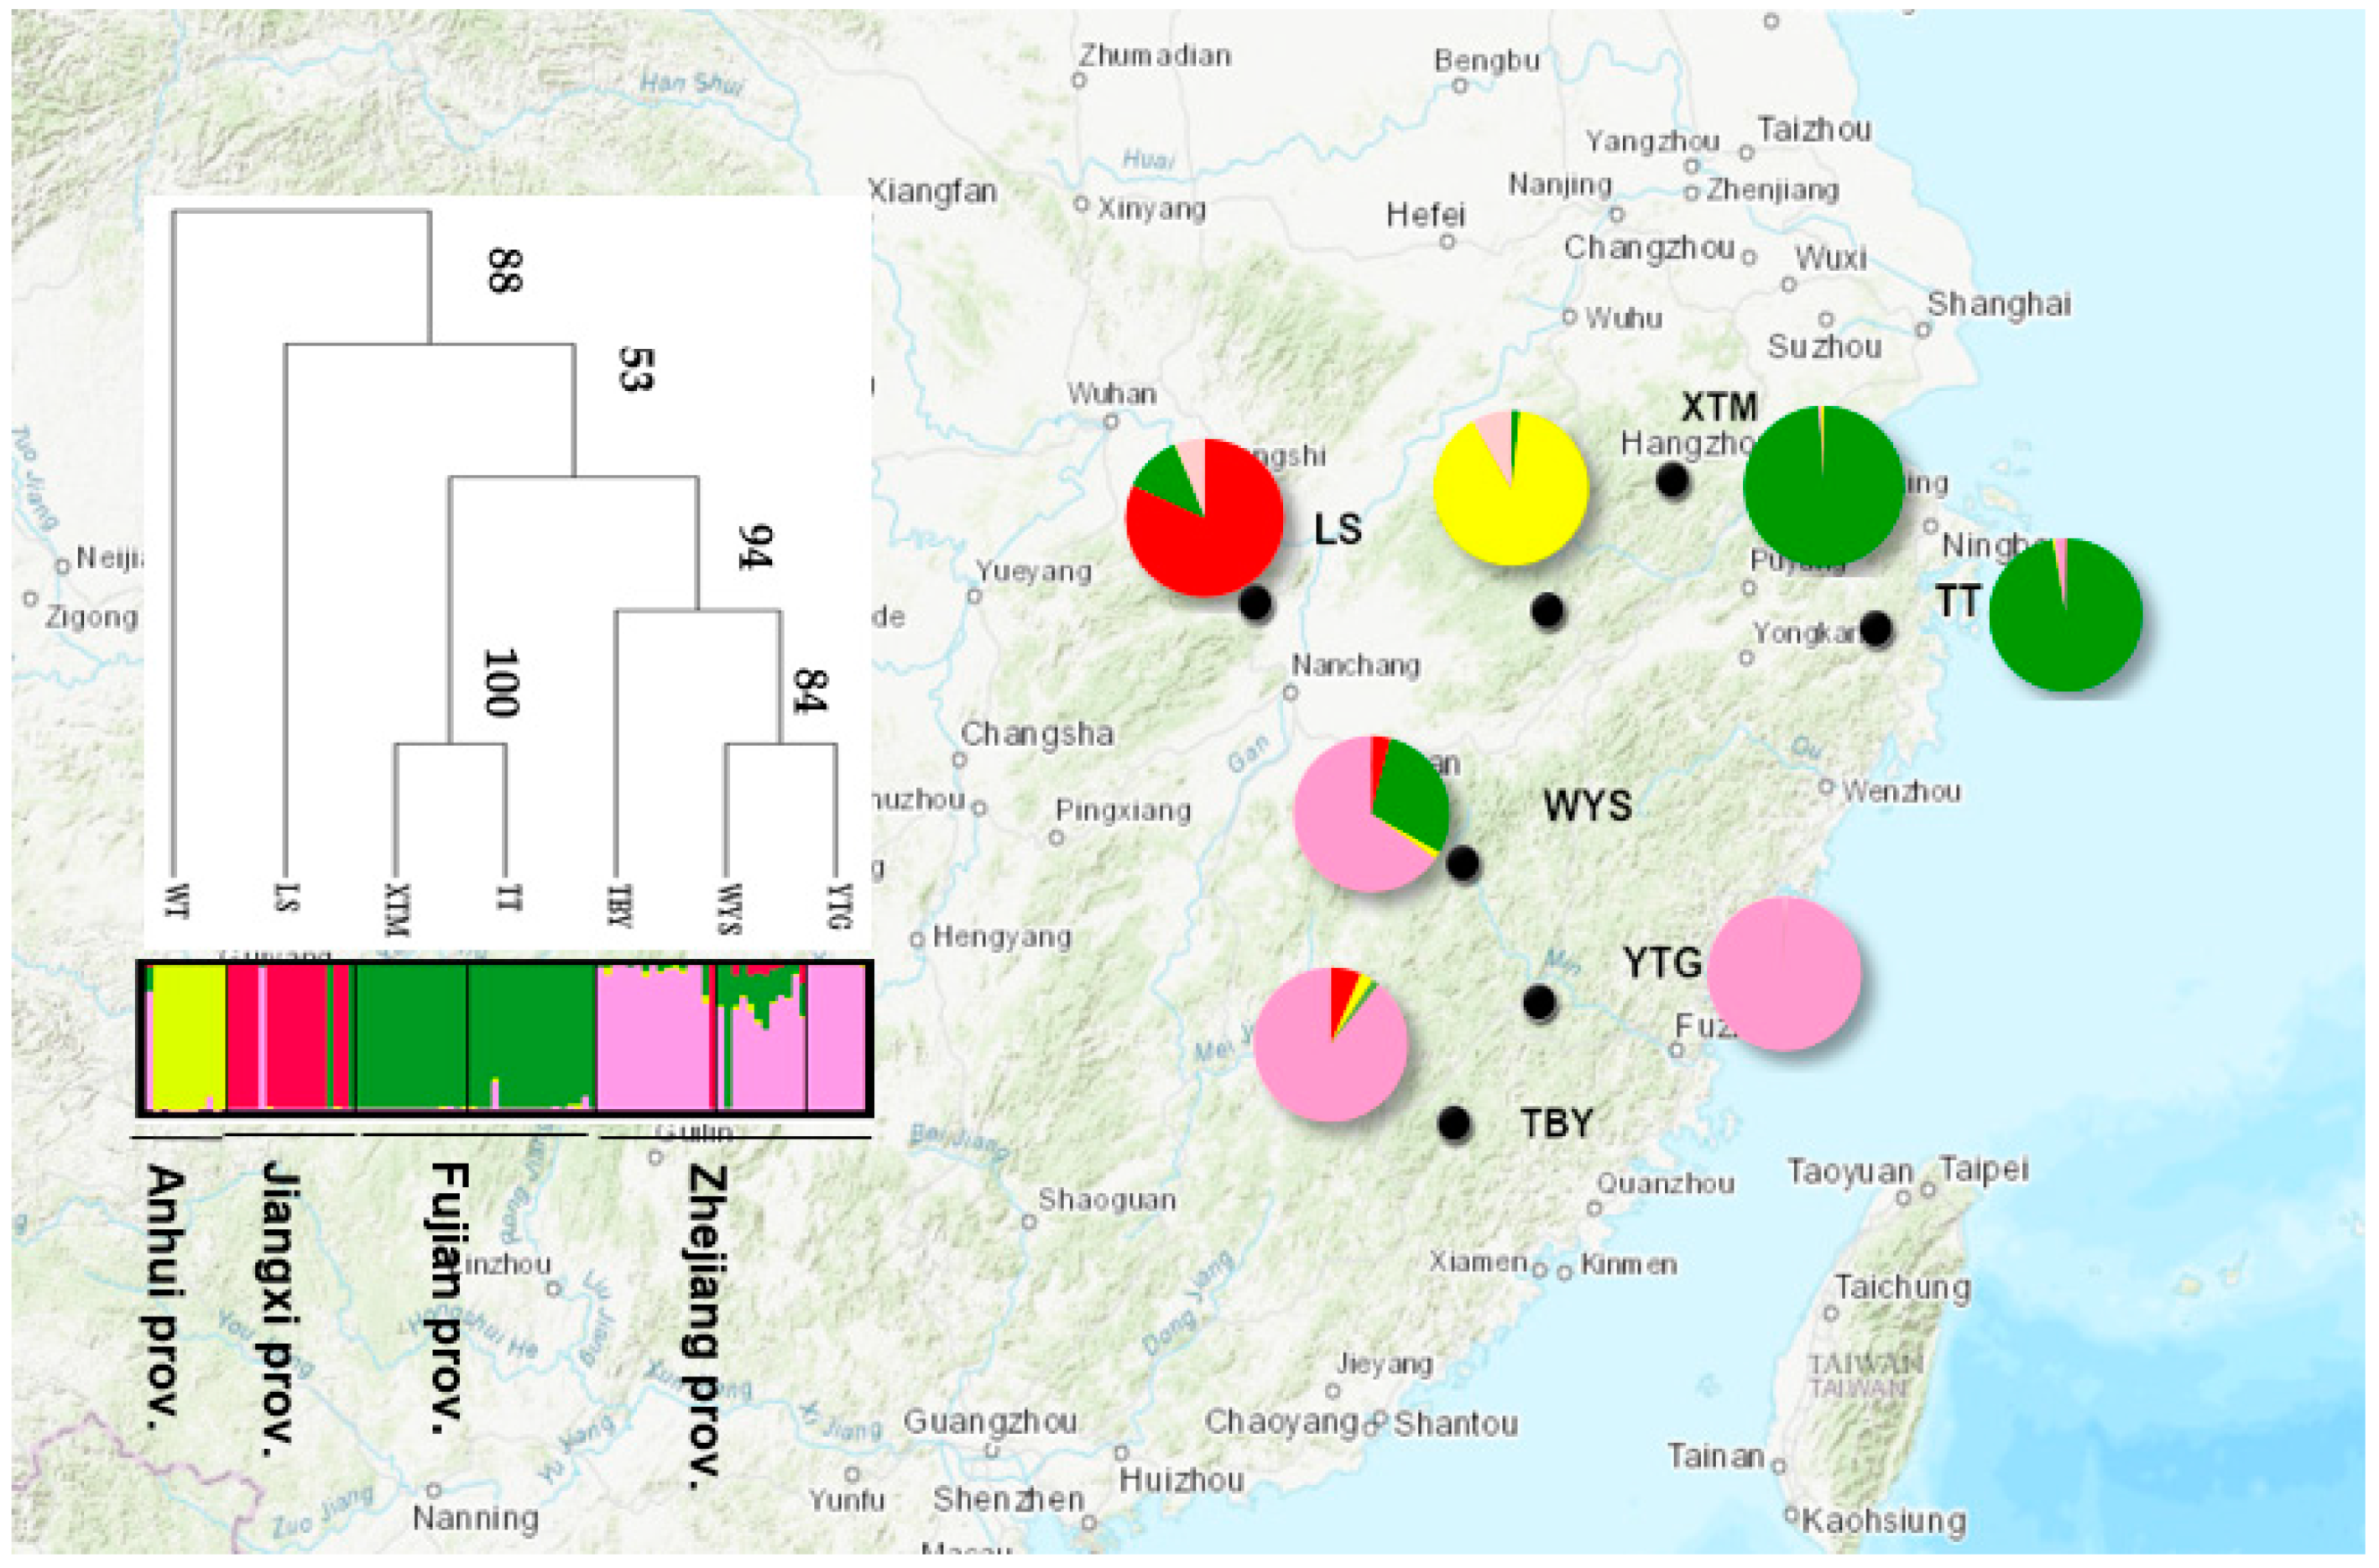
3.2. Genetic Structure

We explored the genetic structure of the Chinese and Japanese populations based on 183 SNPs. Two groups were clearly identified, but the population LS was placed with the Japanese group in the network (Figure S1).
We subsequently analyzed the genetic structure within Chinese populations using the 922 SNPs. The Bayesian cluster analysis assigned the seven populations into four distinct clusters (Figure 2). The results based on ΔK and mean LnP(K) indicated optimal values of 4 and 5, respectively (Figure S2). The presence of four clusters is consistent with division according to the four geographical provinces in which the populations are located, but note that population WYS from cluster 3 (Fujian prov.) shows a certain amount of mixing with cluster 4 (Zhejiang prov.). When K = 5, population YTG from Fujian province is allocated to a separate cluster. The other values of K also provided some additional information. Population LS (Jiangxi prov.) was the first to split from the other populations when K = 2, followed by population WT (Anhui prov.) when K = 3. Separation occurred within cluster 3 (Fujian prov.) when K = 5–7. Cluster 4, two populations from Zhejiang province, were always closely related. Similar results were obtained from the dendrogram based on the pairwise FST matrix (Figure 3) (Figure S3).
In summary, we partitioned the seven populations of C. japonica var. sinensis into four clusters (LS from Jiangxi prov.; WT from Anhui prov.; WYS, TBY, and YTG from Fujian prov.; and TTS and XTM from Zhejiang prov.) which seems to be a reasonable classification. However, population LS should be regarded as Japanese Cryptomeria (Figure S1).
We did not detect a significant correlation between geographic distance and genetic distance based on a Mantel test (R2 = 0.007, p = 0.382) (Figure 4). No isolation by distance (IBD) was found. Here, we considered six populations, excluding LS because this population appears to be an old plantation derived from Japanese stock.

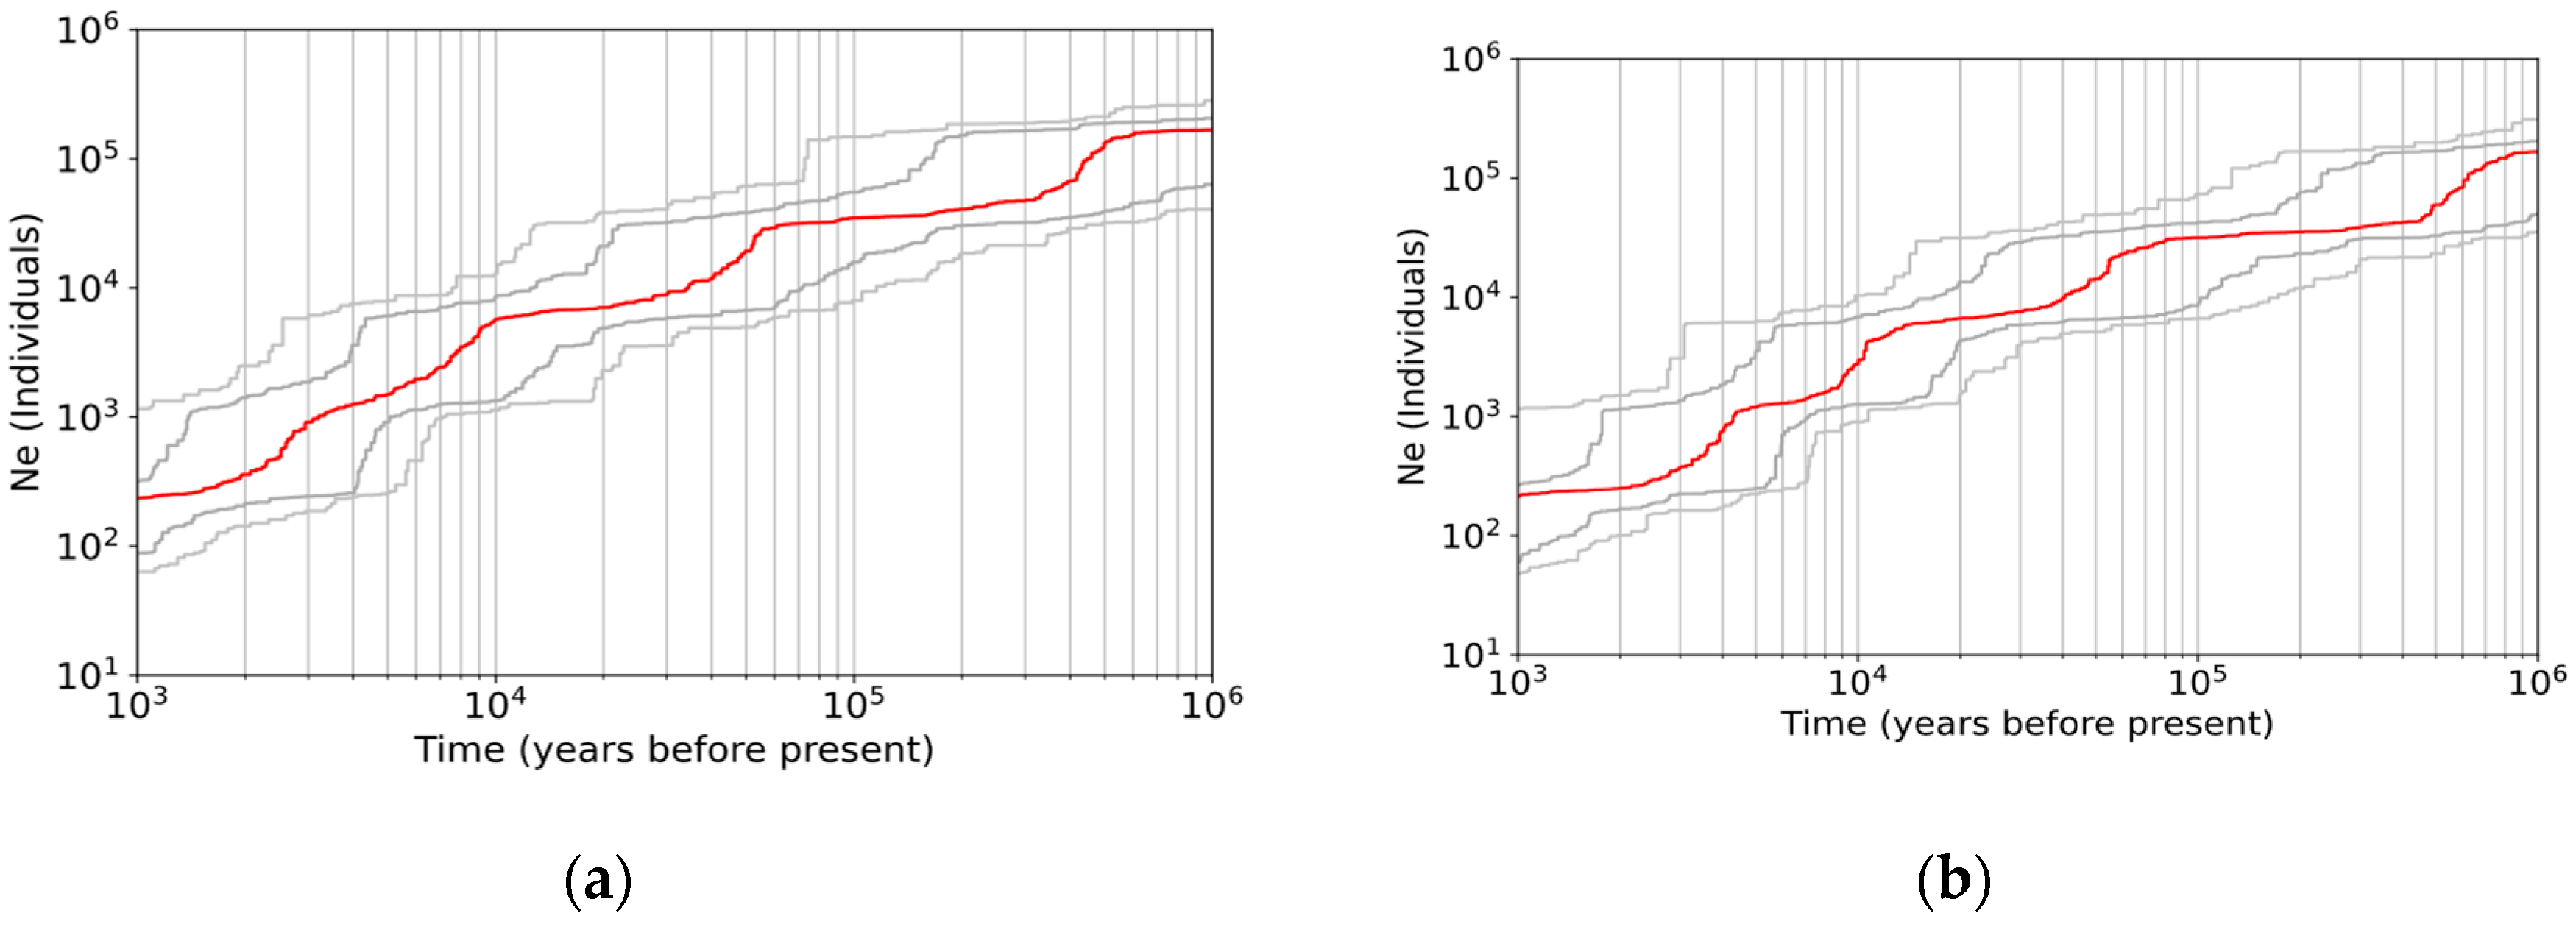
3.3. Demographic History

We obtained very similar trends in the three different scenarios (generation time = 150, 200, and 300 years)—namely, that the effective population size of Chinese Cryptomeria has experienced a continuous decline from the mid-Pleistocene to the present. The first decline occurred from 1 Mya to 0.4 Mya BP, coinciding with the onset of the Naynayxungla Glaciation (0.8–0.5 Mya) in China. The second decline began ca. 0.1 Mya to 0.06 Mya BP, when the Last Glacial Period (LGP) commenced. However, the range of Cryptomeria in China did not increase but continued to decline throughout the Holocene (Figure 5).

4. Discussion

4.1. An Old Plantation Derived from Japanese Origin

The result of the NeighborNet based on FST revealed a clear separation between the Chinese and Japanese Cryptomeria (Figure S1), with population LS from Lushan mountain in Jiangxi province clustered with the Japanese group. Moreover, the genetic diversity of this population was apparently higher than that of the other Chinese populations and showed a very similar level of genetic diversity to the Japanese populations. There are historical records showing that, from ancient times, certainly as early as the 1st century BC, there was trade and the movement of people between Japan and China. After that, this kind of relationship continued until now. As a result, many items were exchanged between the two countries. Useful and important goods and ideas were shared, with rice cultivation being one of the best examples, having originated in China and then been exported to Japan. It is likely that a visitor to Japan in ancient times saw a huge Cryptomeria tree, brought back the seeds, and planted them in China. More recently, large-scale introductions of C. japonica from Japan occurred in the early 20th century. We, therefore, consider the population LS to be a Japanese Cryptomeria population based on our genetic data and historical evidence. However, some Chinese Cryptomeria individuals are present in this population, because individuals LS001 and LS017 belong to the Chinese population according to the NeighborNet result (Figure S4). Bayesian cluster analysis also showed a similar result to that generated by NeighborNet. With regard to individual LS001, this famous tree is recorded in an ancient book, “Travel Notes of Xu Xiake”, written by a geographer in 1618, and it is estimated to be more than 600 years old (Figure S5). The Cryptomeria forest in Lushan mountain is, therefore, a mix of Chinese and Japanese Cryptomeria, and we found no significant phenotypic difference between them during our field investigation.

4.2. Low Genetic Diversity and High Genetic Differentiation in Chinese Cryptomeria

Ancient tree populations of C. japonica var. sinensis in China harbor a very low genetic diversity, but there is high genetic differentiation between populations compared to its congener, C. japonica in Japan. Here, we excluded LS population when discussing the genetic diversity and differentiation of Chinese Cryptomeria. Previous studies such as those by Chen et al. [6] and Tsumura et al. [18] also indicate a lower genetic variation in Chinese populations. Theoretically, inbreeding, genetic drift, restricted gene flow, and small population size all contribute to a reduction in genetic diversity [45]. In this study, we found evidence of a continuous decline in effective population size since the mid-Pleistocene. Genetic drift caused by climate fluctuation probably played an important role during the evolutionary process. Moreover, there was no expansion after the retreat of glaciers. We speculate that habitat loss or degradation and artificial selection caused by intense human activities have further accelerated the decline of the already low diversity, also leading to the great differentiation between different regions. Although gene flow in Cryptomeria, an allogamous, wind-pollinated conifer species, is expected to be high, we detected restricted gene flow (Nm = 1.618) between all the ancient tree populations, lower than the normal value of Nm > 3 in conifers [46]. Given that 76% of the variation occurred within populations, we consider that limited gene flow is also a factor accounting for the low genetic diversity. However, we did not find any sign of inbreeding in any population except WT. The result of relatedness analysis also presented a low proportion of kinship in most cases except the population of WT and YTG (Figure S6). The low diversity in WT may be caused by family relationship, while in YTG is even in the small sample size (only 8) there is no inbreeding (FIS = −0.123) found in it. As far as other Chinese Cryptomeia populations go, we believe that the low level of genetic diversity can be attributed to climate change and strong human activity. Interesting, three populations (WYS, YTG, and XTM) showed signs of significant excess heterozygosity, which we consider probably to be the consequence of selection. However, the FIS values of the three populations are not particularly high (WYS = −0.087, YTG = −0.123, and XTM = −0.082, Table 2) and thus this result may be related to the relatively small number of individuals investigated or may just be a chance occurrence. Some outlier loci under selection were detected by “Fsthet”, and these might also be related to this result (Figure S7).
Similar situations with low genetic variation and high genetic differentiation have been found in some isolated and threatened species, such as Tsuga caroliniana Englem. [47], Podocarpus sellowii Klotzsch ex Endl. [48], and Lupinus alopecuroides Desr. [49]. Chinese Cryptomeria, as an important timber species, has been widely planted throughout southern China, and the unexpectedly low genetic diversity is probably associated with population size reduction because of global climate change, while the high genetic differentiation is probably the result of long isolation and human disturbance.

4.3. Specific Genetic Structure with an Absence of IBD

We separated the seven ancient tree populations into four groups coinciding with the four different administrative provinces in which the trees are located. Population LS from Lushan province and population WT from Anhui province were clearly separated, while the divergence between the Zhejiang and Fujian groups had relatively lower support (Figure 3). A certain mixing of the two groups occurred in the contact population, WYS. Ln(K) is also provided an alternative optimal structure that showed differentiation within the Fujian province group when K = 5 (Figure S2) (Figure 2). We noticed that it was YTG, not the contact population of WYS, that was separated. As we mentioned before, this may related to the small sample size of that population.
Even though a clear genetic structure was found, we did not detect a significant correlation between geographical distance and genetic distance, but Japanese Cryptomeria does exhibit such a correlation [50]. Generally, most tree species exhibit clear isolation by distance (IBD) if there is no strong human disturbance and selection [50,51]. In this case, geographical isolation is not the major factor responsible for the current structure. Since Cryptomeria is a wind-pollinated monoecious species, its mating system cannot explain the large differentiation either. As discussed above, the genetic drift associated with climate oscillations greatly reduced genetic diversity; one key factor may have been drought stress, which Cryptomeria is particularly sensitive to, as reported by Tsumura et al. [18] and Mori et al. [52]. On the other hand, the resulting habitat fragmentation also led to great genetic differentiation. We think that the reason for the unexpected absence of IBD was probably human disturbance. The topography of the range investigated, southern China, is characterized by numerous plains and basins between low hills [53]. In ancient times, the relatively flat terrain, with abundant grain cultivation, along with the development of handcraft industries resulted in the viability of commercial activities based on the timber and silk trade in this area, especially creating links between Fujian and Zhejiang province. A study of the genetic structure of horses suggested an important role for trade routes in facilitating exchange over topographically, ecologically, culturally, and politically diverse landscapes and large geographical distances [54]. Thus, we speculate that ancient trade routes in southern China may have provided opportunities for the transfer of material between different regions, resulting in ambiguities in the genetic origin of trees across the whole distribution range. However, given that we still found a pattern of genetic structure, the transfer of material must have been restricted.
Because of the very limited number of ancient trees currently in existence—we discovered only seven populations—the genetic structure presented in this study may deviate more or less from the original pattern without human interference. Despite this, we found a similar structure pattern—namely, an absence of IBD—to some species in southern China, including Miscanthus lutarioriparius L. Liou ex Renvoize & S.L. Chen [55], Houpoea officinalis (Rehder & E.H. Wilson) N.H. Xia & C.Y. Wu [56], and Brasenia schreberi J.F.Gmel. [57]. This may indicate a similar evolutionary history under anthropogenic pressure.

4.4. Continuous Decline of Population Size without Postglacial Recolonization

Climate oscillations throughout the Late Quaternary had a dramatic effect on the species ranges of both plants and animals in subtropical mainland Asia and the Japanese Archipelago [58]. The same goes for Chinese Cryptomeria: a remarkable decline in effective population size has been detected since the mid-Pleistocene. However, unlike many widely spread temperate plant species in Japan and East China [59], there was no recolonization after contractions during the LGM, but the population kept declining throughout the Holocene. Tsumura et al. [18] also did not find an obvious range expansion in the mid-Holocene and during the present using Species Distribution Modelling (SDM). There are two possible explanations for the continuous decline in population size after the LGM. First, the Ne of Chinese Cryptomeria may have decreased to a threshold size that constrained recovery. The low genetic diversity may have undermined any adaptive potential of the population during migrations. Second, humans in the Holocene directly reduced population size by cutting trees and clearing land [60]. Similar cases can be seen in some plant species in eastern China, including the genus Croomia [61], Davidia involucrate Baill. [62], Ostrya rehderiana Chun [60], and Kalopanax septemlobus (Thunb.) Koidz. [63].
In Japan, the range of Cryptomeria contracted to several refugia, mainly concentrated in the southwestern part of Japan during the last glaciation [64], and some natural stands have been retained up to the present. Japan may have had a favorable environment, with sufficient precipitation and fertile soil [18], and less anthropogenic disturbance. Thus, Cryptomeria in Japan maintained a higher level of genetic diversity and also presumably a larger effective population size than in China.

4.5. Conversation Considerations

Our investigated sites included the most famous and well-conserved forest stand of Chinese Cryptomeria, population XTM, which is located in Tianmu national nature reserve, Zhejiang province. This area contains many relict species of the Paleogene glaciation and is known for various ancient trees, including Ginkgo biloba L., Liquidambar formosana Hance, and Pseudolarix amabilis (J. Nelson) Rehder; among them, C. japonica var. sinensis is the dominant species. Previous studies on Ginkgo biloba [65], Liriodendron chinensis (Hemsl.) Sarg. [66], and Quercus acutissima Carruth [67] presented some evidence of glacial refugia in this region. In our case, we found a moderate level of genetic diversity and some private alleles, but no evidence to show that this area is the origin of Chinese Cryptomeria, even though it may seem to be [18]. Chen et al. [6] also suggested that the ancient population of C. japonica var. sinensis on Tianmu mountain was introduced originally, with subsequent natural regeneration.
Before the 1950s, most of China’s forests were naturally regenerated. Since then, demand for timber has resulted in the extensive cutting of forests, and timber harvests increased from 20 million m3/year in the 1950s to 63 million m3/year in the 1990s [68]. Large-diameter trees are the first targets of timber extraction [69]. Government policy did not require that native tree species be planted after logging, but promoted the planting of fast-growing tree species, such as larch (Larix sp.), poplar (Populus sp.), and Chinese fir (Cunninghamia lanceolata (Lamb.) Hook). As a consequence, forest coverage has increased substantially, while natural forest has declined to 30% of the total forest area in China [68]. Moreover, genetic diversity loss is irreversible. In 1998, the Chinese government established the National Forest Conservation program (NPCP) to protect existing natural forest from excessive cutting. However, natural stands of Chinese Cryptomeria are now very rare, and the ancient populations which probably contain the ancestral genetic signature exhibit very low diversity, highlighting the precarious status of genetic resources of Chinese Cryptomeria.
During our field investigation, we found that some ancient trees occur sporadically in secondary forest and they are vulnerable to habitat fragmentation, atmospheric drought, and other competing species such as moso bamboo (Phyllostachys edulis (Carrière) J.Houz) [70]. However, some ancient trees in human-dominated landscapes are known for their high cultural and socioeconomic value, so citizens are willing to pay for their conservation [69]. Overall, the fate of ancient trees of Cryptomeria in China still hangs in the balance.
Under these circumstances, a more profound understanding and effective measurement are urgently needed. Here we propose both the in situ and ex situ conservation of this species. First, we appeal for stricter implementation of regulations to protect existing ancient trees in the wild. We suggest a complete ban on cutting and grazing; in addition, the thinning of dense, competitive bamboos or other problem species in the habitat is required. Even those trees that are worshipped as “sacred” still face some threats from industrial pollution, urbanization, and other forms of economic development. Sightseeing activities should be properly restricted. Compared to other populations, measures for the conservation of population WT, which is located on Huangshan mountain in Anhui province, are urgently required because it has the lowest diversity and diverges most from the other populations. Secondly, ex situ collections, which represent the highest genetic variation in the wild, need to be established. So far, two large germplasm gardens of Chinese Cryptomeria have been constructed and abundant sources have been collected from Fujian province and Zhejiang province, but we recommend a wider range of collection, targeting every single ancient tree in China. In view of afforestation, even though this species has been planted widely across southern China, many plantations lack clear provenance information, thus obscuring the genetic composition of planted forests; better data is required in order to develop a better afforestation strategy. As revealed in our study, populations from Tianmu mountain (XTM) in Zhejiang province and Tianbaoyan nature reserve (TBY) in Fujian province have a relatively high diversity and harbor some private alleles; these populations should be considered core resources.

5. Conclusions

Although the Chinese Cryptomeria population in Tianmu mountain has been studied and its low genetic diversity has been reported before, our study is the first study to explore the genetic composition of ancient Cryptomeria trees across a distribution range in China. The findings confirm that the ancient Cryptomeria population in China contains a low level of genetic diversity and high differentiation. Populations in different provinces were genetically differentiated, but no IBD was detected. We infer that the genetic drift caused by climate oscillations during the Last Glacial Period greatly reduced the population size of Chinese Cryptomeria, and this was followed by intense anthropogenic disturbance, which accelerated the loss of diversity and also led to a clear differentiation between regions. In addition, we present some theoretical guidance for conservation work in the future. Our study is the first to explore the genetic composition of ancient Cryptomeria trees in China and lays a firm foundation for further molecular research.

Supplementary Materials

The following are available online at https://www.mdpi.com/1999-4907/11/11/1192/s1: Figure S1: NeighborNet based on pairwise FST matrix of Chinese and Japanese populations; Figure S2: The number of inferred cluster K based on ΔK and mean LnP(K) obtained from Structure Harvester; Figure S3 Neighbor-joining dendrogram based on FST pairwise matrix of C. japonica var. sinensis after removing the suspected Japanese population of LS; Figure S4: NeighborNet based on pairwise FST matrix of all individuals. Individuals in red color indicated two trees in population of LS that belong to Chinese group; Figure S5: A ancient tree growing in Lushan mountain, coded LS001 in this study, was estimated more than 600 years old; Figure S6: The result of relatedness analysis of 7 populations, the darker blue indicated the higher relatedness coefficiency. Figure S7: Distribution of FSTHT (expected heterozygosity) relationship based on 922 loci in C. japonica var sinensis. Two red line indicated the confidence interval of high and low value. A total of 20 outlier loci detected among 922 loci. Table S1: Geographic locations and sample size (N) of the 6 Japanese Cryptomeria populations; Table S2: Genetic diversity indices of six populations of C. japonica and seven populations of C. japonica var. sinensis based on 183 loci.

Author Contributions

Conceptualization, Y.T. and Y.W.; methodology, K.U.; software, K.U.; validation, Y.T. and K.U.; formal analysis, K.U., M.C., and Y.O.; investigation, Y.W. and M.C.; sources, Y.W.; data curation, K.U.; writing—original draft preparation, M.C.; writing—review and editing, Y.T., K.U., and M.C.; visualization, M.C.; supervision, Y.T., K.U., and Y.W.; project administration, Y.T. and Y.W.; funding acquisition, Y.T., K.U., and Y.W. All authors have read and agreed to the published version of the manuscript.

Funding

This study was partly supported by the Sumitomo Foundation Grant for Environmental Research Projects, JSPS KAKENHI (grant no. JP18H02248) and the National Key Research and Development Program of China (grant no. 2016YFE0127200).

Acknowledgments

We sincerely offer thanks for the assistance provided by Minqui Wang, Xingtong Wu, Xingyu Li, and Liang Wang during the material sampling and DNA extracting process. We also thank Eko Prasetyo and Ye Chen for offering help on the data analysis.

Conflicts of Interest

The authors declare no conflict of interest.

References

  1. Ding, W.-N.; Kunzmann, L.; Su, T.; Huang, J.; Zhou, Z.-K. A new fossil species of Cryptomeria (Cupressaceae) from the Rupelian of the Lühe Basin, Yunnan, East Asia: Implications for palaeobiogeography and palaeoecology. Rev. Palaeobot. Palynol. 2018, 248, 41–51. [Google Scholar] [CrossRef]
  2. Hayashi, Y. Taxonomical and Phytogeographical Study of Japanese Conifers; Norin-Shuppan: Tokyo, Japan, 1960. [Google Scholar]
  3. Tsumura, Y. Cryptomeria. In Wild Crop Relatives: Genomic and Breeding Resources: Forest Trees; Kole, C., Ed.; Springer: Berlin, Germany, 2011; pp. 49–63. [Google Scholar]
  4. Fu, L.G.; Yu, Y.F.; Mill, R.R. Taxodiaceae. In Flora of China; Wu, Z.Y., Raven, P.H., Eds.; Science Press: Beijing, China, 1999. [Google Scholar]
  5. Zheng, H.; Hu, D.; Wei, R.; Yan, S.; Wang, R. Chinese Fir Breeding in the High-Throughput Sequencing Era: Insights from SNPs. Forests 2019, 10, 681. [Google Scholar] [CrossRef] [Green Version]
  6. Chen, Y.; Yang, S.Z.; Zhao, M.S.; Ni, B.Y.; Liu, L.; Chen, X.Y. Demographic genetic structure of Cryptomeria japonica var. sinensis in Tianmushan Nature Reserve, China. J. Integr. Plant Biol. 2008, 50, 1171–1177. [Google Scholar] [CrossRef]
  7. Luo, P.; Cao, Y.; Mo, J.; Wong, H.; Shi, J.; Xu, J. Analysis of genetic diversity and construction of DNA fingerprinting of clones in Cryptomeria fortune. J. Nanjing For. Univ. (Nat. Sci. Ed.) 2017, 41, 191–196. [Google Scholar]
  8. Howe, G.T.; Yu, J.; Knaus, B.; Cronn, R.; Kolpak, S.; Dolan, P.; Lorenz, W.W.; Dean, J.F. A SNP resource for Douglas-fir: De novotranscriptome assembly and SNP detection and validation. BMC Genom. 2013, 14, 137. [Google Scholar] [CrossRef] [Green Version]
  9. Davey, J.W.; Blaxter, M.L. RADSeq: Next-generation population genetics. Brief. Funct. Genom. 2010, 9, 416–423. [Google Scholar] [CrossRef]
  10. Iwata, H.; Hayashi, T.; Tsumura, Y. Prospects for genomic selection in conifer breeding: A simulation study of Cryptomeria japonica. Tree Genet. Genom. 2011, 7, 747–758. [Google Scholar] [CrossRef]
  11. Zhou, W.; Ji, X.; Obata, S.; Pais, A.; Dong, Y.; Peet, R.; Xiang, Q.-Y.J. Resolving relationships and phylogeographic history of the Nyssa sylvatica complex using data from RAD-seq and species distribution modeling. Mol. Phylogen. Evol. 2018, 126, 1–16. [Google Scholar] [CrossRef]
  12. Brandrud, M.K.; Paun, O.; Lorenz, R.; Baar, J.; Hedrén, M. Restriction-site associated DNA sequencing supports a sister group relationship of Nigritella and Gymnadenia (Orchidaceae). Mol. Phylogenetics Evol. 2019, 136, 21–28. [Google Scholar] [CrossRef]
  13. Miller, M.R.; Dunham, J.P.; Amores, A.; Cresko, W.A.; Johnson, E.A. Rapid and cost-effective polymorphism identification and genotyping using restriction site associated DNA (RAD) markers. Genome Res. 2007, 17, 240–248. [Google Scholar] [CrossRef] [Green Version]
  14. Peterson, B.K.; Weber, J.N.; Kay, E.H.; Fisher, H.S.; Hoekstra, H.E. Double Digest RADseq: An Inexpensive Method for De Novo SNP Discovery and Genotyping in Model and Non-Model Species. PLoS ONE 2012, 7, e37135. [Google Scholar] [CrossRef] [Green Version]
  15. Eaton, D.A.; Ree, R.H. Inferring phylogeny and introgression using RADseq data: An example from flowering plants (Pedicularis: Orobanchaceae). Syst. Biol. 2013, 62, 689–706. [Google Scholar] [CrossRef] [Green Version]
  16. McCormack, J.E.; Hird, S.M.; Zellmer, A.J.; Carstens, B.C.; Brumfield, R.T. Applications of next-generation sequencing to phylogeography and phylogenetics. Mol. Phylogen. Evol. 2013, 66, 526–538. [Google Scholar] [CrossRef]
  17. Wang, J.; Liu, J.; Huang, Y.; Yang, J. The origin and natural distribution of Cryptomeria. J. Sichuan For. Sci. Technol. 2007, 28, 92–94. [Google Scholar]
  18. Tsumura, Y.; Kimura, M.; Nakao, K.; Uchiyama, K.; Ujino-Ihara, T.; Wen, Y.; Tong, Z.; Han, W. Effects of the last glacial period on genetic diversity and genetic differentiation in Cryptomeria japonica in East Asia. Tree Genet. Genom. 2020, 16, 19. [Google Scholar] [CrossRef]
  19. Zhang, J. The Analysis on Genetic Diversity of Superior Cryptomehia Fortunei Resources and Screening of Hybrid Parent. Master’s Thesis, Zhejiang Agriculture and Forestry University, Zhejiang, China, 2014. [Google Scholar]
  20. Ueno, S.; Uchiyama, K.; Moriguchi, Y.; Ujino-Ihara, T.; Matsumoto, A.; Wei, F.-J.; Saito, M.; Higuchi, Y.; Futamura, N.; Kanamori, H. Scanning RNA-Seq and RAD-Seq approach to develop SNP markers closely linked to MALE STERILITY 1 (MS1) in Cryptomeria japonica D. Don. Breed. Sci. 2019, 69, 19–29. [Google Scholar] [CrossRef] [Green Version]
  21. Puritz, J.B.; Hollenbeck, C.M.; Gold, J.R. dDocent: A RADseq, variant-calling pipeline designed for population genomics of non-model organisms. PeerJ 2014, 2, e431. [Google Scholar] [CrossRef] [Green Version]
  22. Danecek, P.; Auton, A.; Abecasis, G.; Albers, C.A.; Banks, E.; DePristo, M.A.; Handsaker, R.E.; Lunter, G.; Marth, G.T.; Sherry, S.T. The variant call format and VCFtools. Bioinformatics 2011, 27, 2156–2158. [Google Scholar] [CrossRef]
  23. Foll, M.; Gaggiotti, O. A genome-scan method to identify selected loci appropriate for both dominant and codominant markers: A Bayesian perspective. Genetics 2008, 180, 977–993. [Google Scholar] [CrossRef] [Green Version]
  24. Flanagan, S.P.; Jones, A.G. Constraints on the FST–heterozygosity outlier approach. J. Hered. 2017, 108, 561–573. [Google Scholar] [CrossRef] [Green Version]
  25. Peakall, R.; Smouse, P.E. GenAlEx 6.5: Genetic analysis in Excel. Population genetic software for teaching and research--an update. Bioinformatics 2012, 28, 2537–2539. [Google Scholar] [CrossRef] [PubMed] [Green Version]
  26. Kalinowski, S.T. hp-rare 1.0: A computer program for performing rarefaction on measures of allelic richness. Mol. Ecol. Notes 2005, 5, 187–189. [Google Scholar] [CrossRef]
  27. Meirmans, P.G. Using the AMOVA framework to estimate a standardized genetic differentiation measure. Evolution 2006, 60, 2399–2402. [Google Scholar] [CrossRef] [PubMed]
  28. Weir, B.S.; Cockerham, C.C. Estimating F-statistics for the analysis of population structure. Evolution 1984, 38, 1358–1370. [Google Scholar] [PubMed]
  29. Excoffier, L.; Smouse, P.; Quattro, J. Analysis of Molecular Variance Inferred From Metric Distances among DNA Haplotypes: Application to Human Mitochondrial DNA Restriction Data. Genetics 1992, 131, 479–491. [Google Scholar]
  30. Rousset, F. genepop’007: A complete re-implementation of the genepop software for Windows and Linux. Mol. Ecol. Resour. 2008, 8, 103–106. [Google Scholar] [CrossRef]
  31. Pritchard, J.K.; Stephens, M.; Donnelly, P. Inference of Population Structure Using Multilocus Genotype Data. Genetics 2000, 155, 945. [Google Scholar]
  32. Earl, D.A. STRUCTURE HARVESTER: A website and program for visualizing STRUCTURE output and implementing the Evanno method. Conserv. Genet. Resour. 2012, 4, 359–361. [Google Scholar] [CrossRef]
  33. Evanno, G.; Regnaut, S.; Goudet, J. Detecting the number of clusters of individuals using the software STRUCTURE: A simulation study. Mol. Ecol. 2005, 14, 2611–2620. [Google Scholar] [CrossRef] [Green Version]
  34. Jakobsson, M.; Rosenberg, N.A. CLUMPP: A cluster matching and permutation program for dealing with label switching and multimodality in analysis of population structure. Bioinformatics 2007, 23, 1801–1806. [Google Scholar] [CrossRef] [Green Version]
  35. Rosenberg, N.A. distruct: A program for the graphical display of population structure. Mol. Ecol. Notes 2004, 4, 137–138. [Google Scholar] [CrossRef]
  36. Kumar, S.; Stecher, G.; Tamura, K. MEGA7: Molecular evolutionary genetics analysis version 7.0 for bigger datasets. Mol. Biol. Evol. 2016, 33, 1870–1874. [Google Scholar] [CrossRef] [PubMed] [Green Version]
  37. Saitou, N.; Nei, M. The neighbor-joining method: A new method for reconstructing phylogenetic trees. Mol. Biol. Evol. 1987, 4, 406–425. [Google Scholar]
  38. Huson, D.H.; Bryant, D. Application of phylogenetic networks in evolutionary studies. Mol. Biol. Evol. 2006, 23, 254–267. [Google Scholar] [CrossRef] [PubMed]
  39. Bryant, D.; Moulton, V. Neighbor-Net: An Agglomerative Method for the Construction of Phylogenetic Networks. Mol. Biol. Evol. 2004, 21, 255–265. [Google Scholar] [CrossRef]
  40. Wang, J. Estimating pairwise relatedness in a small sample of individuals. Heredity 2017, 119, 302–313. [Google Scholar] [CrossRef] [PubMed]
  41. Liu, X.; Fu, Y.-X. Exploring population size changes using SNP frequency spectra. Nat. Genet. 2015, 47, 555–559. [Google Scholar] [CrossRef] [Green Version]
  42. Khimoun, A.; Doums, C.; Molet, M.; Kaufmann, B.; Peronnet, R.; Eyer, P.; Mona, S. Urbanization without isolation: The absence of genetic structure among cities and forests in the tiny acorn ant Temnothorax nylanderi. Biol. Lett. 2020, 16, 20190741. [Google Scholar] [CrossRef] [Green Version]
  43. Moriguchi, N.; Uchiyama, K.; Miyagi, R.; Moritsuka, E.; Takahashi, A.; Tamura, K.; Tsumura, Y.; Teshima, K.M.; Tachida, H.; Kusumi, J. Inferring the demographic history of Japanese cedar, Cryptomeria japonica, using amplicon sequencing. Heredity 2019, 123, 371–383. [Google Scholar] [CrossRef]
  44. Suzuki, E.; Susukida, J. Age Structure and Regeration Process of Temperate Coniferous Stands in the Segire River Basin, Yakushima Island. Jpn. J. Ecol. 1989, 39, 45–51. [Google Scholar]
  45. Furlan, E.; Stoklosa, J.; Griffiths, J.; Gust, N.; Ellis, R.; Huggins, R.; Weeks, A. Small population size and extremely low levels of genetic diversity in island populations of the platypus, Ornithorhynchus anatinus. Ecol. Evol. 2012, 2, 844–857. [Google Scholar] [CrossRef] [PubMed]
  46. Ledig, F.T. Genetic Variation in Pinus. In Ecology and Biogeography of Pinus; Richardson, D.M., Ed.; Cambridge University Press: Cambridge, UK, 1998; pp. 251–280. [Google Scholar]
  47. Potter, K.M.; Campbell, A.R.; Josserand, S.A.; Nelson, C.D.; Jetton, R.M. Population isolation results in unexpectedly high differentiation in Carolina hemlock (Tsuga caroliniana), an imperiled southern Appalachian endemic conifer. Tree Genet. Genom. 2017, 13, 105. [Google Scholar] [CrossRef]
  48. Dantas, L.G.; Esposito, T.; de Sousa, A.C.B.; Félix, L.; Amorim, L.L.; Benko-Iseppon, A.M.; Batalha-Filho, H.; Pedrosa-Harand, A. Low genetic diversity and high differentiation among relict populations of the neotropical gymnosperm Podocarpus sellowii (Klotz.) in the Atlantic Forest. Genetica 2015, 143, 21–30. [Google Scholar] [CrossRef] [PubMed]
  49. Vásquez, D.L.; Balslev, H.; Hansen, M.M.; Sklenář, P.; Romoleroux, K. Low genetic variation and high differentiation across sky island populations of Lupinus alopecuroides (Fabaceae) in the northern Andes. Alp. Bot. 2016, 126, 135–142. [Google Scholar] [CrossRef]
  50. Tsumura, Y.; Kado, T.; Takahashi, T.; Tani, N.; Ujino-Ihara, T.; Iwata, H. Genome scan to detect genetic structure and adaptive genes of natural populations of Cryptomeria japonica. Genetics 2007, 176, 2393–2403. [Google Scholar] [CrossRef] [Green Version]
  51. Aoki, K.; Ueno, S.; Kamijo, T.; Setoguchi, H.; Murakami, N.; Kato, M.; Tsumura, Y. Genetic differentiation and genetic diversity of Castanopsis (Fagaceae), the dominant tree species in Japanese broadleaved evergreen forests, revealed by analysis of EST-associated microsatellites. PLoS ONE 2014, 9, e87429. [Google Scholar] [CrossRef] [Green Version]
  52. Mori, H.; Yamashita, K.; Saiki, S.-T.; Matsumoto, A.; Ujino-Ihara, T. Climate sensitivity of Cryptomeria japonica in two contrasting environments: Perspectives from QTL mapping. PLoS ONE 2020, 15, e0228278. [Google Scholar] [CrossRef]
  53. Cao, X.; Flament, N.; Müller, D.; Li, S. The dynamic topography of eastern China since the latest Jurassic Period. Tectonics 2018, 37, 1274–1291. [Google Scholar] [CrossRef]
  54. Warmuth, V.M.; Campana, M.G.; Eriksson, A.; Bower, M.; Barker, G.; Manica, A. Ancient trade routes shaped the genetic structure of horses in eastern Eurasia. Mol. Ecol. 2013, 22, 5340–5351. [Google Scholar] [CrossRef]
  55. Yang, S.; Xue, S.; Kang, W.; Qian, Z.; Yi, Z. Genetic diversity and population structure of Miscanthus lutarioriparius, an endemic plant of China. PLoS ONE 2019, 14, e0211471. [Google Scholar] [CrossRef] [Green Version]
  56. Yang, X.; Yang, Z.; Li, H. Genetic diversity, population genetic structure and protection strategies for Houpoëa officinalis (Magnoliaceae), an endangered Chinese medical plant. J. Plant Biol. 2018, 61, 159–168. [Google Scholar] [CrossRef]
  57. Li, Z.-Z.; Gichira, A.W.; Wang, Q.-F.; Chen, J.-M. Genetic diversity and population structure of the endangered basal angiosperm Brasenia schreberi (Cabombaceae) in China. PeerJ 2018, 6, e5296. [Google Scholar] [CrossRef]
  58. Harrison, S.; Yu, G.; Takahara, H.; Prentice, I. Diversity of temperate plants in east Asia. Nature 2001, 413, 129–130. [Google Scholar] [CrossRef]
  59. Qiu, Y.; Sun, Y.; Zhang, X.; Lee, J.; Fu, C.-X.; Comes, H.P. Molecular phylogeography of East Asian Kirengeshoma (Hydrangeaceae) in relation to quaternary climate change and landbridge configurations. New Phytol. 2009, 183, 480–495. [Google Scholar] [CrossRef]
  60. Yang, Y.; Ma, T.; Wang, Z.; Lu, Z.; Li, Y.; Fu, C.; Chen, X.; Zhao, M.; Olson, M.S.; Liu, J. Genomic effects of population collapse in a critically endangered ironwood tree Ostrya rehderiana. Nat. Commun. 2018, 9, 5449. [Google Scholar] [CrossRef]
  61. Li, E.-X.; Yi, S.; Qiu, Y.-X.; Guo, J.-T.; Comes, H.P.; Fu, C.-X. Phylogeography of two East Asian species in Croomia (Stemonaceae) inferred from chloroplast DNA and ISSR fingerprinting variation. Mol. Phylogen. Evol. 2008, 49, 702–714. [Google Scholar] [CrossRef]
  62. Chen, Y.; Ma, T.; Zhang, L.; Kang, M.; Zhang, Z.; Zheng, Z.; Sun, P.; Shrestha, N.; Liu, J.; Yang, Y. Genomic analyses of a “living fossil”: The endangered dove-tree. Mol. Ecol. Resour. 2020, 20, 756–769. [Google Scholar] [CrossRef]
  63. Sakaguchi, S.; Qiu, Y.-X.; Liu, Y.-H.; Qi, X.-S.; Kim, S.-H.; Han, J.; Takeuchi, Y.; Worth, J.R.P.; Yamasaki, M.; Sakurai, S.; et al. Climate oscillation during the Quaternary associated with landscape heterogeneity promoted allopatric lineage divergence of a temperate tree Kalopanax septemlobus (Araliaceae) in East Asia. Mol. Ecol. 2012, 21, 3823–3838. [Google Scholar] [CrossRef]
  64. Tsukada, M. Altitudinal and latitudinal migration of Cryptomeria japonica for the past 20,000 years in Japan. Quatern. Res. 1986, 26, 135–152. [Google Scholar] [CrossRef]
  65. Gong, W.; Chen, C.; Dobeš, C.; Fu, C.-X.; Koch, M.A. Phylogeography of a living fossil: Pleistocene glaciations forced Ginkgo biloba L. (Ginkgoaceae) into two refuge areas in China with limited subsequent postglacial expansion. Mol. Phylogenetics Evol. 2008, 48, 1094–1105. [Google Scholar] [CrossRef]
  66. Shen, Y.; Cheng, Y.; Li, K.; Li, H. Integrating Phylogeographic Analysis and Geospatial Methods to Infer Historical Dispersal Routes and Glacial Refugia of Liriodendron chinense. Forests 2019, 10, 565. [Google Scholar] [CrossRef] [Green Version]
  67. Zhang, X.-W.; Li, Y.; Zhang, Q.; Fang, Y.-M. Ancient east-west divergence, recent admixture, and multiple marginal refugia shape genetic structure of a widespread oak species (Quercus acutissima) in China. Tree Genet. Genom. 2018, 14, 88. [Google Scholar] [CrossRef]
  68. Zhang, P.; Shao, G.; Zhao, G.; Le Master, D.C.; Parker, G.R.; Dunning, J.B.; Li, Q. China’s forest policy for the 21st century. Science 2000, 288, 2135–2136. [Google Scholar] [CrossRef] [Green Version]
  69. Wu, C.; Jiang, B.; Yuan, W.; Shen, A.; Yang, S.; Yao, S.; Liu, J. On the Management of Large-Diameter Trees in China’s Forests. Forests 2020, 11, 111. [Google Scholar] [CrossRef] [Green Version]
  70. Wu, C.; Mo, Q.; Wang, H.; Zhang, Z.; Huang, G.; Ye, Q.; Zou, Q.; Kong, F.; Liu, Y.; Wang, G.G. Moso bamboo (Phyllostachys edulis (Carriere) J. Houzeau) invasion affects soil phosphorus dynamics in adjacent coniferous forests in subtropical China. Ann. For. Sci. 2018, 75, 24. [Google Scholar] [CrossRef] [Green Version]
Figure 1. Sampling locations of seven populations of C. japonica var. chinensis in China and six populations of C. japonica in Japan.
Forests 11 01192 g001
Figure 2. Population genetic structure of seven populations of C. japonica var. sinensis by STRUCTURE.
Forests 11 01192 g002
Figure 3. Genetic structure of C. japonica var. sinensis based on 922 SNPs. The pie diagrams on the map represents the membership coefficients to the four clusters inferred in Structure software. The neighbor-joining dendrogram based on pairwise FST values with 1000 bootstrap replicates.
Forests 11 01192 g003
Figure 4. Mental test between geographical distance (km) and genetic distance (PhiPTP) for only Chinese populations where suspected Japanese individuals in LS were removed.
Forests 11 01192 g004
Figure 5. Effective population size (Ne) estimated based on folded SFS (Site Frequency Spectrum) with a generation time of (a) 150 years, (b) 200 years, and (c) 300 years, according to the Stairway Plot software. Red and grey lines represent the medians and the 2.5 and 97.5 percentiles, respectively.
Forests 11 01192 g005aForests 11 01192 g005b
Table 1. Geographic locations and sample size (n) of the seven Chinese Cryptomeria populations.
PopulationsLongitude (E)Latitude (N)Altitude (m)n
Provincelocation
JiangxiLushan (LS)115.580129.3259895 m22
AnhuiHuangshan (WT)118.160029.2743436 m17
FujianTianbaoyan (TBY)117.304425.57561132 m17
Nanping (YTG)118.084826.4418846 m10
Wuyishan (WYS)117.413627.4535892 m18
ZhejiangTiantaishan (TT)121.054129.1458897 m17
Tianmushan (XTM)119.260830.20171089 m21
Total 122
Table 2. Genetic diversity indices of the seven populations of C. japonica var. sinensis based on 922 loci.
Pop NNaNeHoHeFArpAr
LSMean161.9391.5320.3070.3160.023 *1.770.03
SE 0.0080.0110.0060.0050.009
WTMean111.5501.3090.1870.1740.023 *1.420.00
SE 0.0160.0130.0090.0070.015
TBYMean151.9001.4580.2860.277−0.0231.700.01
SE 0.0100.0110.0060.0050.009
YTGMean81.6141.3510.2390.209−0.123 *1.530.00
SE 0.0160.0120.0080.0060.011
WYSMean111.8711.4660.3060.279−0.087 *1.710.00
SE 0.0110.0110.0070.0060.009
TTMean171.8381.4290.2660.257−0.0331.640.01
SE 0.0120.0110.0070.0060.08
XTMMean151.8071.4270.2790.257−0.082 *1.640.01
SE 0.0130.0110.0070.0060.007
TotalMean13.31.7891.4240.2670.253−0.0421.630.0086
SE 0.0050.0040.0030.0020.004
N: sample size; Na: No. alleles; Ne: No. effective alleles; Ho: observed Heterozygosity; He: expected Heterozygosity; FIS: Fixation index; Ar: Allelic richness; pAr: private Allelic richness. * Significance (>confidence interval 99%).
Table 3. Analysis of Molecular Variance (AMOVA) for the seven populations of C. japonica var. sinensis.
SourcedfSSMSEst. Var.%
Among Pops64033.190672.19818.88512%
Among Indiv8914,142.633158.90618.55212%
Within Indiv9611,693.000121.802121.80276%
Total19129,868.823 159.239100%
FST0.119
Nm1.858
Table 4. Pairwise Nm (above the diagonal) and pairwise genetic differentiation (FST) (below the diagonal) of the seven populations of C. japonica var. sinensis.
LSWTTBYYTGWYSTTXTM
LS-1.0142.4601.2512.6301.5331.963
WT0.198 ***-1.2960.6961.2930.9951.047
TBY0.092 ***0.162 ***-1.9277.8462.9023.259
YTG0.167 ***0.264 ***0.115 ***-2.2871.2821.490
WYS0.087 ***0.162 ***0.031 **0.099 ***-2.7804.953
TT0.140 ***0.201 ***0.079 ***0.163 ***0.083 ***-4.788
XTM0.113 ***0.193 ***0.071 ***0.144 ***0.048 **0.050 ***-
Significance levels: ** p < 0.01, *** p < 0.001.
Publisher’s Note: MDPI stays neutral with regard to jurisdictional claims in published maps and institutional affiliations.

