Using Continuous Forest Inventory Data for Control of Wood Production and Use in Large Areas: A Case Study in Lithuania

Abstract
:1. Introduction
- -
- validate the accuracy of information received through SFI;
- -
- evaluate the ratio between the main parts of GAI, as well as its accumulation and use in the country’s forests in order to minimize natural losses; and
- -
- identify the correspondence between potential forest productivity and wood-use intensity.
2. Materials and Methods
3. Results
3.1. Validation of SFI-Assessed Forest Statistics
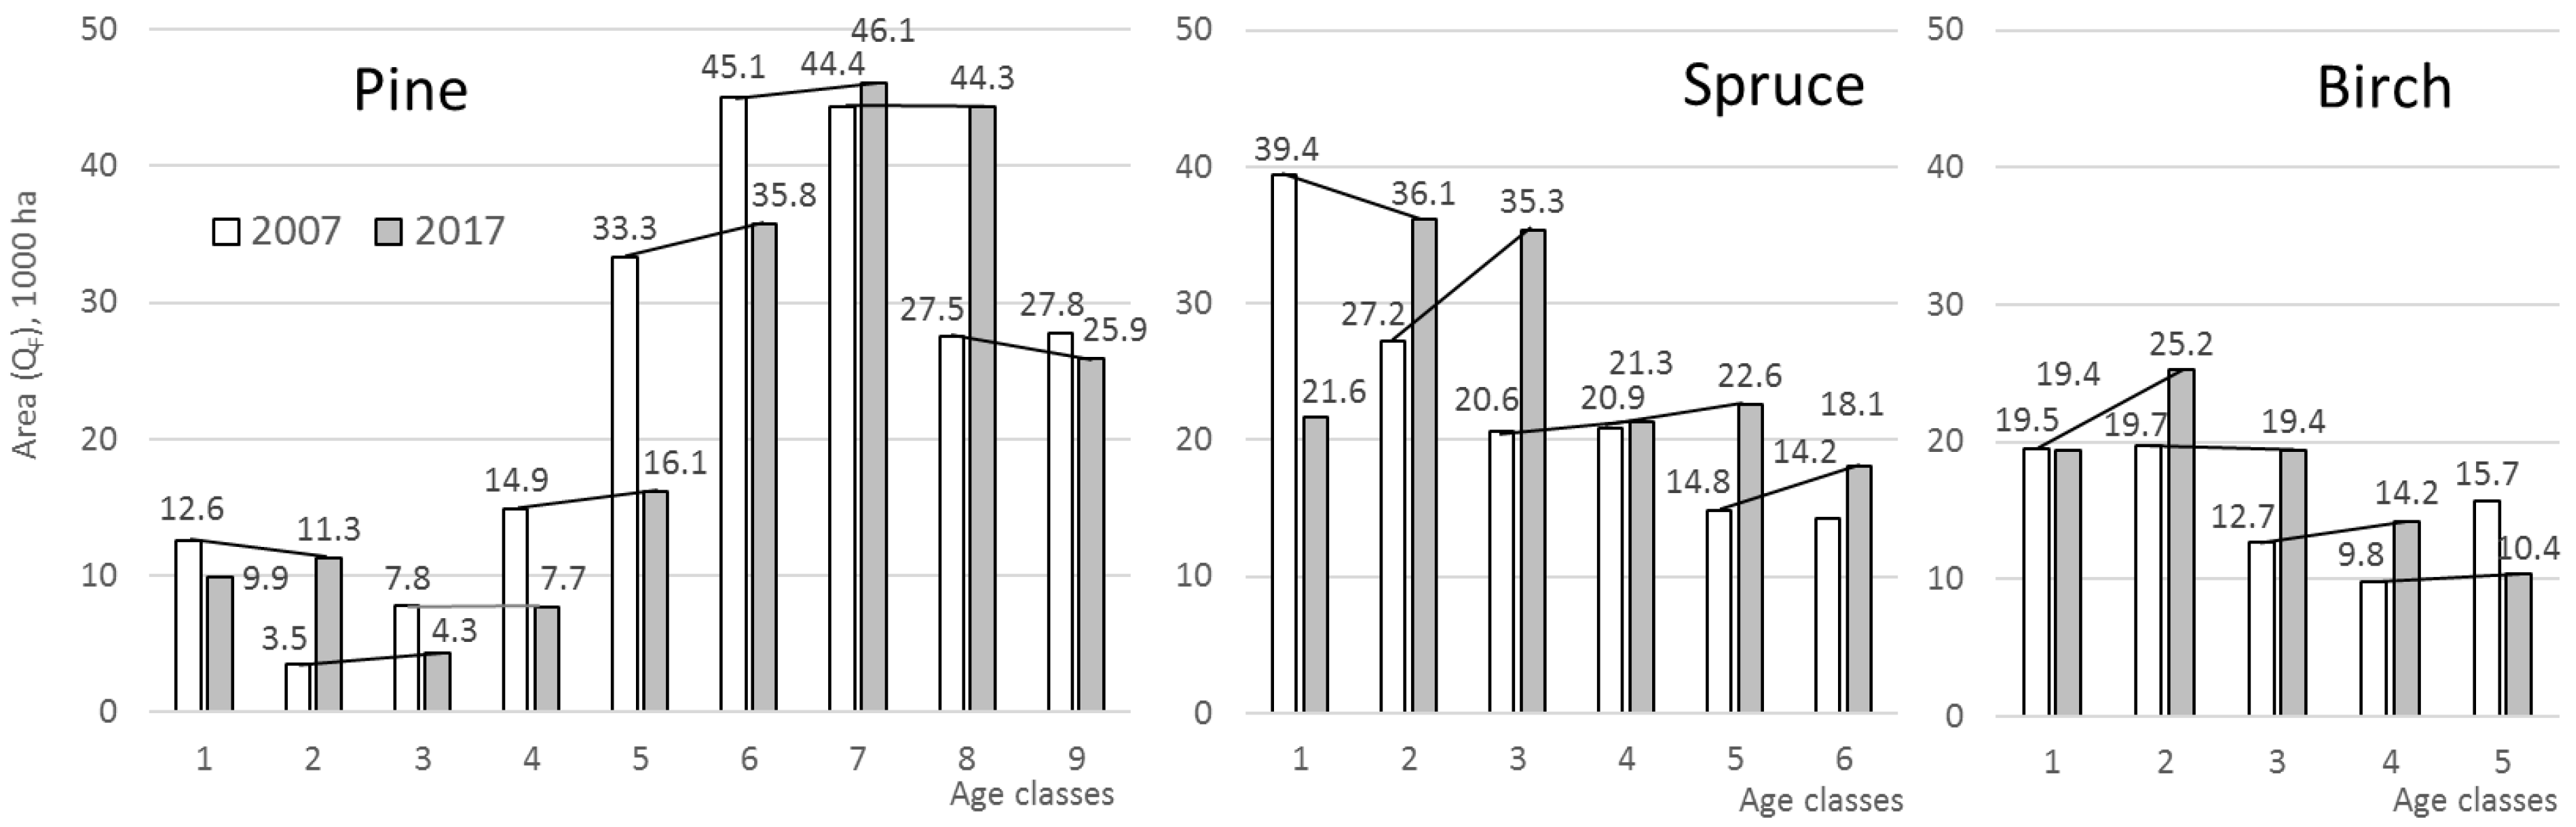
3.1.1. Forest Area
3.1.2. Growing Stock Volume
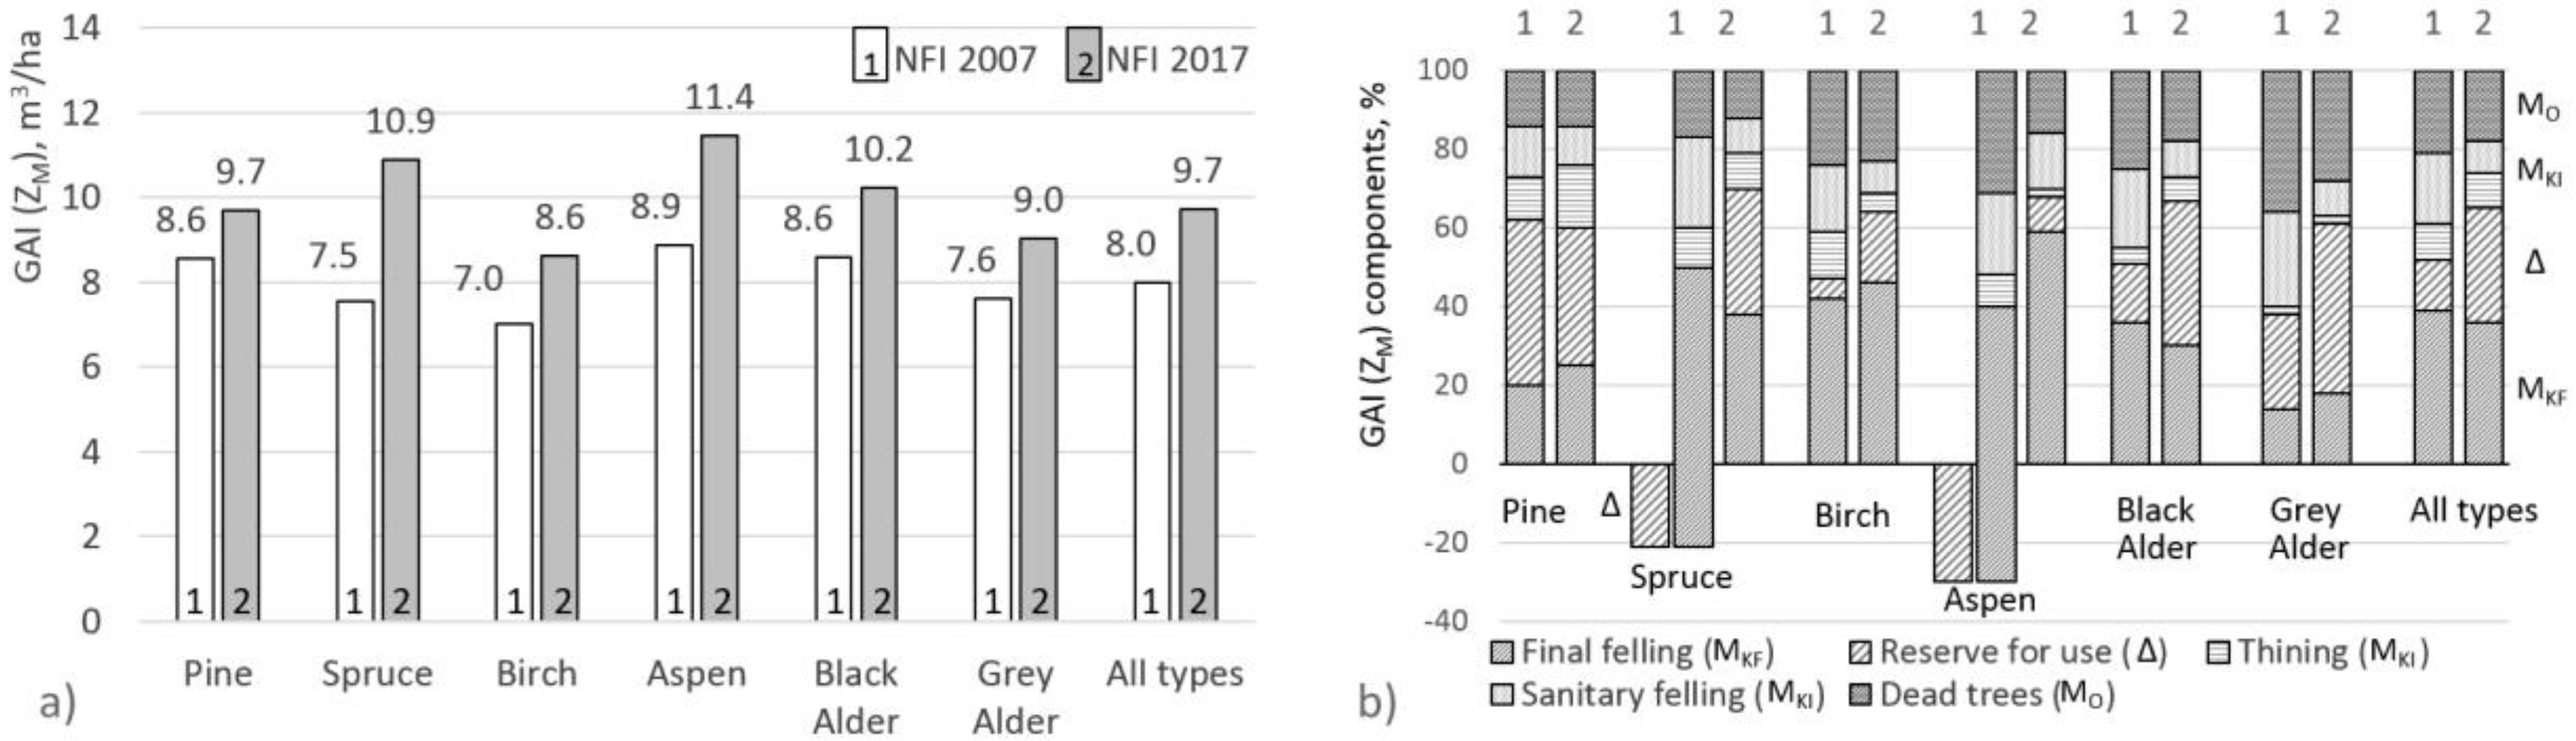
3.2. GAI, Its Components, and Development
Growth Intensity and GAI Structure
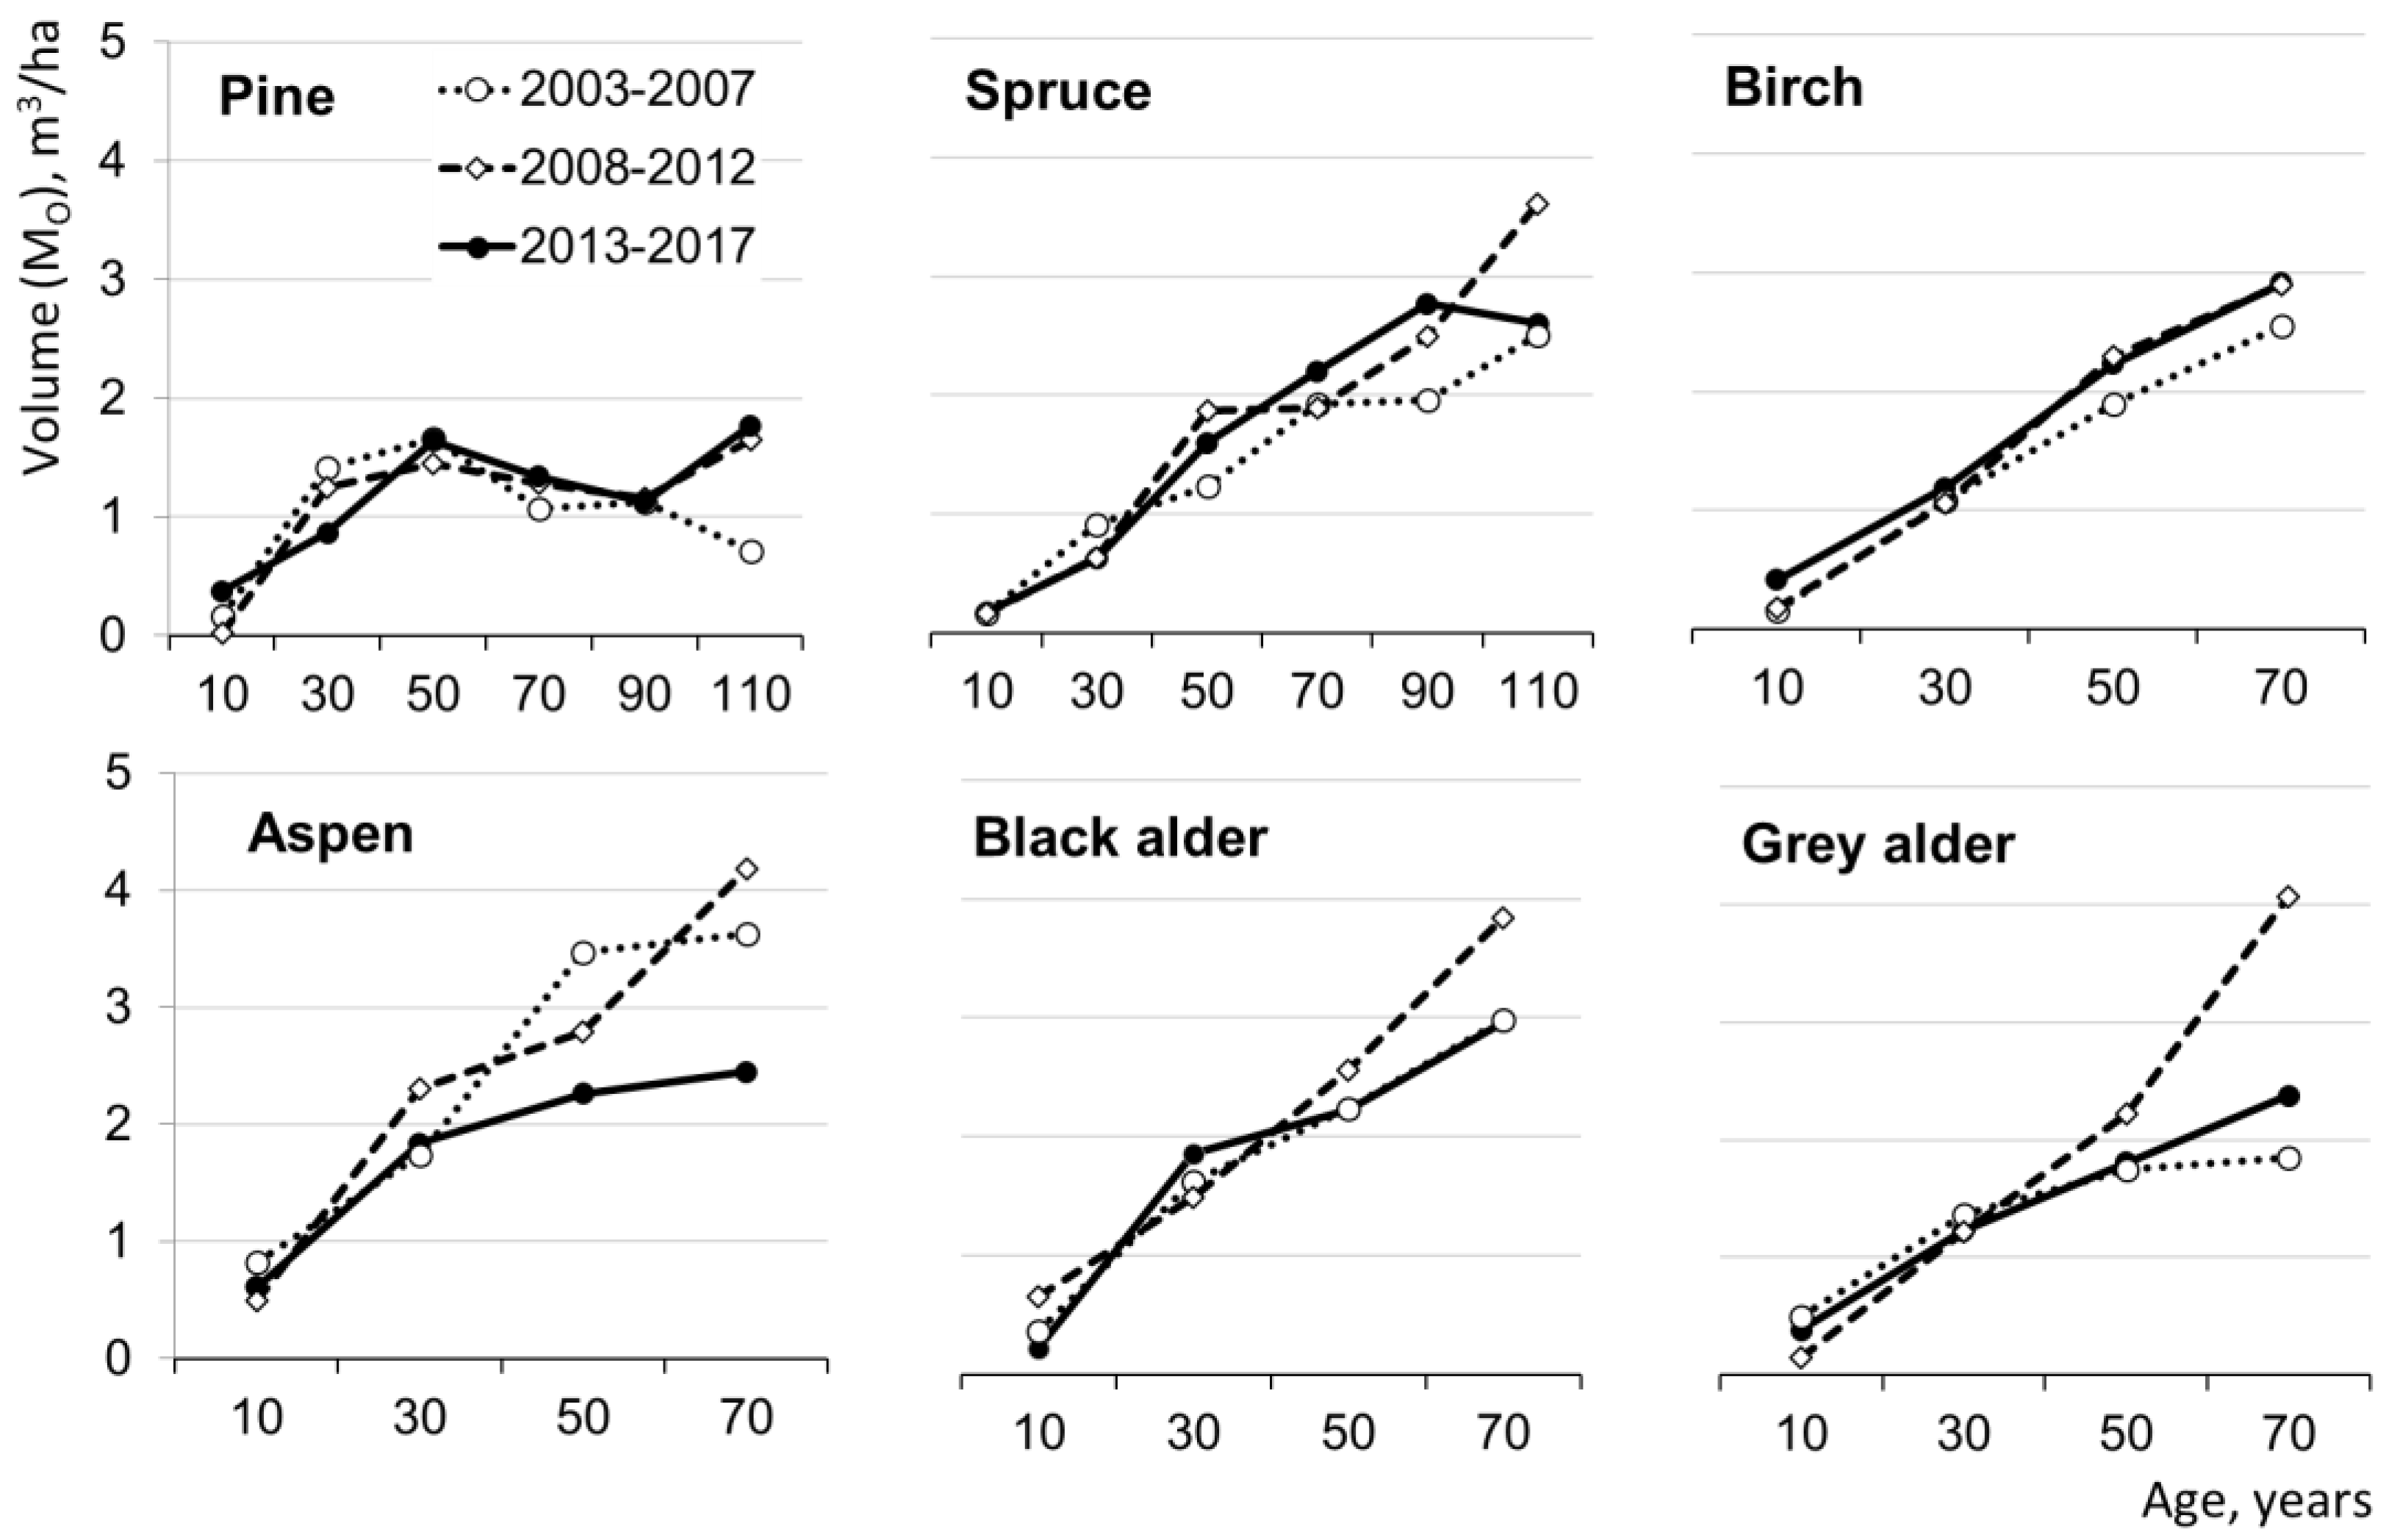
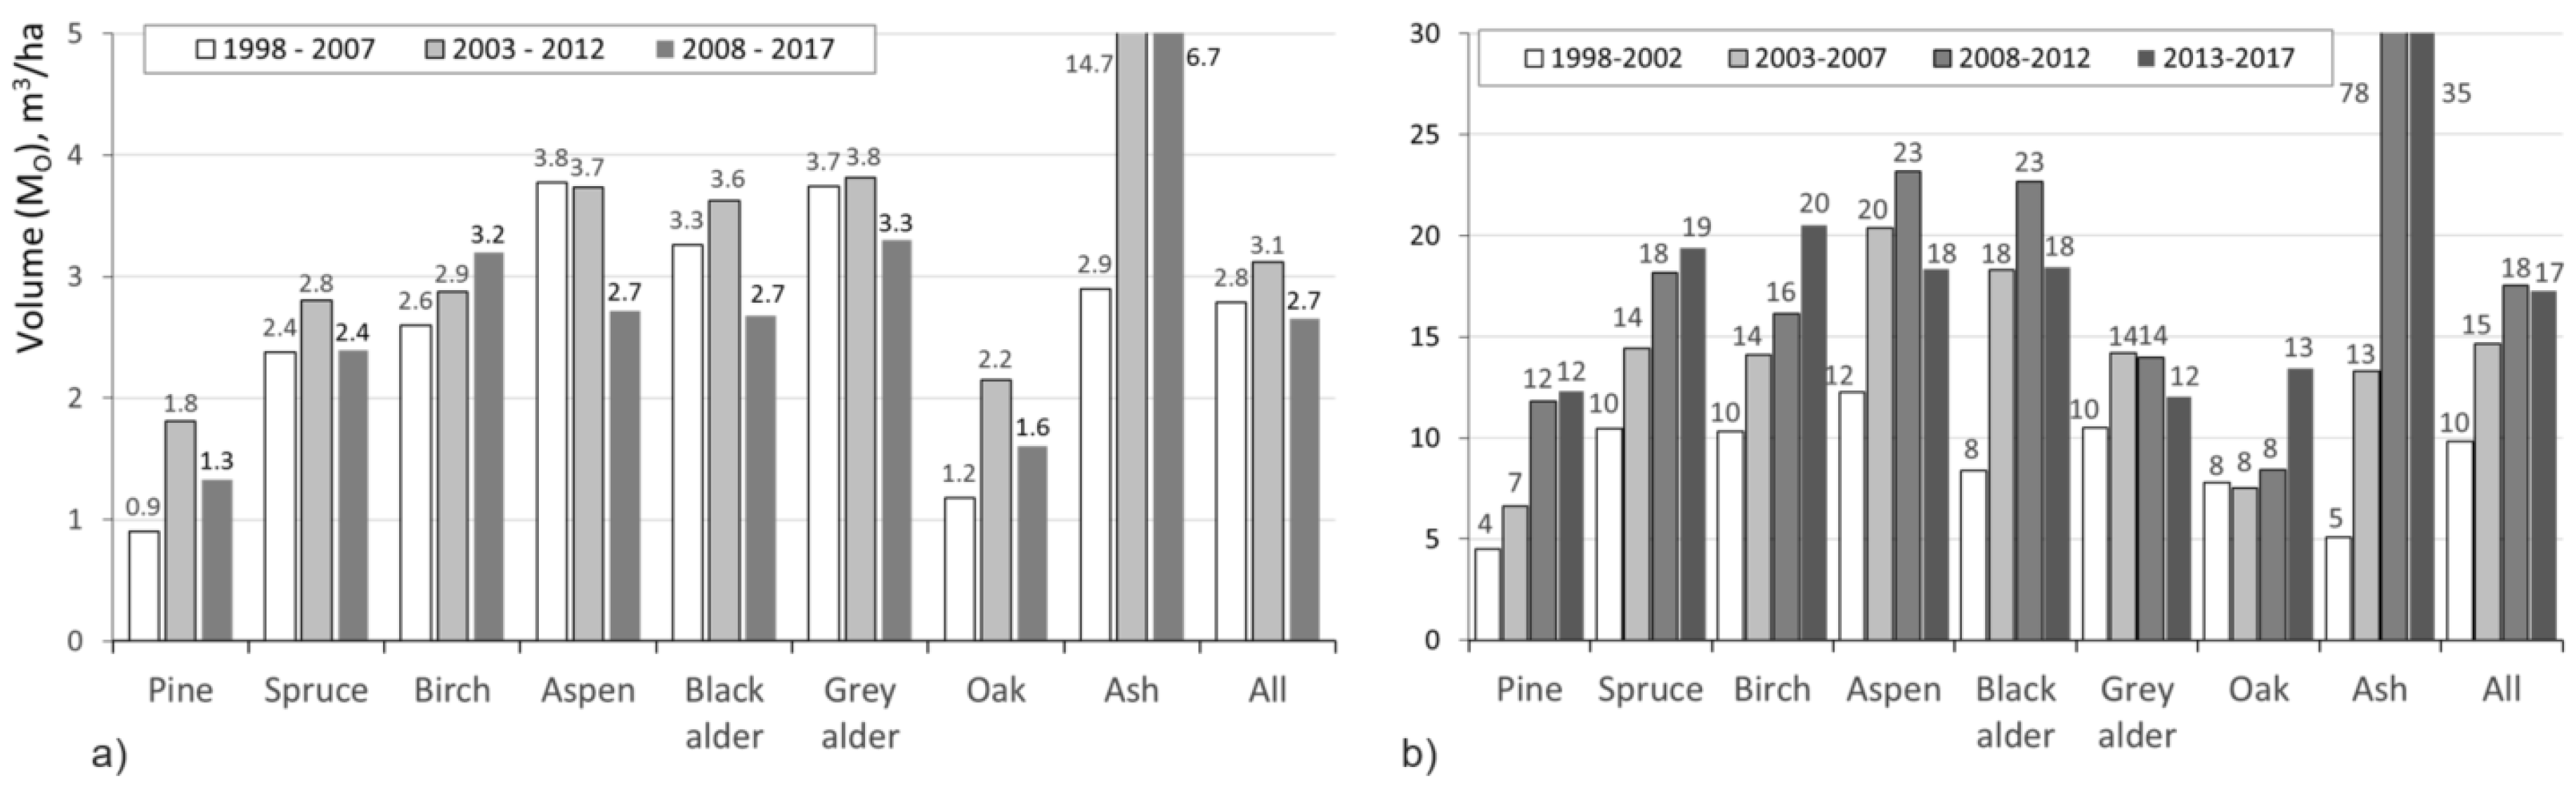
3.3. Results of Natural Self-Thinning in Lithuanian Forest Stands in 2003–2017
3.4. Wood-Use Planning on the Basis of the GAI Parameters Analysis
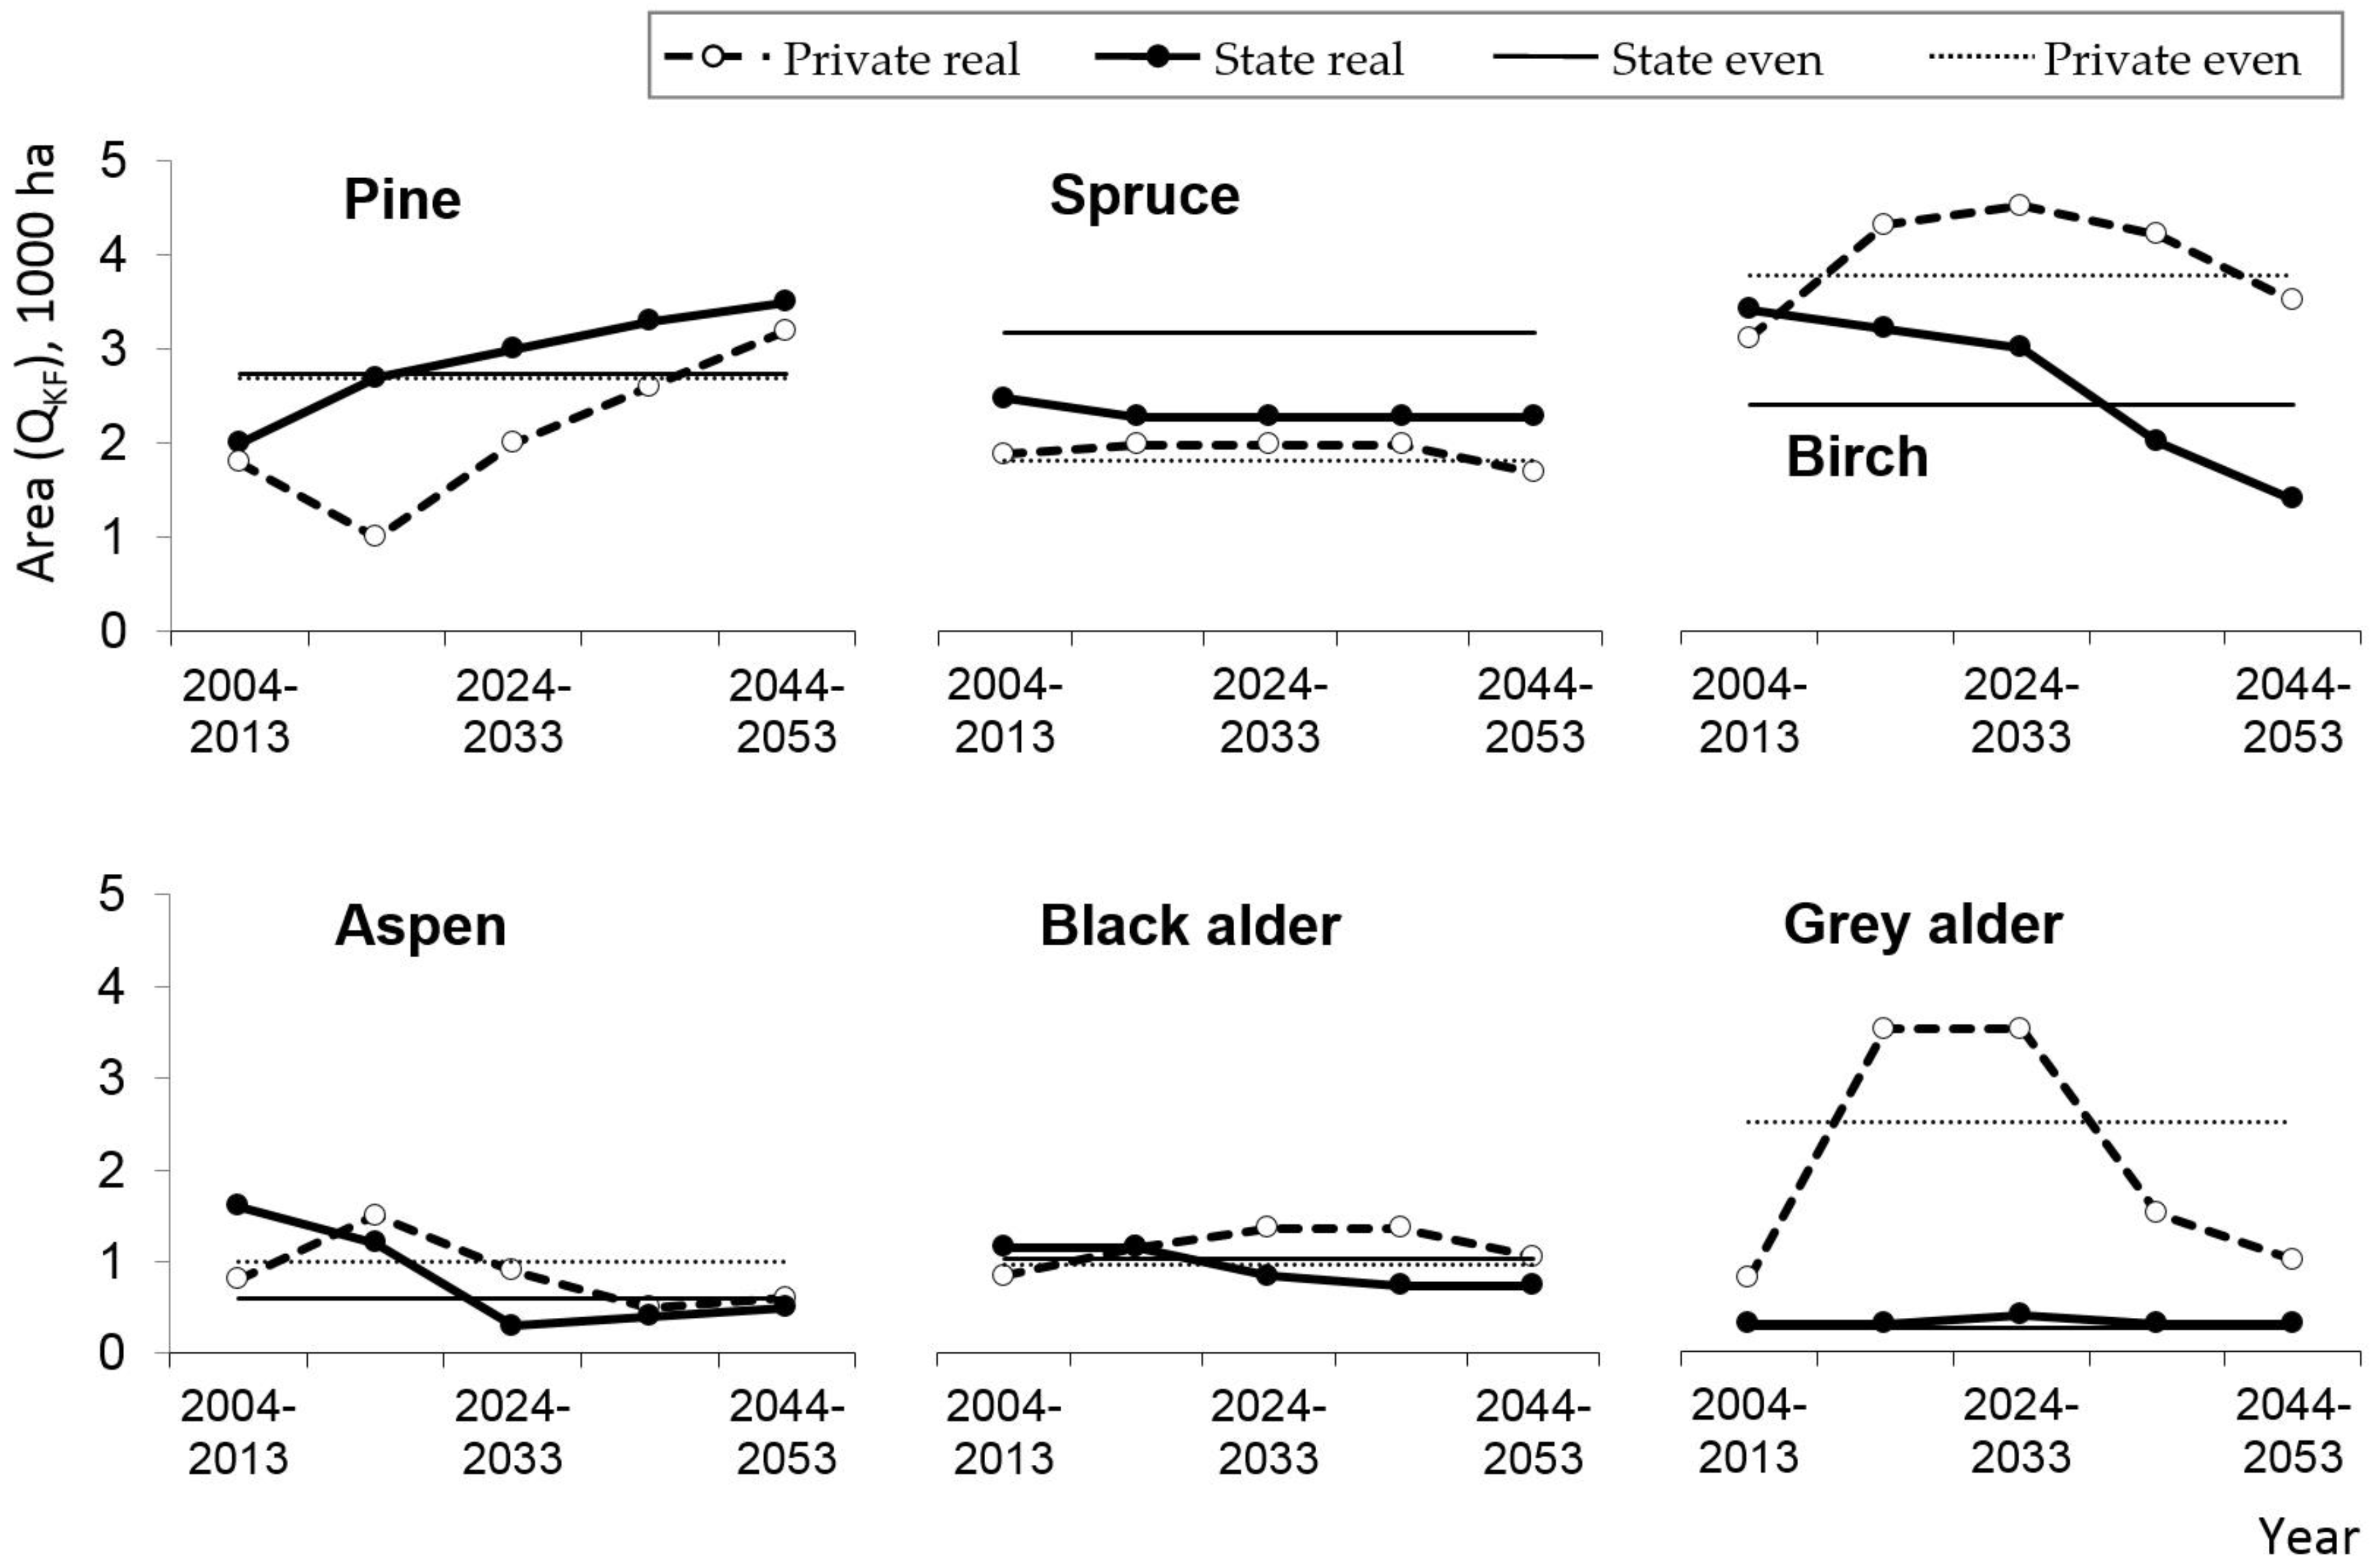
3.4.1. Area of Final Wood Use
3.4.2. Estimation of Intermediate and Final Use Wood Volume
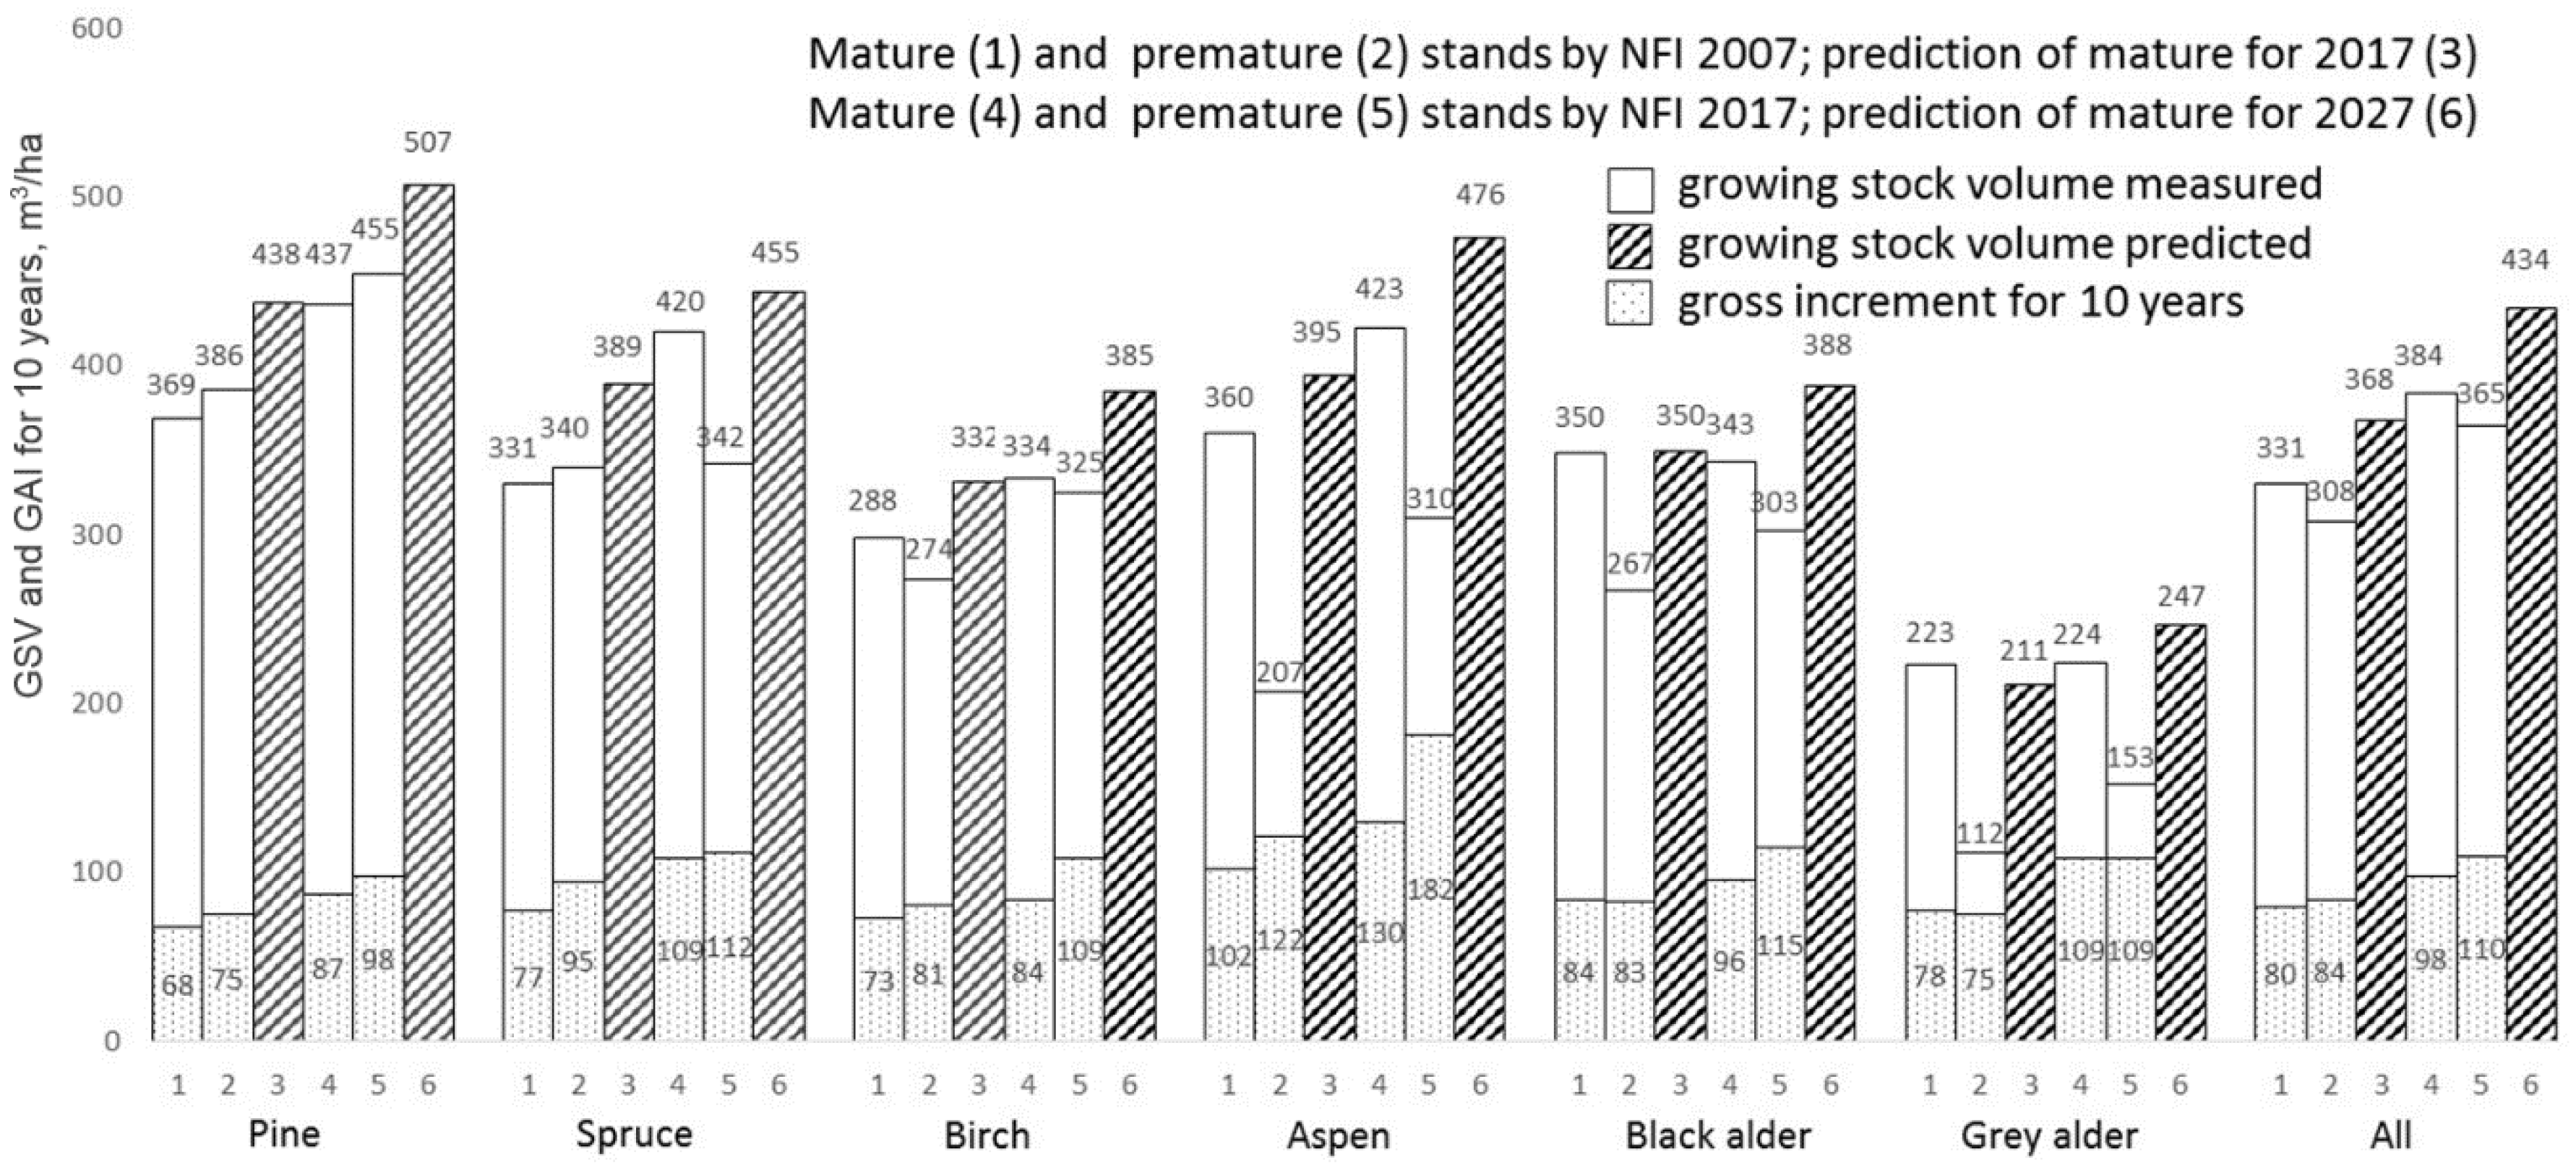
3.5. Prediction of GSV of Mature Stands
3.6. The Key Factors Predetermining Wood-Use Volume
4. Discussion
- (i)
- by the share of felled living versus dead tree stem volume in GAI,
- (ii)
- by the share of natural losses in GAI,
- (iii)
- by the share of intermediate use (tending + thinning versus sanitary felling) in total use of living trees, and
- (iv)
- by GSV at maturity age and output of commercial wood during harvesting.
5. Conclusions
- (1)
- SFI, due to a 10-year remeasurement period, cannot respond to forest area changes as adequately and objectively as it does to NFI. Species composition by SFI is subjectively shifted to more valuable coniferous and hardwood broadleaved species.
- (2)
- SFI underestimates mean GSV by 7–14% on average, and by 13–17% in mature stands, compared with NFI estimations. Deviations decreased by 4–7 pp on average over 15 years as a result of more careful training and improvement of SFI by surveyors taking the results of the NFI data analysis into account.
- (3)
- Permanent NFI plots create the possibility of monitoring the growth of trees from their germination until their death. These features distinguish the NFI as the comprehensive tool for data received from various other inventories.
- (4)
- The productivity of Lithuanian forests from 1998 to 2017 increased from 8.0 to 9.7 m3/ha; 54–67% of GAI was removed by final and intermediate felling, 12–29% of GAI contains reserve for future use, and 17–21% of GAI is comprised of natural losses. GSV of mature stands from 2008 to 2017 increased by 53 m3/ha; the GSV of mature stands is predicted to increase by 50 m3/ha over the next decade.
- (5)
- The most important reasons for the significant increase in natural losses are as follows: (a) low-intensity tending and thinning in the past and present (9% of GAI in all forests, and 11% in state forests), predetermining insufficient resistance of mature stands with the annual loss of trees reaching 3–5 m3/ha, and (b) growing of stands, especially softwood broadleaves, 20–40 years longer than the optimum cutting age.
- (6)
- To increase the efficiency of forest management, reduce natural losses, and augment the usable part of the yield, it is necessary to intensify intermediate felling by removing 25–35% of the GAI until the final felling age, and to reduce areas of overmature stands that are not resistant to adverse natural factors.
- (7)
- Continuous monitoring of forest stand yield using NFI data, the timely disclosure of factors negatively affecting both yield and its accumulation, and regulation of these processes by forest management measures revealed potential ways to increase forest use in Lithuanian FAWS, as compared to predictions and calculations based on the recent past.
Author Contributions
Funding
Acknowledgments
Conflicts of Interest
References
- Gurnaud, A. Cahier D’aménagement Pour L’application De La Méthode Par Contenance; Exposé Sur La Forêt Des; Eperons: Paris, France, 1878; p. 160. [Google Scholar]
- Tiurmer, K.F. Fifty years of forestry practice. In Piatdesiat Let Lesoxoziaistvennoj Praktiki; Knižnij magazine I. Deibnera: Moskva, Russia, 1891; p. 183. (In Russian) [Google Scholar]
- Biolley, H.E. L’aménagement des Forêts par la Méthode Expérimentale et Spécialement la Méthode du Contrôle. AVEC und Lettre-préface de Roger Ducamp; Attinger Frères: Paris, France, 1921; p. 90. [Google Scholar] [CrossRef] [Green Version]
- Tomter, S.M.; Kuliešis, A.; Gschwantner, T. Annual volume increment of the European forests–description and evaluation of methods used. Ann. For. Sci. 2016, 73, 849–856. [Google Scholar] [CrossRef] [Green Version]
- Klein, D.; Hollerl, S.; Blashke, M.; Schulz, C. The contribution of managed and unmanaged forests to climate change mitigation—A model approach at stand level for the main tree species in Bavaria. Forests 2013, 4, 43–69. [Google Scholar] [CrossRef]
- Leskinen, P.; Cardellini, G.; Gonzalez-Garcia, S.; Hurmekoski, E.; Sathre, R.; Seppala, J.; Smyth, C.; Stern, T.; Verkerk, P.J. Substitution Effects of Wood-Based Products in Climate Change Mitigation: From Science to Policy 7; European Forest Institute: Joensuu, Finland, 2018; p. 28. ISBN 978-952-5980-70-7. [Google Scholar]
- Kallio, A.M.I.; Solberg, B. On the reliability on international forest sector statistics: Problems and needs for improvements. Forests 2018, 9, 407. [Google Scholar] [CrossRef] [Green Version]
- Vidal, C.; Alberdi, I.; Hernandez, L.; Redmond, J. National Forest Inventories—Assessment of Wood Availability and Use; Springer International Publishing: Cugas, Switzerland, 2016; p. 842. ISBN 978-3-319-44015-6. [Google Scholar]
- Kenstavičius, J. Miškų resursai, jų paruošos, poreikiai ir būklės gerinimo problemos. In Forest Resources, Their Use, Demands and Problems of State Improvement; Lietuvos Miškų Ūkio Mokslinio Tyrimo Institutas: Kaunas, Lithuania, 1989; p. 89. (In Lithuanian) [Google Scholar]
- Kenstavičius, J.; Brukas, A. Lietuvos miškų pakartotino tvarkymo augimviečių pagrindu rezultatai ir naudojimo perspektyvos. In The Results of Successive Forest Inventory and Forest Management Planning on the Site Type Base and Forest Use Predictions; Miško projektas: Kaunas, Lithuania, 1993; p. 527. (In Lithuanian) [Google Scholar]
- Kuliešis, A.; Kulbokas, G.; Vižlenskas, D.; Butkus, A. Tarpinis miško naudojimas. Dabartis ir perspektyvos. Intermediate wood use. Current situation and future. Mūsų Girios 2011, 2, 6–7; 3, 8–9. (In Lithuanian) [Google Scholar]
- Kuliešis, A.; Kasperavičius, A.; Kulbokas, G.; Vižlenskas, D. Brandūs medynai ir jų naudojimas valstybiniuose miškuose. Forest stands at maturity age and their use. Mūsų Girios 2016, 6, 14–17. (In Lithuanian) [Google Scholar]
- Synek, M.; Hrib, M. Analysing data sources’ suitability to support forest policy decision making in the Czech Republik. Int. For. Rev. 2019, 21, 92–107. [Google Scholar] [CrossRef]
- Nabuurs, G.J.; Paivinen, R.; Pussinen, A.; Schelhaas, M.J. Development of European forests until 2050: A projection of forest resources and forest management in thirty countries. In European Forest Institute Research Report, 15th ed.; Brill: Leiden, The Netherlands, 2003; p. 242. ISSN 1238-8785. [Google Scholar]
- Nabuurs, G.J.; Schelhaas, M.J.; Ouwehand, A.; Van Brusselen, J.; Pesonen, E.; Schuck, A.; Jans, M.F.F.W.; Kuiper, L. Future Wood Supply from European Forests. Implication for the Pulp and Paper Industry; Research Report; Alterra: Wageningen, The Netherlands, 2003; p. 145. Available online: https://library.wur.nl/WebQuery/groenekennis/1717103 (accessed on 20 July 2020).
- Kuliešis, A.; Kulbokas, G.; Kasperavičius, A.; Kuliešis, A.A. Miškų inventorizacijos sistema ir jos tobulinimas pagal intensyvios miškininkystės reikmes. Forest inventory system and its development according to demands of high intensity forestry. Miškininkystė 2010, 2, 61–77. (In Lithuanian) [Google Scholar]
- Kuliešis, A.; Kasperavičius, A.; Kulbokas, G. Lithuania. In National Forest Inventories—Pathways for Common Reporting; Tomppo, E., Gschwantner, T., Lawrence, M., McRoberts, R.E., Eds.; Springer: New York, NY, USA, 2010; pp. 351–374. ISBN 978-90-481-3233-1. [Google Scholar]
- Kuliešis, A.; Kasperavičius, A.; Kulbokas, G. Lithuania. In National Forest Inventories—Assessment of Wood Availability and Use; Vidal, C., Alberdi, I., Hernandez, L., Redmond, J., Eds.; Springer: New York, NY, USA, 2016; pp. 521–547. [Google Scholar] [CrossRef]
- Talarczyk, A. National Forest Inventory in Poland. Balt. For. 2014, 20, 333–341. [Google Scholar]
- Kuliešis, A.; Tomter, S.M.; Vidal, C.; Lanz, A. Estimates of stem wood increments in forest resources: Comparison of different approaches in forest inventory: Consequences for international reporting: Case study of European forests. Ann. For. Sci. 2016, 73, 857–869. [Google Scholar] [CrossRef] [Green Version]
- Brukas, A.; Jakubonis, S.; Kuliešis, A.; Rutkauskas, A. Lietuvos Miškotvarka ir Jos Raida (Forest Management Planning and Its Development in Lithuania); Naujasis lankas: Kaunas, Lithuania, 2002; p. 188. (In Lithuanian) [Google Scholar]
- Brukas, V.; Kuliešis, A.; Sallnas, O.; Linkevicius, E. Resource availability, planning rigidity and Realpolitik in Lithuanian forest utilization. Nat. Resour. Forum 2011, 35, 77–88. [Google Scholar] [CrossRef]
- Tomppo, E.; Gschwantner, T.; Lawrence, M.; McRoberts, R.E. National Forest Inventories: Pathways for Common Reporting; Springer: Dordrecht, The Netherlands, 2010; p. 537. [Google Scholar] [CrossRef]
- UNECE/FAO. The European Forest Sector Outlook Study II 2010–2030; Publishing Service, United Nations: Geneva, Switzerland, 2011; p. 107. Available online: https://www.unece.org/fileadmin/DAM/timber/publications/sp-28.pdf (accessed on 31 July 2020).
- UNECE/FAO. Forest resources of Europe, CIS, North America, Australia, Japan and New Zealand. In Global Forest Resources Assessment 2000; Main Report; United Nations Publication: New York, NY, USA; Geneva, Switzerland, 2000; p. 467. ISBN 92-1-116735-3. [Google Scholar]
- U.S. Department of Agriculture, Forest Service. U.S. Forest Resource Facts and Historical Trends; USDA Forest Service, National Office: Washington, DC, USA, 2014; p. 61. Available online: https://www.srs.fs.usda.gov/products/marketing/cards/fs-1035.pdf (accessed on 31 July 2020).
- Department of Agriculture, Food and Marine. Ireland’s National Forest Inventory 2017. Results. Government of Ireland. 2018; p. 236. Available online: https://www.agriculture.gov.ie/media/migration/forestry/nationalforestinventory/nationalforestinventoryresultsdata/2018/Results311018.pdf (accessed on 4 August 2020).
- Kuliešis, A. Medynų Našumas ir jo Panaudojimas. Forest Stand Yield and Use; Agroleidykla: Vilnius, Lithuania, 1989; p. 141. (In Lithuanian) [Google Scholar]
- Kuliešis, A. Forest Yield Models and Tables in Lithuania; Girios Aidas: Kaunas, Lithuania, 1993; p. 384, (In Lithuanian and English). [Google Scholar]
- Kuliešis, A.; Saladis, J.; Kuliešis, A.A. Development and productivity of young Scotch pine stands by regulating density. Balt. For. 2010, 16, 235–246. Available online: https://www.balticforestry.mi.lt/bf/PDF_Articles/2010-16[2]/Kuliesis_2010%2016(2)_235_246.pdf (accessed on 4 August 2020).
- Oliver, C.D.; Larson, B.C. Forest Stand Dynamics; Update Edition; John Wiley & Sons Inc.: Hoboken, NJ, USA, 1996; p. 520. ISBN 0471138339. [Google Scholar]
- Pretzsch, H. Forest Dynamics, Growth, and Yield; Springer: Berlin/Heidelberg, Germany, 2010; p. 664. [Google Scholar] [CrossRef]
- Cochran, W.G. Sampling Techniques, 2nd ed.; John Willey & Sons: New York, NY, USA; London, UK, 1963; p. 413. ISBN 13: 978-0471162384. [Google Scholar]
- Kuliešis, A.; Kasperavičius, A.; Kulbokas, G.; Kvalkauskienė, M. Lietuvos nacionalinė miškų inventorizacija 1998–2002. Atrankos schema, metodai, rezultatai. Lithuanian National Forest Inventory 1998–2002: Sampling Design, Methods, Results; Naujasis lankas: Kaunas, Lithuania, 2003; p. 256. ISBN 9988-03-185-9. (In Lithuanian and English). [Google Scholar]
- Kuliešis, A.; Kasperavičius, A.; Kulbokas, G.; Kvalkauskienė, M. Lithuanian National Forest Inventory 2003–2007. Forest Resources and Their Dynamic; Lututė: Kaunas, Lithuania, 2009; p. 284. ISBN 978-9955-37-075-8. (In Lithuanian) [Google Scholar]
- Deltuvas, R.; Gerold, D. Information on Some Models of [Forest Tree] Cutting Regulation in the Soviet Union. Sozial. Forstwirtsch. 1978, 6, 187–189. Available online: https://agris.fao.org/agris-search/search.do?recordID=US201302113290 (accessed on 8 February 2008). (In German).
- Kuliešis, A.; Kulbokas, G.; Kuliešis, A.A. Medynų tūrio įvertinimo normatyvų harmonizavimas. Harmonisation of models for growing stock volume estimation in different inventories. Miškininkystė 2012, 1, 7–23. (In Lithuanian) [Google Scholar]
- Kuliešis, A.; Petrauskas, E. Lithuanian Forest Resources in XXI Century; Naujasis Lankas: Kaunas, Lithuania, 2000; p. 146. Available online: https://hdl.handle.net/20.500.12259/64075 (accessed on 12 December 2010).
- Karazija, S.; Kuliešis, A.; Vaivada, S. Reasons and regularities of spreading, as well as losses, made by windfall and bark beetle in Lithuanian forests during 1992–1996 damages. Miškininkystė 1996, 2, 66–80. (In Lithuanian) [Google Scholar]
- Petrauskas, E.; Kuliešis, A. Scenario-based analysis of possible management alternatives for Lithuanian forests in the 21st century. Balt. For. 2004, 10, 72–82. [Google Scholar]
- Forest Europe. State of Europe’s Forests 2015. Ministerial Conference on the Protection of Forests in Europe, Forest Europe Liaison Unit Madrid. 2015, p. 312. Available online: https://www.foresteurope.org/docs/fullsoef2015.pdf (accessed on 31 July 2020).


| Years of Establishment and Remeasurement | Forest Ownership | Forest Groups | ||||
|---|---|---|---|---|---|---|
| State | Private | Reserved for Restitution | I–II | III–IV | Total | |
| 1998–2002 | 2549 | 1585 | 1052 | 672 | 4514 | 5186 |
| 2003–2007 | 2581 | 1991 | 713 | 713 | 4572 | 5285 |
| 2008–2012 | 2646 | 2261 | 551 | 731 | 4727 | 5458 |
| 2013–2017 | 2727 | 2422 | 451 | 727 | 4873 | 5600 |
| Forest Type | Forest Area and Their Changes, 1000 ha | ||||||||
|---|---|---|---|---|---|---|---|---|---|
| NFI Data | SFI Data | Deviation SFI 01.01.2018 from NFI 2017 | |||||||
| 2002 | P, % * | 2017 | P, % * | Changes 2017–2002 | 01.01.2003 | 01.01.2018 | Changes 2018–2003 | ||
| Pine | 684 | 2.3 | 680 | 2.3 | −4 | 712 | 712 | 0 | 32 |
| Spruce | 356 | 3.3 | 377 | 3.2 | 21 | 445 | 430 | −15 | 53 |
| Birch | 394 | 3.1 | 432 | 2.9 | 38 | 392 | 454 | 62 | 22 |
| Aspen | 126 | 5.6 | 146 | 5.2 | 20 | 57 | 96 | 39 | −50 |
| Black Alder | 182 | 4.6 | 235 | 4.1 | 53 | 120 | 160 | 40 | −75 |
| Grey Alder | 138 | 5.3 | 136 | 5.4 | −2 | 122 | 122 | 0 | −14 |
| Total | 1880 | 1.2 | 2006 | 1.1 | 126 | 1848 | 1974 | 126 | −32 |
| Inventory (NFI), Assessment (SFI) Year | Invent-ory Object | Inventory Type, Characteris-tics | Species | |||||||||
|---|---|---|---|---|---|---|---|---|---|---|---|---|
| Pine | Spruce | Birch | Aspen | Black Alder | Grey Alder | Oak | Ash | Others | All | |||
| GSV, m3/ha, Accuracy of Estimation (±P, %), Difference of SFI from NFI, % | ||||||||||||
| 2002 | All stands | NFI GSV | 264 | 214 | 200 | 270 | 213 | 153 | 233 | 199 | 152 | 227 |
| ±P, % | 1.3 | 2.5 | 2.1 | 3.4 | 2.9 | 3.3 | 6.0 | 5.5 | 9.6 | 0.9 | ||
| SFI-NFI, % | −12.9 | −10.7 | −16.0 | −20.0 | −9.4 | −18.3 | −18.4 | −17.1 | −13.7 | |||
| Mature stands | NFI GSV | 361 | 332 | 278 | 355 | 318 | 198 | 316 | 291 | 190 | 301 | |
| ±P, % | 4.9 | 3.0 | 2.9 | 2.6 | 5.1 | 3.4 | 15.2 | 13.6 | 1.5 | |||
| SFI-NFI, % | −18.3 | −8.4 | −17.6 | −24.2 | −8.8 | −25.8 | −22.8 | −20.6 | −16.6 | |||
| 2017 | All stands | NFI GSV | 333 | 249 | 203 | 250 | 234 | 172 | 220 | 201 | 184 | 257 |
| ±P, % | 1.3 | 2.4 | 2.3 | 4.1 | 2.9 | 3.3 | 6.7 | 12.5 | 7.7 | 1.0 | ||
| SFI-NFI, % | −9.6 | −8.4 | −6.9 | −13.2 | −3.0 | +9.9 | −15.9 | −15.4 | −6.6 | |||
| Mature stands | NFI GSV | 416 | 386 | 313 | 383 | 342 | 212 | 336 | 224 | 268 | 336 | |
| ±P, % | 3.5 | 3.0 | 2.6 | 3.5 | 4.0 | 3.5 | 12.9 | 26.5 | 1.5 | |||
| SFI-NFI, % | −15.1 | −11.7 | −15.7 | −18.5 | −3.5 | −0.9 | −26.2 | −13.0 | −12.8 | |||
| Forest Ownership | Actual, Equivalent | Even, According to Forest Groups (NFI 2012) and Unregenerated Area by 2014.01.01 | Prospective in Forests of III–IV Groups | ||||
|---|---|---|---|---|---|---|---|
| 2009–2013 | 2014–2018 | II | III–IV | Total | 2013–2022 | 2023–2032 | |
| State | 10.9 * | 11.2 * | 1.2 | 10.7 | 11.9 | 11.5 | 10.0 |
| Private | 9.9 ** | 10.4 *** | 0.8 | 13.9 | 14.7 | 9.8 | 12.0 |
| Reserved | n.d. | n.d. | 2.2 | 2.5 | |||
| Total | 20.8 | 21.6 | 2.0 | 24.6 | 26.6 | 23.5 | 24.5 |
| Prevailing Tree Species | Intermediate Felling (MKI) | Final Felling (MKF) | Total Annually Felled Volume of Stem (MKI + MKF), M m3 | |||||||||||
|---|---|---|---|---|---|---|---|---|---|---|---|---|---|---|
| Tending | Thinning | Sanitary | Total Annually Felled Stem, M m3 | Area, 1000 ha | Volume * of Mature Stands m3/ha | Volume of Stem in Annually Felled Stands M m3 | ||||||||
| Area of Stands at Tending Age, 1000 ha | Increment m3/ha | Stem Wood for Tending, M m3 | Area of Stands at Thinning Age, 1000 ha | Increment, m3/ha | Stem Wood for Thinning M m3 | Area of Stands at Sanitary Cutting Age, 1000 ha | Increment, m3/ha | Stem Wood for Sanitary Cutting, M m3 | ||||||
| Con ** | 83.5 | 2.7 | 0.07 | 275.1 | 9.8 | 0.75 | 106.2 | 8.8 | 0.24 | 1.06 | 5.0 | 380.5 | 1.90 | 2.96 |
| Soft ** | 80.8 | 3.8 | 0.09 | 71.3 | 9.6 | 0.19 | 122.1 | 9.2 | 0.28 | 0.56 | 5.8 | 322.5 | 1.87 | 2.43 |
| Other ** | 8.9 | 3.2 | 0.01 | 25.8 | 6.3 | 0.05 | 7.4 | 7.9 | 0.01 | 0.07 | 0.2 | 301.5 | 0.06 | 0.13 |
| Total | 173.2 | 3.4 | 0.17 | 372.2 | 9.6 | 0.99 | 235.7 | 9.0 | 0.53 | 1.69 | 11.0 | 341.5 | 3.83 | 5.52 |
| Forest Type | Area, M ha | SI HAB, m | Parameters of Thinning | Rotation, Years | Productivity and Its Components, | ||||||||||||||
|---|---|---|---|---|---|---|---|---|---|---|---|---|---|---|---|---|---|---|---|
| INITIAL | Number of Thinning | Duration between Thinning, Years | Yield Model Results | NFI 2007–2017 | |||||||||||||||
| Age | Stocking Level | Accumulated (MKF) | Thinning (MKI) | Mortality (MO) | Total (∑ZMA) | Annual | Accumulated Volume of Mature Stands | Even Gross Increment | |||||||||||
| Total | Annual | Total | From Them Sanitary | Annual | Total | Annual | 2007 | 2017 | |||||||||||
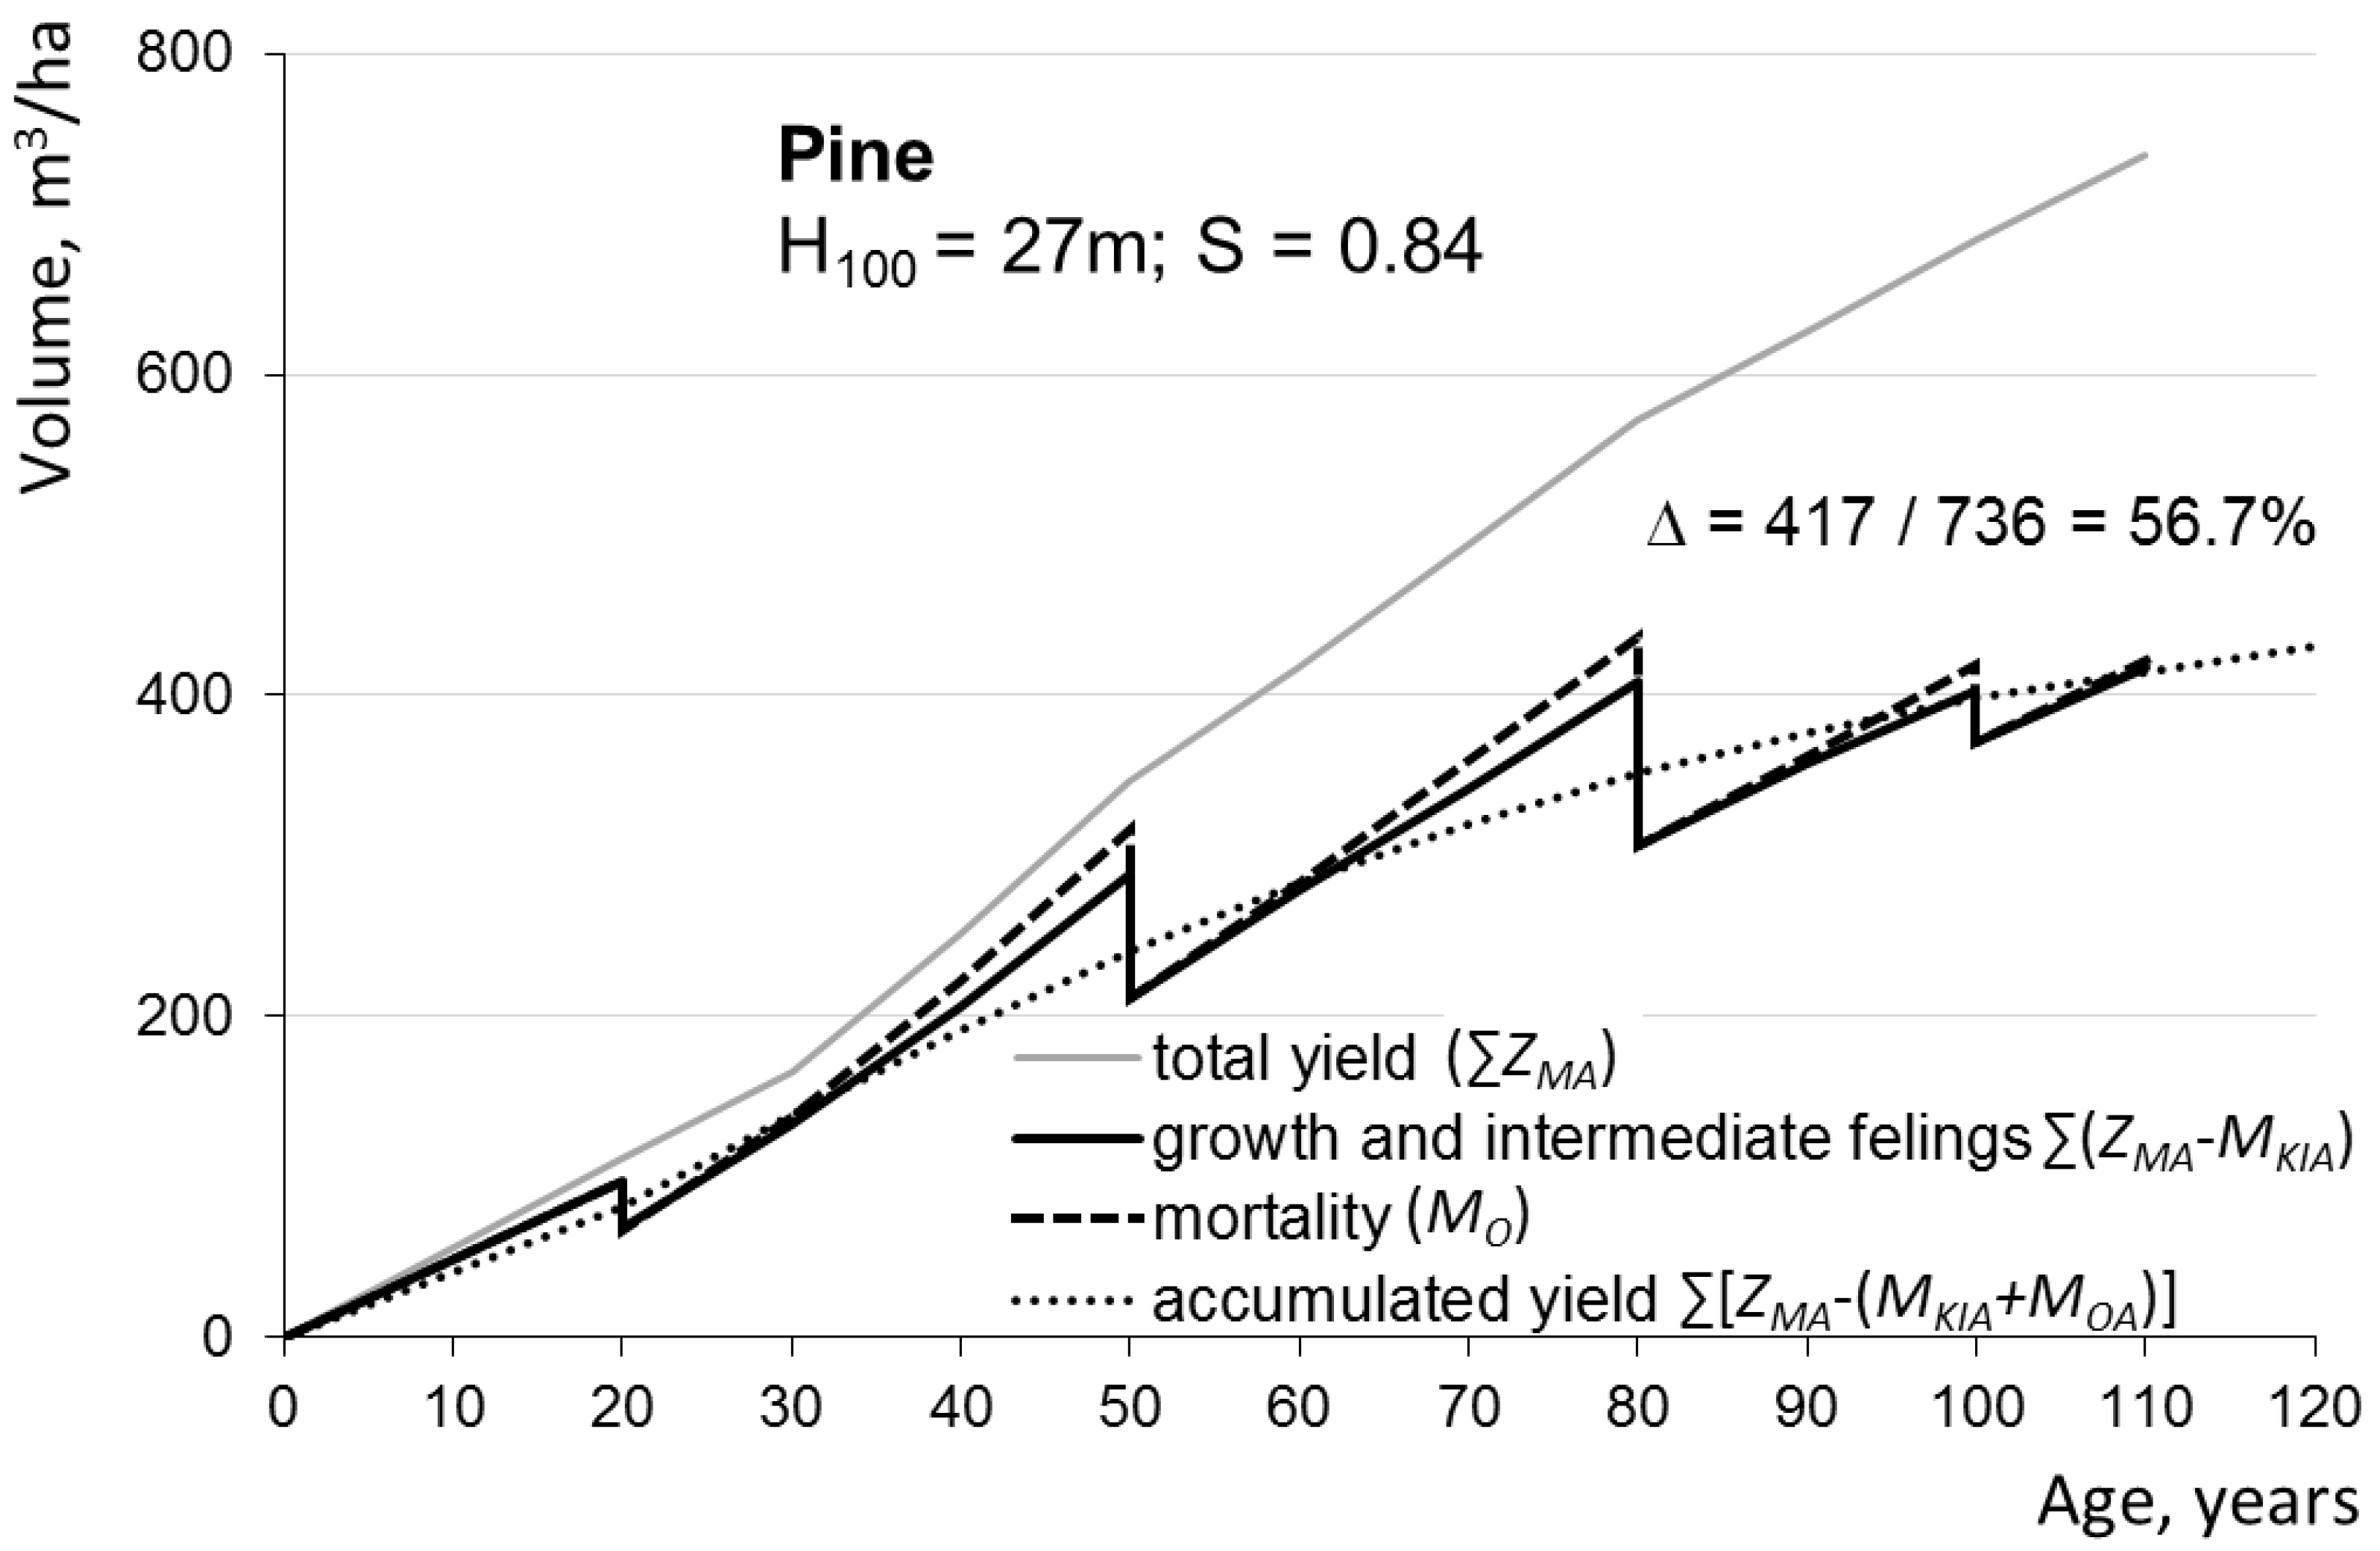
| Pine | 0.28 | 27 | 20 | 1.0 | 3 + 1 * | 30 | 110 | 417 | 3.8 | 242 | 32 | 2.2 | 77 | 0.7 | 736 | 6.7 | 397 | 7.4 | 8.6 |
| 57 | 33 | 4 | 10 | 100 | |||||||||||||||
| Spruce | 0.19 | 28 | 20 | 0.9 | 3 + 1 * | 20 | 80 | 398 | 5.0 | 222 | 32 | 2.8 | 64 | 0.8 | 683 | 8.5 | 385 | 7.7 | 10.8 |
| 58 | 32 | 5 | 10 | 100 | |||||||||||||||
| Birch | 0.16 | 26 | 20 | 1.0 | 2 + 1 * | 30 | 70 | 317 | 4.5 | 117 | 17 | 1.7 | 36 | 0.7 | 470 | 6.7 | 318 | 6.3 | 9.0 |
| 65 | 25 | 4 | 8 | 100 | |||||||||||||||
| Aspen | 0.06 | 29 | 20 | 1.0 | 2 | 20 | 50 | 384 | 7.7 | 134 | - | 2.7 | 24 | 0.5 | 542 | 10.8 | 384 | 9.5 | 13.0 |
| 70 | 25 | 4 | 100 | ||||||||||||||||
| Black alder | 0.08 | 23 | 20 | 1.0 | 2 + 1 * | 30 | 70 | 344 | 4.9 | 165 | 31 | 2.4 | 41 | 0.6 | 550 | 7.9 | 332 | 7.5 | 9.9 |
| 63 | 30 | 5 | 7 | 100 | |||||||||||||||
| Total | 0.77 | 381 | 4.7 | 195 | 29 | 2.3 | 57 | 633 | 370 | ||||||||||
| 60 | 31 | 5 | 9 | 100 | |||||||||||||||
| Balance of felling, % | 66 | 34 | 5 | 66 | 34 | 5 | |||||||||||||
| Characteristics | Forest Type | |||||
|---|---|---|---|---|---|---|
| Pine | Spruce | Birch | Aspen | Black Alder | Grey Alder | |
| Mean, even GAI (ZM), m3/ha/year | 8.7 ± 0.7 | 9.5 ± 1.0 | 7.7 ± 0.9 | 10.6 ± 1.3 | 9.2 ± 1.0 | 7.9 ± 0.7 |
| Rotation period (felling age (AK) + 9), years | 110 | 80 | 70 | 50 | 70 | 40 |
| Total yield during rotation period, m3/ha [ZM × (AK + 9)] | 946 ± 77 | 760 ± 80 | 539 ± 63 | 540 ± 65 | 644 ± 70 | 316 ± 28 |
| Ratio of mean accumulated volume (change + final felling) and total yield (∆ + MKF) × 100/(ZM × (AK + 9)), % according to NFI data | 64.5 ± 3.0 | 52.5 ± 22.0 | 56.4 ± 6.5 | 53.8 ± 12.5 | 63.0 ± 6.0 | 56.2 ± 8.5 |
| according to yield model | 54 | 50 | 60 | 68 | 60 | 64 |
| Growing stock volume at maturity age (VKF) according to total yield and its accumulation level, m3/ha and its deviation from NFI 2017, % | 511 | 380 | 323 | 367 | 386 | 202 |
| 22.8 | −1.6 | 3.2 | 4.2 | 12.9 | −4.7 | |
| Mean Gross Annual Increment (ZM), m3/ha/year | Forest Area Available for Wood Supply, % | Natural Losses, m3/ha/year | ||||||||
|---|---|---|---|---|---|---|---|---|---|---|
| 1.4 | 1.0 | 0.6 | ||||||||
| Output of Commercial Wood from Stem Volume, % | ||||||||||
| 75 | 80 | 85 | 75 | 80 | 85 | 75 | 80 | 85 | ||
| Potential Mean Annual Commercial Wood Volume, m3/ha/year | ||||||||||
| 8.0 | 70 | 3.5 | 3.7 | 3.9 | 3.7 | 3.9 | 4.2 | 3.9 | 4.1 | 4.4 |
| 80 | 4.0 | 4.2 | 4.5 | 4.2 | 4.5 | 4.8 | 4.4 | 4.7 | 5.0 | |
| 90 | 4.5 | 4.8 | 5.0 | 4.7 | 5.0 | 5.4 | 5.0 | 5.3 | 4.7 | |
| 8.5 | 70 | 3.7 | 4.0 | 4.2 | 3.9 | 4.2 | 4.5 | 4.1 | 4.4 | 4.7 |
| 80 | 4.3 | 4.5 | 4.8 | 4.5 | 4.8 | 5.1 | 4.7 | 5.1 | 5.4 | |
| 90 | 4.8 | 5.1 | 5.4 | 5.1 | 5.4 | 5.7 | 5.3 | 5.7 | 6.0 | |
| 9.0 | 70 | 4.0 | 4.3 | 4.5 | 4.2 | 4.5 | 4.8 | 4.4 | 4.7 | 5.0 |
| 80 | 4.6 | 4.9 | 5.2 | 4.8 | 5.1 | 5.4 | 5.0 | 5.4 | 5.7 | |
| 90 | 5.1 | 5.5 | 5.8 | 5.4 | 5.8 | 6.1 | 5.7 | 6.0 | 6.4 | |
© 2020 by the authors. Licensee MDPI, Basel, Switzerland. This article is an open access article distributed under the terms and conditions of the Creative Commons Attribution (CC BY) license (http://creativecommons.org/licenses/by/4.0/).
Share and Cite
Kuliešis, A.; Kasperavičius, A.; Kulbokas, G.; Kuliešis, A.A.; Pivoriūnas, A.; Aleinikovas, M.; Šilinskas, B.; Škėma, M.; Beniušienė, L. Using Continuous Forest Inventory Data for Control of Wood Production and Use in Large Areas: A Case Study in Lithuania. Forests 2020, 11, 1039. https://doi.org/10.3390/f11101039
Kuliešis A, Kasperavičius A, Kulbokas G, Kuliešis AA, Pivoriūnas A, Aleinikovas M, Šilinskas B, Škėma M, Beniušienė L. Using Continuous Forest Inventory Data for Control of Wood Production and Use in Large Areas: A Case Study in Lithuania. Forests. 2020; 11(10):1039. https://doi.org/10.3390/f11101039
Chicago/Turabian StyleKuliešis, Andrius, Albertas Kasperavičius, Gintaras Kulbokas, Andrius A. Kuliešis, Aidas Pivoriūnas, Marius Aleinikovas, Benas Šilinskas, Mindaugas Škėma, and Lina Beniušienė. 2020. "Using Continuous Forest Inventory Data for Control of Wood Production and Use in Large Areas: A Case Study in Lithuania" Forests 11, no. 10: 1039. https://doi.org/10.3390/f11101039