Measuring Tree Height with Remote Sensing—A Comparison of Photogrammetric and LiDAR Data with Different Field Measurements


Abstract
:1. Introduction
2. Materials and Methods
2.1. Study Area
2.2. Field Data Collection
2.3. Remote Sensing Data Acquisition
2.4. Computation of Individual Tree Heights
2.5. Statistical Analysis
3. Results
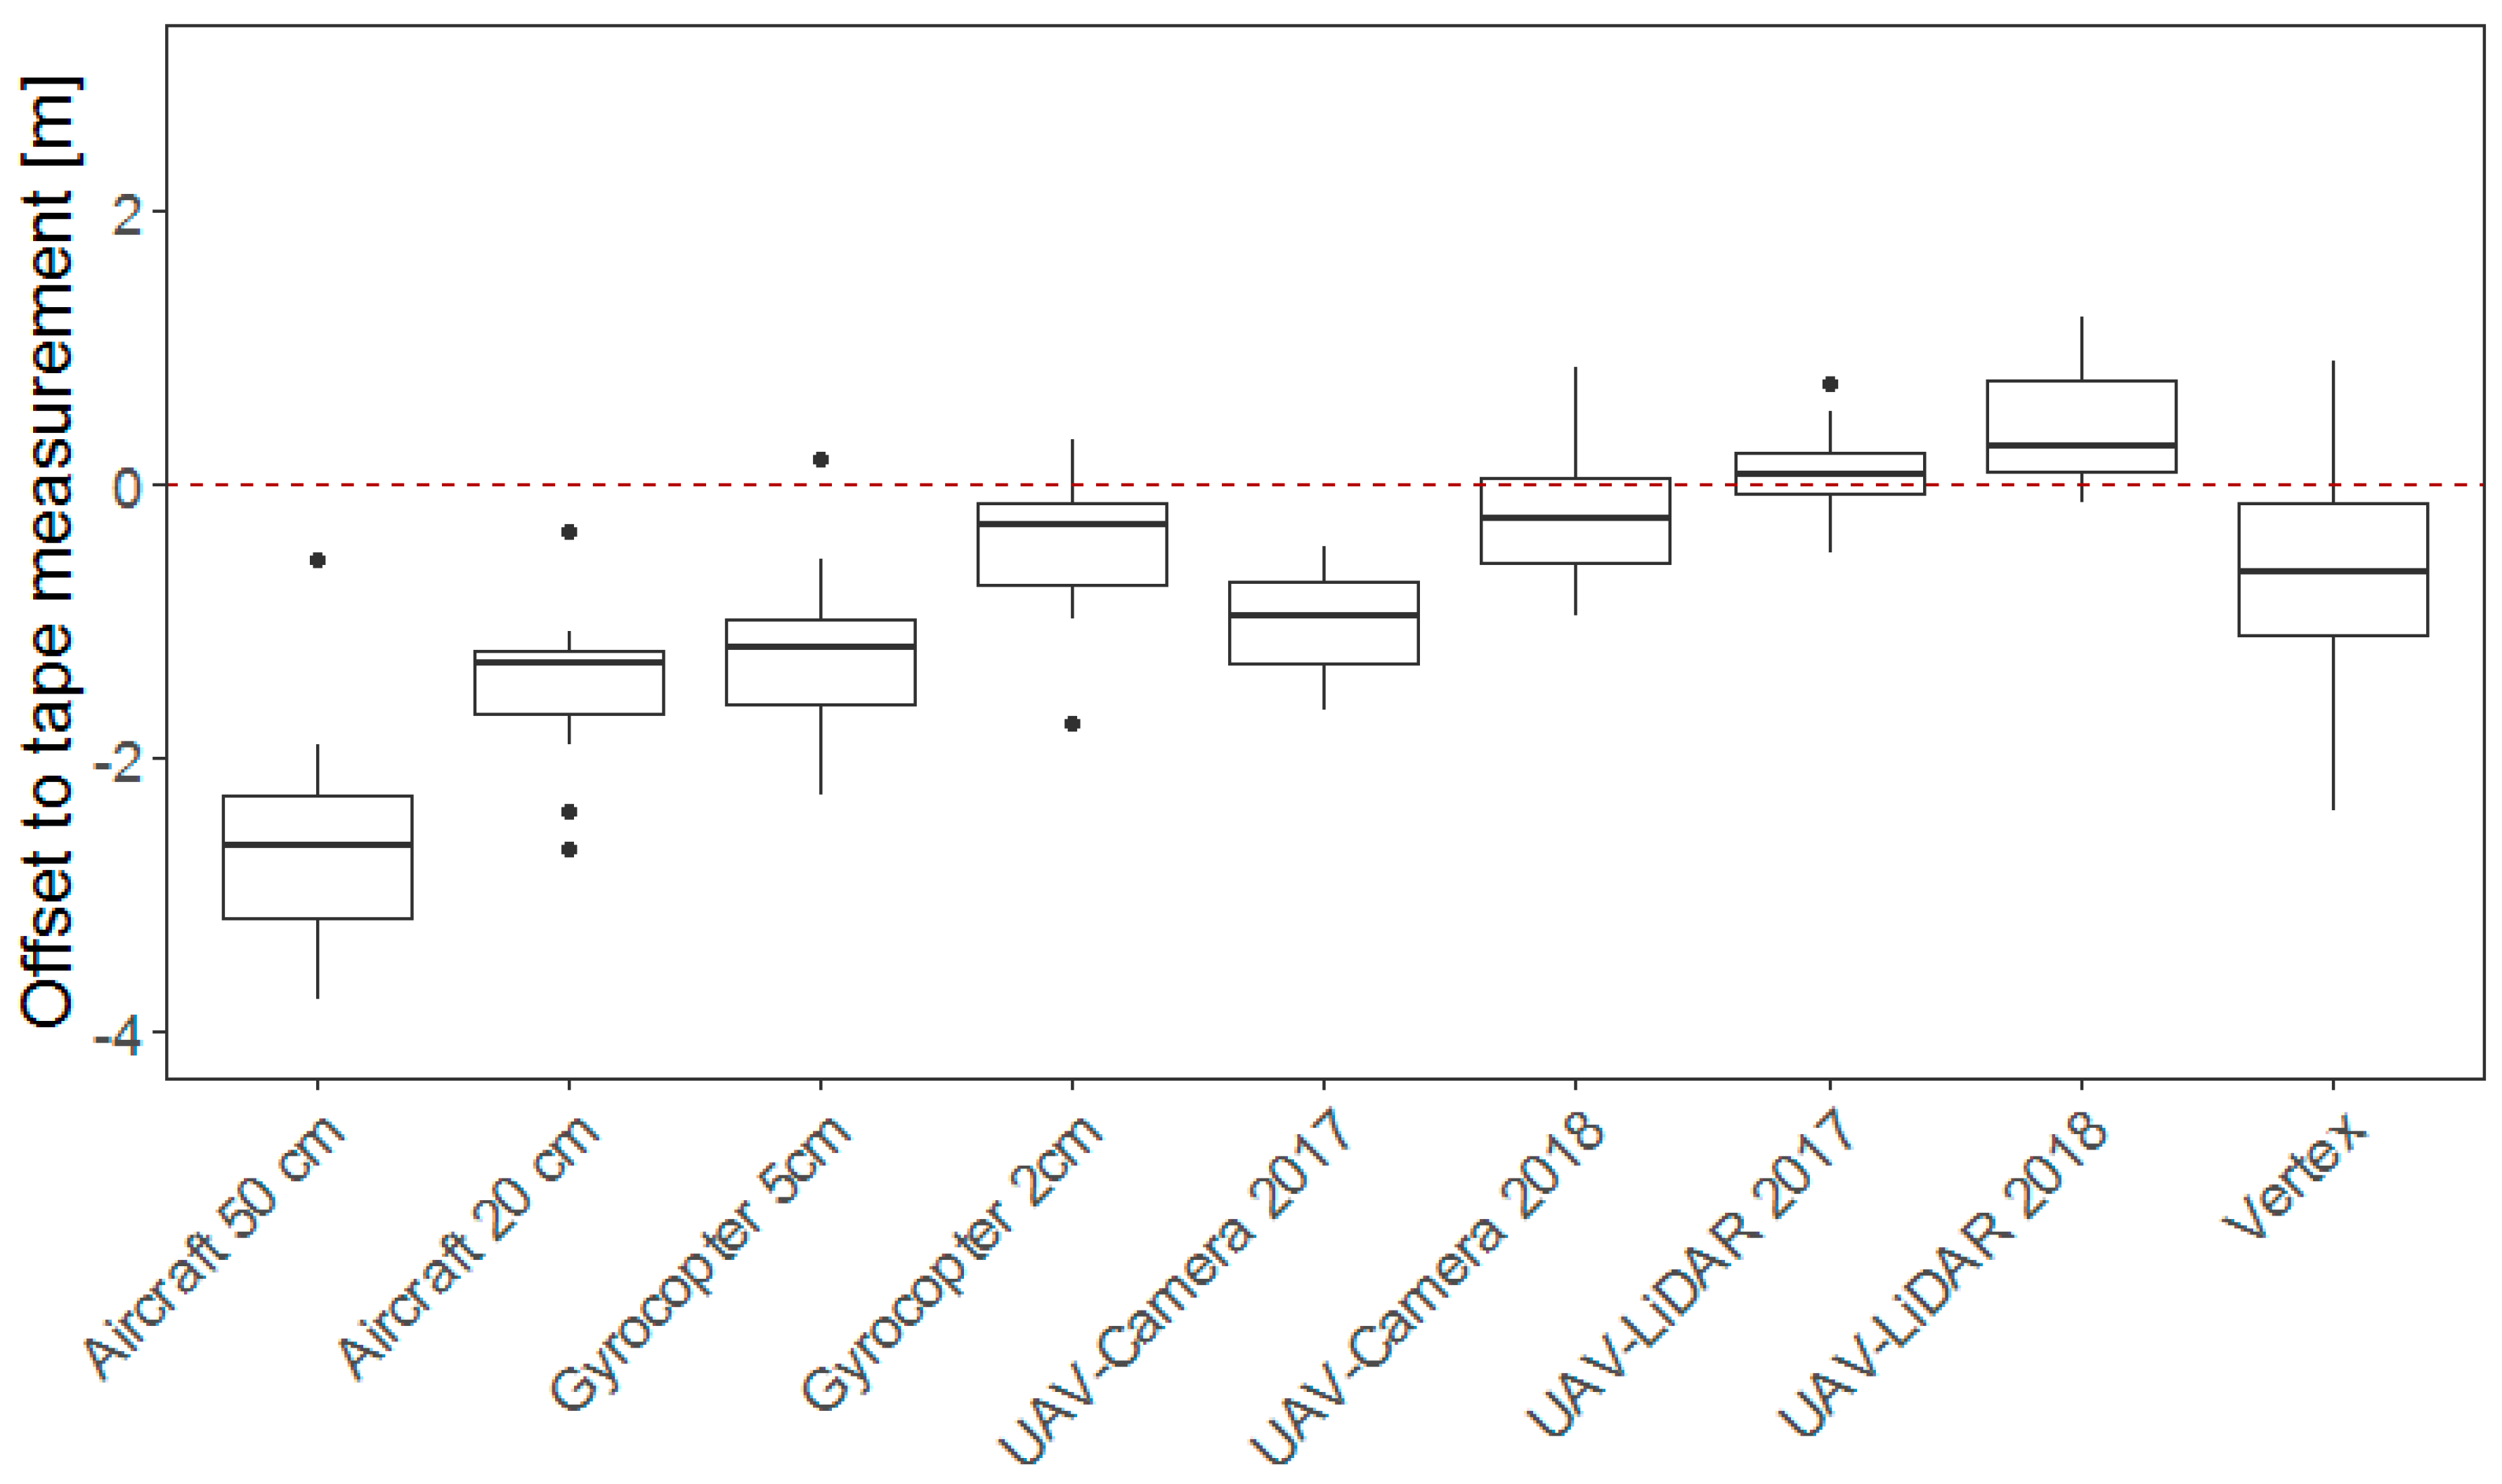
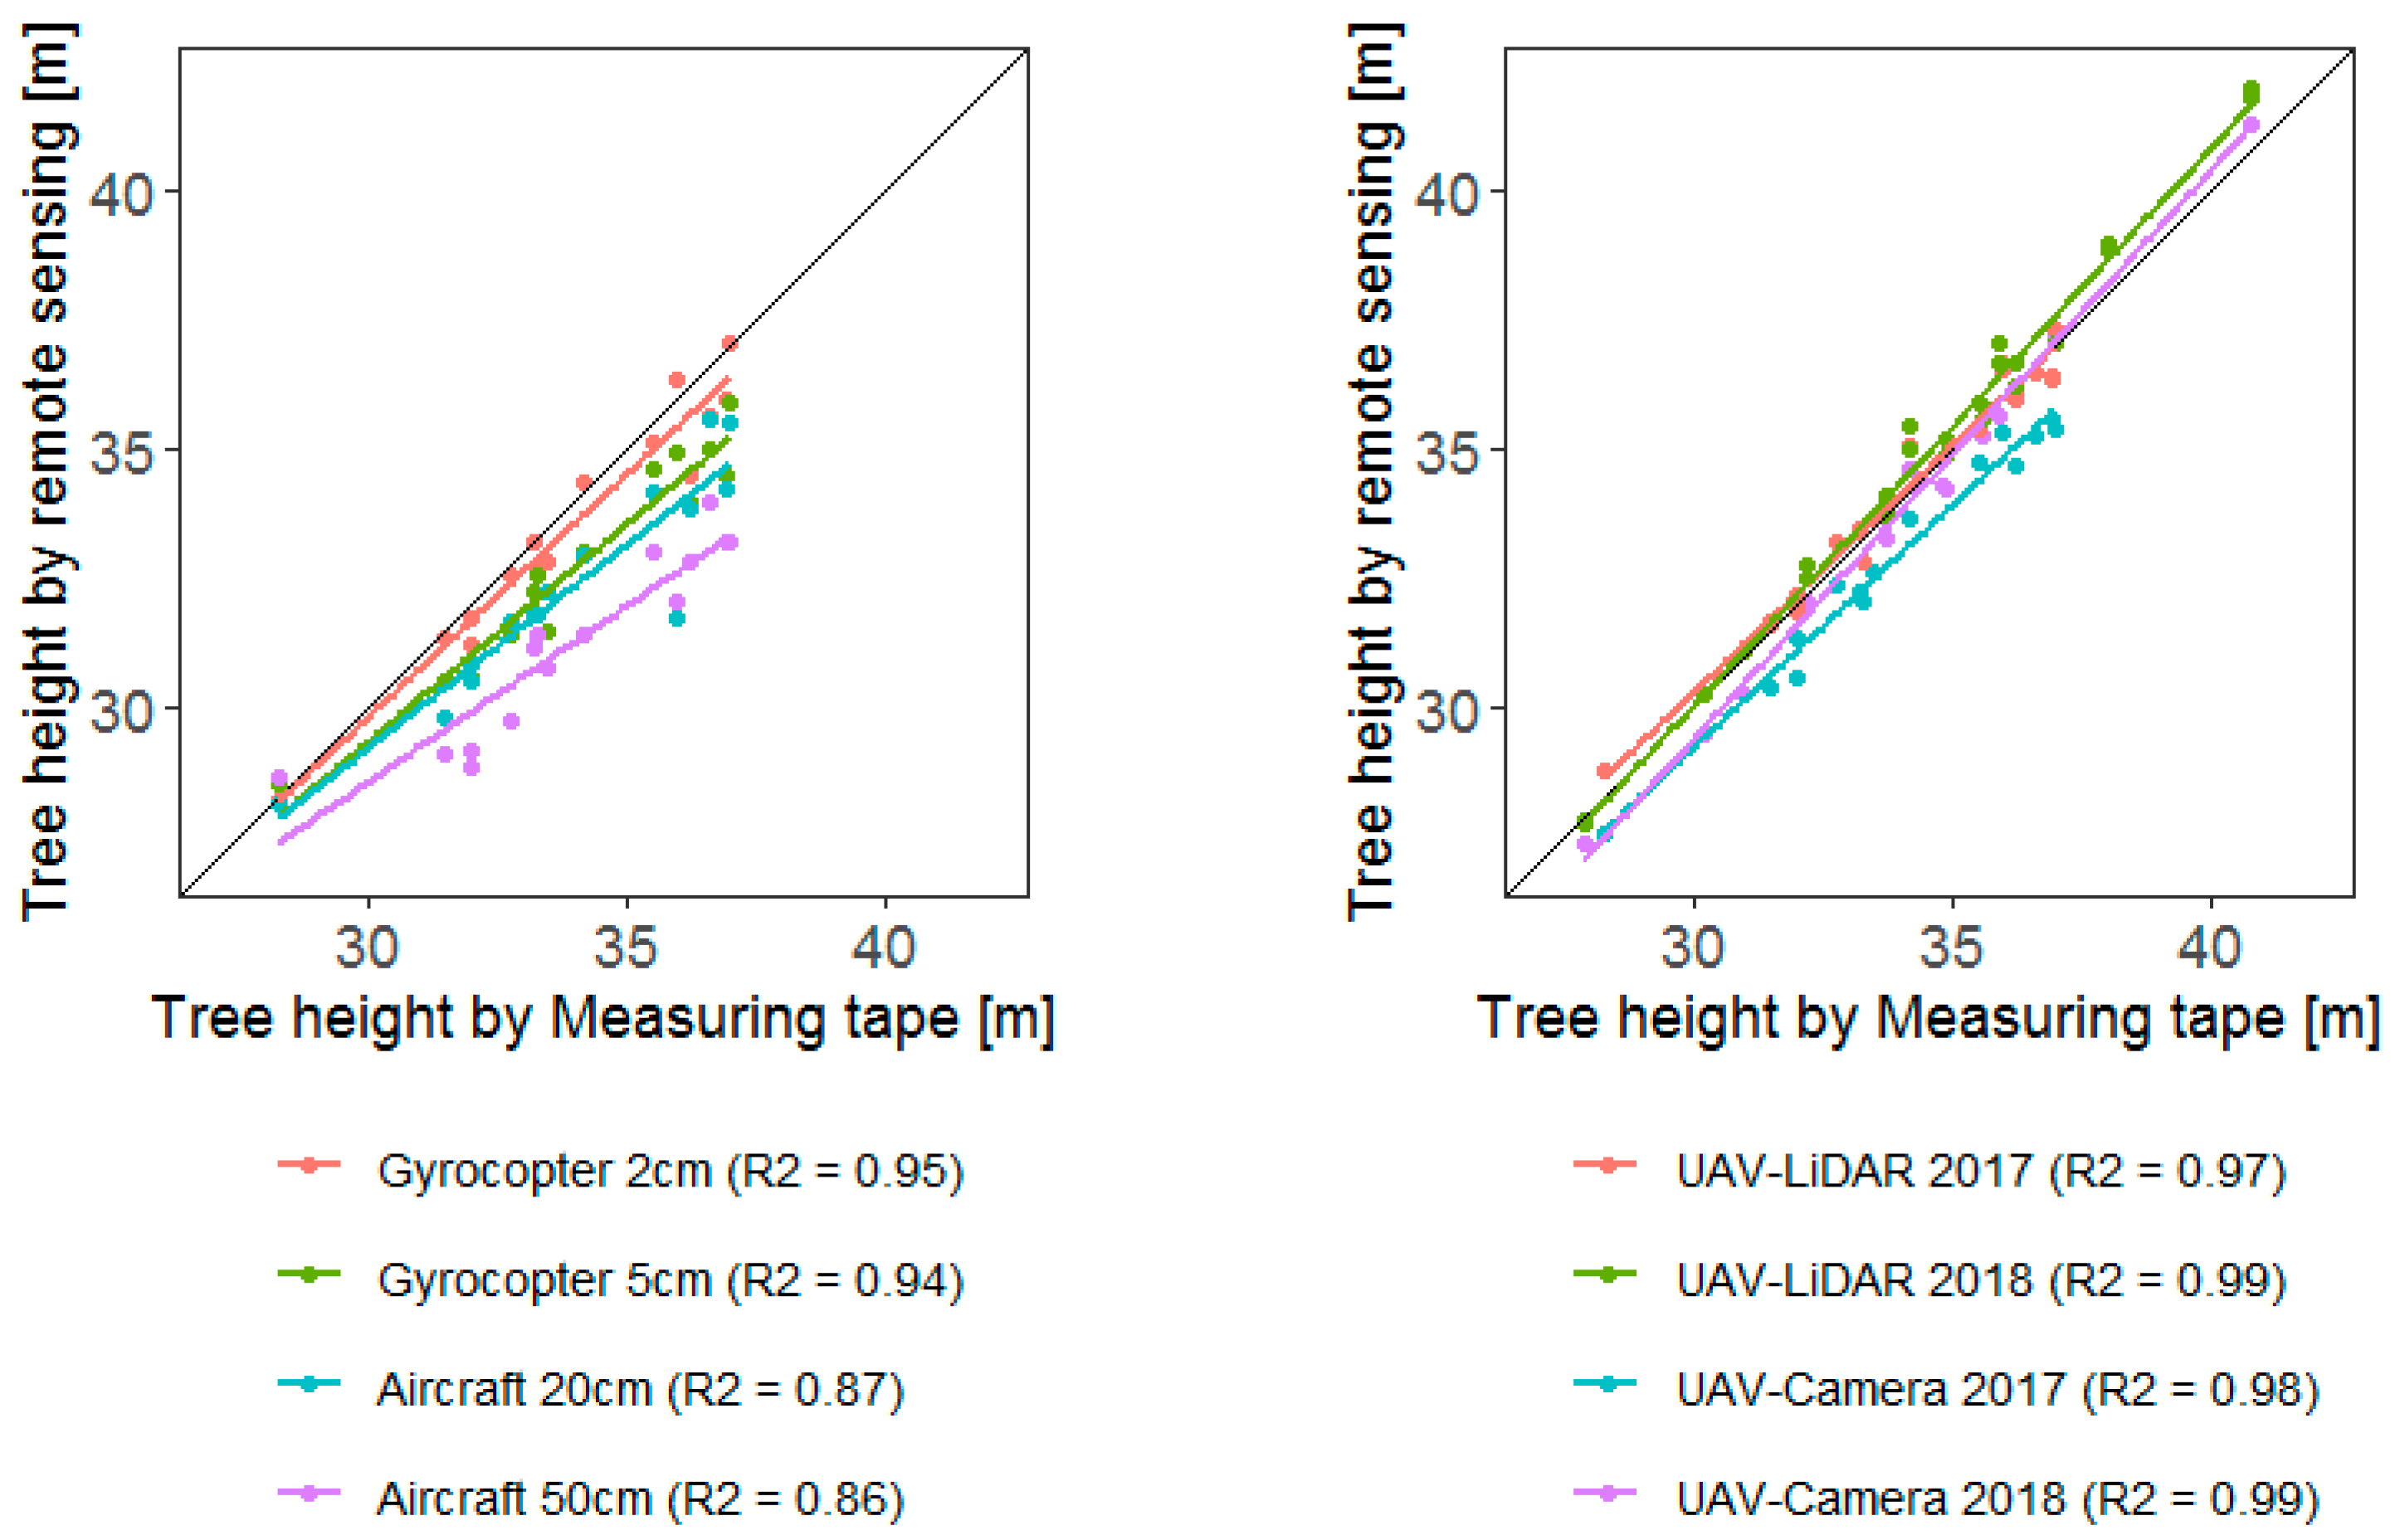
3.1. Accuracy Assessment
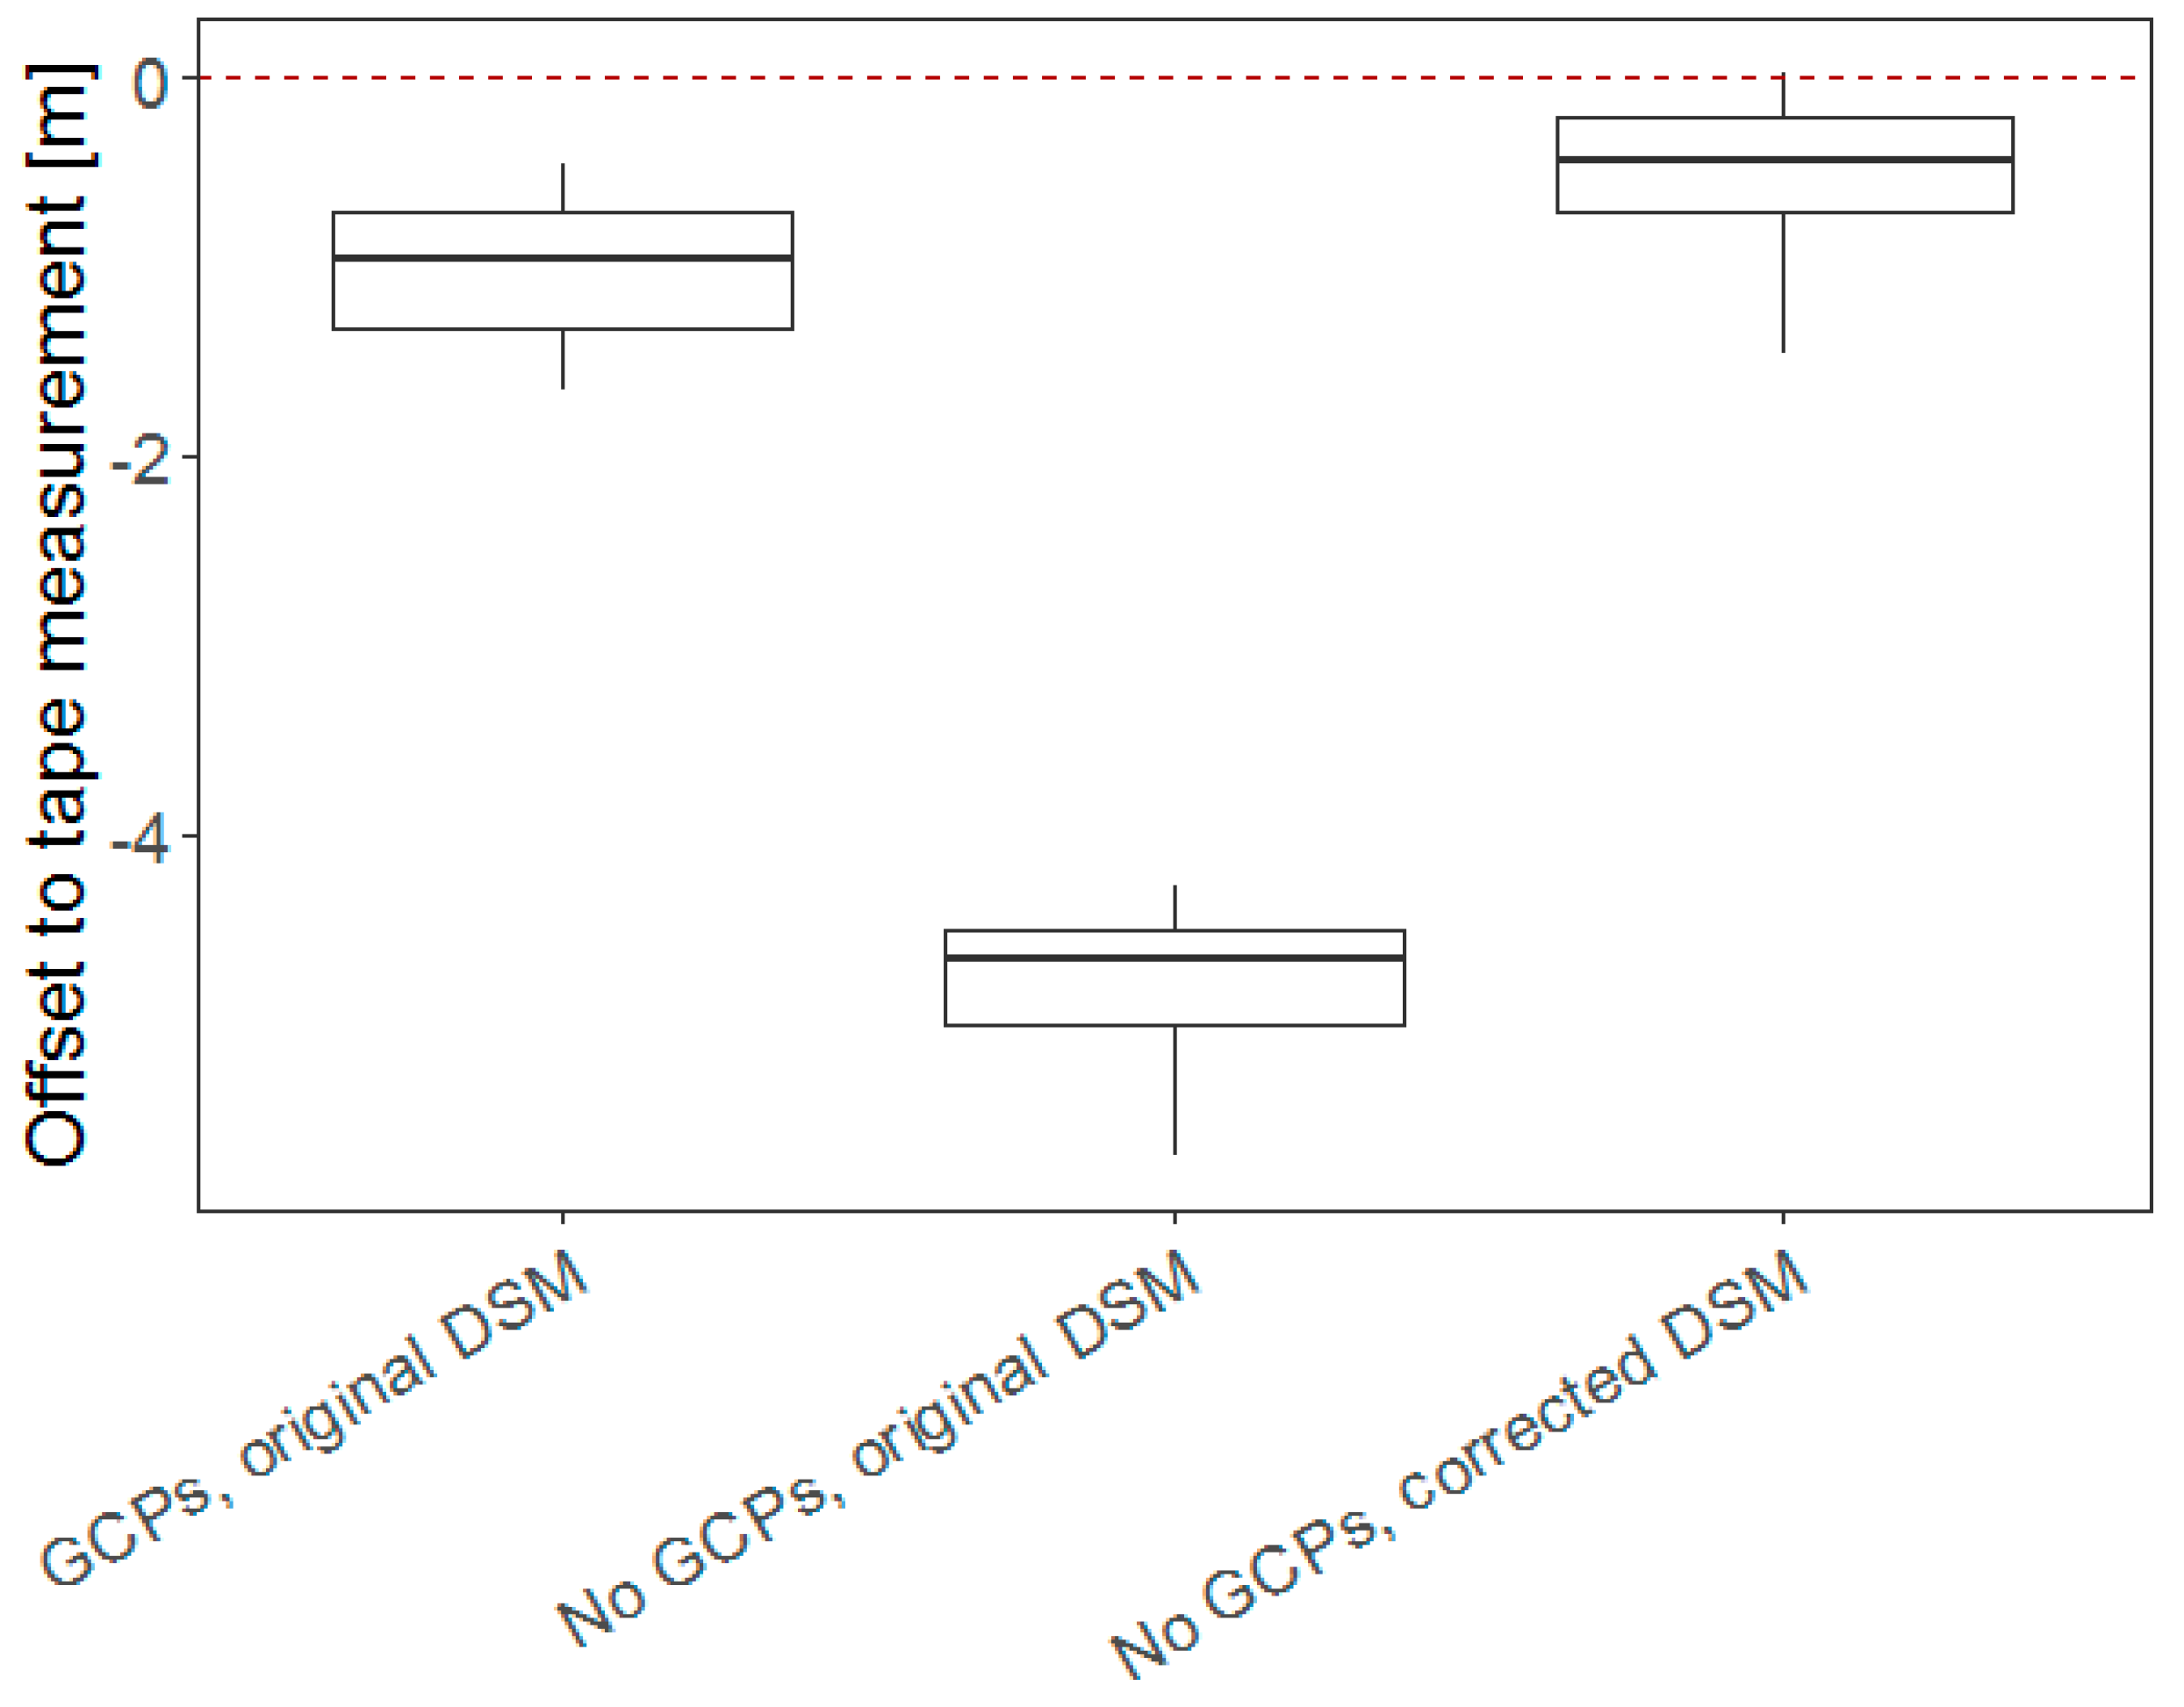
3.2. Analyzing the Influence of Orientation Quality for Tree Height Derivation
4. Discussion
5. Conclusions
Author Contributions
Funding
Acknowledgments
Conflicts of Interest
References
- Goodbody, T.R.; Coops, N.C.; Marshall, P.L.; Tompalski, P.; Crawford, P. Unmanned aerial systems for precision forest inventory purposes: A review and case study. For. Chron. 2017, 93, 71–81. [Google Scholar] [CrossRef] [Green Version]
- Andersen, H.-E.; Reutebuch, S.E.; McGaughey, R.J. A rigorous assessment of tree height measurements obtained using airborne lidar and conventional field methods. Can. J. Remote Sens. 2006, 32, 355–366. [Google Scholar] [CrossRef]
- Bragg, D.C. Accurately measuring the height of (real) forest trees. J. For. 2014, 112, 51–54. [Google Scholar] [CrossRef]
- Fieber, K.D.; Davenport, I.J.; Tanase, M.A.; Ferryman, J.M.; Gurney, R.J.; Becerra, V.M.; Walker, J.P.; Hacker, J.M. Validation of canopy height profile methodology for small-footprint full-waveform airborne lidar data in a discontinuous canopy environment. ISPRS J. Photogramm. Remote Sens. 2015, 104, 144–157. [Google Scholar] [CrossRef]
- Silva, C.A.; Hudak, A.T.; Vierling, L.A.; Loudermilk, E.L.; O’Brien, J.J.; Hiers, J.K.; Jack, S.B.; Gonzalez-Benecke, C.; Lee, H.; Falkowski, M.J. Imputation of individual longleaf pine (Pinus palustris mill.) tree attributes from field and lidar data. Can. J. Remote Sens. 2016, 42, 554–573. [Google Scholar] [CrossRef]
- Waser, L.T.; Boesch, R.; Wang, Z.; Ginzler, C. Towards automated forest mapping. In Mapping Forest Landscape Patterns; Springer: New York, NY, USA, 2017; pp. 263–304. [Google Scholar]
- Dean, T.J.; Cao, Q.V.; Roberts, S.D.; Evans, D.L. Measuring heights to crown base and crown median with lidar in a mature, even-aged loblolly pine stand. For. Ecol. Manag. 2009, 257, 126–133. [Google Scholar] [CrossRef]
- Jung, S.-E.; Kwak, D.-A.; Park, T.; Lee, W.-K.; Yoo, S. Estimating crown variables of individual trees using airborne and terrestrial laser scanners. Remote Sens. 2011, 3, 2346–2363. [Google Scholar] [CrossRef]
- Kato, A.; Moskal, L.M.; Schiess, P.; Swanson, M.E.; Calhoun, D.; Stuetzle, W. Capturing tree crown formation through implicit surface reconstruction using airborne lidar data. Remote Sens. Environ. 2009, 113, 1148–1162. [Google Scholar] [CrossRef]
- Luo, L.; Zhai, Q.; Su, Y.; Ma, Q.; Kelly, M.; Guo, Q. Simple method for direct crown base height estimation of individual conifer trees using airborne lidar data. Opt. Express 2018, 26, A562–A578. [Google Scholar] [CrossRef]
- Muss, J.D.; Mladenoff, D.J.; Townsend, P.A. A pseudo-waveform technique to assess forest structure using discrete lidar data. Remote Sens. Environ. 2011, 115, 824–835. [Google Scholar] [CrossRef]
- Popescu, S.C.; Zhao, K. A voxel-based lidar method for estimating crown base height for deciduous and pine trees. Remote Sens. Environ. 2008, 112, 767–781. [Google Scholar] [CrossRef]
- Solberg, S.; Naesset, E.; Bollandsas, O.M. Single tree segmentation using airborne laser scanner data in a structurally heterogeneous spruce forest. Photogramm. Eng. Remote Sens. 2006, 72, 1369–1378. [Google Scholar] [CrossRef]
- Vauhkonen, J. Estimating crown base height for scots pine by means of the 3D geometry of airborne laser scanning data. Int. J. Remote Sens. 2008, 31, 1213–1226. [Google Scholar] [CrossRef]
- Wallace, L.; Watson, C.; Lucieer, A. Detecting pruning of individual stems using airborne laser scanning data captured from an unmanned aerial vehicle. Int. J. Appl. Earth Obs. Geoinf. 2014, 30, 76–85. [Google Scholar] [CrossRef]
- Xu, W.; Su, Z.; Feng, Z.; Xu, H.; Jiao, Y.; Yan, F. Comparison of conventional measurement and lidar-based measurement for crown structures. Comput. Electron. Agric. 2013, 98, 242–251. [Google Scholar] [CrossRef]
- Goodbody, T.R.; Coops, N.C.; White, J.C. Digital aerial photogrammetry for updating area-based forest inventories: A review of opportunities, challenges, and future directions. Curr. For. Rep. 2019, 5, 55–75. [Google Scholar] [CrossRef]
- Krause, S.; Sanders, T.G.; Mund, J.-P.; Greve, K. Uav-based photogrammetric tree height measurement for intensive forest monitoring. Remote Sens. 2019, 11, 758. [Google Scholar] [CrossRef]
- Sibona, E.; Vitali, A.; Meloni, F.; Caffo, L.; Dotta, A.; Lingua, E.; Motta, R.; Garbarino, M. Direct measurement of tree height provides different results on the assessment of lidar accuracy. Forests 2017, 8, 7. [Google Scholar] [CrossRef]
- Abetz, P. Douglasien-standraumversuche. AFZ Wald 1971, 26, 448–449. [Google Scholar]
- Husch, B.; Beers, T.W.; Kershaw, J.A., Jr. Forest Mensuration, 4th ed.; John Wiley & Sons, Inc: Hoboken, NY, USA, 2003. [Google Scholar]
- Landesamt für Geoinformation und Landentwicklung Baden-Württemberg L Geobasisdaten. 19 January 2018. Available online: www.lgl-bw.de az.: 2851.9 (accessed on 15 August 2019).
- Roussel, J.-R.; Auty, D. lidR: Airborne Lidar Data Manipulation and Visualization for Forestry Applications. R package version 1.5.0. 2018. Available online: https://rdrr.io/cran/lidR/ (accessed on 15 August 2019).
- White, J.; Wulder, M.; Vastaranta, M.; Coops, N.; Pitt, D.; Woods, M. The utility of image-based point clouds for forest inventory: A comparison with airborne laser scanning. Forests 2013, 4, 518–536. [Google Scholar] [CrossRef]
- Landesamt für Geoinformation und Landentwicklung Baden-Württemberg (LGL). Digitale Geländemodelle (dgm). Available online: https://www.lgl-bw.de/lgl-internet/opencms/de/05_ Geoinformation/Geotopographie/Digitale_Gelaendemodelle/ (accessed on 9 July 2019).
- Bragg, D.C. An improved tree height measurement technique tested on mature southern pines. South. J. Appl. For. 2008, 32, 38–43. [Google Scholar]
- Goetz, S.; Dubayah, R. Advances in remote sensing technology and implications for measuring and monitoring forest carbon stocks and change. Carbon Manag. 2011, 2, 231–244. [Google Scholar] [CrossRef]
- Larjavaara, M.; Muller-Landau, H.C. Measuring tree height: A quantitative comparison of two common field methods in a moist tropical forest. Methods Ecol. Evol. 2013, 4, 793–801. [Google Scholar] [CrossRef]
- Luoma, V.; Saarinen, N.; Wulder, M.; White, J.; Vastaranta, M.; Holopainen, M.; Hyyppä, J. Assessing precision in conventional field measurements of individual tree attributes. Forests 2017, 8, 38. [Google Scholar] [CrossRef]
- Birdal, A.C.; Avdan, U.; Türk, T. Estimating tree heights with images from an unmanned aerial vehicle. Geomat. Nat. Hazards Risk 2017, 8, 1144–1156. [Google Scholar] [CrossRef] [Green Version]
- Ullah, S.; Dees, M.; Datta, P.; Adler, P.; Schardt, M.; Koch, B. Potential of modern photogrammetry versus airborne laser scanning for estimating forest variables in a mountain environment. Remote Sens. 2019, 11, 661. [Google Scholar] [CrossRef]
- White, J.C.; Coops, N.C.; Wulder, M.A.; Vastaranta, M.; Hilker, T.; Tompalski, P. Remote sensing technologies for enhancing forest inventories: A review. Can. J. Remote Sens. 2016, 42, 619–641. [Google Scholar] [CrossRef]
- Wallace, L.; Lucieer, A.; Malenovský, Z.; Turner, D.; Vopěnka, P. Assessment of forest structure using two uav techniques: A comparison of airborne laser scanning and structure from motion (sfm) point clouds. Forests 2016, 7, 62. [Google Scholar] [CrossRef]
- Zarco-Tejada, P.J.; Diaz-Varela, R.; Angileri, V.; Loudjani, P. Tree height quantification using very high resolution imagery acquired from an unmanned aerial vehicle (uav) and automatic 3d photo-reconstruction methods. Eur. J. Agron. 2014, 55, 89–99. [Google Scholar] [CrossRef]
- Giftthaler, M. Ermittlung von einzelbaumhöhen basierend auf fernerkundungsdaten unbemannter luftfahrtsysteme. AGIT J. 2017, 3, 142–152. [Google Scholar]
- Panagiotidis, D.; Abdollahnejad, A.; Surový, P.; Chiteculo, V. Determining tree height and crown diameter from high-resolution uav imagery. Int. J. Remote Sens. 2017, 38, 2392–2410. [Google Scholar] [CrossRef]
- Jensen, J.; Mathews, A. Assessment of image-based point cloud products to generate a bare earth surface and estimate canopy heights in a woodland ecosystem. Remote Sens. 2016, 8, 50. [Google Scholar] [CrossRef]
- Bayer, S. Automatisierte Einzelbaumextraktion im Forst: Analyse und Optimierung von Aufnahmeparametern und Prozessierungsschritten von der Luftbildaufnahme bis zum Attributierten Einzelbaum. Ph.D. Thesis, Freie Universität Berlin, Berlin, Germany, 2018. [Google Scholar]
- Yu, X.; Hyyppä, J.; Hyyppä, H.; Maltamo, M. Effects of flight altitude on tree height estimation using airborne laser scanning. Int. Arch. Photogramm. Remote Sens. Spat. Inf. Sci. 2004, XXXVI part 8/W2, 96–101. [Google Scholar]
- Næsset, E. Effects of different flying altitudes on biophysical stand properties estimated from canopy height and density measured with a small-footprint airborne scanning laser. Remote Sens. Environ. 2004, 91, 243–255. [Google Scholar] [CrossRef]
- Bohlin, J.; Wallerman, J.; Fransson, J.E. Forest variable estimation using photogrammetric matching of digital aerial images in combination with a high-resolution dem. Scand. J. For. Res. 2012, 27, 692–699. [Google Scholar] [CrossRef]
- Lim, K.; Hopkinson, C.; Treitz, P. Examining the effects of sampling point densities on laser canopy height and density metrics. For. Chron. 2008, 84, 876–885. [Google Scholar] [CrossRef] [Green Version]
- Honkavaara, E.; Litkey, P.; Nurminen, K. Automatic storm damage detection in forests using high-altitude photogrammetric imagery. Remote Sens. 2013, 5, 1405–1424. [Google Scholar] [CrossRef]
- Honkavaara, E.; Markelin, L.; Rosnell, T.; Nurminen, K. Influence of solar elevation in radiometric and geometric performance of multispectral photogrammetry. ISPRS J. Photogramm. Remote Sens. 2012, 67, 13–26. [Google Scholar] [CrossRef]
- Gobakken, T.; Bollandsås, O.M.; Næsset, E. Comparing biophysical forest characteristics estimated from photogrammetric matching of aerial images and airborne laser scanning data. Scand. J. For. Res. 2015, 30, 73–86. [Google Scholar] [CrossRef]
- Goodbody, T.; Coops, N.; Hermosilla, T.; Tompalski, P.; Pelletier, G. Vegetation phenology driving error variation in digital aerial photogrammetrically derived terrain models. Remote Sens. 2018, 10, 1554. [Google Scholar] [CrossRef]
- Tomaštík, J.; Mokroš, M.; Saloň, Š.; Chudý, F.; Tunák, D. Accuracy of photogrammetric uav-based point clouds under conditions of partially-open forest canopy. Forests 2017, 8, 151. [Google Scholar] [CrossRef]


| Platform | Type of System | GSD (cm) | Date of Acquisition | Altitude above Ground | Overlap | Point Density (points/m2) |
|---|---|---|---|---|---|---|
| Aircraft | Camera | 20 | 10.07.2016 | 2700–2750 m | 68%/40% | 25 |
| Aircraft | Camera | 50 | 10.07.2016 | 2700–2750 m | 68%/40% | 4 |
| Gyrocopter | Camera | 2 | 20.06.2017 | ~300 m | 85%/70% | 502 |
| Gyrocopter | Camera | 5 | 20.06.2017 | ~800 m | 90%/70% | 66 |
| UAV | Camera | 1 | 15.03.2018 | 50–60 m | 60%–70% | 620 |
| UAV | Camera | 1 | 19.06–20.06.2017 | 80–100 m | 50% | 350 |
| UAV | LiDAR | - | 19.06–20.06.2017 | 80–100 m | 80%/80% | 1690 |
| UAV | LiDAR | - | 15.03.2018 | 80–100 m | 80%/80% | 2118 |
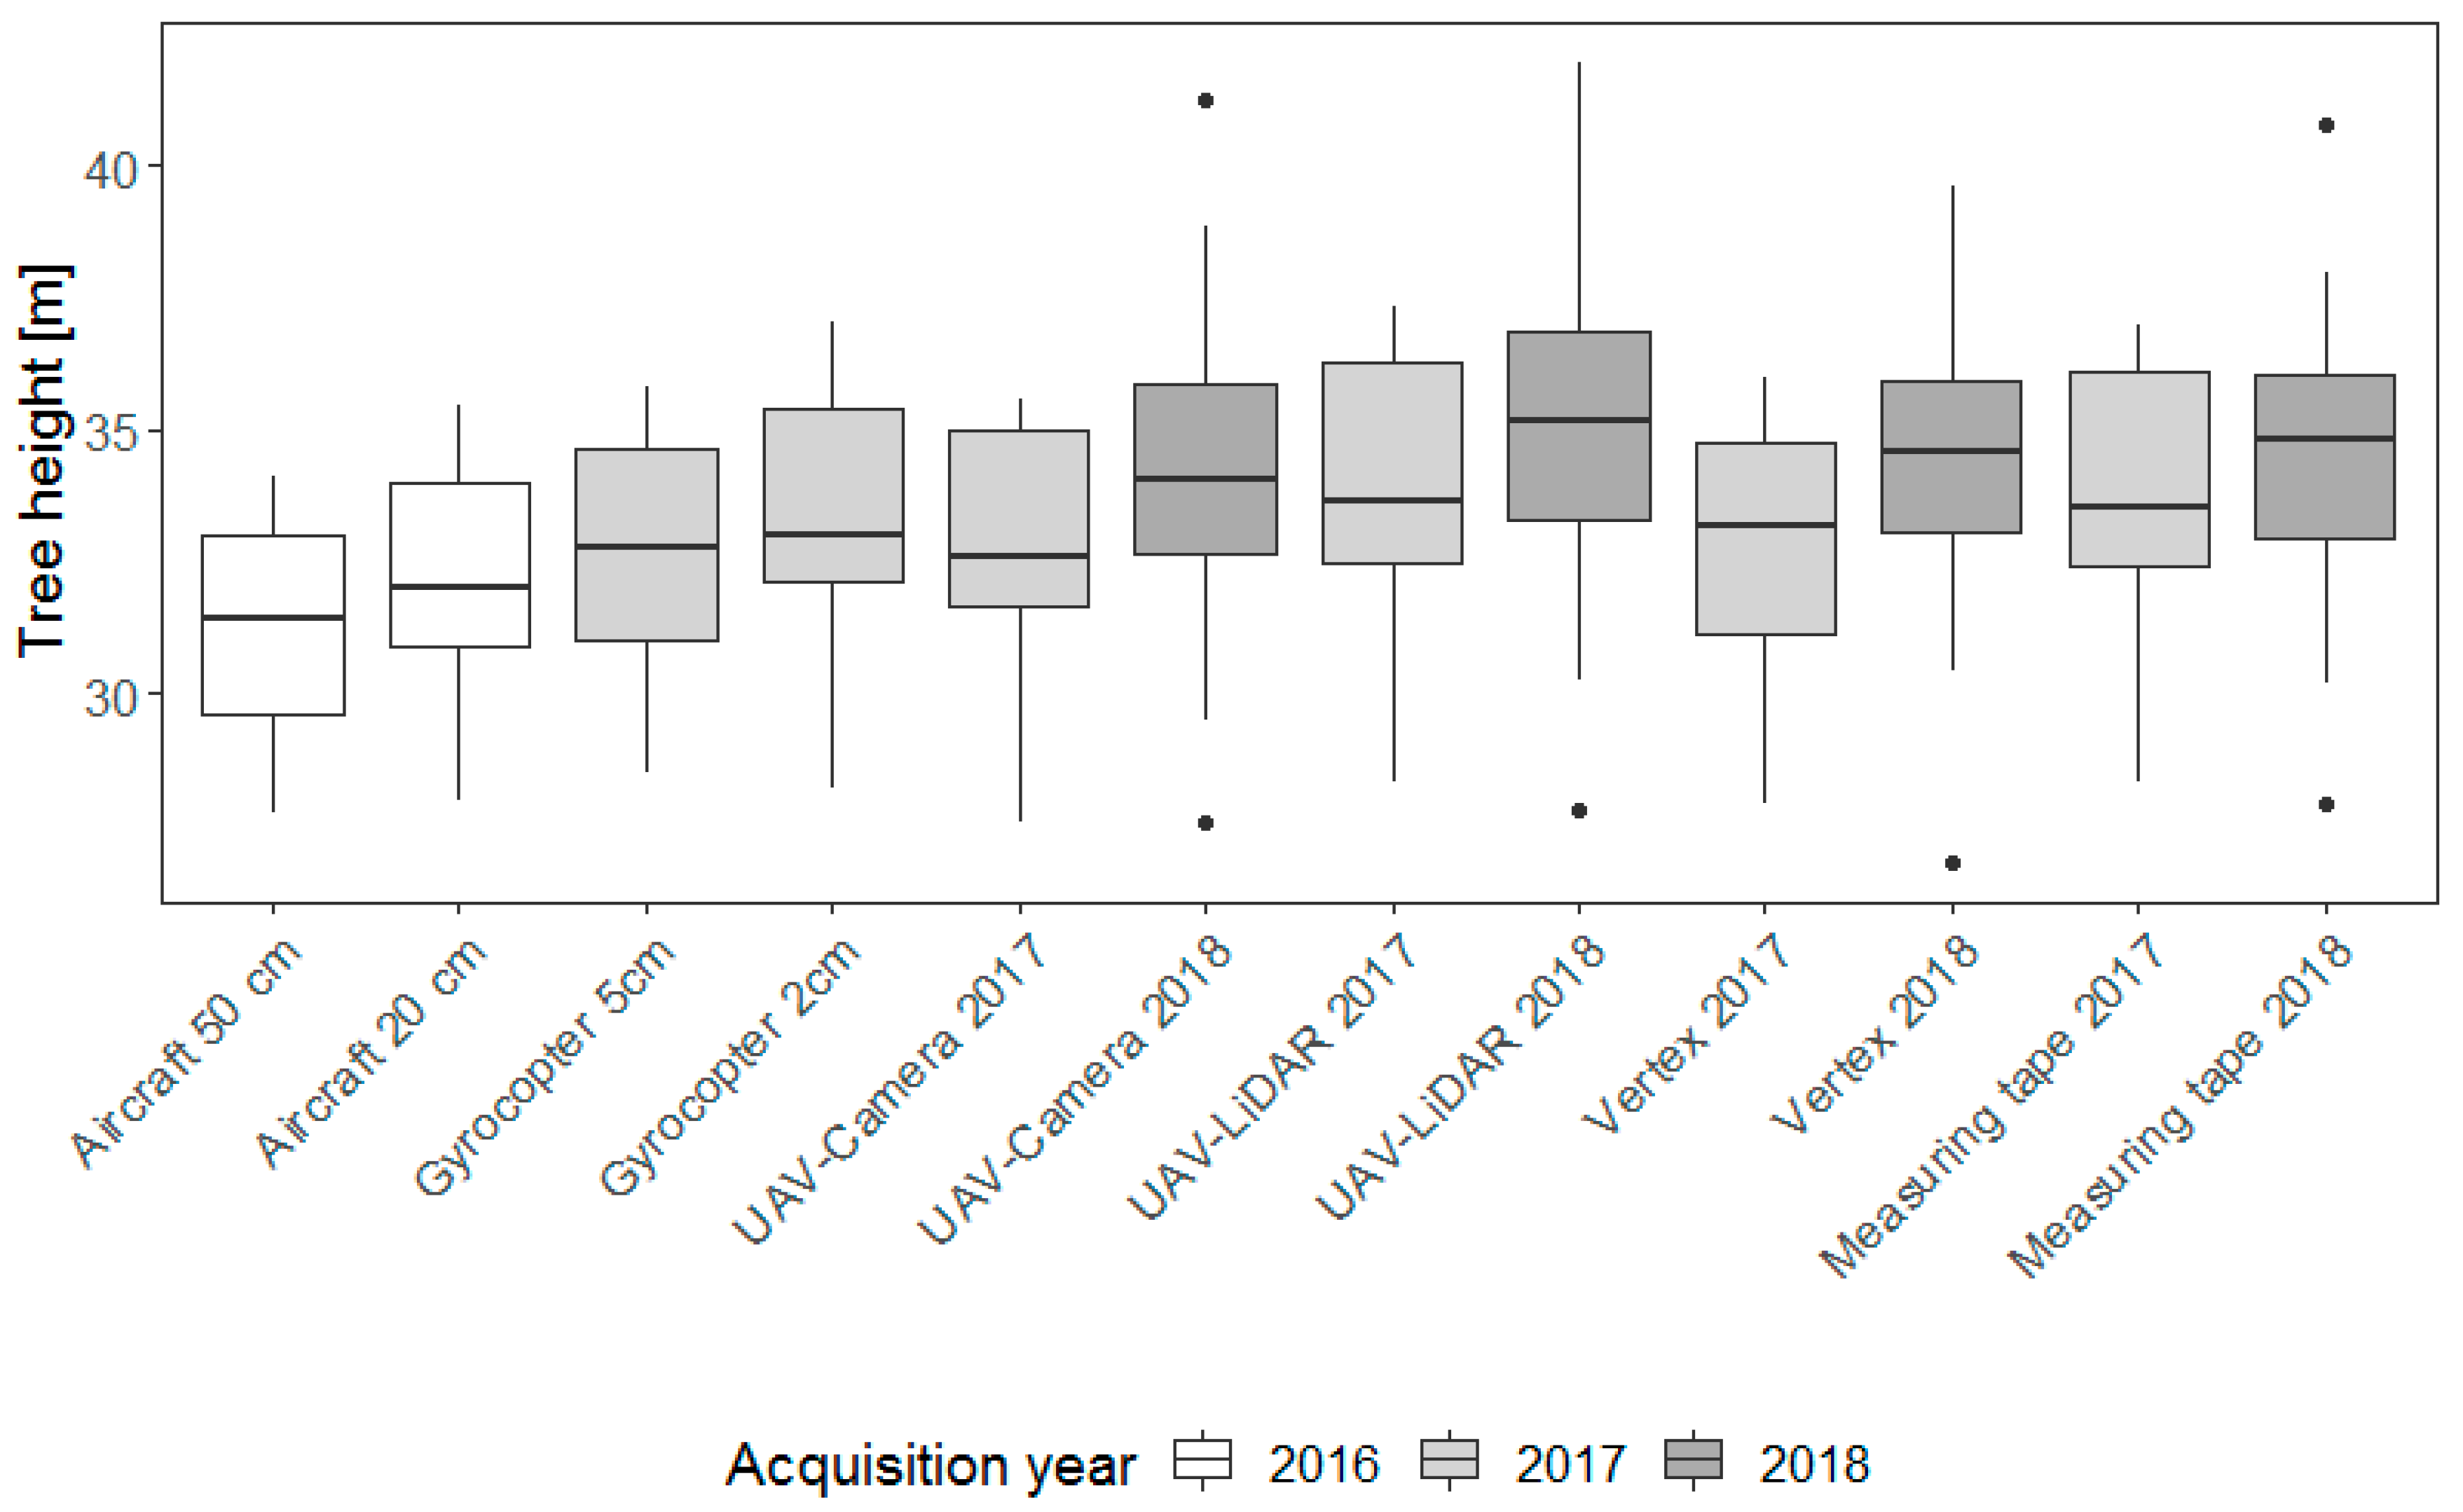
| Platform | Type of System | GSD (cm) | Year of Acquisition | Min (m) | Mean (m) | Max (m) | SD (m) |
|---|---|---|---|---|---|---|---|
| Aircraft | Camera | 20 | 2016 | 27.96 | 32.22 | 35.47 | 2.13 |
| Aircraft | Camera | 50 | 2016 | 27.75 | 31.2 | 34.11 | 1.95 |
| Gyrocopter | Camera | 2 | 2017 | 28.2 | 33.48 | 37.05 | 2.37 |
| Gyrocopter | Camera | 5 | 2017 | 28.49 | 32.64 | 35.8 | 2.12 |
| UAV | Camera | 1 | 2017 | 27.57 | 32.91 | 35.59 | 2.33 |
| UAV | Camera | 1 | 2018 | 27.58 | 34.2 | 41.27 | 3.55 |
| UAV | LiDAR | - | 2017 | 28.31 | 34.02 | 37.3 | 2.46 |
| UAV | LiDAR | - | 2018 | 27.76 | 34.85 | 41.95 | 3.53 |
| Measuring tape | manually | - | 2017 | 28.3 | 33.93 | 37 | 2.46 |
| Measuring tape | manually | - | 2018 | 27.9 | 34.41 | 40.8 | 3.22 |
| Vertex | manually | - | 2017 | 27.9 | 32.85 | 36 | 2.38 |
| Vertex | manually | - | 2018 | 26.8 | 34.17 | 39.6 | 3.13 |
| Platform | Type of System | GSD (cm) | Year of Acquisition | RMSE (m) | ME (m) |
|---|---|---|---|---|---|
| Aircraft | Camera | 20 | 2016 | 1.86 | −1.63 |
| Aircraft | Camera | 50 | 2016 | 2.89 | −2.71 |
| Gyrocopter | Camera | 2 | 2017 | 0.68 | −0.44 |
| Gyrocopter | Camera | 5 | 2017 | 1.44 | −1.29 |
| UAV | Camera | 1 | 2017 | 1.09 | −1.03 |
| UAV | Camera | 1 | 2018 | 0.49 | −0.18 |
| UAV | LiDAR | - | 2017 | 0.36 | 0.13 |
| UAV | LiDAR | - | 2018 | 0.49 | 0.3 |
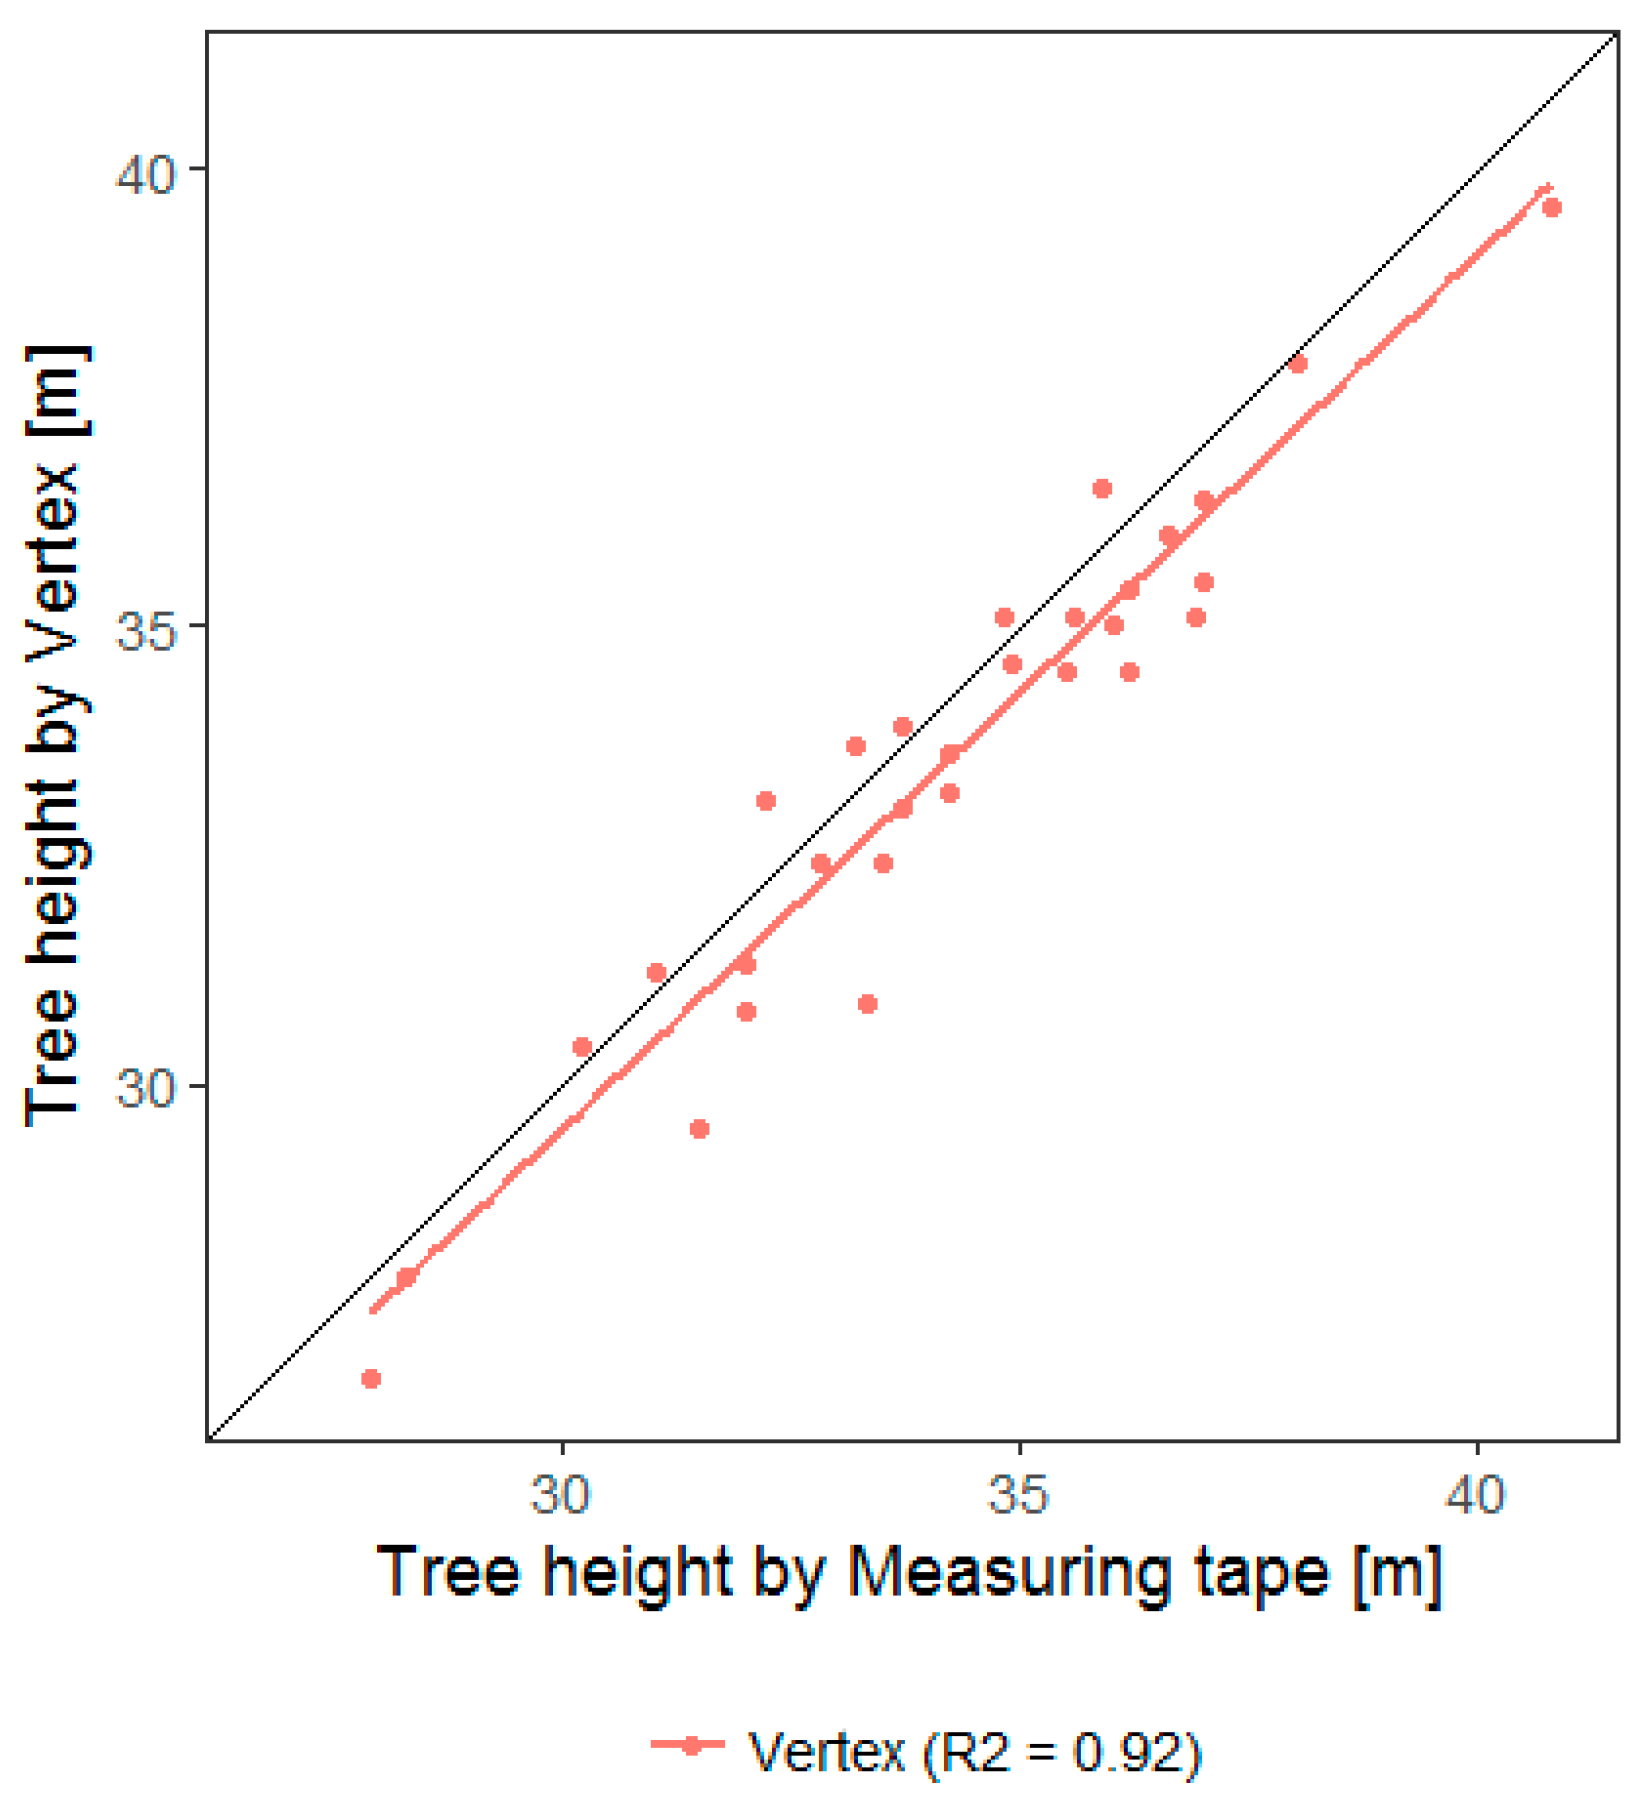
| Vertex | manually | - | 2017/2018 | 1.02 | −0.66 |
| Platform | Type of System | GSD (cm) | Year of Acquisition | Linear Model | R2 |
|---|---|---|---|---|---|
| Aircraft | Camera | 20 | 2016 | y = 0.78 x + 5.64 | 0.87 |
| Aircraft | Camera | 50 | 2016 | y = 0.86 x + 8.14 | 0.86 |
| Gyrocopter | Camera | 2 | 2017 | y = 0.94 x + 1.59 | 0.95 |
| Gyrocopter | Camera | 5 | 2017 | y = 0.84 x + 4.09 | 0.94 |
| UAV | Camera | 1 | 2017 | y = 0.94 x + 1.16 | 0.98 |
| UAV | Camera | 1 | 2018 | y = 1.10 x − 3.61 | 0.99 |
| UAV | LiDAR | - | 2017 | y = 0.95 x + 1.62 | 0.97 |
| UAV | LiDAR | - | 2018 | y = 1.08 x − 2.31 | 0.99 |
| Vertex | manually | - | 2017/2018 | y = 0.96 x + 0.82 | 0.92 |
© 2019 by the authors. Licensee MDPI, Basel, Switzerland. This article is an open access article distributed under the terms and conditions of the Creative Commons Attribution (CC BY) license (http://creativecommons.org/licenses/by/4.0/).
Share and Cite
Ganz, S.; Käber, Y.; Adler, P. Measuring Tree Height with Remote Sensing—A Comparison of Photogrammetric and LiDAR Data with Different Field Measurements. Forests 2019, 10, 694. https://doi.org/10.3390/f10080694
Ganz S, Käber Y, Adler P. Measuring Tree Height with Remote Sensing—A Comparison of Photogrammetric and LiDAR Data with Different Field Measurements. Forests. 2019; 10(8):694. https://doi.org/10.3390/f10080694
Chicago/Turabian StyleGanz, Selina, Yannek Käber, and Petra Adler. 2019. "Measuring Tree Height with Remote Sensing—A Comparison of Photogrammetric and LiDAR Data with Different Field Measurements" Forests 10, no. 8: 694. https://doi.org/10.3390/f10080694