1. Introduction
Poplar is a fast-growing species, and is economically important for wood production and for several industrial purposes (plywood, sawn timber and pulpwood, fuelwood, and biomass for energy). Poplar plantations are environmentally important for the role they play in the protection of soil, regeneration of waste land, restoration of natural river-bank environments, phytoremediation, and for the reduction of the effects of climate change and air pollution [
1].
Recent estimates confirm that, in Italy, poplar plantations cover about 46,000 ha, less than 1% compared to the national forest surface, spread mainly (~43,000 ha) in the Po Valley [
2]. Despite its relatively scarce extension, poplar represents the main source of wood for timber industry transformation in Italy.
Poplar plantations can be managed using different planting systems and rotations. Biomass production rotations can be ‘short’ (less than 10 years) or even ‘very short’ (less than 5 years). Poplar cultivation oriented towards industrial transformations, mainly plywood, veneer, and sawn timber, requires longer rotations.
The value of wood for different timber assortments can vary by a factor of ten. Optimal assortment allocation is, thus, a key element in the wood products supply chain, particularly for plantations. Stem profiles are the first element to consider for assortment allocation.
Stem profiles are modeled by taper functions or stem curves (see e.g., [
3]). These are empirical functions calibrated on the basis of measures of stem diameters taken at different distances from its base. The reference method is destructive: diameter measurements are taken felling the tree and using a tape meter and tree caliper. The significant efforts involved would often limit the number and spatial extent of samples that can be collected in the field. An additional specific drawback for poplar plantations is the high price of a single poplar stem (about 80 euro as minimum price), making sampling costs almost prohibitive.
In the last decades, different instruments have been devised enabling foresters to measure or estimate diameters at different heights: the Finnish parabolic caliper, optical telescopes (monocular with reticle), and laser instruments. These approaches, whether remote or direct, provide little or no information concerning bole straightness, a problem that can significantly affect the volume and the quality of the industrial products. Moreover, such measurements have a much coarser approximation if confronted with terrestrial laser scanning (TLS) measures. Geometric approaches of this type have been developed in many countries worldwide (see e.g., [
4,
5,
6,
7,
8,
9,
10]). To achieve a reliable calibration, given the high variability, a large sample size is required (see e.g., [
4,
10]). More accurate, low-cost, and non-destructive measurements of tree parameters and detailed three-dimensional modelling of forest stands can be obtained by high density point clouds using terrestrial laser scanners [
11,
12]. In addition, the development of small and light-weight devices makes their use in forest environments feasible [
13].
An overview on methods used for stem diameter estimation by means of TLS was given by [
14]. The approaches for diameter estimation from TLS point clouds representing a tree stem are mainly based on circle or cylinder-fitting methods (CLMs) (see e.g., [
14,
15,
16,
17,
18]). CLMs start separating horizontal cross-sectional slices of a point cloud at given heights above the ground. For a reliable identification of trunks and measurement of their diameter, an adequate number of points is required. Cross-sections of individual trunks are identified by spatial clustering. Clusters with a low number of points are excluded from the subsequent data processing steps. The thickness of the horizontal cross section is then defined according to the point cloud density (i.e., number of points per cubic centimeter). For that reason, from an operational point of view, when the objective is to obtain precise measures on the diameters along the stem, multi-scans are required and only the trees closest to the scanning device can be reliably measured.
CLM approaches approximate all cross-sections to circles, obviously hiding eventual bole eccentricities. But, particularly for the most valuable assortments, the industrial process requires reducing the bole to a cylinder to initiate the peeling phase. Hence, for these assortments, the productive dimension is bound to the smallest diameter and a greater eccentricity implies more waste. The geometry of the bole can be quite irregular, and different approaches have been proposed to model it (e.g., [
19,
20]).
The general aim of this research is to improve assortment estimations of standing poplar plantation trees. The specific objective is to assess poplar profile sensitivity to competition anisotropy by FARO® TLS (FARO Technologies Inc., Lake Mary, FL, USA). Lateral compression of horizontal stem cross-sections (bole eccentricity) was evaluated by adopting a relatively straightforward approach to diameter estimation and better exploiting TLS data to focus on the different influences of unequally spaced side competitors. In this plantation, distances to neighboring trees differ depending on direction. Lateral compression is then interpreted and assumed as an effect of this anisotropic competition. Given the interest of forest industry in the lower part of the bole, in this experiment we have studied the bole eccentricity up to 4.5 m from the ground, i.e., just below the first branch.
2. Materials and Methods
2.1. Study Area
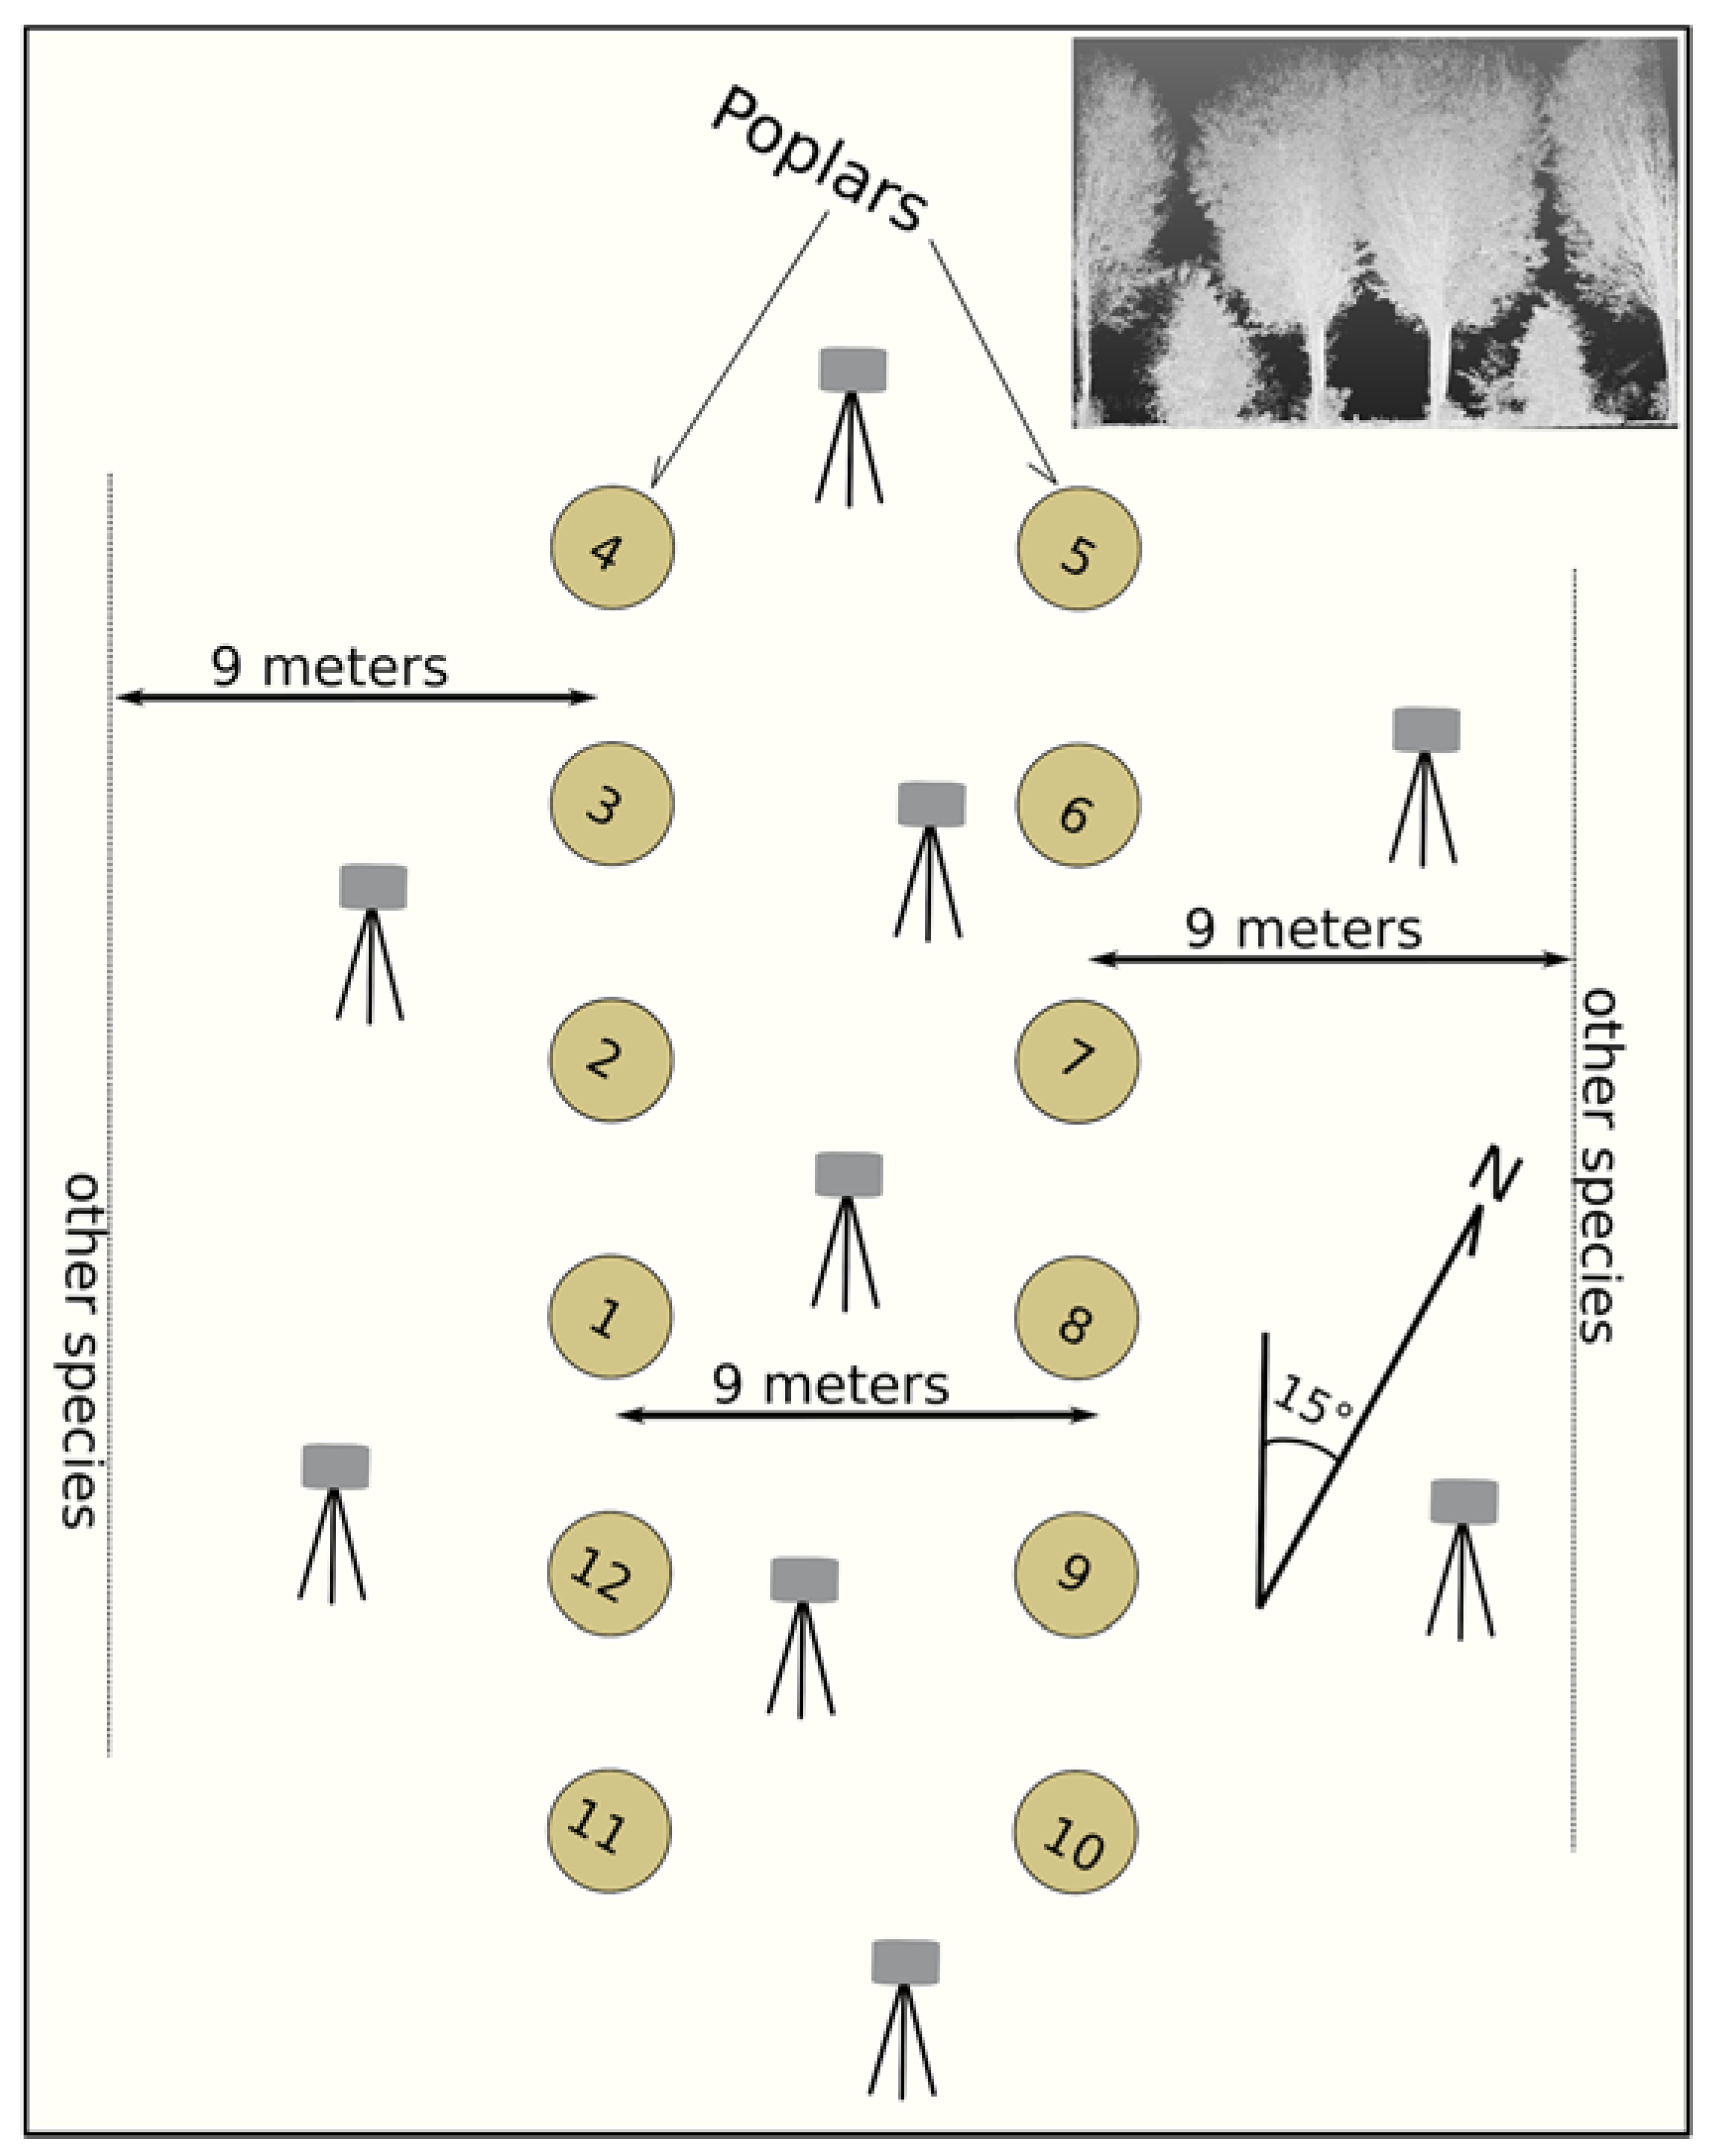
Data were collected in a 10-year-old poplar plantation located in Viadana, Mantova, Northern Italy in January 2017, during leaf-off conditions. As a general layout, the plantation alternated two poplar rows with a row of other valuable species that did not grow as fast as poplar (
Figure 1). Distances between rows were fixed and large (9 m) compared to the distances along the rows. In this direction, distances varied for different parts of the plantation, defining distinct stands. The plantation grew in a flat and uniform terrain and was cultivated a long time ago. No relevant differences were evidenced in the site growth potential of the stands. Data were collected in three neighboring stands, one plot per stand, 12 trees per plot, for a total of 36 trees. The row distances of the plots were 4.0 m (P400), 4.5 m (P450), and 5.0 m (P500).
2.2. Data Collection
International Union of Forest Research Organizations (IUFRO) standard “breast height” diameters (dbh, measured at 1.3 m from the ground) were manually tallied in the field and registered two measures: one along the plantation rows, the second on the orthogonal direction.
TLS data were acquired using a FARO Focus 3D × 130 (FARO Technologies Inc., Lake Mary, FL, USA). The instrument uses a phase-shift-based technology with a maximum range of 120 m and acquires data with an azimuth scan angle of 360°. It collects the x, y, and z coordinates and the intensity of laser returns with a scan ranging noise of ±1 mm [
21]. A complete description of the instrument can be found in [
22].
The TLS device was set to acquire data with medium resolution and quality (1/5 resolution and 4× quality) for a total of 28.2 million pulses per scan. Time elapsed per scan was approximately 3 min. To reduce occlusion from the presence of other obstacles or vegetation and provide sufficient coverage, scanning was repeated in nine positions systematically distributed across the stand. Each of the trees in the stand was directly in front of at least four stations (
Figure 1). Up to 12 white polystyrene registration spheres (14 cm diameter) were placed throughout each plot to aid in digital registration of individual scans, as described in the following section.
2.3. Pre-Processing
For each stand, individual scans were merged using the automatic registration algorithms included in Trimble Real Works
® (TRW) software [
23]. The program joins overlapping redundant points to create one seamless 3D point cloud suited for the analysis. Details of the operation (settings, criteria, and thresholds) performed by the software are not declared nor accessible. The process attained a very low plot-level registration error, and TRW achieved a high-precision scan placement (mean = 2.7 mm, sd = 0.8 mm, max = 3.2 mm).
2.4. Point Cloud Processing
Using TRW tools, each poplar tree stem was visually separated from the rest, i.e., from the ground, the crown, and other non-poplar points. Ground level was clearly detectable since no shrubs were present and herbaceous cover was quite transparent. Boles were cut at the height of 4.5 m since first major branching could appear above that height. Coordinates (x, y, z) of the single bole point cloud were exported as plain-text file, and imported in R [
24].
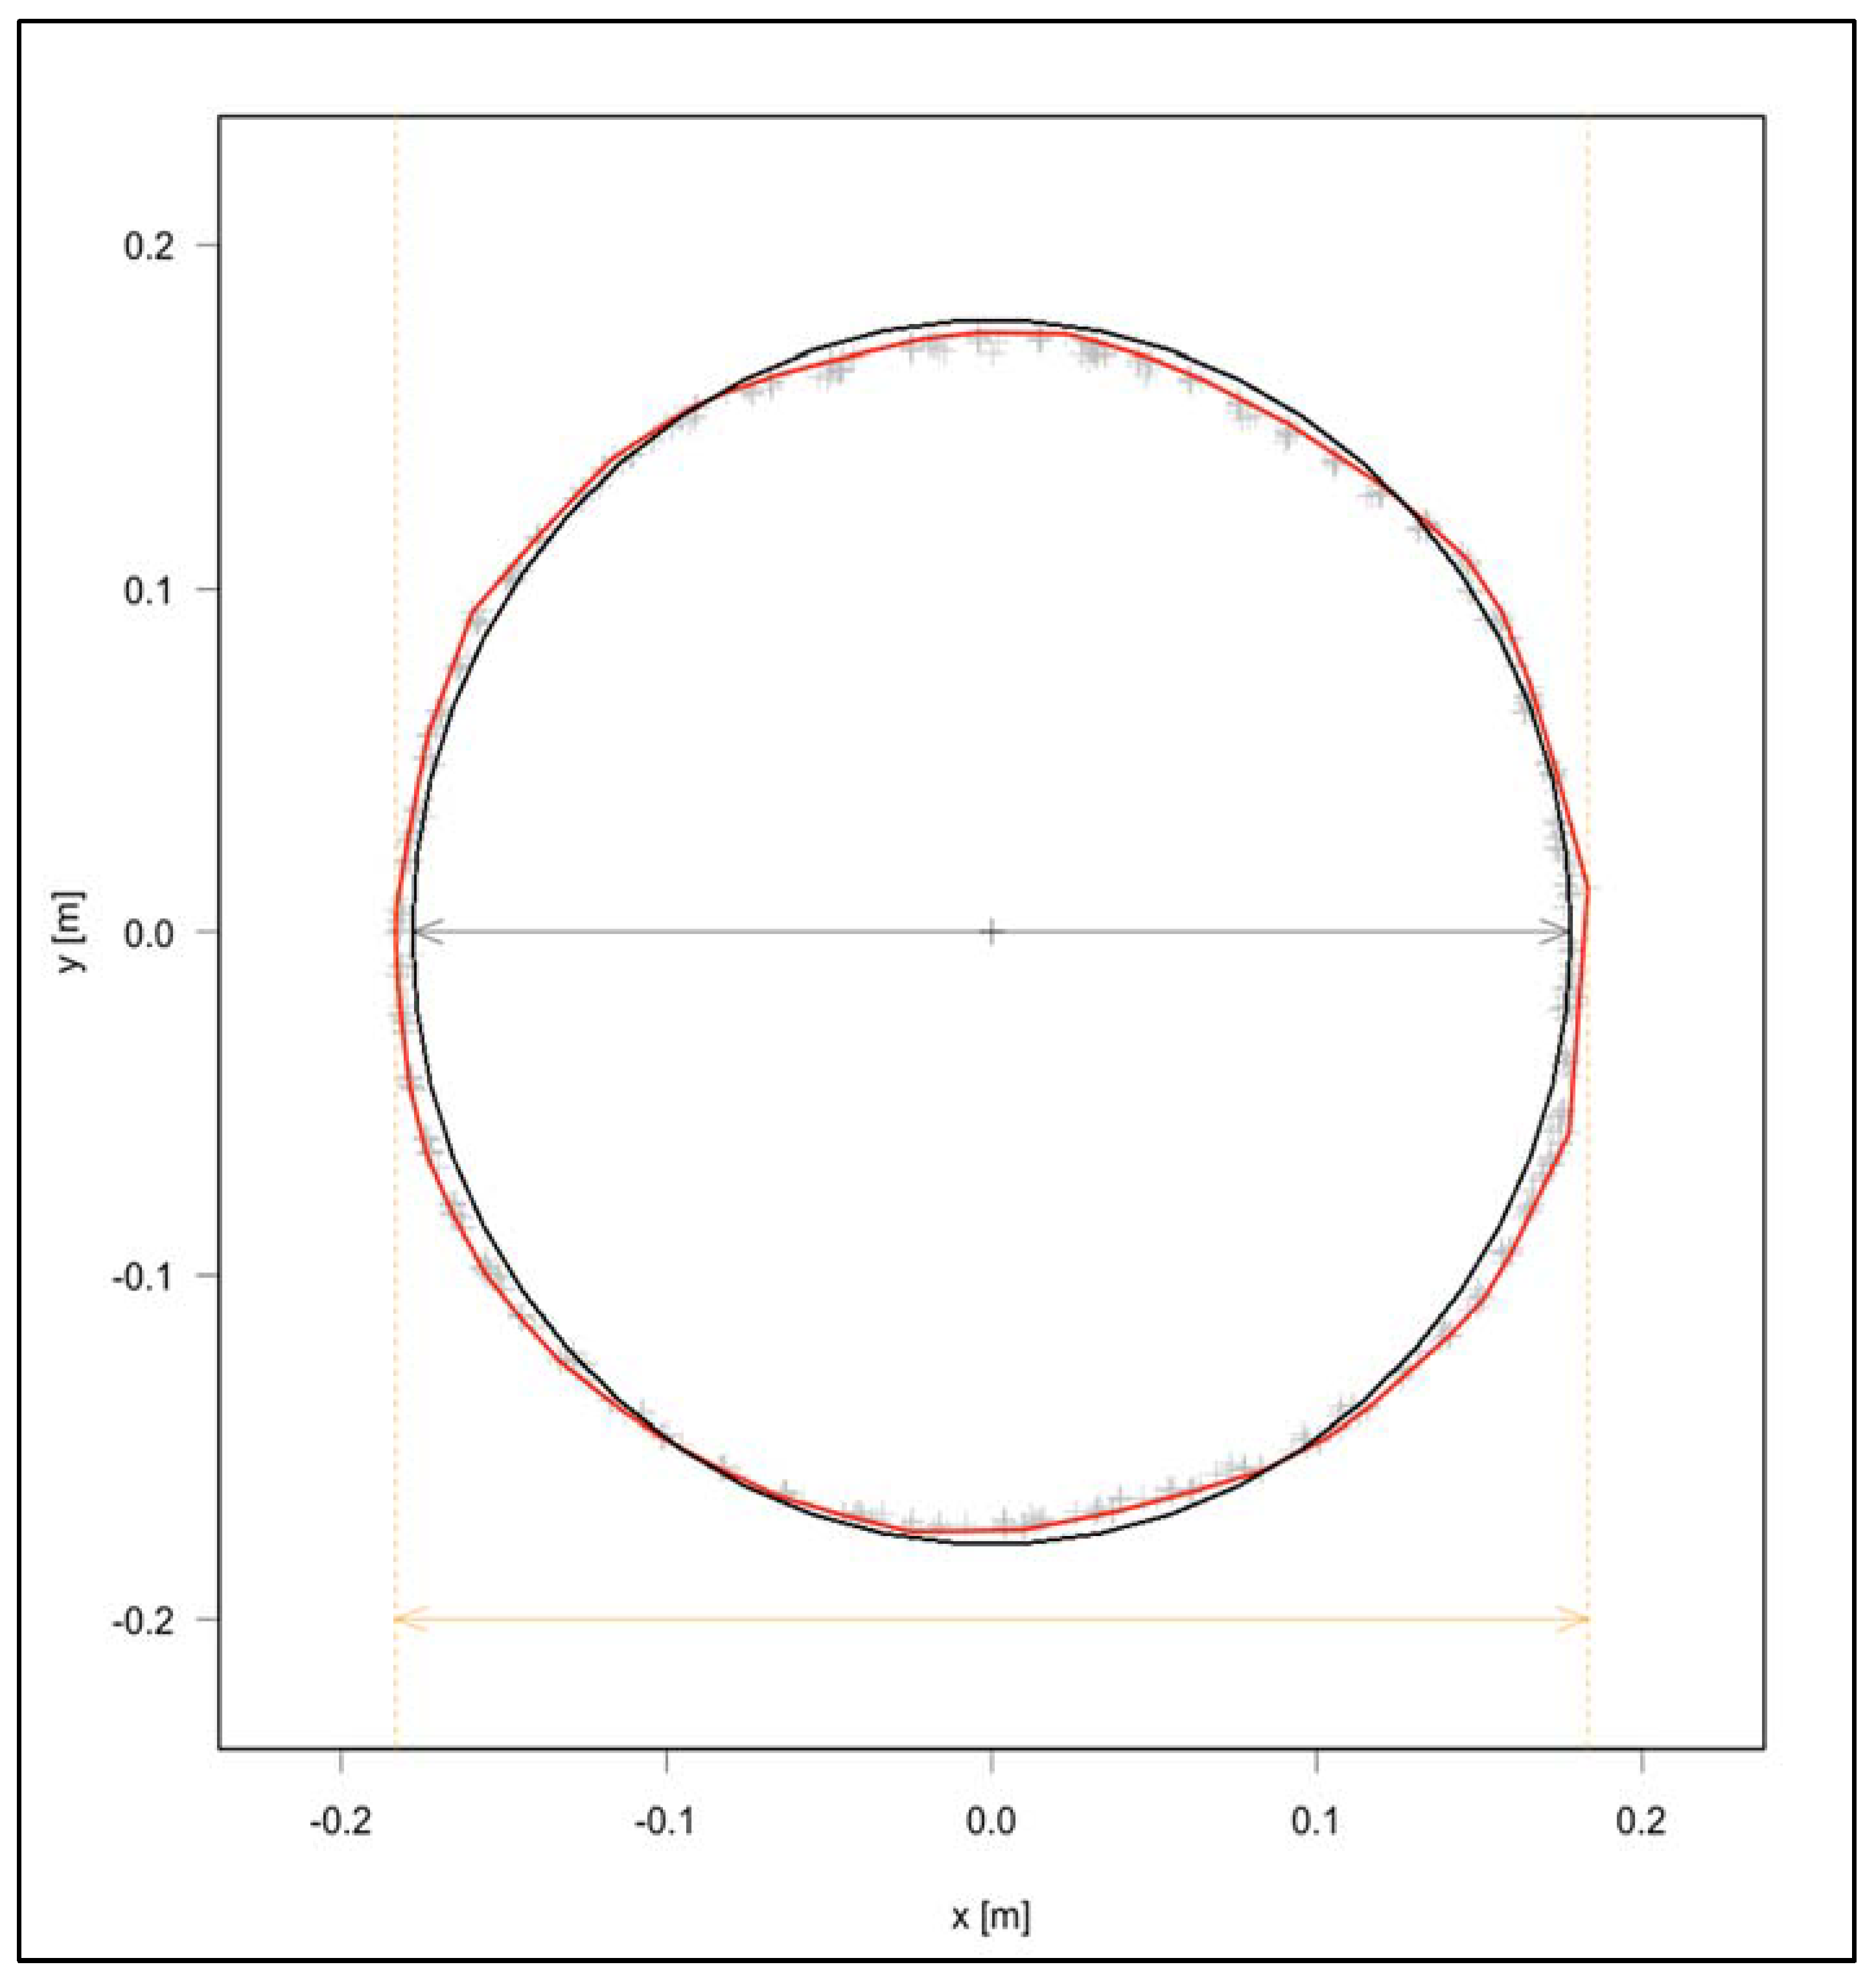
In a second phase, using R, orthogonal cross-sectional diameters were estimated at different heights. The stem was sectioned in 10 cm-thick horizontal slices and, neglecting the z-coordinate, a convex hull was computed for each slice. Considering the plantation row directions and the orthogonal directions, maximum distances between opposite sides of the polygon were considered for the estimation of the two sectional diameters (
Figure 2).
3. Results and Discussion
The analysis considered the lower part of the stems, up to 4.5 m height. The annex included a plot of all estimated profiles. The typical neiloidic shape, due to butt swell, and the transition to the paraboloid shape of the central part of the bole were recognizable in all stems. The convex hull procedure used to estimate diameters implemented a caliper-like approach, evidencing some irregularities such as local protrusions on the side, where the caliper touches the stem, producing a positive bias (
Figure 2). Generally, the bark of these poplars was quite smooth, but some irregularities actually existed. Moreover, since the method did not perform any smoothing computation, outliers, if present, could have relevant impacts on the results.
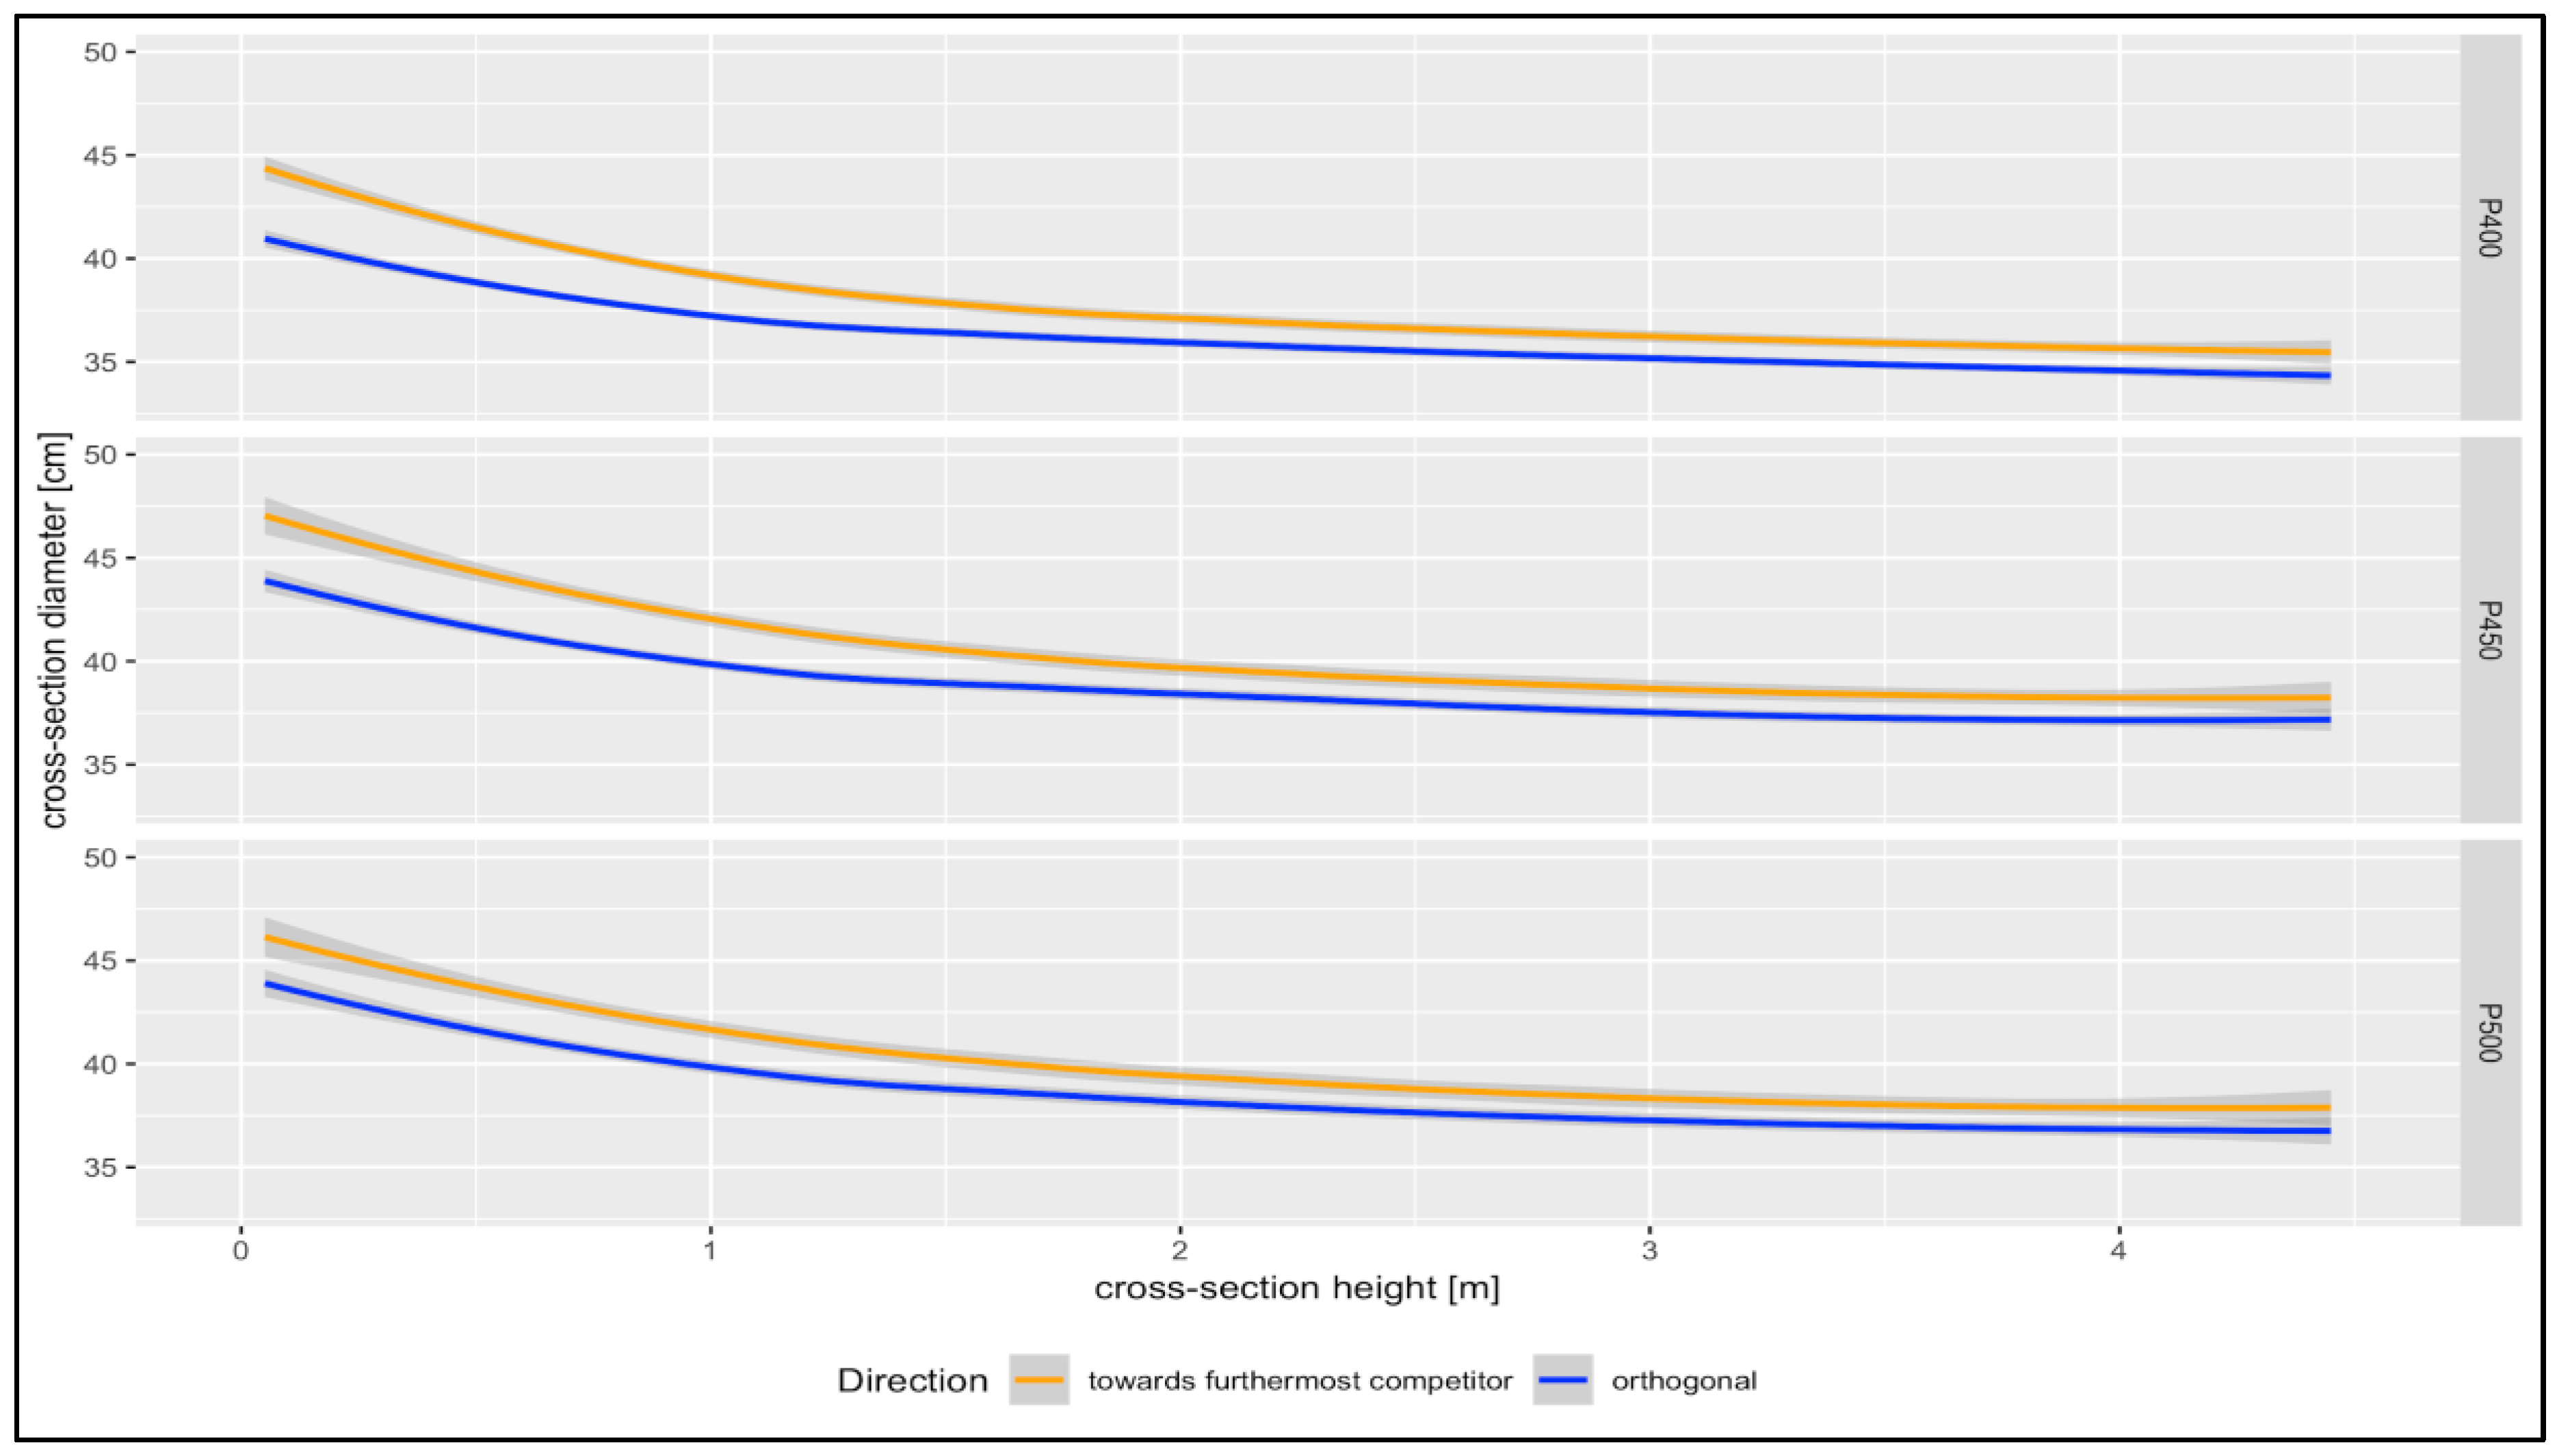
In the observed conditions, poplar stems displayed an elliptical cross-section, evidenced by the differences between the diameters measured in the two orthogonal directions: (i) along the rows, where competition was higher and more variable (4 to 5 m to nearest competitor), and (ii) between rows (lowest competition, 9 m to nearest competitor).
Statistical analysis of breast height diameters quantitatively documented the effects of stand density and anisotropic competition (
Table 1). Average diameter for the 4 m spacing was over 38 cm, where the distance between trees along the row was 4.5 m, the average diameter was 2.6 cm larger, while with 5 m spacing, the average diameter was only just one millimeter larger than with 4.5 m spacing. Moreover, the analysis evidenced that, on average, breast height cross sections were compressed in the row direction; they were about 1.6 cm smaller than the orthogonal ones.
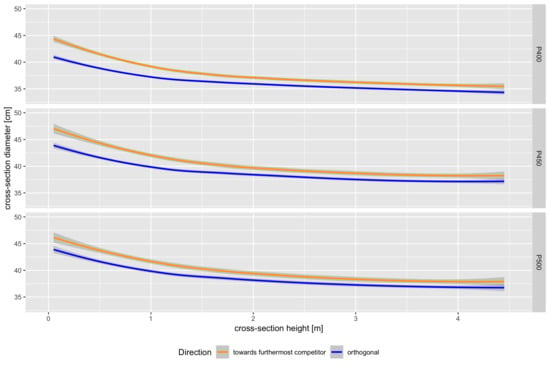
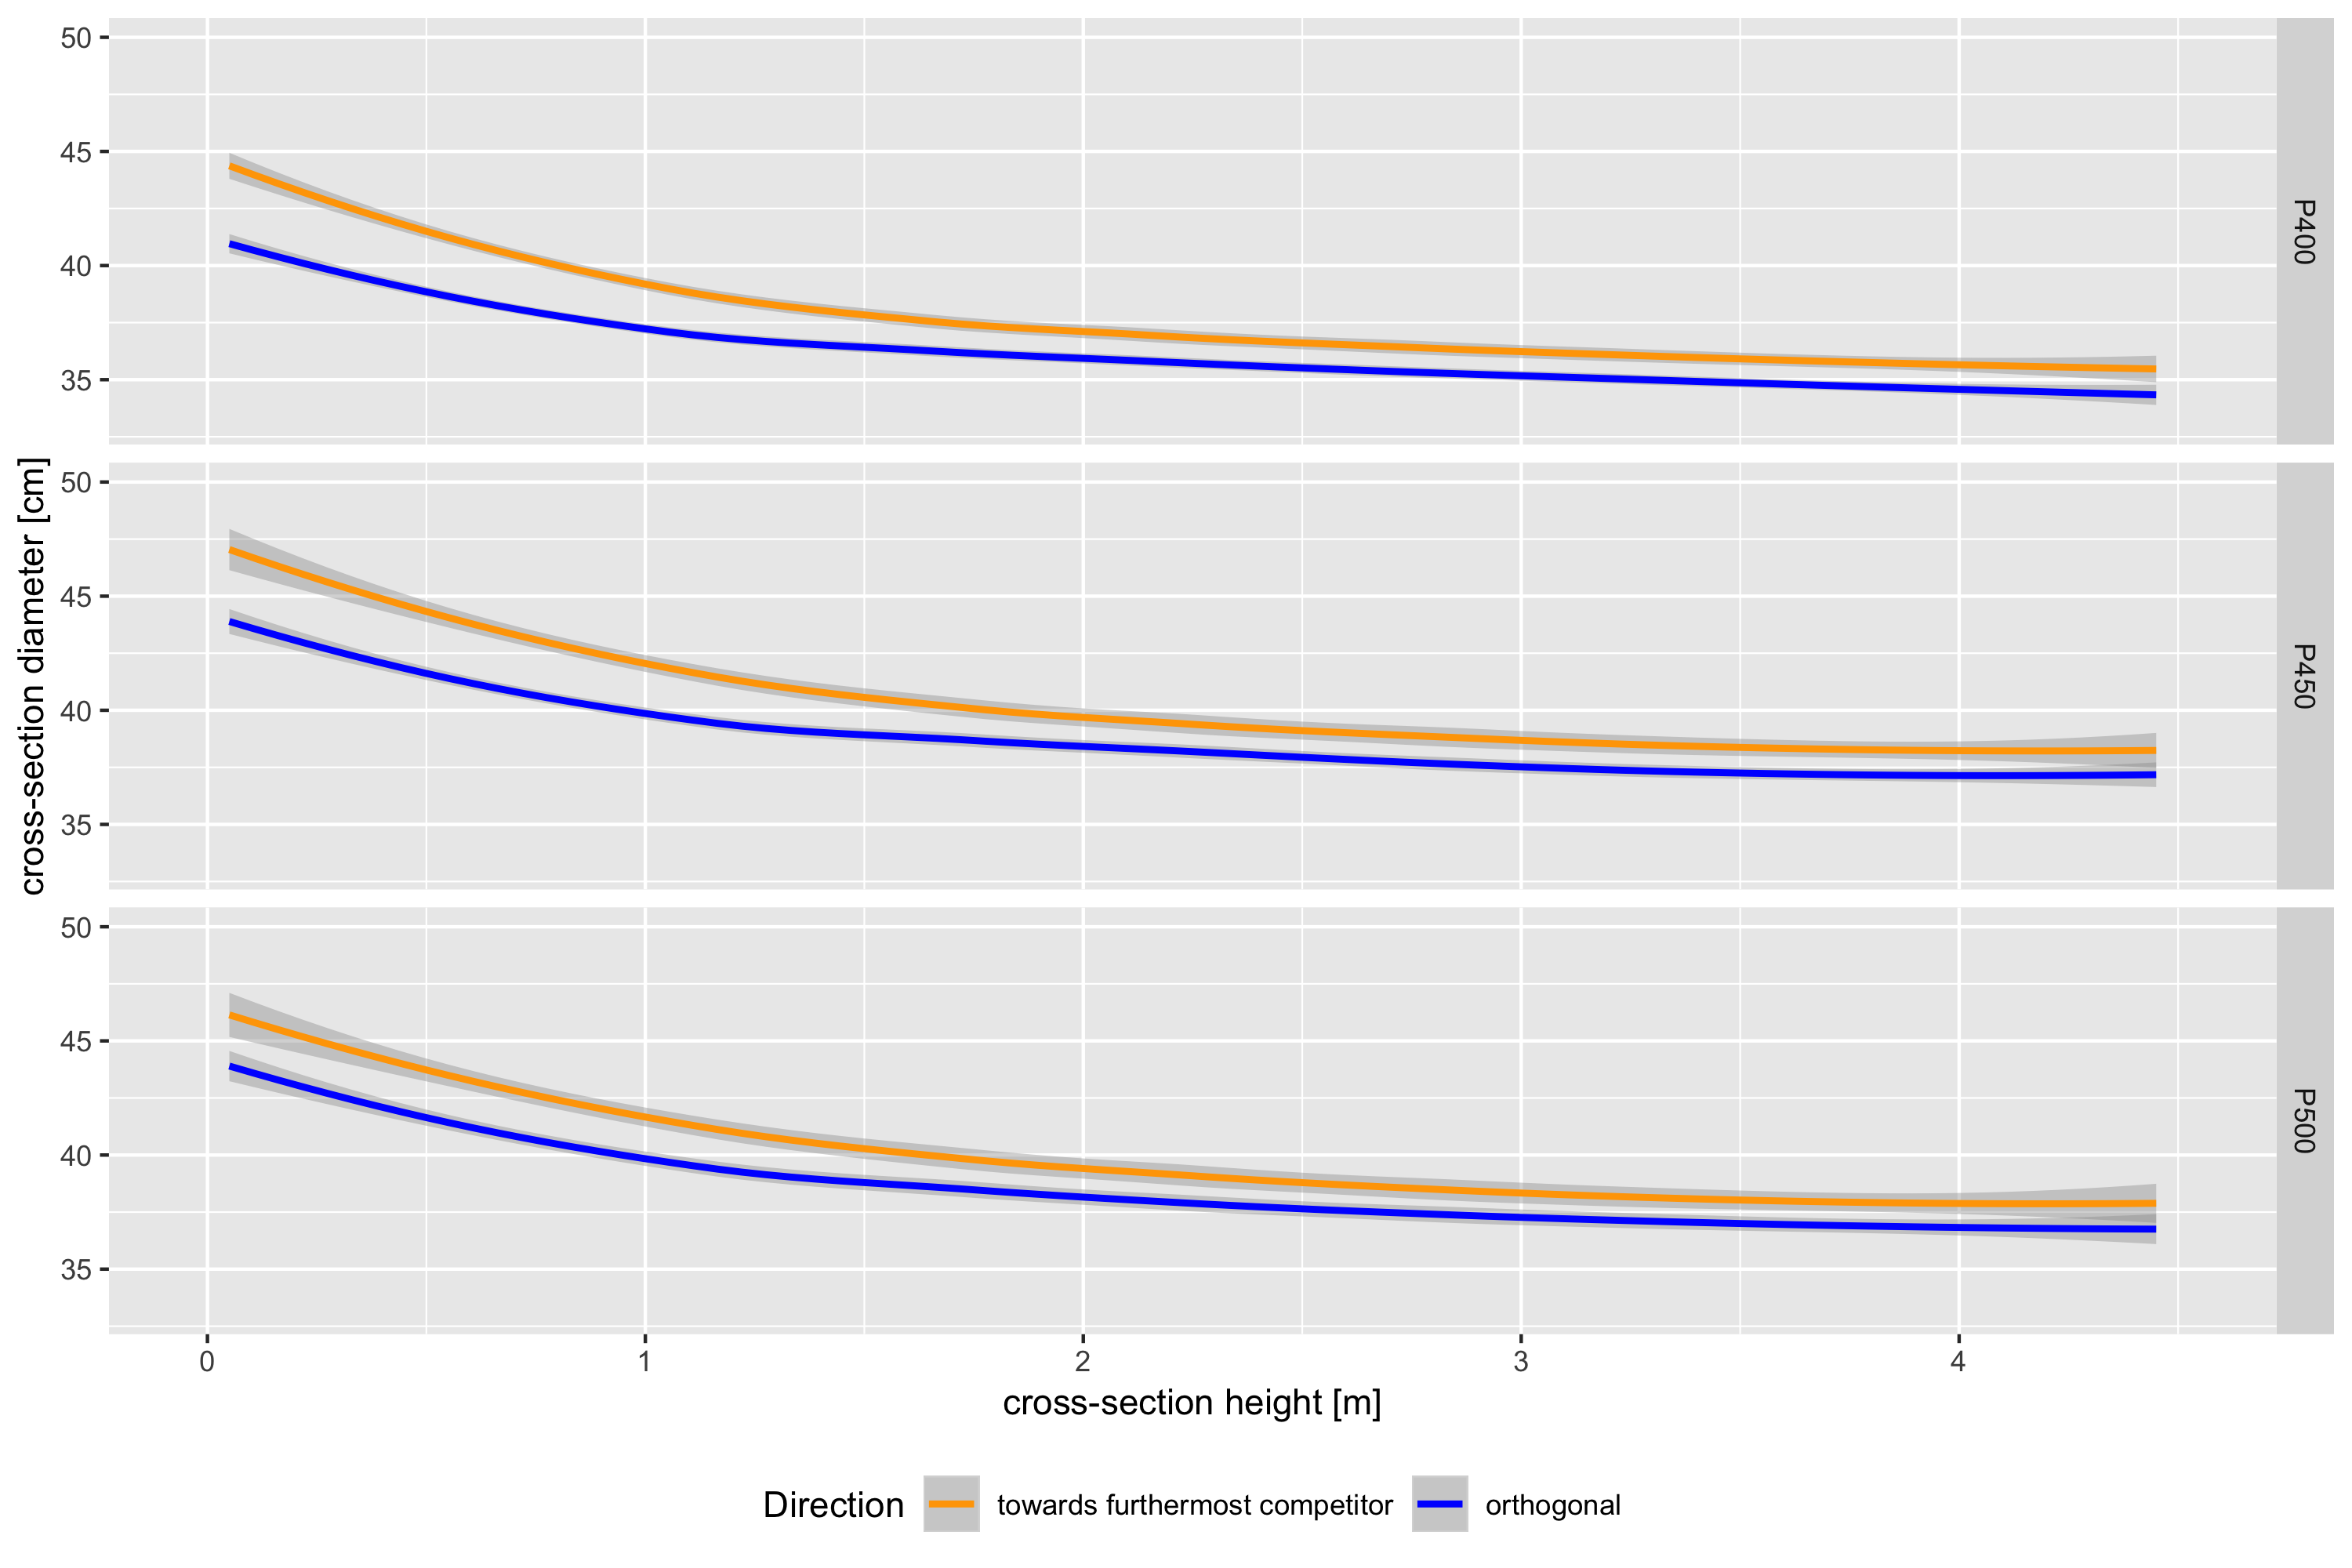
Plots in
Figure 3 portray (‘local regression’) average profiles by treatment, with ‘standard error bounds’, offering a graphical representation of the results of the study. Distance between trees along the row affected the stem size and shape; as distance decreased the stems became thicker and, to some extent, displayed a reduced lateral compression.
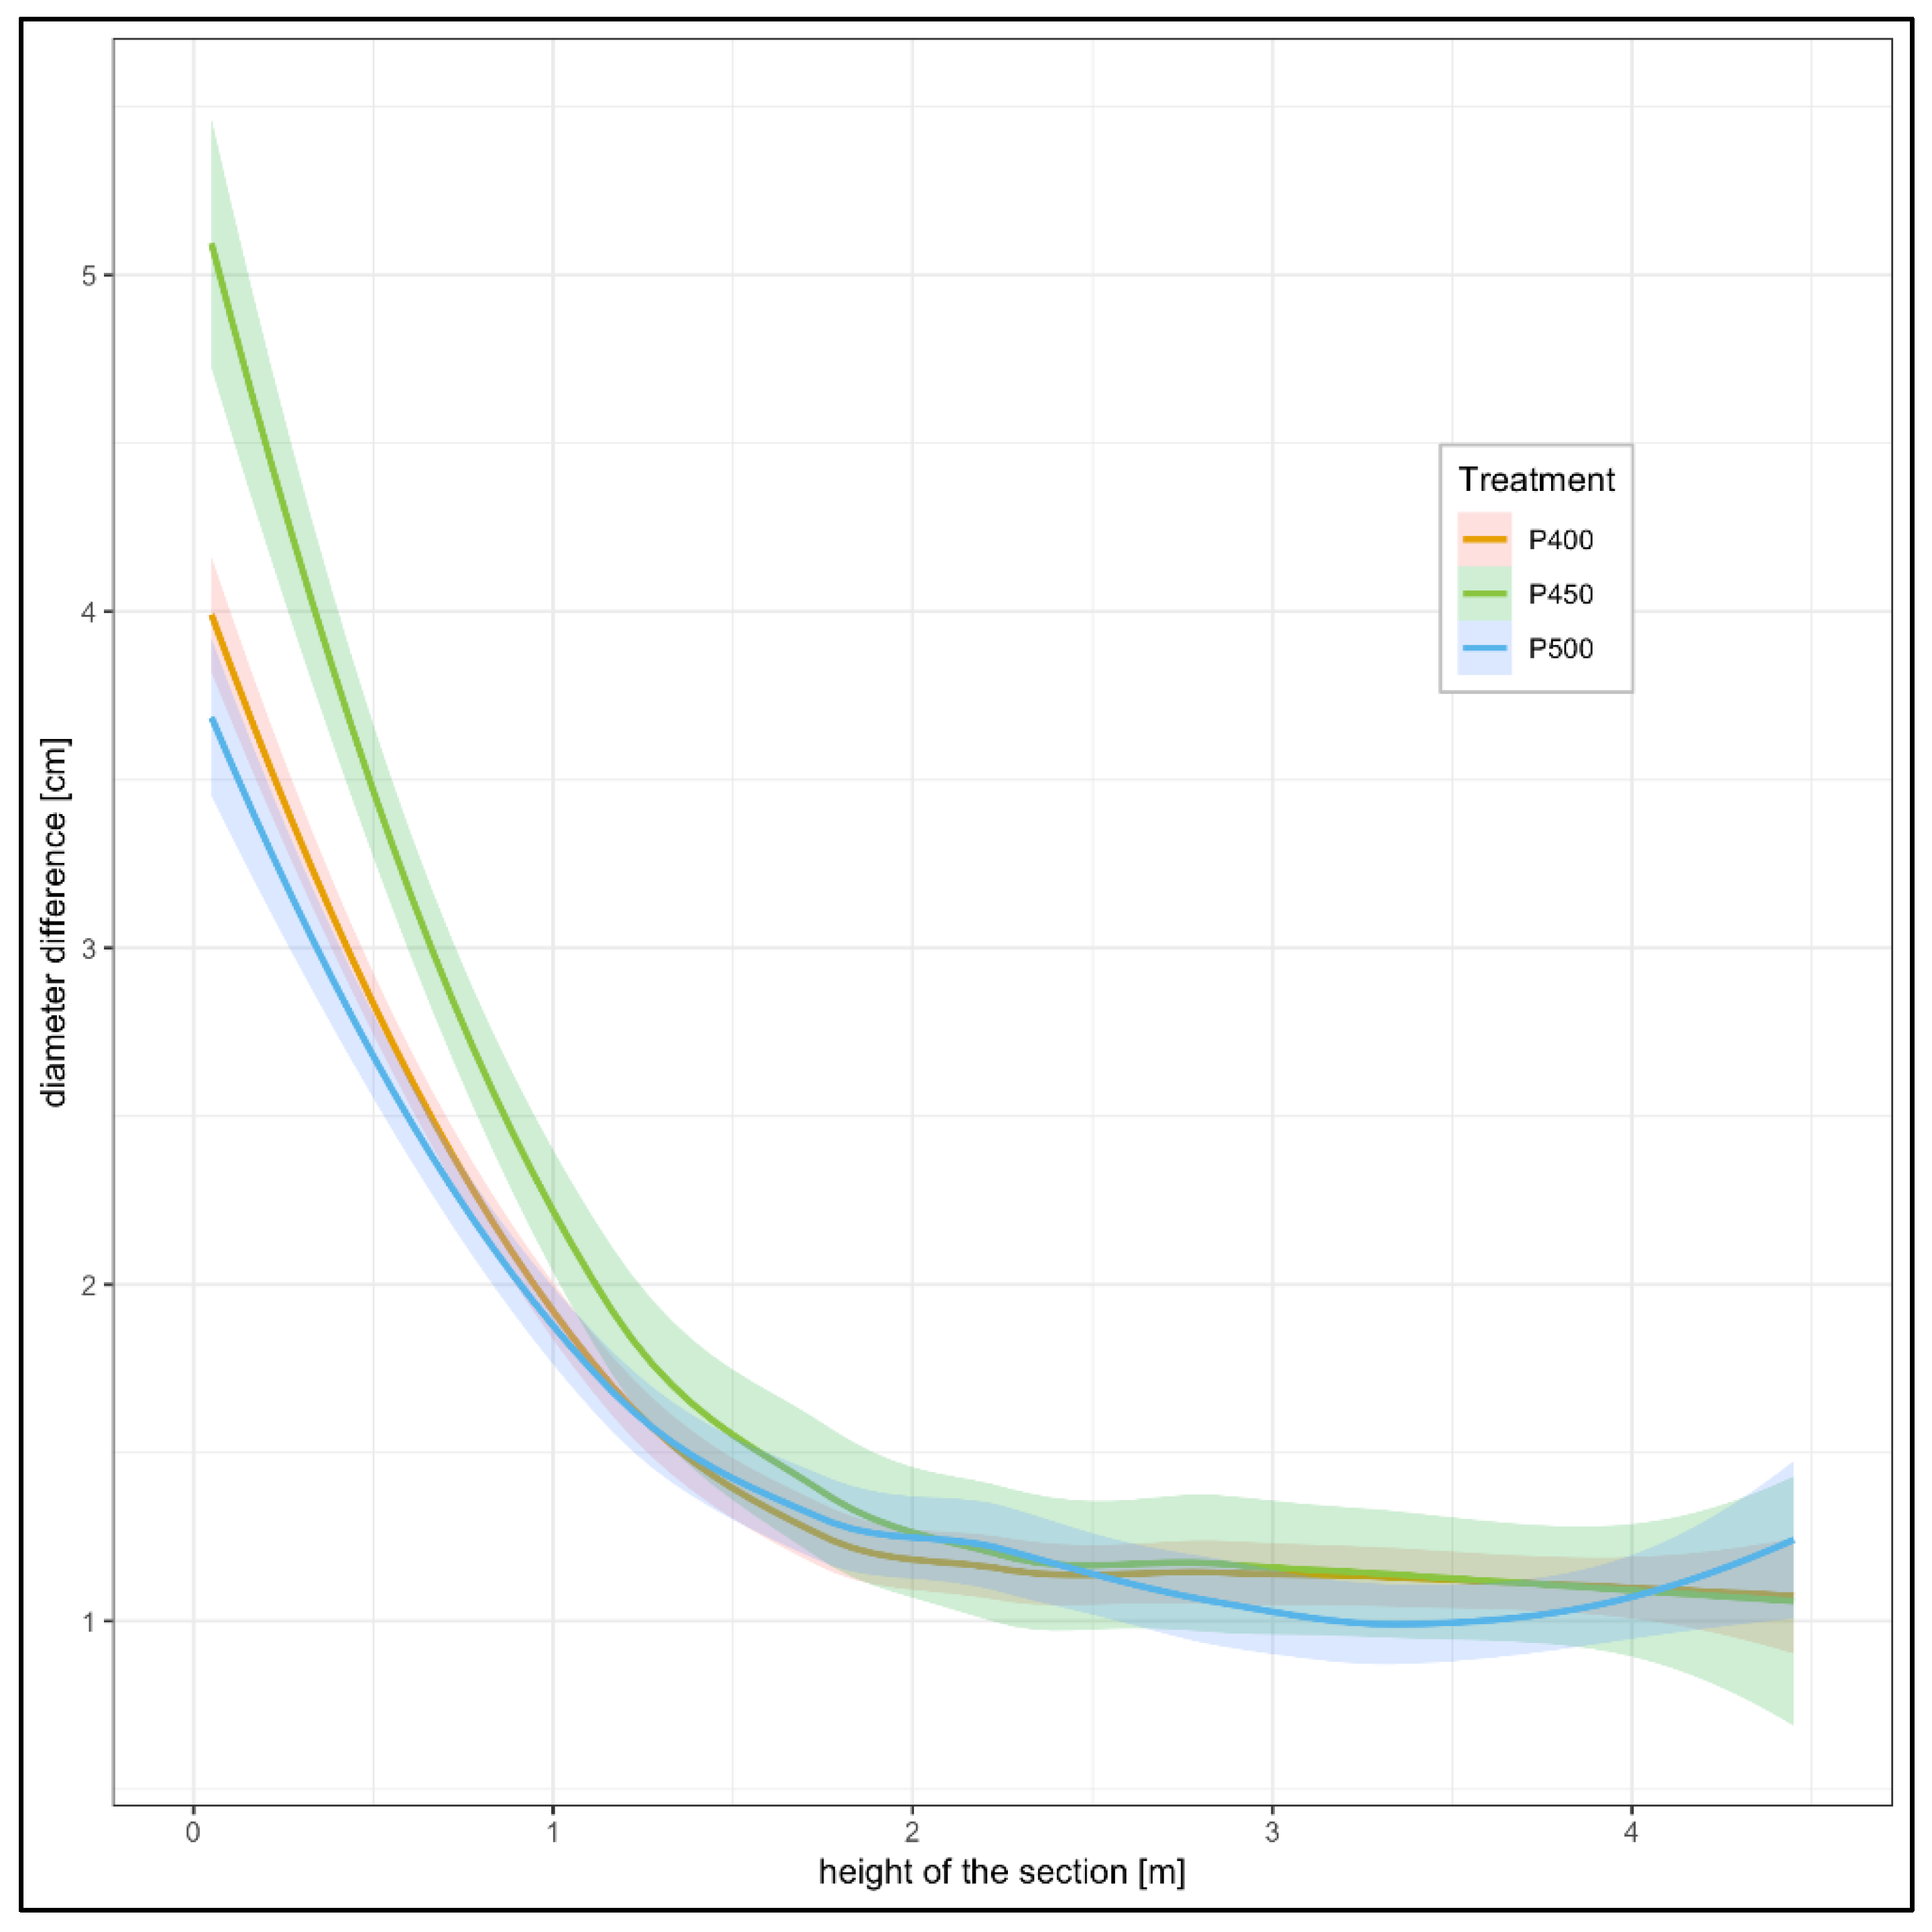
The differences between orthogonal profiles were computed for each treatment. The plot in
Figure 4 displays (‘local regression’) average differences and associated ‘standard error bounds’. Average differences between the two orthogonal diameters were markedly greater only in the lower portion of the stem for tree distances of 4.5 m. As expected, differences were smaller (there was less compression) in trees grown 5 m apart. As a general result, lateral compression of more than 1 cm was detectable above 1.3 m (‘breast height’), but differences in the distance to the nearest competitor had no effect.
The behavior of average differences for trees grown 4 m apart was somewhat confusing: values along row direction were smaller than the orthogonal ones, but the differences were smaller than the ones observed in trees growing 4.5 m apart. This observation was not in line with the general expected path and represents a second limit for the effect of different distances to the nearest competitor. Close inspection of the point clouds did not evidence any visible problem. However, the operational conditions offered by the proprietary software that must be used to process and clean the point clouds (TRW) impose some limitations. For example, manual ground level cut-off cannot be exactly applied in the same way in each of the three plots. Without being noticeable in TRW, a difference in the order of centimeters can occur in the three ground levels obtained for each plot, with a significant impact on the section-height to stem-diameter relation.
Compared to traditional stem-profile measurement methods (limited in the best case to a precision in the order of centimeters), TLS evidently offered much greater precision and accuracy. This advantage has already been exploited for taper function development and calibration (e.g., [
25,
26,
27]), but little attention has been given to finer, yet technologically relevant, characteristics such as lateral compression [
28].
The considered plantation offered the opportunity to start exploiting TLS data in greater detail since the stands present different densities and an anisotropic competition structure. The present study concentrated on the evaluation of lateral compression of stem horizontal cross-sections. Procedures that reliably estimate cross-section contours without pre-establishing its shape (namely assuming a circular shape) have to be better refined. The proposed approximation, as stem point clouds were very carefully ‘cleaned’, uncovered significant effects with no relevant impact on computation complexity. For a more general use, potential impact of outliers would have to be smoothed.
The study quantitatively assessed the effects of plantation density as well as that of the difference in competitor distances placed at orthogonal directions. Diameters differences, on average, were on the order of centimeters, a significant quantity in terms of volume.
4. Conclusions
Optimal management of the wood products supply chain is a very complex objective, even within plantation forestry. The quality of the final products and, hence, timber prices depend on many internal and external factors. Nonetheless, precise evaluation of the shape and of the dimensions of the bole of standing trees is an inevitable step in the production process.
It is well-known, for example, that stand density significantly reduces stem diameters, but no general model is available to forecast the extent of the reduction. For an assessment in terms of total volume production, a more detailed growth analysis is required, but, nonetheless, the effect in terms of value is surely relevant—as dimensions exceed given thresholds, the price for a volume unit can grow up to ten times. The analysis has produced a quantitative evaluation of this effect—having one meter more between trees along the rows increases breast height diameters, on average, almost three centimeters. TLS enables a much more detailed evaluation of stem profiles than what was achievable with previous instruments. The present analysis, considering the bole up to 4.5 m height, has evidenced a significant lateral compression. On average, diameters in the direction facing higher competition are 1.6 cm thinner compared to the orthogonal ones.
Estimated profiles display high variability (see
Figure S1 in Supplementary Materials), extending the analysis to include an even less dense stand and/or economic evaluation could be of interest for further analysis.
The study has set the grounds for the development of ‘competition aware’ taper functions extending the exploitation of TLS data potential. Upon improving the diameter estimation procedure, it will be possible to develop functions that estimate stem tapering (with eccentricity and straightness) considering plantation schema and inter-tree distances.


