1. Introduction
Loss of rainfall on the crowns of deciduous species forms part of the losses of the forest water balances, and, along with losses by evaporation from leaf surface area, determines the volume of moisture flowing under deciduous canopy, the nature of soil moisturization, and calculated characteristics of the flood runoff of small watersheds of forest areas. At the same time, there is no common method of assessing the limiting capacity of precipitation interception by deciduous species. Published results of empirical studies express the limiting retention capacity value depending on the leaf mass, which makes it difficult to use such results in the calculation of elements of forest area water balances. The authors believe that rainfall is both intercepted and evaporated by leaf surfaces, and the retention capacity can be assessed correctly only on the basis of considering relationships to the leaf surface areas of growing stock.
The first known studies of precipitation losses of single showers in forest crowns were conducted in the USA (Horton, 1919) and Switzerland (Buhler, 1891) in the late 19th–early 20th century. The studies were based on parallel observations of the field precipitation gauges installed simultaneously under the middle parts of the crowns of the individual broadleaved species and in the open areas. In 1917–1919, the Horton laboratory determined the values of maximum water retention on the crowns of 12 broadleaved species (Norway maple (Acer platanoides L.), elm (Ulmus spp.), white willow (Salix alba L.), European ash (Fraxinus excelsior L.), beech (Fagus spp.), American linden (Tilia Americana L.), English oak (Quercus robur L.), Eastern hemlock (Tsuga canadensis (L.) Carrière), Scots pine (Pinus sylvestris L.), hickory (Carya spp.), European horse-chestnut (Aesculus hippocastanum L.), apple (Malus spp.), varying from 0.5 to 2.9 mm per projection crown area. It has been established that in the first minutes of rain, 70% to 100% of the precipitation is kept on the crowns (i.e., the proportion of precipitation leaked from the start of the rain to the moment of full water saturation of the tree crowns is 25%–30%). The general Horton model determines the amount of interception as the difference between the amount of precipitation falling on the forest canopy and the amount of moisture retained in the crowns and lost due to evaporation from the leaf surface; following the crown capacity filling, the retained precipitation is lost only due to evaporation, which, in its turn, increases with increases in wind speed.
Several models of the throughfall retention of forest crowns during rain events have been proposed to date (minus the stem flow of water that makes up not more than 10% of the total interception). The most common among them are the Horton, Merrian, Jackson, Gash, and Fan models.
In addition to the authors listed above, Zinke (1967) [
1], Rutter et al. (1971) [
2], and a number of others have contributed to the modeling of precipitation interception by tree crowns. Currently, researchers are trying to develop new models of interception; however, new models are often modifications of the Gash and Rutter models (Muzylo, 2009) [
3].
The common feature for all the models is that they rely on the empirical observations of rainfall under crowns, and not on the results of physical modeling of moisture retention on the lamina. At the same time, the measurements under the crowns per se should always be considered conditional, since the installation point of the precipitation gauges under different parts of the crowns is always chosen subjectively.
The maximum crown retention of individual forest stand species is the most important parameter included in each described model (in the units of water weight on the total leaf surface area or in the values of the water layer per tree projection area). In all the described models, this value is determined as the maximum value based on the parallel observations of precipitation under the canopy of trees of certain species and in open spaces and does not depend on the leaf surface area. In the Gash, Zinke, and Rutter models, this value is defined as the breakpoint of the observed precipitation amounts under the forest canopy and on treeless spaces and is also not related to the characteristics of tree stands. According to Zinke, the maximum moisture retention layer of an individual rainfall event can reach 9 mm for coniferous forest stands. According to Thomas et al. (2012) [
4], the capacity of moisture retention of the American maple (
Acer negundo L.) and yellow birch (
Betula alleghaniensis Britt.) is 1.3–1.5 mm. Thomas and Shannon (2013) [
5] attempted to establish the relationship between the crown-held moisture layer (in terms of the projection area) and the leaf area (
LA) surface of the analyzed wood species upon the independence of the limiting moisture retention value upon the crowns in the known models of the forest appraisal index and the crown development degree. The differences recorded for the interception of precipitation among
Populus tremuloides Michx. (trembling aspen),
Picea engelmannii Parry ex Engelm. (Engelmann spruce), and
Pinus ponderosa Douglas ex C.Lawson (western yellow pine) showed that the conifers (Engelmann spruce and western yellow pine) had larger amounts of water retention (12–14 mm) as compared to the trembling aspen (4 mm) in terms of the projection area of a single tree. According to the research data, it was established that a higher density of plantings corresponds to the lower values of precipitation interception, which may be due to a number of reasons, including the lower development of crowns (a smaller leaf area), the lack of wind-driven rains and incomplete wetting of the crowns, as well as the lower wind speeds, which prevent the crowns from experiencing inward crown soaking.
The physical leaf and needle moisture retention studies were conducted at the end of the 20th century. The moisture retention method, depending on the leaf or needle surface wetting degree and horizontal surface inclination angle, was described by Holder in 2007 [
6]. Holder came to the conclusion that the rainwater is kept in drip form and that the sheet surface’s hydrophobicity degree is determined by the edge angles of the individual drops. If the earlier rainfall interception study values were intended to establish the general patterns of water retention on the crowns and its subsequent evaporation, then the modern studies are more often aimed at studying the precipitation inflow amounts under urban forest canopies (Sanders, 1986) [
7]. Urban forests have been discovered to intercept 10% to 20% of the precipitation amounts for individual heavy downpour events. The modern studies increasingly rely on finding dependencies between the amount of precipitation interception and the leaf surface area for individual tree species (Peng et al., 2000) [
8].
None of these models allow for the value of the limiting moisture retention on the crowns to be determined based on the physical modeling. In the present study, the authors have conducted a set of experimental studies on the artificial creation of droplets on the leaf surfaces of separate branches in order to determine the maximum weight of the retained water and calculate the leaf surface area of the analyzed samples, as well as to determine the droplet size limits and their contact angles and determine the empirical dependencies between the leaf surface area of individual species and the maximum retained water weight.
Issues related to quantitative estimations of rainfall retention capacity of deciduous stock have been studied since the beginning of the 20th century. Precipitation retention and further evaporation values are directly related to the dimensions and properties of moistening surfaces [
9]. Tikhonov et al., who artificially sprinkled certain species of deciduous plants (and parts thereof), concluded that crinkled or villous leaves intercept significantly larger volumes of moisture as compared to smooth or waxy leaves. So, for example, 1 kg of bird cherry tree (
Prunus padus L.), birch (
Betula alleghaniensis Britt.), and aspen (
Populus tremula L.) leaves retain 0.70–0.98 kg of water, elder (
Sambucus nigra L.) leaves—0.4–0.5 kg, and herbaceous plants leaves—no more than 0.3–0.4 kg of water per 1 kg of mass. The above values are related to leaf mass and rather conditionally reflect relations between the mass of the retained moisture and actual surface of the moistened surface. Roughly, the retention mass specified by A.I. Subbotin corresponds to 1.5–2.0 mm of rainfall depth for bird cherry tree, birch, and aspen.
Precipitation is not only retained by the crowns of trees, but also, moistened wood. According to experimental data obtained by V. Lokhov, a unit of trunk surface retains 3–5 times more moisture than an equal-sized leaf surface. However, a forest phytocenosis canopy is mainly represented by assimilatory bodies (leaves, needles), the surface of which is at least 10–15 times larger than the area of phytocenosis itself; therefore, the share of trunk interception is insignificant. According to research by Molchanov and Smirnov [
10] and Rahmanov [
11], the volume of rainfall spent on one-time moistening of canopy (retention capacity) for deciduous species (beech, birch, aspen) amounts to 1–3 mm; in some cases, the volume may be up to 4–5 mm in hardwoods. Grass phytocenoses have remarkably lower retention capacity. For example, only 0.68 mm of moisture was spent on the one-time moistening of grassy mass of fertile meadow with a leaf surface area 22 times higher than the area of such meadow.
Despite the fact that rainfall capacity retention is generally described for certain tree species, there are currently no estimates for a range of tree species in certain natural zones, including forests of the Middle Ural. This fact makes it difficult to prepare adequate estimates of water balance elements of forest watersheds.
In this study, the authors made empirical estimates of the canopy storage capacity of deciduous species based on unit of leaf surface and interpreted the obtained results in calculating the limiting mass of moisture retention by a single tree and rainfall depth under crowns of studied species.
2. Research Subjects and Methodology
Research was conducted within the territory of the integrated landscape reserve “Preduralye” located on the border of Kishertsky and Kungursky Districts of Perm Krai, where the academic and scientific facility of Perm State National Research University is located. This reserve was first botanically described by P.I. Krotov in 1885. Kungursky reservation was established in 1943 and the integrated reserve was subsequently established in 1952. The reserve falls within the broad-leaved-fir-spruce forests subzone directly adjacent to the Kungur forest steppe subzone. The reserve area combines boreal and taiga, nemoral elements of broad-leaved forests, steppe, meadow steppe, mountain steppe, water and coastal complexes. There are 16 vegetation formations in the reserve. In terms of landscape and typology, Preduralye reserve combines several area types: floodplain, terrace above floodplain, riverine, valley and gulley, upland.
This study considered seven species of deciduous trees in the period of maximum development of green mass (end of June 2018) growing in all areas, save for floodplain and upland: elm (Ulmus spp.), Norway maple (Acer platanoides), mountain ash (Sorbus aucuparia L.), bird cherry tree (Prunus padus L.), birch (Betula pendula Roth), aspen (Populus tremula L.), linden (Tilia cordata Mill.); one coniferous species—larch (Larix) (for comparison). Branches used for sprinkling and determination of moisture mass were selected from different parts of the crowns of analyzed tree species. The analyzed trees were 40 to 60 years old, with heights between 16 and 20 m, and projection crown areas between 20 to 28 m. The study used 10–20 branches from each tree. The total mass of outward branches stemming from tree trunk and including all sprouts ranged from 0.4 to 5.0 kg.
Measured branches were suspended by ropes through constructed wooden brackets mounted on the surface of scales. Scales were mounted on an outboard bracket attached to the balcony of a laboratory building, above the ground. Each of the suspended analyzed branches were positioned in a manner as close to the natural positions of growing branches as possible (
Figure 1). Natural branch mass in dry weather was determined within the accuracy of up to 5 g (instrumental error of the used scales). Then a branch was artificially sprinkled with a watering can until stabilization of maximum mass, which was recorded in a field log. The total maximum volume of moisture retained by leaves and branches of an analyzed specimen was determined on the basis of the difference between the masses of the branch under dry and moistened conditions.
Ten leaves were selected from different parts of the analyzed branch for further statistical calculations of areas, masses, vein lengths, etc. The leaves were put on a white paper and scanned in order to preserve the original leaf area and structure in computer form for further calculations. Then the leaves were removed from the branch, their number was counted manually, and the branch was weighed again. Experiments conducted on dry and moist branches without leaves evidenced that water retention by branches was insignificant (up to 5%–10% of its total mass). Mass of leaves was determined as the difference between the mass of a branch with laminae and without them. The same branches were used for the analysis, without foliage, which were dried during the day in natural conditions.
Despite the fact that measurements were conducted by means of platform scales (JSC “Ves-SERVICE”, St. Petersburg, Russia) (accuracy class III, OKP 42 7451, GOST 29329-92) with factory accuracy of measurements ±5 g, the accuracy of measurements of mass of water on the leaves at the moment of maximum water retention did not exceed 11.1% (average value of 4.3%). The use of this type of scale was predetermined by the nature of the research and the large masses of the analyzed branch samples.
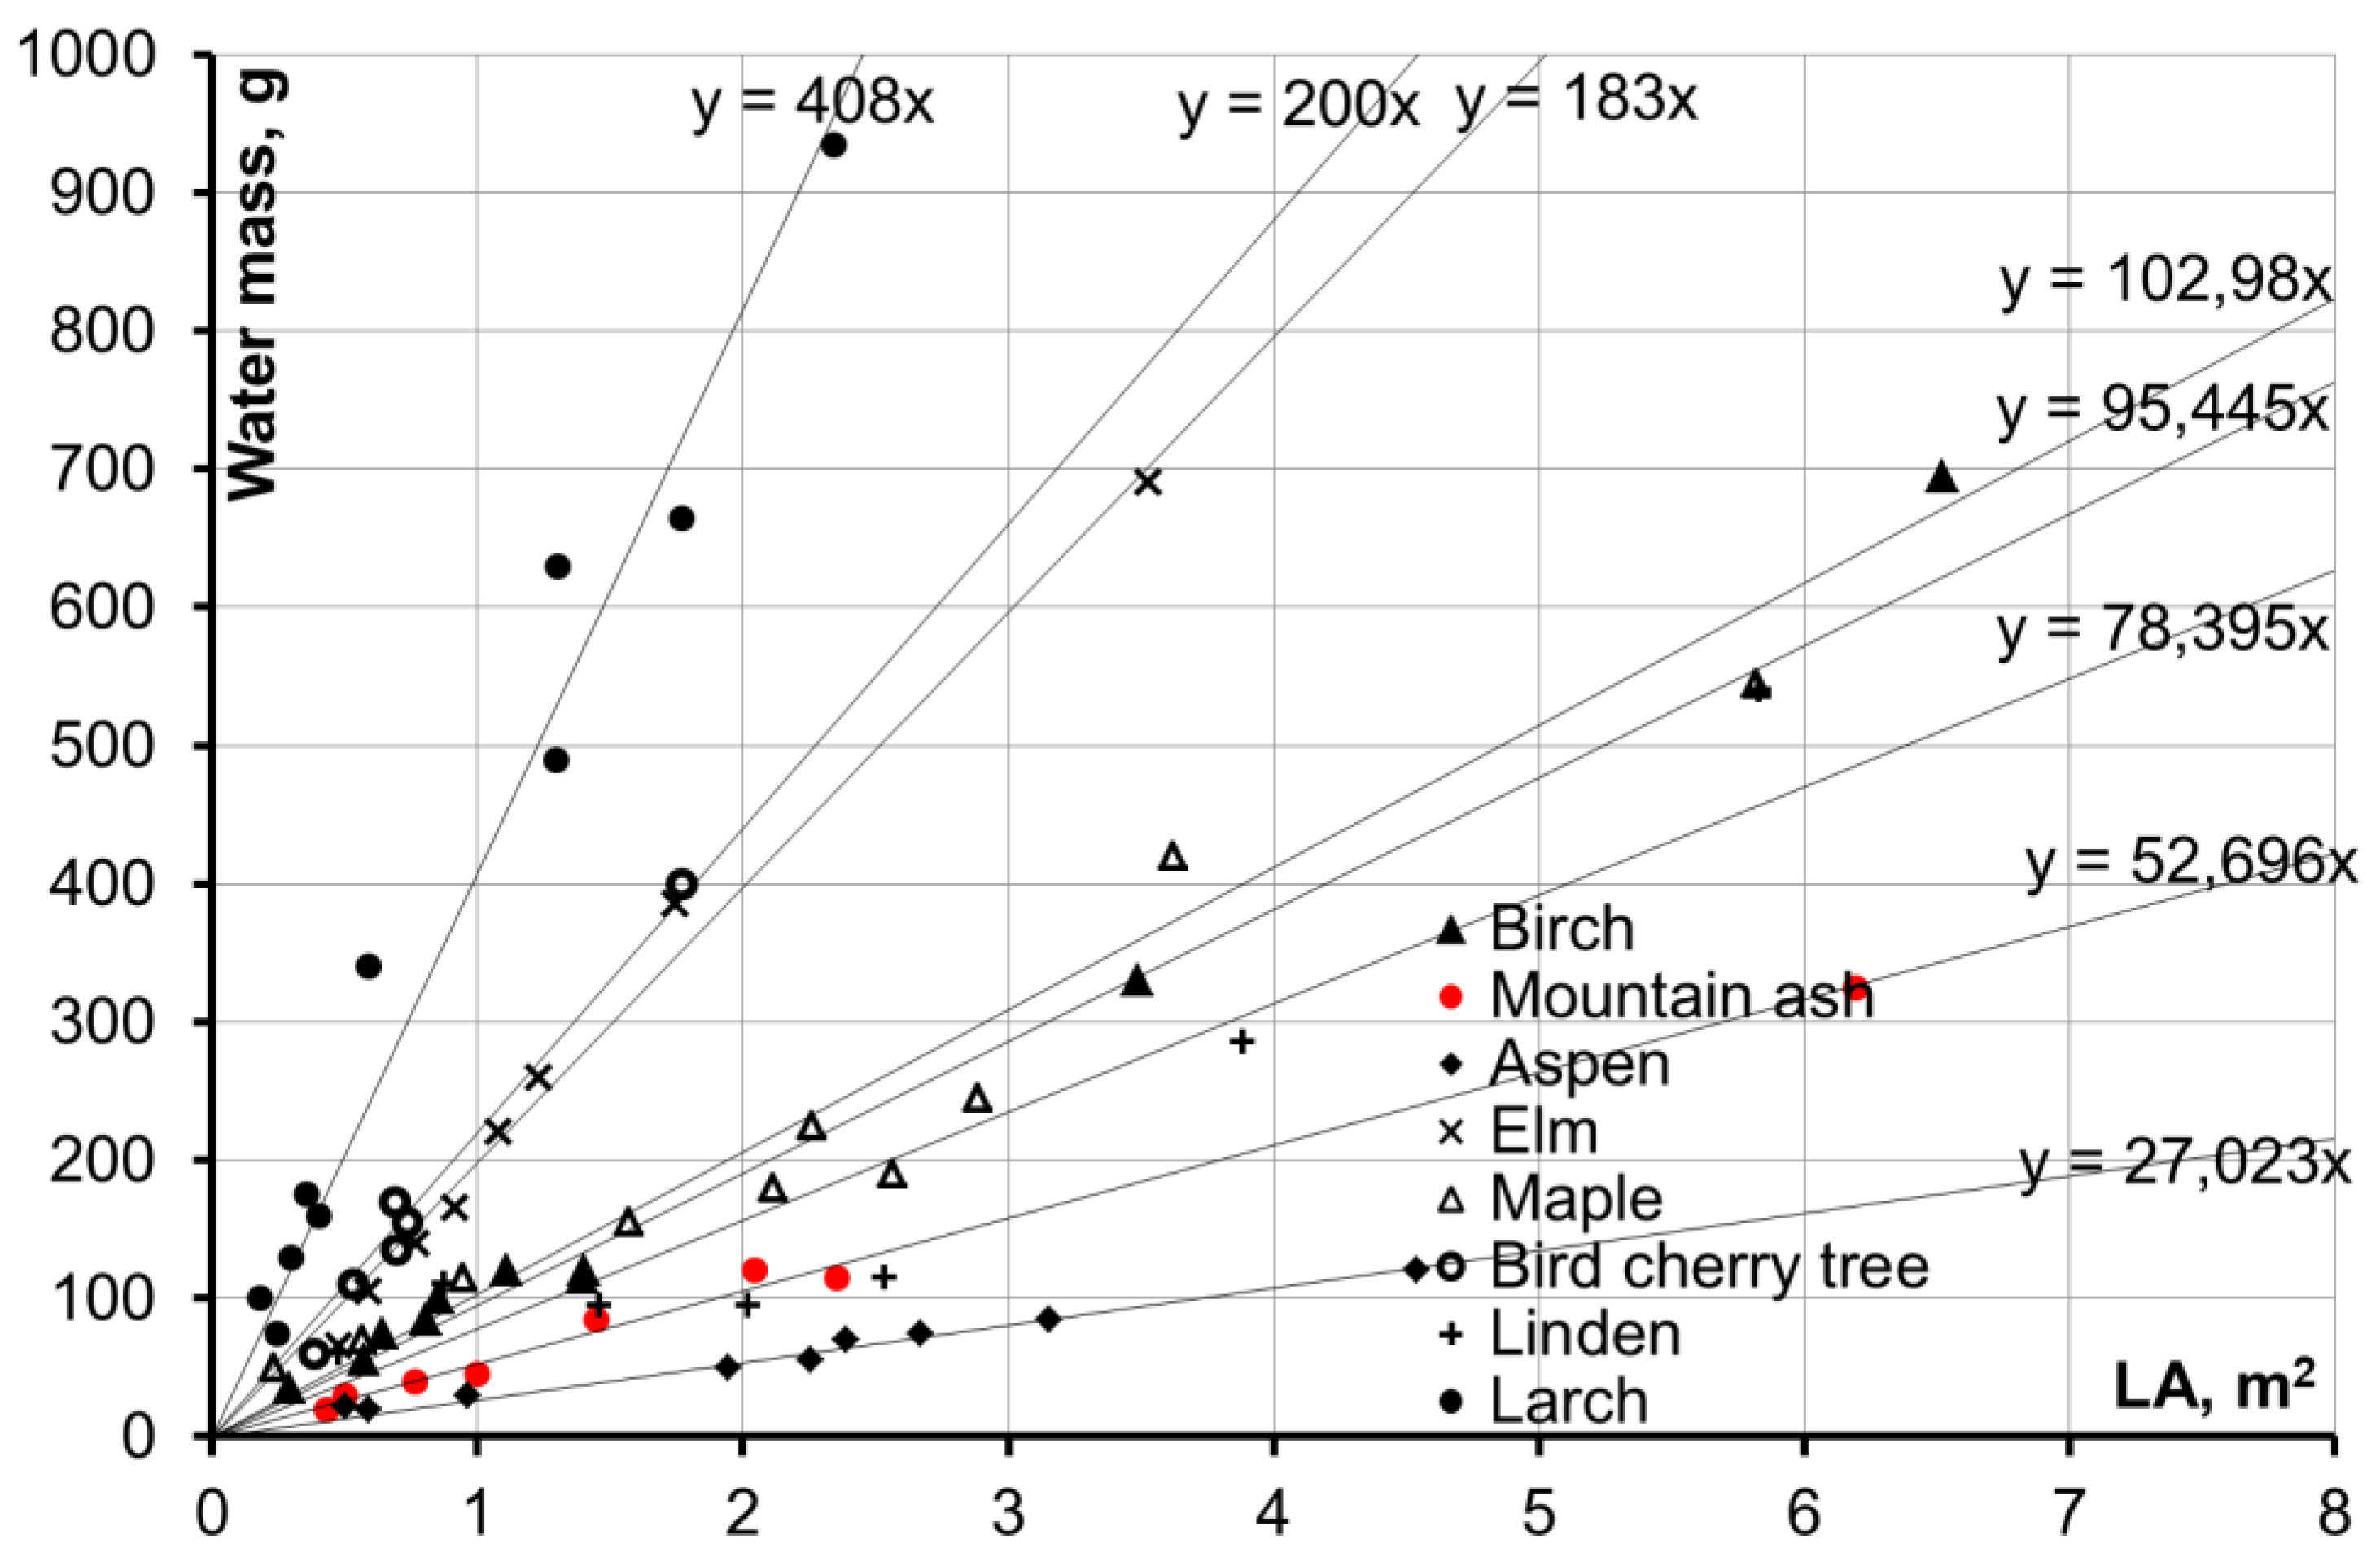
Relationships between the leaf surface area of analyzed species (
LA, m
2) and maximum water retention mass were determined on the basis of experimental results (
Figure 2). Leaf surface area was calculated as follows: the number of leaves on an analyzed branch was calculated manually, then a sample of 50 leaves from different parts of the branch was formed, and the average leaf area in the analyzed sample was calculated (it was carried out by means of large-scale scanning of leaves; the calculation was made by graphics programs, with errors not exceeding 2 mm
2). The statistical error in determining the leaf surface area on a branch did not exceed 3%.
Since rainfall value that does not fall under forest canopy is the most important indicator when using empirical results, in terms of maximum rainfall interception by crowns of deciduous stock, determination of the following biometrical values of coniferous stock and individual trees is of significant importance:
mass of leaves per 1 ha (F1, tons per hectare);
leaf surface area (total area of one-side surface of needles or leaves) (LA, ha);
number and average dimensions of leaves and needles.
Forest quality class, trunk timber resources, and degree of closeness are taken into account.
Values of phytomass and trunk timber resources are established on the basis of yield tables, full stock biological productivity tables [
12], results of field forest surveys, experimental data [
13,
14], the surface areas of forest plants, as well as satellite images and large-scale maps. Forest quality class is determined on the basis of field studies (information about height and age of growing stock), according to Orlov tables. Forest quality class (bonitet forests (him. Bonität, from Lat. Bonitas—good quality)) is determined by taxation characteristics of forest plantations, which determines the potential productivity of plantings and the growth rate of trees. It is determined by using Orlov’s table, which considers the average age and the average height of the stand in the plantation and its origin (seed or shoots). The higher the bonitet class of forests, the higher the height and value of the plantings at a given age. Bonitet class is visually determined by the distance between the whorls (more than 50 cm: bonitet class 1; less than 50 cm: bonitet class 2). Plantations in bonitet class II or above are called high bonitet, III–IV—middle bonitet, V—low bonitet, VA and Vб—unproductive. In Russia there are five classes of forest quality class.
Leaf area index (
LAI, ha/ha) is determined on the basis of databases and empirical dependencies revealed by A.I. Utkin et al. [
14] on the basis of phytomass value (
F1, t/ha) of deciduous species as
LAI =
f (
F1).
Total leaf surface area of forested plot (
LA, ha) is determined as follows:
where
S is forest plot area (ha),
k is degree of closeness (in fractions of unit).
3. Theory
A number of models with different accuracy levels are used today worldwide for the calculation of the values of the precipitation interception by forest stand crowns.
The Horton model (Horton, 1919) [
15] determines the amount of precipitation interception as the sum of losses during precipitation (crown filling losses) and post-rain losses (evaporation). The total value of losses can be determined by the following formula:
where
I means the precipitation interception loss (mm);
t means the precipitation duration (min);
S means the maximum interception capacity (mm); and
E means the evaporation rate of intercepted water (mm/min).
The Horton model established the foundation for conceptual methods of determining the rain retention of forest crowns.
The Merriam model (Thomas, Shannon, 2013) [
5] uses an exponential equation that takes into account the decrease in the interception volume with the increasing precipitation due to the maximum crown capacity filling. The loss value can be determined by the following formula:
where
I means the precipitation interception loss (mm);
t means the precipitation duration (min);
S means the maximum interception capacity (mm);
E means the evaporation rate of intercepted water (mm/min); and
P means the amount of precipitation in open areas (mm).
The empirical Jackson model (Thomas, Shannon, 2013) [
5] is described with the following equation:
where
a,
b,
c are empirical coefficients, indirectly taking into account the evaporation losses, leaf surface area of rocks, and tree stand characteristics.
The Gash model (Gash, 1995) [
16,
17] is the model of precipitation interception that is most commonly used today. The main parameters of the model are: the amount of precipitation during the time from the start of the rain on open areas (
PG, mm) and under the forest crown canopy (
Pn, mm), maximum amount of water in crowns (
S, mm), under forest crown canopy precipitation proportion (
p), average evaporation rate/average rainfall intensity ratio (
E/
R) at the calculated time point, and the crown saturation point (
PS, mm). The Gash model makes the following assumptions: (1) the whole crown is saturated simultaneously during a shower, and (2) the crowns are dry before the shower. Based on the regression dependencies
Pn =
f (
PG) constructed separately for the rainfall period
t1, where
PG (
t1) <
PS, and
t2, where
PG (
t2·
P2) exceeds the
PS crown interception value, the required value of the maximum precipitation interception by the
PS crowns is determined as the point of intersection of these regression dependencies.
Until the crown saturation, the
Pn and
PG ratio is defined as:
where
p means the proportion of dome-passing precipitation until dome saturation (the value changes from 0 at the start of the rainfall to 0.7–0.8 by the time of full crown saturation).
Before saturation, it is assumed that the intercepted water either remains in or evaporates from the crowns in the drip and film form. After saturation, the intercepted sediments will both penetrate under the forest canopy and evaporate. The passage of precipitation to below the forest canopy after saturation is calculated as:
The maximum crown moisture retention amount
S (maximum crown saturation) is defined as:
where
IW means the amount of precipitation that is lost due to in-dome wetting evaporation:
The
IW use may lead to re-evaluation of evaporation (Link et al., 2004) [
18], since it assumes that the crown is fully saturated during a rainfall. In fact, during the shower, the crowns can only be partially saturated, and the retained moisture amount is less than the saturation point
PS value.
The Gash model is the most commonly used rainfall capture model in North America. The Gash model quantifies the amount of
In interception for the three phases of rain: pre-saturation, full saturation, and post-rain forest canopy drying. The canopy can hold an amount of water equal to
S. The precipitation captured by the forest canopy subsequently passes through the forest canopy in the form of droplets or is lost to evaporation. However, this model is limited by the following assumptions set forth by Gash: (1) showers are the individual events separated by adequately long rainless periods sufficient for the crowns to dry completely; (2) meteorological conditions are constant throughout the shower; (3) there is no precipitation under the forest canopy until the maximum saturation of the crowns. Obviously, assumptions 2 and 3 are often violated during a rainstorm, since meteorological conditions like wind speed, precipitation intensity, and dew point deficiency can change, and wind speeds can vary significantly and shake the crowns, thus causing drop fall during wetting. Nevertheless, the Gash model proved to be quite reliable in the prediction of losses in the rainfall interception (Gash et al., 1995) [
16]. Additionally, the amount of precipitation under the forest canopy in the Gash model is determined empirically by the installation of precipitation gauges under the crowns, which brings subjectivity to the measurement results, since the distribution of under crown penetration moisture is rather variable as it moves away from the tree trunk and requires the use of specialized integrated plants instead of precise precipitation measuring devices.
The Fan model (Fan et al., 2007) [
19] describes the interception of precipitation (
I, mm) during a rainstorm from zero to reaching the maximum water saturation of the stands (
S, mm) depending on the tree species, leaf area, and fullness of the plantation (Fan et al., 2007) [
19]. The model is described by the following equation:
where
P means the open area precipitation (mm),
S means the maximum moisture retention layer by tree crowns per unit area (mm),
β means the empirical forest stand individual coefficient reflecting the homogeneity of the leaf surface area of individual species (and factoring in variables such as tree age, species composition, and forest appraisal index), and
α means the forest stand ratio (crown projection area/forested territory area coefficient ratio).
The maximum water saturation of crowns is established as a break point for intercepting losses by the crowns depending on the amount of precipitation during a single shower
In =
f (
P), where the precipitation amount is
P > 51.5 mm, and the
In value of losses stabilizes at 19.4 mm per 1-hectare area covered with red Chinese pine (
Pinus tabuliformis L.). The
In interception limit value corresponds to the maximum retention capacity of the crowns (
S). The
S value is set individually for each species. The Fan model does not take into account the loss of moisture due to evaporation from the leaf surface, and therefore, the loss values are overestimated by 20%–50% as compared to the experimentally observed values (Shujun et al., 2011) [
17].
The Gash and Fan models should be considered as the most modern methods of calculating the rainfall interception by forest stands. According to Shujun et al. (2011) [
17], with the actual interception of precipitation of a single rainfall in the amount of 33.2% of the total precipitation amount, the Gash model calculations provide the interception value at 35.9% and the Fan model calculations provide the interception value at 53.6%.
As has been noted above, the limiting moisture retention value in all the models is determined by the empirical rainfall observations under the crowns of tree species and in open spaces. None of the models use objective values for the droplet weight on the lamina and leaf surface area, which the authors of the present study have managed to obtain through artificial sprinkling of the branches, the weighing of the branches, and the leaf area count that followed.
4. Results and Discussions
Measurements of geometrical dimensions of laminae on branches of analyzed species were performed by way of sampling from the total leaf mass of the analyzed branches. Laminae were scanned, and all measurements were performed by means of computer programs. Area and vein length (primary and secondary) were measured for each leaf, whereupon statistical sample parameters were calculated. Normal distribution (Gauss distribution) was used for calculations (
Table 1).
As can be seen, the correlations are of good quality (with correlation coefficients greater than 0.9 in all cases) with groupings into separate bundles (
Figure 2). Dependency analysis allowed for an assumption to be made that specific water retention (first multiplier, which shows the mass of water per 1 m
2 of the leaf surface) is determined by the type of venation of leaves of the analyzed species. Leaves with pinnate and netted venation have larger retention values as compared to leaves with pinnate and edge venation.
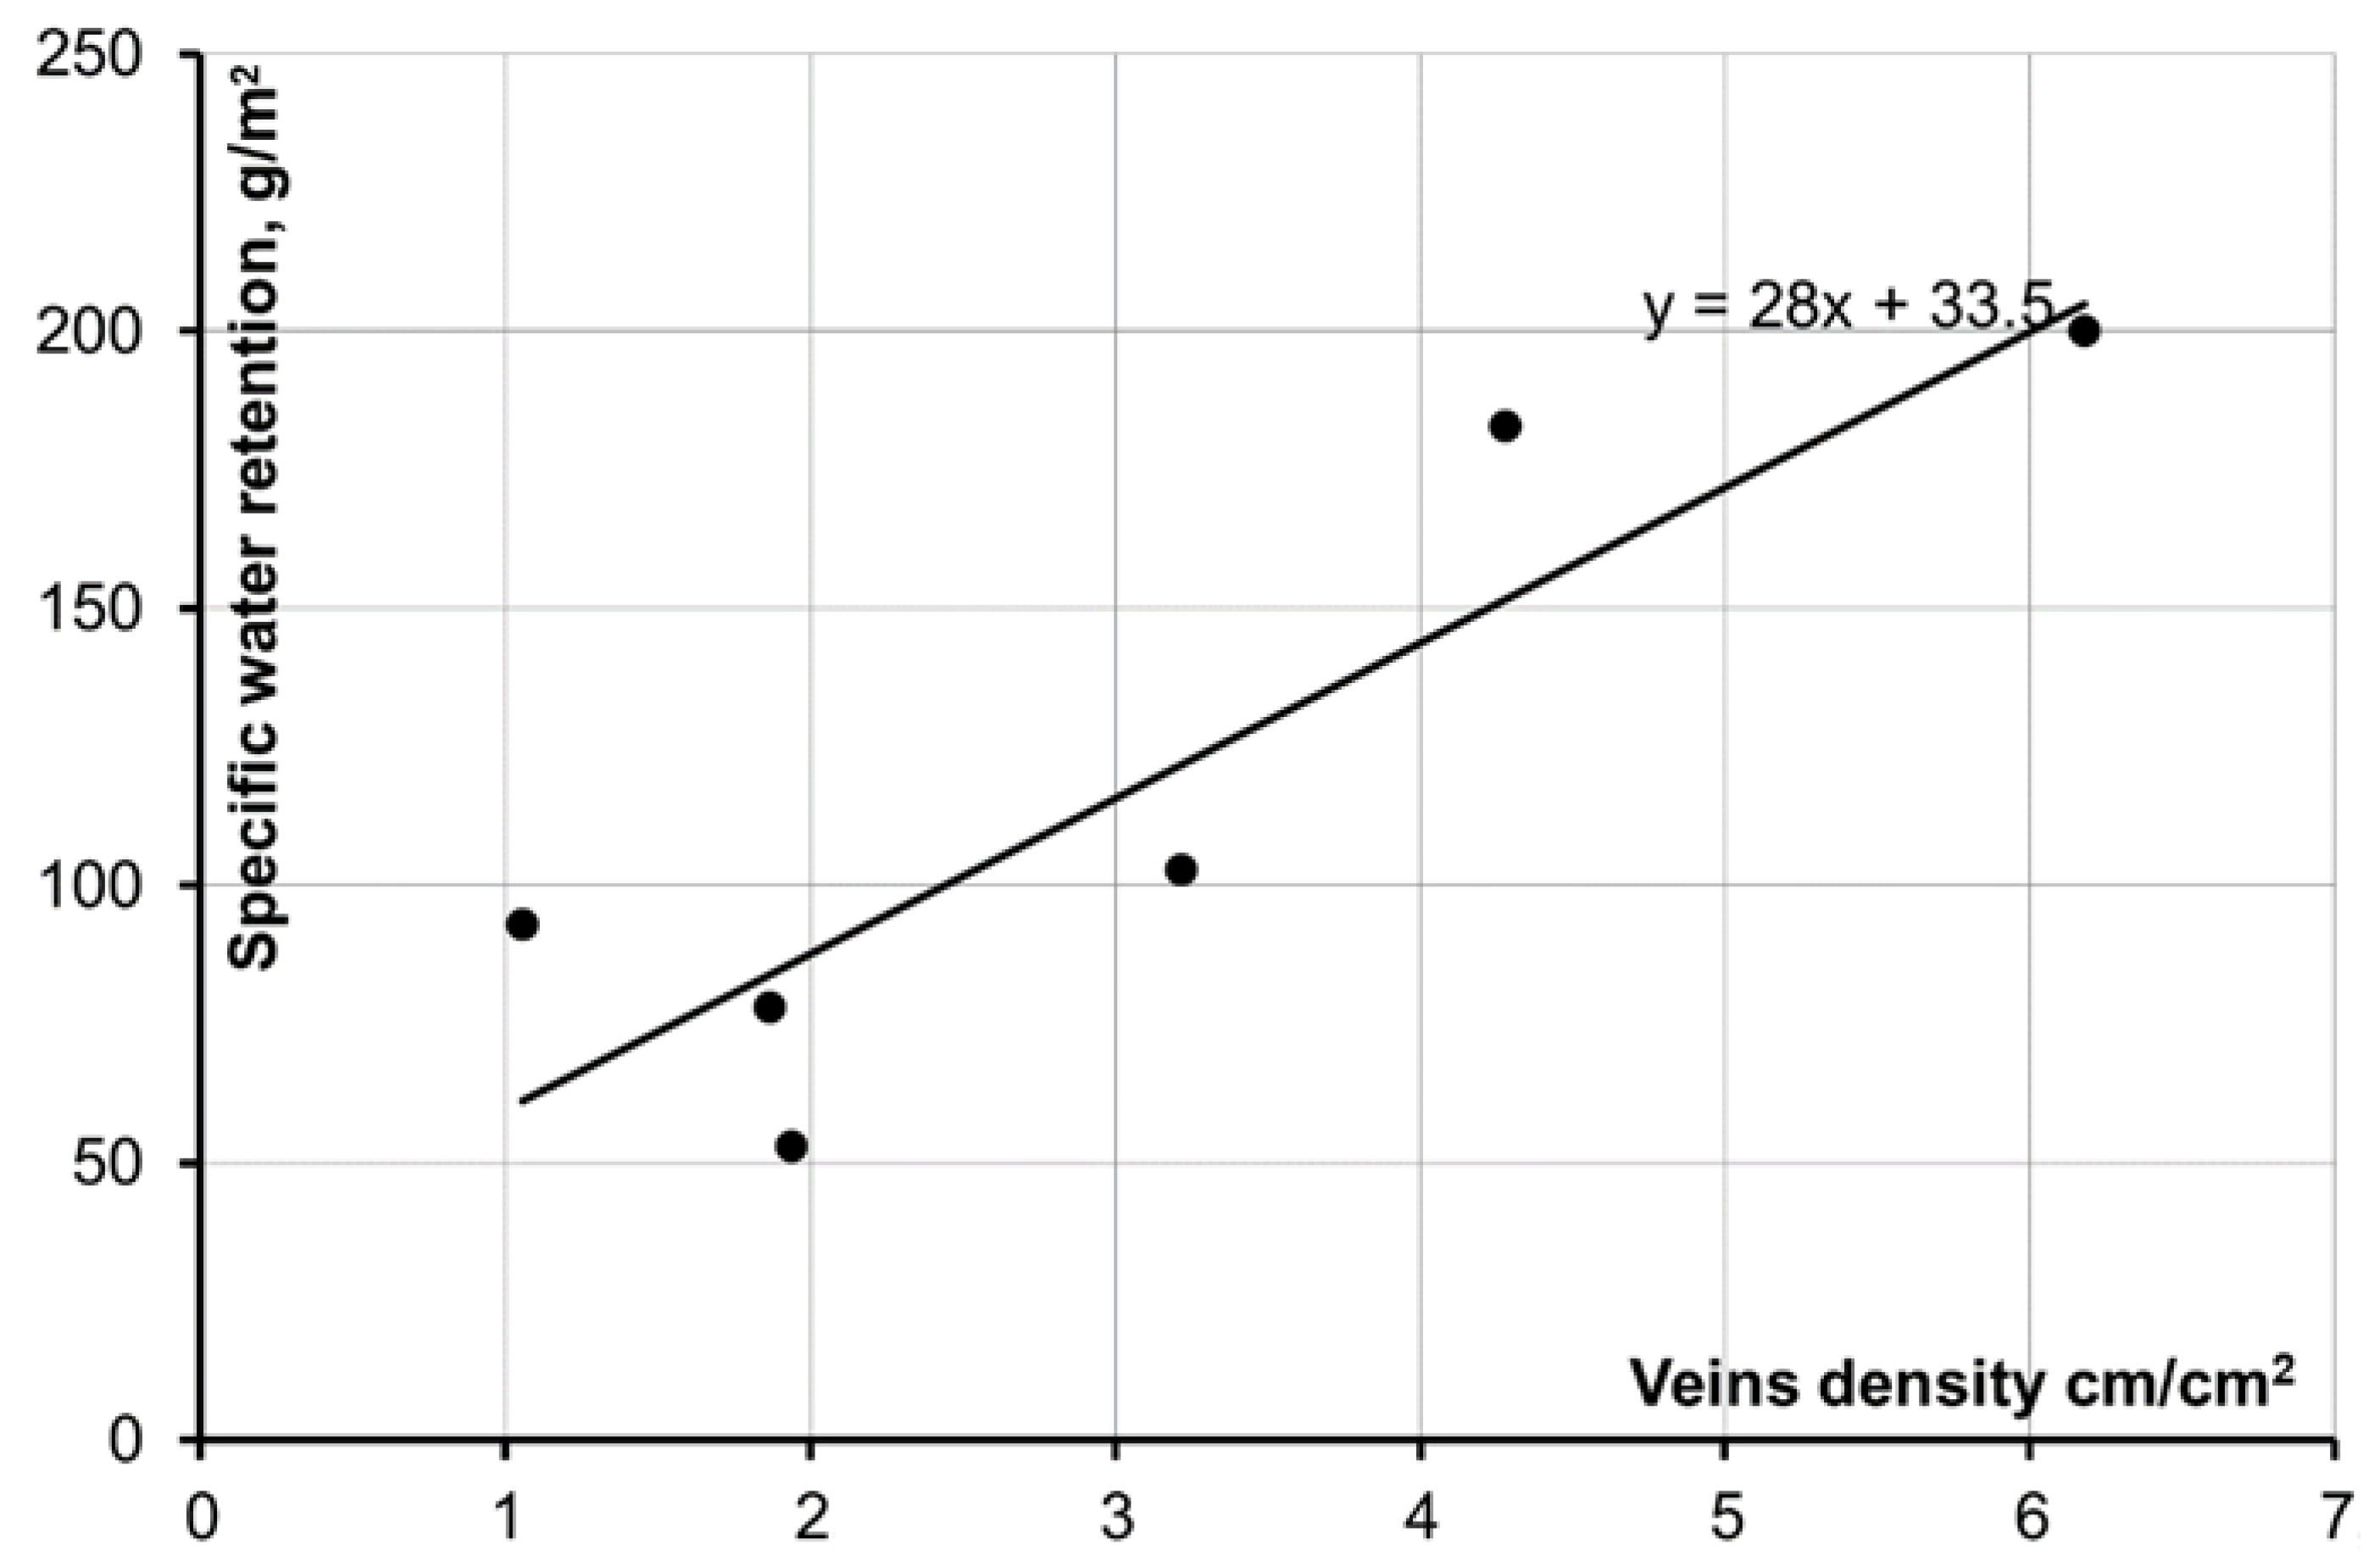
In order to confirm this assumption, vein lengths of laminae from analyzed samples were measured by means of computer programs (AutoCAD 2007, Version 17, Inc. Autodesk, San Rafael, CA, USA). Results of measurements and provisional calculations are shown in
Table 2. The average vein density of samples and dependency between vein density and specific moisture retention for such species were determined on the basis of information about the total length of visible veins and “normal” (average in representative sample) leaf area. The dependency (
Figure 3) was determined to be of good quality (correlation coefficient 0.89). It was established during measurements that the number of small veins of each pinna is equal to the number of pinnae on a leaf. Aspen was not included in the dependency. Low values of specific retention on aspen leaves can be explained by the form of aspen leaves, rather than by venation type: aspen leaf stems are laterally flattened and long—therefore, leaves sway easily in the wind and raindrops fall off them with the slightest leaf motion.
Deciduous species of the analyzed area fall within spring-summer-autumn-green phenotype with winter-spring resting period. Vegetation lasts from early summer to autumn, which within the analyzed area occurs from mid-May to early October. The green mass of deciduous stock reaches its maximum development by the middle of July. Leaf surface area is at its maximum during this period, which is also a period of maximum rainfall frequency. Green mass and leaf surface area estimates in calculation dependencies [
13,
14] are shown for the period of their maximum development.
This study considered retention mass (kg) and rainfall depth per projection crown area (m
2) on the basis of biometrical values of deciduous trees in order to estimate the total values of maximum rainfall retention in crowns and obtain empirical dependencies (
Table 3). The interpretation of results from studies such as this can be used in the assessment of rainfall loss values in calculations of the flood runoff of small watersheds of forest zones by means of genetic methods.
5. Conclusions
Limiting values of specific rainfall retention on laminae were determined on the basis of a series of experiments that included the artificial sprinkling of deciduous tree species. The specific retention mass per 1 m2 of leaf surface was determined by the nature of lamina surface and, primarily, venation type. Leaves with pinnate and netted venation (elm, bird cherry tree) were observed to have 2–3 times larger retention values (180–200 g/m2) as compared to leaves with pinnate and edge venation (birch, aspen; 27–100 g/m2). Total retention mass was determined by leaf surface area as of rain time, which is different for various tree species, ages, and stock heights.
Leaf surface area was determined for “normal” lamina in a representative sample in the course of experiments (statistical parameters of leaf area were determined for sample: norm, coefficients of variation, and asymmetry). The number of leaves on a branch was determined manually. Statistical errors of determination of the total area did not exceed 11%. Errors of determination of rainfall retention mass equaled 4.3%. Methods of assessment of leaf surface area for forest-forming species are described in detail in the literature, which allows rainfall retention mass to be calculated in sufficiently large sections of forest on the basis of obtained empirical dependencies.
In view of the fact that rainfall depth values are used in hydrometeorology, the limiting retention capacity for deciduous species in Preduralye reserve was recalculated into rainfall depth value per projection crown area for assessment of total values. The largest values of rainfall interception were obtained for elm and bird cherry tree (3.9–4.3 mm), whereas for linden, maple, and birch the rainfall interception values were 1.7–2.8 mm, and rainfall interception values less than 1 mm were observed for other species.
The obtained values can be used for the calculation of various water balance components for deciduous and mixed forests and to help determine the maximum storm flow from forest watersheds. In addition, in view of the fact that rainfall retained by the crowns of deciduous species is evaporated only, these dependencies can be used for the assessment of monthly values of liquid precipitation events in the form of adjustments of daily rainfall values.
The obtained experimental estimates were not compared with observations under crowns of deciduous species. The authors believe that point-by-point measurements of rainfall values performed by means of precipitation gauges or rain recording gauges under the crowns would be ineffective due to the heterogeneous density of leaves in different parts of the crown. Rainfall falling on the projection crown area can be calculated accurately by means of collecting moisture using experimental devices, which is a form of research that should be carried out in the future.


