1. Introduction
New forest stands have long been artificially regenerated after clearcuts in boreal and hemiboreal forests, using various types of conifer seedlings, scarification techniques and harvest management practices developed over decades [
1,
2]. In Sweden, the proportion of clearcut areas regenerated by planting increased from 63% to 80% between 2000 and 2018 [
3] and more than 90% of clearcuts are now scarified before planting [
4]. The main threat to the survival and vitality of planted conifer seedlings in northern Europe has been the pine weevil (
Hylobius abietes) [
1,
5] which is most likely to have lethal effects within the first three years after planting [
6,
7]. Several studies have shown that soil scarification, which creates a surface of bare mineral soil, is the most important measure to prevent pine weevils damaging planted conifer seedlings [
1,
8,
9,
10]. Soil scarification also provides other benefits for seedlings, such as reduction of competitive vegetation, warming of seed beds [
2] and increases in growth rates [
11]. In addition, soil scarification increases frequencies of suitable planting spots, e.g., elevated spots in wet areas, and/or spots cleared of stones and slash residues, although the effect may be depending on the specific type of scarification and site hydrology [
2,
8].
In this study, seedling mortality and planting success were related to a wide range of planting spot-, site- and management variables, using data acquired from inventories and re-inventories of clearcuts in forests of small private owners in southern Sweden. In addition to generally exploring potentially relevant relationships, a first hypothesis was formulated that (in accordance with findings from above cited, controlled experiments) seedling density three years after planting would be highly dependent on the suitability of microsite conditions in planting spots. Thus, the seedling survival rate at this time would correlate with the density of seedlings judged to have been properly planted. To test the hypothesis, the estimated density of suitable planting spots together with some of the sample plot descriptors, were used as indicators of within-clearcut variability, such as stoniness, amount of slash residues, soil moisture content and water availability.
Another important objective for this study was to evaluate the potential utility of available digital spatial data, such as soil moisture layers, in planning where to plant and where to rely on natural regeneration. A second hypothesis was formulated that Norway spruce seedling survival would be lower in moist and wet microsites, and that these areas on clearcuts, could be detected at the planning stage with available spatial information.
In addition, the mortality of properly planted seedlings that sometimes occurs could be randomly distributed in clearcuts, due to pine weevil damage, or mechanical damage either in the nursery or in transport. Alternatively, seedling mortality could be clustered in certain areas of clearcuts because of spatial variation in areas’ suitability for planting. The latter would be indicated by a higher coefficient of variation of seedling survival rates between sample plots, while if mortality is randomly located, mean seedling density should be reduced after three years but the variation in seedling density between plots should be similar at the planting time and three years later.
2. Materials and Methods
2.1. Inventory
The data used in the study were acquired in two-stage inventories of planted clearcuts in southern Sweden located between 55° and 60° N in estates regenerated in contracts by Södra, a big forest owners association in southern Sweden, which is divided into three management regions (
Figure 1). Prior to clearcutting, study sites consisted of conifer stands varying between 45 and 90 years of age, dominated by either Norway spruce or Scots pine, or a mixture of the two. Site index varied between G27–G34 (corresponding to 27–34 m dominant height at 100 years), indicative of a production potential of 5–11 m
3 ha
−1year
−1. Whereas the final felling was not necessarily contracted to Södra, this organization was responsible for the management of all the plantations. All clearcuts were planted during spring with soil scarification performed prior to planting. In each of the five years from 2006 to 2010, 50 clearcuts in each of the three regions were randomly selected, for a total of 150 clearcuts sampled per year, and 750 sampled clearcuts in total. Each clearcut was inventoried within two months of planting. Three years later, 20 of the clearcuts in each region were revisited. The resampling effort was repeated for each cohort of clearcuts over the five years of the study, amounting to 300 resampled clearcuts in total. In the first inventory, information regarding operational details was collected for each clearcut, including aspects such as soil scarification method, planting week, seedling type (containerized or bareroot seedlings) and the type of insecticide used for pine weevil protection. Insecticides used in the study were mainly Merit® Forest (Bayer AB, Lyon, France) and Hylobi Forest® (Syngenta Nordics A/S, Copenhagen, Denmark). However, because this information was not always available, the impact of different between pesticides was not further investigated.
The inventory on every clearcut consisted of 30 circular sample plots of size 25 m
2 (radius = 2.82 m) which were systematically established in a grid. The grid had a varying distance between plots to account for differences in clearcut size, so that the inventory would cover the whole regenerated area. The sample plots were classified in soil moisture classes (wet, moist, mesic or dry) according to the methods applied in the Swedish national forest inventory [
12]. The sample plots were also classified in technical severity in scarification and planting in terms of amount of stones and slash in three categories: easy, normal and severe. Deviations were noted when areas within plots were excluded from scarification, but the surrounding area was treated. Each sample plot was marked with a central stick and the GPS coordinates was registered. The inventory-taker subjectively classified the area in each plot as suitable for planting coniferous seedlings, or unsuitable due to high biodiversity values, or inappropriate conditions, e.g., bare rock surfaces or excessive moisture. Parts of the clearcuts, or sometimes whole clearcuts, were excluded from the study if they were classified as unsuitable for planting. In total, 14.4% of the sample plots were excluded for these reasons. Furthermore, all sample plots with no registered planted seedlings (1.4% of the total) were excluded before analyses. Only three clearcuts were planted with birch seedlings and only 5% of the sample plots were planted with Scots pine. Therefore, only the sample plots with Norway spruce seedlings were included in further analysis to maintain adequate sample sizes, leaving a final total of 6306 sample plots distributed among 231 clearcuts.
In every sample plot, the planted seedlings were counted, and the quality of planting was assessed by counting planted seedlings that did not meet pre-defined criteria. Failure to plant in a suitable patch of bare mineral soil, planting too shallow or too deep in the soil, insufficient packing of soil around the seedling, and leaning of the seedling at the time of the first inventory were all recorded as planting mistakes. Only one mistake per seedling was registered, in the order of the mentioned types of mistake (e.g., if a seedling was not planted in a suitable patch of bare mineral soil, and in too deep soil, only the first of these mistakes was recorded). Seedlings that were planted with none of these mistakes were classified as properly planted seedlings (PPS). The overall percentage of the total number of planted seedlings (TPS) classified as PPS was 79% and 1.6% of all sample plots had no PPS at the time of the first inventory. In addition, potential planting spots (patches of bare mineral soil with a radius of at least 10 cm and 150 cm away from other spots) were counted in each sample plot, regardless of whether there was a seedling and regardless of scarification type.
The re-inventories three years after planting were all conducted between 1 March and 30 April every year. If the center stick of a sample plot could not to be found, a new sample plot was laid out at the same coordinates, but any observations of the plot or material in it were classified as new measurements rather than as a re-inventory. The annual percentage of re-inventoried sample plots ranged from 67% to 86%. All living planted seedlings were counted first, then up to nine naturally regenerated seedlings per plot, prioritized by species and height: Norway spruce and Scots pine first, if not damaged, and then all broadleaved species, classified in a single group. Mean heights of five groups of seedlings were recorded: planted Norway spruce and Scots pine, naturally regenerated Norway spruce and Scots pine, and broadleaves.
2.2. Data Analysis
Seedling survival was analyzed on plot and stand level. Differences in mean seedling densities over years and regions as well for seedling types, was tested with one-way analysis of variance, with a significance level
p < 0.05. For all analysis of regeneration success and site variability, only re-inventoried sample plots were used. The dependence of seedling mortality rates on site properties was tested by logistic regression, with sample plots nested by clearcut, using the lme4 package in R [
13] (Functions 1 and 2). Only clearcuts with more than 14 re-inventoried sample plots were included in the analysis (N = 79) and all independent variables were standardized prior to analysis. The number of suitable planting spots ha
−1 was included in the regression as an indicator of suitable microsites. Three categorical sample plot-level site descriptions (scarified sample plot and severity of amounts of stones or slash) were also included in the model.
The soil moisture classification from the field inventory was replaced in the regression model with a covariate derived from a raster of depth to water index (DTW), provided by the Swedish Forest Agency based on the theoretical framework of similar Canadian models [
14,
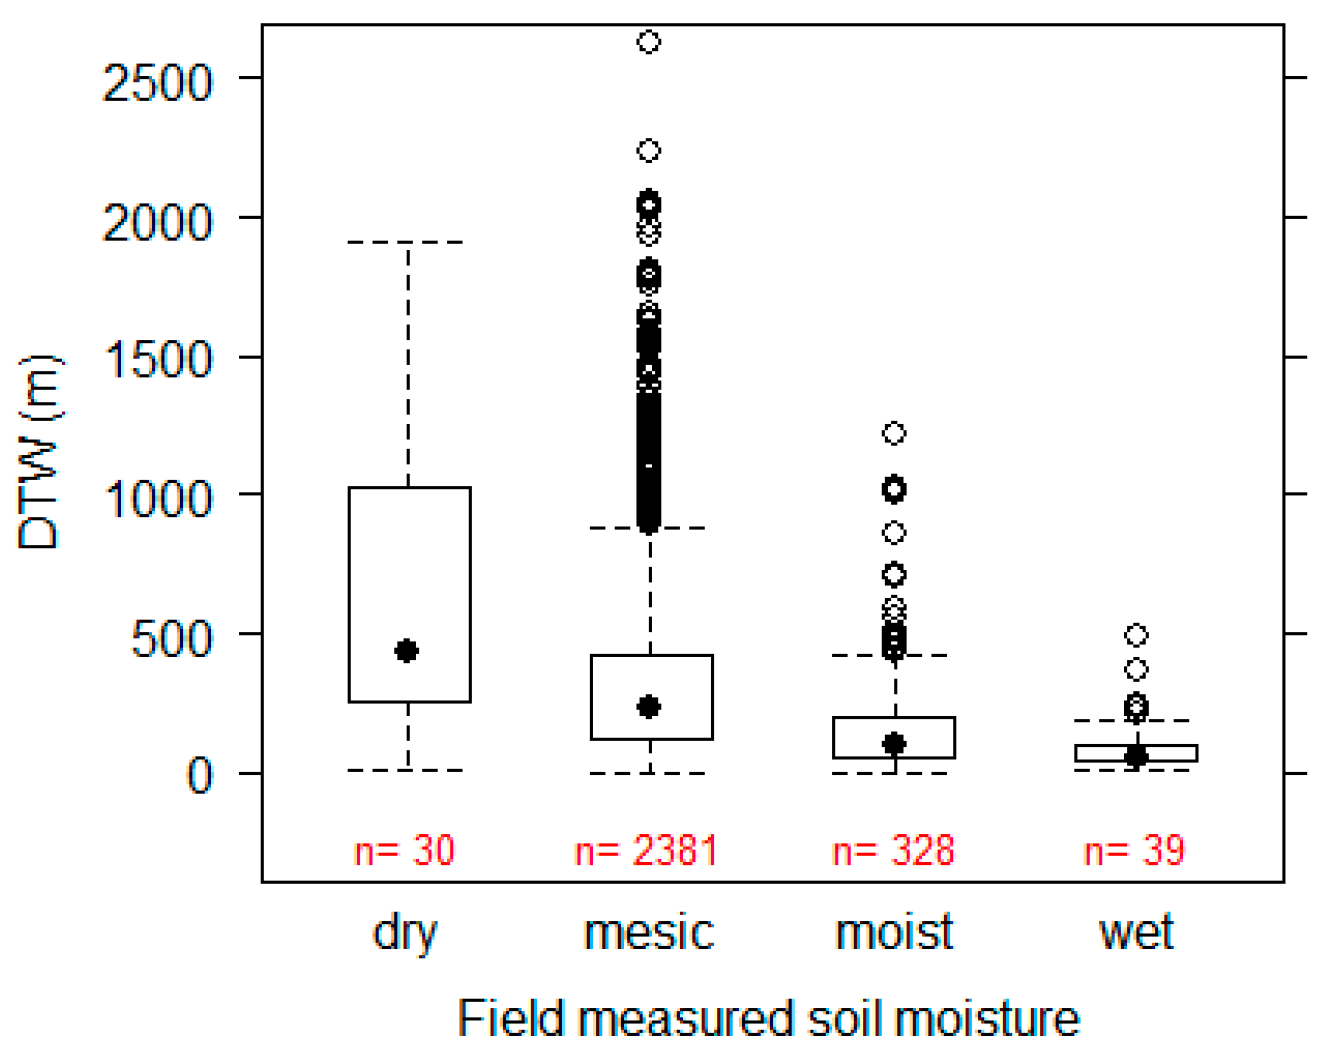
15]. The DTW raster is available to all Swedish land owners through the Agency’s open source web services and is derived from analysis of a digital elevation model covering Sweden with 2 m × 2 m resolution. The estimated depth to water is typically 1–2 m, corresponding to a high soil moisture content, but has a continuous scale ranging from 0 to more than 1000 m. A DTW value was extracted for each sample plot, using the mean value of intersecting pixels from its center to its circumference 2.82 m away. The extracted DTW values were compared with the soil moisture classifications obtained from field observations with box and whisker plots (
Figure 2), and judged to be sufficiently consistent with a trend of soil moisture classes. Before scaling and implementation in the model, the DTW values were transformed using the function
y = exp
−x.
Annual and spatial variation in water availability (AvaW) was also added as a covariate in the statistical analysis, based on monthly precipitation and global irradiation from the JRA-55 climate model produced by the Swedish Meteorological institute (SMHI) [
16]. The monthly water availability value was calculated from the difference between the precipitation sum and evapotranspiration sum, which was derived by the 3PG Penman–Monteith equation [
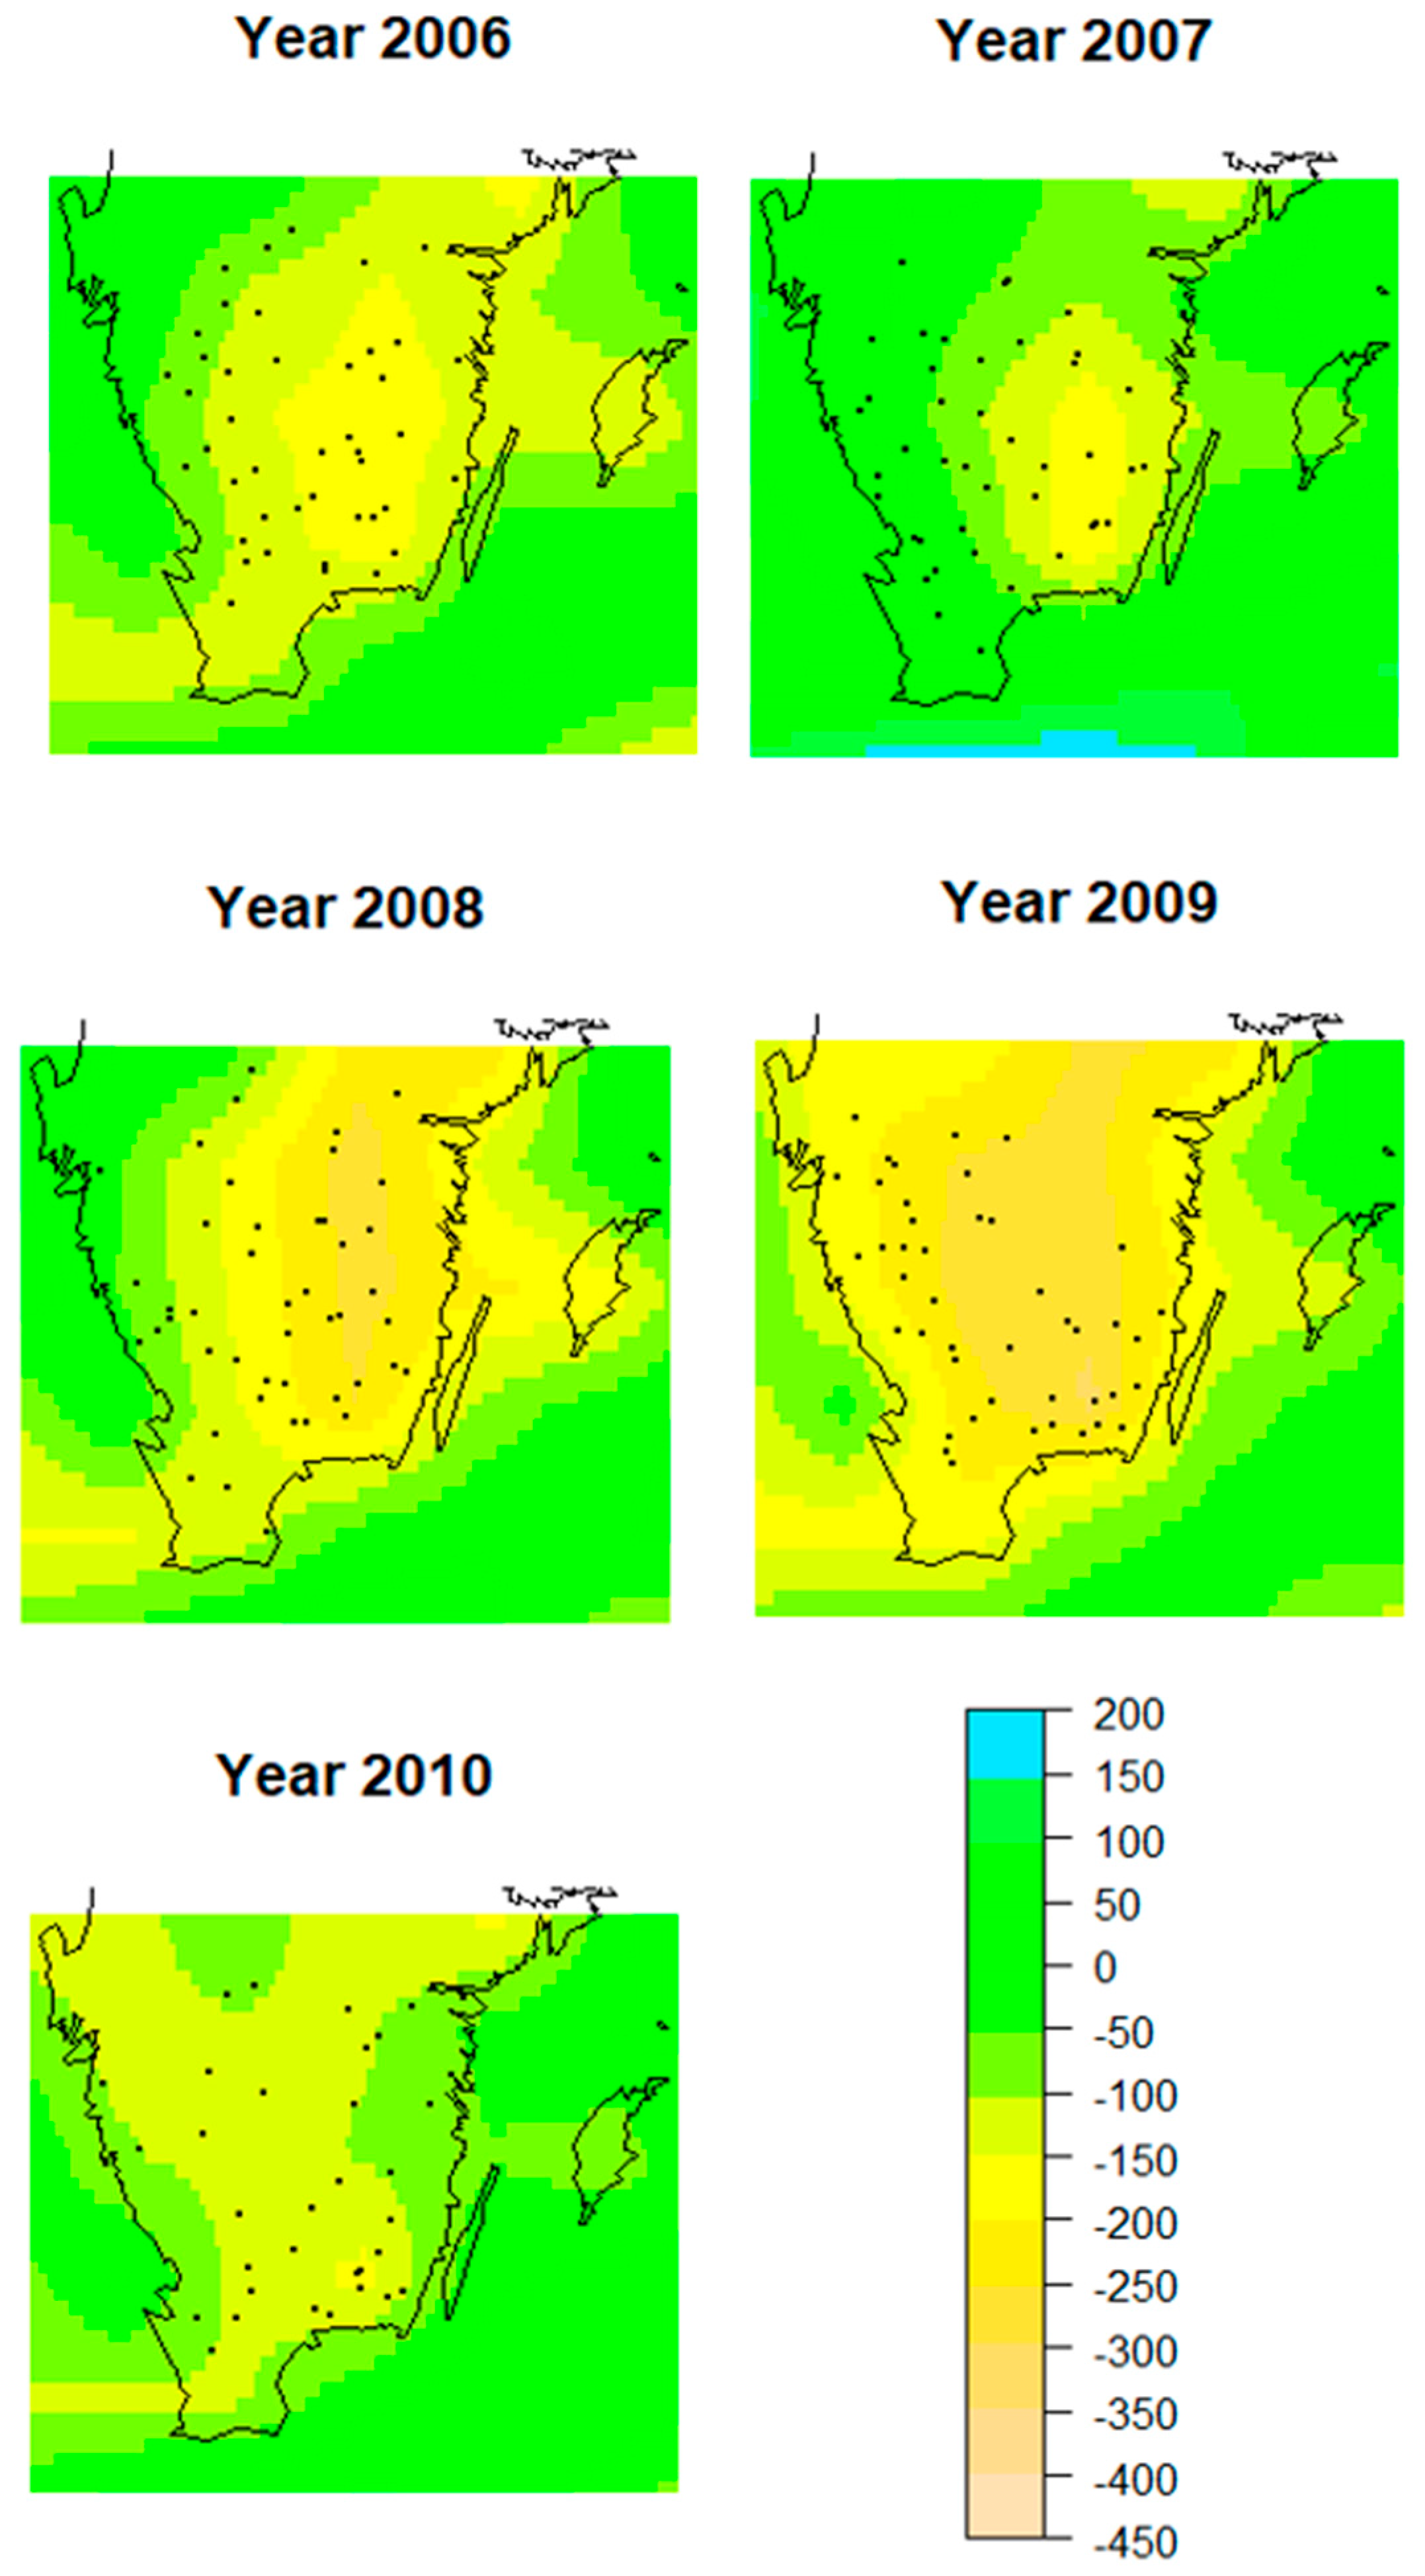
17]. The accumulated water availability from January to July for the planting years (2006–2010) was implemented in the model (
Figure 3). The variable is primarily used as indicator of differences between years and sites, not as absolute measures of the magnitude.
The logistic regression model for seedling survival of number planted (
) used was:
where
i is sample plot,
j is the random variable clearcut, PlS is the number of suitable planting spots, AvaW is available water in the clearcut in the planting year and eDTW is the transformed DTW value of soil moisture content from raster data. Stone and Slash is the classified variables of severity in planting due to stone and slash, respectively, and finally Scarif is whether the sample plot was part of the disc trenched area of the clearcut.
The coefficient of variance was calculated as the variance of sample plots within the clearcuts. Low coefficients indicate relatively homogenous planting densities at clearcut level, while higher coefficients indicate more clustered mortality patterns.
3. Results
No significant differences were found in density of planted Norway spruce between years or regions (p > 0.05). The overall mean density was 2100 seedlings ha−1 and 80% of the seedlings were classified as properly planted (PPS). Of the remaining 20%, 86% were not classified as PPS due to planting in an unsuitable planting spot.
In the re-inventories three years after planting, the overall mean density was 2000 seedlings ha−1, including both planted and naturally regenerated seedlings, but the number of planted seedlings had decreased to 1500 seedlings ha−1.
Based solely on data for re-inventoried sample plots, the overall mean mortality on clearcuts was 594 ± 29 seedlings ha
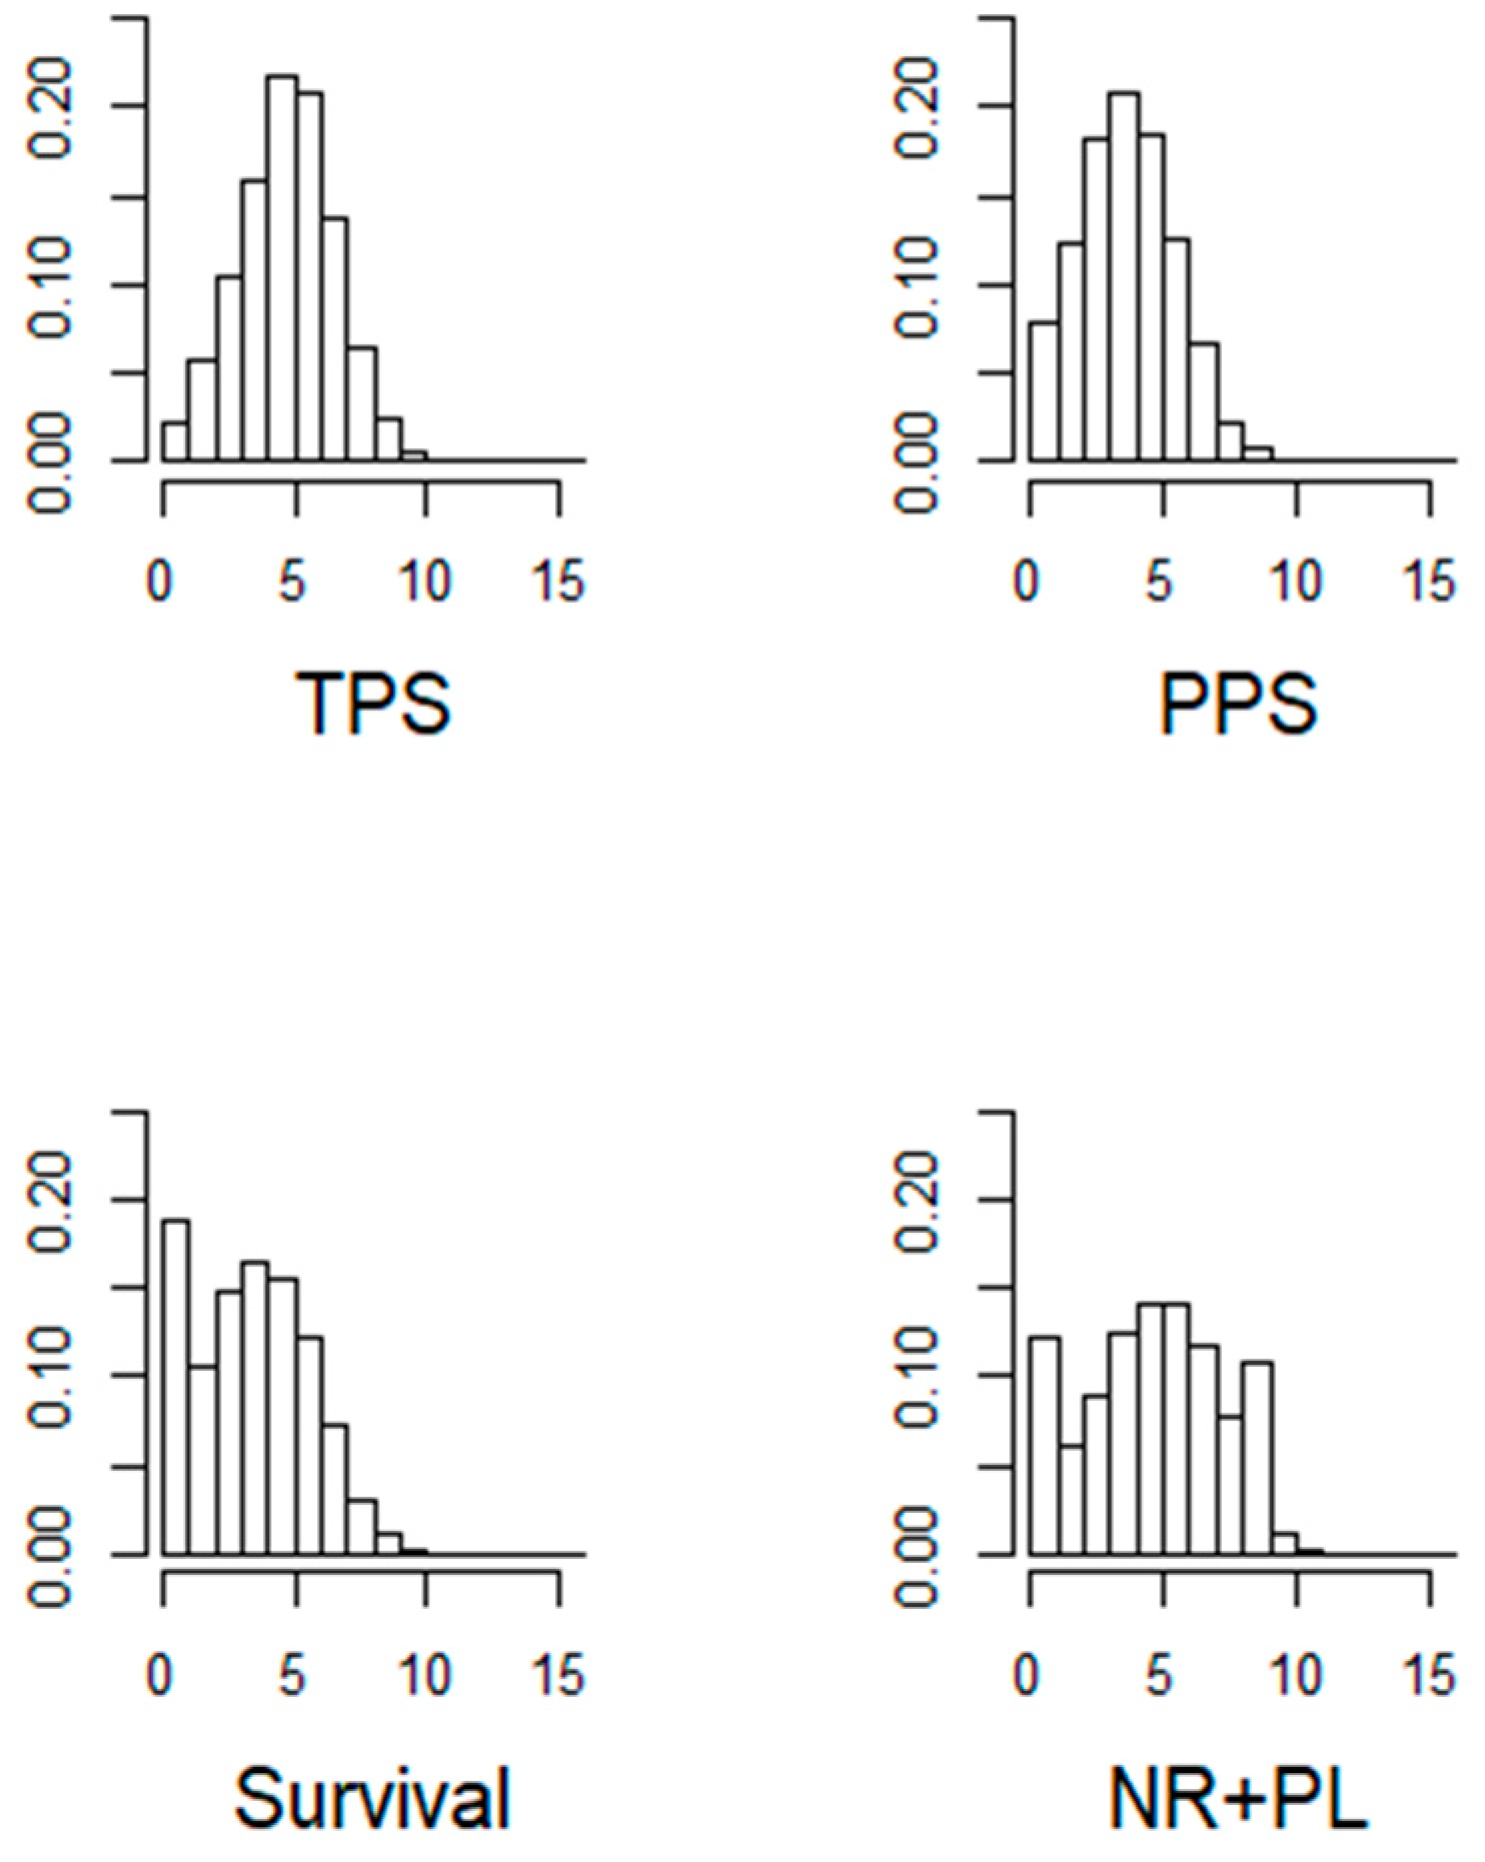
−1 (corresponding to 1.45 seedlings per sample plot). On average, 32% of planted seedlings had died, but the average mortality rate of PPS was lower; 25%. However, no mortality of planted seedlings at all was recorded in 42% of the sample plots (
Figure 4).
There was no significant difference in mortality rate between years, regions or planting week (p > 0.05). There was also no significant difference in seedling density after three years between containerized and bare root planted seedlings (p = 0.700) in disc-trenched clearcuts (51 with containerized and 47 with bareroot seedlings).
The density of suitable planting spots correlated with TPS, PPS and seedling density after three years (
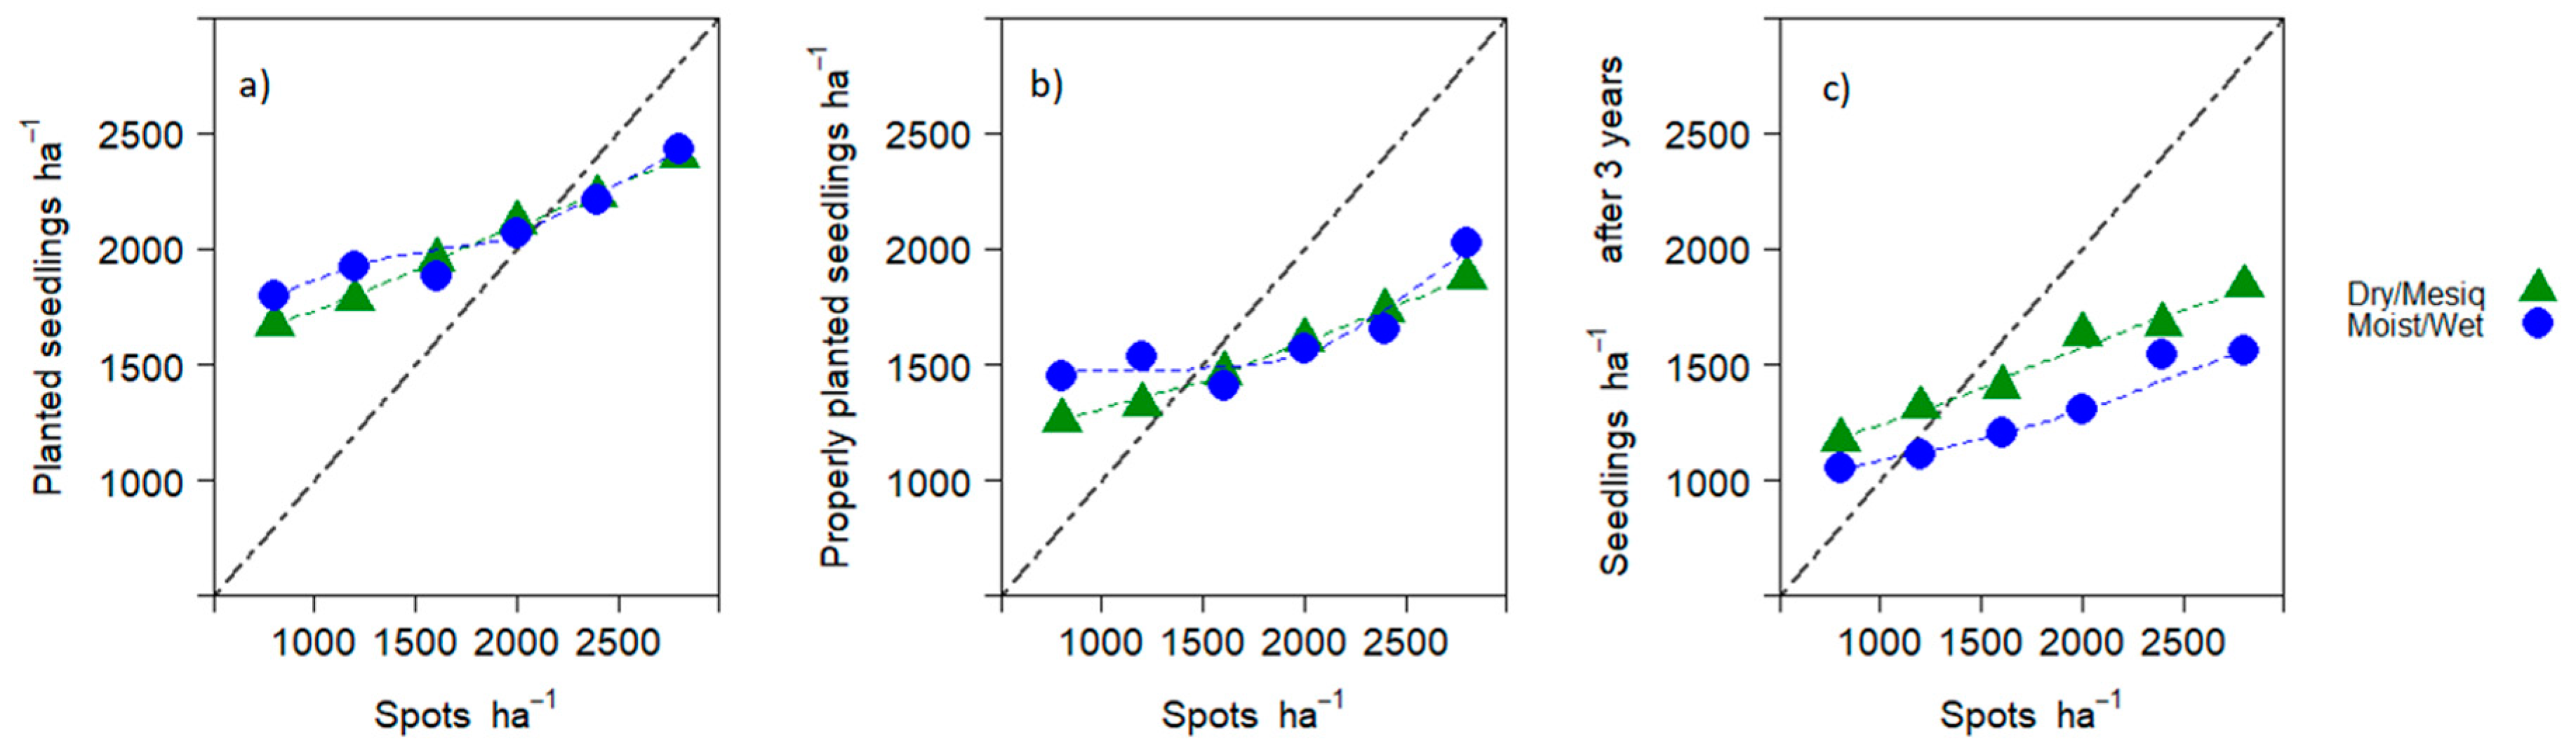
Figure 5). As hypothesized, there was an inverse relationship between sample plots’ soil moisture contents (according to the DTW raster) and seedling survival rates three years after planting in them. Accumulated available water and time of planting had minor but significant effects on seedling density.
The logistic regression model indicated that the sample plot characteristics explained some of the variation in mortality rates. Stoniness, amount of slash residues and soil scarification had no significant effects and thus were removed from the final model (
Table 1). However, the following variables did have significant effects on mortality rate: the number of suitable sample plots (
p ≤ 0.01), the site and yearly specific available water (
p = 0.03) and the DTW value (
p < 0.01) (
Table 2).
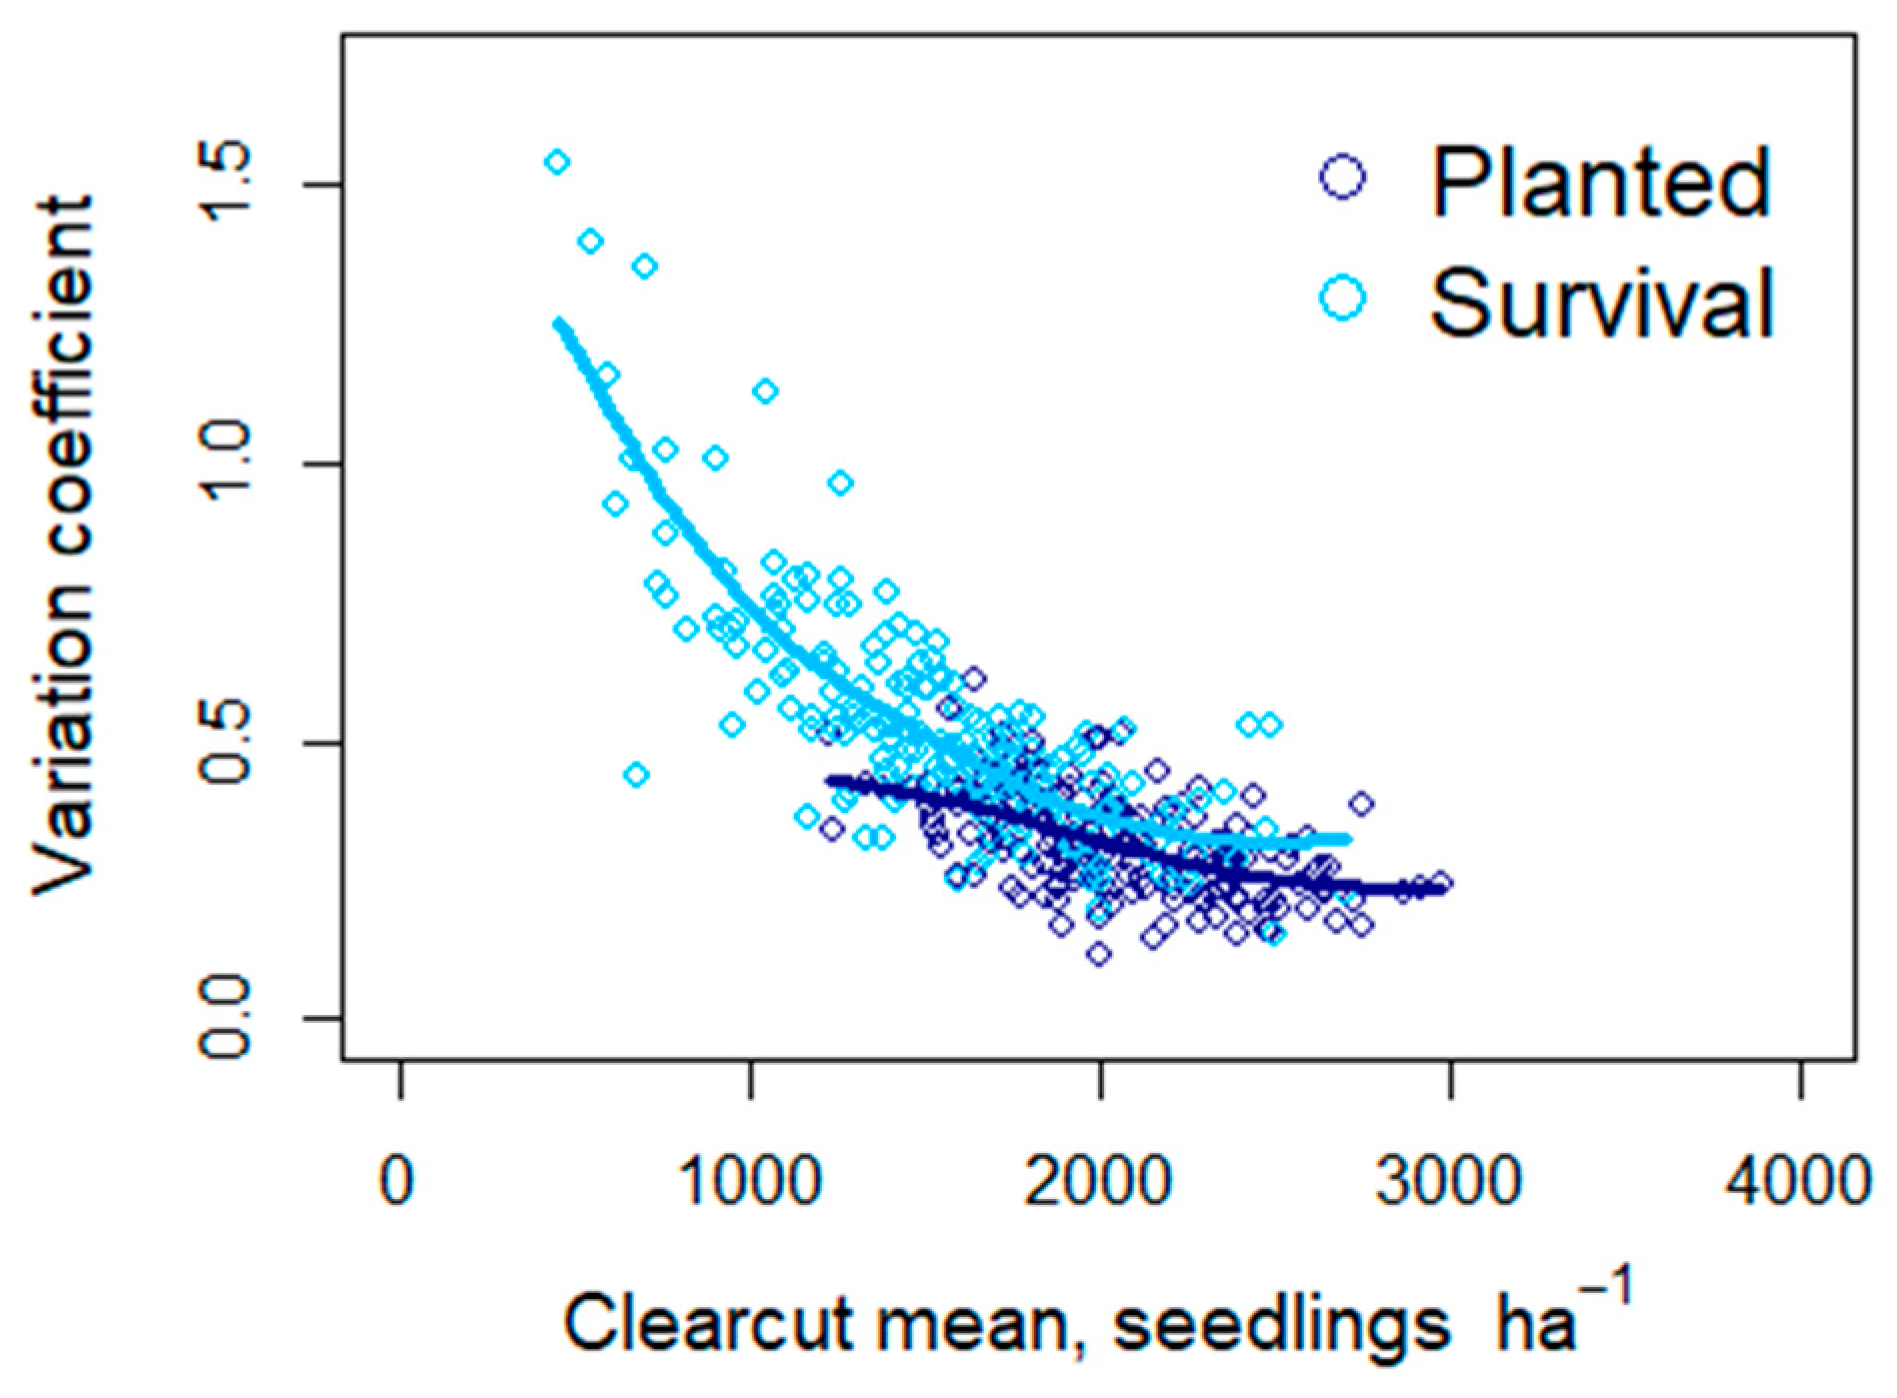
The mean coefficient of variation of seedling density in the clearcuts increased significantly (
p < 0.05) from 0.32 to 0.52 during the three years between inventories. The combination of reduction in seedling density (
Figure 5) and increase in this variation indicates that the mortality among planted seedlings was not randomly distributed over the clearcuts (
Figure 6).
4. Discussion
The results from this inventory are based on regenerations in private owned forest, which corresponds well to findings of earlier experiments. As hypothesized, seedling survival was highly correlated to suitable planting spots.
Most regenerations included in the re-inventories were established with the same soil scarification type (disc-trenching), which prevented evaluation of survival rates associated with any other methods. Although other, more intermittent, methods have provided similar or even better establishment results in trials [
18,
19], the forestry industry seems reluctant to diversify and disc trenching is the dominant scarification method in southern Sweden. This is probably because of economic incentives to use existing machinery, even though intermittent methods would reduce soil disturbance and thus probably reduce adverse effects on soil, water and field vegetation.
Seedling survival did not significantly differ between years, but differences in available water between years and sites significantly influenced seedling survival rates. Increases in variation in annual climatic parameters, due to future climate change, may increase the value of robust predictions of drought-related mortality in scarification method decisions. Examples of such ecophysiological responses to interactive climate, site and management variations might not be common yet in northern Europe, but there are numerous examples from other regions with plantation forestry [
20,
21]. There were almost equal distributions of containerized and bare-rooted seedlings, and no difference in their survival rate was detected in this study, in accordance with findings of several experimental studies that both seedling types have pros and cons [
22,
23].
The re-inventory of plantations showed that the mortality rate could be quite substantial, despite application of mechanical or chemical seedling measures and soil scarification to provide protection against the pine weevil. These findings are consistent with several experimental studies conducted in southern Sweden in recent decades [
1,
7,
19]. In this study, naturally regenerated seedlings of both conifer and broadleaved species were included if suitable as future crop trees when planted seedlings had died. The estimates could be relevant for practical forestry, since the additional supply of seedlings could be valuable in parts of clearcuts with high mortality of planted seedlings (
Figure 4).
The second hypothesis, that digital tools could predict a higher mortality in moist and wet conditions was not rejected. Most of the planning decisions before regeneration are based on site-averaged information, such as site productivity, stoniness and soil moisture conditions. However, the inverse relationship found between the coefficient of variation of seedling density on clearcuts and regeneration success strongly indicates that mortality was not random but clustered in areas of the clearcuts where site conditions were harshest (
Figure 6). However, whether the clustered mortality was due to increased pine weevil damage in moist conditions, insufficient soil scarification, standing ground water or combinations of factors, is not possible to disentangle from the inventory data. Partly for this reason, the results show that there is high potential to increase efficiency through more detailed planning and more precise application of regeneration methods. The planting spot density and the soil moisture conditions explained much of the sample plot-level mortality (
Figure 5). This indicates that the regeneration success of planting Norway spruce could be increased by improving the management of moist or wet areas in clearcuts. Applying other soil scarification methods could be one solution [
18,
19]. Alternatively, and perhaps more likely, use of other tree species, either naturally regenerated [
24,
25] or planted Scots pine or broadleaves, could potentially provide solutions that reduce establishment costs and enhance ecosystem services [
26].
5. Conclusions
Monitoring of practical Norway spruce plantations provided insights into seedling mortality and how it is affected by small-scale variation on clearcuts. Some of the mortality issues could be addressed in the planning process, before clearcutting or soil scarification, by using soil water mapping, e.g., depth to water maps. Most importantly, however, this study indicates that much of the mortality may be avoided by better choice of planting spots.
Author Contributions
E.H. was the main author and responsible for most of the data analysis and writing. M.P. and H.G. designed the inventory, collected all the data and contributed to the manuscript.
Acknowledgments
The analysis of the inventory data was enabled by funding from Partnerskap Alnarp, SLU, Sweden. We also thank the field inventory staff of Asa unit of field-based research, SLU.
Conflicts of Interest
The inventory was paid for, and organized by, the company and forest owner’s association Södra skogsägarna, but the inventory staff were not employed by the company and had no association with the companies involved in the regeneration operations. Magnus Petersson and Helena Gålnander were employed (at the time of the study) by Södra, but Emma Holmström was and is employed by the independent university SLU.
References
- Nilsson, U.; Luoranen, J.; Kolstrom, T.; Orlander, G.; Puttonen, P. Reforestation with planting in northern Europe. Scand. J. For. Res. 2010, 25, 283–294. [Google Scholar] [CrossRef]
- Löf, M.; Dey, D.C.; Navarro, R.M.; Jacobs, D.F. Mechanical site preparation for forest restoration. New For. 2012, 43, 825–848. [Google Scholar] [CrossRef]
- Bergquist, J.; Fries, C.; Svensson, L. Skogsstyrelsens Återväxtuppföljning Resultat Från 1999–2016; Swedish Forest Agency: Jönköping, Sweden, 2017. [Google Scholar]
- Bergquist, J.; Eriksson, A.; Fries, C. Skogsstyrelsen Polytax 5/7 Återväxttaxering: Resultat Från 1999–2009; 1100-0295; Skogsstyrelsens Böcker & Broschyrer: Jönköping, Sweden, 2011. [Google Scholar]
- Wallertz, K.; Petersson, M. Pine weevil damage to Norway spruce seedlings: Effects of nutrient-loading, soil inversion and physical protection during seedling establishment. Agric. For. Entomol. 2011, 13, 413–421. [Google Scholar] [CrossRef]
- Johansson, K.; Hajek, J.; Sjölin, O.; Normark, E. Early performance of Pinus sylvestris and Picea abies—A comparison between seedling size, species, and geographic location of the planting site. Scand. J. For. Res. 2015, 30, 388–400. [Google Scholar] [CrossRef]
- Orlander, G.; Nilsson, U. Effect of reforestation methods on pine weevil (Hylobius abietis) damage and seedling survival. Scand. J. For. Res. 1999, 14, 341–354. [Google Scholar] [CrossRef]
- Johansson, K.; Nilsson, U.; Örlander, G. A comparison of long-term effects of scarification methods on the establishment of Norway spruce. Forestry 2013, 86, 91–98. [Google Scholar] [CrossRef]
- Luoranen, J.; Viiri, H.; Sianoja, M.; Poteri, M.; Lappi, J. Predicting pine weevil risk: Effects of site, planting spot and seedling level factors on weevil feeding and mortality of Norway spruce seedlings. For. Ecol. Manag. 2017, 389, 260–271. [Google Scholar] [CrossRef]
- Petersson, M. Regeneration Methods to Reduce Pine Weevil Damage to Conifer Seedlings. Ph.D. Thesis, Swedish University of Agricultural Sciences, Uppsala, Sweden, 2004. [Google Scholar]
- Nordborg, F.; Nilsson, U. Growth, damage and net nitrogen uptake in Picea abies (L.) Karst. seedlings, effects of site preparation and fertilisation. Ann. For. Sci. 2003, 60, 657–666. [Google Scholar] [CrossRef]
- Fridman, J. Field Instructions NFI. Available online: https://www.slu.se/en/Collaborative-Centres-and-Projects/the-swedish-national-forest-inventory/about-us/inventory-design/field-instructions/ (accessed on 22 December 2018).
- R Core Team. R: A Language and Environment for Statistical Computing; R Foundation for Statistical Computing: Vienna, Austria, 2013. [Google Scholar]
- Murphy, P.N.C.; Ogilvie, J.; Castonguay, M.; Zhang, C.-F.; Meng, F.-R.; Arp, P.A. Improving forest operations planning through high-resolution flow-channel and wet-areas mapping. For. Chron. 2008, 84, 568–574. [Google Scholar] [CrossRef]
- Murphy, P.N.C.; Ogilvie, J.; Meng, F.-R.; White, B.; Bhatti, J.S.; Arp, P.A. Modelling and mapping topographic variations in forest soils at high resolution: A case study. Ecol. Modell. 2011, 222, 2314–2332. [Google Scholar] [CrossRef]
- Harada, Y.; Kamahori, H.; Kobayashi, C.; Endo, H.; Kobayashi, S.; Ota, Y.; Onoda, H.; Onogi, K.; Miyaoka, K.; Takahashi, K. The JRA-55 Reanalysis: Representation of Atmospheric Circulation and Climate Variability. J. Meteorol. Soc. Jpn. 2016, 94, 269–302. [Google Scholar] [CrossRef]
- Landsberg, J.J.; Waring, R.H. A generalised model of forest productivity using simplified concepts of radiation-use efficiency, carbon balance and partitioning. For. Ecol. Manag. 1997, 95, 209–228. [Google Scholar] [CrossRef]
- Orlander, G.; Hallsby, G.; Gemmel, P.; Wilhelmsson, C. Inverting improves establishment of Pinus contorta and Picea abies—10-year results from a site preparation trial in northern Sweden. Scand. J. For. Res. 1998, 13, 160–168. [Google Scholar] [CrossRef]
- Wallertz, K.; Bjorklund, N.; Hjelm, K.; Petersson, M.; Sundblad, L.G. Comparison of different site preparation techniques: Quality of planting spots, seedling growth and pine weevil damage. New For. 2018, 49, 705–722. [Google Scholar] [CrossRef] [PubMed]
- Ojeda, H.; Rubilar, R.A.; Montes, C.; Cancino, J.; Espinosa, M. Leaf area and growth of Chilean radiata pine plantations after thinning across a water stress gradient. N. Z. J. For. Sci. 2018, 48. [Google Scholar] [CrossRef]
- Qi, J.; Markewitz, D.; Radcliffe, D. Modelling the effect of changing precipitation inputs on deep soil water utilization. Hydrol. Process 2018, 32, 672–686. [Google Scholar] [CrossRef]
- Grossnickle, S.C.; El-Kassaby, Y.A. Bareroot versus container stocktypes: A performance comparison. New For. 2016, 47, 1–51. [Google Scholar] [CrossRef]
- Johansson, K.; Nilsson, U.; Allen, H.L. Interactions between soil scarification and Norway spruce seedling types. New For. 2007, 33, 13–27. [Google Scholar] [CrossRef]
- Holmström, E.; Hjelm, K.; Karlsson, M.; Nilsson, U. Scenario analysis of planting density and pre-commercial thinning: Will the mixed forest have a chance? Eur. J. For. Res. 2016. [Google Scholar] [CrossRef]
- Holmström, E.; Karlsson, M.; Nilsson, U. Modeling birch seed supply and seedling establishment during forest regeneration. Ecol. Modell. 2017, 352, 31–39. [Google Scholar] [CrossRef]
- Felton, A.; Nilsson, U.; Sonesson, J.; Felton, A.; Roberge, J.-M.; Ranius, T.; Ahlström, M.; Bergh, J.; Björkman, C.; Boberg, J.; et al. Replacing monocultures with mixed-species stands: Ecosystem service implications of two production forest alternatives in Sweden. Ambio 2016, 45, 124–139. [Google Scholar] [CrossRef] [PubMed]
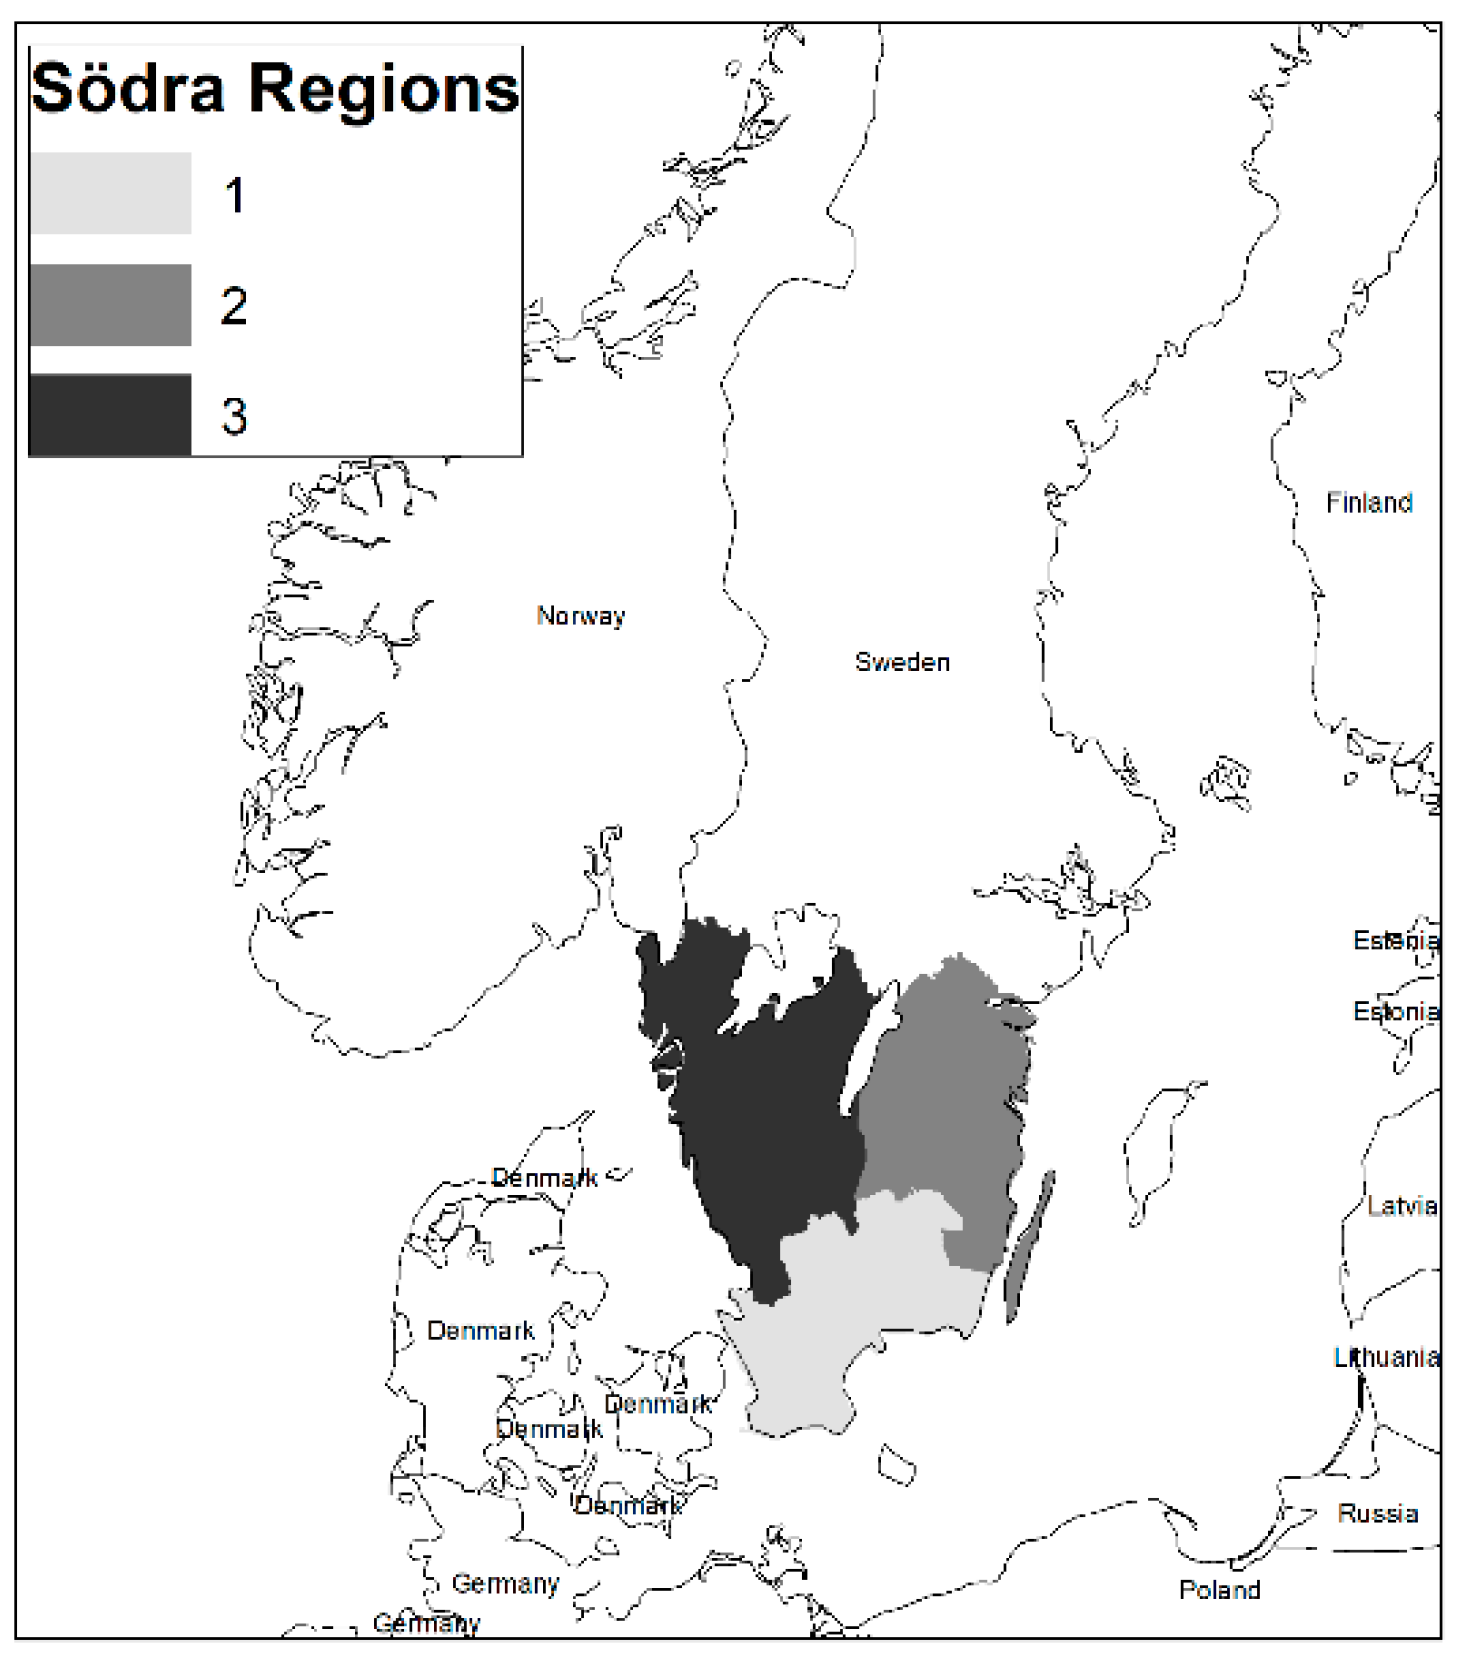
Figure 1.
The distribution of forest owners associated with the Södra company in southern Sweden, showing management regions 1–3.
Figure 1.
The distribution of forest owners associated with the Södra company in southern Sweden, showing management regions 1–3.
Figure 2.
Box and whiskers plot of the digital depth to water value in the field-measured soil moisture classes: dry, mesic, moist and wet. The number of sample plots in each category (n) is shown in red below each box. Black dots indicate median, the border of the box indicates the first and third quartile, length of whiskers represents approximately two standard deviations of the data, and the unfilled dots indicate outliers of the whiskers.
Figure 3.
Accumulated available water (mm) in the years 2006–2010 and geographic locations of the clearcuts included in the re-inventory marked in planting years.
Figure 3.
Accumulated available water (mm) in the years 2006–2010 and geographic locations of the clearcuts included in the re-inventory marked in planting years.
Figure 4.
Proportions of the sample plots (total number of plots summarize to 1) with indicated numbers of seedlings, ranging from 0 to max registered value 14 (corresponding to 0–5600 ha−1): TPS, Total number of planted seedlings; PPS, Properly planted seedlings; Survival, Number of planted seedlings after three years; NR + PL, Number of naturally regenerated and planted seedlings after three years.
Figure 5.
Densities of (a) all planted seedlings and (b) properly planted seedlings in the planting year, and (c) number of surviving planted seedlings three years after planting, in sample plots of indicated soil moisture classes derived from DTW raster values. The x-axes represent the number of suitable planting spots ha−1 in corresponding sample plots.
Figure 6.
The variation coefficient of seedling density as a function of the clearcut mean, at the time of planting (dark blue) and three years later (light blue) and smoothed lines of the overall inventory tendencies.
Figure 6.
The variation coefficient of seedling density as a function of the clearcut mean, at the time of planting (dark blue) and three years later (light blue) and smoothed lines of the overall inventory tendencies.
Table 1.
Fixed effects full model (Equation (2)), with mortality in sample plots nested within clearcuts. PlS, the number of suitable planting spots; AvaW, Available Water at planting year; eDTW, the transformed DTW value of soil moisture content from raster data; Scarif, scarified sample plot yes or no; Stone and Slash, the classified variables of severity in planting due to stone and slash respectively.
| | Estimate | Std. Error | z Value | Pr(>|z|) |
|---|
| (Intercept) | −1.10037 | 0.14820 | −7.425 | <0.0001 |
| PlS | −0.17860 | 0.02825 | −6.322 | <0.0001 |
| AvaW | −0.32813 | 0.14942 | −2.196 | 0.0281 |
| eDTW | 0.1199 | 0.02748 | 4.364 | <0.0001 |
| Scarif | 0.45676 | 0.38998 | 1.171 | 0.2415 |
| Stone_severe | −0.15570 | 0.08540 | −1.823 | 0.0683 |
| Slash_severe | 0.17423 | 0.09466 | 1.841 | 0.0657 |
Table 2.
Fixed effects reduced model (Equation (2)), with mortality in sample plots nested within clearcuts. Variables according to description in
Table 1.
Table 2.
Fixed effects reduced model (Equation (2)), with mortality in sample plots nested within clearcuts. Variables according to description in
Table 1.
| | Estimate | Std. Error | z Value | Pr(>|z|) |
|---|
| (Intercept) | −1.10935 | 0.14774 | −7.509 | <0.0001 |
| PlS | −0.18130 | 0.02645 | −6.856 | <0.0001 |
| AvaW | −0.32192 | 0.14963 | −2.151 | 0.0314 |
| eDTW | 0.12011 | 0.02746 | 4.374 | <0.0001 |
© 2019 by the authors. Licensee MDPI, Basel, Switzerland. This article is an open access article distributed under the terms and conditions of the Creative Commons Attribution (CC BY) license (http://creativecommons.org/licenses/by/4.0/).


