

Study on Vertical Bearing Capacity of Pile Foundation with Distributed Geopolymer Post-Grouting on Pile Side
 ,
,
Abstract
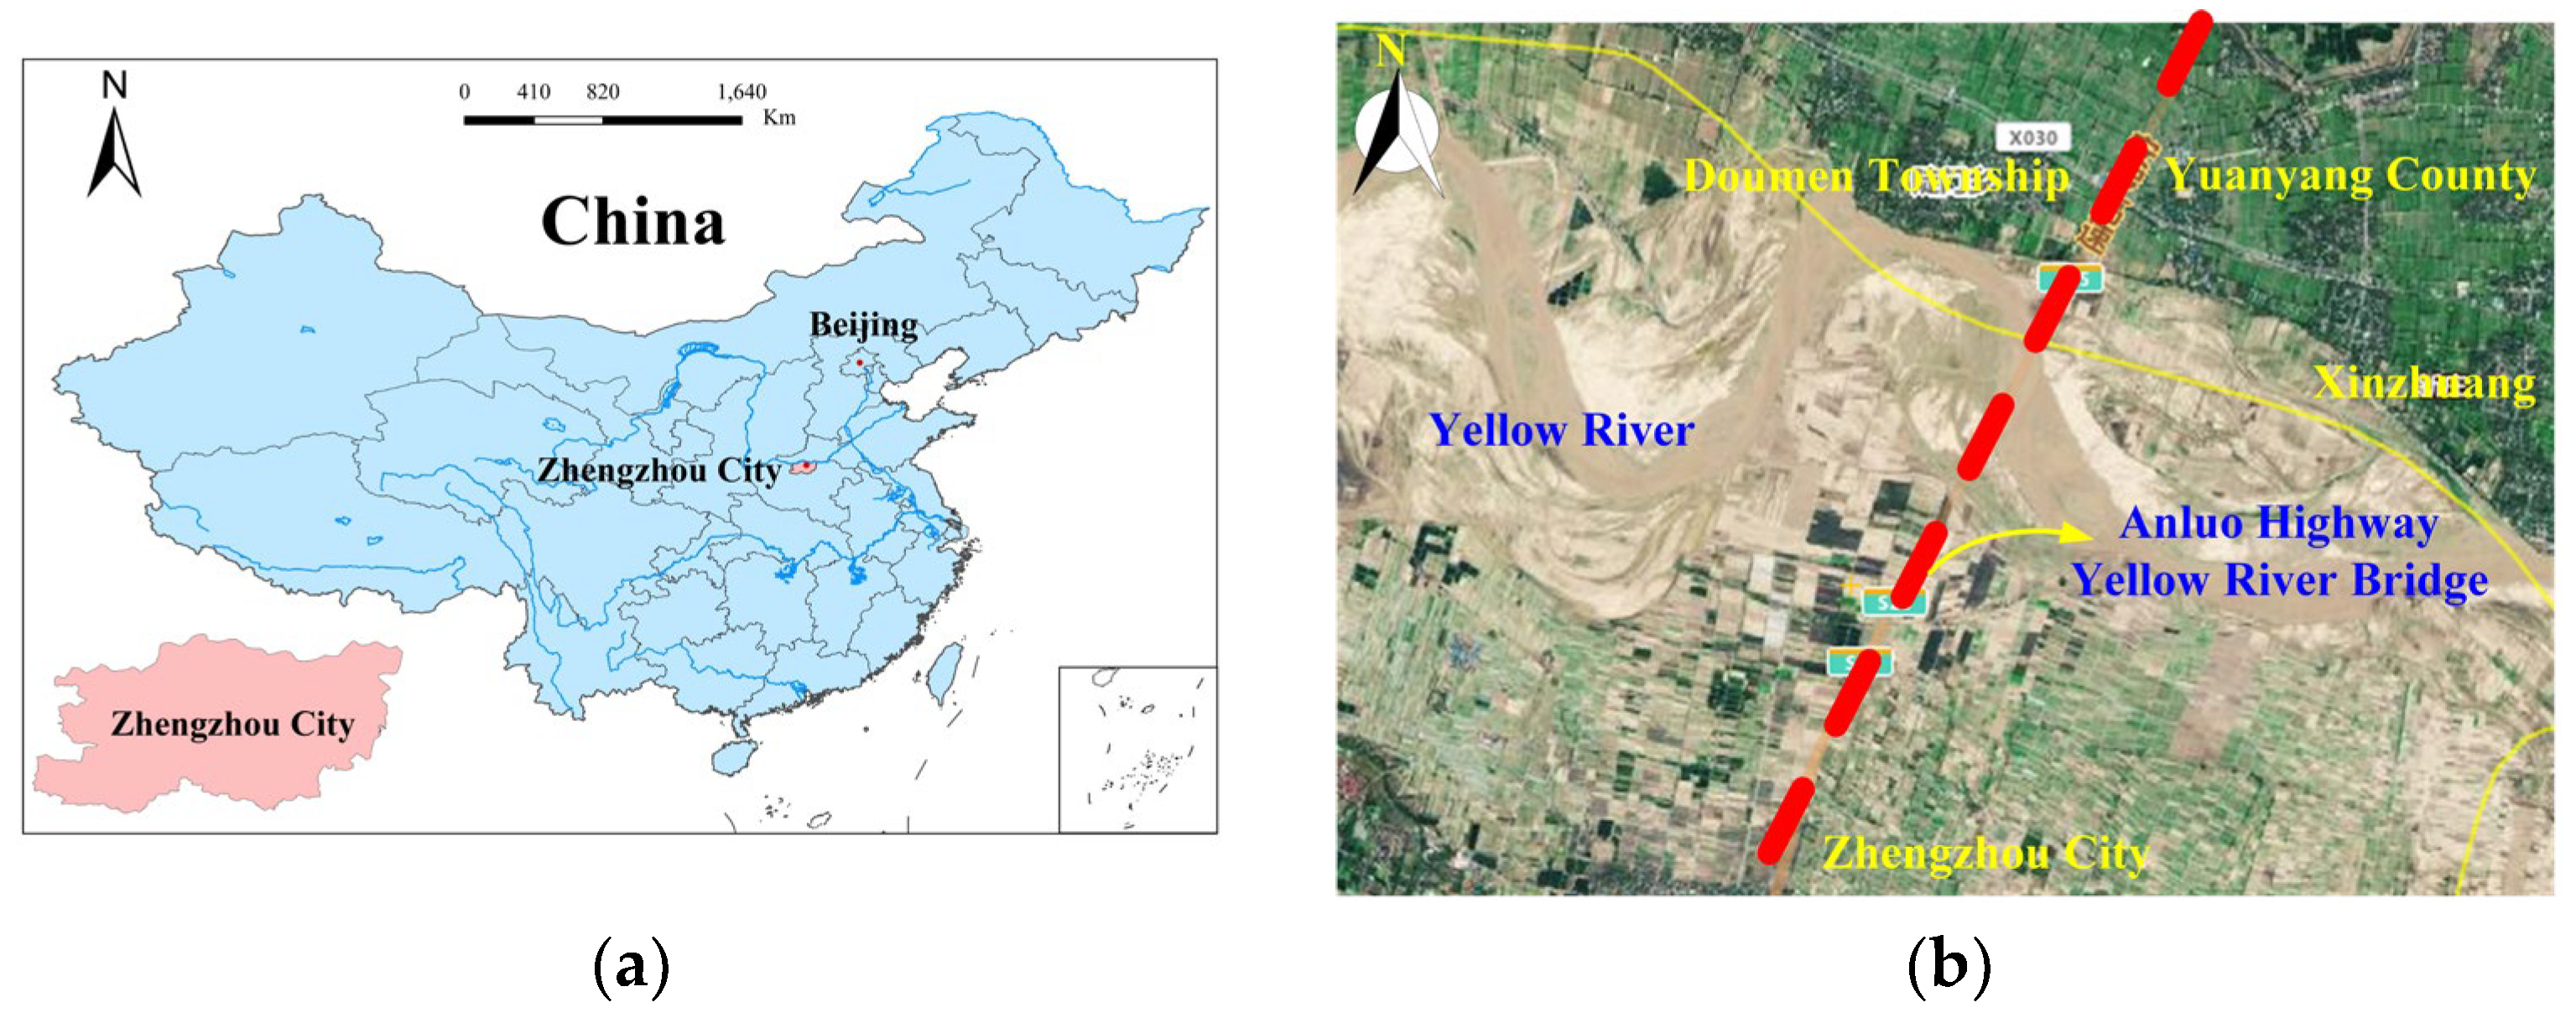
:1. Introduction
2. Model Tests
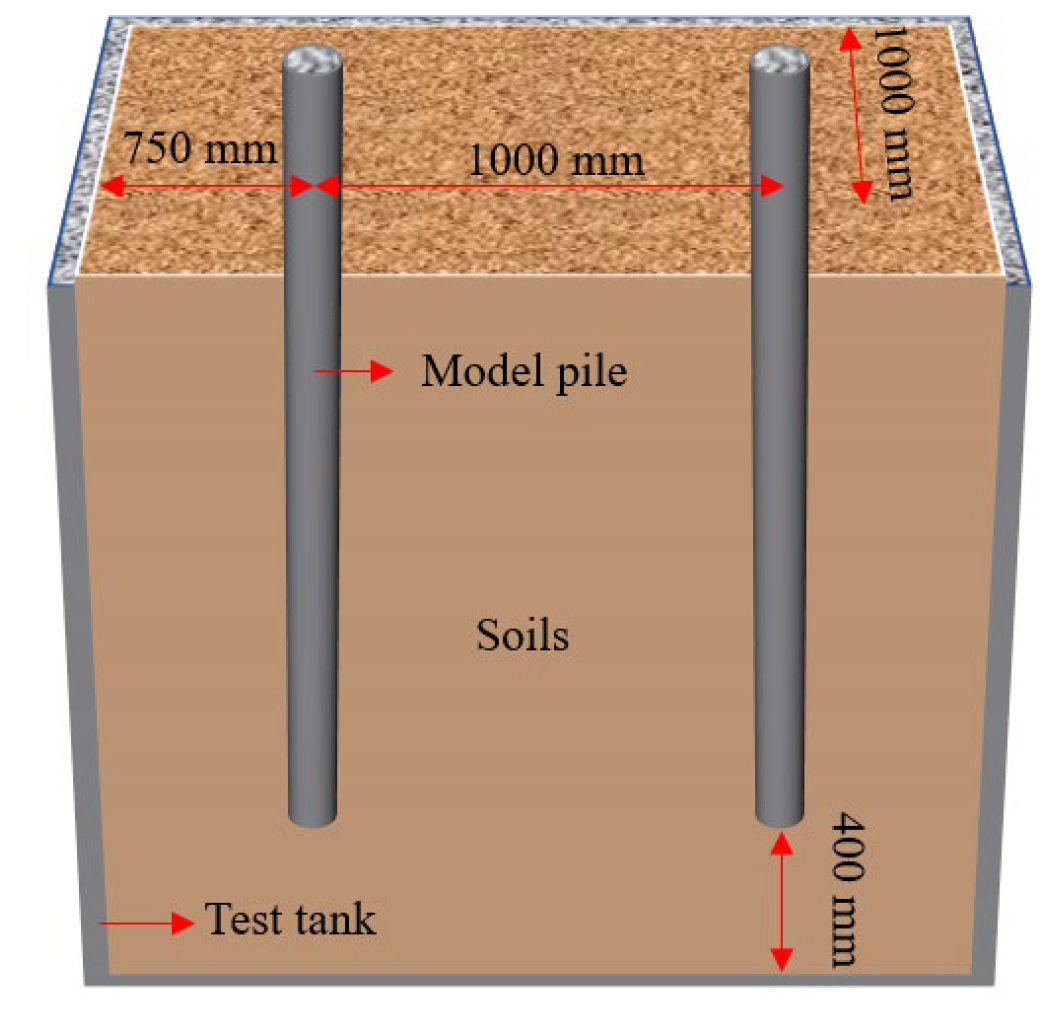
2.1. Model Test Tank
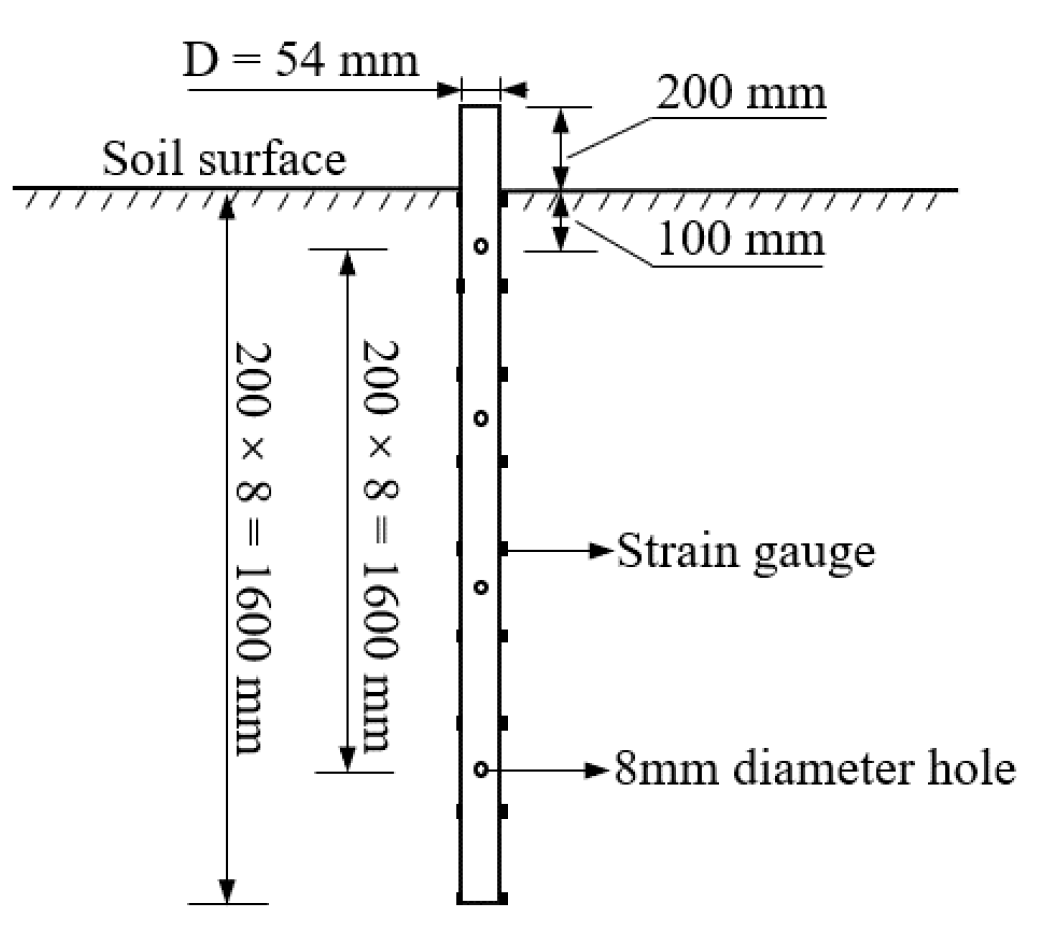
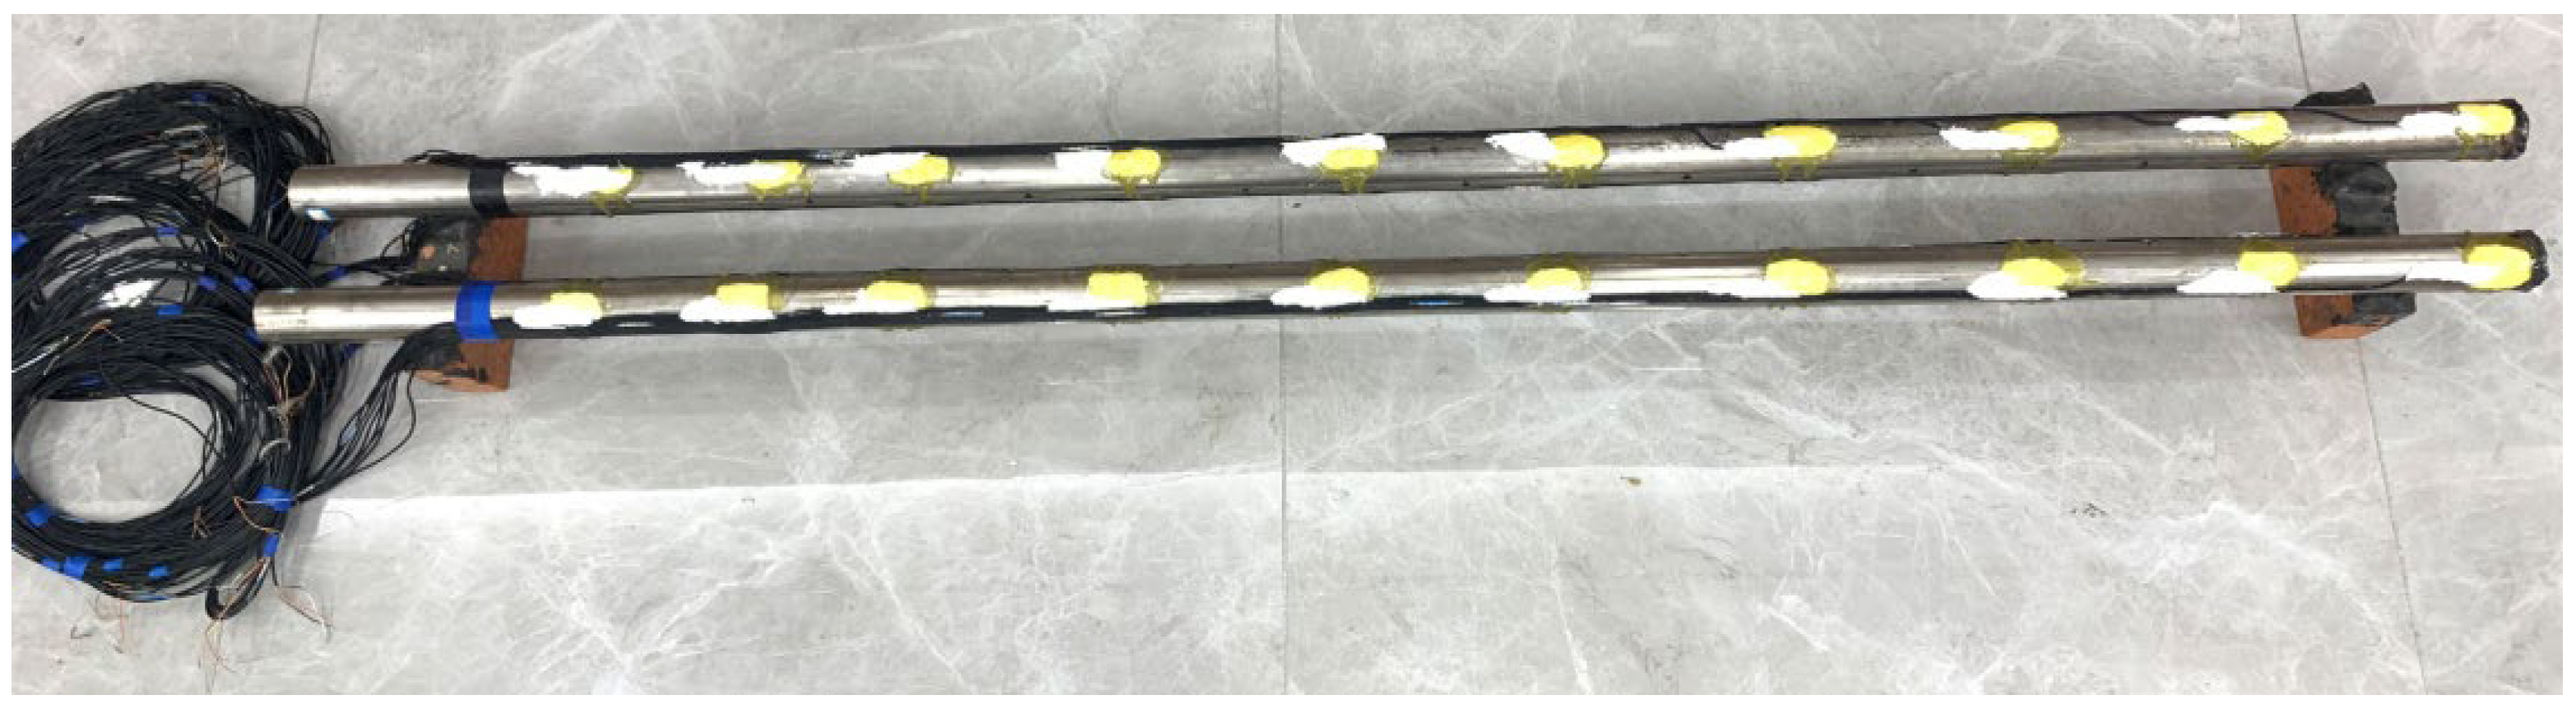
2.2. Model Pile Preparation
2.3. Model Soil and Pile Formation Methods
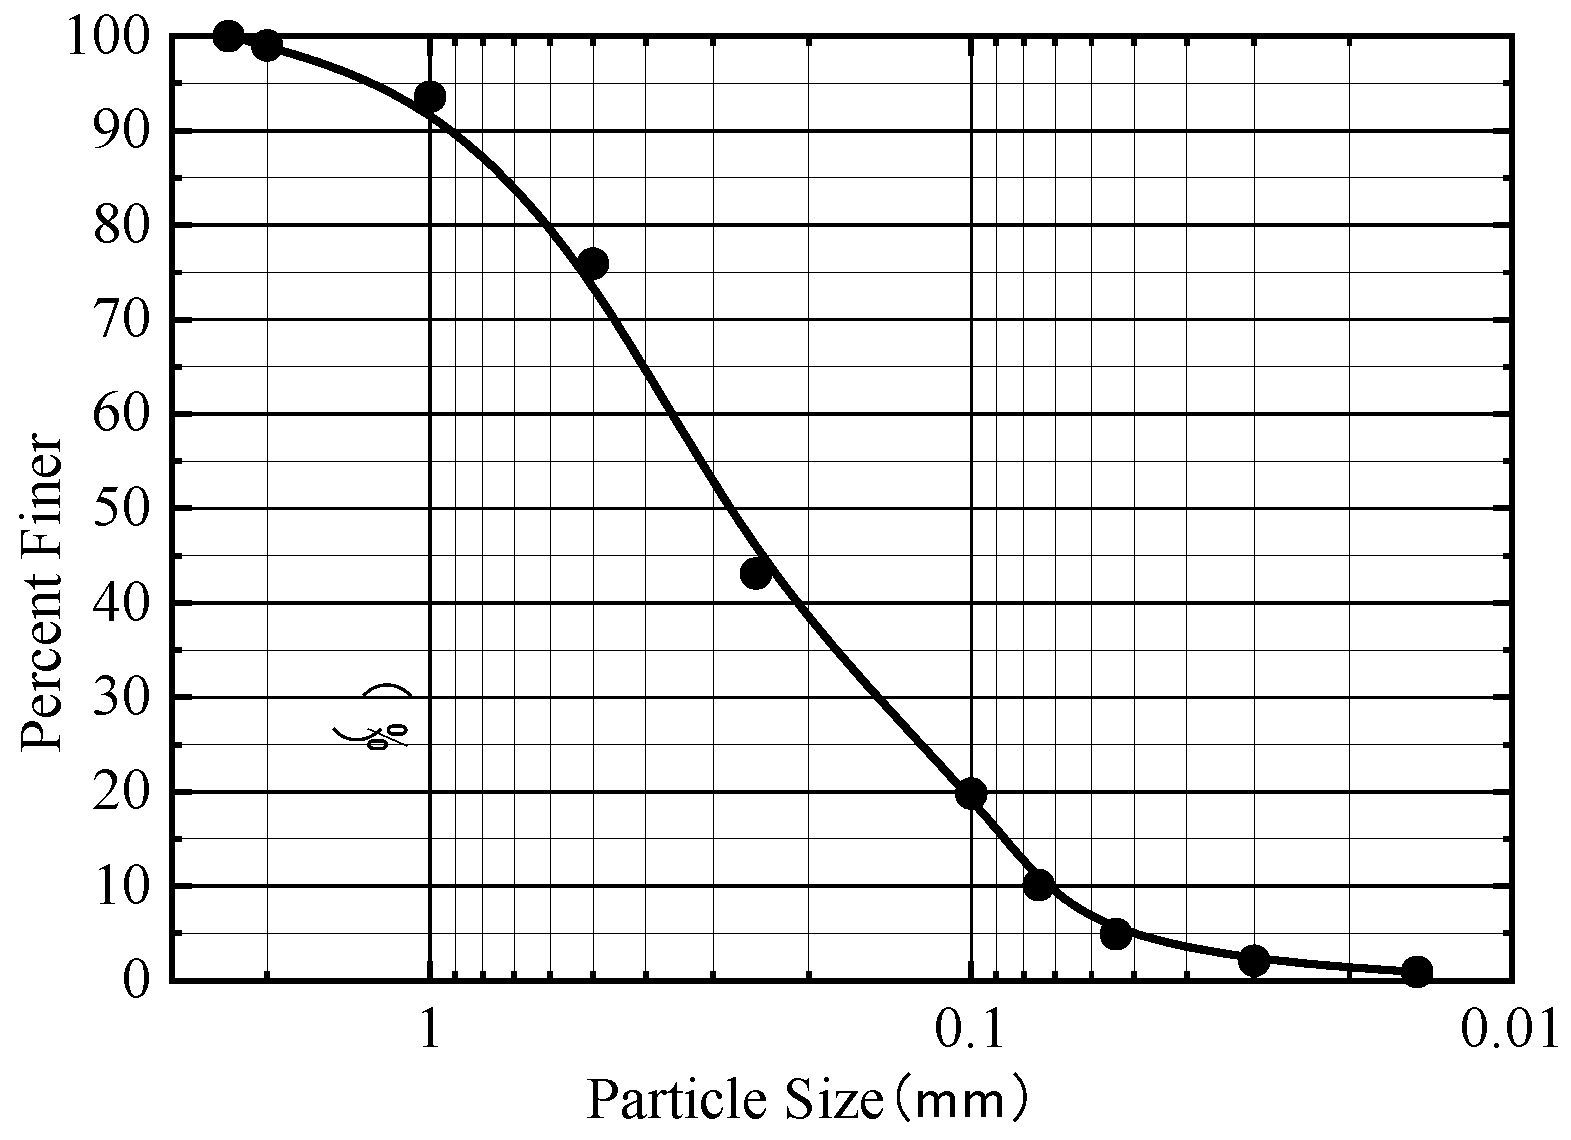
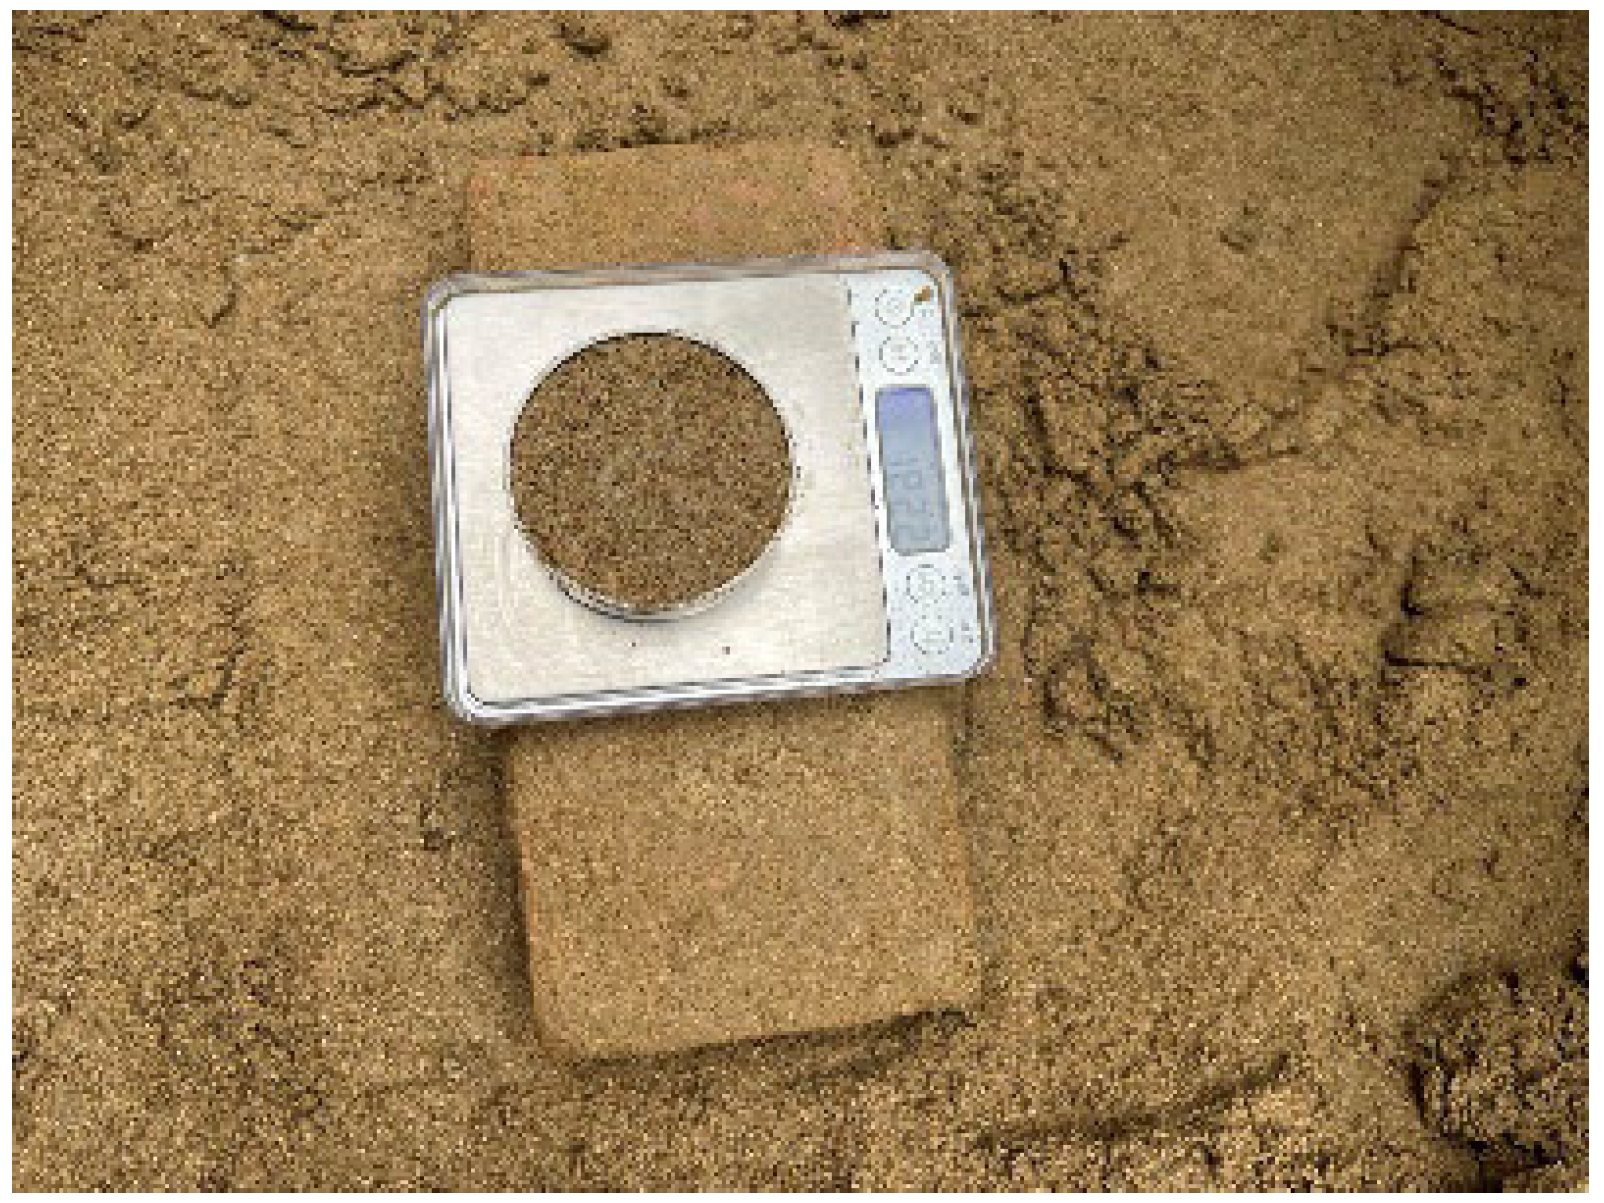
2.3.1. Soil
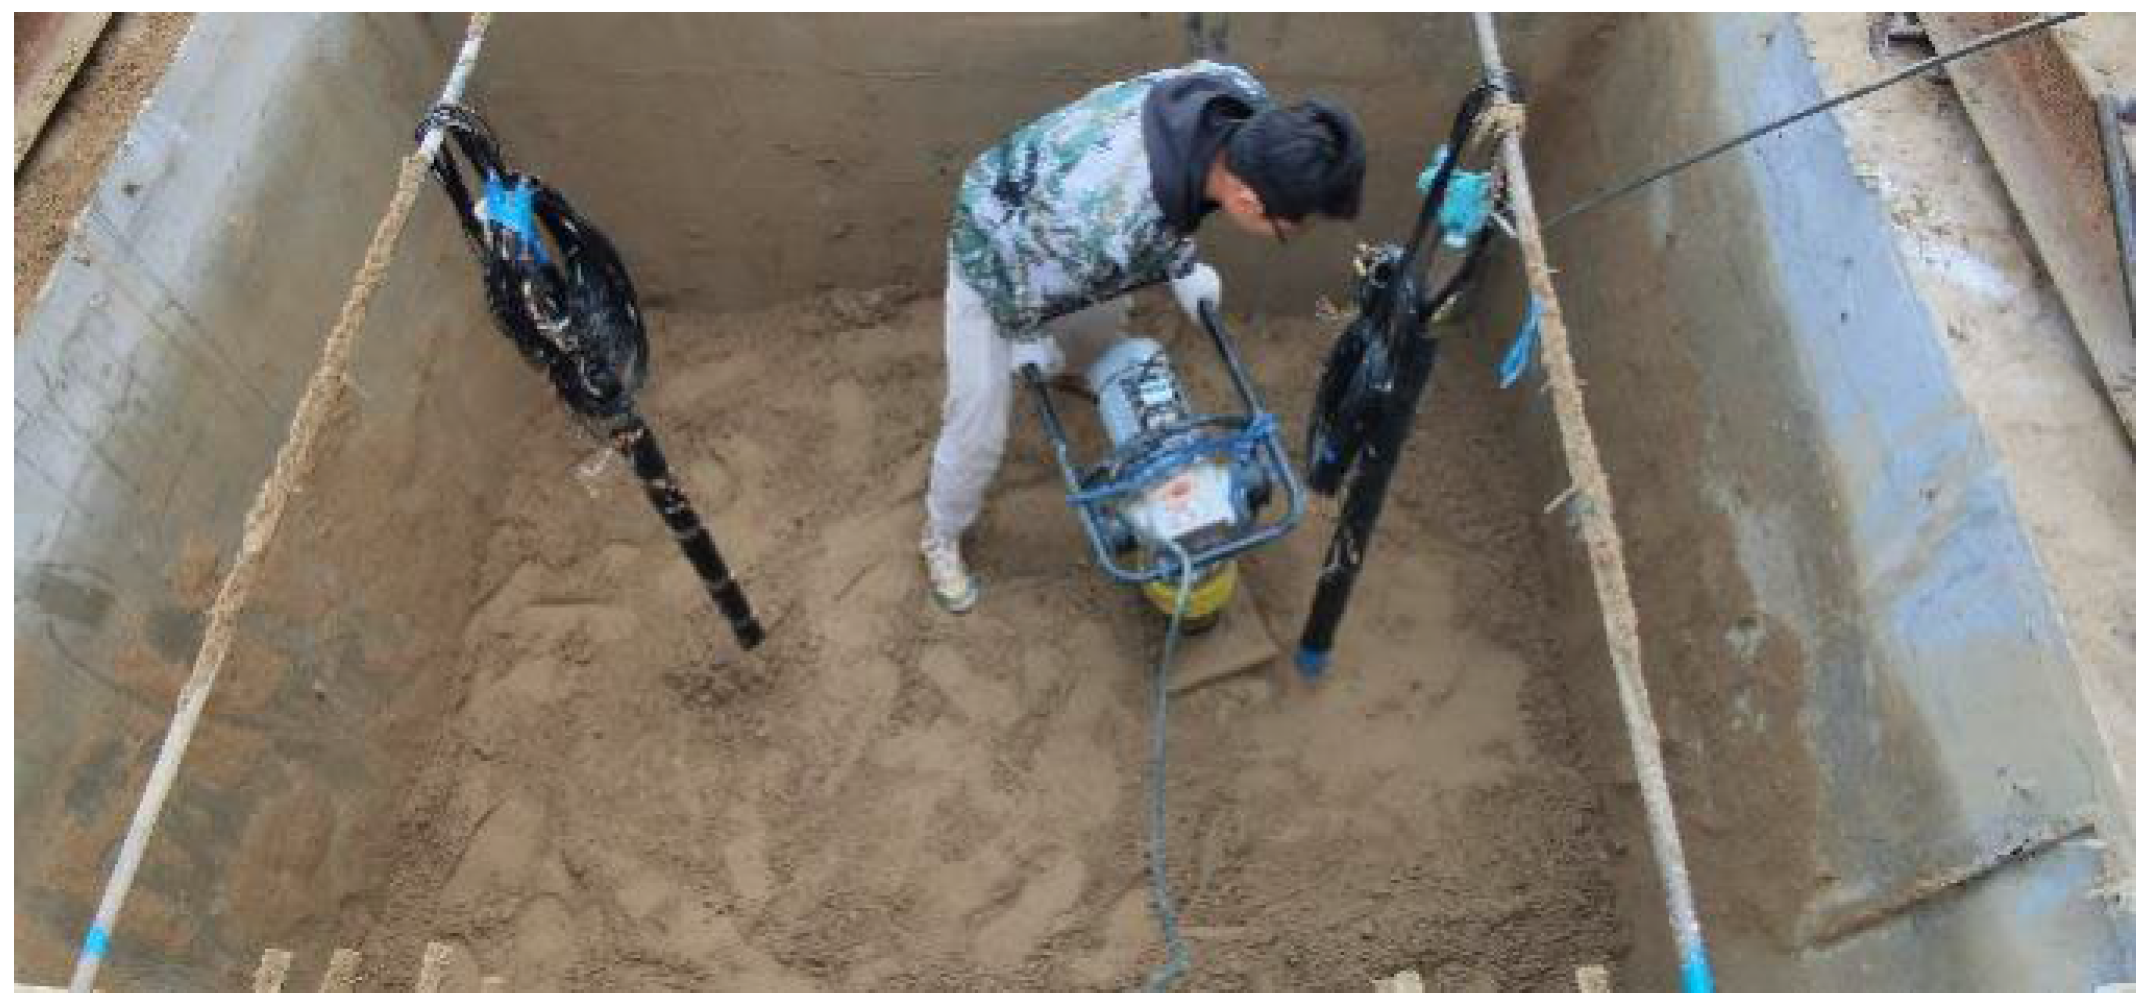
2.3.2. Formation of Pile
2.4. Test Programs and Devices
2.4.1. Grouting Program
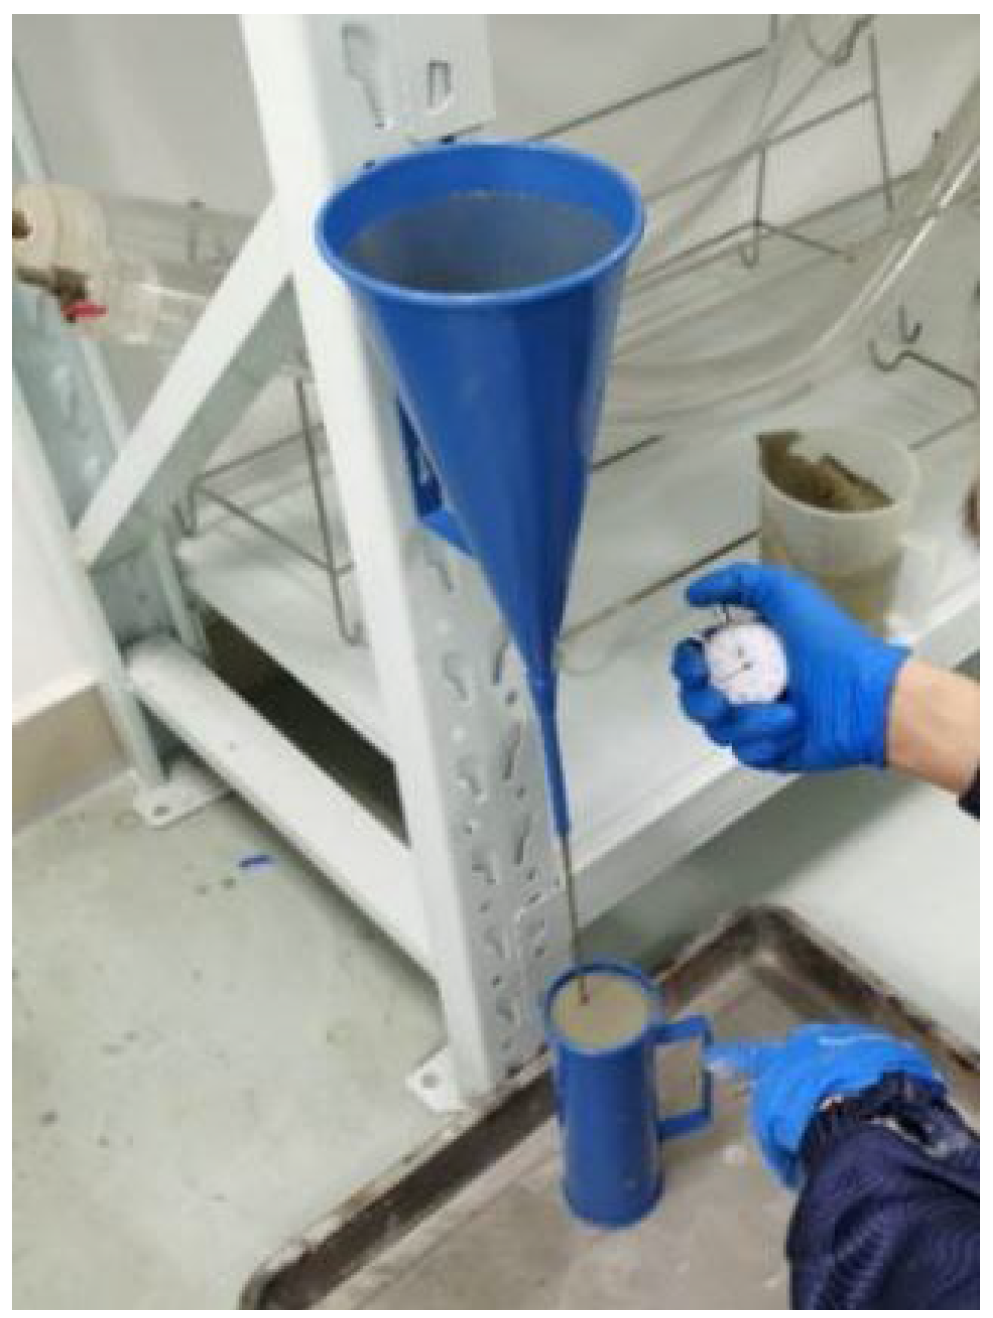
- It has better injectability. Under a uniform flow degree (15 s), the water secretion rate of geopolymer slurry is less than 0.4%, while the water secretion rate of ordinary cement is more than 2%. The higher water secretion causes the cement slurry in the soil body to reduce the flow performance, the slurry diffusion range is reduced and in the process of grouting, there is a phenomenon of running slurry in the cement slurry in the shallower grouting position, which results in reductions in the final grouting volume.
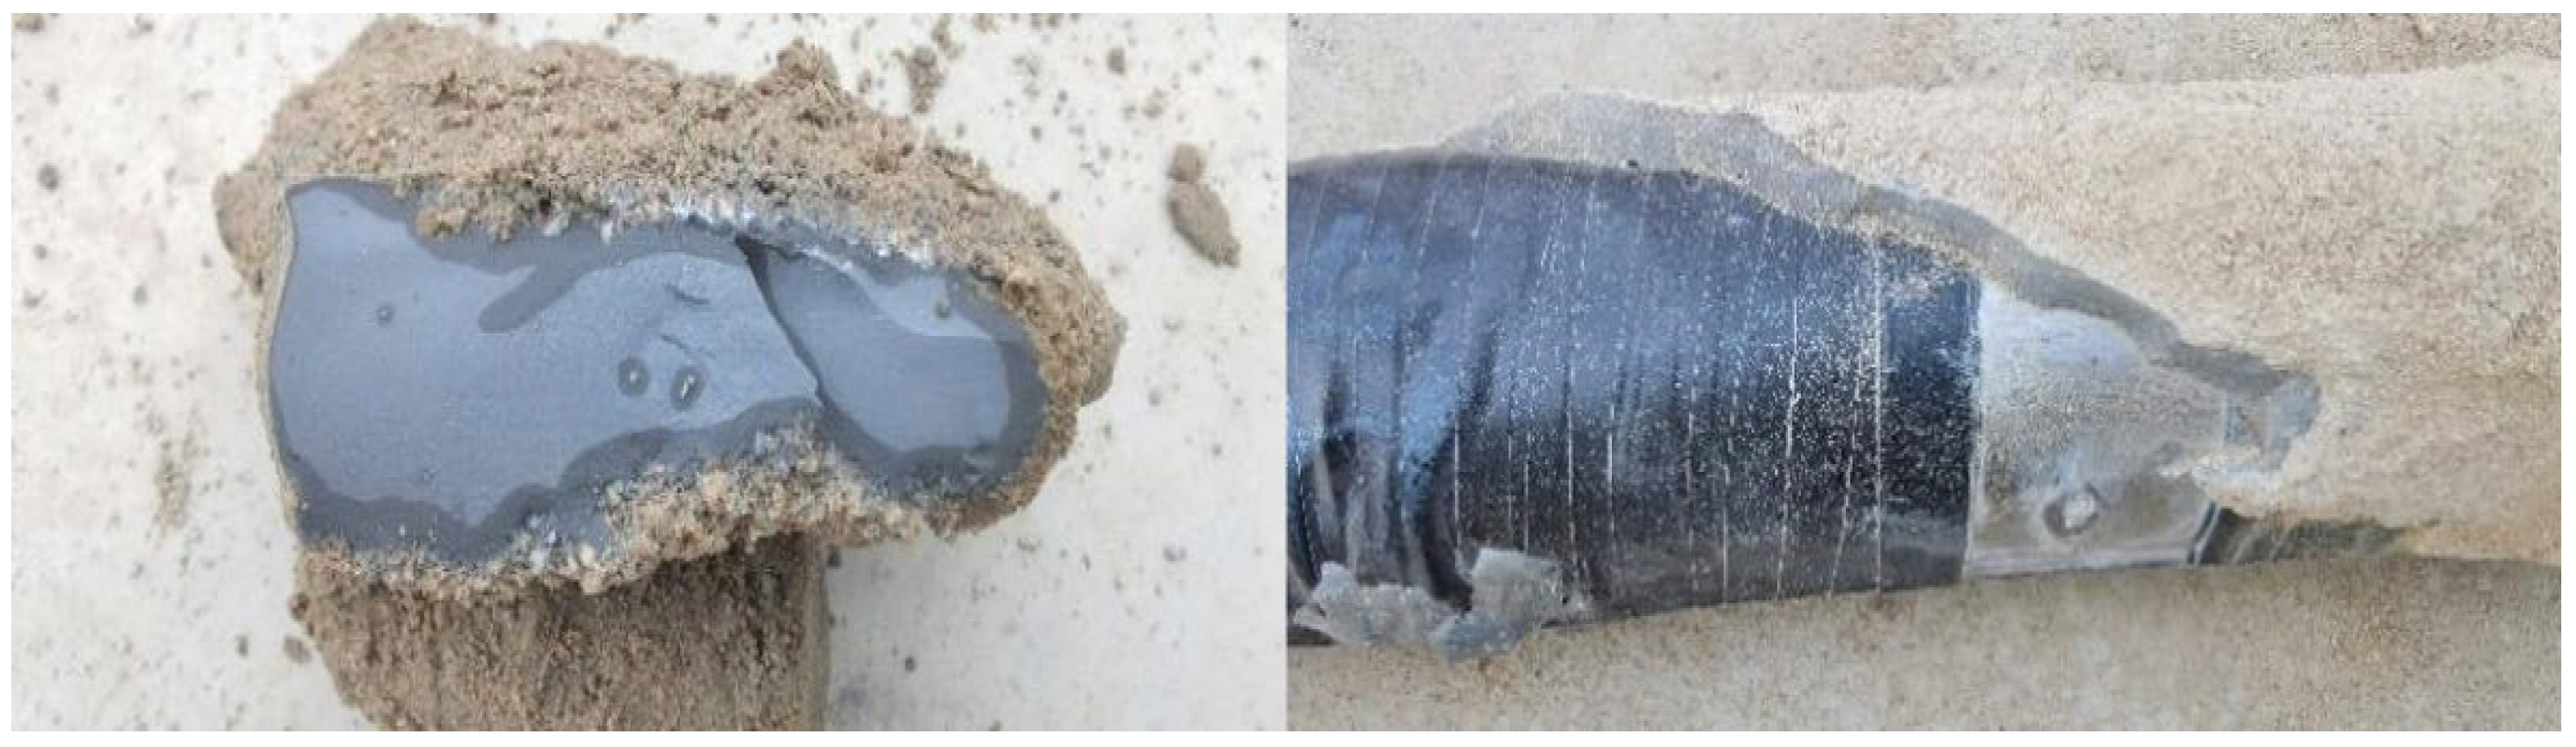
- The diffusion form and range of the CN-1-type geopolymer in the grouting position is different from that of ordinary cement. In this grouting process, the diffusion form of geopolymer slurry is mainly compact diffusion, with a small amount of penetration diffusion, and there is a string slurry phenomenon between each solid body, while the diffusion form of cement slurry is mainly cleavage diffusion with a small amount of penetration diffusion. The different diffusion forms lead to a larger reinforcement area of the geopolymer-grouted pile and a more uniform diffusion of the slurry, thus enhancing the bearing capacity of the model pile.
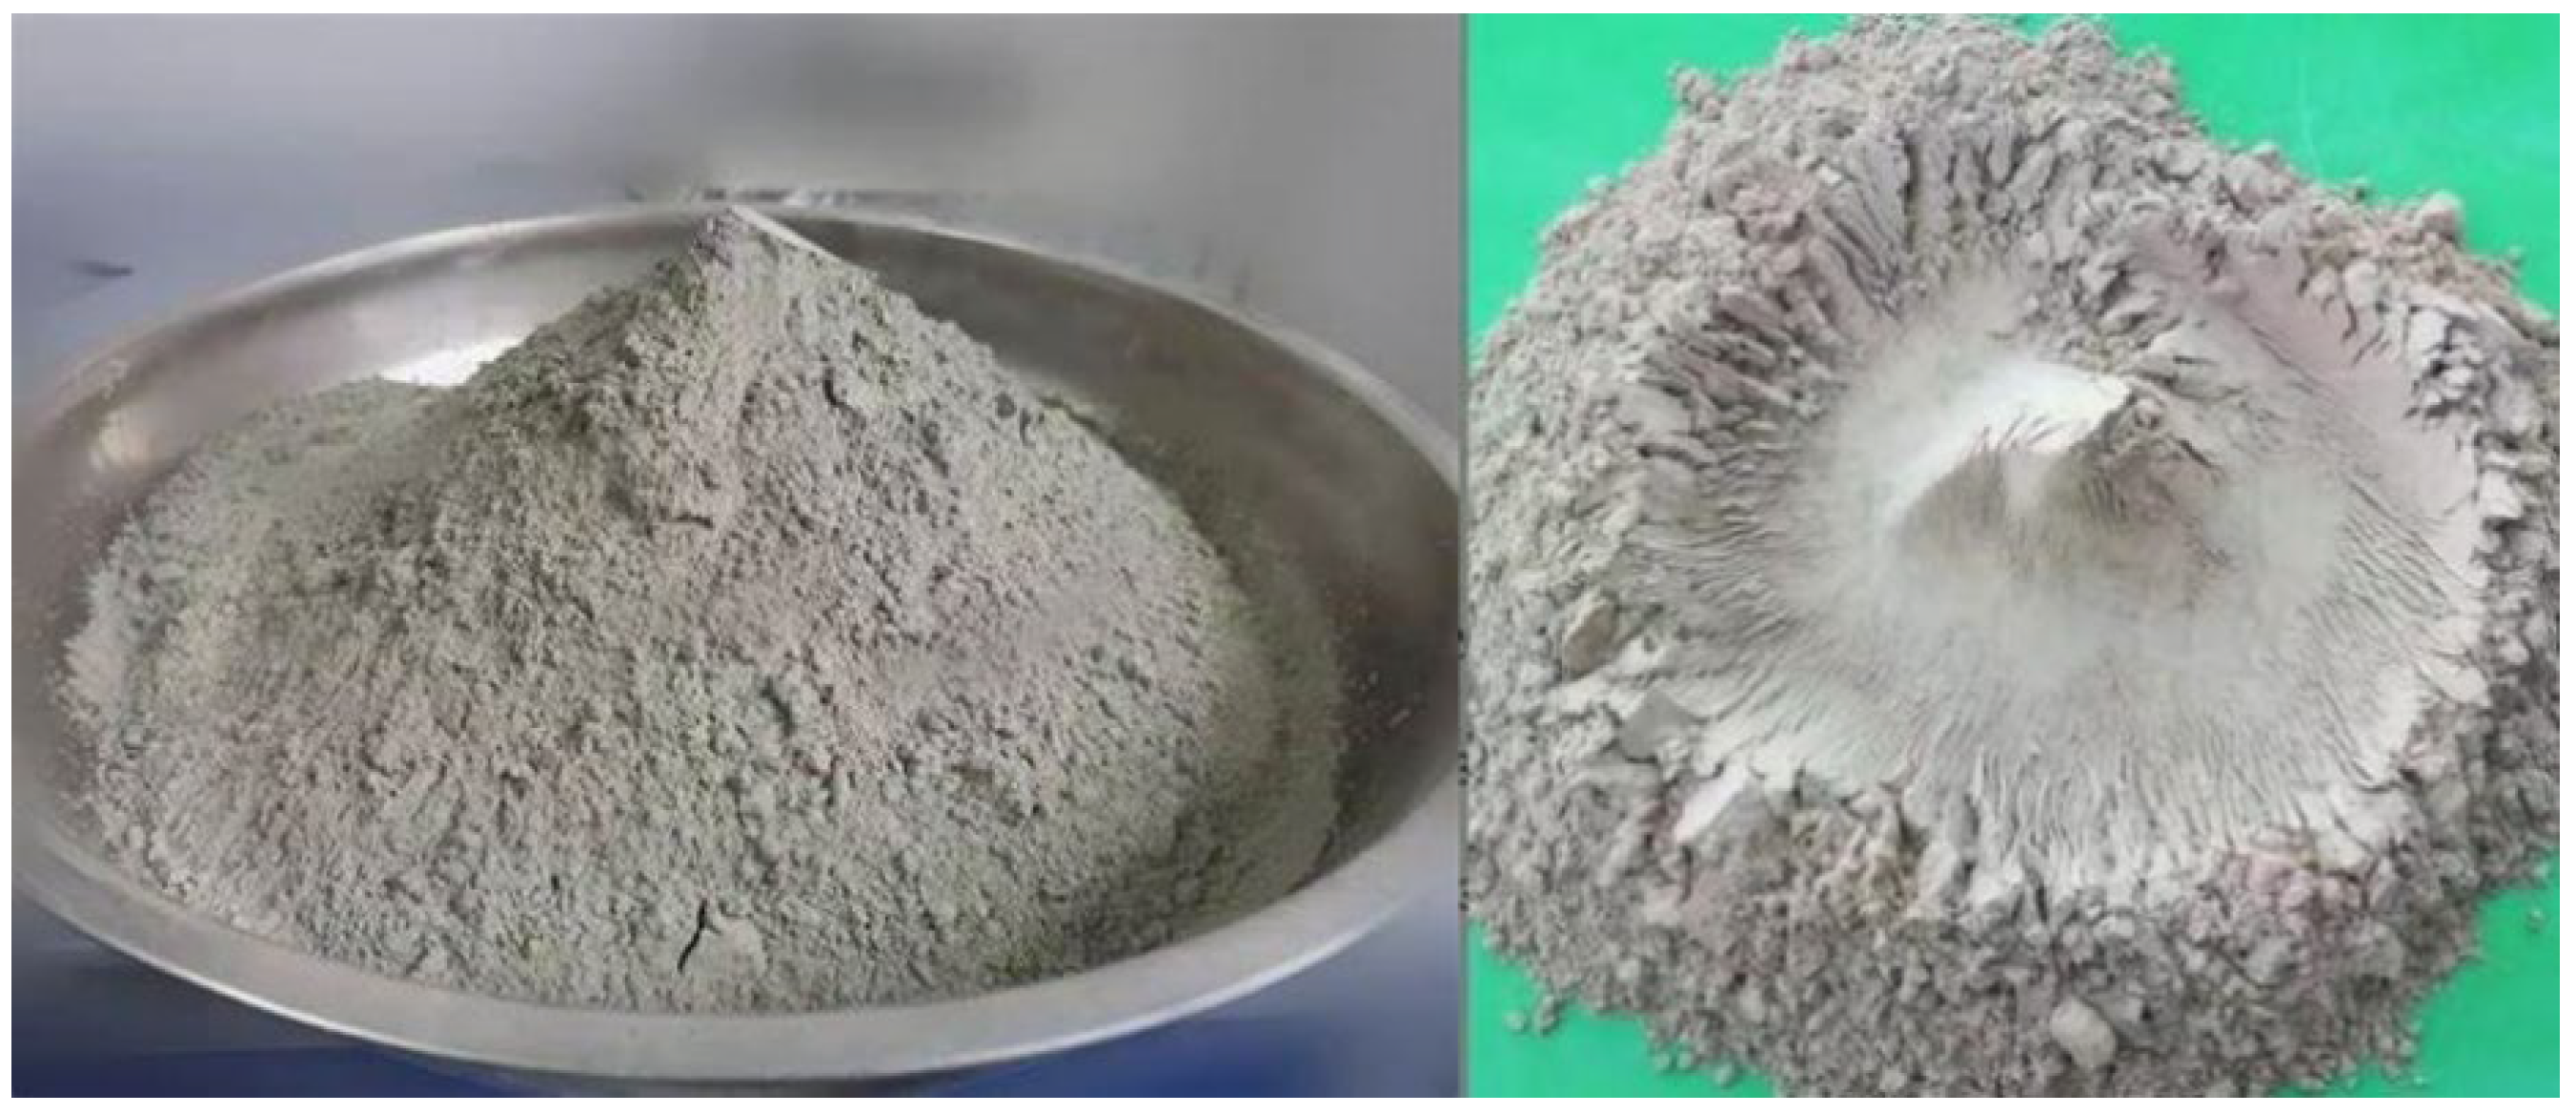
- The CN-1-type geopolymer, due to the biased high territory, slag, fly ash and other silica–aluminum-rich source materials, results in the formation of hydration products with a large number of silicon, aluminum, oxygen and alkali metal elements, composing a three-dimensional mesh structure. This structure contributes to the higher strength of the geopolymer solidification body, leading to elevated strength at the interface between the solidification body and the soil. This, in turn, enhances the pile-side friction resistance, ultimately improving the bearing capacity of the model piles.
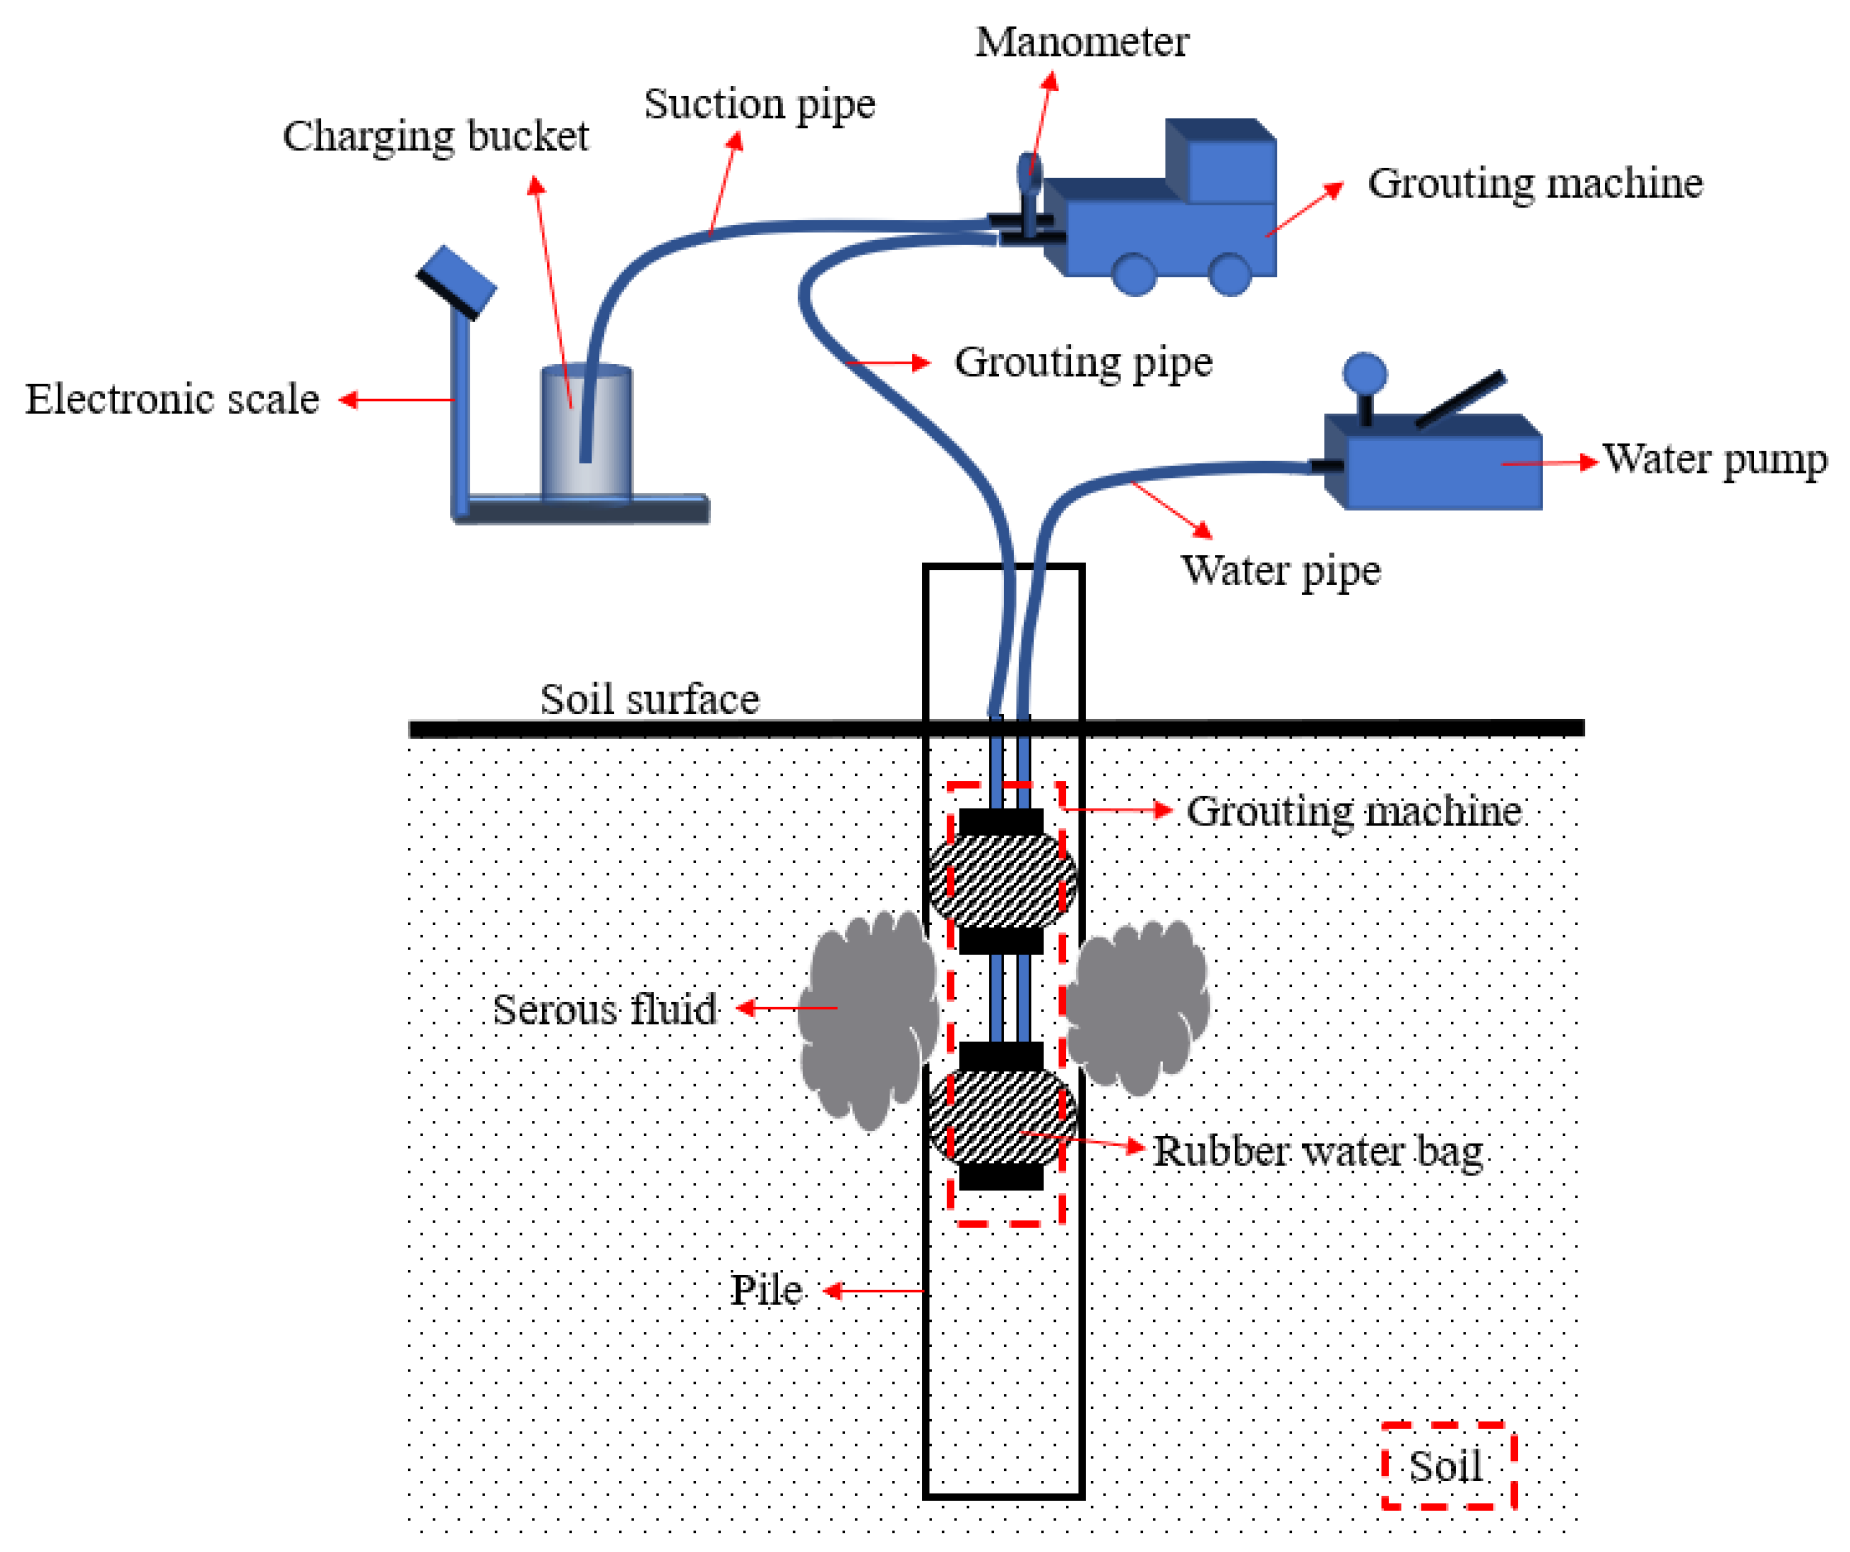
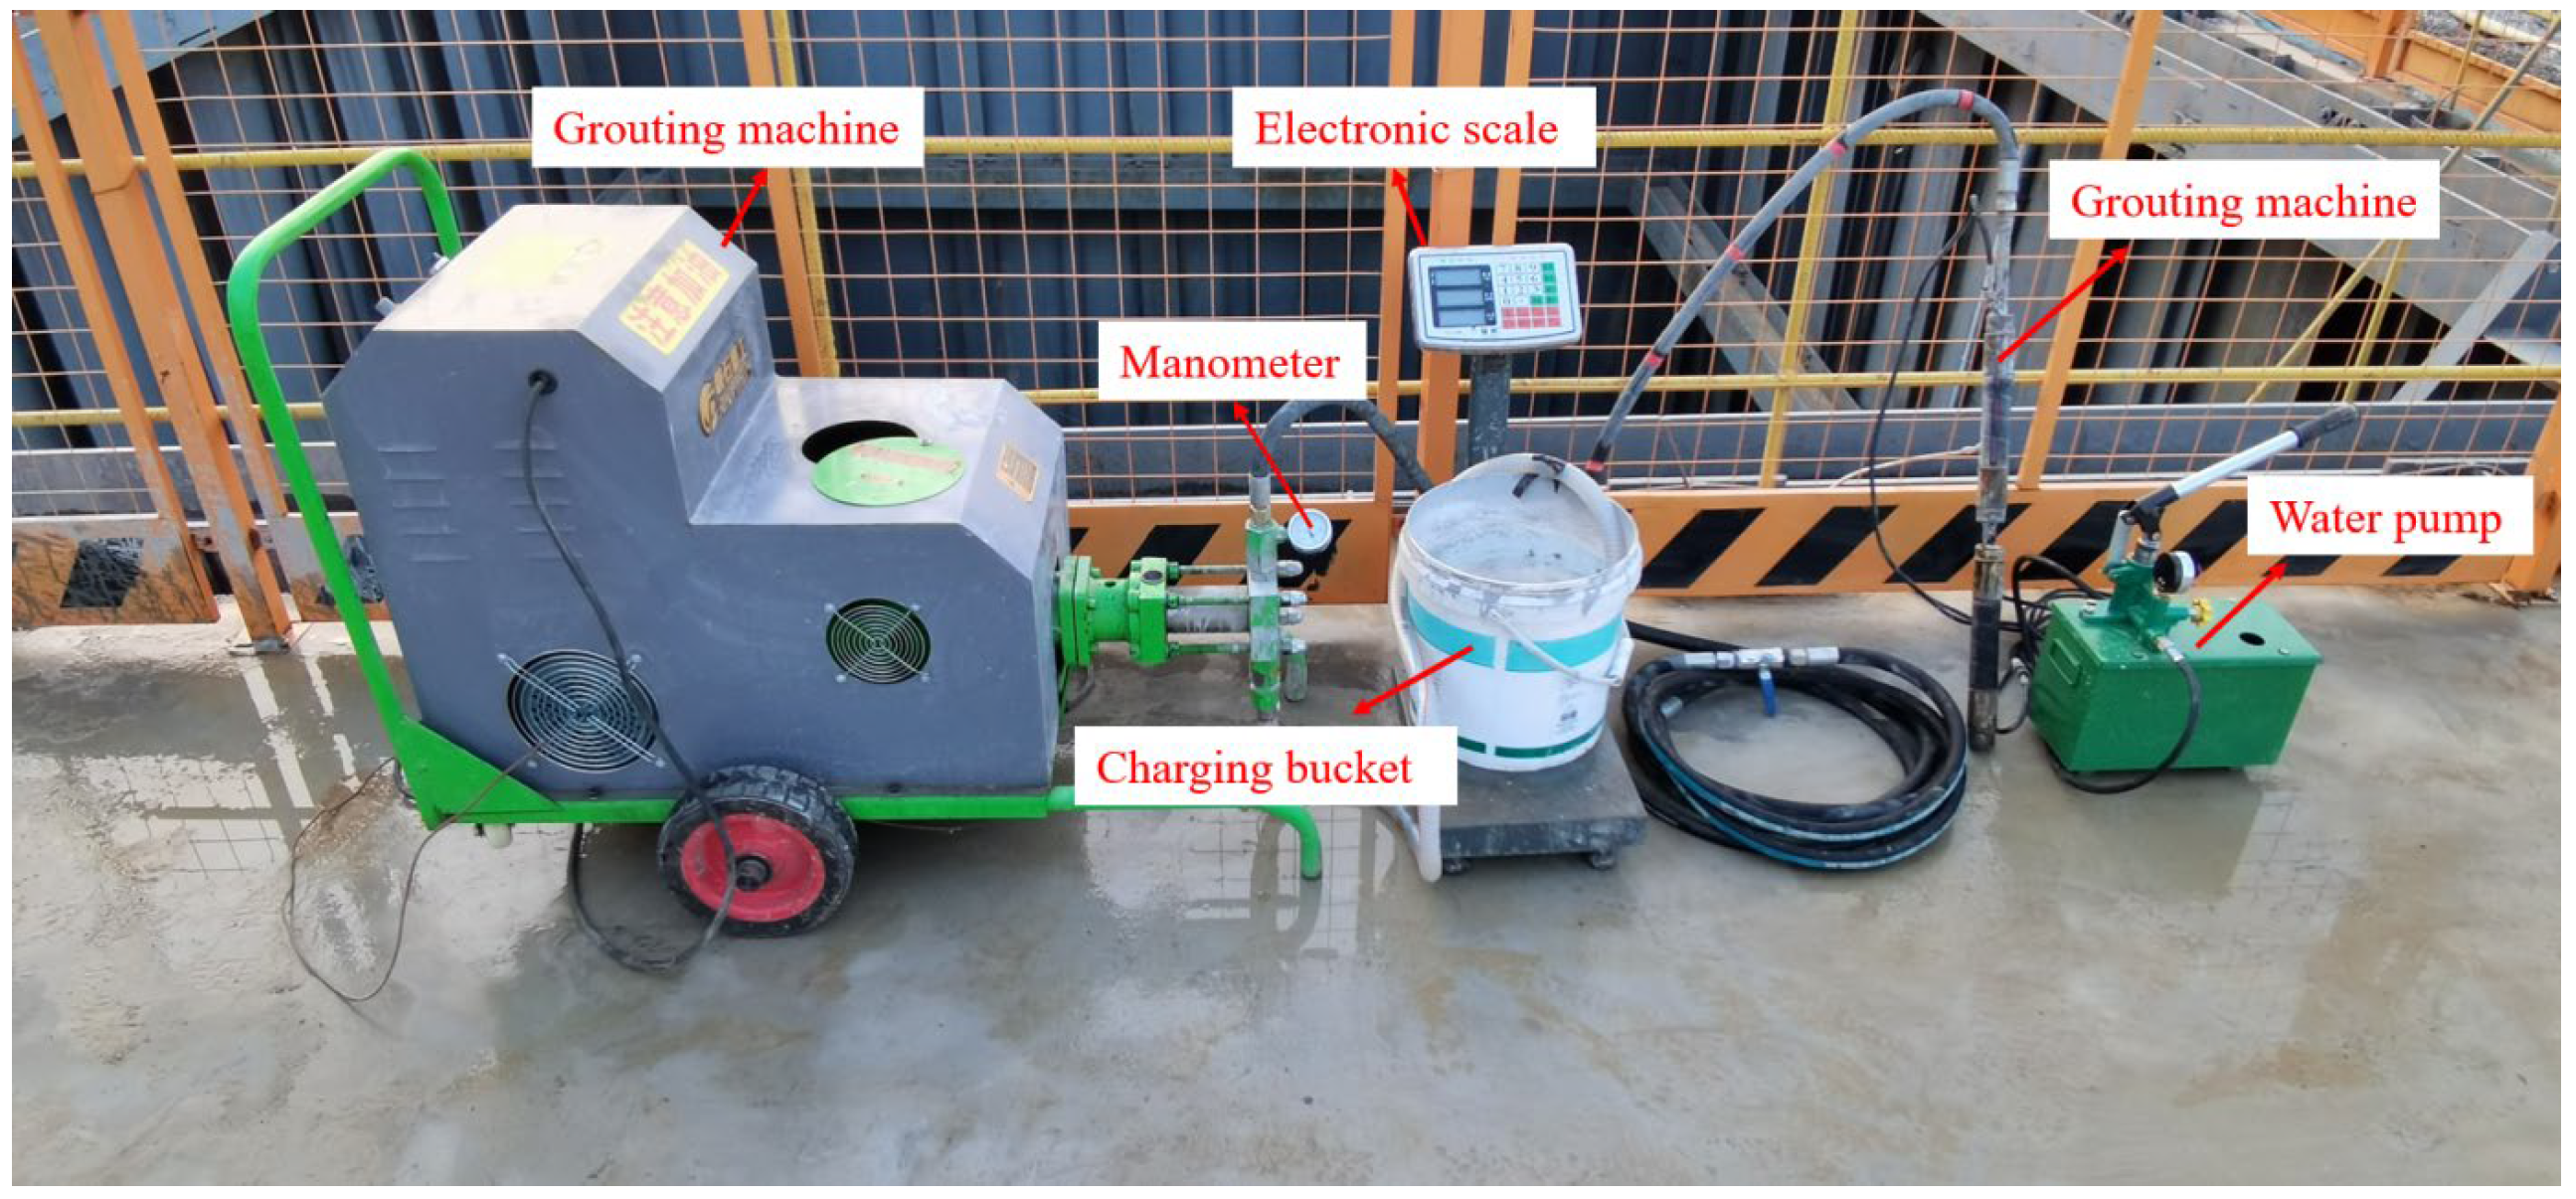
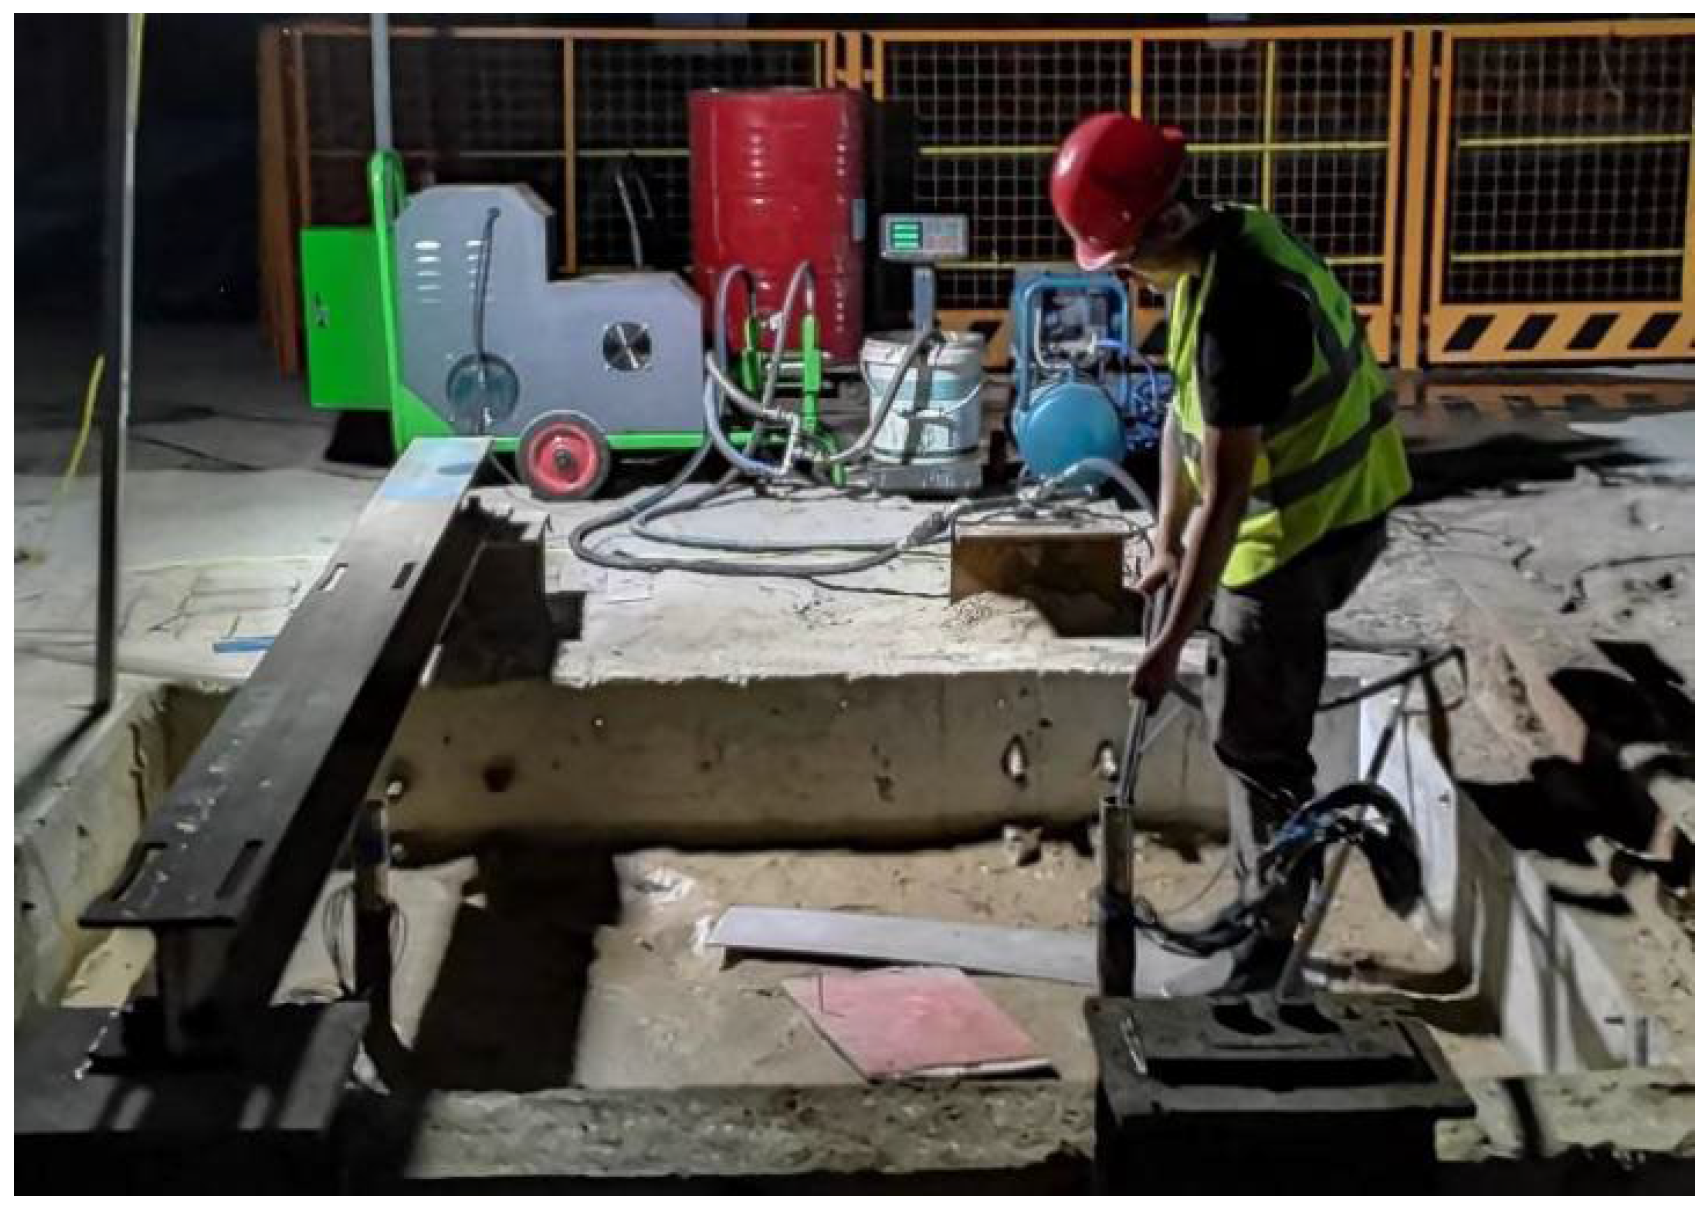
2.4.2. Test Device and Grouting Process
2.5. Vertical Bearing Capacity Test Programs and Devices
2.5.1. Test Programs
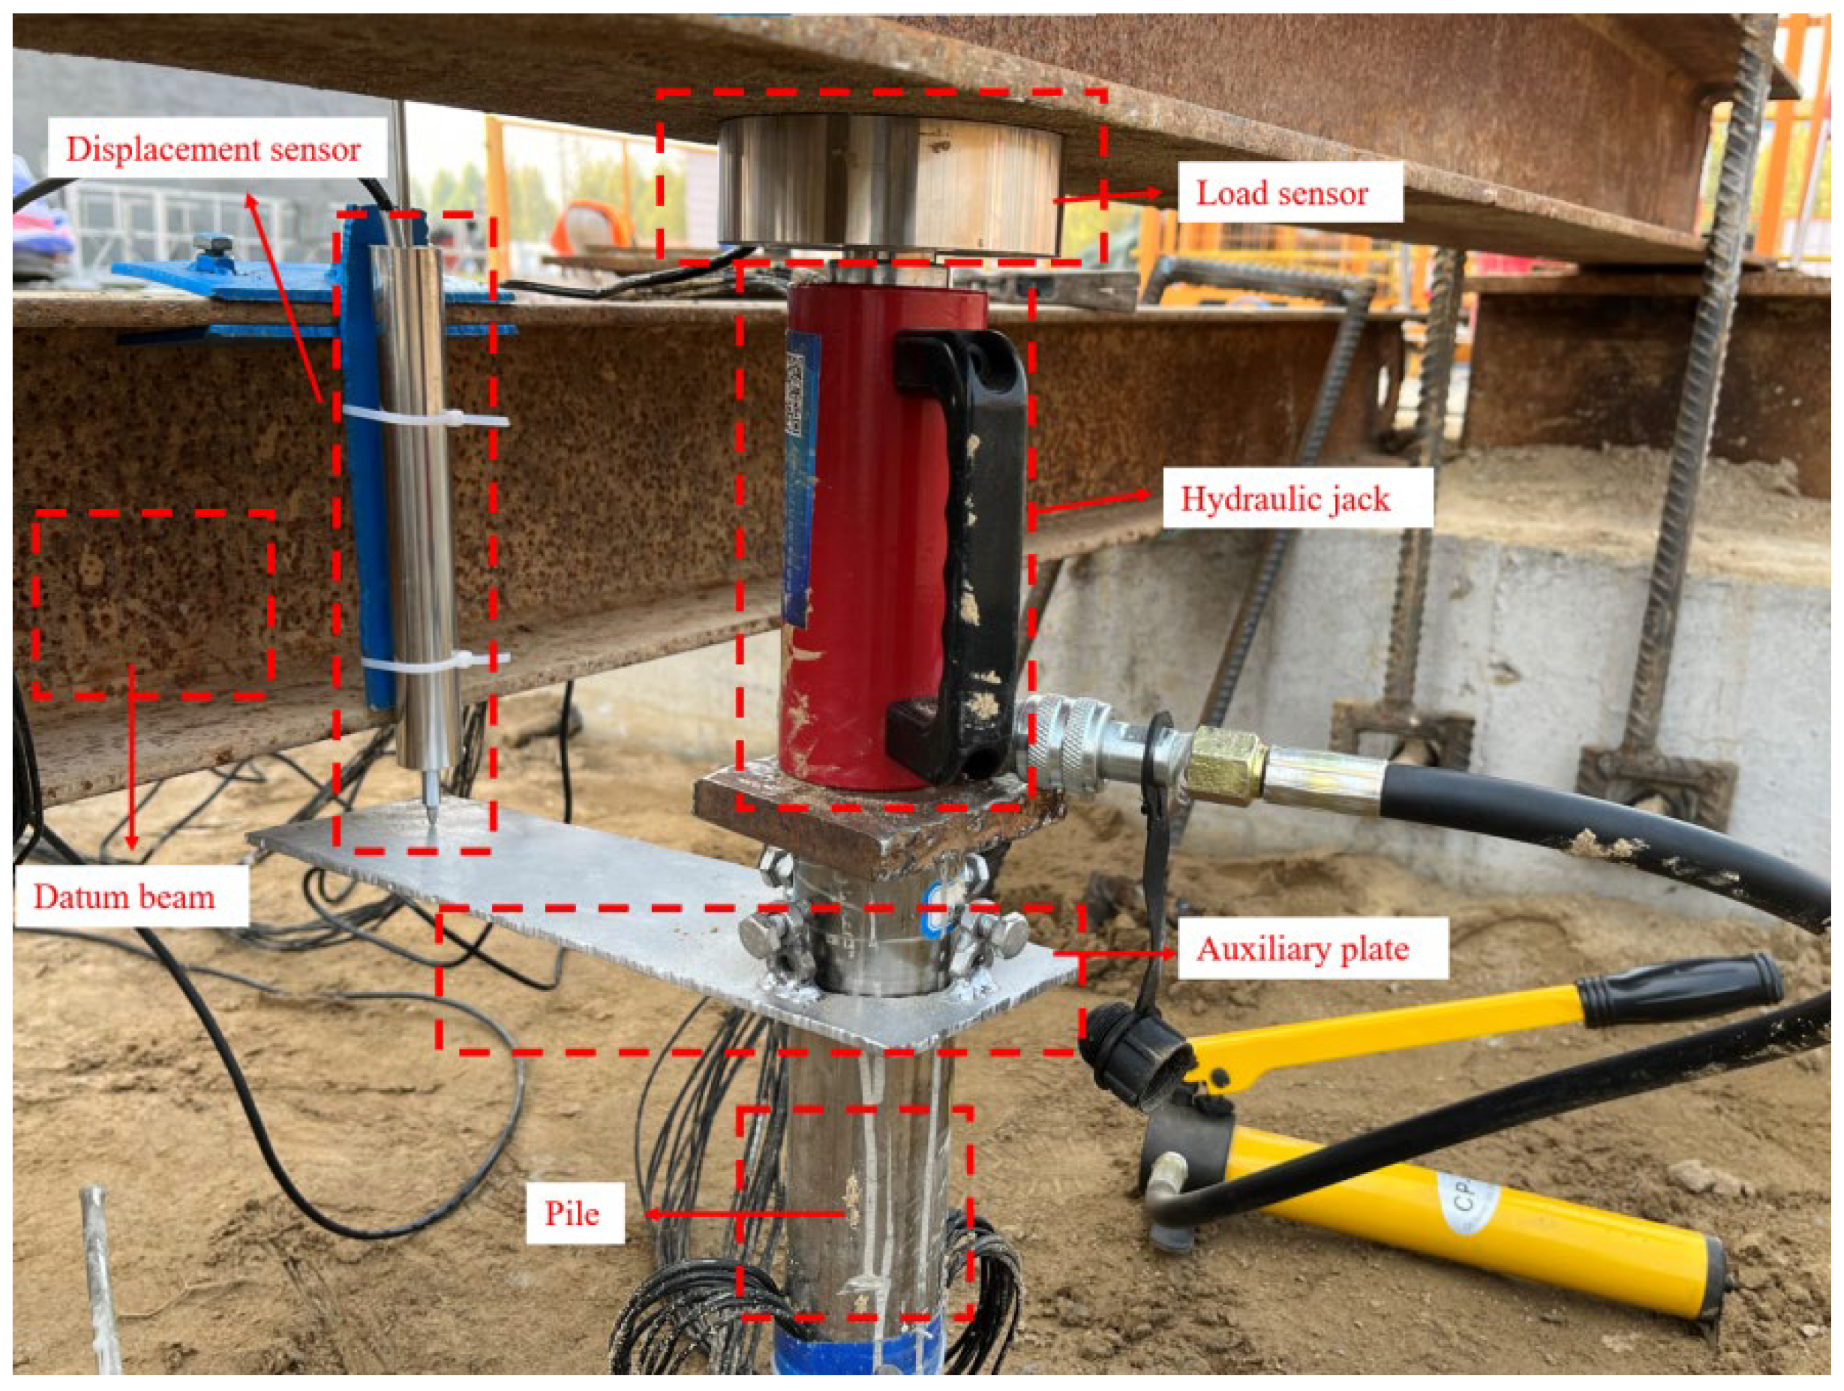
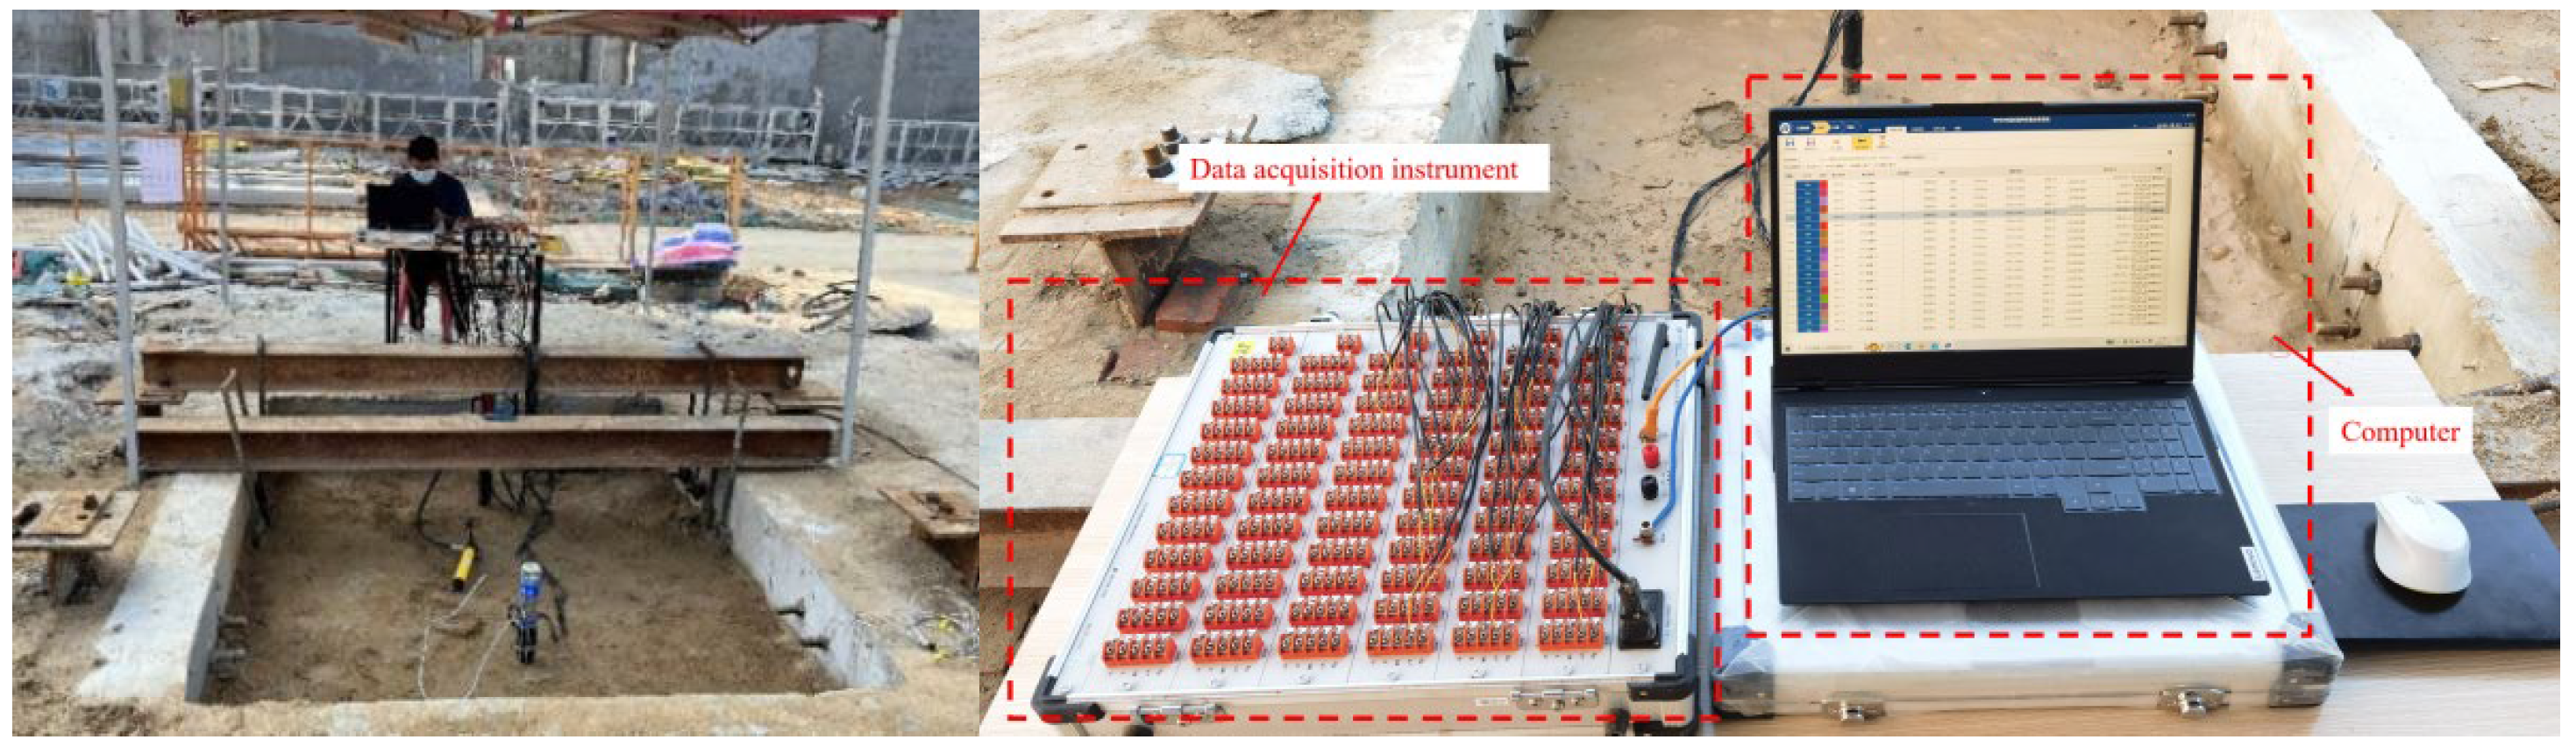
2.5.2. Loading Device
3. Results and Analysis
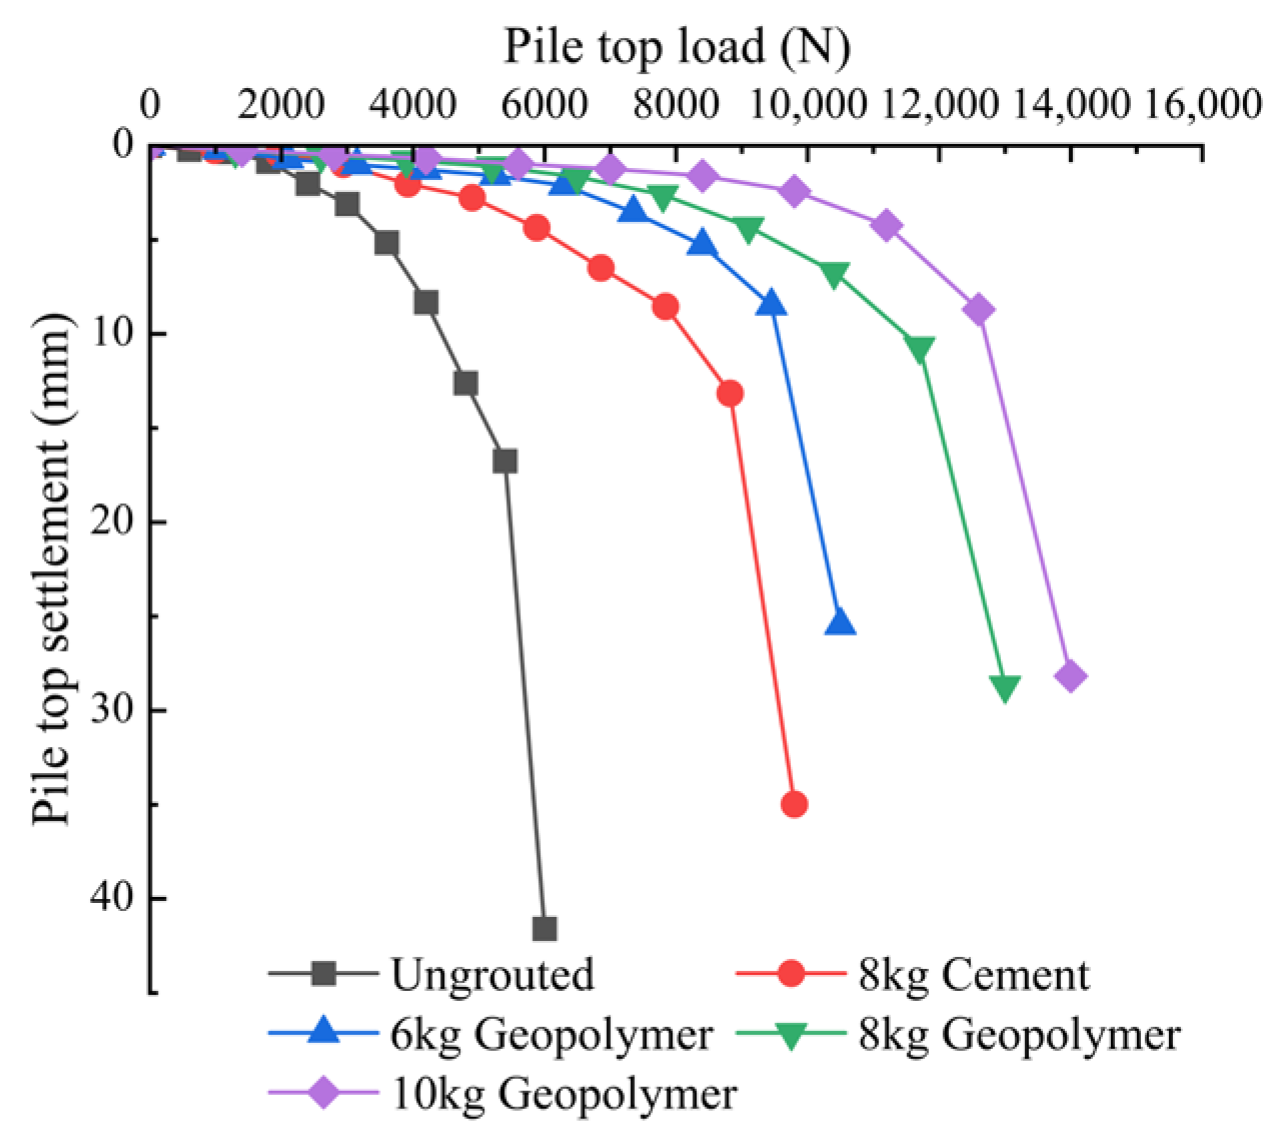
3.1. Pile Top Load–Pile Top Settlement Curve
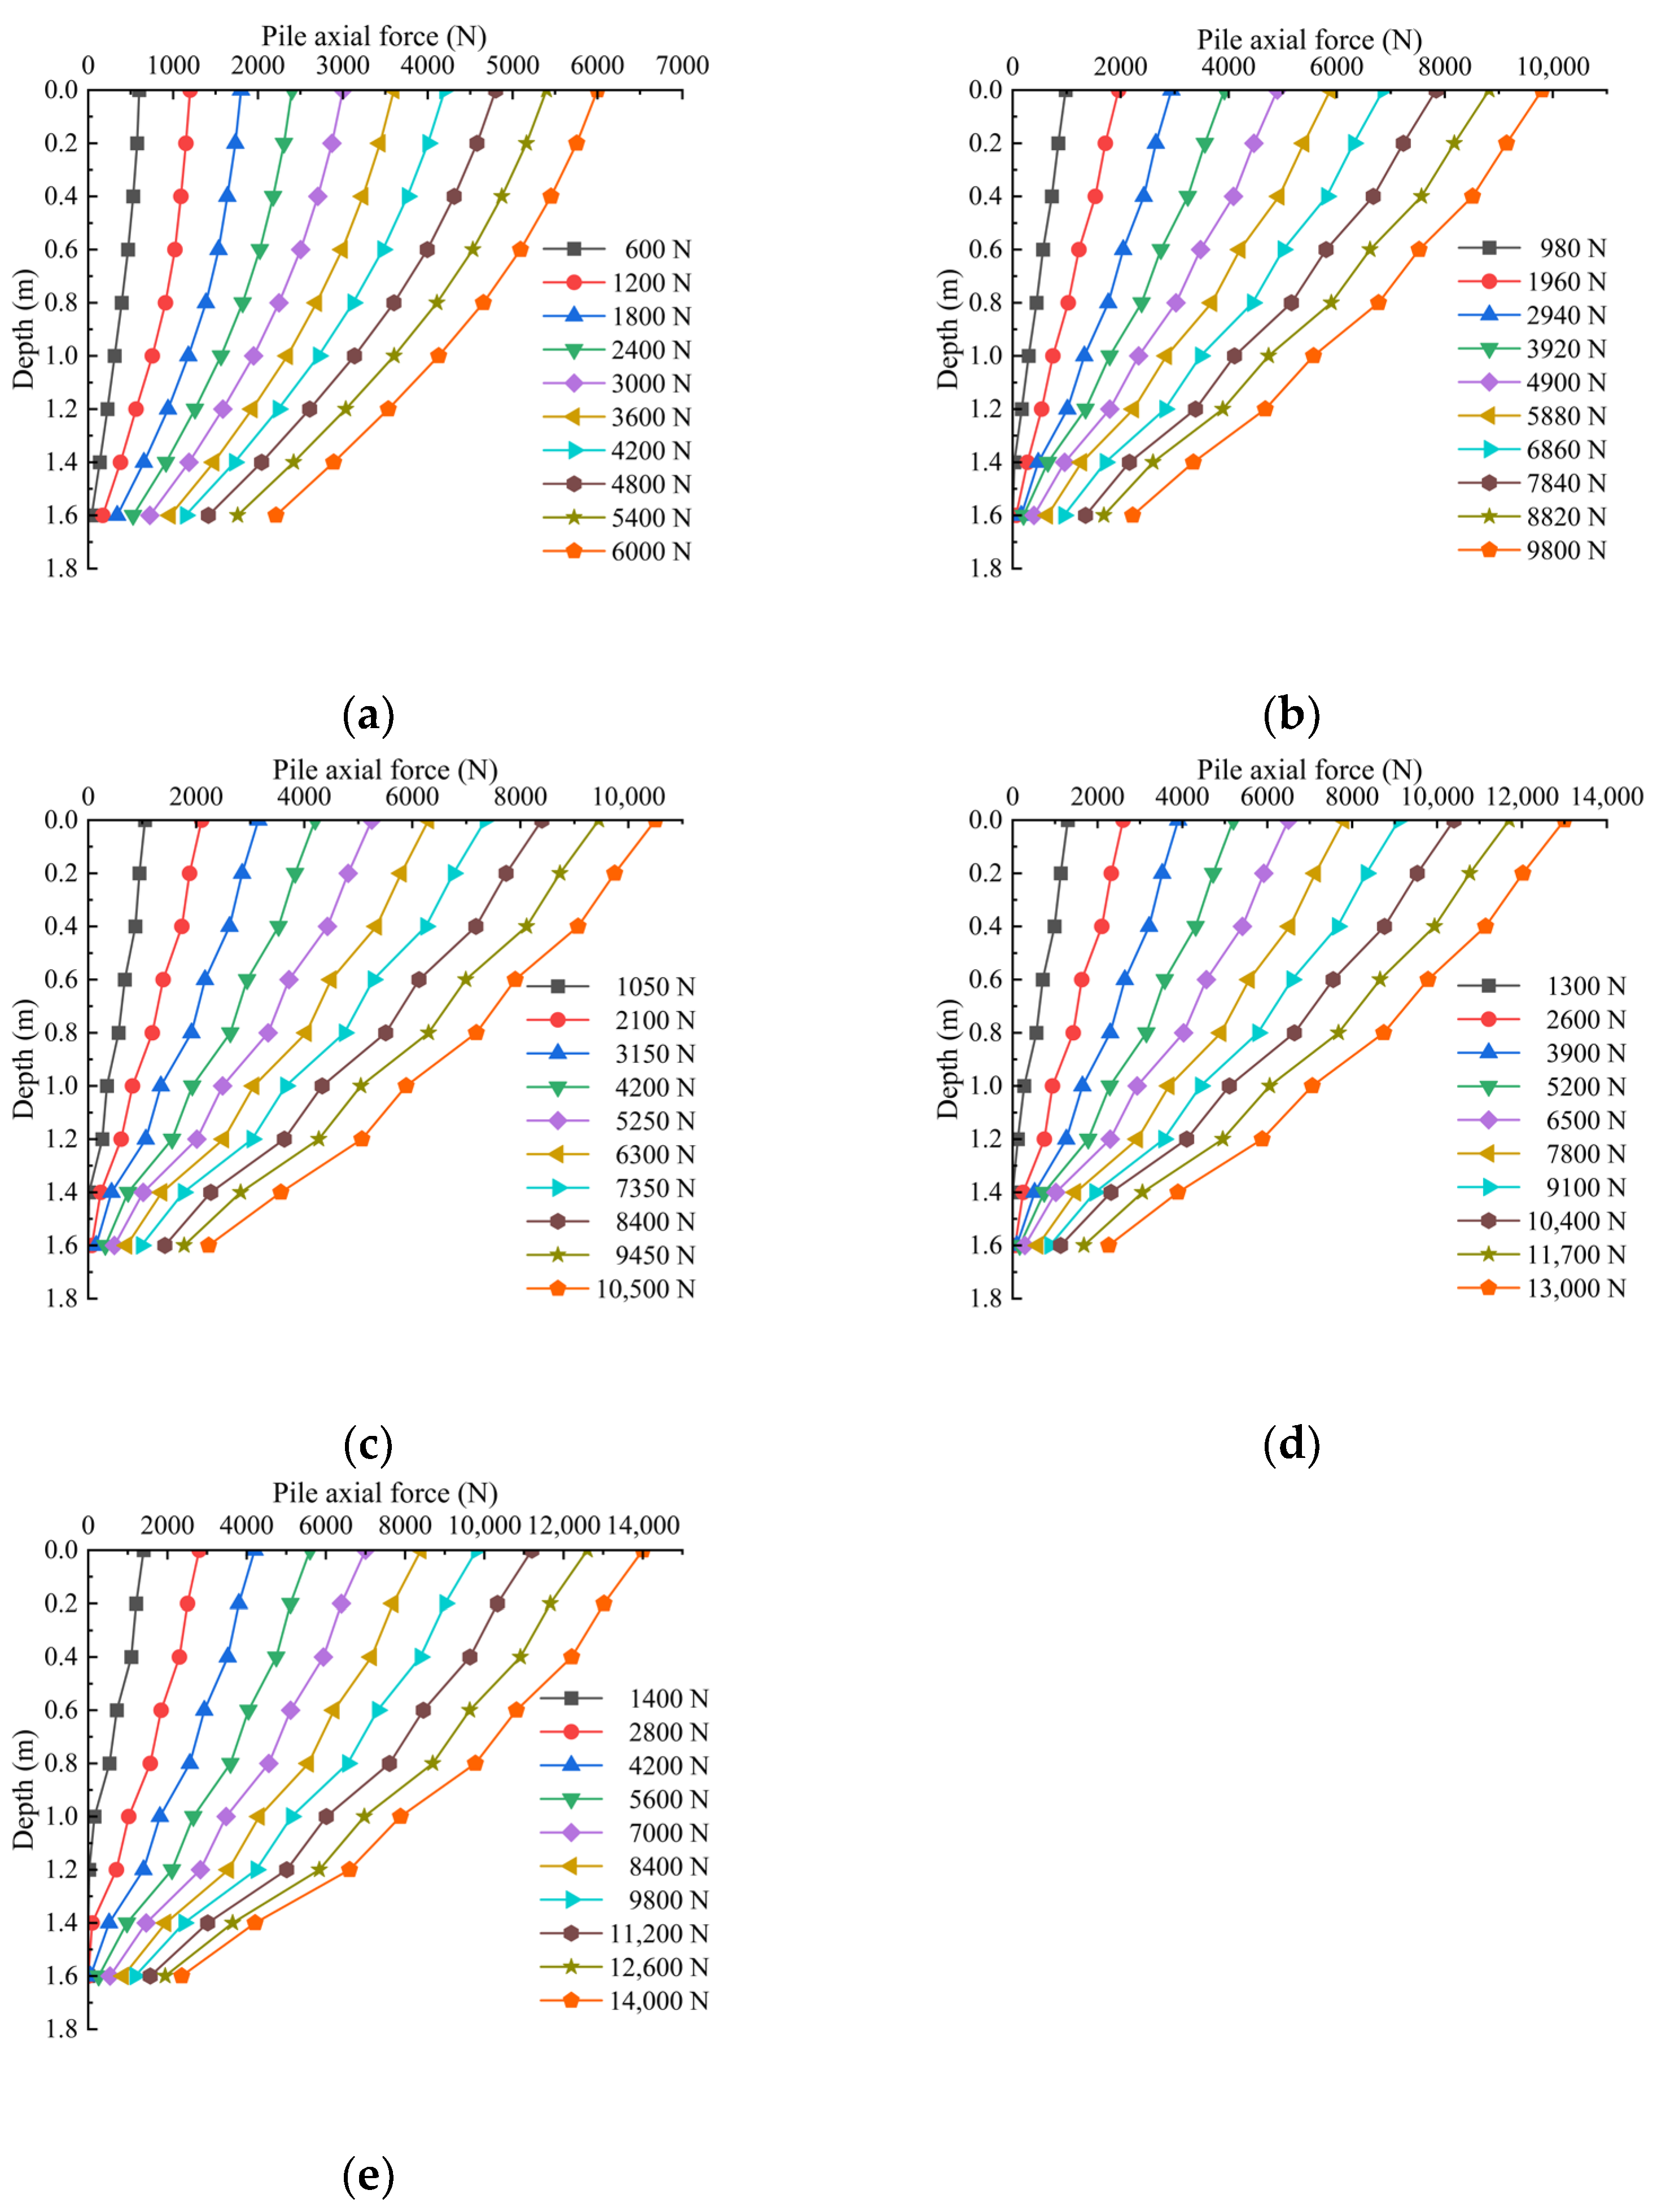
3.2. Pile Axial Force Distribution Curve with Depth
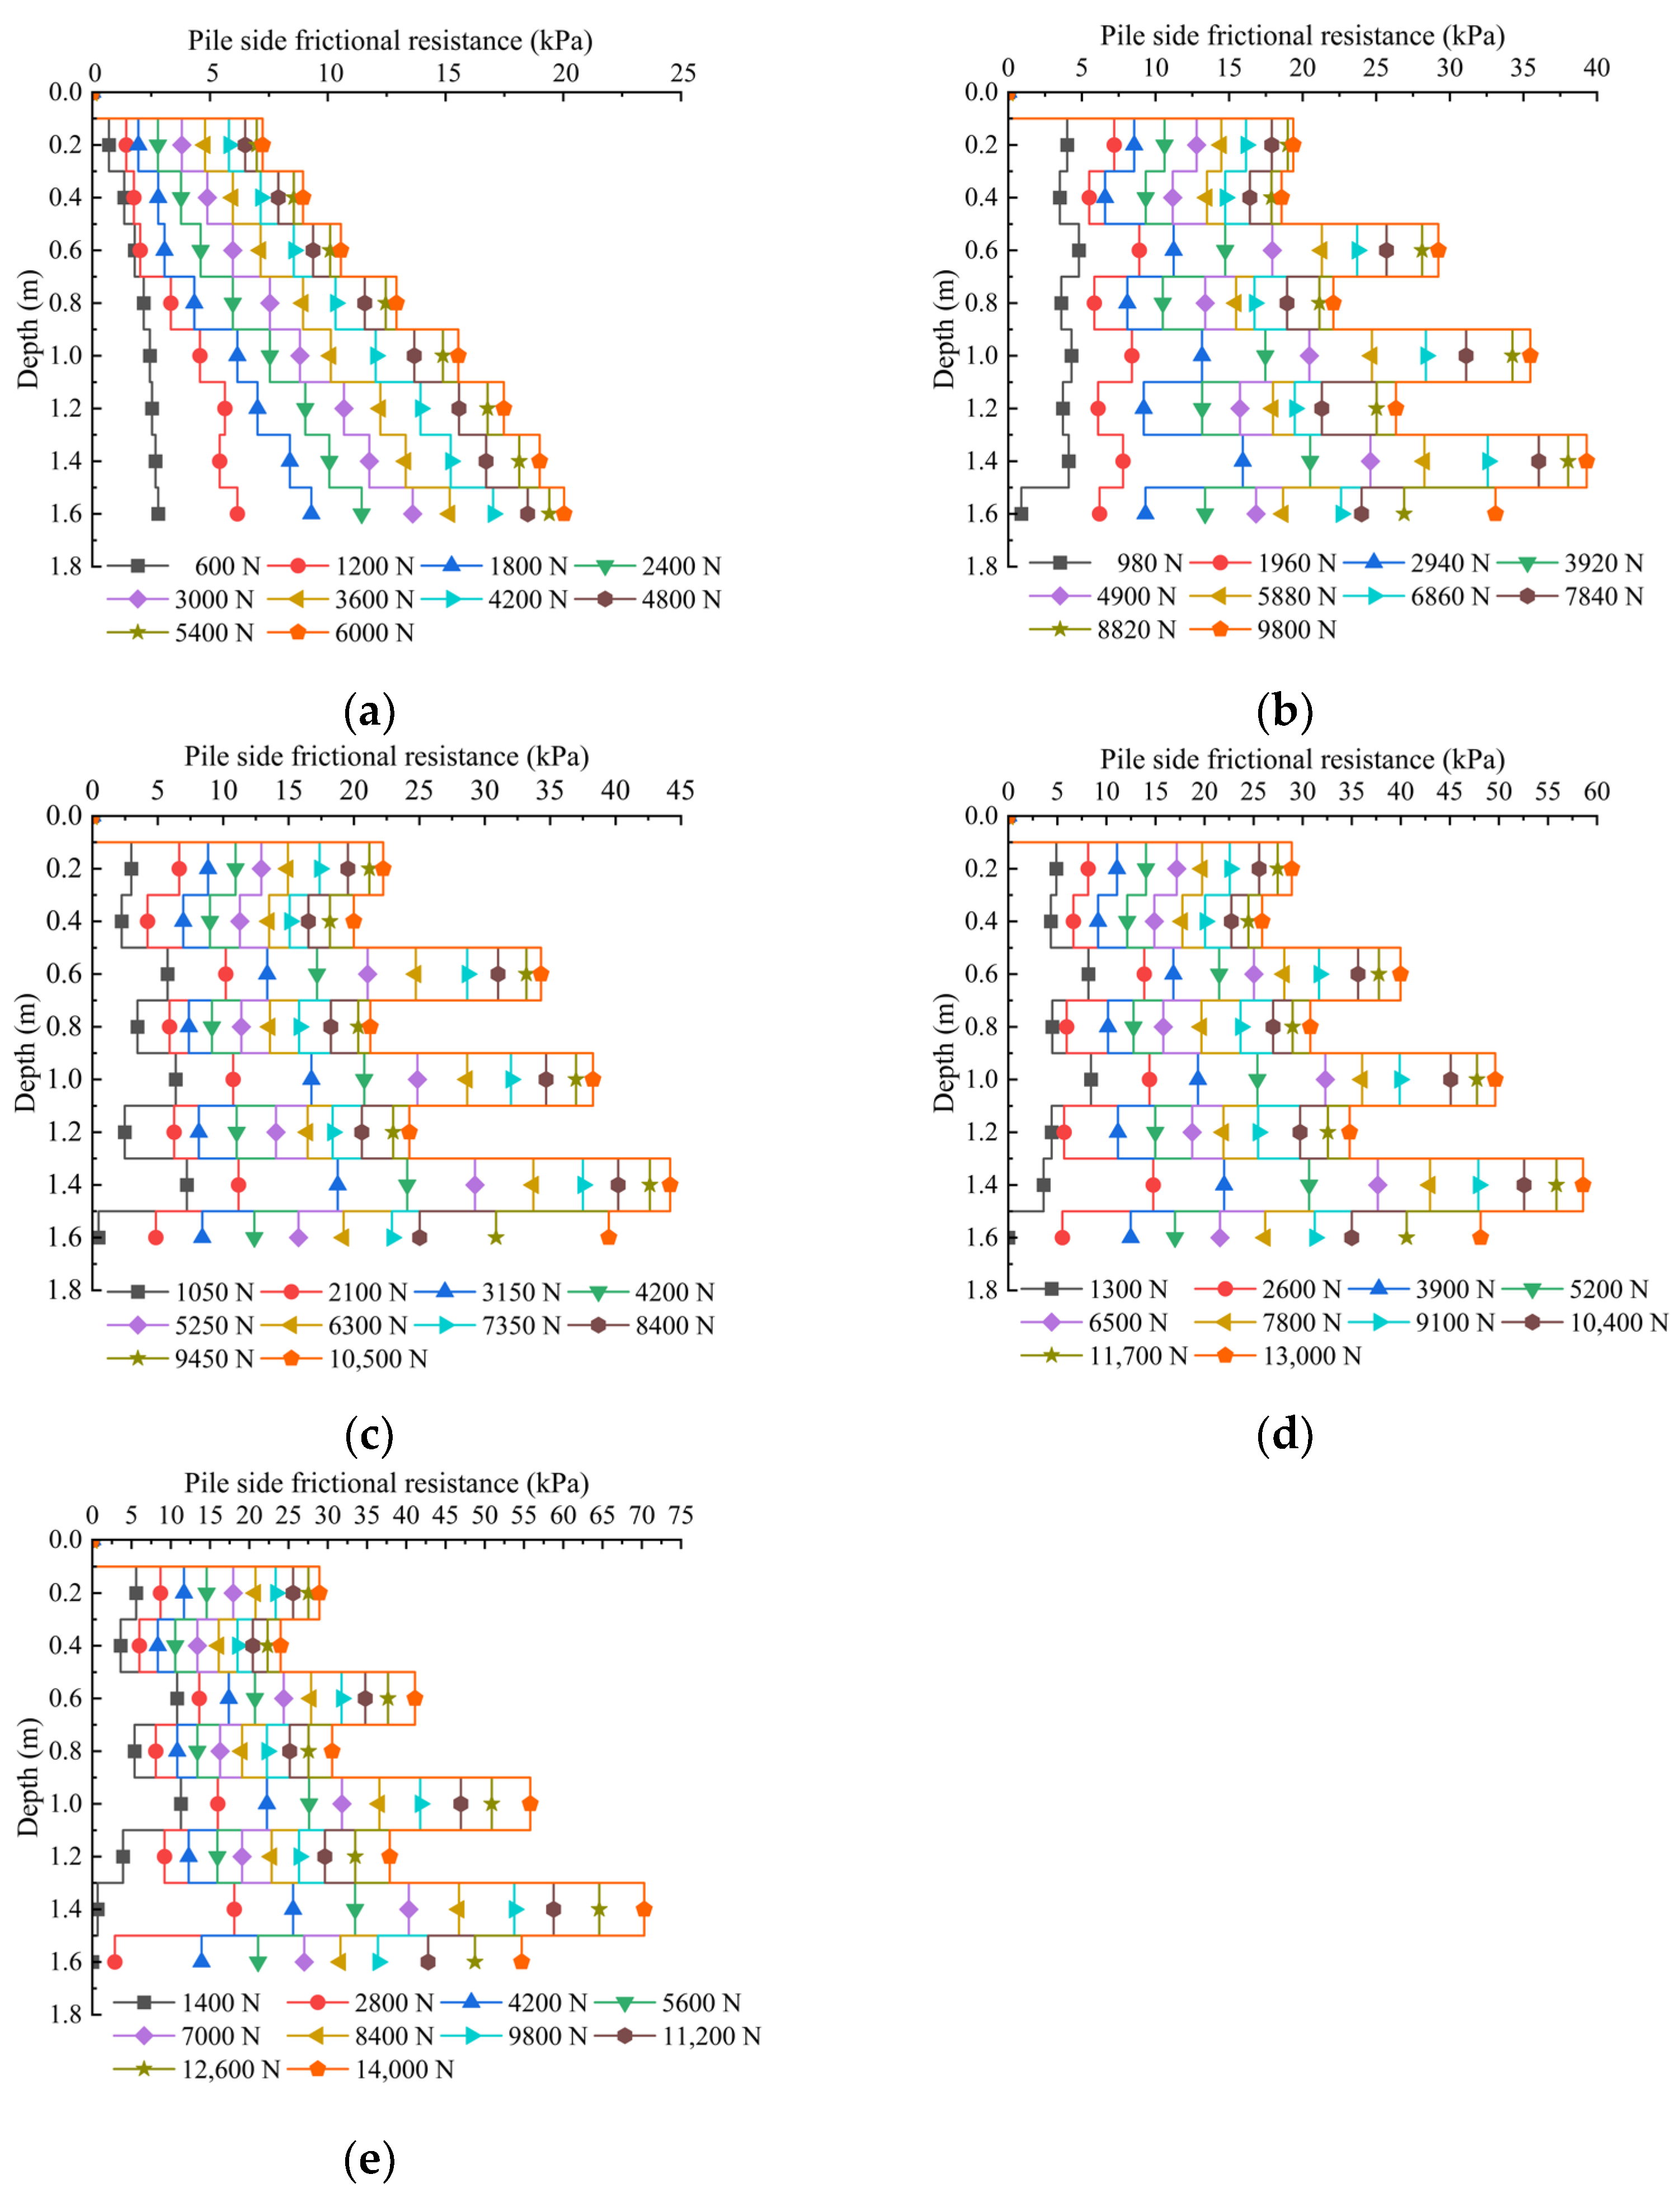
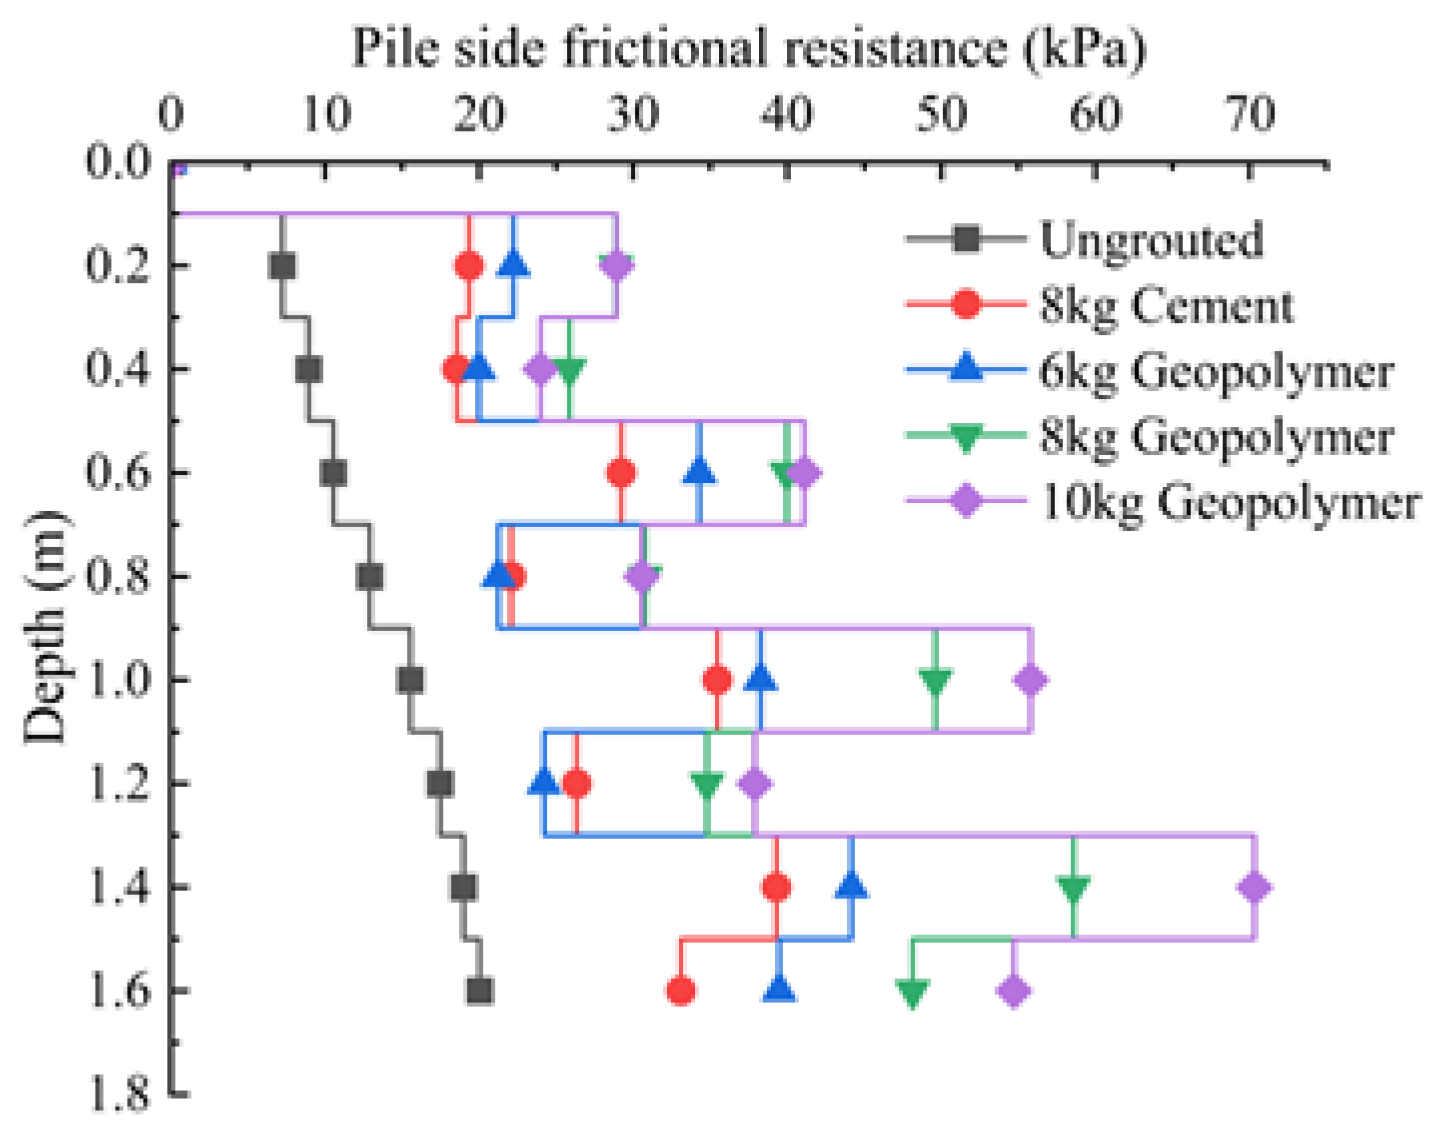
3.3. Distribution Curve of Lateral Frictional Resistance of Pile Body along Depth
4. Diffusion of Slurry around Model Pile
5. Conclusions
- The ultimate bearing capacity of the ungrouted pile P0 is 5400 N. For the pile-side distributed post-grouting piles (P1, P2, P3 and P4), the ultimate bearing capacities are 8820 N, 9450 N, 11,700 N and 12,600 N, respectively, demonstrating improvements of 163%, 175%, 217% and 233% compared to the ungrouted piles. Under extreme load conditions, the top settlements of P1, P2, P3 and P4 piles were 84%, 61.2%, 68.9% and 67.7% of that observed in P0 piles. Importantly, the top settlements of pile-side grouted piles were significantly smaller than those of ungrouted piles at the same load level, highlighting that distributed post-grouting on the pile side not only enhanced the ultimate load carrying capacity of the piles but also substantially reduced top settlements.
- Under equivalent grouting amounts, the ultimate bearing capacity of geopolymer-grouted piles is increased by 133% compared to that of normal Portland cement-grouted piles. This observation suggests that, during the same grouting process, geopolymer-grouted piles exhibit superior bearing performance compared to piles grouted with normal Portland cement. This finding validates the applicability of geopolymer grouting materials in post-grouting applications for pile foundations in sandy soil. It serves as a valuable reference for the engineering implementation of post-grouting in pile foundations using geopolymer.
- When comparing various grouting amounts, an increase in the grouting quantity correlates with an enhanced ultimate bearing capacity of the pile. Specifically, the ultimate bearing capacity of P3 increases by 124% relative to P2, and that of P4 increases by 108% relative to P3. This observation suggests that the capacity to enhance the ultimate bearing capacity by escalating the grouting volume is constrained; there exists a maximum threshold. Beyond this threshold, the incremental growth in the ultimate bearing capacity diminishes in magnitude.
- Under the influence of the ultimate load, the average values of pile-side friction resistance for P1, P2, P3 and P4 are 27.93 kPa, 30.49 kPa, 39.58 kPa and 44.59 kPa, respectively. The enhancement in pile-side friction resistance, when compared to the ungrouted pile P0, is 200%, 218%, 284% and 319%, indicating that distributed post-grouting on the pile side predominantly enhances the ultimate load carrying capacity by improving the pile-side friction resistance. Moreover, under the same grouting quantity, geopolymer-grouted piles exhibit superior performance in enhancing pile-side friction resistance compared to normal Portland cement-grouted piles. This suggests that distributed post-grouting on the pile side primarily elevates the ultimate bearing capacity by augmenting pile-side friction resistance, and, under equivalent grouting amounts, geopolymer-grouted piles outperform normal Portland cement-grouted piles in enhancing side friction resistance.
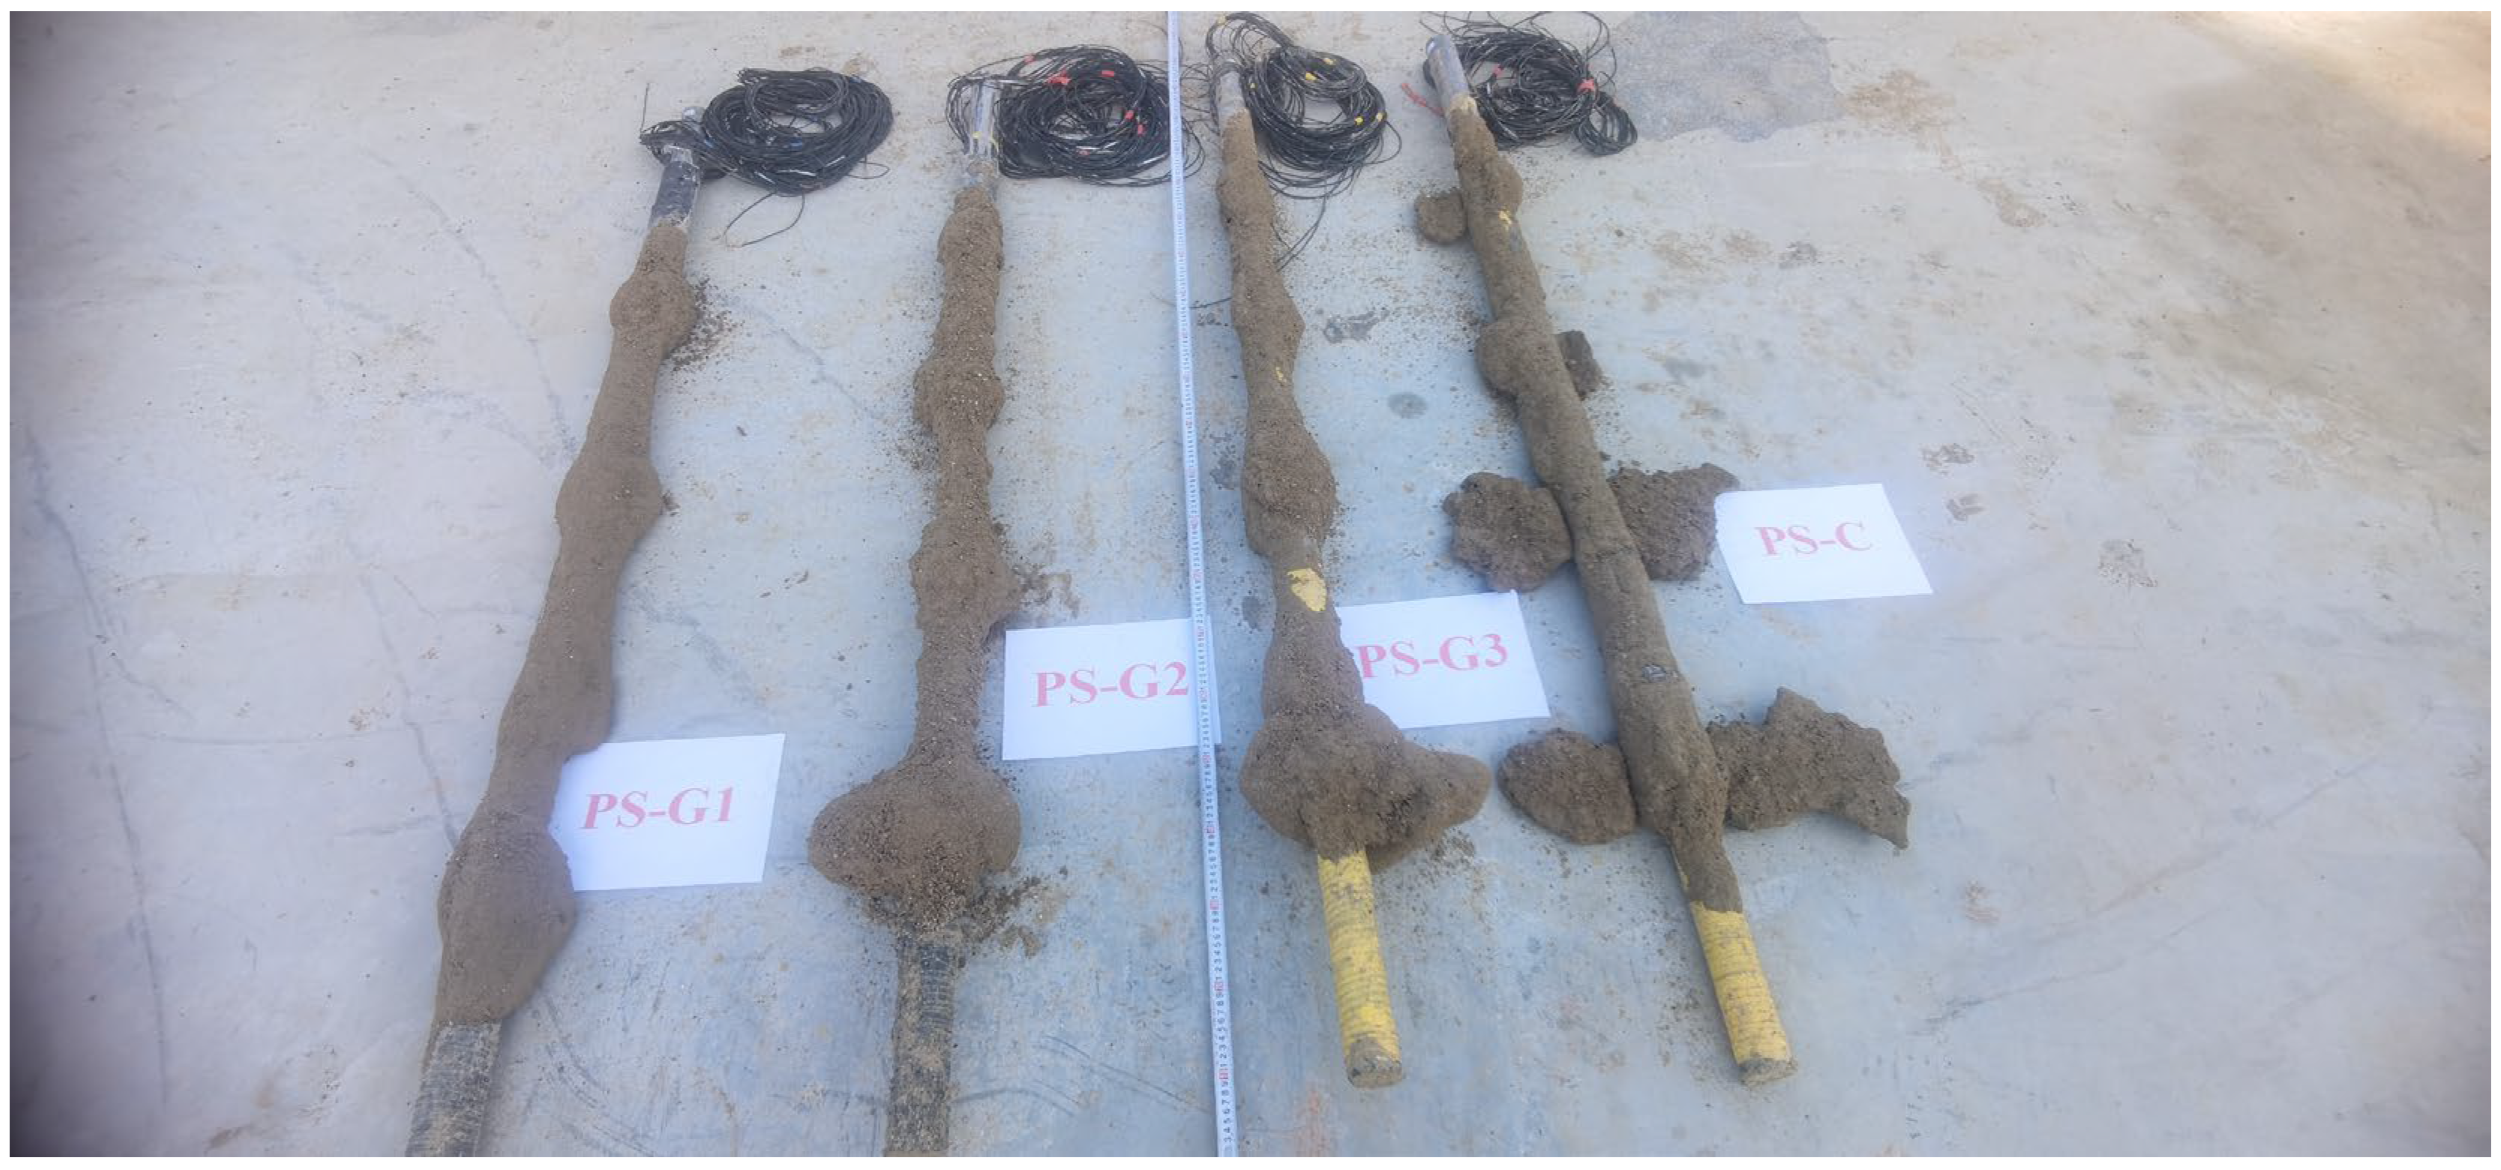
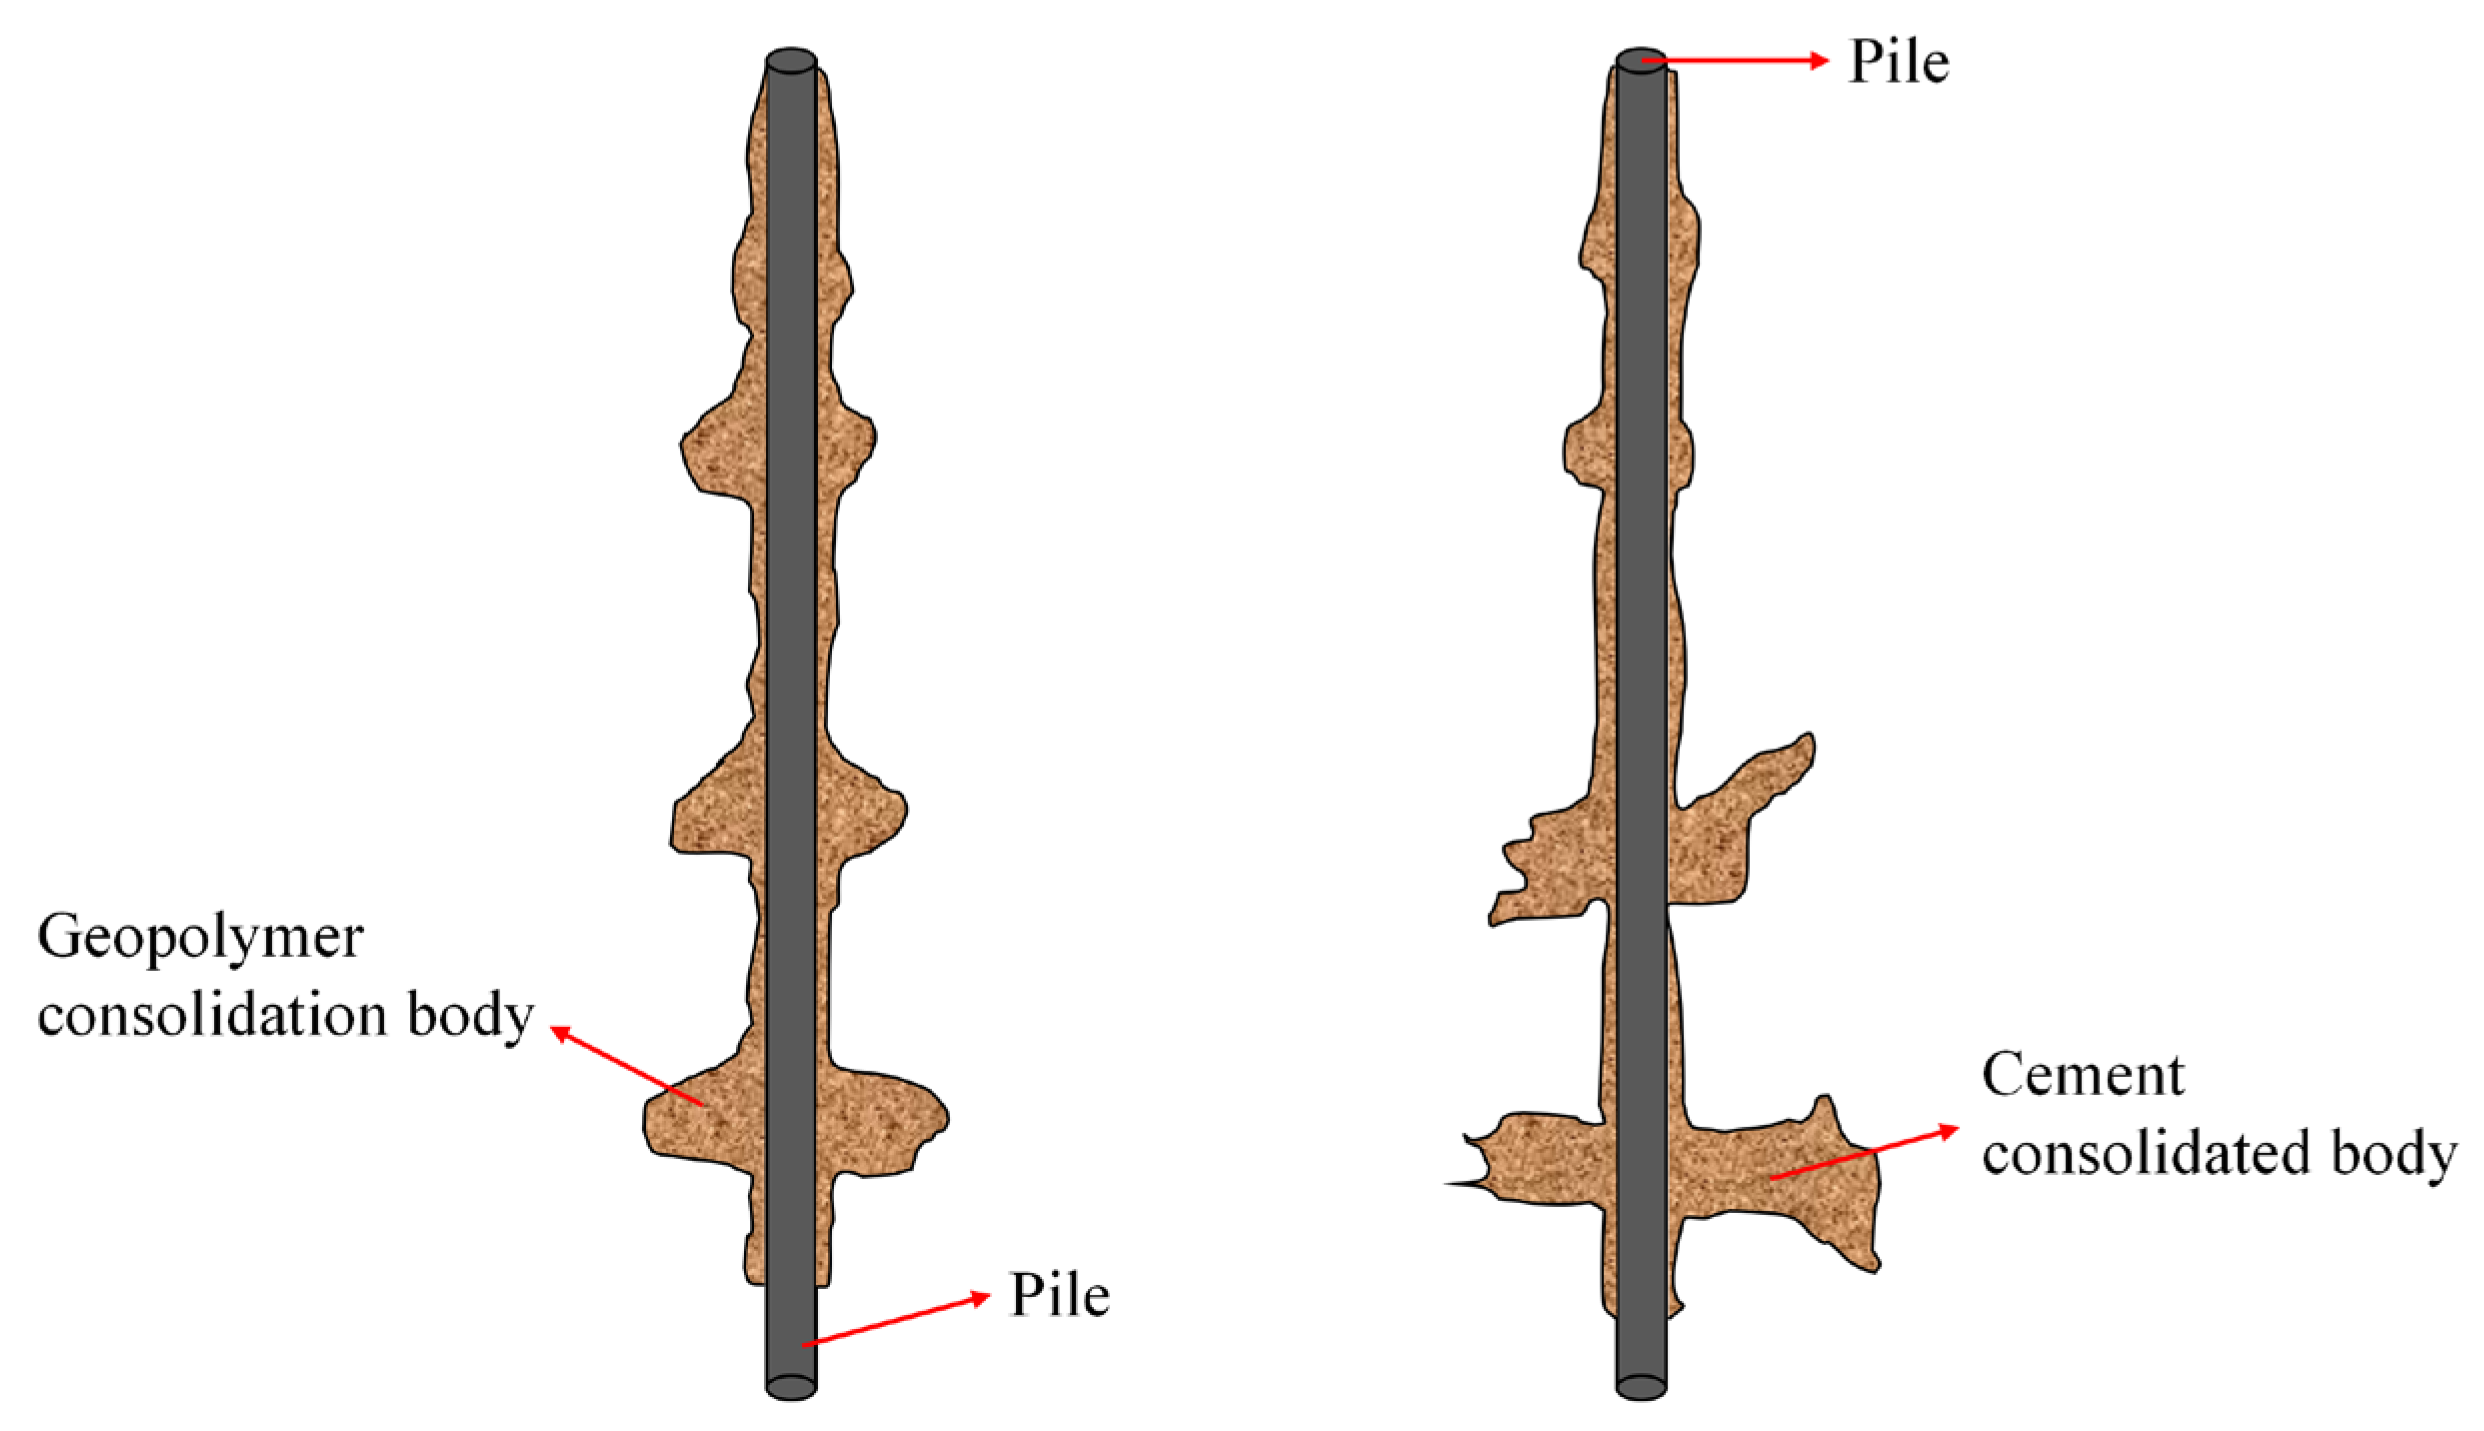
- The geopolymer grouting pile forms an ellipsoidal consolidation body at the pile-side grouting, primarily characterized by compaction diffusion and accompanied by a minor amount of seepage diffusion. The normal Portland cement grouting pile generates a sheet consolidation body at the grouting position in the lower part of the pile body, mainly exhibiting split diffusion. An ellipsoid consolidation body is formed at the grouting position in the upper part of the pile body. The post-grouting piles of both materials exhibit grouting between each grouting section, forming a layer of slurry shell within the pile body. The slurry is evenly distributed along the pile body, thereby increasing the contact area between the pile body and the consolidation body and enhancing pile–soil interaction. The distributed grouting process on the pile side demonstrates excellent applicability to the post-grouting of super-long pile sides.
6. Shortages and Prospects
Author Contributions
Funding
Institutional Review Board Statement
Informed Consent Statement
Data Availability Statement
Conflicts of Interest
References
- Seso, C.; Sarmiento, L.; Canlas, R. Prediction of shaft resistance of large diameter bored piles socketed in guadalupe tuff formation. J. Korean Geotech. Soc. 2022, 18, 281–293. [Google Scholar]
- Eid, M.; Hefny, A.; Sorour, T.; Zaghloul, Y.; Al-Atroush, M. Full-Scale Well Instrumented Large Diameter Bored Pile Load Test in Multi Layered Soil: A Case Study of Damietta Port New Grain Silos Project. Int. J. Curr. Eng. Technol. 2018, 8, 85–98. [Google Scholar] [CrossRef]
- Laboratory Investigation of Shaft Grouting | Proceedings of the Institution of Civil Engineers—Geotechnical Engineering. Available online: https://www.icevirtuallibrary.com/doi/abs/10.1680/geng.13.00130 (accessed on 17 July 2023).
- Useche-Infante, D.J.; Aiassa-Martinez, G.M.; Arrua, P.A.; Eberhardt, M. Performance Evaluation of Post-Grouted Drilled Shafts: A Review. Innov. Infrastruct. Solut. 2022, 7, 230. [Google Scholar] [CrossRef]
- Thiyyakkandi, S. Post-Grouted Deep Foundations: Individual and Group Responses. Indian Geotech. J. 2023, 1–14. [Google Scholar] [CrossRef]
- Znamenskii, V.V.; Hegazy, O.M. A Comparative Study of Ordinary Piles and Superlong Piles in Consolidating Soil. J. Phys. Conf. Ser. 2019, 1425, 012071. [Google Scholar] [CrossRef]
- Mullins, G.; Dapp, S.; Frederick, E.; Wagner, R. Post Grouting Drilled Shaft Tips: Phase I; Research Report; University of South Florida: Tampa, FL, USA, 2001. [Google Scholar]
- Sze, J.W.C.; Chan, K.M. Application of Shaft Grouting Technique in Deep Foundations—Hong Kong Experience. In Grouting and Deep Mixing; ASCE: Reston, VA, USA, 2012; pp. 1085–1094. [Google Scholar] [CrossRef]
- Nguyen, T.; Lai, V.Q.; Phung, D.L.; Phan, T.P. Shaft Resistance of Shaft-Grouted Bored Piles and Barrettes Recently Constructed in Ho Chi Minh City. Geotech. Eng. 2019, 50, 155–162. [Google Scholar]
- Thiyyakkandi, S.; McVay, M.; Lai, P. Experimental Group Behavior of Grouted Deep Foundations. Geotech. Test. J. 2014, 37, 621–638. [Google Scholar] [CrossRef]
- Huang, X.; Mei, Y.; Wangren, Y.; Li, T.; Lei, B.; Zhao, W. An Analysis on Comparison of the Static Load Test Performed to Post-Grouted Pile Foundation with Chinese, American and European Standard. Teh. Vjesn. 2020, 27, 978–985. [Google Scholar] [CrossRef]
- Zhang, Z.; Gong, W.; Dai, G.; Xu, J. Enhancement of Load Bearing of Post-Grouted Drilled Shafts Based on in Situ Tests. Arab. J. Geosci. 2021, 14, 32. [Google Scholar] [CrossRef]
- Fiscina, L.F.G.; Barbosa, Y.; de Albuquerque, P.J.R.; de Carvalho, D. Field Study on Axial Behavior of Instrumented Post-Grouted Steel Pipe Micropiles in Tropical Lateritic Soil. Innov. Infrastruct. Solut. 2021, 6, 56. [Google Scholar] [CrossRef]
- Wan, Z.; Dai, G.; Gong, W. Field Study on Post-Grouting Effects of Cast-in-Place Bored Piles in Extra-Thick Fine Sand Layers. Acta Geotech. 2019, 14, 1357–1377. [Google Scholar] [CrossRef]
- Dai, G.; OuYang, H.; Gao, L.; Guo, Q.; Gong, W. Experimental Study on Monotonic and Cyclic Lateral Behavior Enhancing Mechanism of Semi-Rigid Pile under Different Foundation Reinforced Methods in Clay. Ocean. Eng. 2023, 273, 113955. [Google Scholar] [CrossRef]
- Zhou, Z.; Wang, K.; Feng, H.; Tian, Y.; Zhu, S. Centrifugal Model Test of Post-Grouting Pile Group in Loess Area. Soil Dyn. Earthq. Eng. 2021, 151, 106985. [Google Scholar] [CrossRef]
- Zhao, C.F.; Wu, Y.; Zhao, C.; Wang, Y. Load-Displacement Relationship of Single Piles in Clay Considering Different Tip Grouting Volumes and Grouting Returned Heights. Int. J. Geomech. 2020, 20, 04019158. [Google Scholar] [CrossRef]
- Baca, M.; Ivannikov, A.L.; Rybak, J. Numerical Modelling of Various Aspects of Pipe Pile Static Load Test. Energies 2021, 14, 8598. [Google Scholar] [CrossRef]
- Baca, M.; Brząkała, W.; Rybak, J. Bi-Directional Static Load Tests of Pile Models. Appl. Sci. 2020, 10, 5492. [Google Scholar] [CrossRef]
- Baca, M.; Rybak, J. Pile Base and Shaft Capacity under Various Types of Loading. Appl. Sci. 2021, 11, 3396. [Google Scholar] [CrossRef]
- Wan, Z.; Liu, H.; Zhou, F.; Dai, G. Axial Bearing Mechanism of Post-Grouted Piles in Calcareous Sand. Appl. Sci. 2022, 12, 2731. [Google Scholar] [CrossRef]
- Zhang, J.; Zhao, C.; Wu, Y. Experimental Study on Post-Grouting Pile Vertical Bearing Performance Considering Different Grouting Methods and Parameters in Cohesive Soil. Appl. Sci. 2023, 13, 12175. [Google Scholar] [CrossRef]
- Wu, Y.; Zhang, X.; Zhao, C.; Zhao, C. Effects of Soil Unloading and Grouting on the Vertical Bearing Mechanism for Compressive Piles. Ocean. Eng. 2023, 271, 113754. [Google Scholar] [CrossRef]
- Dai, S.; Wang, H.; Wu, H.; Zhang, M. Exploration of the Mechanical Properties, Durability and Application of Geopolymers: A Review. Eur. J. Environ. Civ. Eng. 2023, 27, 3202–3235. [Google Scholar] [CrossRef]
- Wu, Y.; Lu, B.; Bai, T.; Wang, H.; Du, F.; Zhang, Y.; Cai, L.; Jiang, C.; Wang, W. Geopolymer, Green Alkali Activated Cementitious Material: Synthesis, Applications and Challenges. Constr. Build. Mater. 2019, 224, 930–949. [Google Scholar] [CrossRef]
- Singh, B.; Ishwarya, G.; Gupta, M.; Bhattacharyya, S.K. Geopolymer Concrete: A Review of Some Recent Developments. Constr. Build. Mater. 2015, 85, 78–90. [Google Scholar] [CrossRef]
- Krishna, R.S.; Mishra, J.; Zribi, M.; Adeniyi, F.; Saha, S.; Baklouti, S.; Shaikh, F.U.A.; Gökçe, H.S. A Review on Developments of Environmentally Friendly Geopolymer Technology. Materialia 2021, 20, 101212. [Google Scholar] [CrossRef]
- Ayub, F.; Khan, S.A. An Overview of Geopolymer Composites for Stabilization of Soft Soils. Constr. Build. Mater. 2023, 404, 133195. [Google Scholar] [CrossRef]
- Abbas, I.S.; Abed, M.H.; Canakci, H. Development and Characterization of Eco- and User-Friendly Grout Production via Mechanochemical Activation of Slag/Rice Husk Ash Geopolymer. J. Build. Eng. 2023, 63, 105336. [Google Scholar] [CrossRef]
- Da Silva, A.M.; Pereira, C.E.; Costa, F.O.; de Sousa, B.V. Chemical Attacks in Geopolymeric Materials by Sulfuric Acid and Hydrochloric Acid. Mater. Sci. Forum 2017, 881, 245–250. [Google Scholar] [CrossRef]
- Zhang, H.Y.; Kodur, V.; Wu, B.; Yan, J.; Yuan, Z.S. Effect of Temperature on Bond Characteristics of Geopolymer Concrete. Constr. Build. Mater. 2018, 163, 277–285. [Google Scholar] [CrossRef]
- Rios, S.; Cristelo, N.; Viana da Fonseca, A.; Ferreira, C. Structural Performance of Alkali-Activated Soil Ash versus Soil Cement. J. Mater. Civ. Eng. 2016, 28, 04015125. [Google Scholar] [CrossRef]
- Xiong, L.; Wan, Z.; Qin, S.; Shi, P.; Wang, J.; Wu, Z. A Novel Class F Fly Ash-Based Geopolymer and Its Application in Coal Mine Grouting. Adv. Civ. Eng. 2020, 2020, e8899173. [Google Scholar] [CrossRef]
- Guo, Y.; Huang, Y.; Li, J.; Ouyang, S.; Fan, B.; Liu, Y.; Hou, G. Preparation of the Geopolymer Grouting Material by Coal-Based Solid Wastes for the Aquiclude Key Strata and Its Application. Constr. Build. Mater. 2023, 408, 133539. [Google Scholar] [CrossRef]
- Ahmad Zailani, W.W.; Bouaissi, A.; Abdullah, M.M.A.B.; Abd Razak, R.; Yoriya, S.; Mohd Salleh, M.A.A.; Mohd Remy Rozainy, M.A.Z.; Fansuri, H. Bonding Strength Characteristics of FA-Based Geopolymer Paste as a Repair Material When Applied on OPC Substrate. Appl. Sci. 2020, 10, 3321. [Google Scholar] [CrossRef]
- Jwaida, Z.; Dulaimi, A.; Mashaan, N.; Othuman Mydin, M.A. Geopolymers: The Green Alternative to Traditional Materials for Engineering Applications. Infrastructures 2023, 8, 98. [Google Scholar] [CrossRef]
- Geißler, P.; Schwarz, J.; Cuéllar, P.; Hüsken, G.; Baeßler, M.; Kühne, H.-C.; Morrone, C. Compaction Grouting to Improve the Pile Bearing Capacity in Non-Cohesive Soil. In Proceedings of the 29th International Ocean and Polar Engineering Conference, Honolulu, HI, USA, 15–20 June 2019. [Google Scholar]
- El Haffar, I.; Blanc, M.; Thorel, L. Impact of Pile Installation Method on the Axial Capacity in Sand. Géotechnique Lett. 2017, 7, 260–265. [Google Scholar] [CrossRef]
- JTG 3430-2020; Test Methods of Soils for Highway Engineering. Ministry of Transport of the People’s Republic of China: Beijing, China, 2020.
- JTG 3420-2020; Testing Methods of Cement and Concrete for Highway Engineering. Ministry of Transport of the People’s Republic of China: Beijing, China, 2020.
- De Aux, M.D.; Crowder, J.; Westland, J. RSPile Analysis of Two Osterberg Cell Load Tests on Post-Grouted and Conventionally Installed Caissons in Vaughan, Ontario; Atlantis Press: Amsterdam, The Netherlands, 2023; pp. 575–592. [Google Scholar]
- JGJ 106—2003; Technical Code for Testing of Building Foundation Piles. Ministry of Construction: Beijing, China, 2014.
- Cherian, A. On-Site and Numerical Analysis of Bidirectional Static Load Testing (BDSLT) on Bored Pile. Mater. Today Proc. 2023, 85, 51–54. [Google Scholar] [CrossRef]


| Soil Name | Density (g/cm3) | Water Content (%) | Cohesion (kPa) | Internal Friction Angle (°) | Void Ratio | Constrained Modulus (MPa) |
|---|---|---|---|---|---|---|
| Fine silt sand | 1.9 | 24.8 | 8.8 | 31.2 | 0.81 | 21.2 |
| Water-Cement Ratio | Setting Time (Min) | Flow Time (s) | Bleeding Rate (%) | Expansion Ratio (%) | Water Resistance (%) | Constrained Modulus (MPa) | |||
|---|---|---|---|---|---|---|---|---|---|
| Initial | Final | 1 d | 7 d | 28 d | |||||
| 0.6 | ≥90 | ≦140 | 15 | ≦0.4 | 0.01 | ≥95 | ≥20 | ≥40 | ≥50 |
| Number | Grouting Methods | Grouting Materials | Grout Amount |
|---|---|---|---|
| P0 | Non-grouting | - | - |
| P1 | Pile side | Cement | 8 kg |
| P2 | Pile side | Geopolymer | 6 kg |
| P3 | Pile side | Geopolymer | 8 kg |
| P4 | Pile side | Geopolymer | 10 kg |
Disclaimer/Publisher’s Note: The statements, opinions and data contained in all publications are solely those of the individual author(s) and contributor(s) and not of MDPI and/or the editor(s). MDPI and/or the editor(s) disclaim responsibility for any injury to people or property resulting from any ideas, methods, instructions or products referred to in the content. |
© 2024 by the authors. Licensee MDPI, Basel, Switzerland. This article is an open access article distributed under the terms and conditions of the Creative Commons Attribution (CC BY) license (https://creativecommons.org/licenses/by/4.0/).
Share and Cite
Li, P.; Xia, Y.; Xie, X.; Wang, J.; Wang, C.; Shi, M.; Wang, B.; Wu, H. Study on Vertical Bearing Capacity of Pile Foundation with Distributed Geopolymer Post-Grouting on Pile Side. Materials 2024, 17, 398. https://doi.org/10.3390/ma17020398
Li P, Xia Y, Xie X, Wang J, Wang C, Shi M, Wang B, Wu H. Study on Vertical Bearing Capacity of Pile Foundation with Distributed Geopolymer Post-Grouting on Pile Side. Materials. 2024; 17(2):398. https://doi.org/10.3390/ma17020398
Chicago/Turabian StyleLi, Pan, Yangyang Xia, Xinhui Xie, Jing Wang, Chaojie Wang, Mingsheng Shi, Bo Wang, and Haoye Wu. 2024. "Study on Vertical Bearing Capacity of Pile Foundation with Distributed Geopolymer Post-Grouting on Pile Side" Materials 17, no. 2: 398. https://doi.org/10.3390/ma17020398