

Poisson’s Ratio of Glasses, Ceramics, and Crystals

Division of Materials Science, University of Tsukuba, Tsukuba, Ibaraki 305-8573, Japan
Materials 2024, 17(2), 300; https://doi.org/10.3390/ma17020300
Submission received: 16 November 2023
/
Revised: 4 January 2024
/
Accepted: 4 January 2024
/
Published: 7 January 2024
(This article belongs to the Topic Applications of Non-destructive Testing Technologies in Materials or Engineering)
Abstract
:Poisson’s ratio is the fundamental metric used to discuss the performance of any material when strained elastically. However, the methods of the determination of Poisson’s ratio are not yet discussed well. The first purpose of this paper is to introduce the five kinds of typical experimental methods to measure Poisson’s ratio of glasses, ceramics, and crystals. The second purpose is to discuss the experimental results on the variation of Poisson’s ratio by composition, temperature, and pressure reviewed for various glasses, ceramics, and crystals, which are not yet reviewed. For example, in oxide glasses, the number of bridging oxygen atoms per glass-forming cation provides a straightforward estimation of network crosslinking using Poisson’s ratio. In the structural-phase transition of crystals, Poisson’s ratio shows remarkable temperature-dependence in the vicinity of a phase-transition temperature. The mechanism of these variations is discussed from physical and chemical points of view. The first-principles calculation of Poisson’s ratio in the newly hypothesized compounds is also described, and its pressure-induced ductile–brittle transition is discussed.
1. Introduction
Poisson’s ratio, ν, is defined by
where xt = (∆d/d) is the lateral contraction ratio of a sample with a transverse size d and xl = (∆l/l) is the relative longitudinal extension of a sample with a length l. In an isotropic material with three dimensions, such as glasses and ceramics, the number of independent elastic moduli is two and it holds that
where Y and G are Young’s and shear moduli, respectively. For three-dimensional isotropic materials, it holds that −1.0 ≤ ν ≤ 0.5. For compact and weekly compressive materials, such as liquids, stress primarily results in a shape change, and ν is close to 0.5. Poisson’s ratio of soft materials, such as rubber, is close to 0.5, while that of porous materials, such as cork, is near 0. For most polymers, ceramics, and metals, 0.25 ≤ ν ≤ 0.35, and for gases, ν = 0. Materials with different Poisson ratios show very differently mechanical behaviors [1].
For structural glasses, the correlation between Poisson’s ratio and fragility (m) was reported [2]. The correlation among Poisson’s ratio, fragility, and atomic packing density (Cg) was discussed, and an overall increase in ν with an increase in m and Cg was suggested [3].
Auxetic materials with a negative Poisson’s ratio draw increasing attention [4,5]. The auxetic properties were reported in various materials, such as cubic crystals [6] and polymers [7]. Recent first-principles calculations predicted that the Si2XY monolayers are auxetic materials with a negative Poisson’s ratio along both x and y axes [8].
2. Experimental Methods to Measure Poisson’s Ratio
Up to the present, several kinds of experimental methods have been used to determine Poisson’s ratio of various glasses, ceramics, crystals, and metals through the measurements of strain, ultrasonic waves, and thermally excited acoustic phonons. In this chapter, five kinds of typical experimental methods, namely (1) the ultrasonic pulse-echo method, (2) resonant ultrasonic spectroscopy, (3) piezo-resonance method, (4) Brillouin scattering spectroscopy, and (5) atomic force microscopy are introduced.
2.1. Ultrasonic Pulse-Echo Method
The pulse-echo method has been used for nondestructive testing, which is analogous to the sonar system in ships for sounding ocean depths. It is also useful to determine the sound velocity of a sample. The schematic illustration of the ultrasonic pulse-echo method is shown in Figure 1. The ultrasonic/piezoelectric transducer is attached to the top of the sample. The RF pulse is converted to ultrasonic waves into the sample by a piezoelectric transducer and the reflected ultrasonic waves (echo) at the bottom of a sample are converted again to electric output signals by the same piezoelectric transducer. The sound velocity of a sample, V, is determined based on the ultrasonic travel time, τ, and the travel length, L, using the equation V = 2L/τ. In the pulse-echo overlap method, the ultrasonic travel time is accurately determined based on the McSkimin criterion to find the condition of correct overlapping between ultrasonic echoes [9,10,11].
2.2. Resonant Ultrasonic Spectroscopy
Resonant ultrasonic spectroscopy (RUS) is a resonance technique that consists of placing a sphere or a cube of a sample on a piezoelectric shear-mode transducer and exciting the vibration of mechanical eigen modes of a sample. From the measured resonance spectrum in the frequency domain and the measured diameter or size, the sound velocity and elastic moduli of a sample are determined. The mode spectrum is assigned based on the comparison of the experimental modes with the calculated values for an ideal isotropic sphere. Eigenvalue modes of an isotropic elastic sphere were calculated analytically by Sato and Usami [12,13,14]. In a sphere, Tnm denotes the torsional modes, which are pure shear modes; Snm denotes the spheroidal modes, which are mixed shear and dilatational modes. The subscripts n and m indicate the number of oscillation nodes in the radial direction of the sphere and the order of spherical Bessel functions nm, respectively. For isotropic materials, elastic moduli, such as Young’s modulus, the shear modulus, and Poisson’s ratio, are determined based on the mode frequencies of Tnm and Snm modes [15]. For a single crystal, all elastic stiffness constants are determined using the cube resonance method [16]. The rectangular parallelepiped resonance was also measured to determine the elastic properties of a small crystal, as shown in Figure 2. In the martensitic transformation of a shape-memory alloy, the elastic anomaly occurs in an austenitic-to-martensite transformation [17]. The free vibration frequencies of a Cu-Al-Ni crystal of a shape-memory alloy are measured as a function of the exciting frequency to determine all elastic stiffness constants [18]. In the superconductor, the elastic constants show the difference between the superconducting and the normal states [19]. The mechanical resonance frequency and amplitude of spherical superconducting Ba(Pb1−xBix)O3 ceramics was also measured from 4 K to 300 K with the external magnetic field (0~5 T) to discuss the change in the conduction electron mean path at Tc = 12 K [20]. It is possible for the conventional RUS to determine all independent elastic constants of a crystal by comparing observed and calculated free-vibration resonance frequencies. However, to avoid invalid local minima in the inverse process, good initial guesses of the elastic constants must be available. Very recently, a deep-learning assisted scheme was proposed to solve this problem, which utilizes an input elasticity image composed of three layers determined from resonance frequency data [21].
2.3. Piezoelectric Resonance Method
Poisson’s ratio of piezoelectric materials has been measured using the resonance-antiresonance method. In a piezoelectric material, electric displacement D is proportional to a mechanical stress X. The sign of D changes to the opposite one if the direction of mechanical stress X is reversed. Piezoelectric materials also show a converse piezoelectric effect that strain e is induced by an electric field E. Again, the sign of strain e is switched to the opposite one if the direction of an electric field is reversed. Through the application of alternative electric fields to a piezoelectric material, the mechanical vibration is excited by its piezoelectricity [22,23].
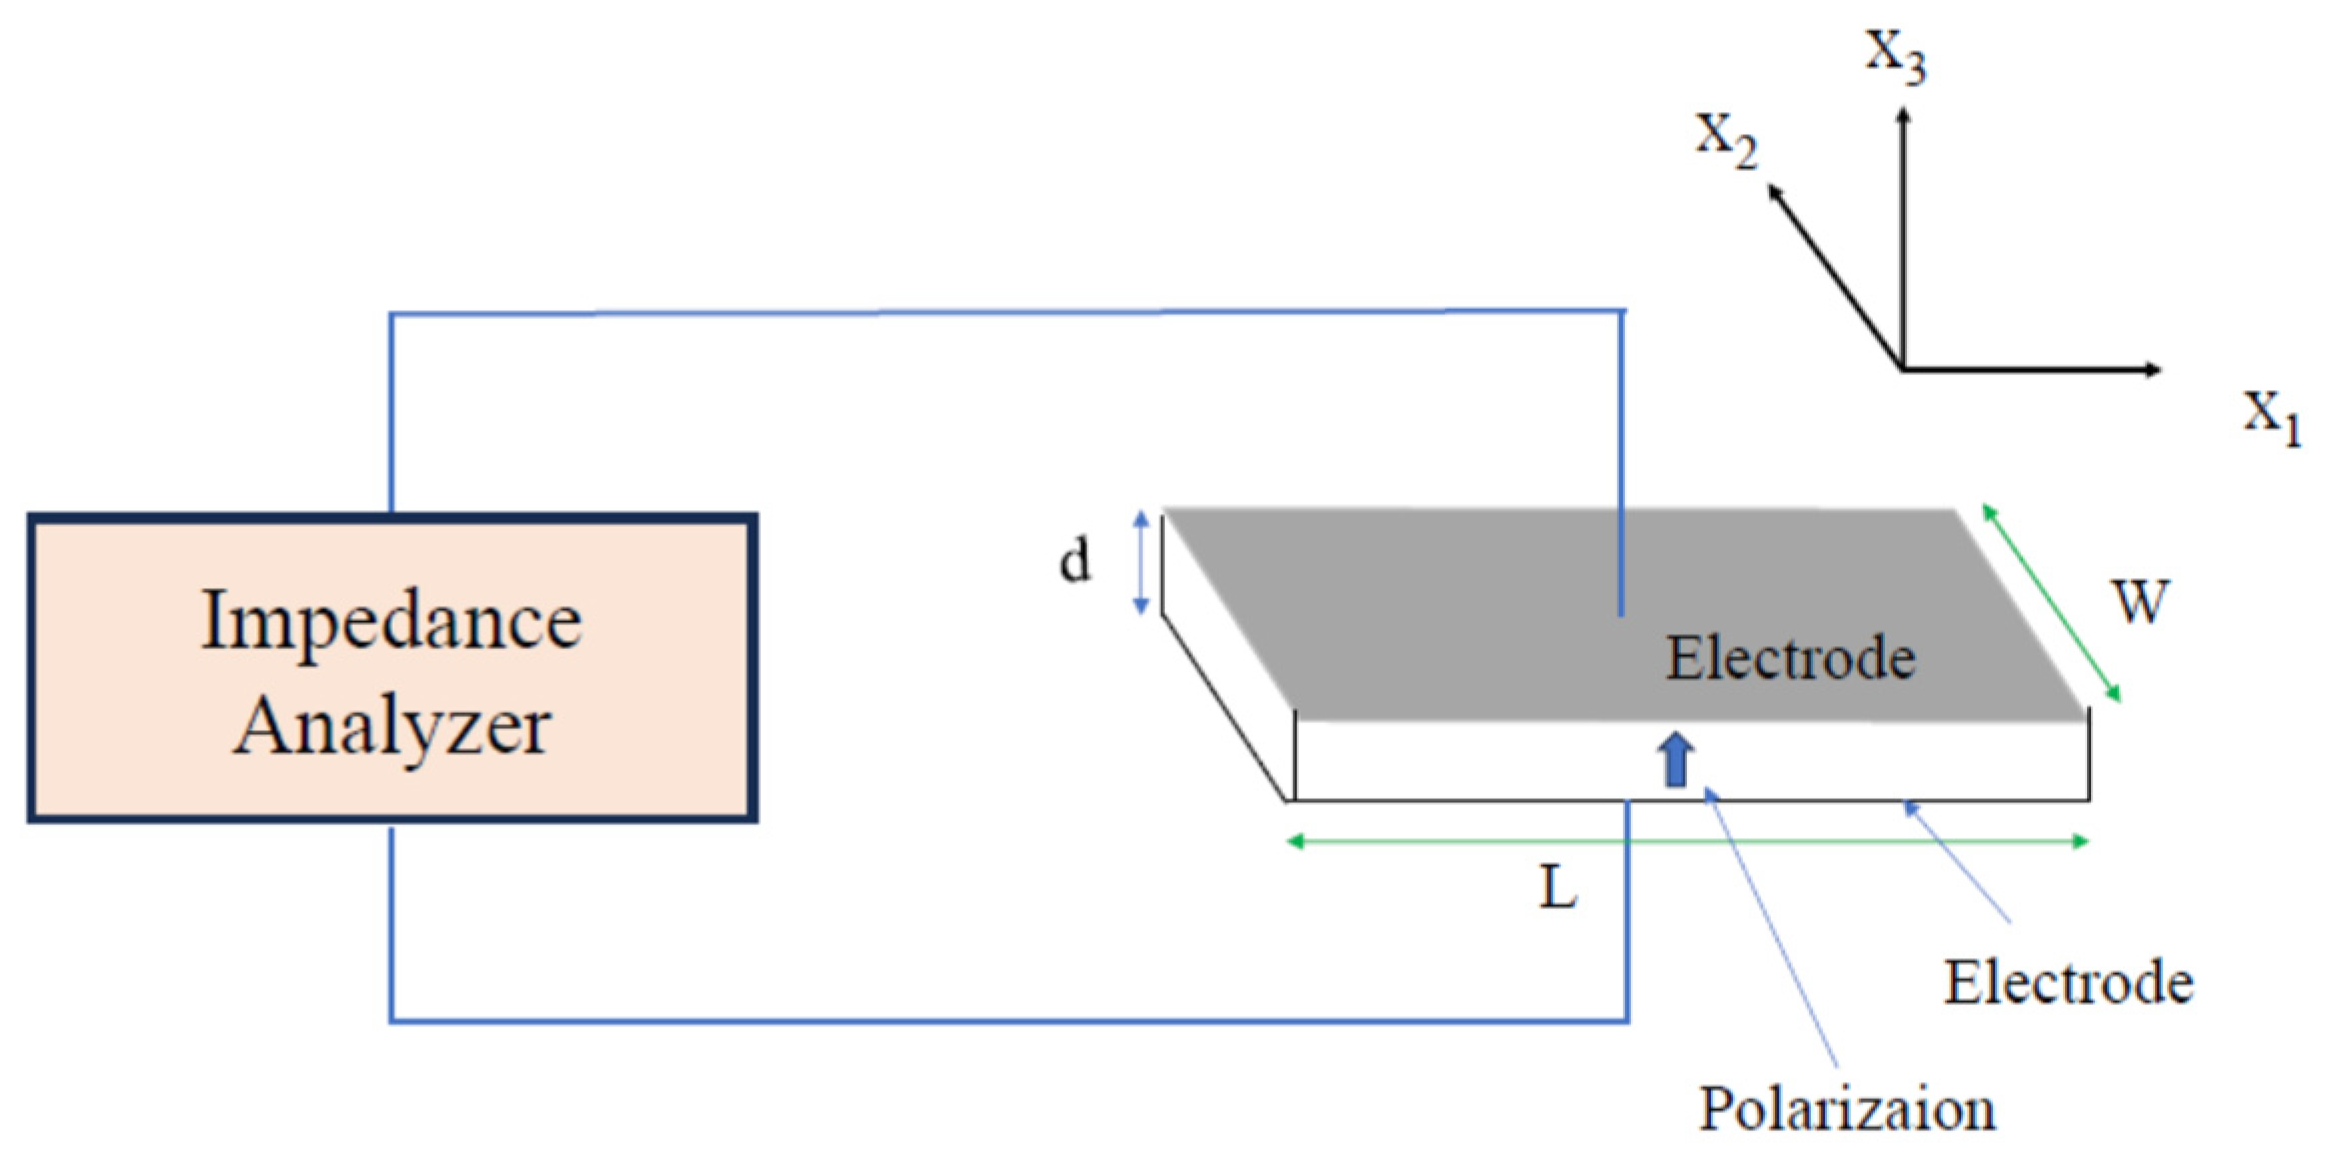
In the apparatus shown in Figure 3, alternating voltage is applied along the x3-axis, and polarization is induced along the x3-axis. Through the piezoelectric effect related to the piezoelectric constant d13, the strain is induced along the x1-axis. The frequency-dependent response from a sample is analyzed by an impedance analyzer. Piezoelectric resonance and antiresonance are observed at the frequencies fr and fa based on the condition of Y = ∞ and 0, respectively, where Y is admittance. The resonance frequency is given by
where L, ρ, and s11 are the length along the x1-axis, density, and elastic compliance constant of a sample to be studied, respectively. The electromechanical coupling coefficient K is given by.
When the electric field, E, is along the x3-axis and the induced strain is along the x1-axis (lateral mode), it holds in a cubic crystal that.
where d13, ε33, and s11 are piezoelectric, dielectric, and elastic compliance constants. The piezoelectric resonance–antiresonance method is an important method to determine the electromechanical coupling constants of piezoelectric ceramics.
In the radial vibration of a disk of piezoelectric ceramics, the electromechanical coupling factor KP is given by.
Poisson’s ratio is approximately determined as
where fr1 is the first overtone frequency [24]. PZT is a well-known piezoelectric material, while it is very difficult to grow single crystals. Therefore, PZT ceramics have been used for the piezoelectric application. The temperature-dependence of Poisson’s ratio of PZT ceramics was reported [25].
2.4. Brillouin Scattering Spectroscopy
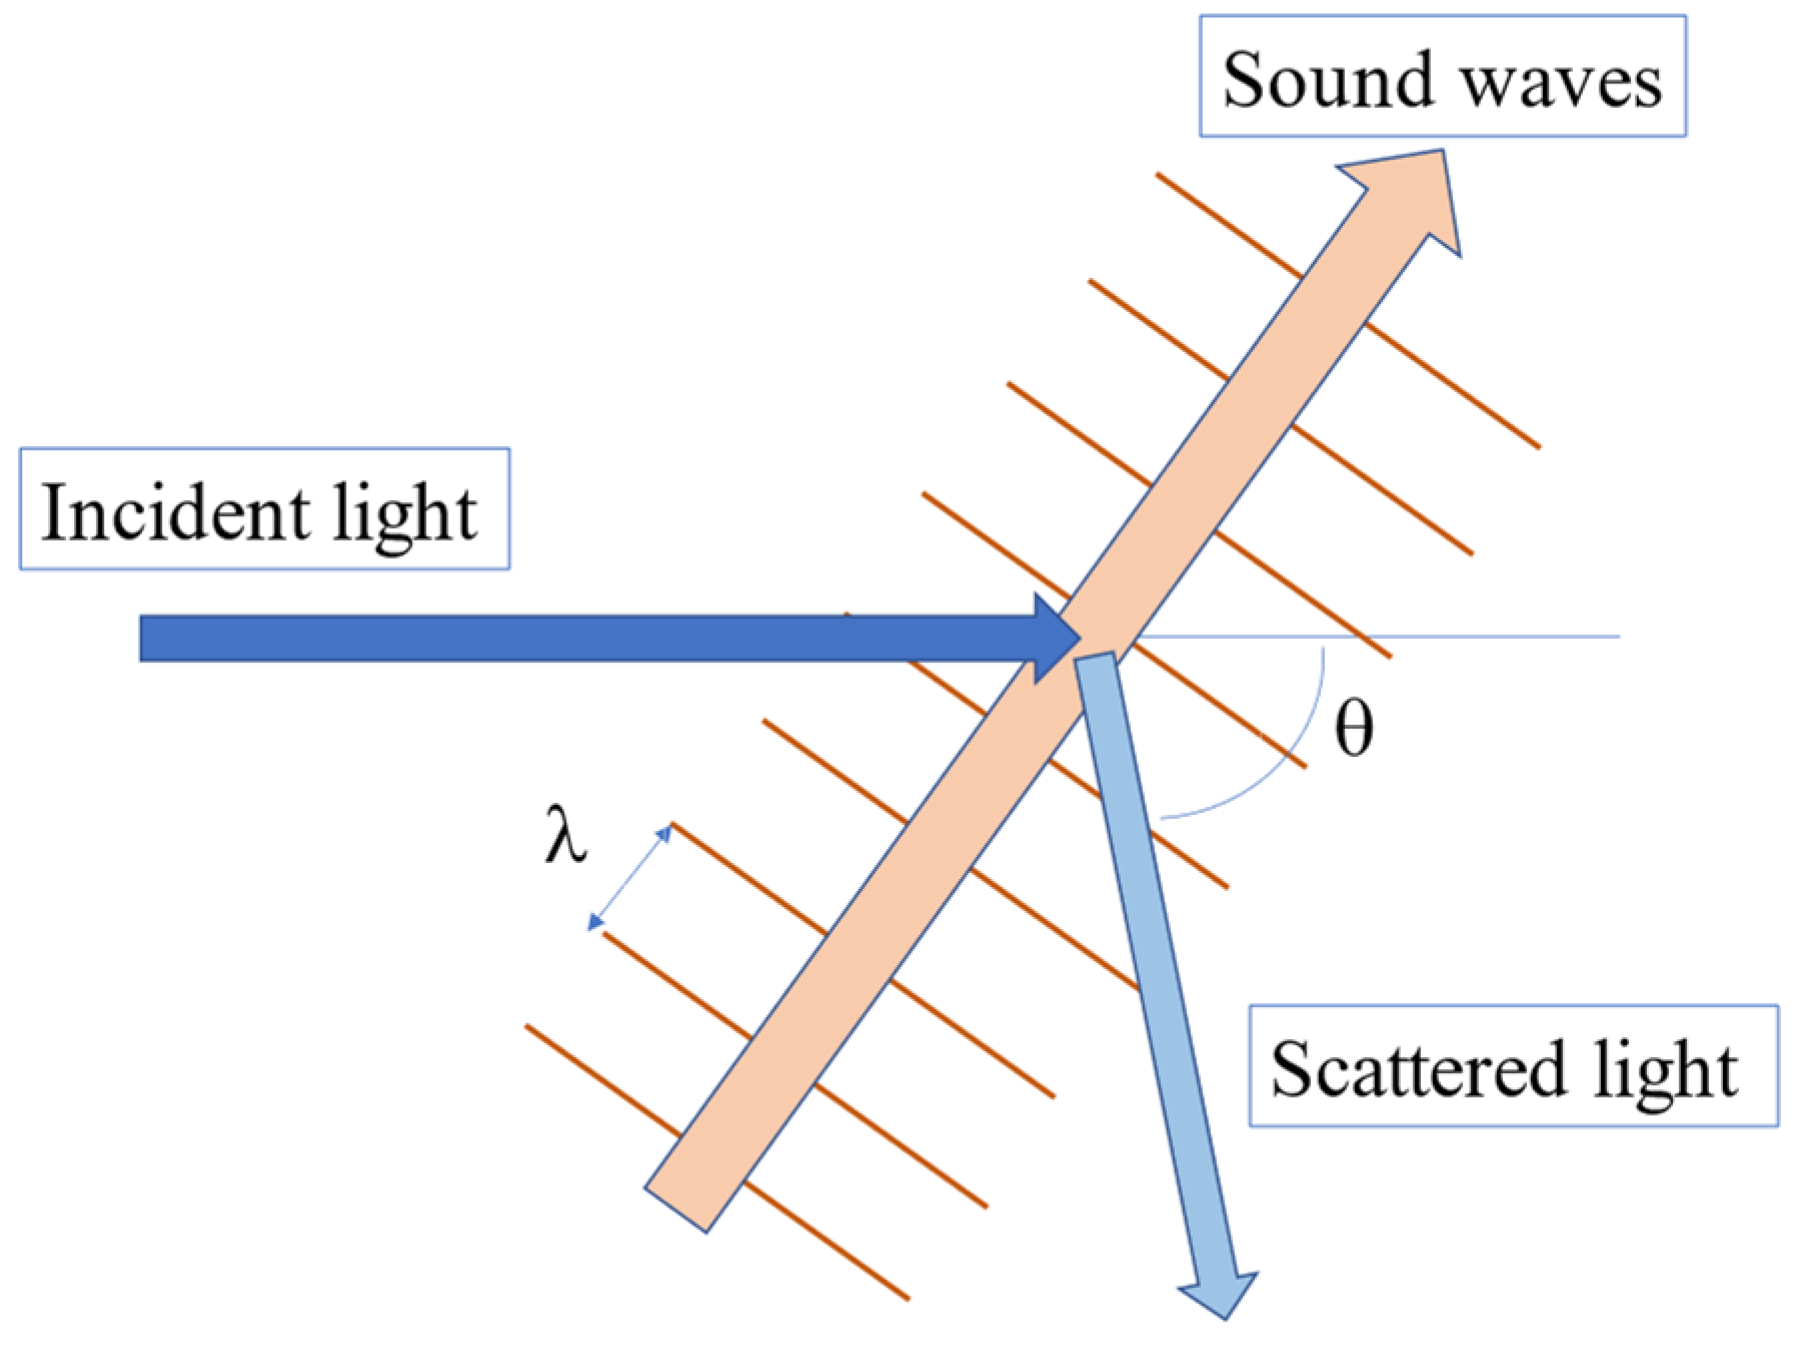
Brillouin scattering spectroscopy is a non-contact and non-destructive method to measure the velocity of acoustic phonons and elastic constants of a material using monochromatic visible light. Brillouin scattering is the inelastic scattering of light by thermally excited acoustic phonons of a sample, as shown in Figure 4. The single-frequency laser beam is incident to a sample to be observed, and the scattered light from a sample is collected into Fabry-Perot interferometers with high-frequency resolution and is detected by a photon-counting system or a CCD detector [26].
The velocity of acoustic phonons, V, of a sample, is determined based on the frequency shift from an incident beam frequency in the Brillouin scattering spectrum.
where, λi, θ, and n are the wavelength of an incident light, the scattering angle, and the refractive index of a sample, respectively. Using the longitudinal acoustic (LA) velocity and transverse acoustic (TA) velocity, all elastic moduli of a material can be calculated. The sound attenuation, α, is determined by.
where Γ is the FWHM of the Brillouin peak.
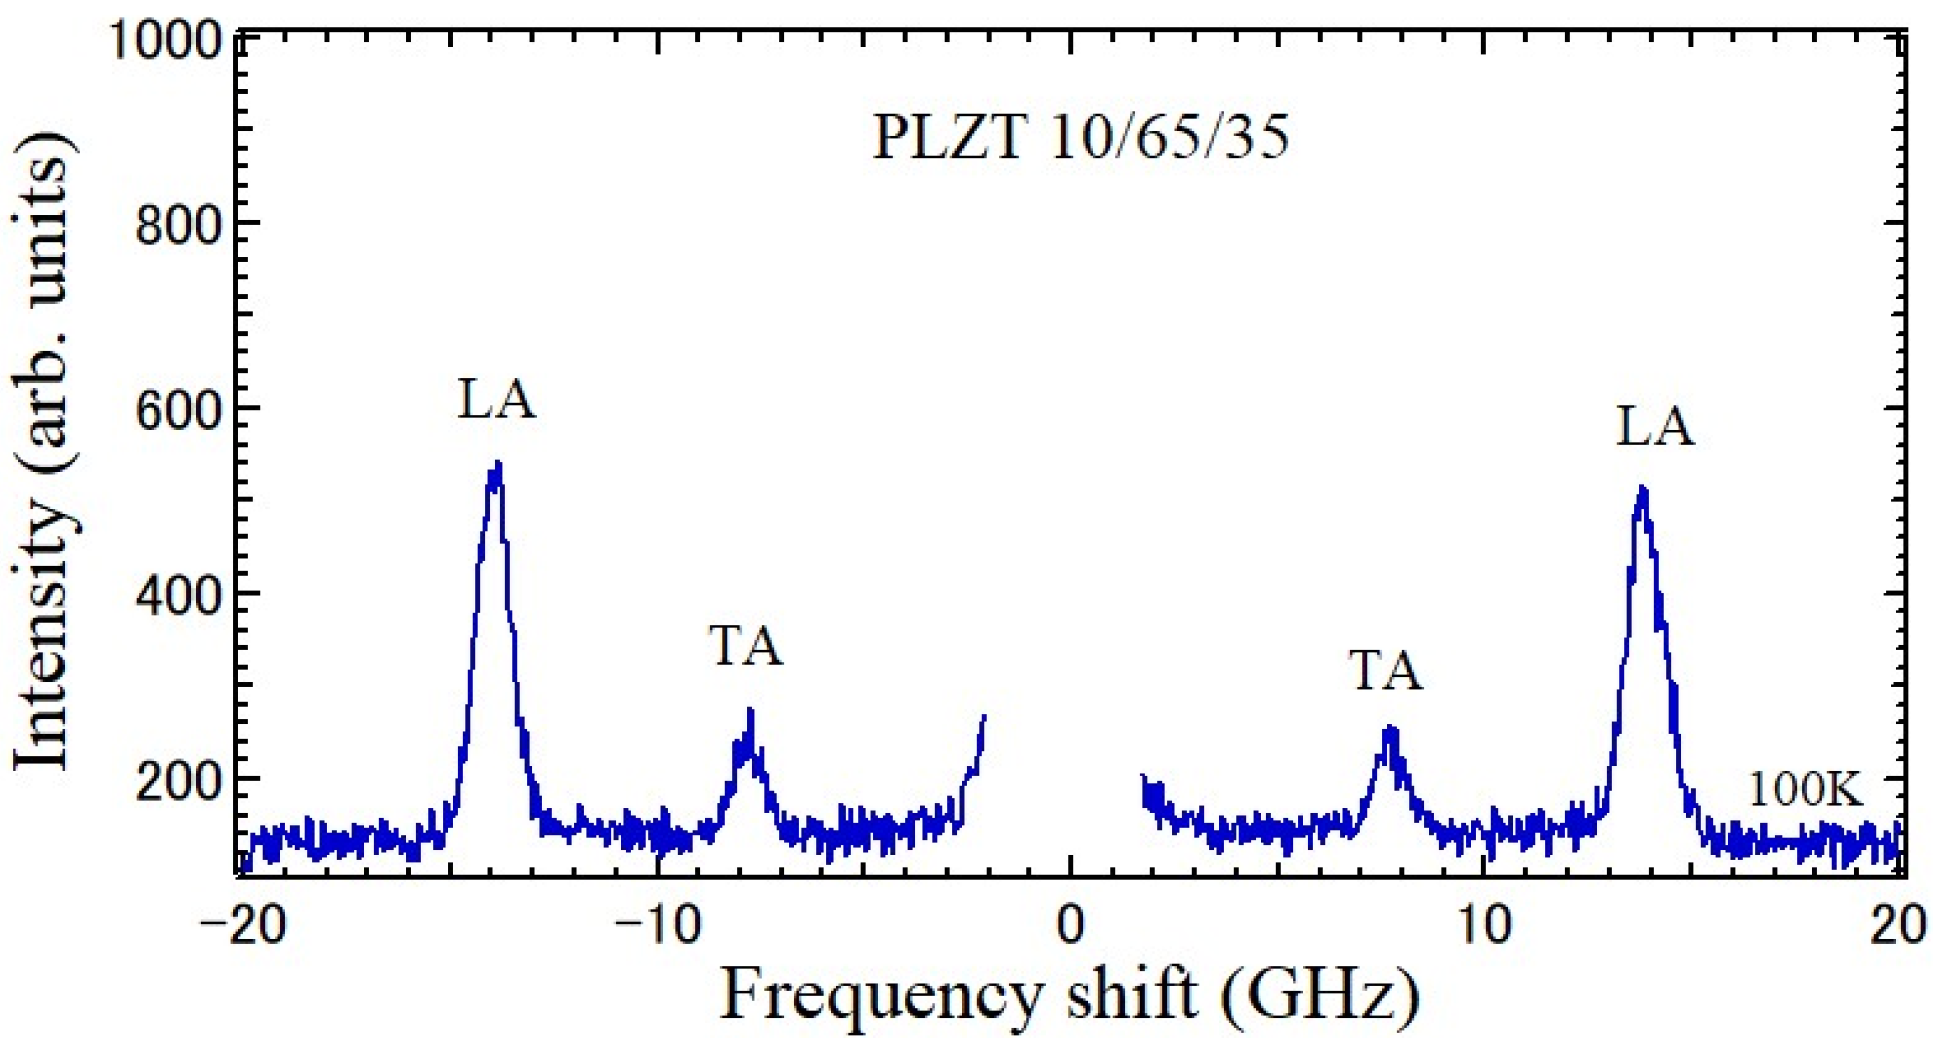
PLZT is a well-known transparent piezoelectric material, while it is very difficult to grow single crystals. Therefore, PLZT ceramics have been used for the piezoelectric application. The Brillouin scattering spectrum of piezoelectric PLZT ceramics using scanning tandem multi-pass Fabry–Perot interferometers is shown in Figure 5, in which LA and TA peaks were observed [27]. The frequency shift, > 0, is the Stokes component and the shift, < 0, is the anti-Stokes component, where and are the frequencies of the incident and scattered light, respectively.
For the rapid acquisition of a Brillouin scattering spectrum, the angular dispersive Fabry–Perot interferometer with a solid etalon has been developed [26].
For the measurement of the pressure-dependence of Poisson’s ratio, diamond anvils are convenient to observe Brillouin scattering spectra under very high pressure, as shown in Figure 6 [26,28]. By pressing the spacing between two diamond anvils, very high pressure, of up to 100 GPa, can be applied to a sample to be studied in a gasket hole. For a solid sample, a pressure-transmitting medium is used. The pressure in a gasket hole is measured based on the pressure shift of the R1 line fluorescence of a ruby chip [29]. The ruby fluorescence pressure scale is the standard method to measure pressure within a sample chamber of a diamond anvil cell apparatus.
2.5. Atomic Force Microscopy
The atomic force microscope (AFM) is a combined system of the scanning tunneling microscope and the stylus profilometer. An image of AFM is obtained based on the measurement of the force on a sharp tip related to the proximity to the surface of a sample. In air, a lateral resolution of 30 A and a vertical resolution less than 1 A were obtained [30]. Hamazaki et al. used AFM to study the surface morphology of the ferroelastic domains BaTiO3. An undulation of the surface was observed around the boundary of ferroic 90° domains and was reasonably explained based on the ferroelastic strain [31]. Hurley and Turner reported the contact-resonance atomic force microscopy (AFM) methods to quantitatively measure Poisson’s ratio and the shear modulus at the same time as Young’s modulus [32]. Yamazaki et al. reported the principle of the AFM to estimate the elasticity of the cell from force curves obtained via the AFM measurement [33]. Arnold et al. reported micro-indentation methods to measure the elastic modulus of murine articular cartilage using AFM [34]. Force curves were analyzed based on fitting using the following equation with the Hertzian model.
Here, F, R, and δ are the indentation force, probe radius, and indentation depth, respectively. They determined Young’s modulus with the assumption of ν = 0.5 and did not determine Poisson’s ratio independently. Further improvement is necessary for the accurate determination of Poisson’s ratio based on the use of AFM.
3. Poisson’s Ratio of Glasses
Using the observed values of LA velocity, VL, and TA velocity, VT, the following elastic moduli were calculated using the density, ρ, of a sample.
Compressibility: κ = 1/B.
3.1. Composition-Dependence of Poisson’s Ratio
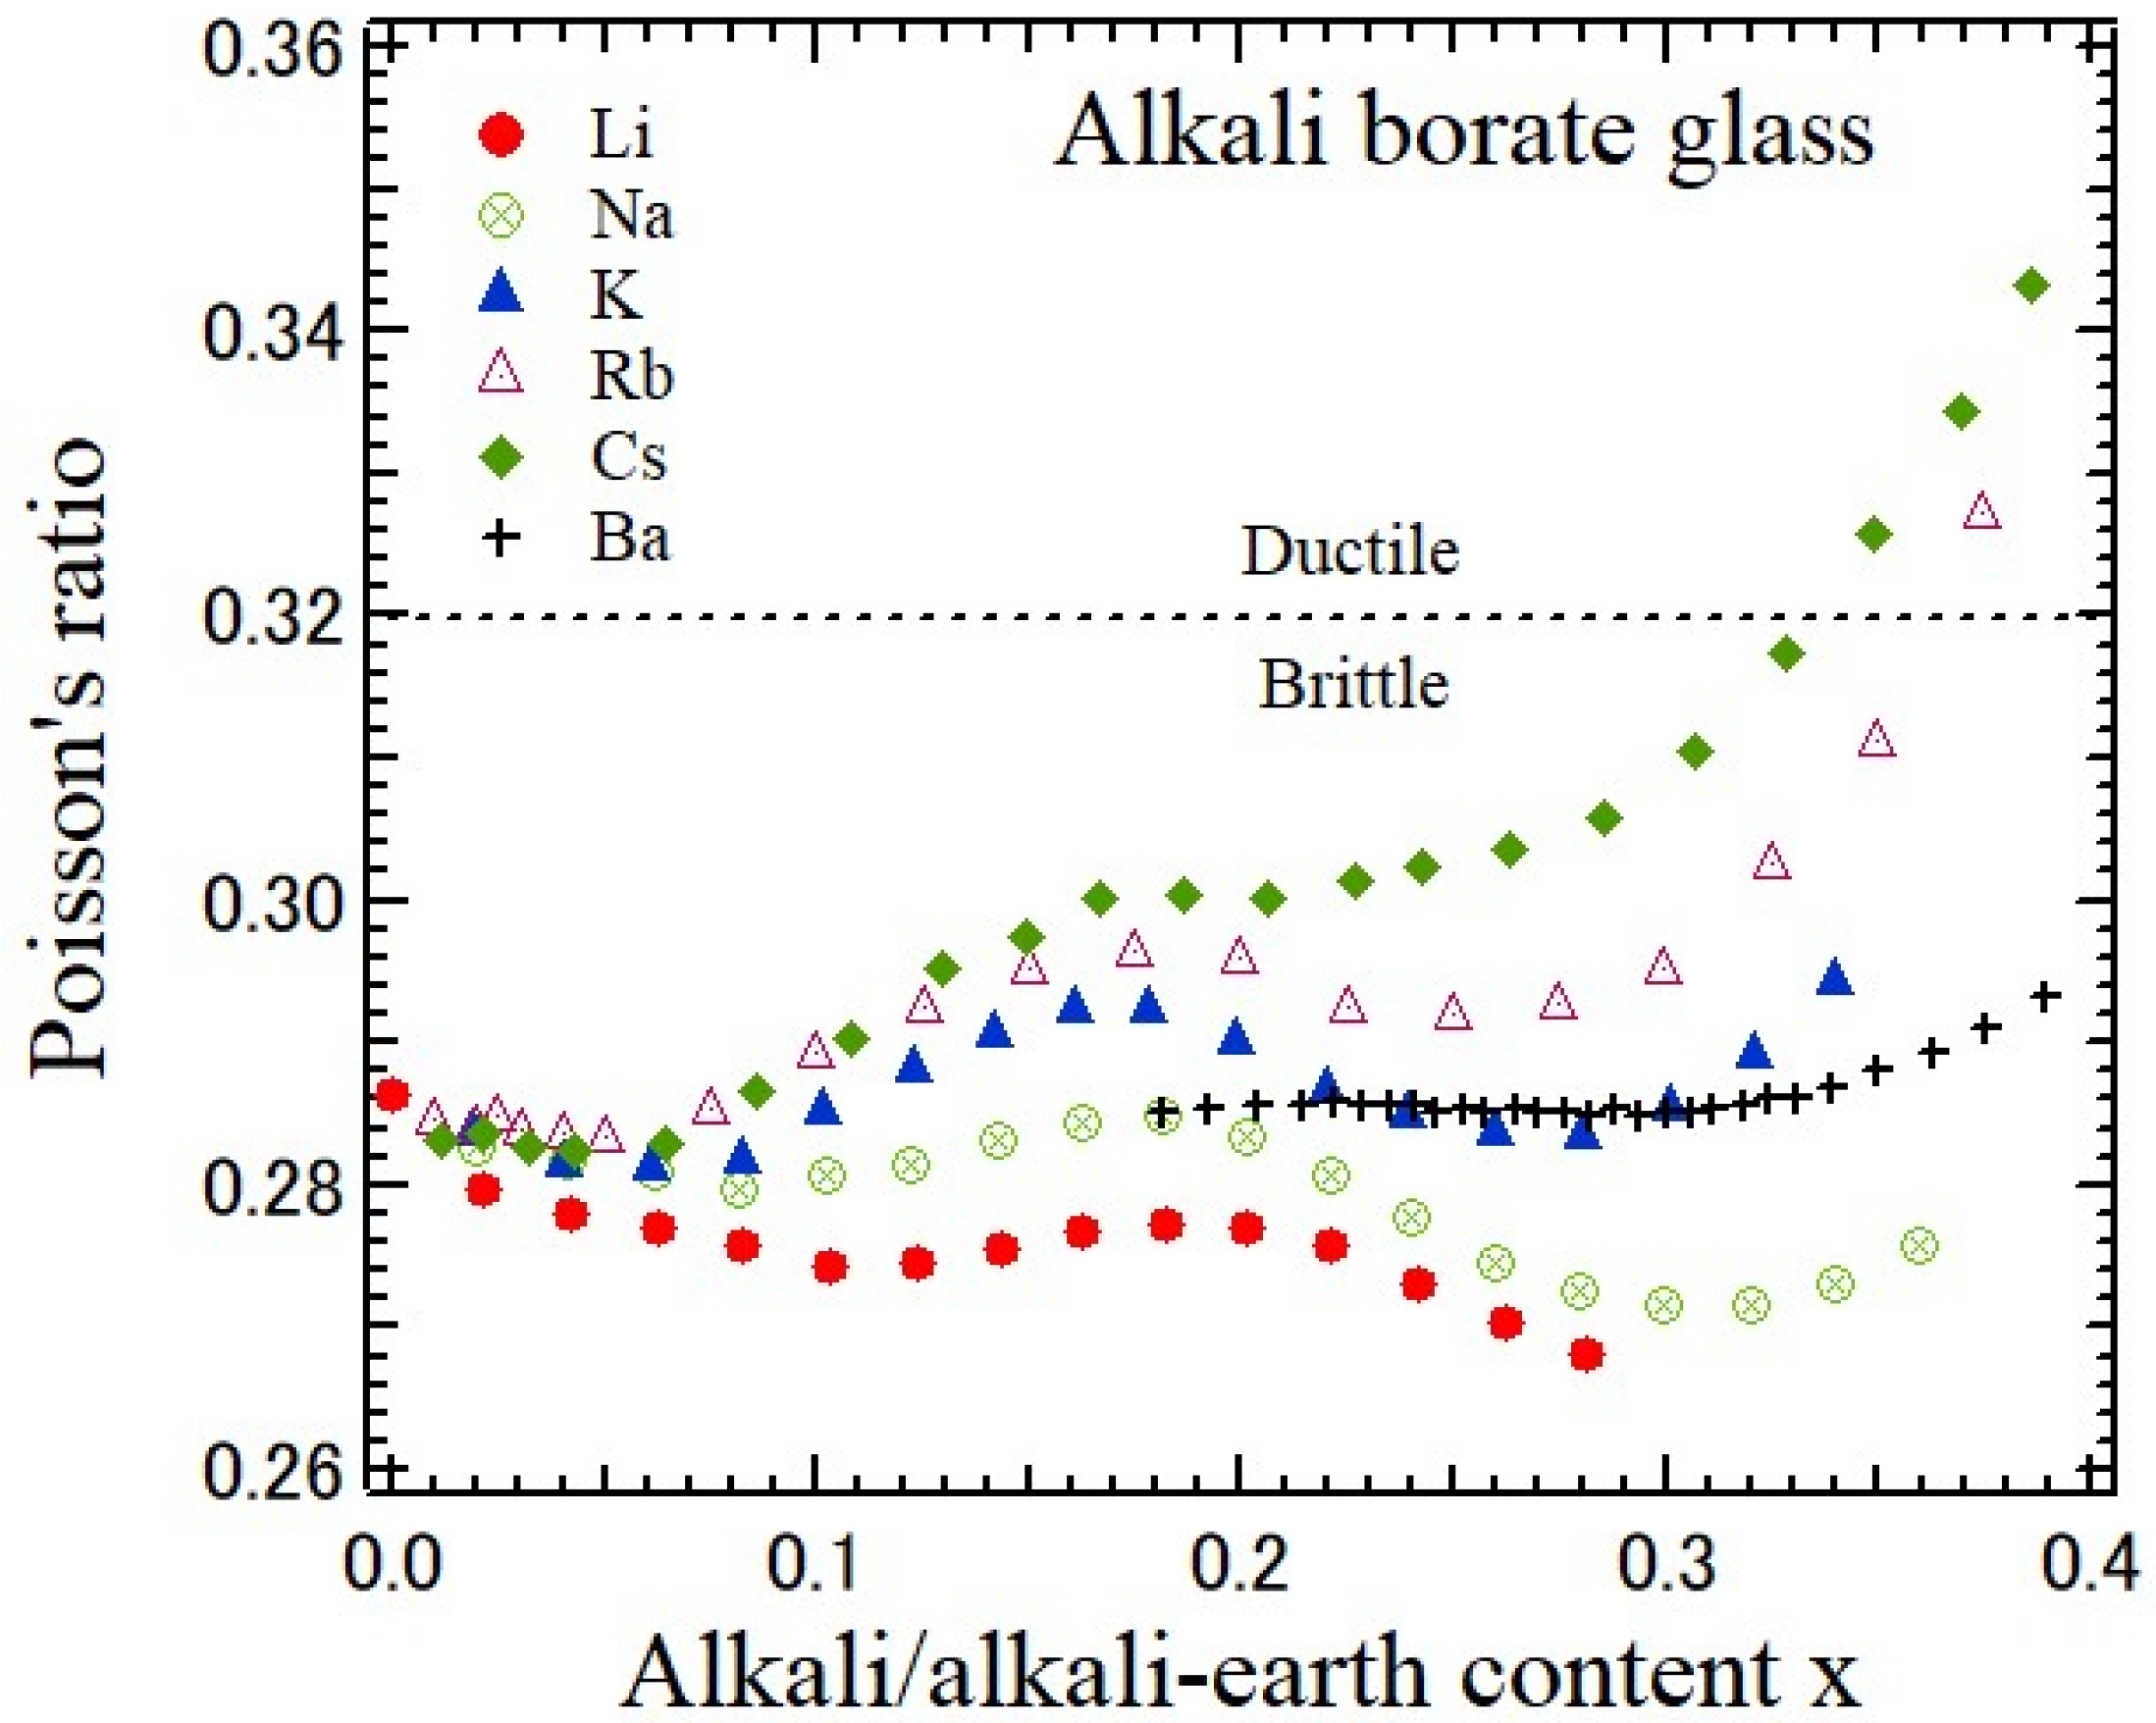
In structural glasses, Poisson’s ratio is closely related to connectivity and the atomic packing density [1]. Poisson’s ratio increases as the connectivity decreases and the atomic packing density increases. In the case of oxide glasses, the number of bridging oxygen atoms, , per glass-forming cation, such as Si, B, and P, is closely related to network crosslinking, where subscript BØ denotes bridging oxygens. For As2O3, B2O3, and P2O5 glasses, = 3 and ν ≈ 0.3, whereas for SiO2 and GeO2 glasses, = 4 and ν ≈ 0.2 [1]. Poisson’s ratio of alkali and alkali-earth borate glasses determined using the ultrasonic pulse-echo method is shown as a function of alkali and alkali-earth content in Figure 7 [35,36]. In undoped borate glass, ν = 0.28 is close to the case of = 3 and ν ≈ 0.3. There are two origins for the effect of alkali and alkali-earth modifications. (1) The presence of BØ4− units increases , and ν decreases. However, the BOØ2− units decrease , and ν increases, where O denotes nonbridging oxygens. (2) The BØ4− units in pentaborate groups do not contribute to the connectivity of the surrounding structural units, and ν does not change. For lithium and sodium borate glasses, in the (a) first alkali content range, 0 < x < 0.08, ν decreases based on the formation of BØ4− units. In the (b) second range, 0.08 < x < 0.19, pentaborate groups are formed and ν increases. In the (c) third range, 0.19 < x < 0.30, the presence of BØ4− units increases and ν decreases again. In the (d) fourth range of sodium borate glass, 0.30 < x < 0.40, pentaborate and tri-borate groups are formed. The slight increase in BOØ2− units causes the increase in ν. For potassium, rubidium, and cesium borate glasses, the formation of BOØ2− units increases, while the formation of BØ4− units decreases in the order from potassium to cesium borate glasses, and ν is larger than that of lithium and sodium borate glasses. The alkali-earth dependence of ν in barium borate glasses is mild, while it has a similarity with that of potassium borate glasses [36]. The variation in structural units may be smaller than that of alkali borate glasses. In cesium borate glass, Figure 7 shows the remarkable increase or Poisson’s ratio as the lithium content x increases and the correlation between Poisson’s ratio and fragility was observed [36]. Poisson’s ratio exceeds 0.32 for x > 0.34. Here, ν = 0.32 is the threshold of the brittle-to-ductile transition in borate glasses [37].
An overall increase in ν, increasing fragility m and Cg, was suggested [3]. A remarkable increase in fragility was reported in lithium borate glasses from m = 32 at x = 0 to m = 60 at x = 0.25 based on the increase in the lithium content x [36]. However, Poisson’s ratio of lithium borate glass decreases as the lithium content decreases, and further discussion is necessary for the correlation between Poisson’s ratio and fragility.
3.2. Pressure-Dependence of Poisson’s Ratio
Poisson’s ratio is very sensitive to pressure because pressure directly changes the interatomic distance. The pressure-dependence of Poisson’s ratio of a typical strong SiO2 glass was studied based on Brillouin scattering with a diamond anvil cell up to 57.5 GPa, as shown in Figure 8 [38]. The initial value of ν = 0.19 at 0.54 GPa decreases down to 0.15 at first and then increases to about 0.30–0.35. It is nearly pressure-independent above 23 GPa. At a low pressure, SiO2 glass is less ductile, while at a high pressure above 23 GPa, it shows typical ductility, which is like metals. These results suggest various metastable glassy states with a change in Si coordination under high pressure.
The pressure-dependence of Poisson’s ratio of typical natural fragile glass, Baltic amber, was studied [26]. Amber is a few tens of millions of years old, and it also shows ductility. The pressure-dependence of LA and TA peaks was measured based on Brillouin scattering using a diamond anvil cell. The LA frequency shift, which is proportional to LA velocity, remarkably increases as the pressure increases. The pressure-dependences of Poisson’s ratio and the bulk modulus are shown in Figure 9a. It is found that the bulk modulus monotonically increases as the pressure increases. However, the pressure-dependence of Poisson’s ratio is very small, and their values of Poisson’s ratio are about 0.35–0.37 between 1 and 12 GPa. The pressure-dependence of Poisson’s ratio of glycerol is also shown in Figure 9b [39]. Glycerol undergoes a liquid–glass transition at about 5 GPa, and above this pressure, the TA mode was observed in a glassy state using Brillouin scattering. Poisson’s ratio was determined between 5 and 14 GPa from the TA and LA sound velocities. It is found that Poisson’s ratio of glycerol in a glass state is close to that of amber, and the pressure-dependence is also very small. In general, the pressure-dependence of Poisson’s ratio of organic glasses is much smaller than that of inorganic oxide glasses.
4. Poisson’s Ratio of Piezoelectric Ceramics
When a crystal structure has no center of symmetry, the application of an electric field induces a strain, and the application of stress induces an electric polarization. This reversible phenomenon is called the piezoelectric effect. In free energy, piezoelectricity is given by the bilinear coupling between the strain and electric polarization. The piezoelectric effect is defined by the strain, eij, electric flux density, Di, stress, Xij, and electric field, Ei, based the following equation:
where dijk, sijkl, and εij are the piezoelectric, elastic compliance, and dielectric constants, respectively. Since the piezoelectricity is related to the third polar tensor, it disappears in a centrosymmetric crystal. Poisson’s ratio of piezoelectric materials can be measured using the piezo-resonance method described in Section 2.3 because the mechanical resonance is directly excited by a piezoelectric sample without the contact of a piezoelectric transducer.
Ferroelectric and piezoelectric materials are very important functional materials with sensing and actuating capabilities related to many applications. In this section, experimental results of Poisson’s ratio of well-known ferroelectric and piezoelectric PZT and PLZT ceramics are described.
4.1. Lead Zirconate Titanate Ceramics
A solid solution of xPbZrO3-(1−x)PbTiO3, PZT100x/100(1−x), is formed based on the partial replacement of Ti in ferroelectric PbTiO3 by Zr, where x is a molar ratio. PZT has a perovskite structure with the random occupancy of Ti and Zr at the B-site. Upon cooling from a high temperature, 1 wt% Nb-doped PZT75/25 (x = 0.75) and PZT95/5 (x = 0.95) ceramics undergo a structural phase transition from a paraelectric cubic to ferroelectric rhombohedral phase at TC = 543 and 476 K, respectively [40]. For further cooling, PZT75/25 and PZT95/5 undergo a ferroelectric rhombohedral high-temperature phase, FR(HT), to a ferroelectric rhombohedral low-temperature phase, FR(LT), at about Ttr = 335 and 332 K, respectively. The FR(LT)–FR(HT) phase transition in PZT95/5 is related to two transitions, i.e., the transition from the ordered R-type to disordered R-type tilts and the one from the ordered R-type to ordered M-type tilts. However, the transition in PZT75/25 is only related to the former transition of R-type to M-type tilts.
The piezoelectric and elastic properties of PZT75/25 and PZT95/5 ceramics were studied using the piezo-resonance method [24]. Poisson’s ratio ν can be derived using Equation (7) from the resonance frequency, fr, anti-resonance frequency, fa, and the first overtone frequency, fs1. The temperature-dependences of Poisson’s ratio and electromechanical coupling factor of the radial mode Kp of PZT75/25 and PZT95/5 ceramics are shown in Figure 10a and Figure 10b, respectively [40]. Poisson’s ratio and the coupling factor of PZT95/5 exhibit first-order phase transition behaviors with an abrupt change at Ttr. However, those of PZT75/25 exhibit a diffusive FR(LT)–FR(HT) phase transition with gradually continuous changes near Ttr. These results suggest that the FR(LT)–FR(HT) phase transition of PZT75/25 is probably related to the transition between ordered R-type and disordered R-type tilts and does not include M-type tilts. Very recently, the glass-like behavior of PZT was reported in the ferroelectric rhombohedral phases and paraelectric cubic phases. This fact suggests the strong phonon damping in these phases of PZT [41]. Further studies are necessary to clarify the origin of such structural phase transitions, especially in the Zr-rich compositions.
4.2. Lead Lantanum Zirconate Titanate Ceramics
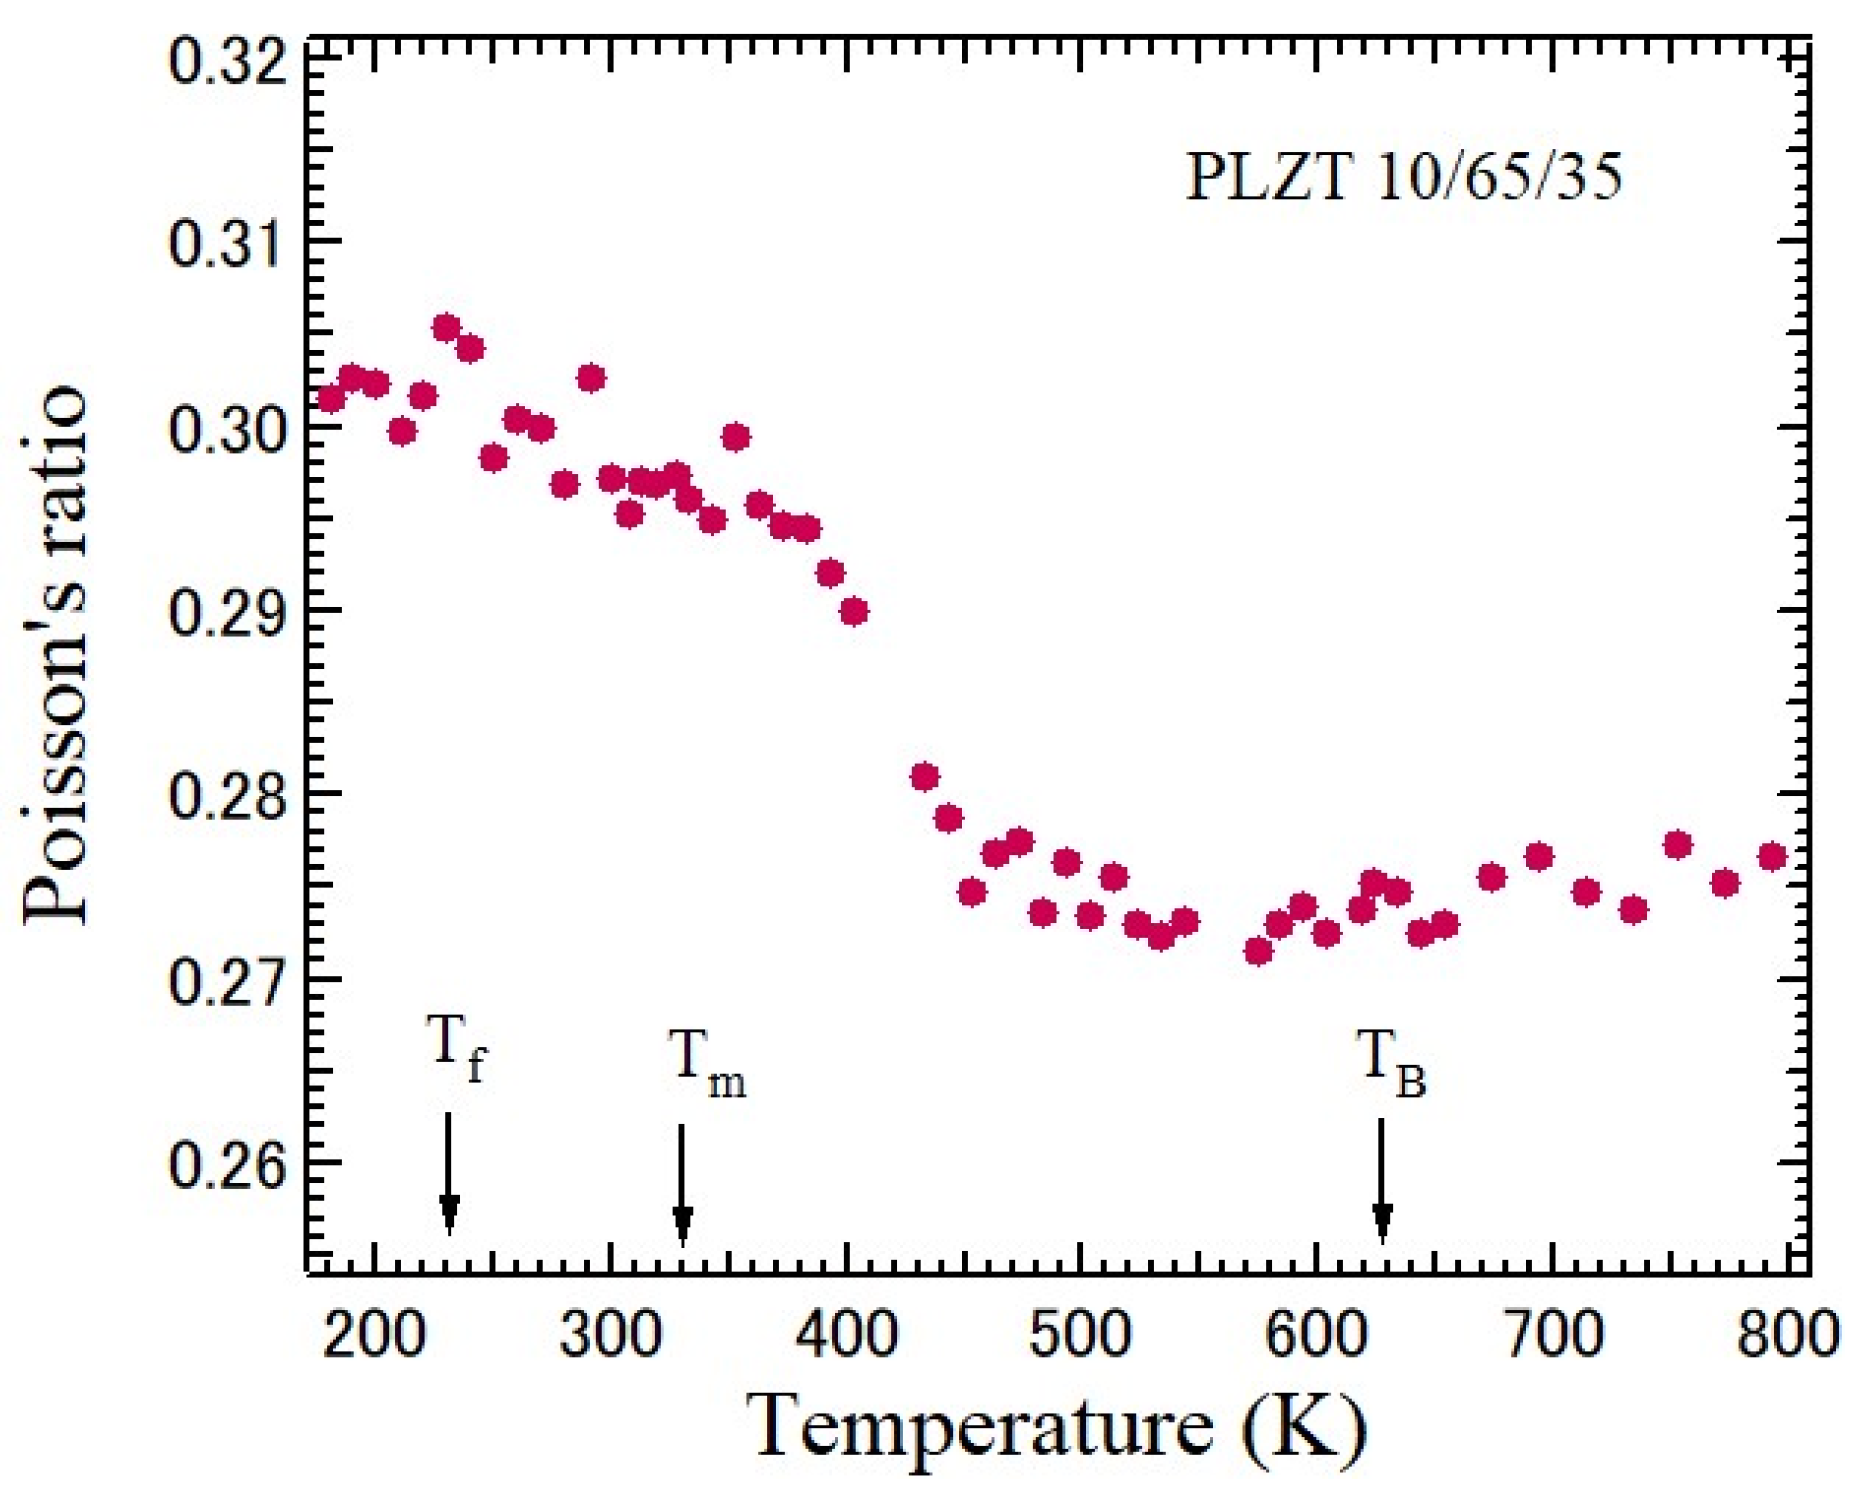
Lanthanum-modified lead zirconate titanate (Pb1−xLax)(ZryTi1−y)O3 (PLZTx/y/1−y) solid solutions with perovskite structures are transparent piezoelectric ceramics, which have various potential applications, such as electro-optical devices [42]. The compositions of the most extensively studied are x/65/35 with La contents from 5 to 14 at. % exhibiting a typical relaxor ferroelectric behavior. Its random fields are stronger than those of PZT. Since PLZT ceramics are transparent, elastic properties were studied based on Brillouin scattering in the large temperature range from 4 to 800 K [27]. The Brillouin scattering spectrum is shown in Figure 5. TA and LA peaks were observed, and the temperature-dependence of VT and VL was determined. The temperature-dependence of Poisson’s ratio of PLZT10/65/35 determined based on VT and VL is shown in Figure 11.
PLZT10/65/35 undergoes a normal-to-relaxor ferroelectric phase transition upon cooling from a high temperature. The Burns temperature, TB, dielectric maximum temperature, Tm, and freezing temperature, Tf, are 627 K, 328 K, and 230 K, respectively. Upon cooling from a high temperature, dynamic polar nano regions (PNRs) appear at TB, which is a few hundred degrees higher than the ferroelectric Curie temperature, TC. At above TB, ν = 0.27, and upon cooling, it increases up to 0.295 at Tm, which is close to TC. The increase ν can be attributed to the growth and the dynamic-to-static transition of PNRs. The diffusive change of Poisson’s ratio may be attributed to the dynamic–static transitions of PNRs. For further cooling, it becomes nearly temperature-independent, because the PNRs were frozen, and ν is about 0.30. For all the temperatures, ν is larger than 0.27.
5. First-Principles Calculation of Poisson’s Ratio of Crystals
The elastic, electronic, and optical properties of the newly hypothesized perovskite compound ACuO3 (A = Ca, Sr) were investigated under hydrostatic pressure using the first-principles method using CASTEP code [43] in the framework of density functional theory (DFT) [44]. The electronic interactions between ions and the electron are described based on the application of the exchange-correlational energy function in which the generalized gradient approximation (GGA) method developed by Perdew–Burke–Ernzerhor (PBE) is used [45]. Based on the plane-wave cut-off and k-point mesh, the convergence of the present calculations was examined carefully. The ground state structure was calculated using the Brodyden–Fletcher–Goldfarb–Shanno (BFGS) method [46]. A smooth and computation-friendly pseudopotential was produced based on ultrasoft Vanderbilt-type pseudopotentials, and it saves computation time significantly without affecting the accuracy appreciably. The independent elastic constants and elastic moduli were calculated using the stress–strain method using the CASTEP code [47].
For a cubic system, the elastic moduli, Y, B, G, and Poisson’s ratio, ν, were determined using the calculated elastic stiffness constants, Cij. By averaging the upper and lower bounds of Voigt’s and Reuss’s techniques, B and G have been calculated based on the Voigt–Reuss–Hill approximation [48] using the following equations:
where the subscript R denotes the Reuss approximation, the subscript V denotes the Voigt approximation, and B and G have been calculated following the Voigt–Reuss–Hill approximation.
Poisson’s ratio is the essential mechanical indicator. Since brittle materials can bear much stress, they are tough. However, they cannot stretch much and may break down suddenly. The stress–strain relationship of ductile materials is linear, and their elastic regions are larger. The critical value ν to determine the ductile/brittle nature of solids is 0.26 [49]. Figure 12 shows the pressure-dependences of the Young, bulk, and shear moduli of an SrCuO3 crystal.
Figure 13 shows the pressure dependence of Poisson’s ratio, ν, of CaCuO3, SrCuO3, and CsNbO3 crystals. For CaCuO3 and SrCuO3 crystals, values ν at different pressures are larger than 0.26. This fact indicates that the compounds CaCuO3 and SrCuO3 are ductile. The degree of ductility of two crystals shows nearly a monotonic behavior with applied pressure. The sort of interatomic forces involved in a crystal is also determined by the value of ν. When the value ν is between 0.25 and 0.50, the central force interaction is dominant and non-central. Since the values of ν in CaCuO3 and SrCuO3 are between 0.25 and 0.50 for all pressures, the interatomic forces can be central in both materials. In a comparison of the indicator, it is confirmed that CaCuO3 is more ductile than SrCuO3.
The cubic phase of a CsNbO3 crystal with a perovskite structure was also hypothesized to investigate the elastic, electronic, photocatalytic, and optical properties related to applications in industries using the first-principles method [50]. Frantsevich et al. reported, at first, the separation of ductility from brittleness of materials on the basis of Poisson’s ratio [51]. Frantsevich’s rule suggested that ν = 0.26 is the divided line between the brittle and ductile materials. If ν > 0.26, then the material is ductile and plastic deformation occurs. If ν < 0.26, the material is brittle and no plastic deformation occurs. The values of ν above 20 GPa indicated a ductile nature. Meanwhile, the values below 20 GPa show a brittle nature, as shown in Figure 13.
6. Conclusions
Poisson’s ratio is a very important elastic modulus used to discuss various properties of glasses, ceramics, and crystals. It is related to the connectivity, mean coordination number, valence electron density, and fragility of glass-forming materials. At first, the five kinds of experimental methods to determine Poisson’s ratio are introduced, namely the ultrasonic pulse-echo method, resonant ultrasonic spectroscopy, piezoelectric resonance method, Brillouin scattering spectroscopy, and atomic force microscopy. For the evaluation of elastic constants of hypothesized compounds, the first-principles calculation is described. Poisson’s ratio is sensitive to the composition, temperature, and pressure. The experimental results based on the dependences of Poisson’s ratio on the temperature, pressure, and composition are reviewed for various glasses, ceramics, and crystals. The mechanism of these variations is discussed from physical and chemical points of view. In oxide glasses, the number of bridging oxygen atoms per glass-forming cation is directly related to network crosslinking through Poisson’s ratio. The correlation between Poisson’s ratio and fragility is discussed. Piezoelectric ceramics show the anomaly in the vicinity of a structural phase-transition temperature. Based on the first-principles calculation, ductile–brittle transition is discussed.
Funding
This research received no external funding.
Informed Consent Statement
Not applicable.
Data Availability Statement
The data that support the findings of this study are available from the corresponding author upon reasonable request.
Acknowledgments
The author thanks collaborations on the study of elastic properties of various glasses and ceramics with Y. Matsuda, G. Shabbir, M. Ahart, Md Helal, Md Rahaman, X. L. Dong, Y.-H. Ko, Q. R. Yin, T. Suzuki, and M. Kodama.
Conflicts of Interest
The author declares no conflict of interest.
References
- Greaves, G.N.; Greer, A.L.; Lakes, R.S.; Rouxe, T. Poisson’s ratio and modern materials. Nat. Mater. 2011, 10, 823–837. [Google Scholar] [CrossRef] [PubMed]
- Novikov, V.N.; Sokolov, A.P. Poisson’s ratio and the fragility of glass-forming liquids. Nature 2004, 431, 961–963. [Google Scholar] [CrossRef] [PubMed]
- Østergaard, M.B.; Hansen, S.R.; Januchta, K.; To, T.; Rzoska, S.J.; Bockowski, M.; Bauchy, M.; Smedskjaer, M.M. Revisiting the Dependence of Poisson’s Ratio on Liquid Fragility and Atomic Packing Density in Oxide Glasses. Materials 2019, 12, 2439. [Google Scholar] [CrossRef] [PubMed]
- Lakes, R.S. Foam structures with a negative Poisson’s ratio. Science 1987, 235, 1038–1040. [Google Scholar] [CrossRef]
- Wojciechowski, K.W. Auxetics and Other Systems with Unusual Characteristics. Phys. Status Solidi B 2022, 259, 2200536. [Google Scholar] [CrossRef]
- Baughman, R.H.; Shacklette, J.M.; Zakhidov, A.A.; Stafstrom, S. Negative Poisson’s ratios as a common feature of cubic metals. Nature 1998, 392, 362–365. [Google Scholar] [CrossRef]
- Friis, E.A.; Lakes, R.S.; Park, J.B. Negative Poisson’s ratio polymeric and metallic materials. J. Mater. Sci. 1988, 23, 4406–4414. [Google Scholar] [CrossRef]
- Hiep, N.T.; Nguyen, C.Q.; Hieu, N.N. Negative Poisson’s ratio and anisotropic carrier mobility in ternary Janus Si2XY (X=Y ¼ S, Se, Te): First-principles prediction. Appl. Phys. Lett. 2023, 123, 092102. [Google Scholar] [CrossRef]
- McSkimin, H.J. Pulse superposition method for measuring ultrasonic wave velocities in solids. J. Aco. Soc. Am. 1961, 33, 12–16. [Google Scholar] [CrossRef]
- Yasunaga, M.; Funatsu, Y.; Kojima, S.; Otsuka, K.; Suzuki, T. Ultrasonic Velocity Near The Martensitic Transformation Temperature. J. Phys. Colloq. 1982, 43, C4-603–C4-608. [Google Scholar] [CrossRef]
- Kodama, M.; Kojima, S. High Accuracy Measurement of Ultrasonic Travel Time by Pulse-Echo Overlap Method: The McSkimin Criterion for Specimens over a Wide Range of Characteristic Impedance. Proc. Symp. Ultrason. Electron. 2010, 31, 37–38. [Google Scholar]
- Sato, Y.; Usami, T. Basic study on the oscillation of a homogeneous elastic sphere. I. Frequency of the free oscillations. Geophys. Mag. 1962, 31, 15–24. [Google Scholar]
- Sato, Y.; Usami, T. Basic study on the oscillation of a homogeneous elastic sphere: II. Distribution of displacement. Geophys. Mag. 1962, 31, 25–47. [Google Scholar]
- Sato, Y.; Usami, T. Basic study on the oscillation of a homogeneous elastic sphere: III. Boundary conditions and the generation of elastic waves. Geophys. Mag. 1962, 31, 49–62. [Google Scholar]
- Fraser, D.B.; LeCraw, R.C. Novel Method of Measuring Elastic and Anelastic Properties of Solids. Rev. Sci. Inst. 1964, 35, 1113–1115. [Google Scholar] [CrossRef]
- Ohno, I. Free vibration of a rectangular parallelepiped crystal and its application to determination of elastic constants of orthorhombic crystals. J. Phys. Earth 1976, 24, 355–379. [Google Scholar] [CrossRef]
- Guenin, G.; Rios Jara, D.; Murakami, Y.; Delaey, L.; Gobin, P.F. Some elastic properties of a single crystal of Cu-Zn-Al Martensite. Scripta Met. 1979, 13, 289–292. [Google Scholar] [CrossRef]
- Yasunaga, M.; Funatsu, Y.; Kojima, S.; Otsuka, K.; Suzuki, T. Measurement of Elastic Constants. Scripta. Met. 1983, 17, 1091–1094. [Google Scholar] [CrossRef]
- Olsen, J.L. Change of Elastic Constants in a Superconductor. Nature 1955, 175, 37. [Google Scholar] [CrossRef]
- Tanaka, M.; Yosizaki, R.; Kojima, S.; Sakudo, T.; Suzuki, T. Elastic Modulus Measurement of BaPb1−xBixO3 by Resonance Method. Jpn. J. Appl. Phys. 1985, 24 (Suppl. S1), 18–20. [Google Scholar] [CrossRef]
- Fukuda, H.; Nagakubo, A.; Wright, O.B.; Kyotani, K.; Ogi, H. Deep-Learning-Assisted Resonant Ultrasound Spectroscopy for Cubic Solids. Phys. Rev. Appl. 2023, 20, 034048. [Google Scholar]
- Bechmann, R. Elastic, Piezoelectric, and Dielectric Constants of Polarized Barium Titanate Ceramics and Some Applications of the Piezoelectric Equations. J. Acous. Soc. Am. 1956, 28, 347–350. [Google Scholar] [CrossRef]
- Li, Y.; Qing, Z.K.; Zhou, Z.G. Measurements for Piezoelectric and Ferroelectric Materials; Science Press: Beijing, China, 1984. (In Chinese) [Google Scholar]
- Zhang, S.; Dong, X.L.; Kojima, S. Temperature Dependence of Dielectric, Elastic and Piezoelectric Properties of Pb(ZrxTi1−x)O3. Jpn. J. Appl. Phys. 1997, 36, 2994–2997. [Google Scholar] [CrossRef]
- Dong, X.L.; Kojima, S. Dielectric and resonance frequency investigations of phase transitions in Nb-doped PZT95/5 and 75/25 ceramics. J. Phys. Conden. Matter. 1997, 9, L171. [Google Scholar]
- Kojima, S. 100th Anniversary of Brillouin Scattering: Impact on Materials Science. Materials 2022, 15, 3518. [Google Scholar] [CrossRef] [PubMed]
- Shabbir, G.; Ko, J.H.; Kojima, S.; Yin, Q. Acoustic properties of PLZT relaxor ferroelectric ceramics studied by Brillouin scattering. Appl. Phys. Lett. 2003, 82, 4696–4698. [Google Scholar]
- Kojima, S.; Nakamura, T.; Asaumi, K.; Takashige, M.; Minomura, S. Raman Scattering Studies on Phase Transition in Barium Sodium Niobate at High-Pressure. Solid State Commun. 1979, 29, 779–783. [Google Scholar]
- Mao, H.K.; Bell, P.M.; Shaner, J.W.; Steinberg, D.J. Specific volume measurements of Cu, Mo, Pd, and Ag and calibration of the ruby R 1 fluorescence pressure gauge from 0.06 to 1 Mbar. J. Appl. Phys. 1978, 49, 3276–3283. [Google Scholar]
- Binnig, G.; Quate, C.F.; Gerber, C. Atomic Force Microscope. Phys. Rev. Lett. 1986, 56, 930–933. [Google Scholar] [CrossRef]
- Hamazaki, S.; Shimizu, F.; Kojima, S.; Takashige, M. AFM observation of 90° domains of BaTiO3 butterfly crystals. J. Phys. Soc. Jpn. 1995, 64, 3660–3663. [Google Scholar] [CrossRef]
- Hurley, D.C.; Turner, J.A. Measurement of Poisson’s ratio with contact-resonance atomic force microscopy. J. Appl. Phys. 2007, 102, 033509. [Google Scholar] [CrossRef]
- Yamasaki, Y.; Akita, E.; Okano, K.; Hosokawa, Y. Force measurement of plant cell utilizing atomic force microscopy. Plant Morphol. 2021, 33, 41–45. [Google Scholar] [CrossRef]
- Arnold, K.M.; Sicard, D.; Tschumperlin, D.J.; Westendorf, J.J. Atomic Force Microscopy Micro-Indentation Methods for Determining the Elastic Modulus of Murine Articular Cartilage. Sensors 2023, 23, 1835. [Google Scholar] [PubMed]
- Kodama, M. Velocity of sound in and elastic properties of barium borate glasses. Phys. Chem. Glass 1985, 26, 105–112. [Google Scholar]
- Kojima, S. Physical properties of alkali borate glasses. In Advances in Materials Science Research; Nova Science Publishers: Hauppauge, NY, USA, 2022; Volume 55, Chapter 8. [Google Scholar]
- Ngai, K.L.; Wang, L.M.; Liu, R.; Wang, W.H. Microscopic dynamics perspective on the relationship between Poisson’s ratio and ductility of metallic glasses. J. Chem. Phys. 2014, 140, 044511. [Google Scholar] [CrossRef]
- Zha, C.S.; Hemley, R.J.; Mao, H.K.; Duffy, T.S.; Meade, C. Acoustic velocities and refractive index of SiO2 glass to 57.5 GPa by Brillouin scattering. Phys. Rev. B 1984, 50, 13105. [Google Scholar] [CrossRef]
- Vallero, C.; Ahart, M.; Tkachev, S.; Chariton, S.; Prakapenka, V.; Kojima, S.; Gramsh, S.A.; Russell, J.; Hemley, R.J. Acoustic properties, elasticity, and equation of state of glycerol under pressure. J. Chem. Phys. 2023, 159, 064506. [Google Scholar] [CrossRef]
- Dong, X.L.; Kojima, S. Dynamical Properties of the FR(LT)-FR(HT) Phase Transition in Zr-Rich Lead Zirconate Titanate Ceramics. Jpn. J. Appl. Phys. 1997, 36, 2989–2993. [Google Scholar] [CrossRef]
- Tachibana, M.; Bourgès, C.; Mori, T. Thermal conductivity of lead zirconate titanate PbZr1−xTixO3. Appl. Phys. Express 2023, 16, 101002. [Google Scholar] [CrossRef]
- Haertling, G.H.; Land, C.E. Hot-Pressed (Pb,La)(Zr,Ti)O3 Ferroelectric Ceramics for Electrooptic Applications. J. Am. Ceram. Soc. 1971, 54, 1–11. [Google Scholar]
- Segal, M.D.; Lindan, P.J.D.; Probert, M.J.; Pickard, C.J.; Hasnip, P.J.; Clark, S.J.M.; Payne, M.C. First-principles simulation: Ideas, illustrations, and the CASTEP code. J. Phys. Condens. Matter 2002, 14, 2717–2744. [Google Scholar] [CrossRef]
- Khon, W.; Sham, L.J. Self-Consistent Equations Including Exchange and Correlation Effects. Phys. Rev. 1965, 140, A1133–A1138. [Google Scholar] [CrossRef]
- Perdew, J.P.; Burke, K.; Ernzerhof, M. Generalized gradient approximation made simple. Phys. Rev. Lett. 1996, 77, 3865–3868. [Google Scholar] [CrossRef] [PubMed]
- Bouhemadou, A. Calculated structural and elastic properties of M2InC (M = Sc, Ti, V, Zr, Nb, Hf, Ta). Mod. Phys. Lett. B 2008, 22, 2063–2076. [Google Scholar] [CrossRef]
- Monira, M.; Helal, M.A.; Liton, M.N.H.; Kamruzzaman, M.; Islam, A.K.M.F.; Kojima, S. Effect of hydrostatic pressure on mechanical and optoelectronic properties of ACuO3 (A = Ca, Sr). Jpn. J. Appl. Phys. 2022, 61, 111001. [Google Scholar] [CrossRef]
- Zuo, L.; Hambert, M.; Esling, C. Elastic properties of polycrystals in the Voigt–Reuss–Hill approximation. J. Appl. Crystallogr. 1992, 25, 751–755. [Google Scholar] [CrossRef]
- Bouhadda, Y.; Djellab, S.; Bououdina, M.; Fenineche, N.; Boudouma, Y. Structural and elastic properties of LiBH4 for hydrogen storage applications. J. Alloys Compd. 2012, 534, 20–24. [Google Scholar] [CrossRef]
- Monira, M.; Helal, M.A.; Liton, M.N.H.; Kamruzzaman, M.; Kojima, S. Elastic, optoelectronic and photocatalytic properties of semiconducting CsNbO3: First principles insights. Sci. Rep. 2023, 13, 10246. [Google Scholar] [CrossRef]
- Frantsevich, I.N.; Voronov, F.F.; Bokuta, S.A. Elastic Constants and Elastic Moduli of Metals and Insulators Handbook; Naukova Dumka: Kyiv, Ukraine, 1983; pp. 60–180. [Google Scholar]
Figure 1.
Ultrasonic pulse-echo overlap method [11]. The sound velocity of a sample is determined based on the travel time of an ultrasonic pulse and the travel length of a sample. The operating frequency is usually 1~10 MHz.
Figure 1.
Ultrasonic pulse-echo overlap method [11]. The sound velocity of a sample is determined based on the travel time of an ultrasonic pulse and the travel length of a sample. The operating frequency is usually 1~10 MHz.

Figure 2.
Experimental setup to measure the resonance frequencies of a rectangular parallelepiped sample [18]. Two shear mode transducers are used as an exciting source and detection, where PZT transducers are piezoelectric ceramics. Poisson’s ratio is determined based on the measurement of tortional and spheroidal resonance-mode frequencies.

Figure 3.
Apparatus for measuring the piezoelectric resonance of a piezoelectric plate with length L, width W, and thickness d.
Figure 3.
Apparatus for measuring the piezoelectric resonance of a piezoelectric plate with length L, width W, and thickness d.

Figure 4.
Inelastic light scattering by thermally excited acoustic phonons where λ and θ denote the wavelength of the acoustic mode and scattering angle between the incident and scattered light, respectively.
Figure 4.
Inelastic light scattering by thermally excited acoustic phonons where λ and θ denote the wavelength of the acoustic mode and scattering angle between the incident and scattered light, respectively.

Figure 5.
Brillouin scattering spectrum of a piezoelectric PLZT 10/65/35 ceramic at 100 K. Stokes and anti-Stokes components are observed. LA and TA denote peaks of longitudinal acoustic and transverse acoustic modes, respectively [27].
Figure 5.
Brillouin scattering spectrum of a piezoelectric PLZT 10/65/35 ceramic at 100 K. Stokes and anti-Stokes components are observed. LA and TA denote peaks of longitudinal acoustic and transverse acoustic modes, respectively [27].

Figure 6.
The diamond anvil cell to measure Brillouin scattering from a sample under high pressures [26]. The pressure of a sample is measured based on the pressure shift of the R1 line fluorescence of a ruby scale. Poisson’s ratio is determined based on the measurement of LA and TA velocities.
Figure 6.
The diamond anvil cell to measure Brillouin scattering from a sample under high pressures [26]. The pressure of a sample is measured based on the pressure shift of the R1 line fluorescence of a ruby scale. Poisson’s ratio is determined based on the measurement of LA and TA velocities.

Figure 7.
Composition-dependence of Poisson’s ratio of alkali and alkali-earth borate glasses [35,36].

Figure 8.
Pressure-dependence of Poisson’s ratio of an SiO2 glass measured based on Brillouin scattering using DAC [38].
Figure 8.
Pressure-dependence of Poisson’s ratio of an SiO2 glass measured based on Brillouin scattering using DAC [38].

Figure 9.
Pressure-dependence of (a) Poisson’s ratio ν and the bulk modulus B of Baltic amber measured based on Brillouin scattering [26], and (b) pressure-dependence of Poisson’s ratio of glycerol [39].

Figure 10.
Temperature-dependences of (a) Poisson’s ratio and (b) coupling factor of piezoelectric PZT75/25 and PZT 95/5 ceramics with a perovskite structure in a ferroelectric phase [40]. Ttr is the transition temperature from FR(LT) to FR(HT).
Figure 10.
Temperature-dependences of (a) Poisson’s ratio and (b) coupling factor of piezoelectric PZT75/25 and PZT 95/5 ceramics with a perovskite structure in a ferroelectric phase [40]. Ttr is the transition temperature from FR(LT) to FR(HT).

Figure 11.
Temperature-dependence of Poisson’s ratio of piezoelectric PLZT10/65/35 ceramics with a perovskite structure [27]. It undergoes a normal-to-relaxor ferroelectric phase transition.
Figure 11.
Temperature-dependence of Poisson’s ratio of piezoelectric PLZT10/65/35 ceramics with a perovskite structure [27]. It undergoes a normal-to-relaxor ferroelectric phase transition.

Figure 12.
Pressure-dependences of Young, bulk, and shear moduli of an SrCuO3 crystal.


Disclaimer/Publisher’s Note: The statements, opinions and data contained in all publications are solely those of the individual author(s) and contributor(s) and not of MDPI and/or the editor(s). MDPI and/or the editor(s) disclaim responsibility for any injury to people or property resulting from any ideas, methods, instructions or products referred to in the content. |
© 2024 by the author. Licensee MDPI, Basel, Switzerland. This article is an open access article distributed under the terms and conditions of the Creative Commons Attribution (CC BY) license (https://creativecommons.org/licenses/by/4.0/).
Share and Cite
MDPI and ACS Style
Kojima, S. Poisson’s Ratio of Glasses, Ceramics, and Crystals. Materials 2024, 17, 300. https://doi.org/10.3390/ma17020300
AMA Style
Kojima S. Poisson’s Ratio of Glasses, Ceramics, and Crystals. Materials. 2024; 17(2):300. https://doi.org/10.3390/ma17020300
Chicago/Turabian StyleKojima, Seiji. 2024. "Poisson’s Ratio of Glasses, Ceramics, and Crystals" Materials 17, no. 2: 300. https://doi.org/10.3390/ma17020300
Note that from the first issue of 2016, this journal uses article numbers instead of page numbers. See further details here.