

Fast Hydrogen Sorption Kinetics in Mg-VCl3 Produced by Cryogenic Ball-Milling

Abstract
:1. Introduction
2. Materials and Methods
2.1. Mixtures Preparation
2.2. Hydriding and Dehydriding Reactions
2.3. Physicochemical Characterization of the Materials
3. Results
3.1. Hydriding and Dehydriding Reactions of Cryogenically Milled Mg-15wt.% VCl3
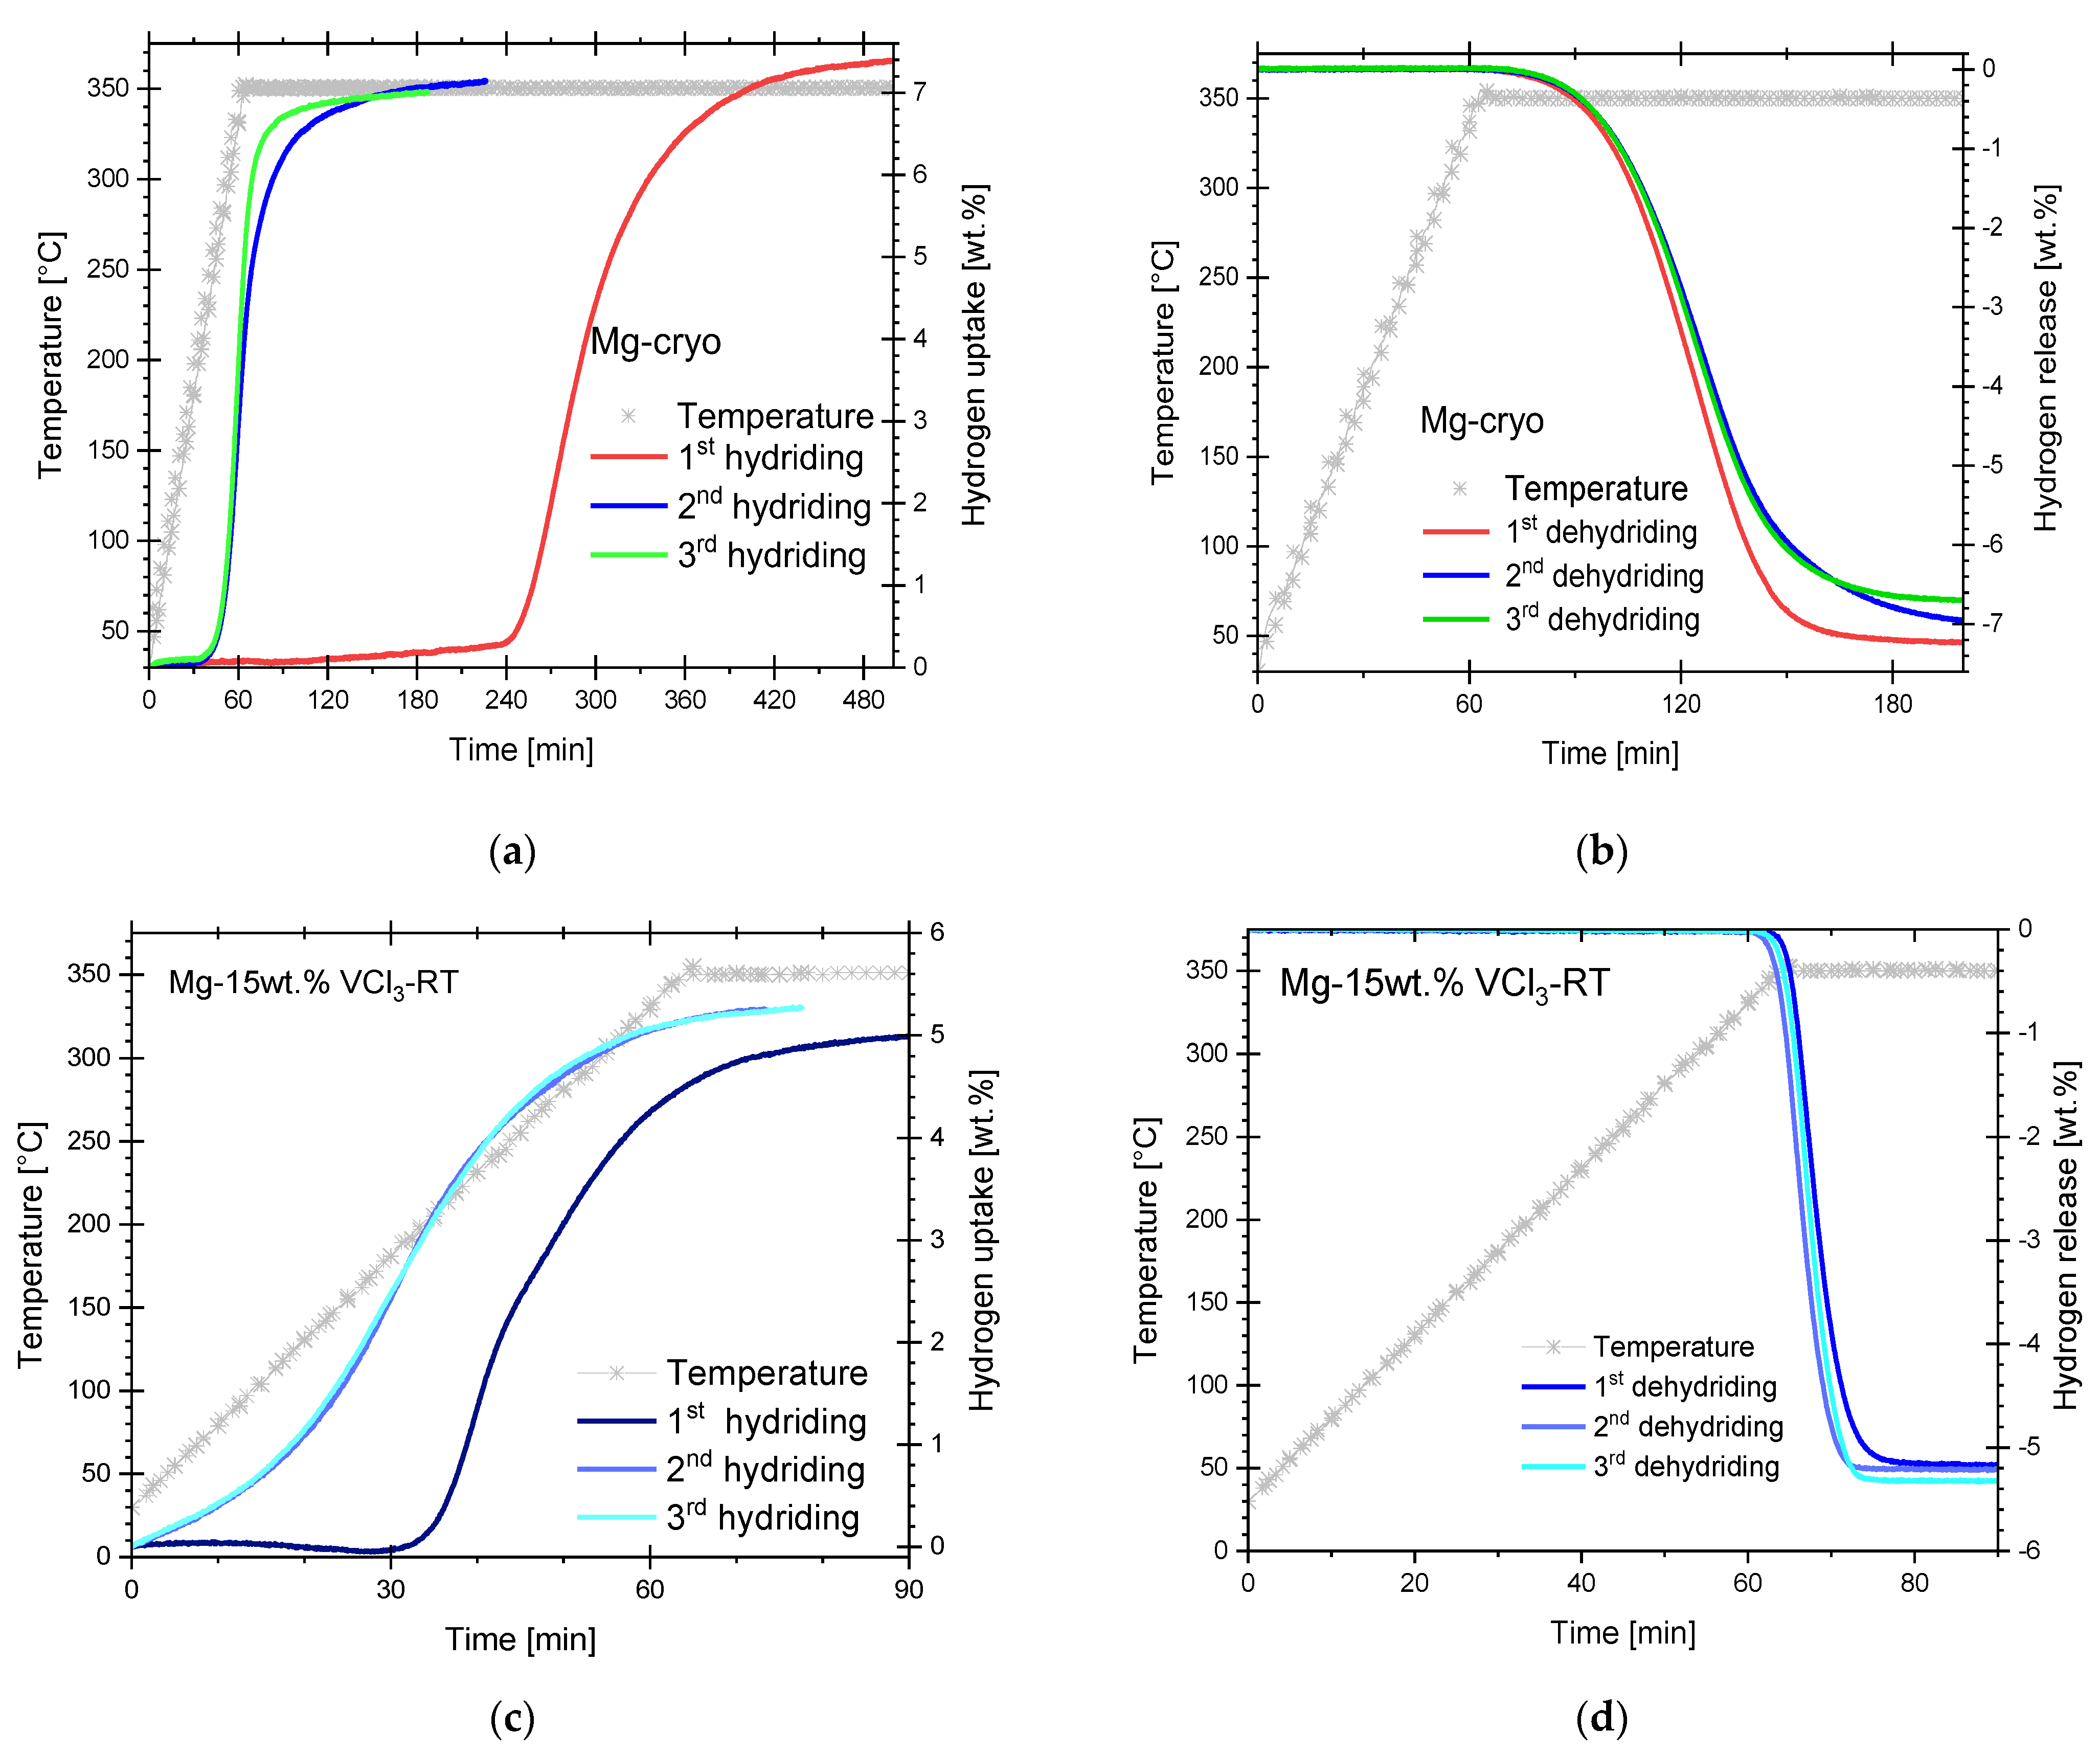
3.2. Hydriding and Dehydriding Reactions of Pure, Cryogenically Milled Mg and Mg-15wt.% VCl3-RT
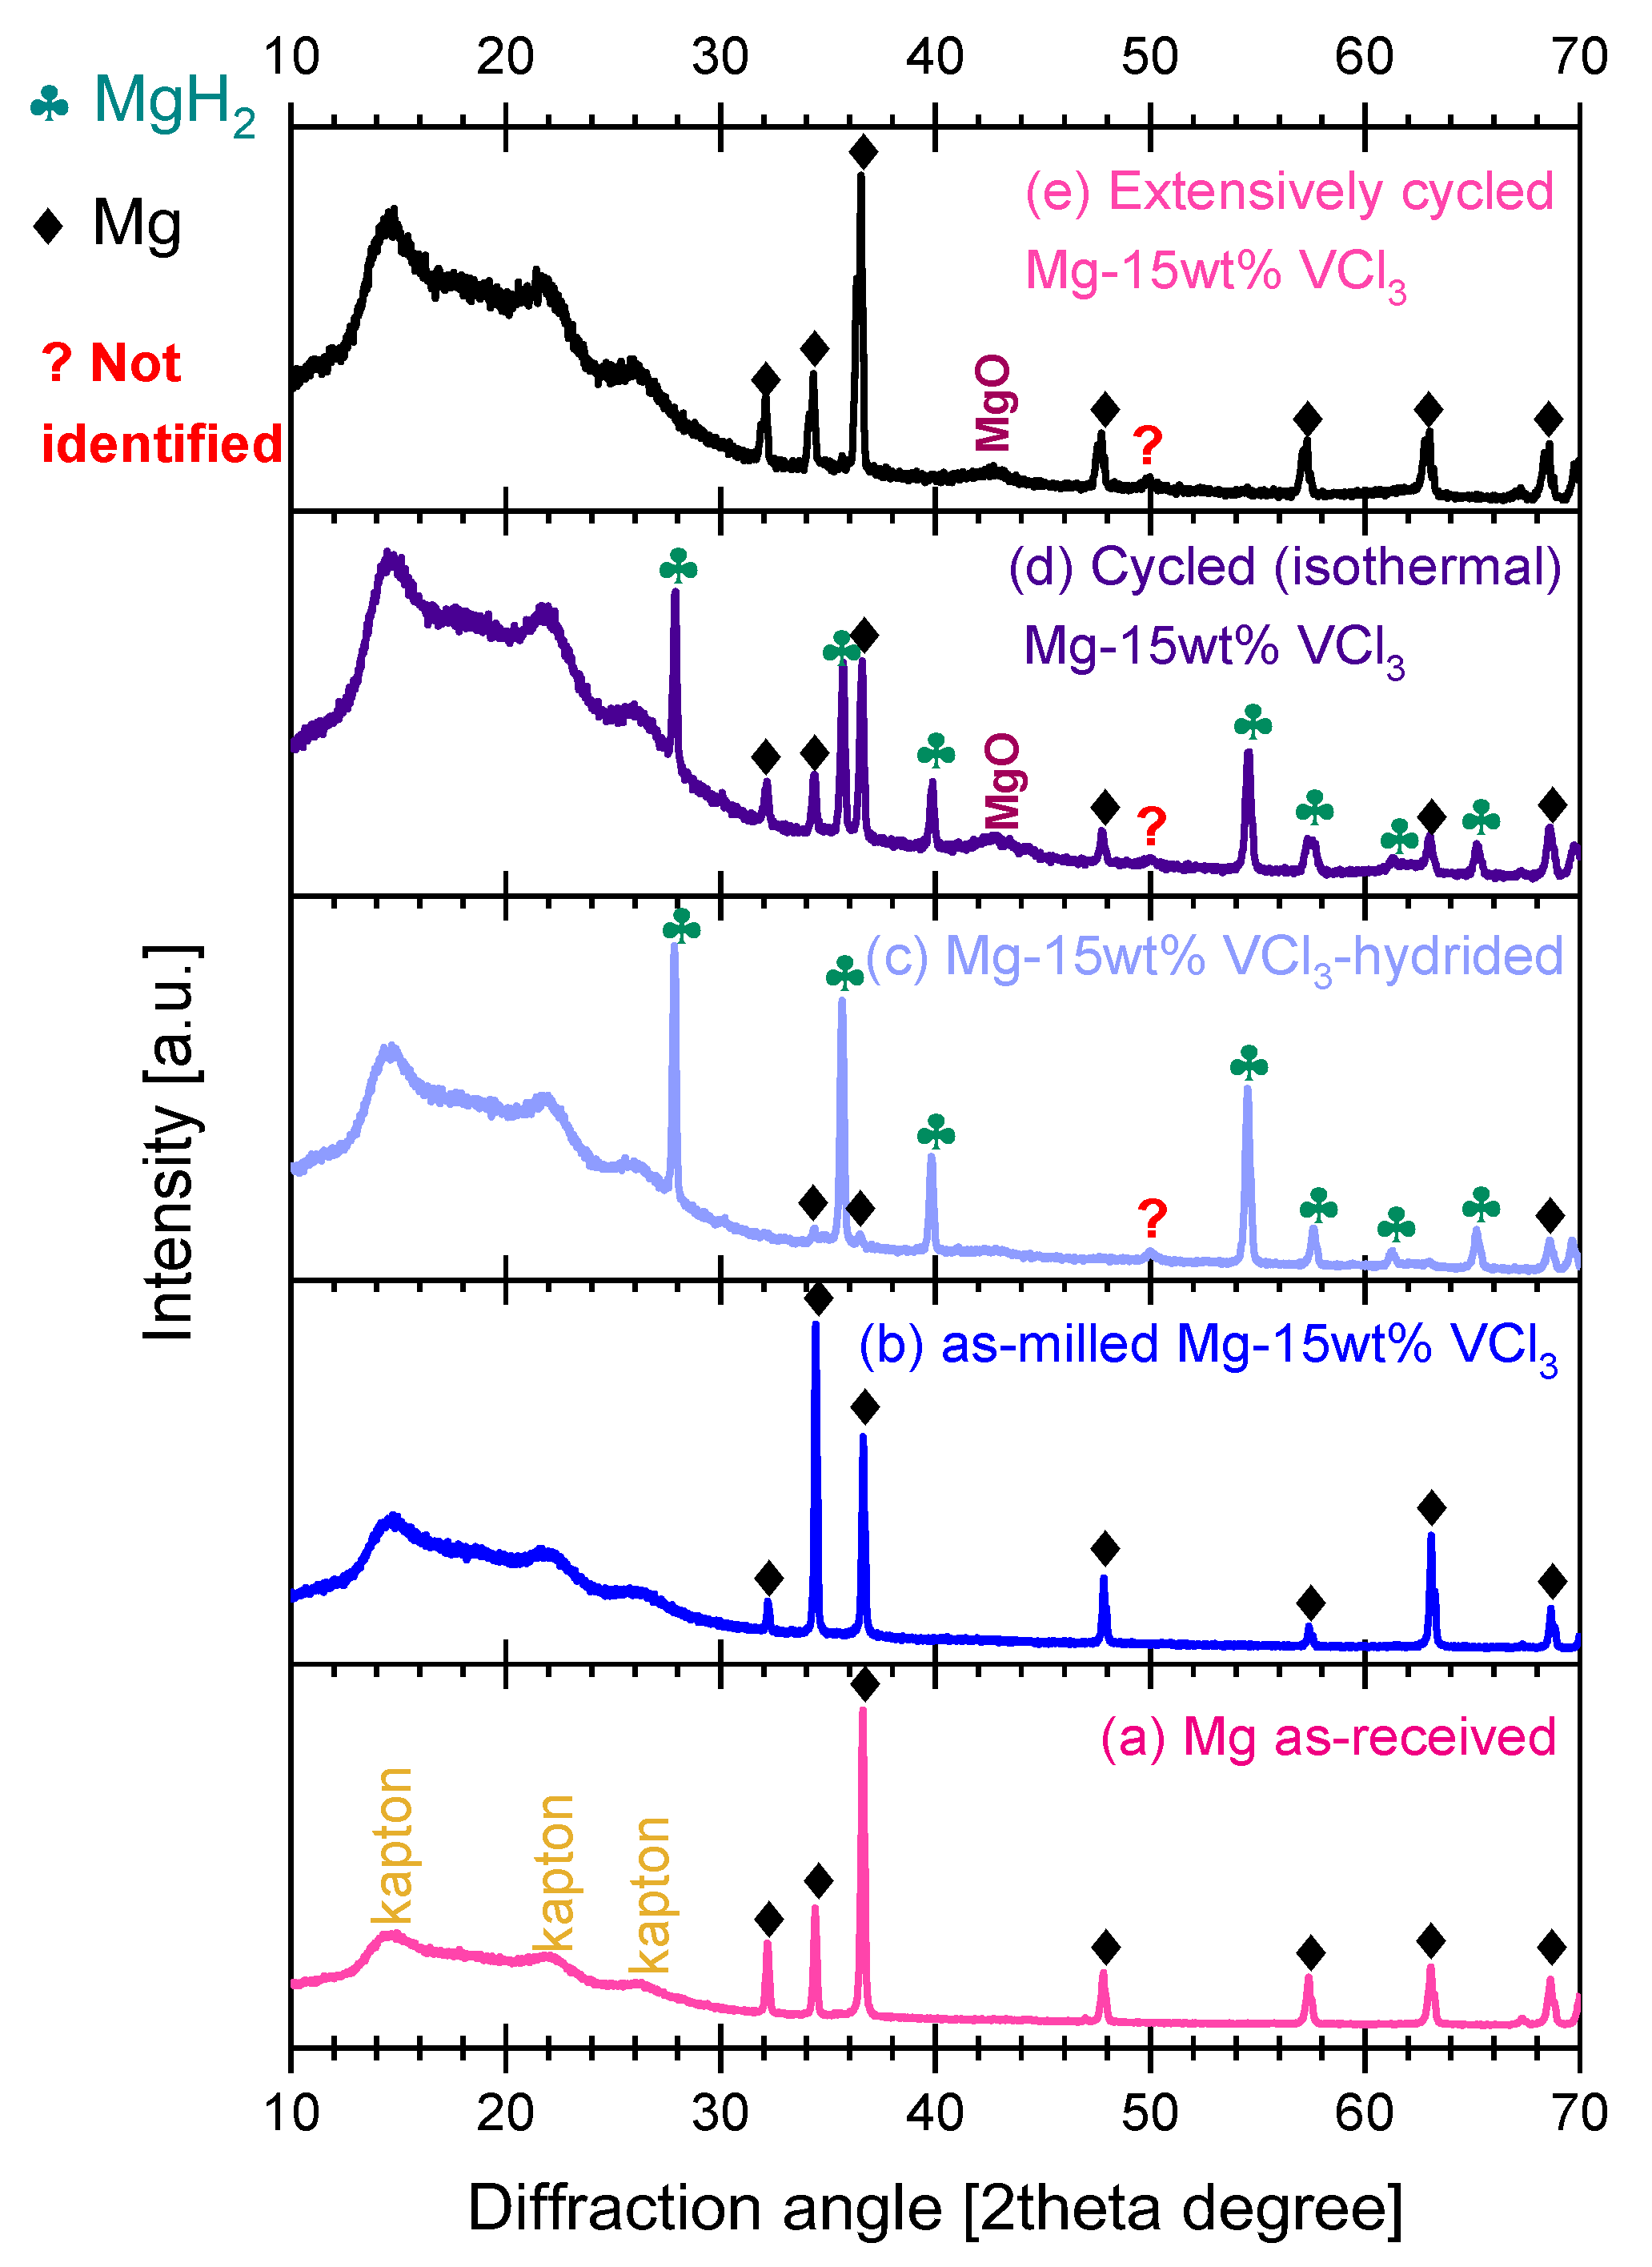
3.3. Characterization of As-Milled, Hydrided, and Dehydrided Materials
4. Discussion
4.1. Remarks on Cryogenic Milling and Amount of Added VCl3
4.2. Other Reported Mg/MgH2-VCl3 Mixtures
4.3. Hydriding Activation Energy
4.4. Dehydriding Activation Energy
4.5. Reason for Improved Hydriding Kinetics
5. Conclusions
Supplementary Materials
Author Contributions
Funding
Data Availability Statement
Acknowledgments
Conflicts of Interest
References
- Espegren, K.; Damman, S.; Pisciella, P.; Graabak, I.; Tomasgard, A. The Role of Hydrogen in the Transition from a Petroleum Economy to a Low-Carbon Society. Int. J. Hydrogen Energy 2021, 46, 23125–23138. [Google Scholar] [CrossRef]
- Hitam, C.N.C.; Aziz, M.A.A.; Ruhaimi, A.H.; Taib, M.R. Magnesium-Based Alloys for Solid-State Hydrogen Storage Applications: A Review. Int. J. Hydrogen Energy 2021, 46, 31067–31083. [Google Scholar] [CrossRef]
- Egeland-Eriksen, T.; Hajizadeh, A.; Sartori, S. Hydrogen-Based Systems for Integration of Renewable Energy in Power Systems: Achievements and Perspectives. Int. J. Hydrogen Energy 2021, 46, 31963–31983. [Google Scholar] [CrossRef]
- Felderhoff, M.; Bogdanović, B. High Temperature Metal Hydrides as Heat Storage Materials for Solar and Related Applications. Int. J. Mol. Sci. 2009, 10, 335–344. [Google Scholar] [CrossRef] [PubMed]
- Yartys, V.A.; Lototskyy, M.V.; Akiba, E.; Albert, R.; Antonov, V.E.; Ares, J.R.; Baricco, M.; Bourgeois, N.; Buckley, C.E.; Bellosta von Colbe, J.M.; et al. Magnesium Based Materials for Hydrogen Based Energy Storage: Past, Present and Future. Int. J. Hydrogen Energy 2019, 44, 7809–7859. [Google Scholar] [CrossRef]
- Yang, Y.; Xiong, X.; Chen, J.; Peng, X.; Chen, D.; Pan, F. Research Advances in Magnesium and Magnesium Alloys Worldwide in 2020. J. Magnes. Alloy. 2021, 9, 705–747. [Google Scholar] [CrossRef]
- Züttel, A. Materials for Hydrogen Storage. Mater. Today 2003, 6, 24–33. [Google Scholar] [CrossRef]
- Alapati, S.V.; Johnson, J.K.; Sholl, D.S. Predicting Reaction Equilibria for Destabilized Metal Hydride Decomposition Reactions for Reversible Hydrogen Storage. J. Phys. Chem. C 2007, 111, 1584–1591. [Google Scholar] [CrossRef]
- Zhang, J.; Yan, S.; Xia, G.; Zhou, X.; Lu, X.; Yu, L.; Yu, X.; Peng, P. Stabilization of Low-Valence Transition Metal towards Advanced Catalytic Effects on the Hydrogen Storage Performance of Magnesium Hydride. J. Magnes. Alloy. 2021, 9, 647–657. [Google Scholar] [CrossRef]
- Floriano, R.; Deledda, S.; Hauback, B.C.; Leiva, D.R.; Botta, W.J. Iron and Niobium Based Additives in Magnesium Hydride: Microstructure and Hydrogen Storage Properties. Int. J. Hydrogen Energy 2017, 42, 6810–6819. [Google Scholar] [CrossRef]
- Guo, F.; Zhang, T.; Shi, L.; Song, L. Hydrogen Absorption/Desorption Cycling Performance of Mg-Based Alloys with in-Situ Formed Mg2Ni and LaHx (x = 2, 3) Nanocrystallines. J. Magnes. Alloy. 2021. [Google Scholar] [CrossRef]
- Meena, P.; Singh, R.; Sharma, V.K.; Jain, I.P. Role of NiMn9.3Al4.0Co14.1Fe3.6 Alloy on Dehydrogenation Kinetics of MgH2. J. Magnes. Alloy. 2018, 6, 318–325. [Google Scholar] [CrossRef]
- El Khatabi, M.; Bhihi, M.; Naji, S.; Labrim, H.; Benyoussef, A.; El Kenz, A.; Loulidi, M. Study of Doping Effects with 3d and 4d-Transition Metals on the Hydrogen Storage Properties of MgH2. Int. J. Hydrogen Energy 2016, 41, 4712–4718. [Google Scholar] [CrossRef]
- Mao, J.; Guo, Z.; Yu, X.; Liu, H.; Wu, Z.; Ni, J. Enhanced Hydrogen Sorption Properties of Ni and Co-Catalyzed MgH2. Int. J. Hydrogen Energy 2010, 35, 4569–4575. [Google Scholar] [CrossRef]
- Wei, L.; Sun, H.; Song, F.; Cui, Z.; Zhu, Y.; Li, L. Effects of VF4 on the Hydriding Cycling at 373 K and Dehydriding of Mg99Ni Prepared by Hydriding Combustion Synthesis and Mechanical Milling (HCS+MM). J. Alloy. Compd. 2017, 698, 913–920. [Google Scholar] [CrossRef]
- Malka, I.E.; Pisarek, M.; Czujko, T.; Bystrzycki, J. A Study of the ZrF4, NbF5, TaF5, and TiCl3 Influences on the MgH2 Sorption Properties. Int. J. Hydrogen Energy 2011, 36, 12909–12917. [Google Scholar] [CrossRef]
- Wang, S.; Gao, M.; Yao, Z.; Xian, K.; Wu, M.; Liu, Y.; Sun, W.; Pan, H. High-loading, ultrafine Ni nanoparticles dispersed on porous hollow carbon nanospheres for fast (de)hydrogenation kinetics of MgH2. J. Magnes. Alloy. 2021, 10, 3354–3366. [Google Scholar] [CrossRef]
- Wang, P.; Tian, Z.; Wang, Z.; Xia, C.; Yang, T.; Ou, X. Improved Hydrogen Storage Properties of MgH2 Using Transition Metal Sulfides as Catalyst. Int. J. Hydrogen Energy 2021, 46, 27107–27118. [Google Scholar] [CrossRef]
- Li, Q.; Lu, Y.; Luo, Q.; Yang, X.; Yang, Y.; Tan, J.; Dong, Z.; Dang, J.; Li, J.; Chen, Y.; et al. Thermodynamics and Kinetics of Hydriding and Dehydriding Reactions in Mg-Based Hydrogen Storage Materials. J. Magnes. Alloy. 2021, 9, 1922–1941. [Google Scholar] [CrossRef]
- Shahi, R.R.; Yadav, T.P.; Shaz, M.A.; Srivastva, O.N. Studies on Dehydrogenation Characteristic of Mg(NH2)2/LiH Mixture Admixed with Vanadium and Vanadium Based Catalysts (V, V2O5 and VCl3). Int. J. Hydrogen Energy 2010, 35, 238–246. [Google Scholar] [CrossRef]
- Ren, C.; Fang, Z.Z.; Zhou, C.; Lu, J.; Ren, Y.; Zhang, X. Hydrogen Storage Properties of Magnesium Hydride with V-Based Additives. J. Phys. Chem. C 2014, 118, 21778–21784. [Google Scholar] [CrossRef]
- Oelerich, W.; Klassen, T.; Bormann, R. Comparison of the Catalytic Effects of V, V2O5, VN, and VC on the Hydrogen Sorption of Nanocrystalline Mg. J. Alloy. Compd. 2001, 322, L5–L9. [Google Scholar] [CrossRef]
- Pang, Y.; Wang, Y.; Yang, J.; Zheng, S. Engineering Dual-Functional VB2 Nanoparticles in MgH2 for Highly Efficient Hydrogen Storage. Compos. Commun. 2021, 26, 100781. [Google Scholar] [CrossRef]
- Malka, I.E.; Bystrzycki, J. The Effect of Storage Time on the Thermal Behavior of Nanocrystalline Magnesium Hydride with Metal Halide Additives. Int. J. Hydrogen Energy 2014, 39, 3352–3359. [Google Scholar] [CrossRef]
- Malka, I.E.; Czujko, T.; Bystrzycki, J. Catalytic Effect of Halide Additives Ball Milled with Magnesium Hydride. Int. J. Hydrogen Energy 2010, 35, 1706–1712. [Google Scholar] [CrossRef]
- Kumar, S.; Singh, P.K.; Rao, G.N.; Kojima, Y.; Kain, V. Synergic Effect of Vanadium Trichloride on the Reversible Hydrogen Storage Performance of the Mg-MgH2 System. Int. J. Hydrogen Energy 2018, 43, 15330–15337. [Google Scholar] [CrossRef]
- Kwak, Y.-J.; Song, M.-Y. Improvement in Hydriding and Dehydriding Features of Mg–TaF5–VCl3 Alloy by Adding Ni and x Wt.% MgH2 (x = 1, 5, and 10) Together with TaF5 and VCl3. Micromachines 2021, 12, 1194. [Google Scholar] [CrossRef]
- Song, M.Y.; Kwak, Y.J. Hydrogen Uptake and Release Characteristics of Mg-xTaF5-XVCl3 (X=1.25, 2.5, and 5). Korean J. Met. Mater. 2018, 56, 611–619. [Google Scholar] [CrossRef] [Green Version]
- Song, M.Y.; Lee, S.H.; Kwak, Y.J. Improvement in the Hydrogenation and Dehydrogenation Features of Mg by Milling in Hydrogen with Vanadium Chloride. Korean J. Met. Mater. 2021, 59, 709–717. [Google Scholar] [CrossRef]
- da Conceição, M.O.T.; Brum, M.C.; dos Santos, D.S. The Effect of V, VCl3 and VC Catalysts on the MgH2 Hydrogen Sorption Properties. J. Alloy. Compd. 2014, 586, S101–S104. [Google Scholar] [CrossRef]
- Korablov, D.; Nielsen, T.K.; Besenbacher, F.; Jensen, T.R. Mechanism and Kinetics of Early Transition Metal Hydrides, Oxides, and Chlorides to Enhance Hydrogen Release and Uptake Properties of MgH2. Powder Diffr. 2015, 5, 9–15. [Google Scholar] [CrossRef] [Green Version]
- Glage, A.; Ceccato, R.; Lonardelli, I.; Girardi, F.; Agresti, F.; Principi, G.; Molinari, A.; Gialanella, S. A Powder Metallurgy Approach for the Production of a MgH2–Al Composite Material. J. Alloy. Compd. 2009, 478, 273–280. [Google Scholar] [CrossRef]
- Wan, Q.; Li, P.; Wang, T.; Qu, X.H. NbF5 and CrF3 Catalysts Effects on Synthesis and Hydrogen Storage Performance of Mg-Ni-NiO Composites. Adv. Mater. Res. 2013, 681, 31–37. [Google Scholar] [CrossRef]
- Huot, J.; Cuevas, F.; Deledda, S.; Edalati, K.; Filinchuk, Y.; Grosdidier, T.; Hauback, B.C.; Heere, M.; Jensen, T.R.; Latroche, M.; et al. Mechanochemistry of Metal Hydrides: Recent Advances. Materials 2019, 12, 2778. [Google Scholar] [CrossRef] [Green Version]
- Riktor, M.D.; Deledda, S.; Herrich, M.; Gutfleisch, O.; Fjellvåg, H.; Hauback, B.C. Hydride Formation in Ball-Milled and Cryomilled Mg–Fe Powder Mixtures. Mater. Sci. Eng. B 2009, 158, 19–25. [Google Scholar] [CrossRef]
- Tian, M.; Shang, C. Nano-Structured MgH2 Catalyzed by TiC Nanoparticles for Hydrogen Storage. J. Chem. Technol. Biotechnol. 2011, 86, 69–74. [Google Scholar] [CrossRef]
- Deledda, S.; Hauback, B.C.; Fjellvåg, H. H-Sorption Behaviour of Mechanically Activated Mg–Zn Powders. J. Alloy. Compd. 2007, 446–447, 173–177. [Google Scholar] [CrossRef]
- Borissova, A.V.; Deledda, S.; Hauback, B.C. Synthesis and Hydrogen Sorption Properties of Mg–Ti–Ni Composite, Produced by Mechanical Milling at Liquid Nitrogen Temperature. J. Alloy. Compd. 2009, 481, L24–L26. [Google Scholar] [CrossRef]
- Cryomill of Retsch. Available online: https://www.retsch.com/products/milling/ball-mills/mixer-mill-cryomill/ (accessed on 7 March 2023).
- Carrillo-bucio, J.L.; Tena-garcia, J.R.; Armenta-garcia, E.P.; Hernandez-silva, O.; Cabañas-moreno, J.G.; Suárez-alcántara, K. HardwareX Low-Cost Sieverts-Type Apparatus for the Study of Hydriding/Dehydriding Reactions. Hardw. 2018, 4, e00036. [Google Scholar] [CrossRef]
- Shao, H.; Wang, Y.; Xu, H.; Li, X. Hydrogen Storage Properties of Magnesium Ultrafine Particles Prepared by Hydrogen Plasma-Metal Reaction. Mater. Sci. Eng. B Solid-State Mater. Adv. Technol. 2004, 110, 221–226. [Google Scholar] [CrossRef]
- Barkhordarian, G.; Klassen, T.; Bormann, R. Kinetic Investigation of the Effect of Milling Time on the Hydrogen Sorption Reaction of Magnesium Catalyzed with Different Nb2O5 Contents. J. Alloy. Compd. 2006, 407, 249–255. [Google Scholar] [CrossRef]
- Lototskyy, M.; Denys, R.; Nyallang Nyamsi, S.; Bessarabskaia, I.; Yartys, V. Modelling of Hydrogen Thermal Desorption Spectra. Mater. Today Proc. 2018, 5, 10440–10449. [Google Scholar] [CrossRef]
- Luo, Q.; Li, J.; Li, B.; Liu, B.; Shao, H.; Li, Q. Kinetics in Mg-Based Hydrogen Storage Materials: Enhancement and Mechanism. J. Magnes. Alloy. 2019, 7, 58–71. [Google Scholar] [CrossRef]
- Liang, G.; Huot, J.; Boily, S.; Van Neste, A.; Schulz, R. Hydrogen Storage Properties of the Mechanically Milled MgH2-V Nanocomposite. J. Alloy. Compd. 1999, 291, 295–299. [Google Scholar] [CrossRef]
- Lu, J.; Choi, Y.J.; Fang, Z.Z.; Sohn, H.Y.; Rönnebro, E. Hydrogen Storage Properties of Nanosized MgH2 −0.1TiH2 Prepared by Ultrahigh-Energy−High-Pressure Milling. J. Am. Chem. Soc. 2009, 131, 15843–15852. [Google Scholar] [CrossRef]
- Available online: https://webbook.nist.gov/chemistry (accessed on 14 January 2023).
- Vyazovkin, S. Kissinger Method in Kinetics of Materials: Things to Beware and Be Aware Of. Molecules 2020, 25, 2813. [Google Scholar] [CrossRef]
- Schulz, H. From the Kissinger Equation to Model-Free Kinetics: Reaction Kinetics of Thermally Initiated Solid-State Reactions. ChemTexts 2018, 4, 9. [Google Scholar] [CrossRef]
- Hwang, S.; Nishimura, C.; McCormick, P.G. Mechanical Milling of Magnesium Powder. Mater. Sci. Eng. A 2001, 318, 22–33. [Google Scholar] [CrossRef]
- Çakmak, G.; Öztürk, T. Milling of Magnesium Powders without Additives. Powder Technol. 2013, 237, 484–488. [Google Scholar] [CrossRef]
- Song, M.Y.; Kwak, Y.J.; Lee, S.H.; Park, H.R. Comparison of Hydrogen Storage Properties of Pure Mg and Milled Pure Mg. Bull. Mater. Sci. 2014, 37, 831–835. [Google Scholar] [CrossRef] [Green Version]
- Doppiu, S.; Schultz, L.; Gutfleisch, O. In Situ Pressure and Temperature Monitoring during the Conversion of Mg into MgH2 by High-Pressure Reactive Ball Milling. J. Alloy. Compd. 2007, 427, 204–208. [Google Scholar] [CrossRef]
- Yermakov, A.; Mushnikov, N.; Uimin, M.; Gaviko, V.; Tankeev, A.; Skripov, A.; Soloninin, A.; Buzlukov, A.; Yermakov, A.; Mushnikov, N.; et al. Hydrogen reaction kinetics of Mg-based alloys synthesized by mechanical milling. J. Alloy. Compd. 2006, 425, 367–372. [Google Scholar] [CrossRef]
- Rios, J.; Restrepo, A.; Zuleta, A.; Bolívar, F.; Castaño, J.; Correa, E.; Echeverria, F. Effect of Ball Size on the Microstructure and Morphology of Mg Powders Processed by High-Energy Ball Milling. Metals 2021, 11, 1621. [Google Scholar] [CrossRef]
- Ma, L.P.; Kang, X.D.; Dai, H.B.; Liang, Y.; Fang, Z.Z.; Wang, P.J.; Wang, P.; Cheng, H.M. Superior Catalytic Effect of TiF3 over TiCl3 in Improving the Hydrogen Sorption Kinetics of MgH2: Catalytic Role of Fluorine Anion. Acta Mater. 2009, 57, 2250–2258. [Google Scholar] [CrossRef]
- Ma, L.-P.; Wang, P.; Cheng, H.-M. Hydrogen Sorption Kinetics of MgH2 Catalyzed with Titanium Compounds. Int. J. Hydrogen Energy 2010, 35, 3046–3050. [Google Scholar] [CrossRef]
- da Conceição, M.O.T.; dos Santos, D.S. Catalytic Effect of Chlorides Compounds on Hydrogen Sorption Properties of Magnesium Hydride. J. Alloy. Compd. 2014, 615, S715–S718. [Google Scholar] [CrossRef]
- Aguey-Zinsou, K.-F.; Ares-Fernández, J.-R. Hydrogen in Magnesium: New Perspectives toward Functional Stores. Energy Environ. Sci. 2010, 3, 526. [Google Scholar] [CrossRef]
- Fernández, J.F.; Sánchez, C.R. Rate Determining Step in the Absorption and Desorption of Hydrogen by Magnesium. J. Alloy. Compd. 2002, 340, 189–198. [Google Scholar] [CrossRef]
- Shang, Y.; Pistidda, C.; Gizer, G.; Klassen, T.; Dornheim, M. Mg-Based Materials for Hydrogen Storage. J. Magnes. Alloy. 2021, 9, 1837–1860. [Google Scholar] [CrossRef]
- Fichtner, M. Nanoconfinement Effects in Energy Storage Materials. Phys. Chem. Chem. Phys. 2011, 13, 21186–21195. [Google Scholar] [CrossRef]
- Huot, J.; Liang, G.; Boily, S.; Van Neste, A.; Schulz, R. Structural Study and Hydrogen Sorption Kinetics of Ball-Milled Magnesium Hydride. J. Alloy. Compd. 1999, 293, 495–500. [Google Scholar] [CrossRef]
- Porcu, M.; Petford-Long, A.K.; Sykes, J.M. TEM Studies of Nb2O5 Catalyst in Ball-Milled MgH2 for Hydrogen Storage. J. Alloy. Compd. 2008, 453, 341–346. [Google Scholar] [CrossRef]
- Kumar, S.; Jain, A.; Ichikawa, T.; Kojima, Y.; Dey, G.K. Development of Vanadium Based Hydrogen Storage Material: A Review. Renew. Sustain. Energy Rev. 2017, 72, 791–800. [Google Scholar] [CrossRef]
- Reilly, J.J.; Wiswall, R.H. Higher Hydrides of Vanadium and Niobium. Inorg. Chem. 1970, 9, 1678–1682. [Google Scholar] [CrossRef]
- Yukawa, H.; Takagi, M.; Teshima, A.; Morinaga, M. Alloying Effects on the Stability of Vanadium Hydrides. J. Alloy. Compd. 2002, 330–332, 105–109. [Google Scholar] [CrossRef]


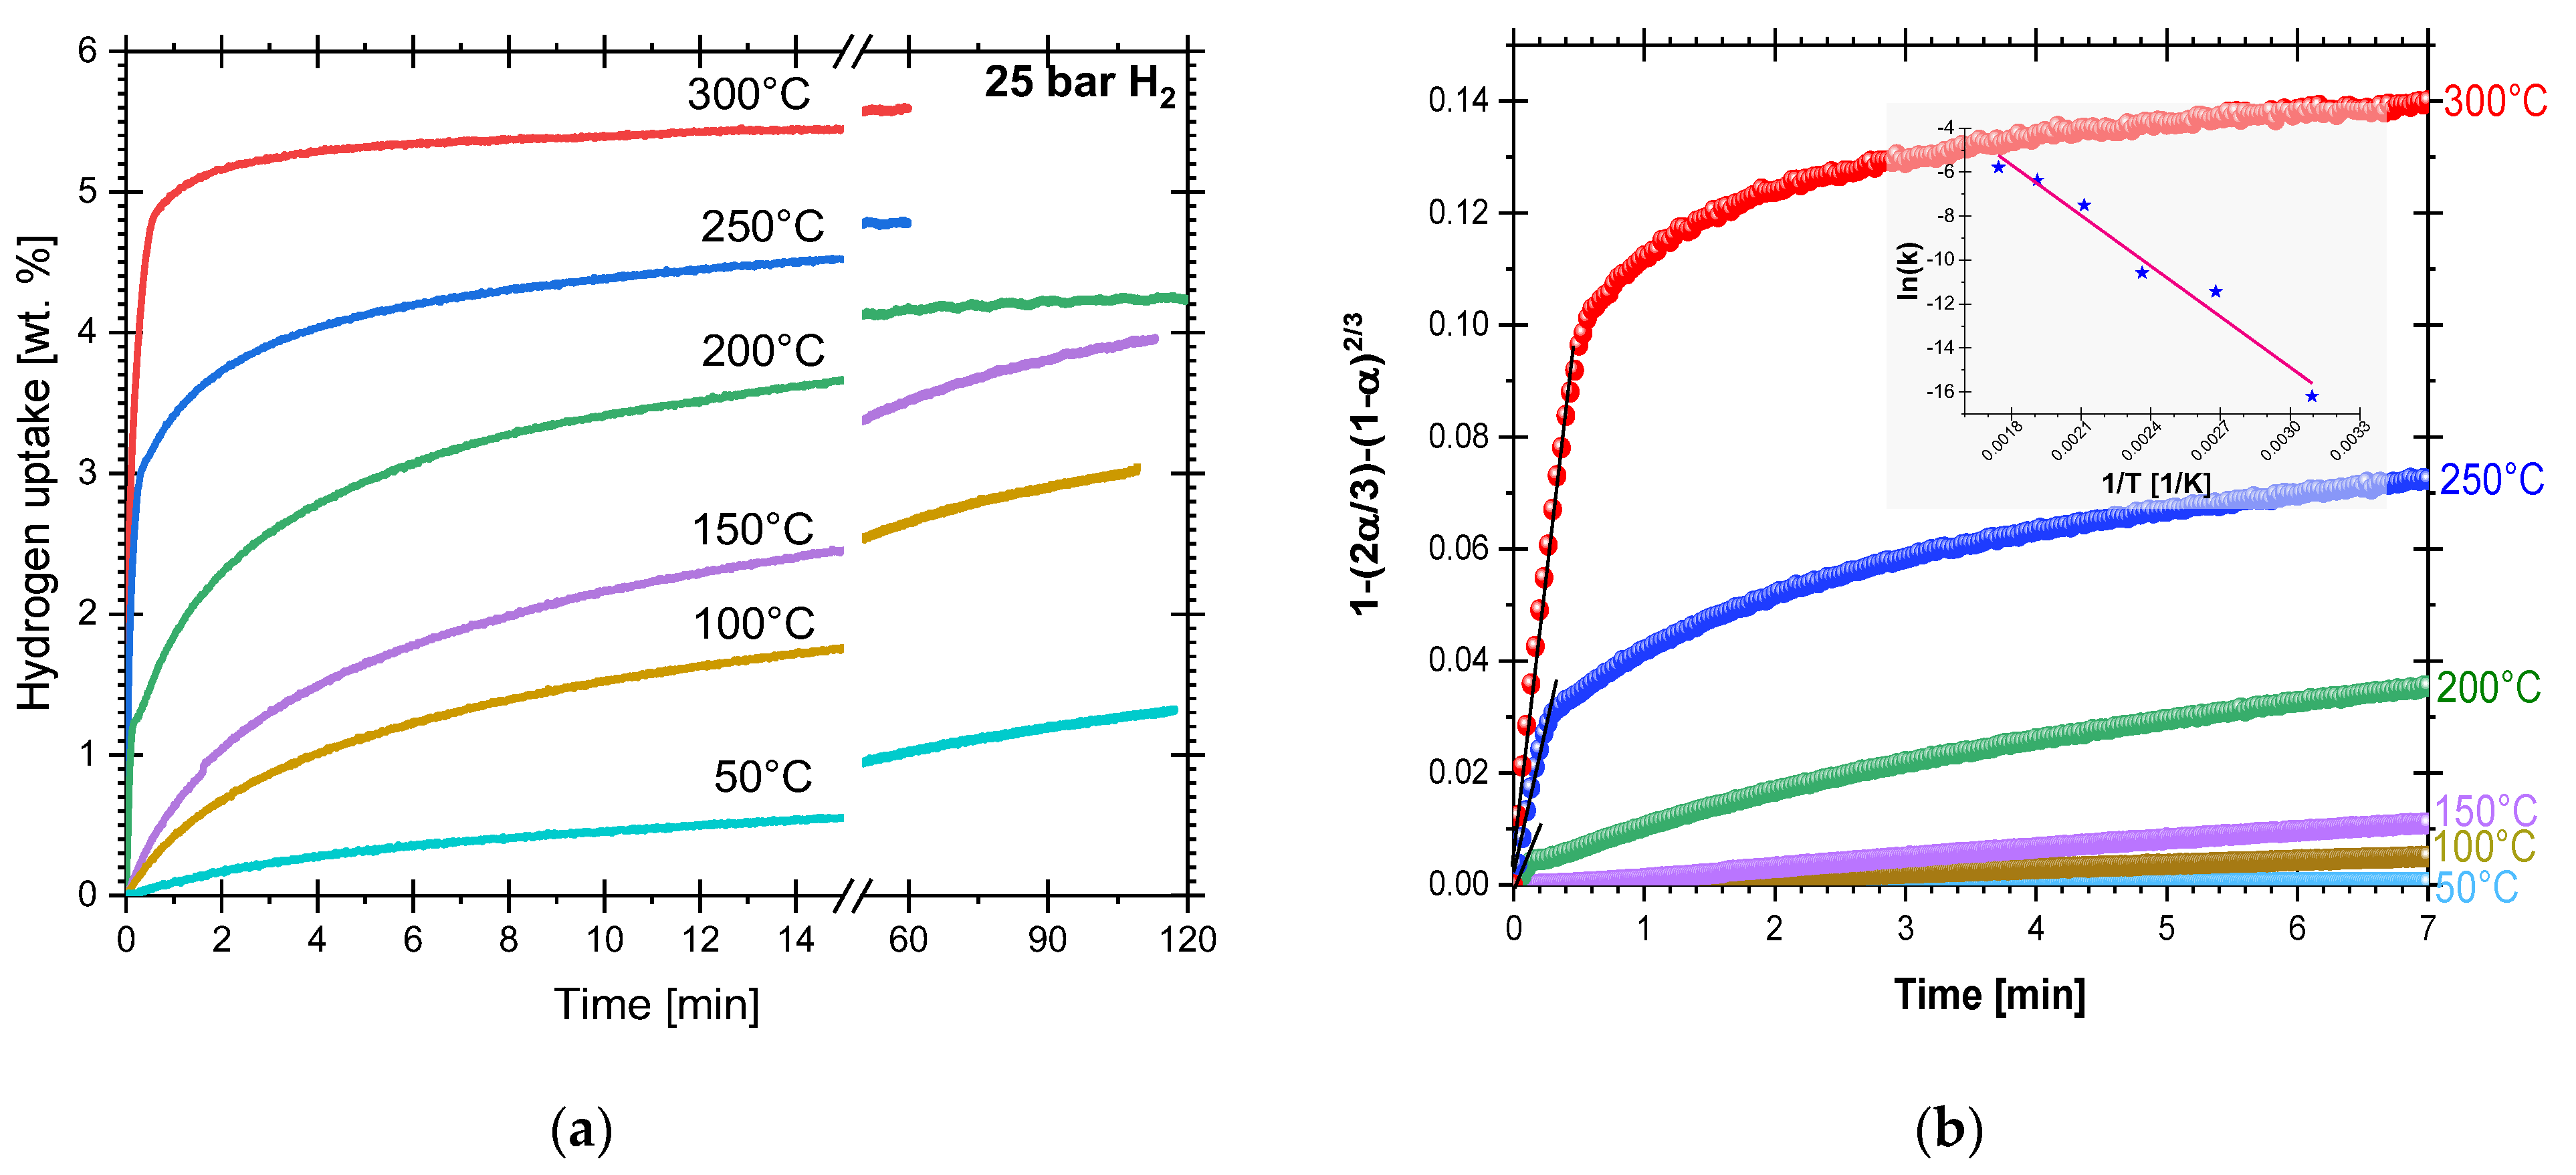
| Temperature [°C] | Time Interval [min] | k [s−1] |
|---|---|---|
| 50 | 0–60 | 3.05 × 10⁻⁵ |
| 100 | 0–19 | 6.06 × 10⁻⁵ |
| 150 | 0–12 | 7.58 × 10⁻⁵ |
| 200 | 0–0.1 | 1.51 × 10⁻³ |
| 250 | 0–0.3 | 3.73 × 10⁻³ |
| 300 | 0–0.5 | 4.60 × 10⁻³ |
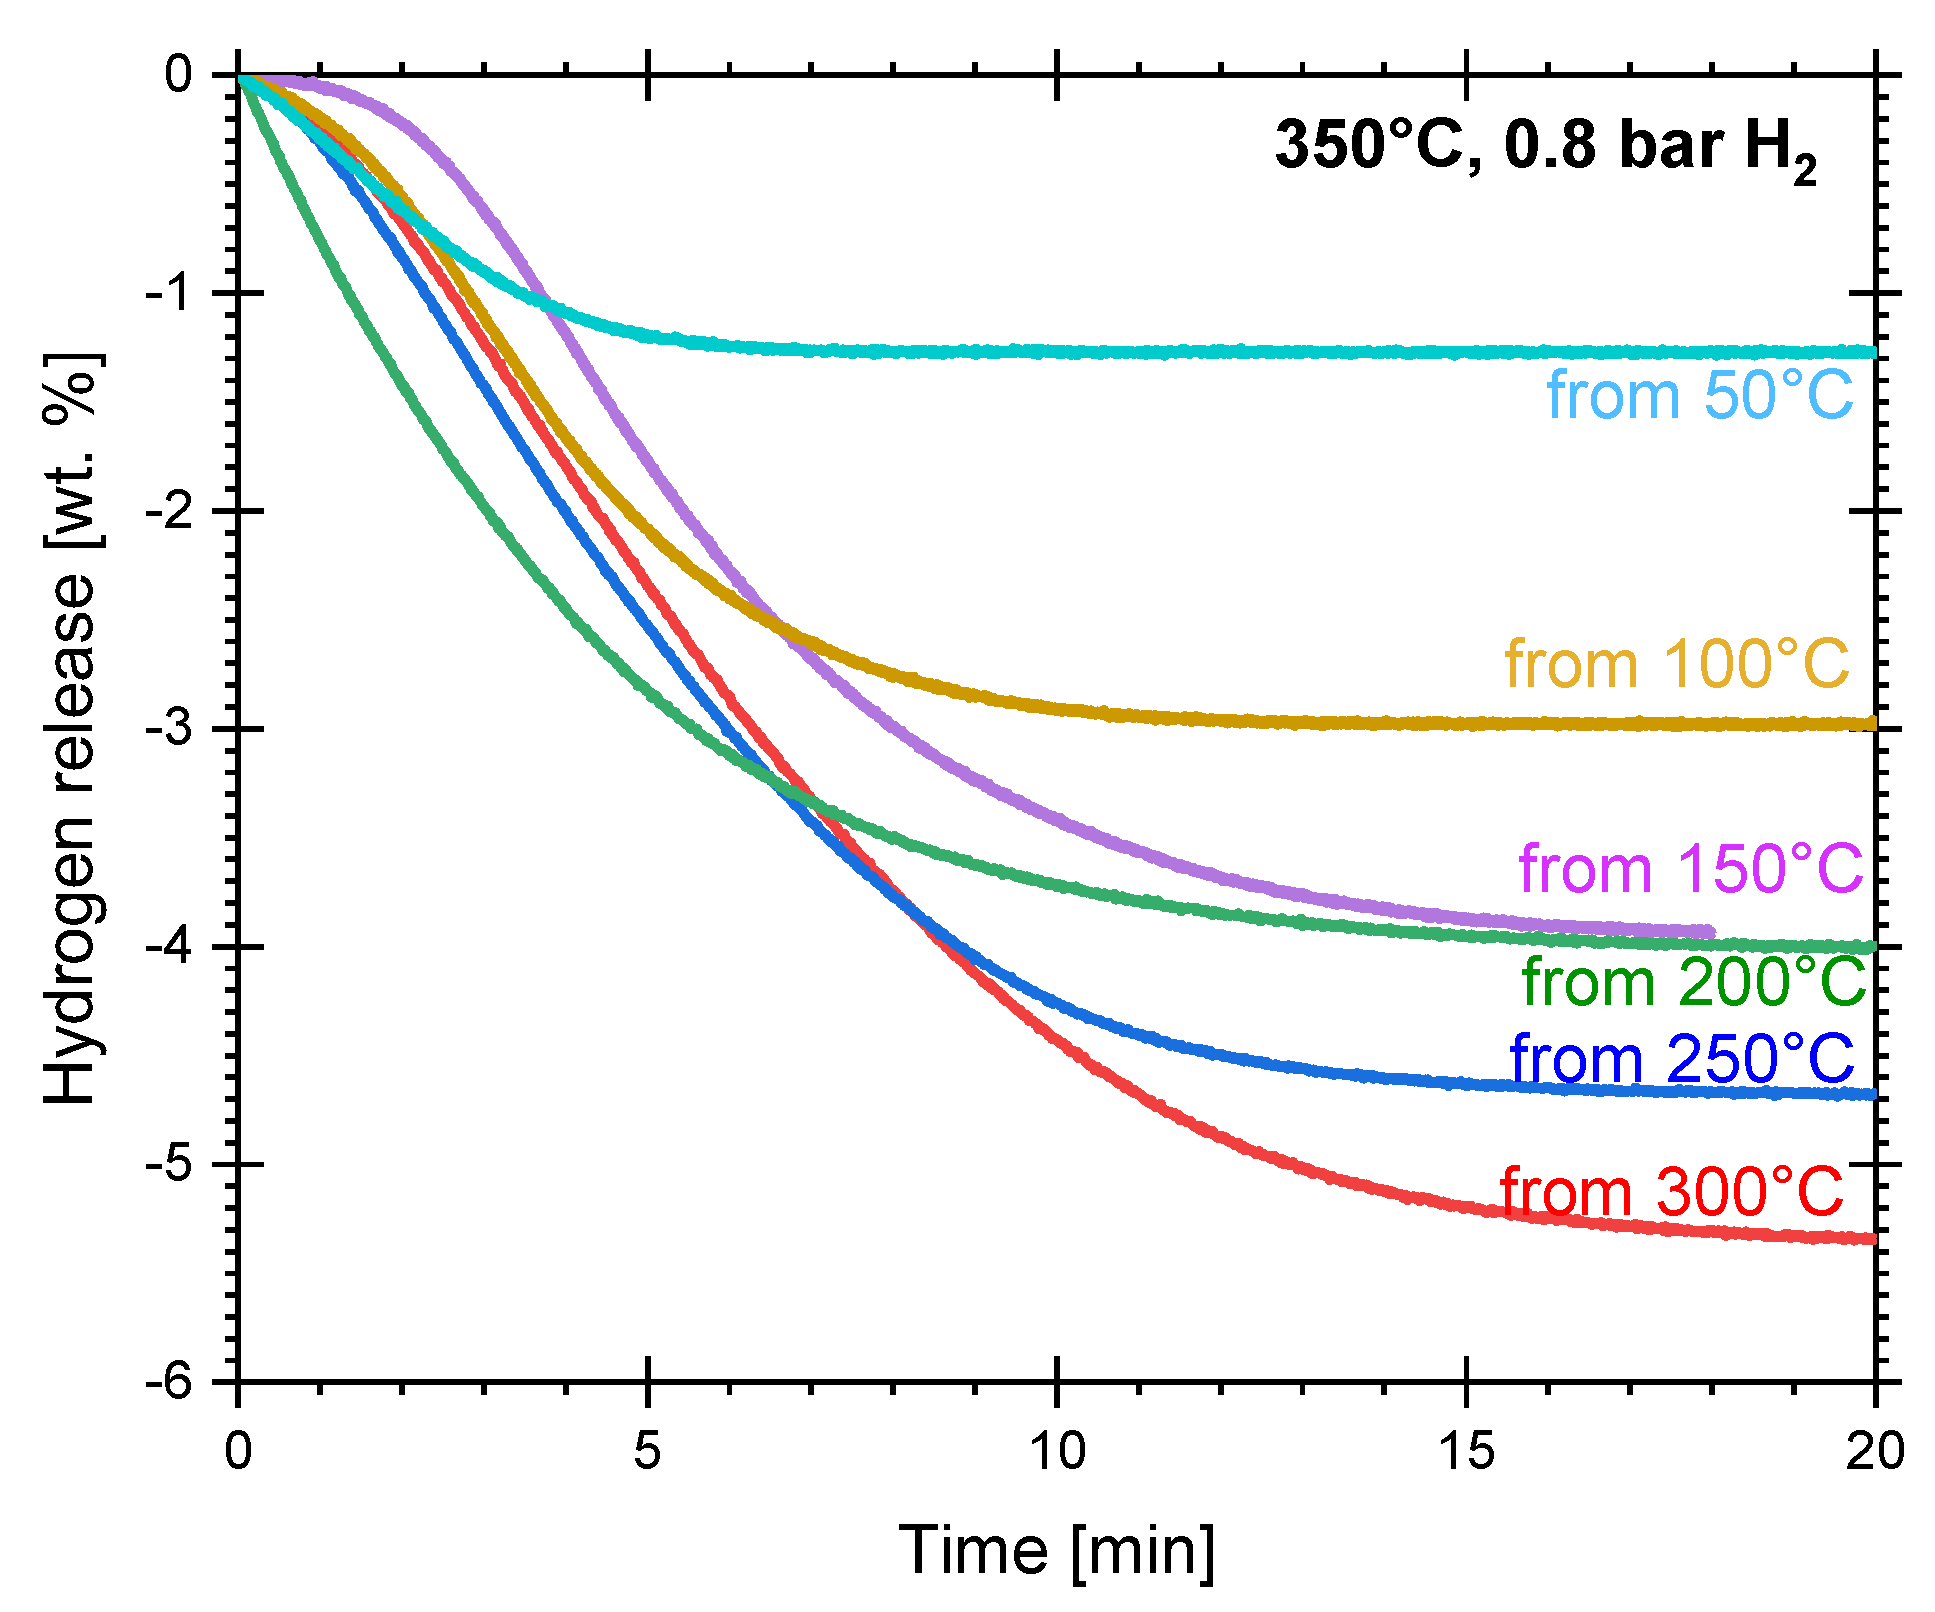
| Previous Hydriding Temperature [°C] | k [s−1] of Dehydriding at 350 °C, 0.8 Bar |
|---|---|
| 50 | 4.98 × 10⁻³ |
| 100 | 3.14 × 10⁻³ |
| 150 | 2.50 × 10⁻³ |
| 200 | 2.24 × 10⁻³ |
| 250 | 2.38 × 10⁻³ |
| 300 | 2.05 × 10⁻³ |
| Material, Theoretical Hydrogen Content [wt.%], and Highlights of Preparation | Ref. | Hydrogen Uptake [wt.%] | Hydrogen Release [wt.%] | Peak Dehydriding Temperature [°C] and Conditions |
|---|---|---|---|---|
| Mg-5 wt.% VCl3 7.22 milled in hydrogen | [29] | 3.37 wt.% at 2.5 min 6.36 wt.% at 60 min 320 °C, 12 bar, isothermic. | 0.12 wt.% at 2.5 min 4.54 wt.% at 60 min 320 °C, 1 bar, isothermic. | Not reported |
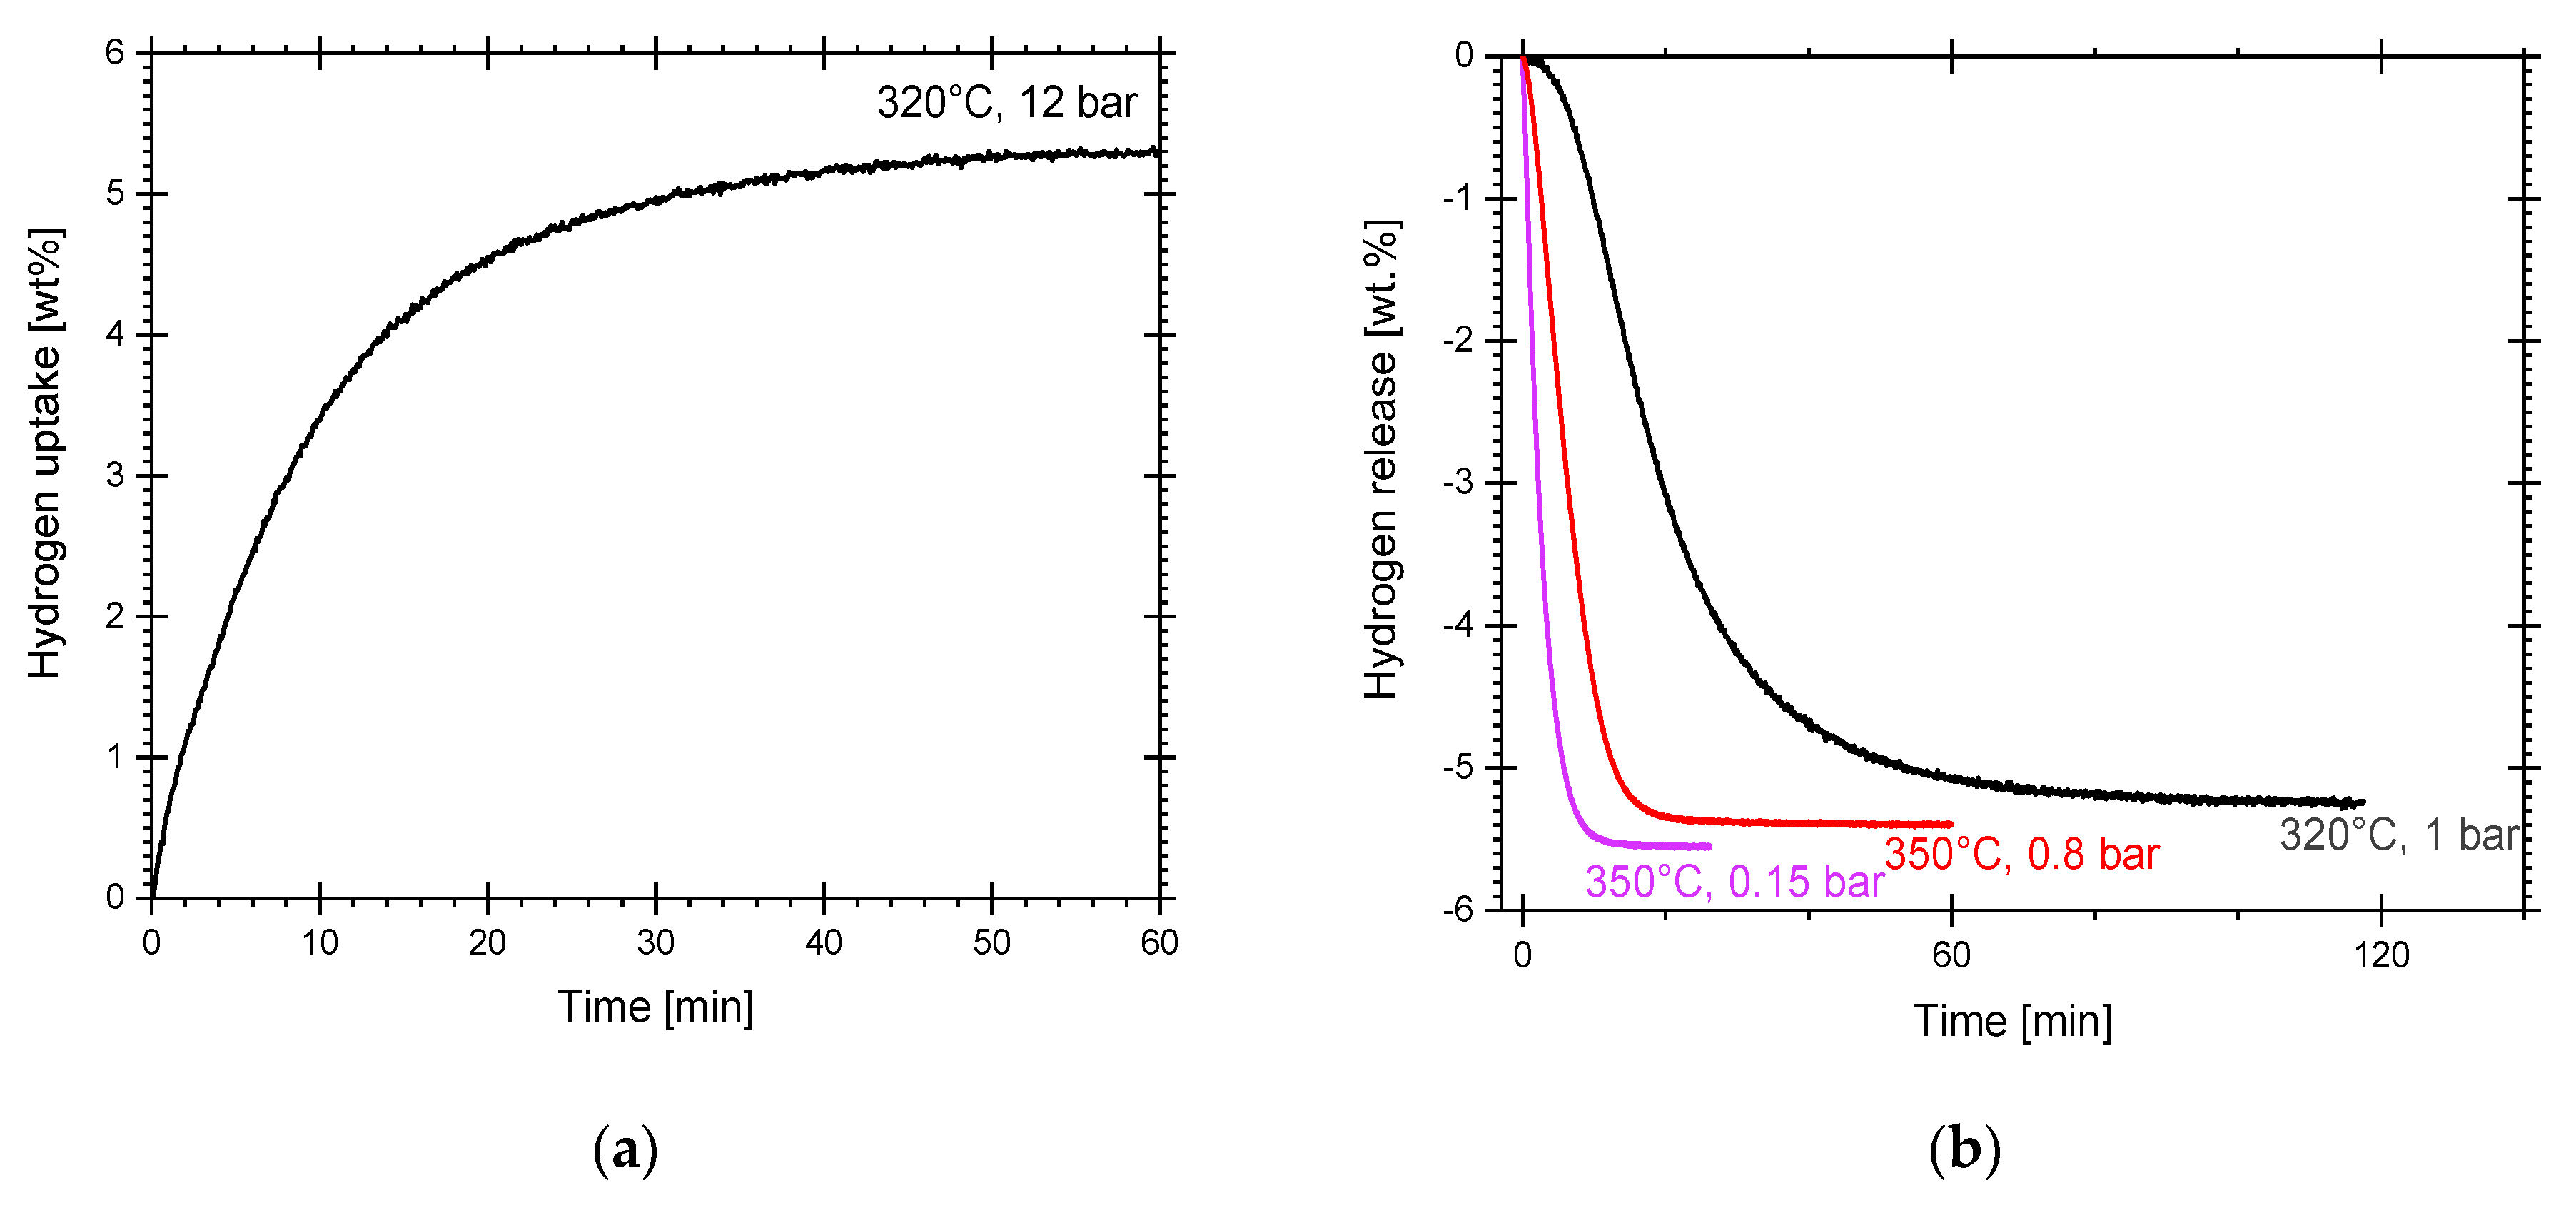
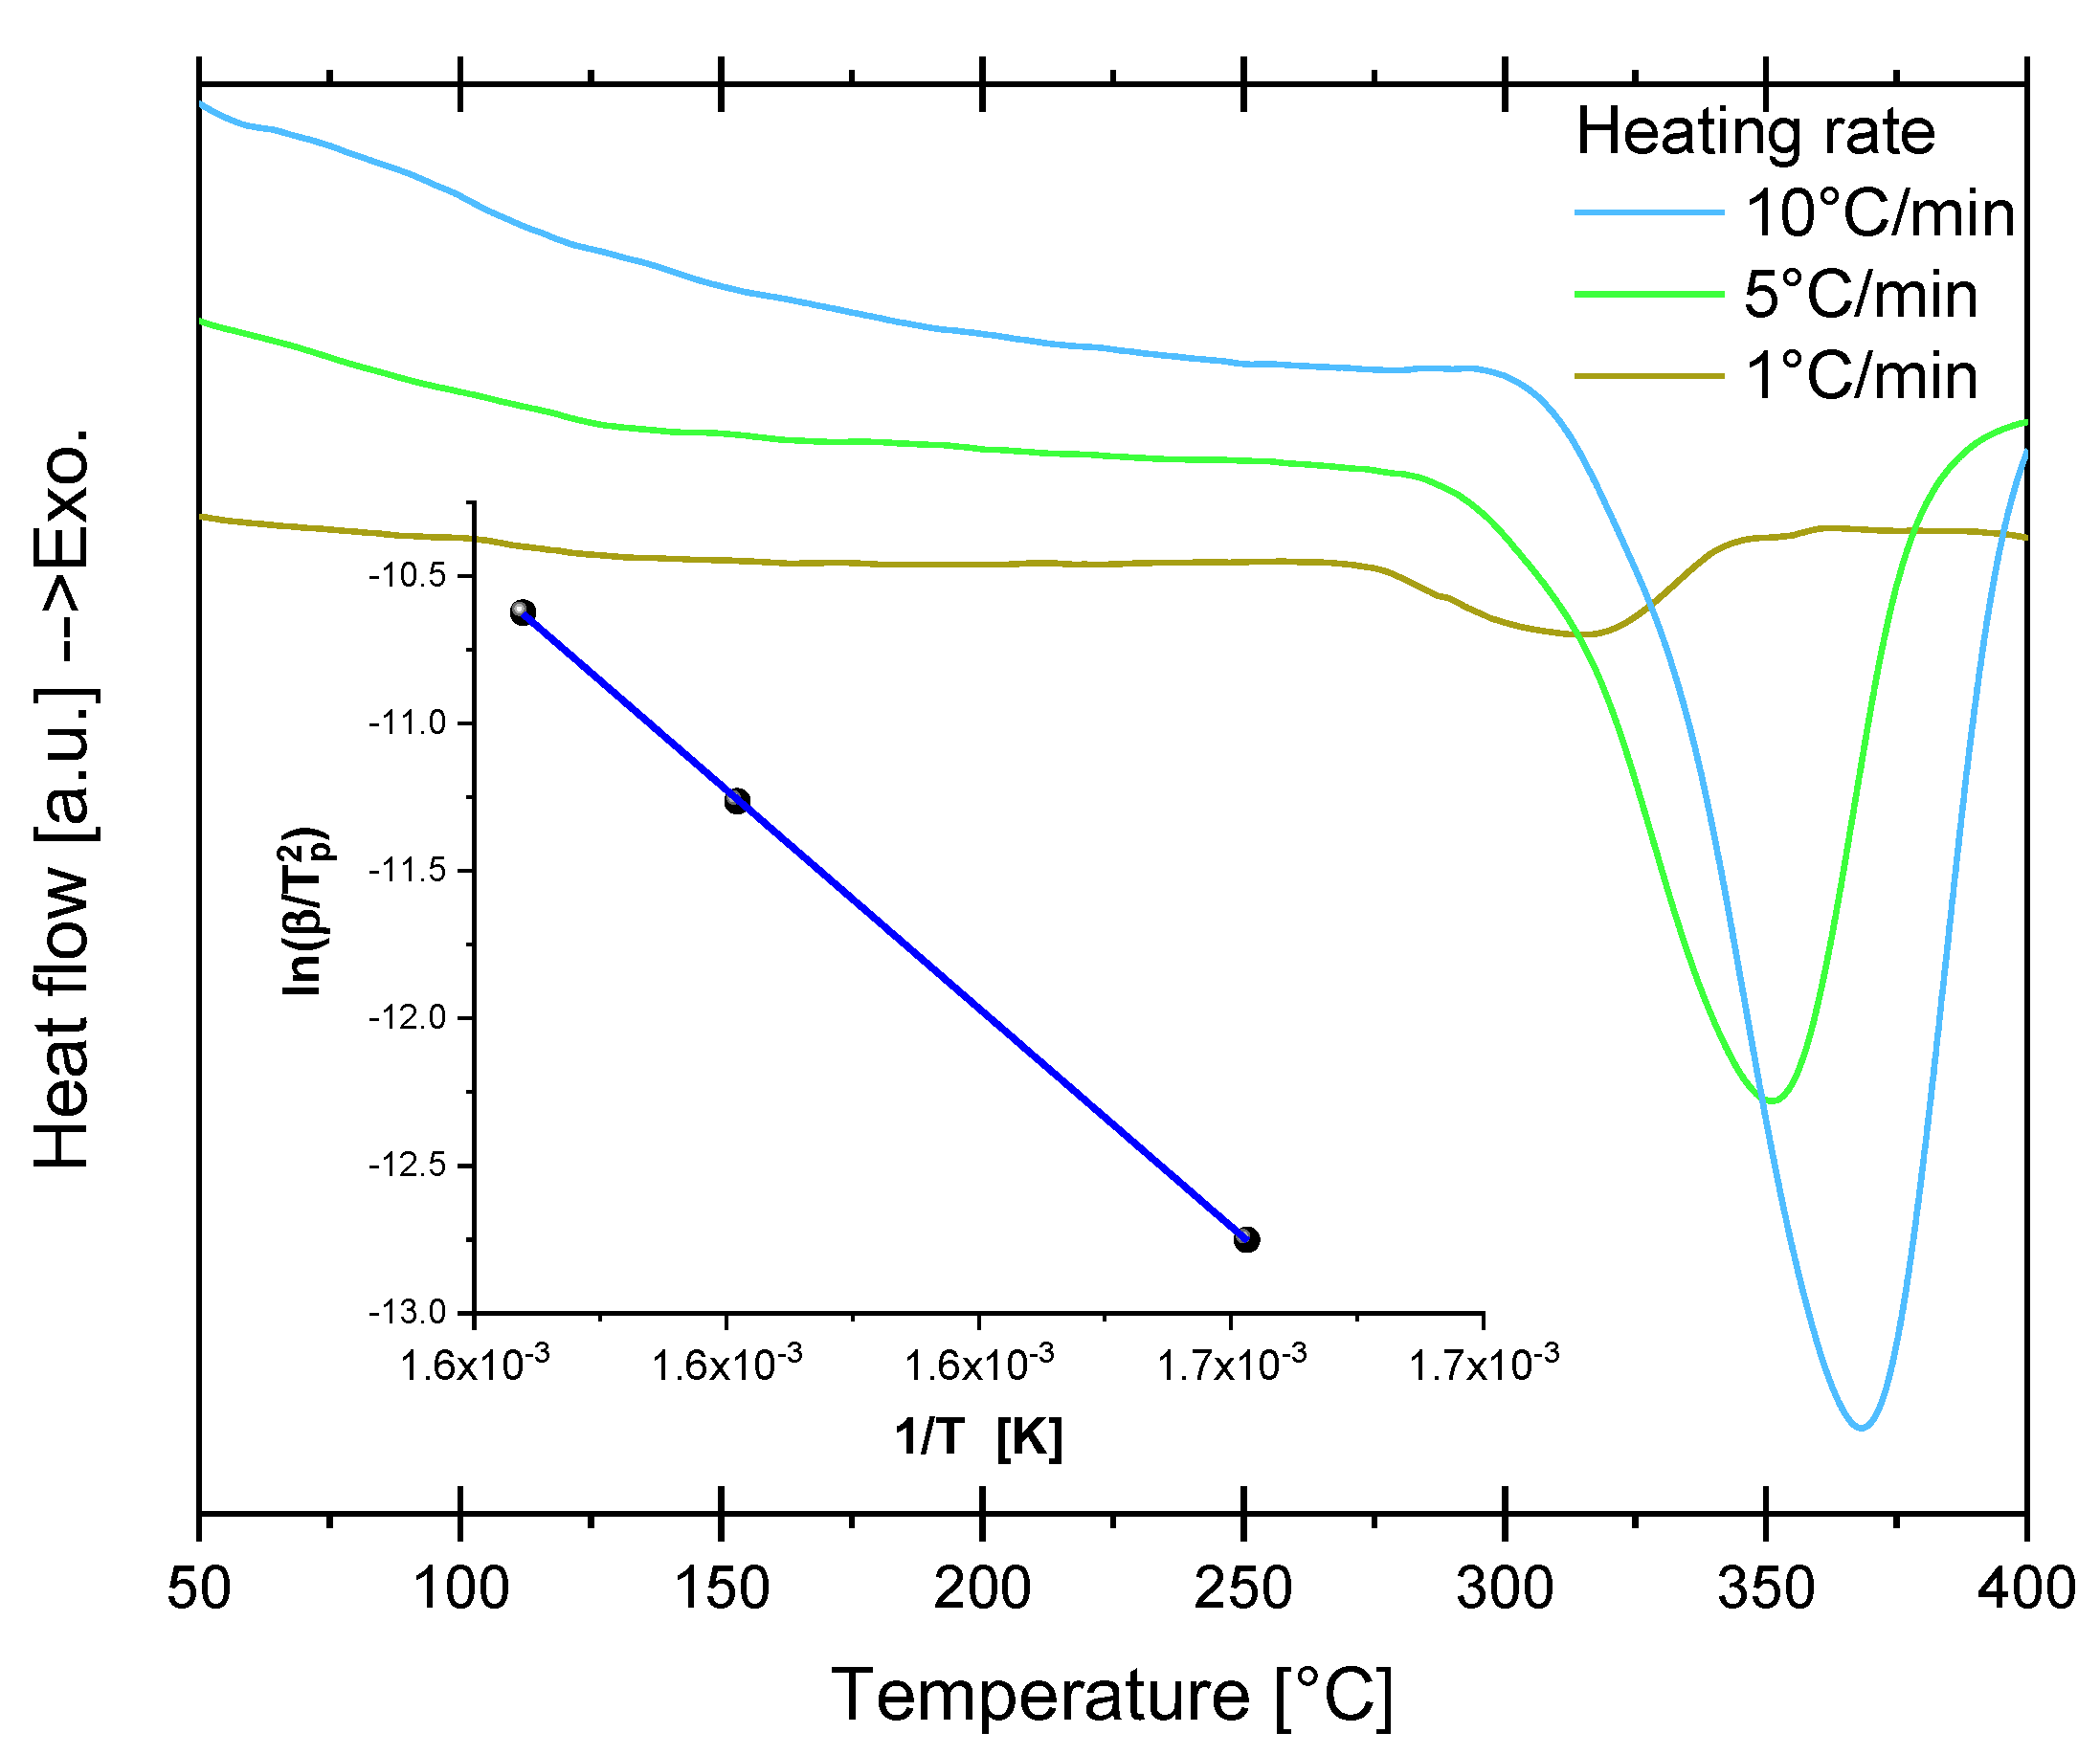
| Mg-15 wt.% VCl3 6.46 1 h cryomilling | This work | 5.19 wt.% at 2.5 min 5.6 wt.% at 60 min 300 °C, 26 bar, isothermic. | 0.95 wt.% at 2.5 min 5.34 wt.% at 20 min 350 °C, 0.8 bar, isothermic. | 314 °C, 1 °C/min, DSC |
| 1.26 wt.% at 2.5 min 5.3 wt.% at 60 min 320 °C, 12 bar, isothermic. | 0.03 wt.% at 2.5 min 5.07 wt.% at 60 min 320 °C, 1 bar, isothermic. | |||
| MgH2-14 wt.% VCl3 6.53 1 h milling in argon | [25] | Not reported | Not reported | ~310 °C *, 5 °C/min, TPD |
| MgH2-7 wt.% VCl3 7.06 1 h milling in argon | [25] | Not reported | Not reported | ~305 °C *, 5 °C/min, TPD |
| 278 °C, 5 °C/min, DSC | ||||
| MgH2-5 wt.% VCl3 7.22 Planetary ball milling | [26] | ~7.0 wt.% * 100 °C, 20 bar, 60 min, isothermic | ~7.0 wt.% * TG-DSC No kinetics study | ~275 °C, 1 °C/min, TG-DSC |
| MgH2-7 wt.%VCl3 7.06 Pre-milled in H2 at 2 bar for 24 h. Then milled for 20 min with the additive. | [30] | ~6.5 wt.% * 350 °C, 10 bar, 30 min Isothermic | ~6.2 wt.% * 350 °C, 0.1 bar (vacuum), 14 min Isothermic | ~375 °C DSC |
| MgH2-5mol% VCl3 (i.e., 23.9 wt.% VCl3) 5.78 | [31] | wt.% not reported 270 and 320 °C, 100–150 bar In-situ SR-PXD | wt.% not reported 270 and 320 °C, dynamic vacuum In-situ SR-PXD | Not reported |
| MgH2-10 wt.% NiCl2 2 h ball milled | [14] | ~6.1 wt.% * 350 °C, 20 bar, 5 min, isothermic | ~6.1 wt.% * 0.01 bar (vacuum), TPD | Not reported |
| MgH2-4mol% TiCl3 (i.e., 19.6 wt.% TiCl3) 10 h milling in argon | [56,57] | ~5.1 wt.% * 300 °C, 20 bar, 1 min, isothermic | ~3.8 wt.% * 280 °C, 0.1 bar (vacuum), 25 min, isothermic | Not reported |
| MgH2-5 wt.% NbCl5 milled in H2 at 2 bar for 24 h. | [58] | ~6.4 wt.% * 350 °C, 10 bar, 15 min, isothermic | ~6.4 wt.% * 350 °C, 0.1 bar (vacuum), 6 min, isothermic | ~375 °C DSC |
| Material | Ea [kJ/mol H2] | Reference |
|---|---|---|
| Mg | 90 ± 10 | [60] |
| 95–130 | [61] | |
| Mg-15wt.% VCl3 | 63.8 ± 5.6 | This work |
| Material | Relevant Conditions of Materials Preparation | Ea [kJ/mol H2] | Reference |
|---|---|---|---|
| MgH2 | Not milled | 240 | [25] |
| MgH2 | Commercial (not milled) | 195.3 ± 10 | [62] |
| MgH2 | Not milled | 156 | [63] |
| MgH2 | Particle size 45 µm | 160 ± 10 | [60,61] |
| MgH2 | 2 h ball milled | 158.5 | [14] |
| Mg-15wt.% VCl3 | Cryogenic ball milling (2.5–5 µm thickness) | 123.11 ± 0.61 | This work |
| MgH2-5wt.% VCl3 | Planetary ball milling, 2 h, particle size < 10 µm | 122 ± 5 | [26] |
| MgH2-10wt.% CoCl2 | 2 h ball milled | 121.3 | [14] |
| MgH2-10wt.% NiCl2 | 2 h ball milled | 102.6 | [14] |
| MgH2-7wt.% TiCl3 | 1 h milling in argon | 97 | [25] |
| MgH2-5wt.% NbCl5 | 24 h reactive-milling in 2 bar H2 | 98 | [58] |
| MgH2-7wt.% VCl3 | 1 h milling in argon | 96–97 | [25] |
| MgH2-5 at.% V (9.2 wt.% V) | 20 h milling, particle size < 5 µm | 62 | [45] |
| MgH2-7 wt.% VCl3 | Pre-milled in H2 at 2 bar for 24 h. Then milled for 20 min with the additive. | 47 | [30] |
Disclaimer/Publisher’s Note: The statements, opinions and data contained in all publications are solely those of the individual author(s) and contributor(s) and not of MDPI and/or the editor(s). MDPI and/or the editor(s) disclaim responsibility for any injury to people or property resulting from any ideas, methods, instructions or products referred to in the content. |
© 2023 by the authors. Licensee MDPI, Basel, Switzerland. This article is an open access article distributed under the terms and conditions of the Creative Commons Attribution (CC BY) license (https://creativecommons.org/licenses/by/4.0/).
Share and Cite
Suárez-Alcántara, K.; Flores-Jacobo, N.I.; Osorio-García, M.d.P.; Cabañas-Moreno, J.G. Fast Hydrogen Sorption Kinetics in Mg-VCl3 Produced by Cryogenic Ball-Milling. Materials 2023, 16, 2526. https://doi.org/10.3390/ma16062526
Suárez-Alcántara K, Flores-Jacobo NI, Osorio-García MdP, Cabañas-Moreno JG. Fast Hydrogen Sorption Kinetics in Mg-VCl3 Produced by Cryogenic Ball-Milling. Materials. 2023; 16(6):2526. https://doi.org/10.3390/ma16062526
Chicago/Turabian StyleSuárez-Alcántara, Karina, Nadia Isabel Flores-Jacobo, Mayara del Pilar Osorio-García, and José Gerardo Cabañas-Moreno. 2023. "Fast Hydrogen Sorption Kinetics in Mg-VCl3 Produced by Cryogenic Ball-Milling" Materials 16, no. 6: 2526. https://doi.org/10.3390/ma16062526