
Experimental and Numerical Study of the Ultimate Flexural Capacity of a Full-Size Damaged Prestressed Concrete Box Girder Strengthened with Bonded Steel Plates
Abstract
:1. Introduction
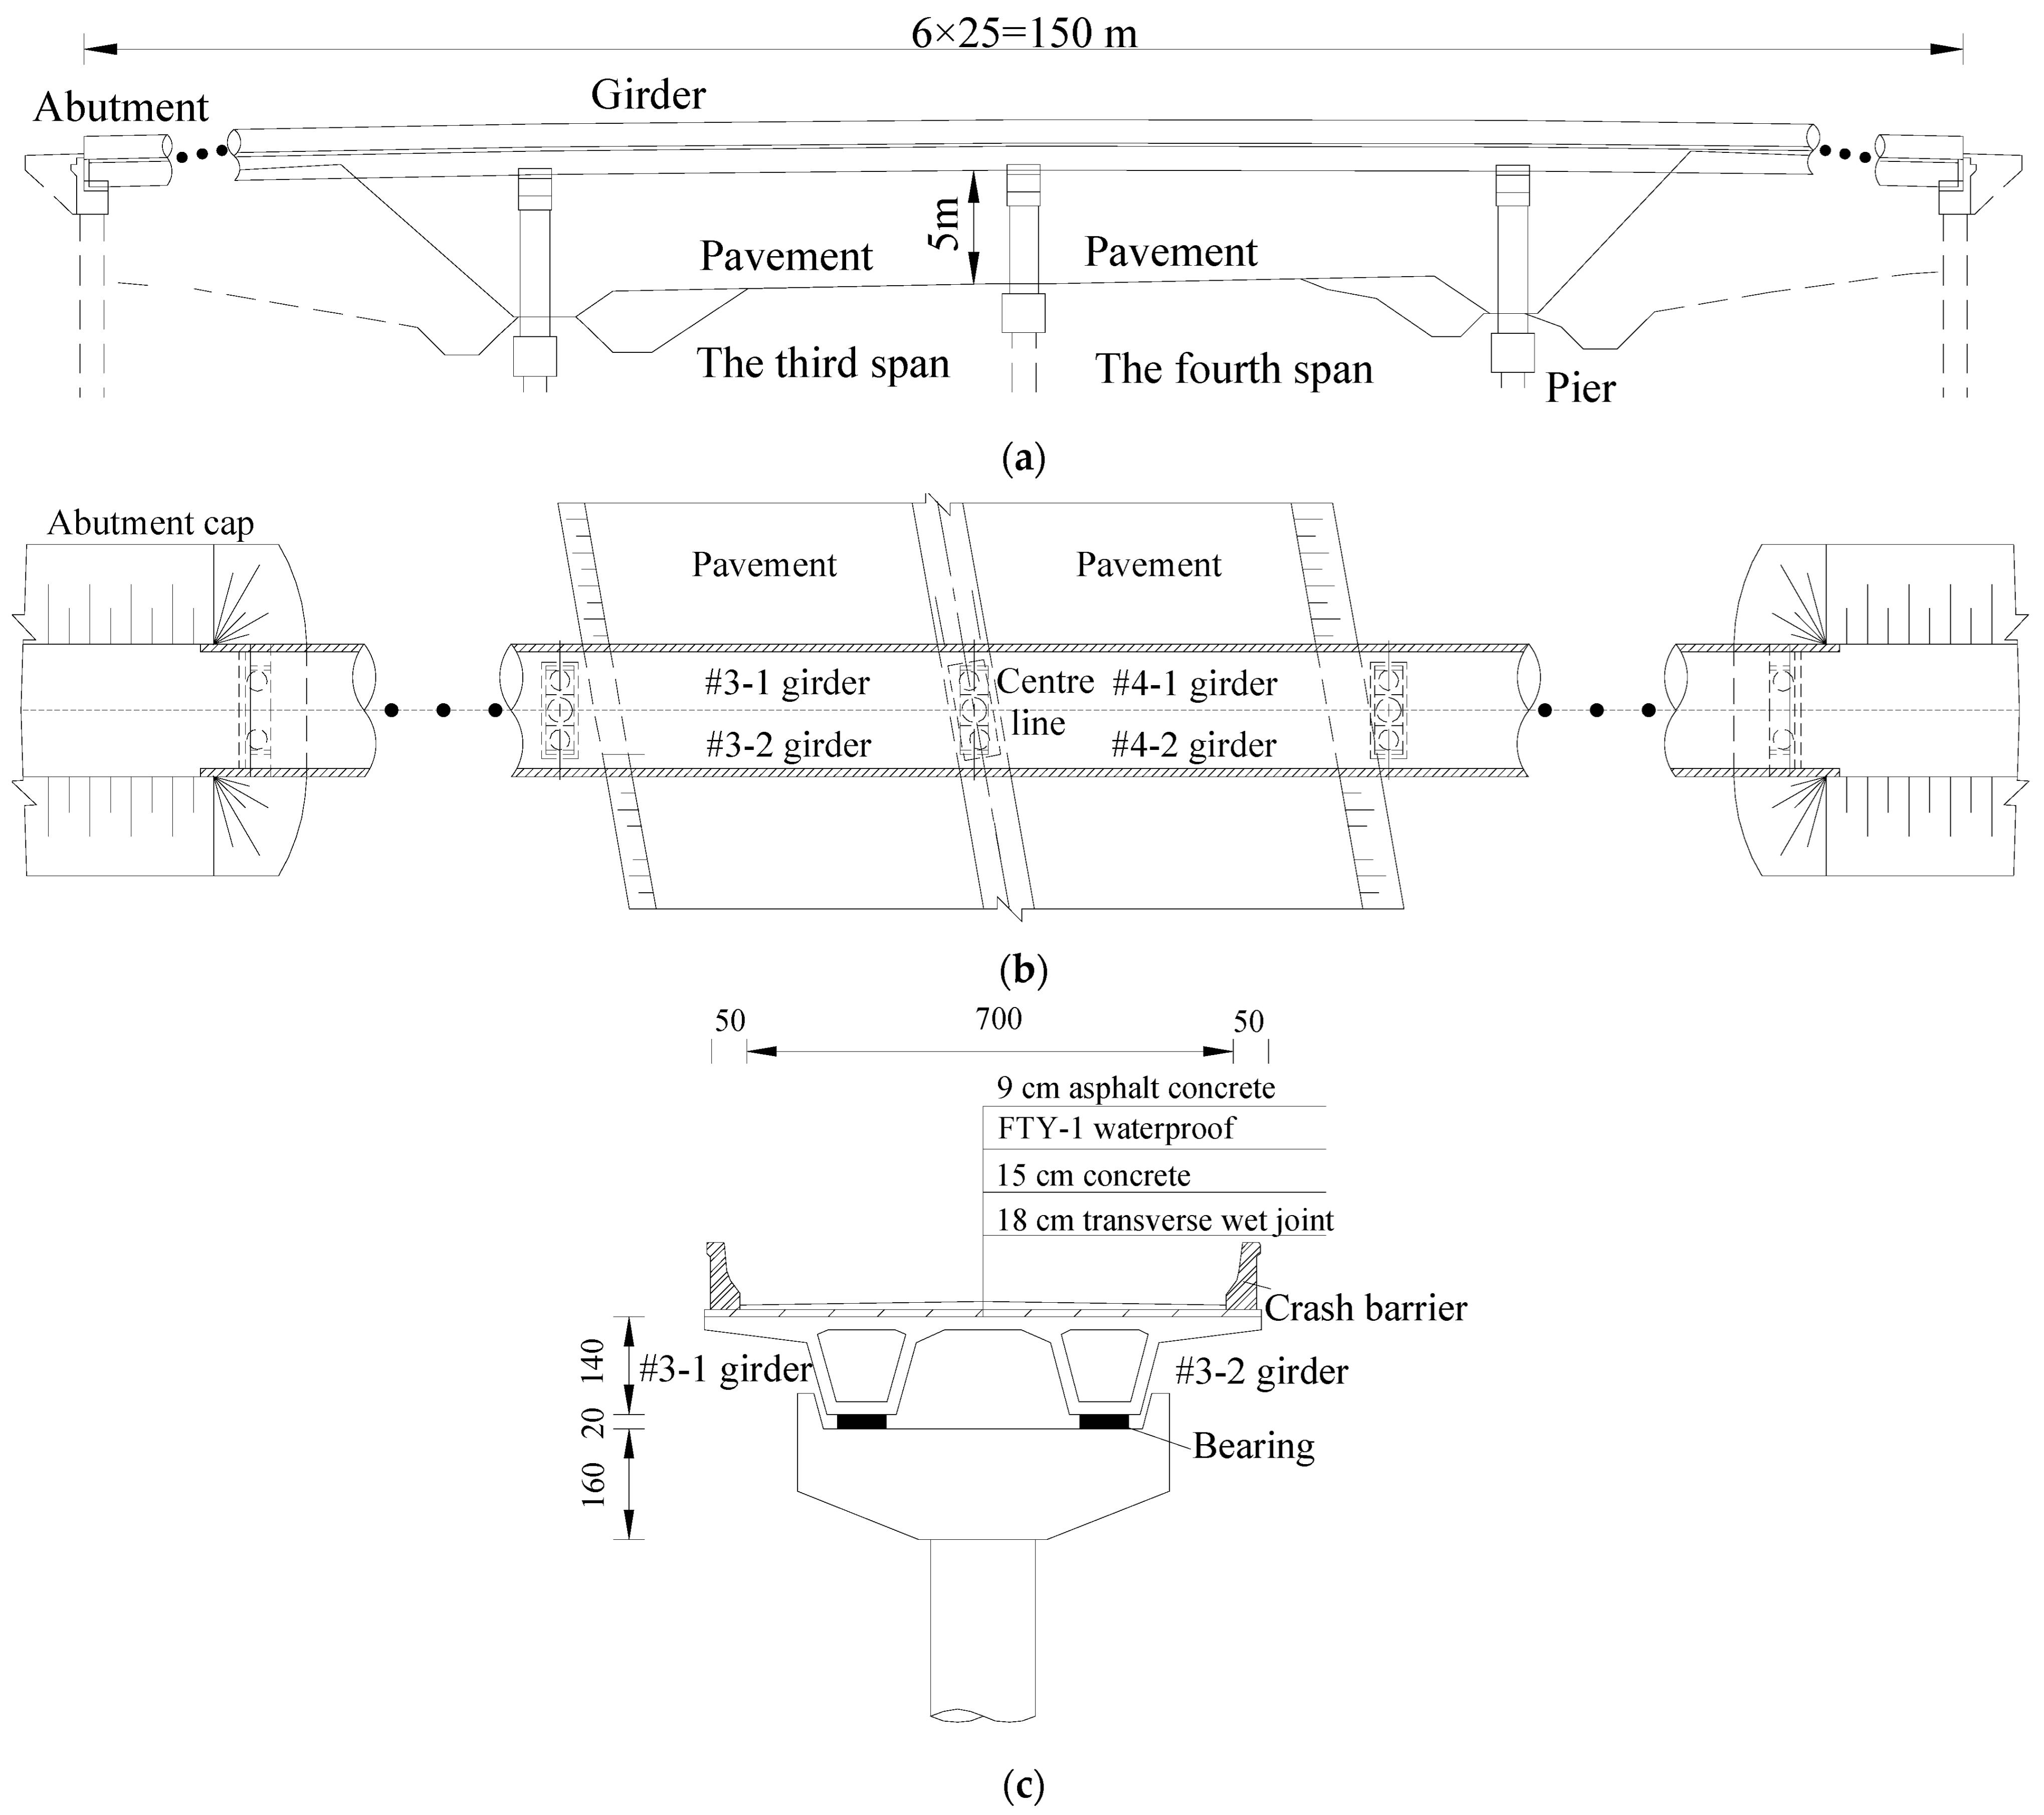
2. Engineering Situations
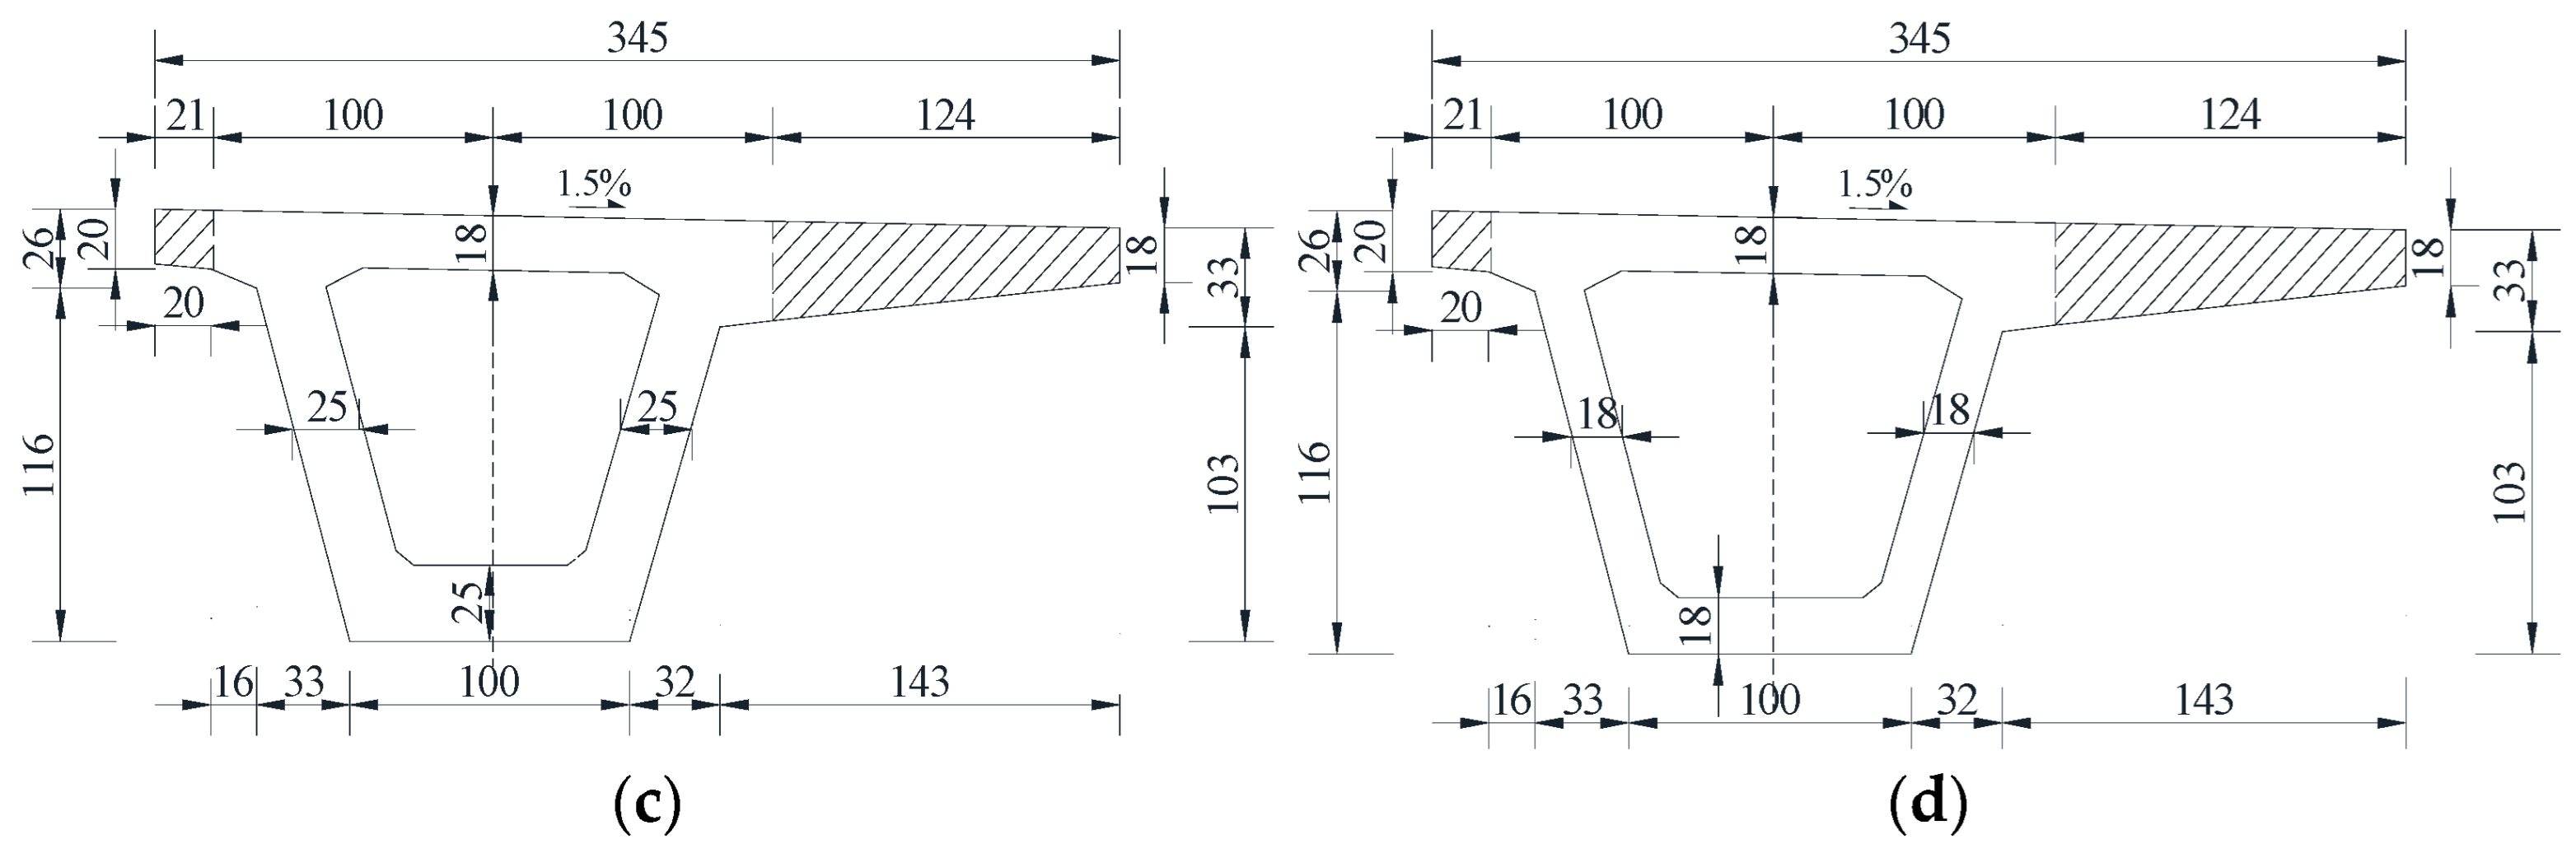
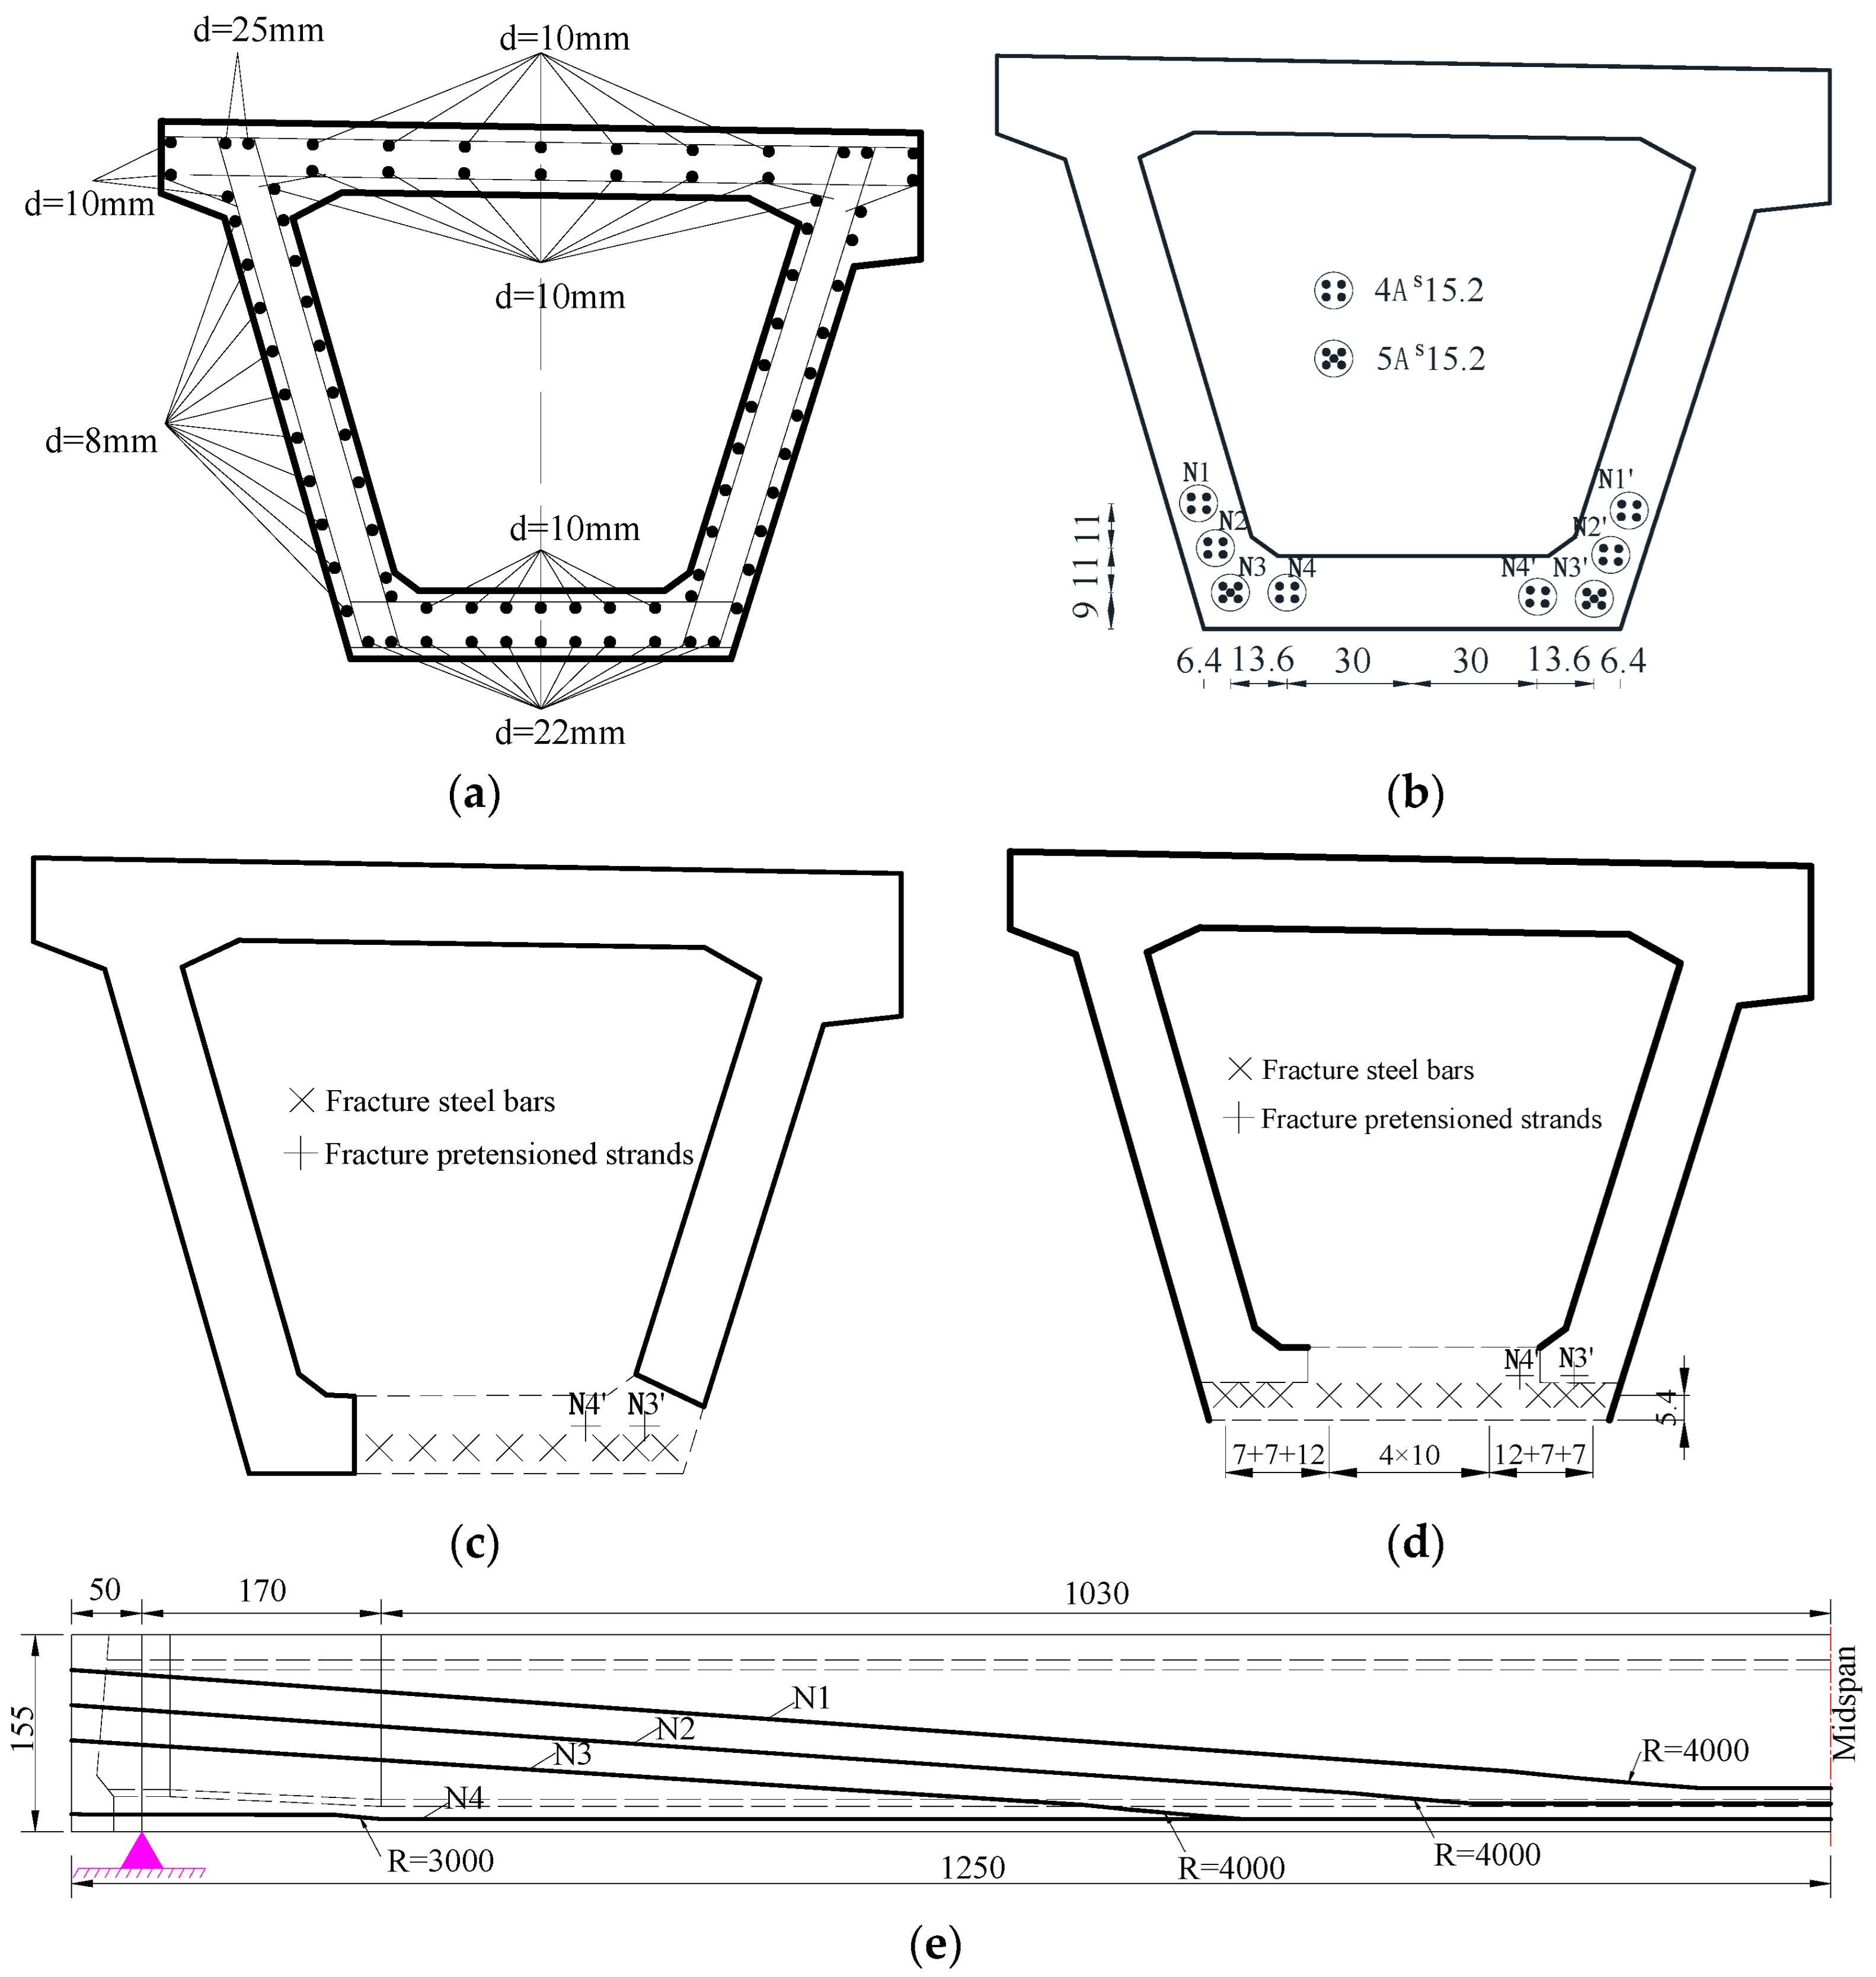
2.1. Bridge Information
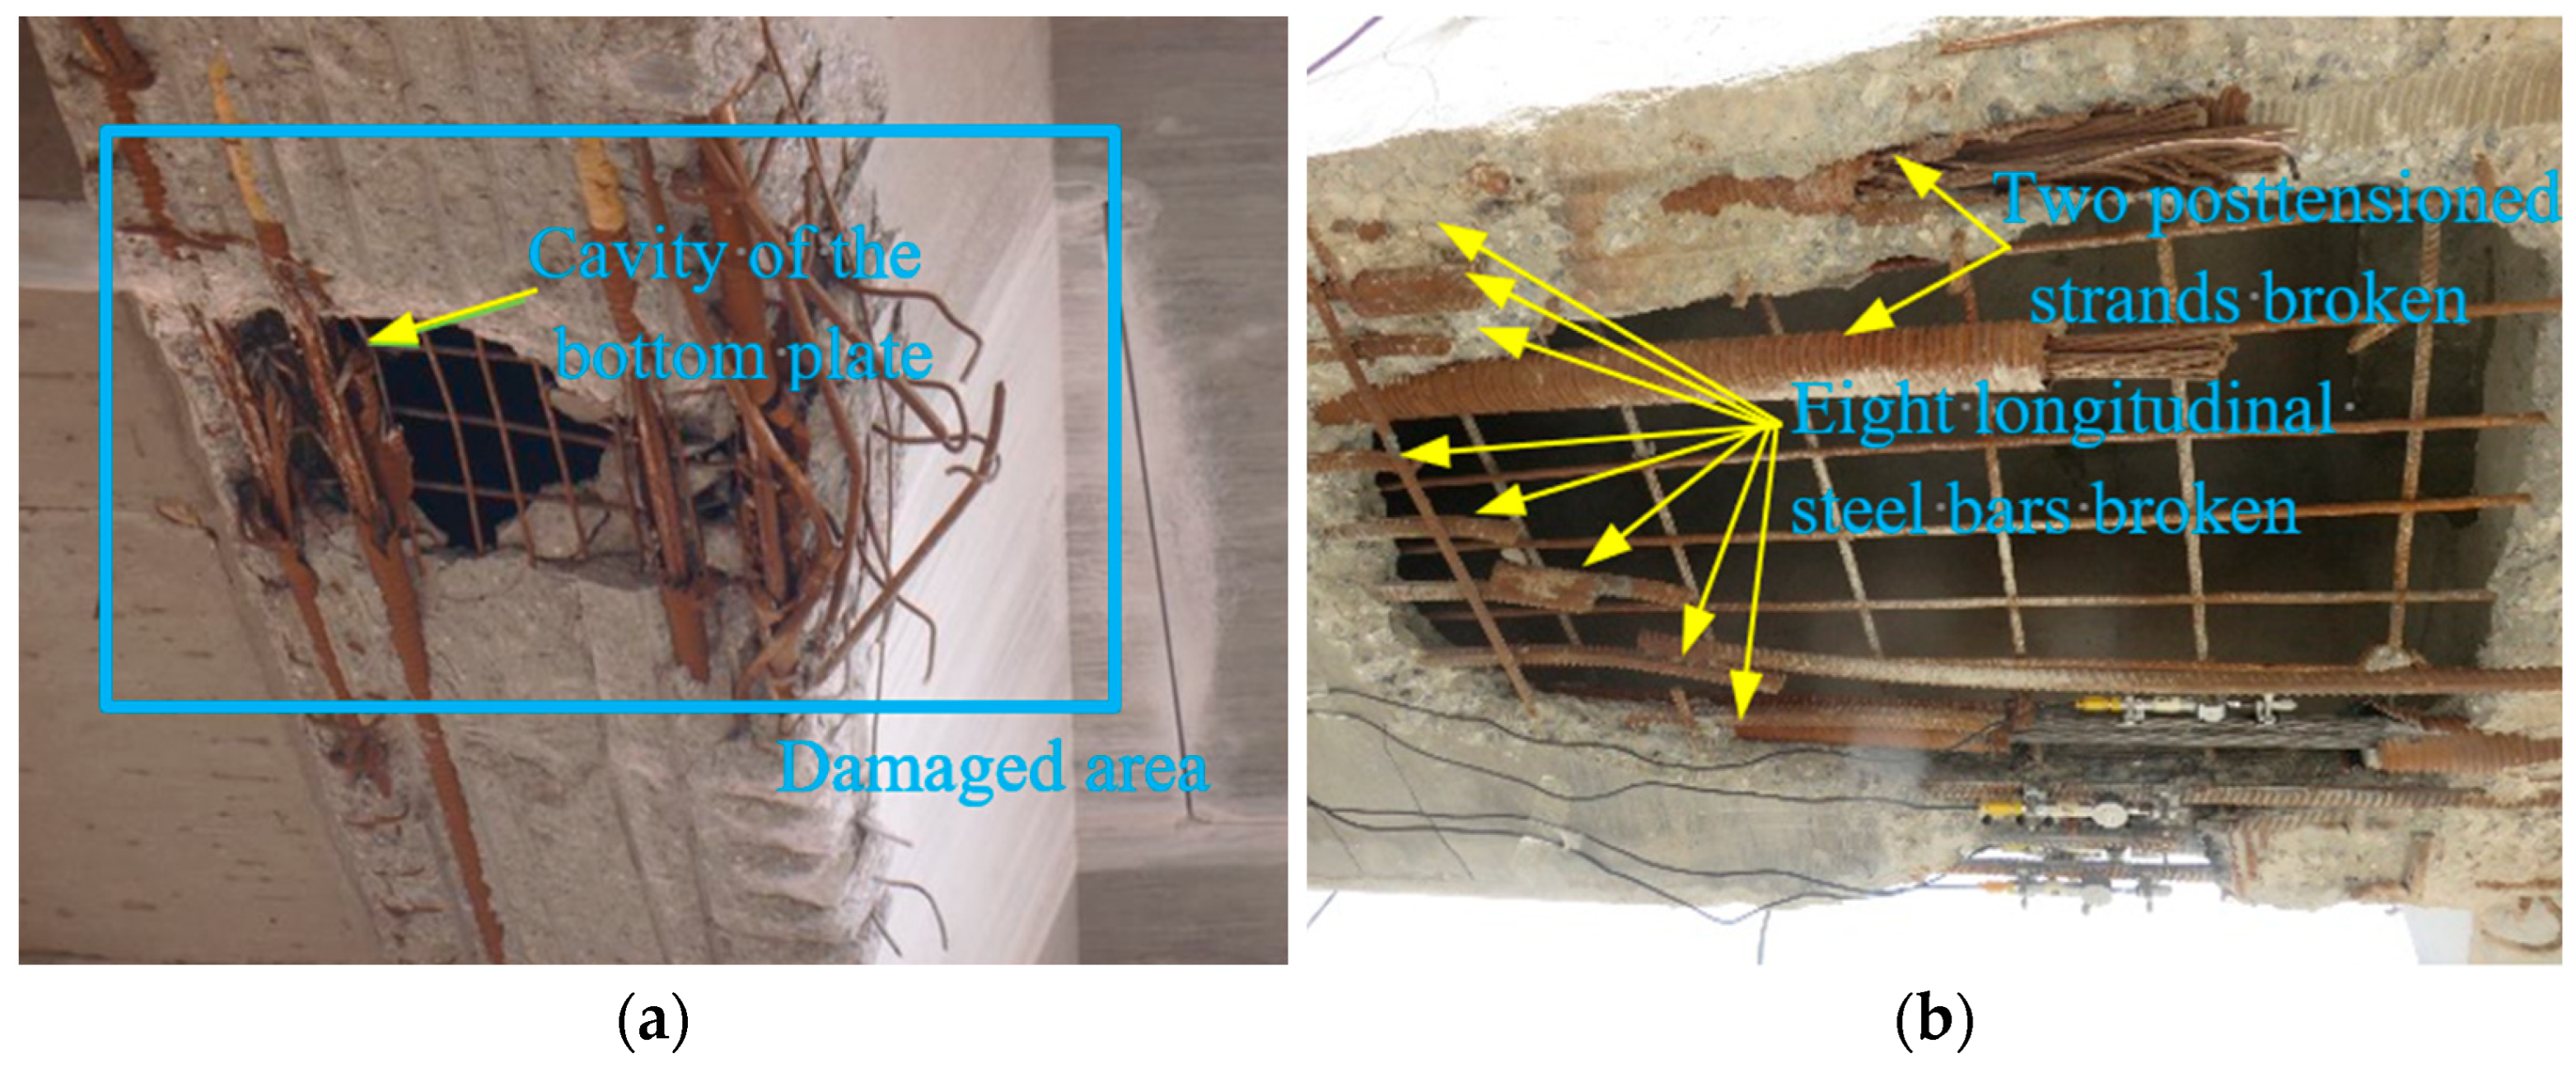
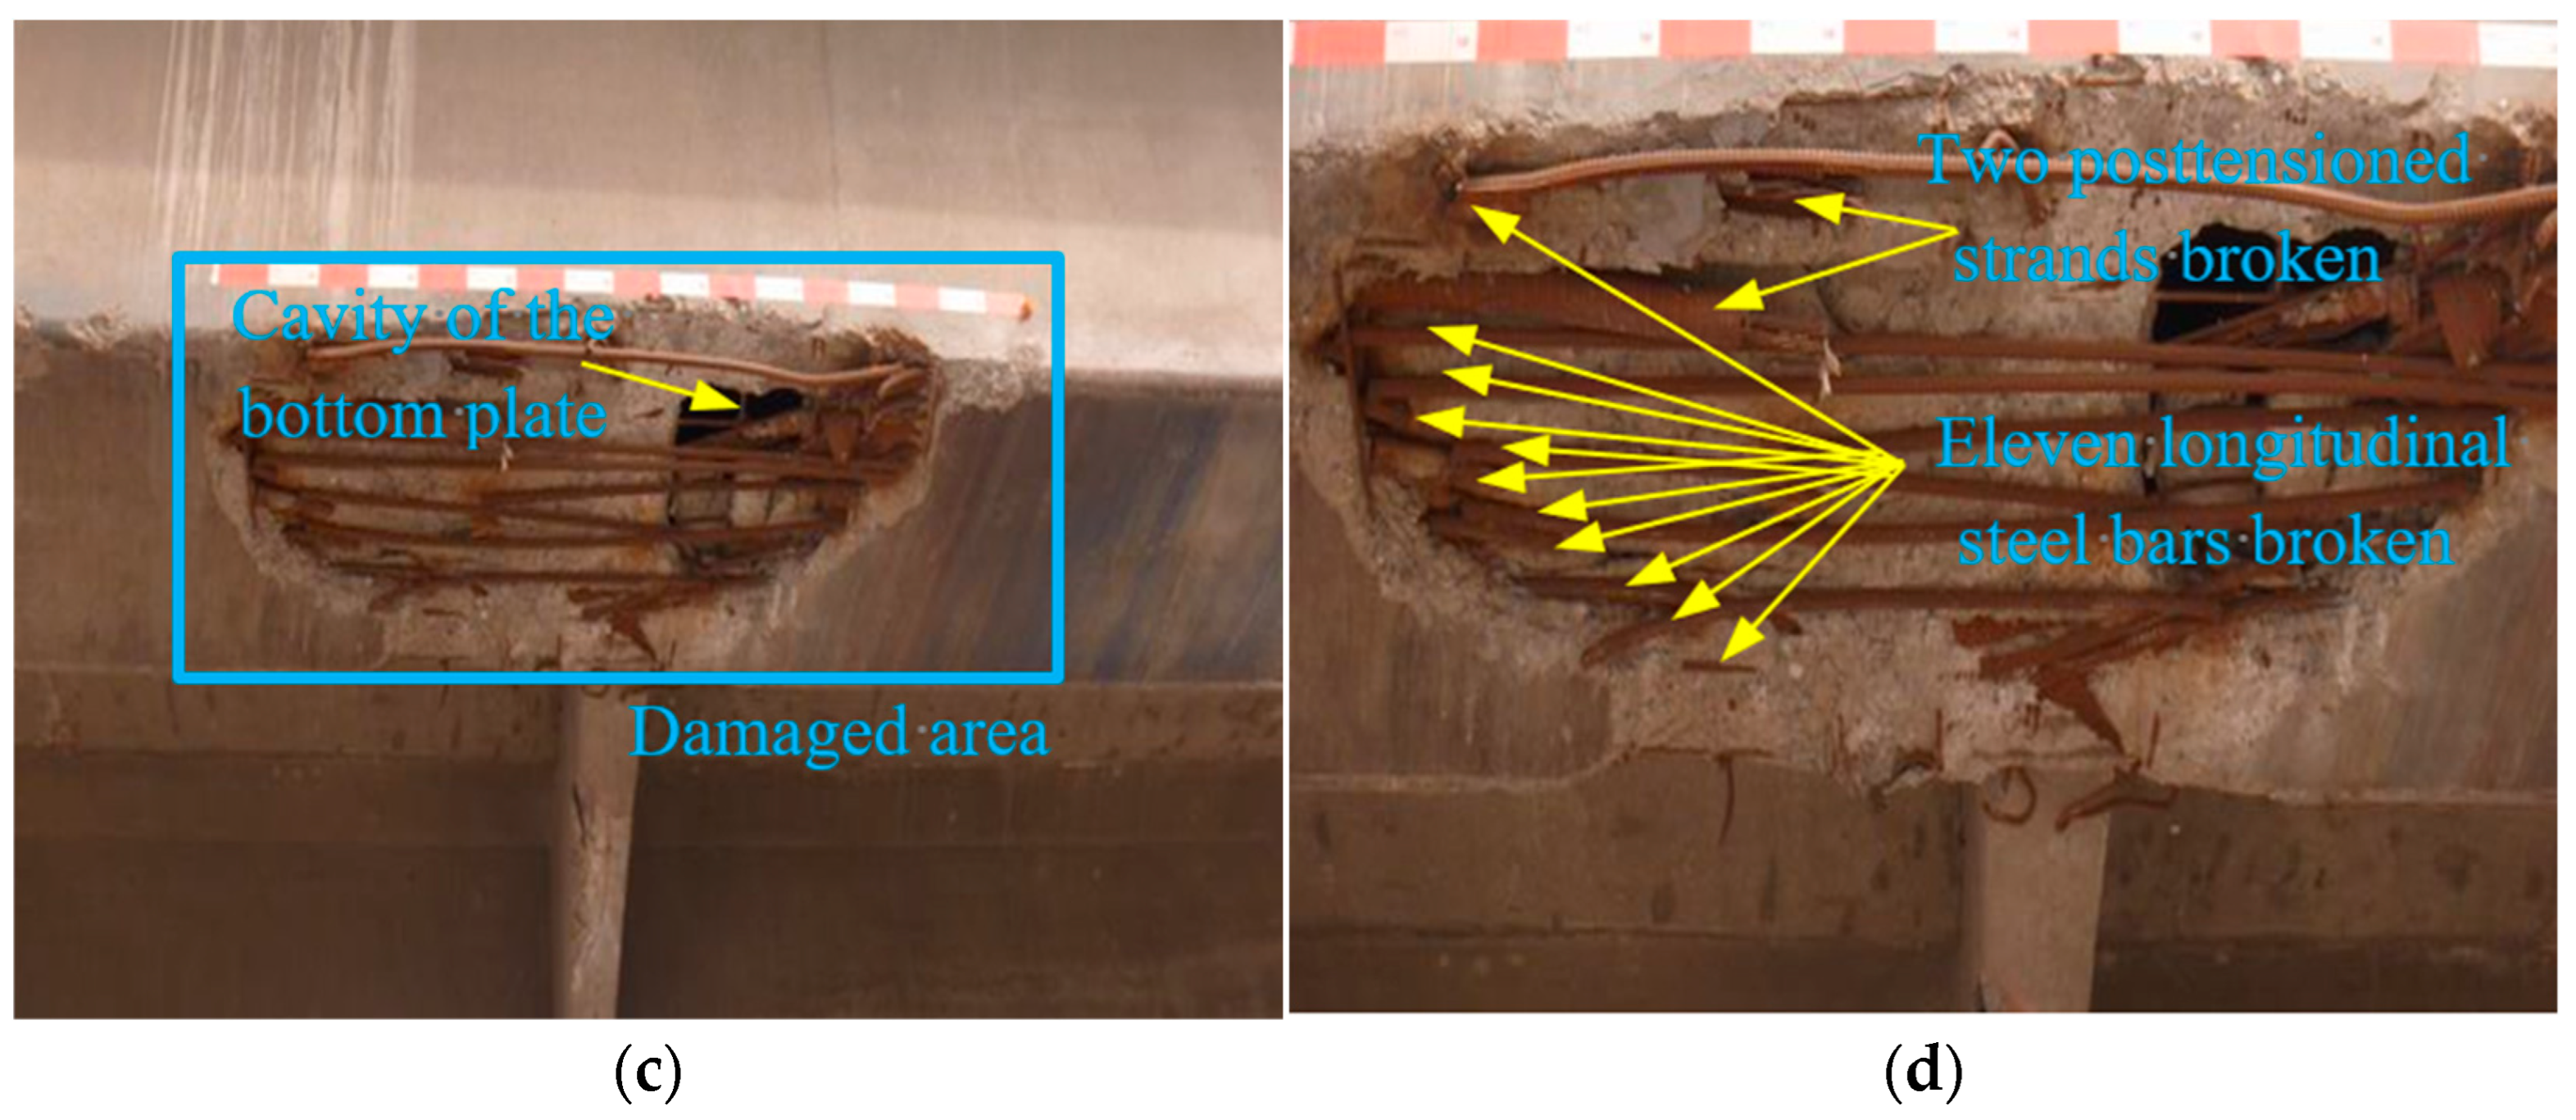
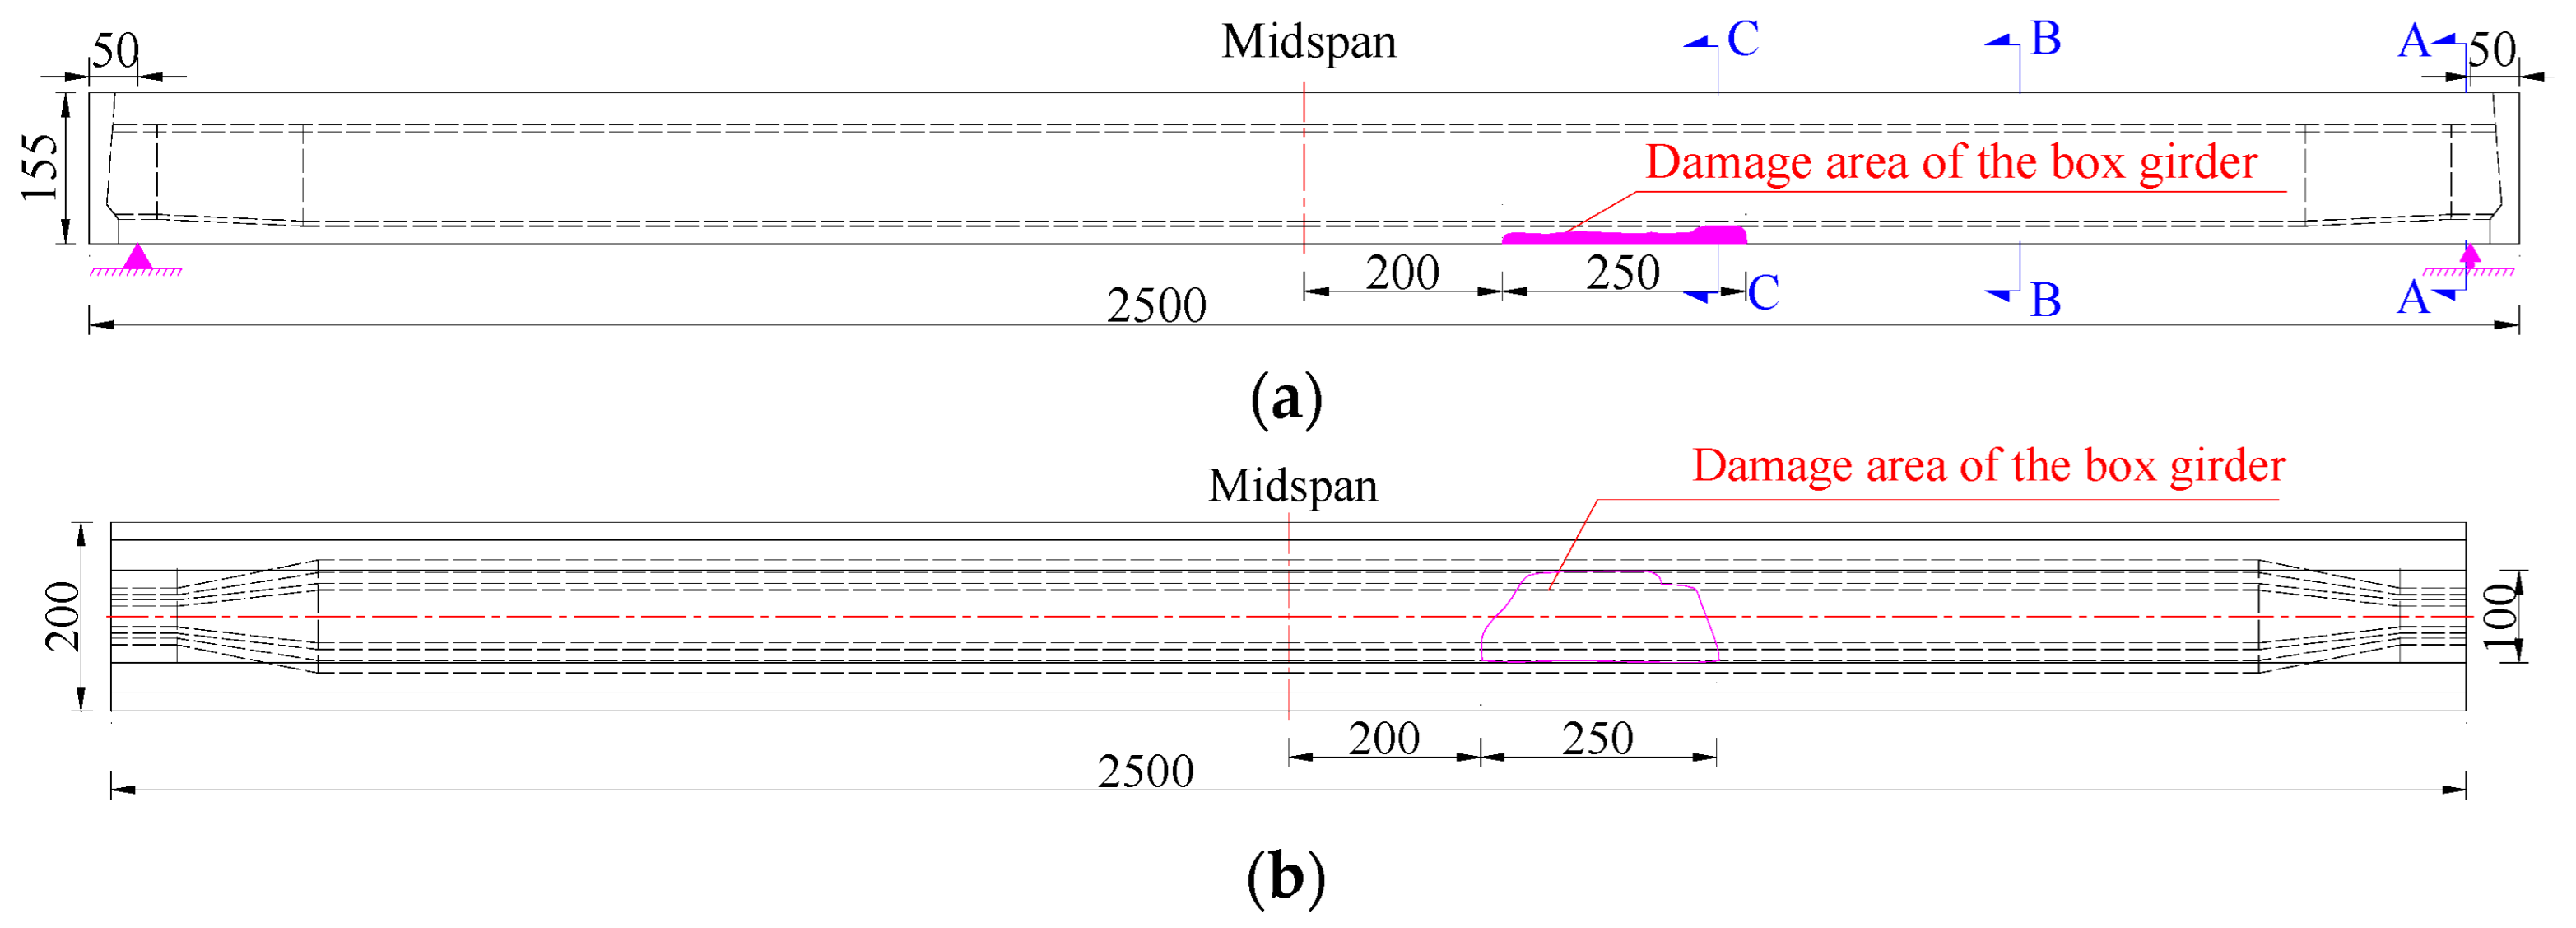
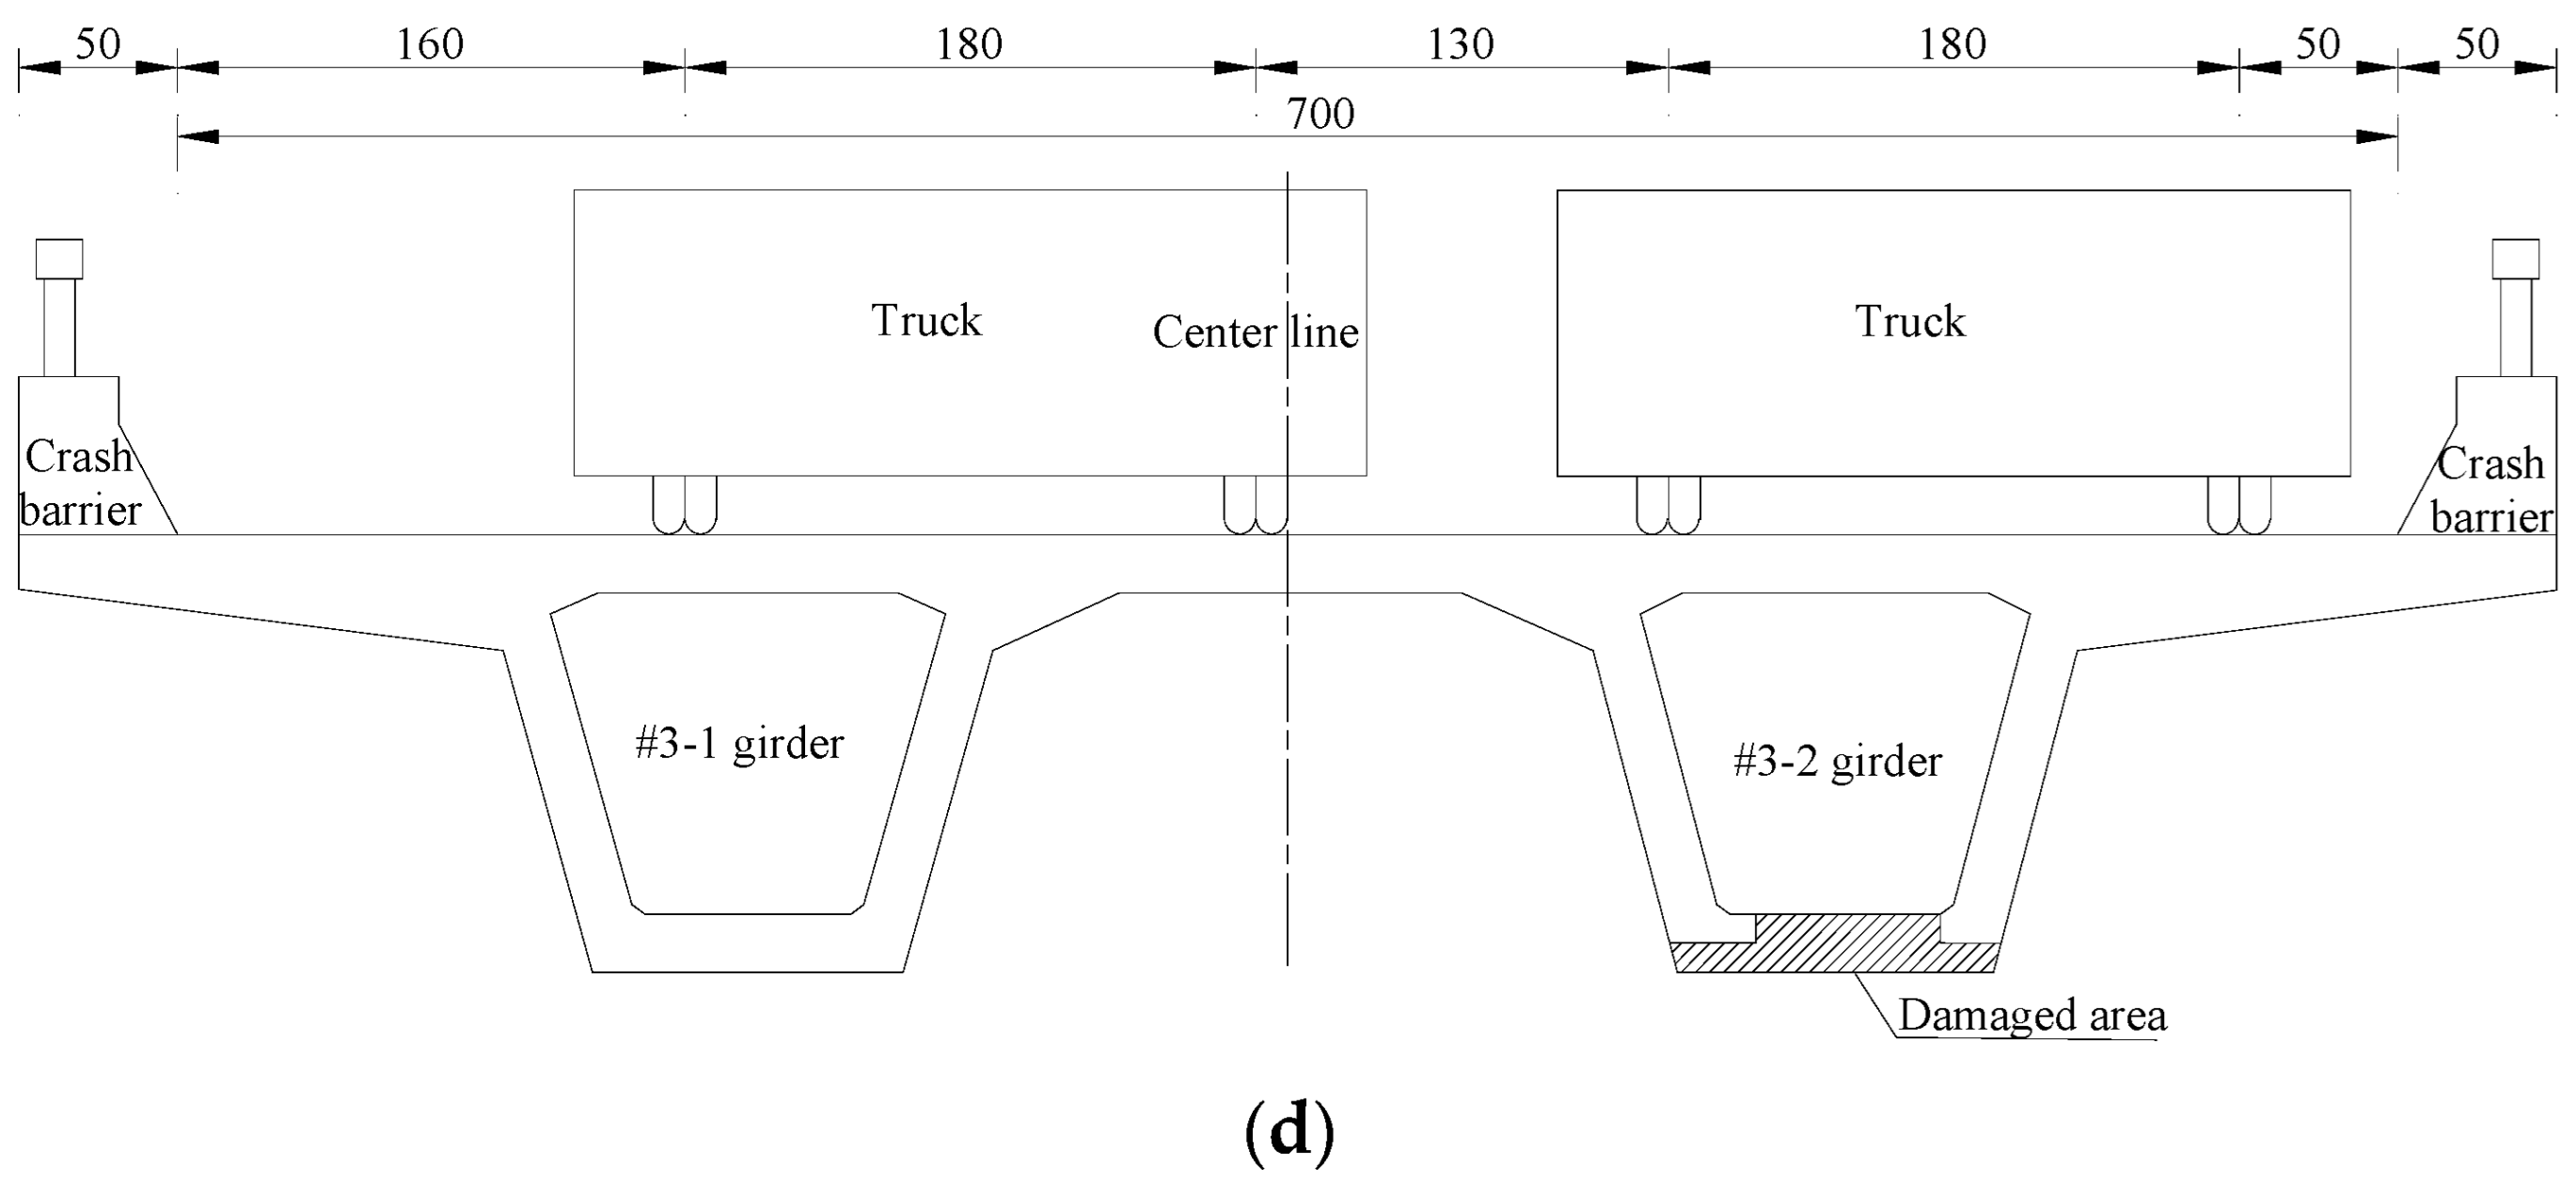
2.2. Appearance of Damage
3. Theoretical Analysis
3.1. Flexural Capacity
3.2. Load Effect under the Designed Load
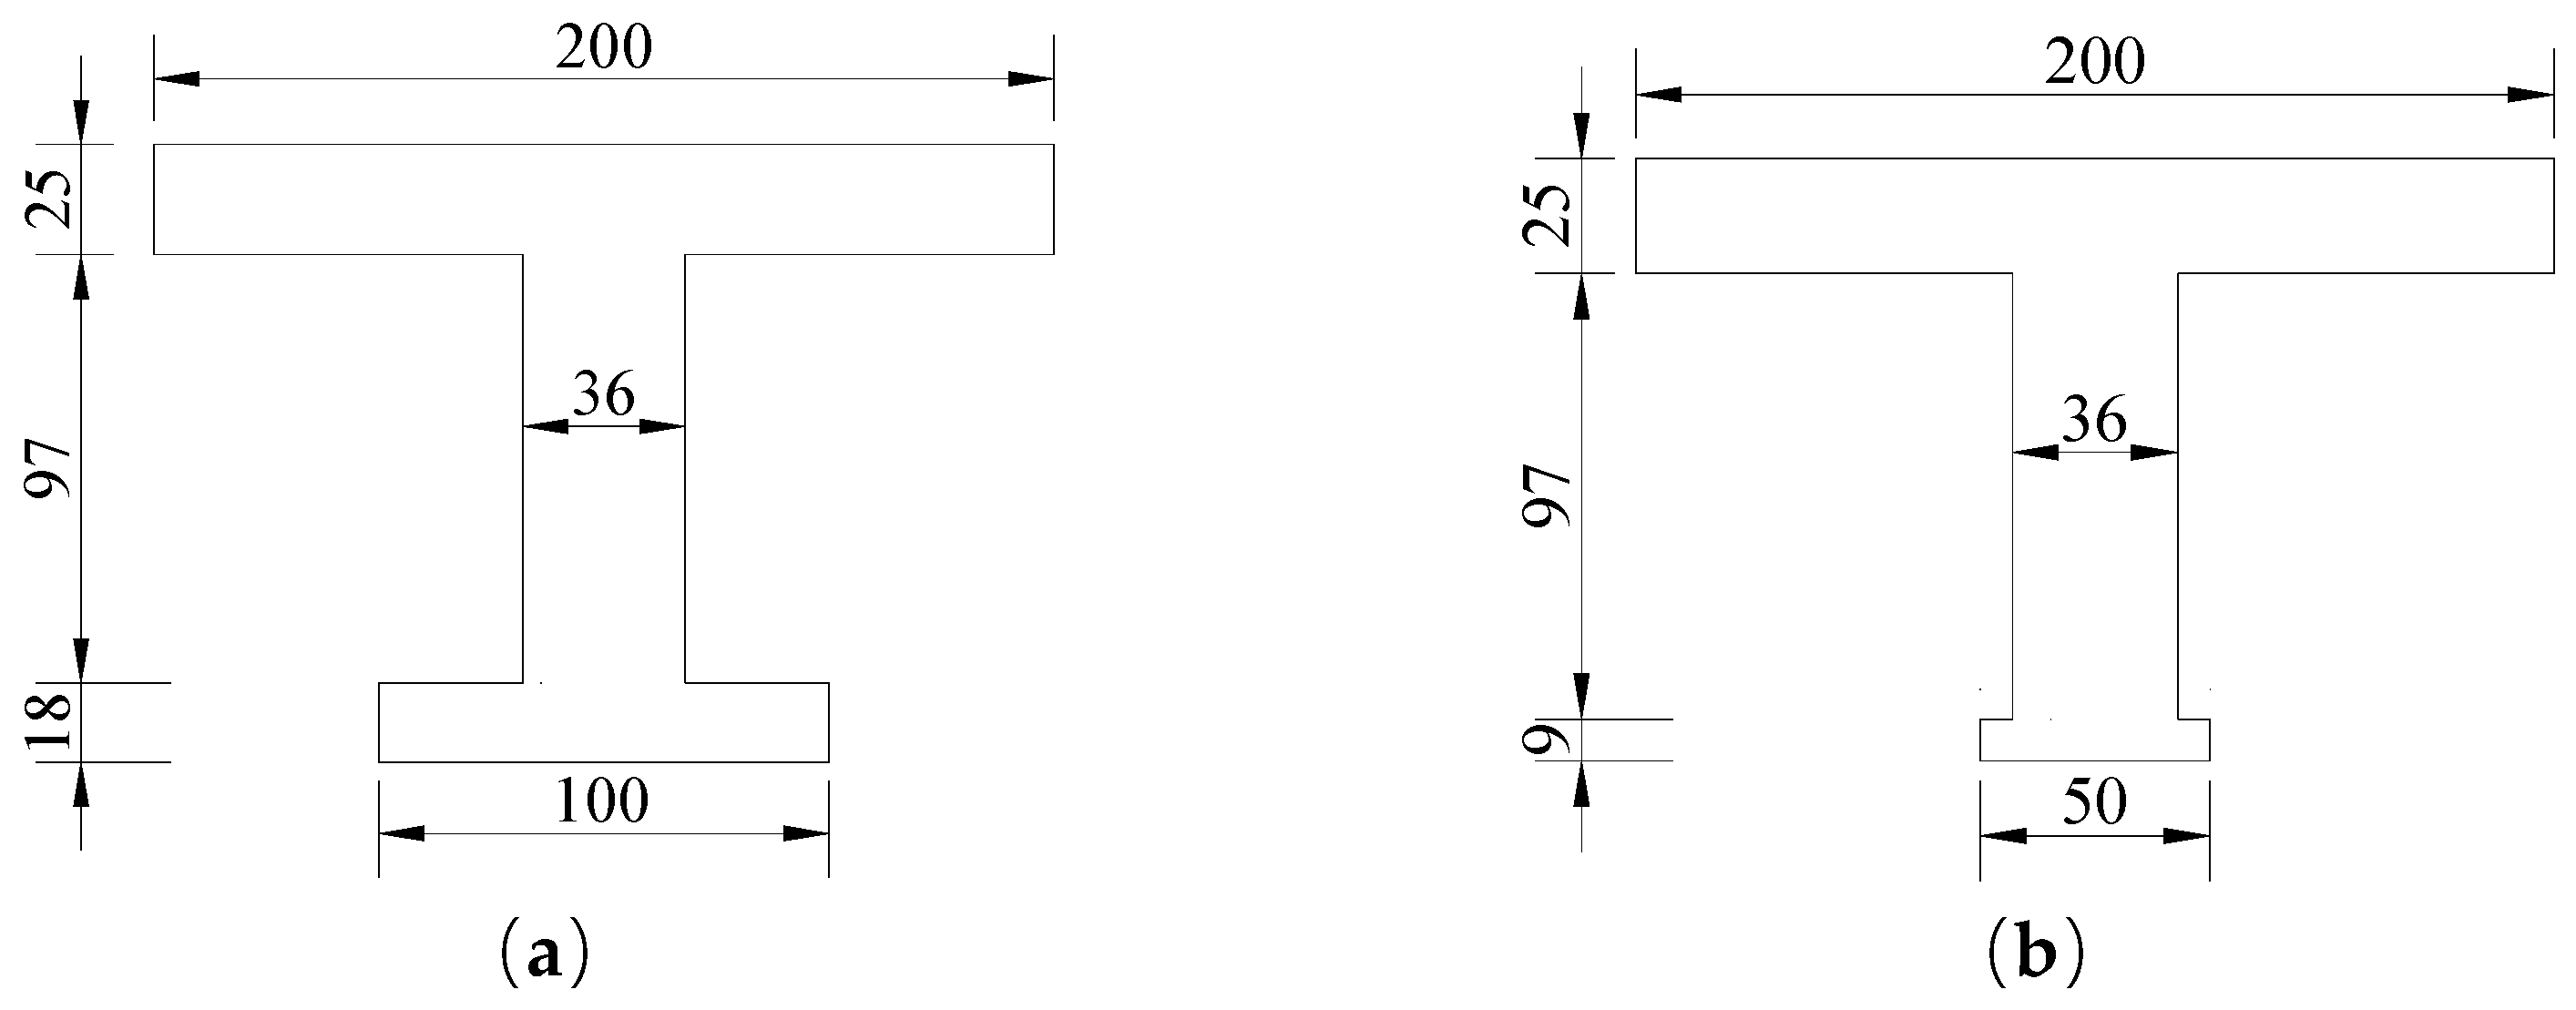
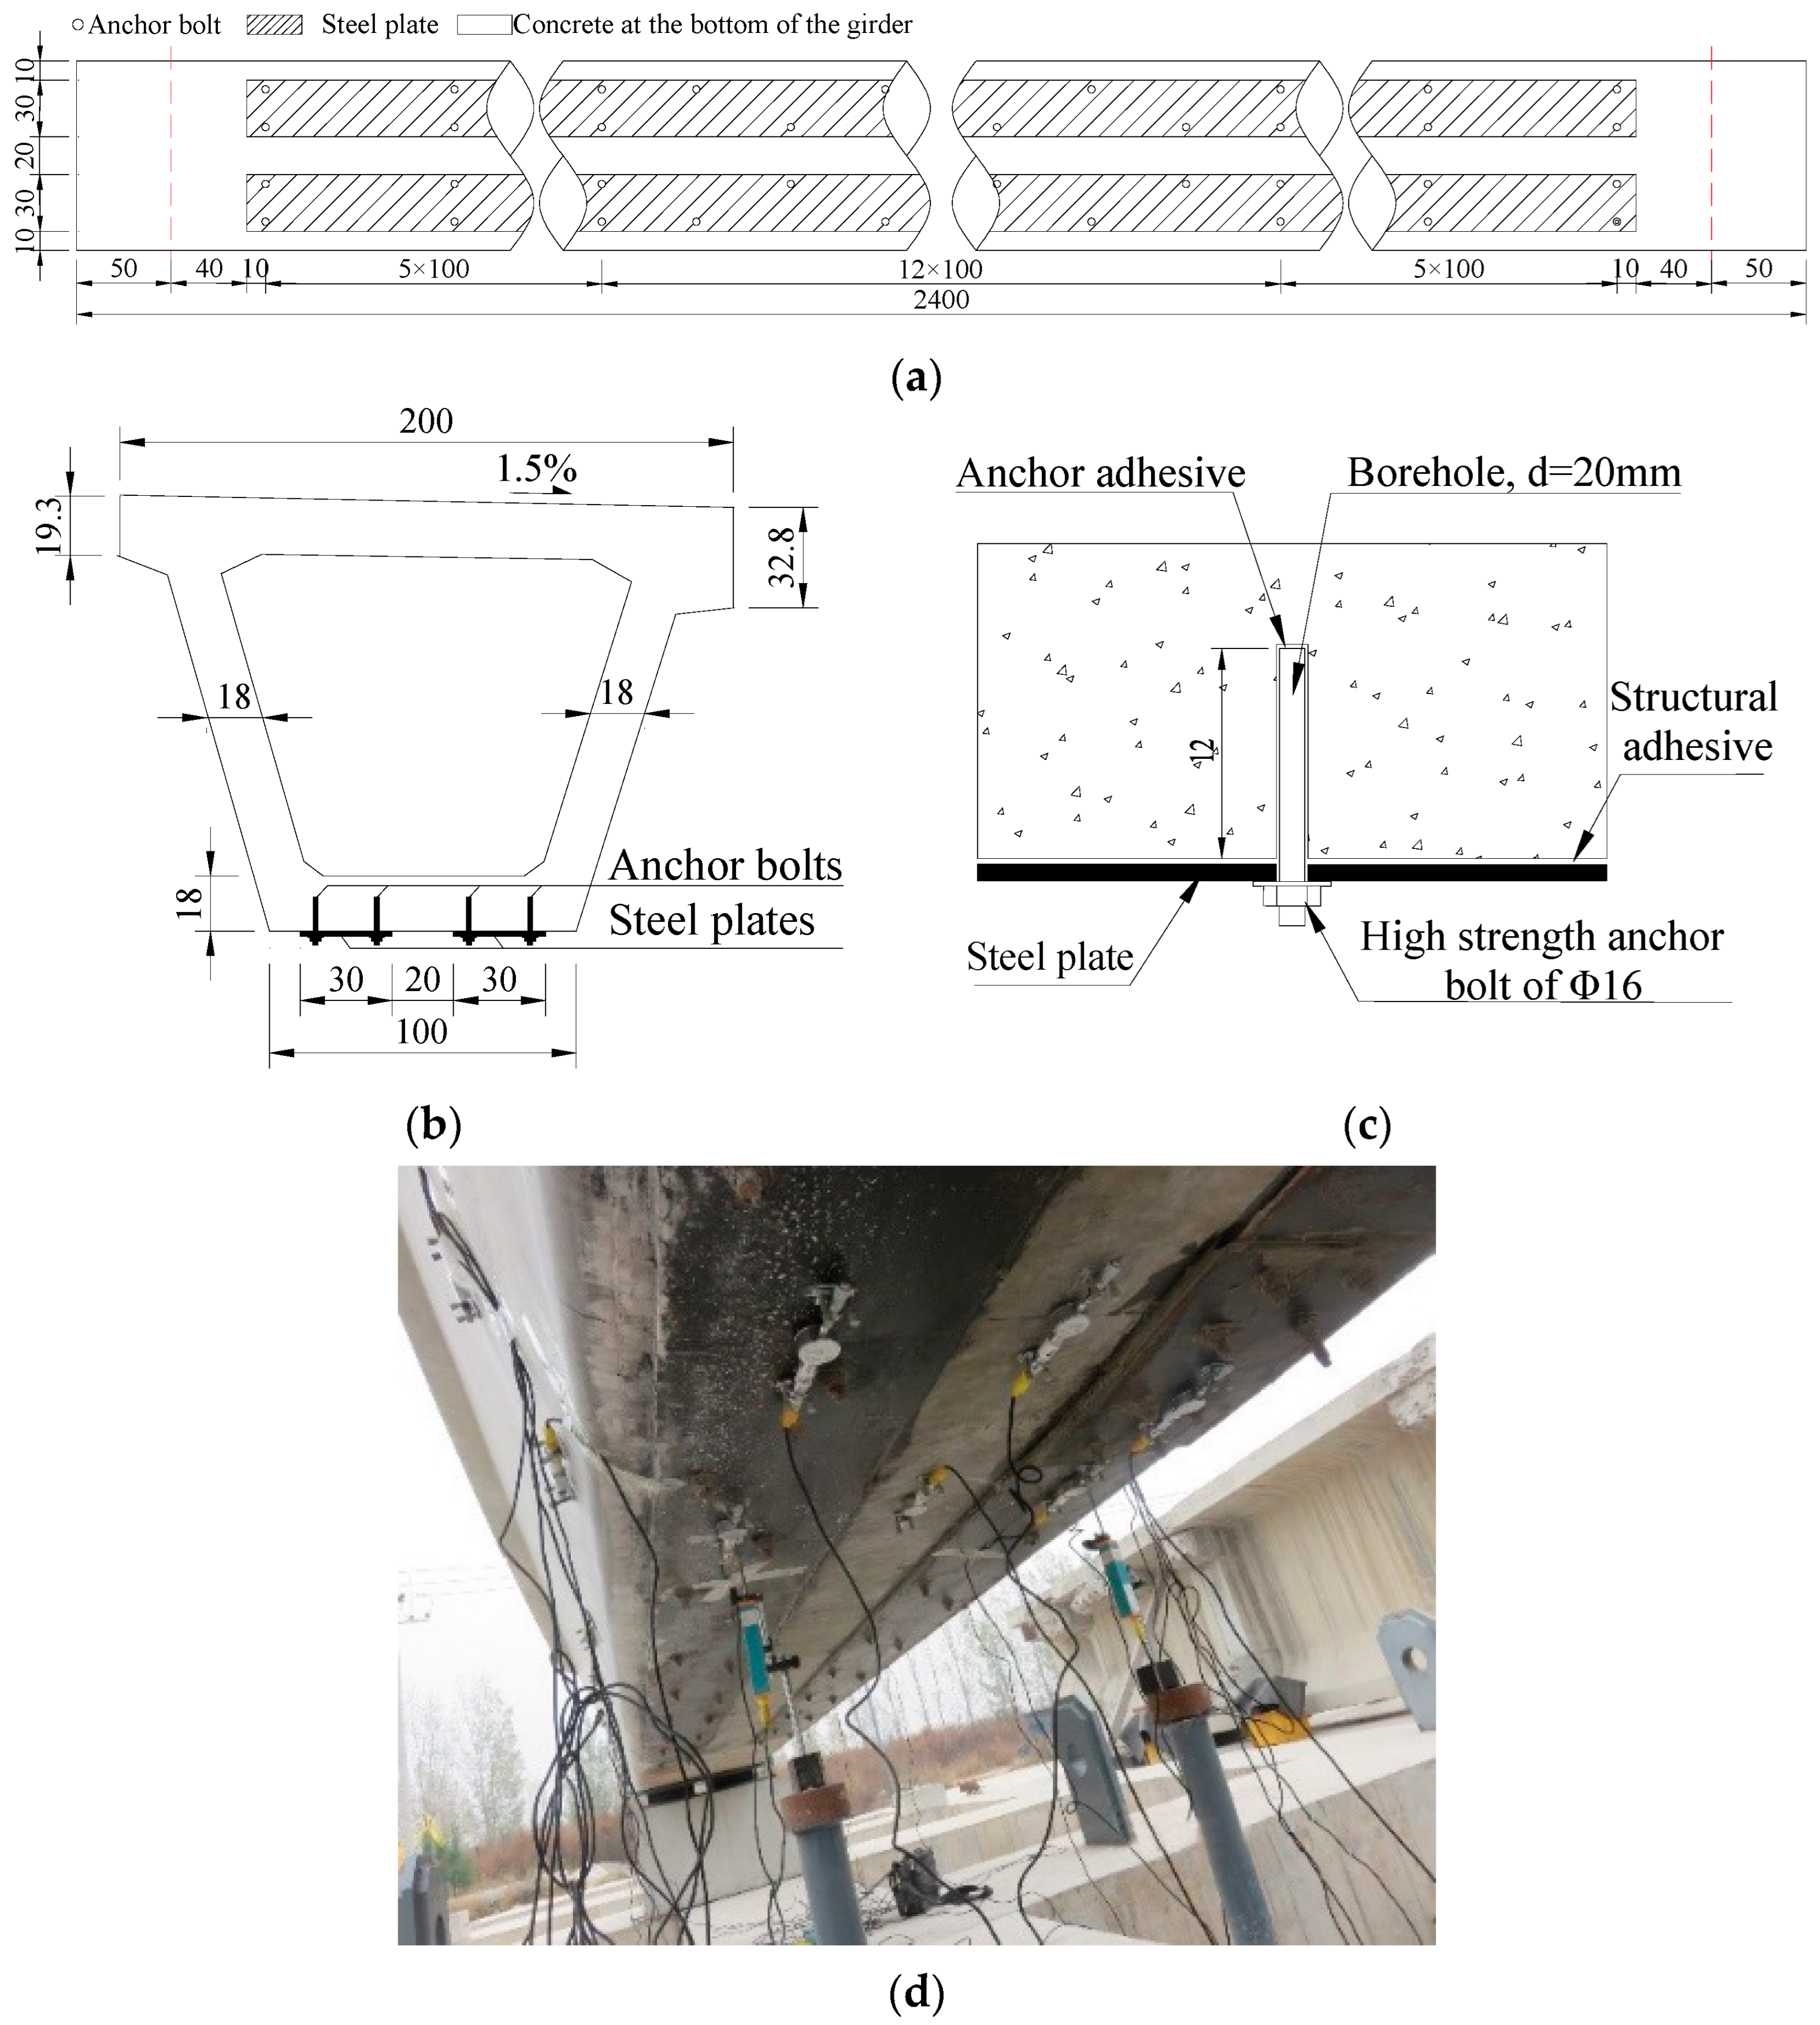
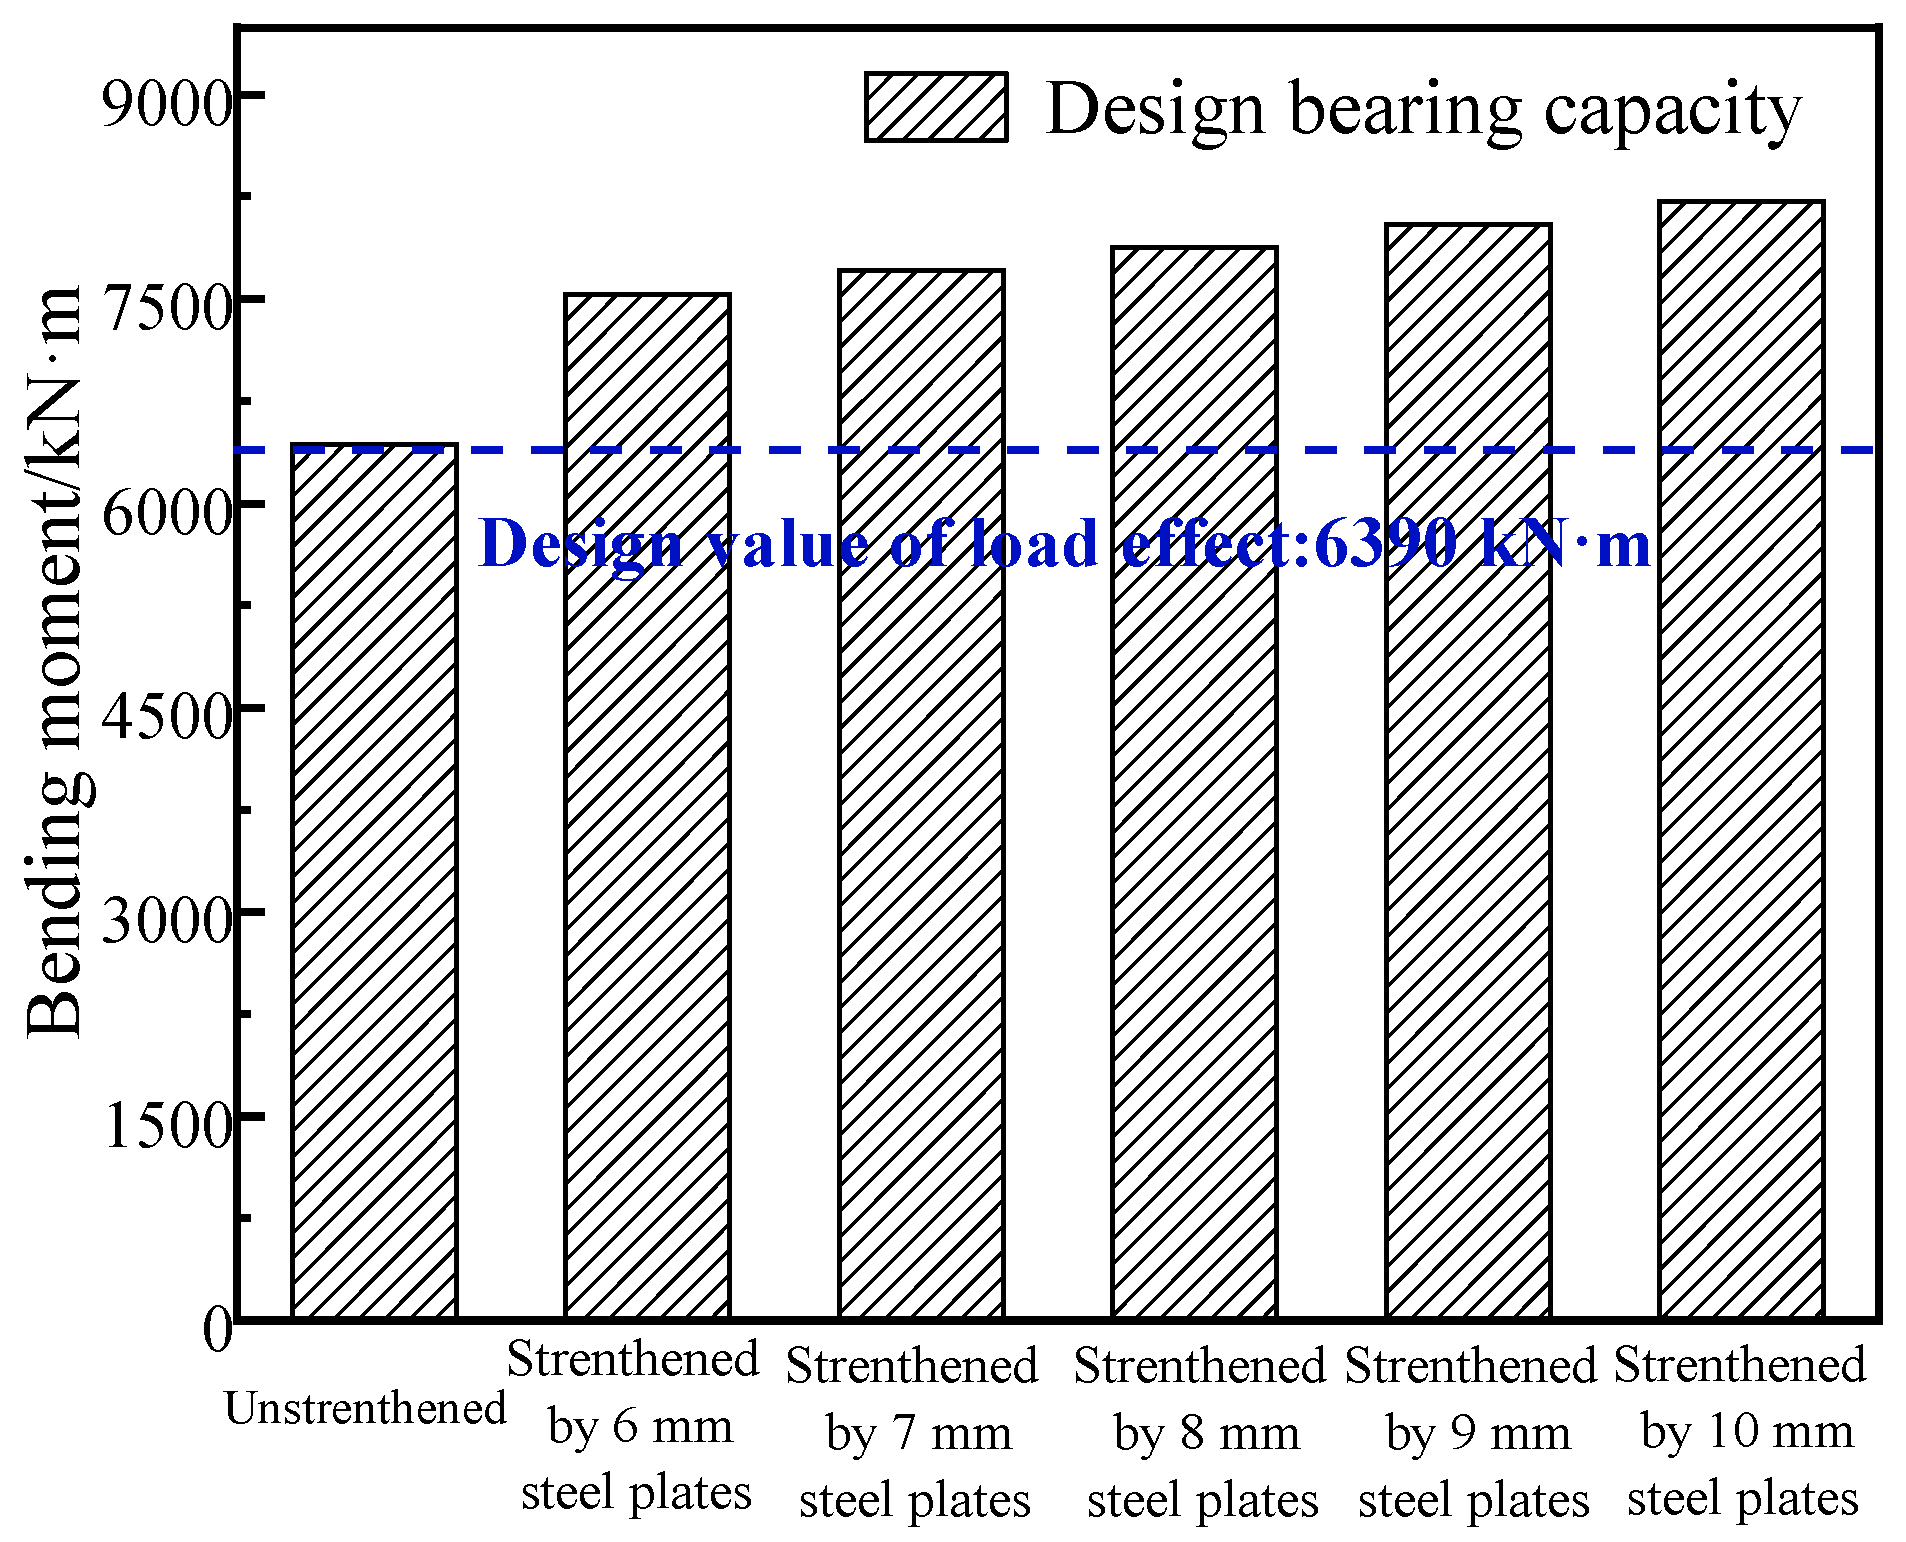
3.3. Strengthening Scheme of the Repaired Girder
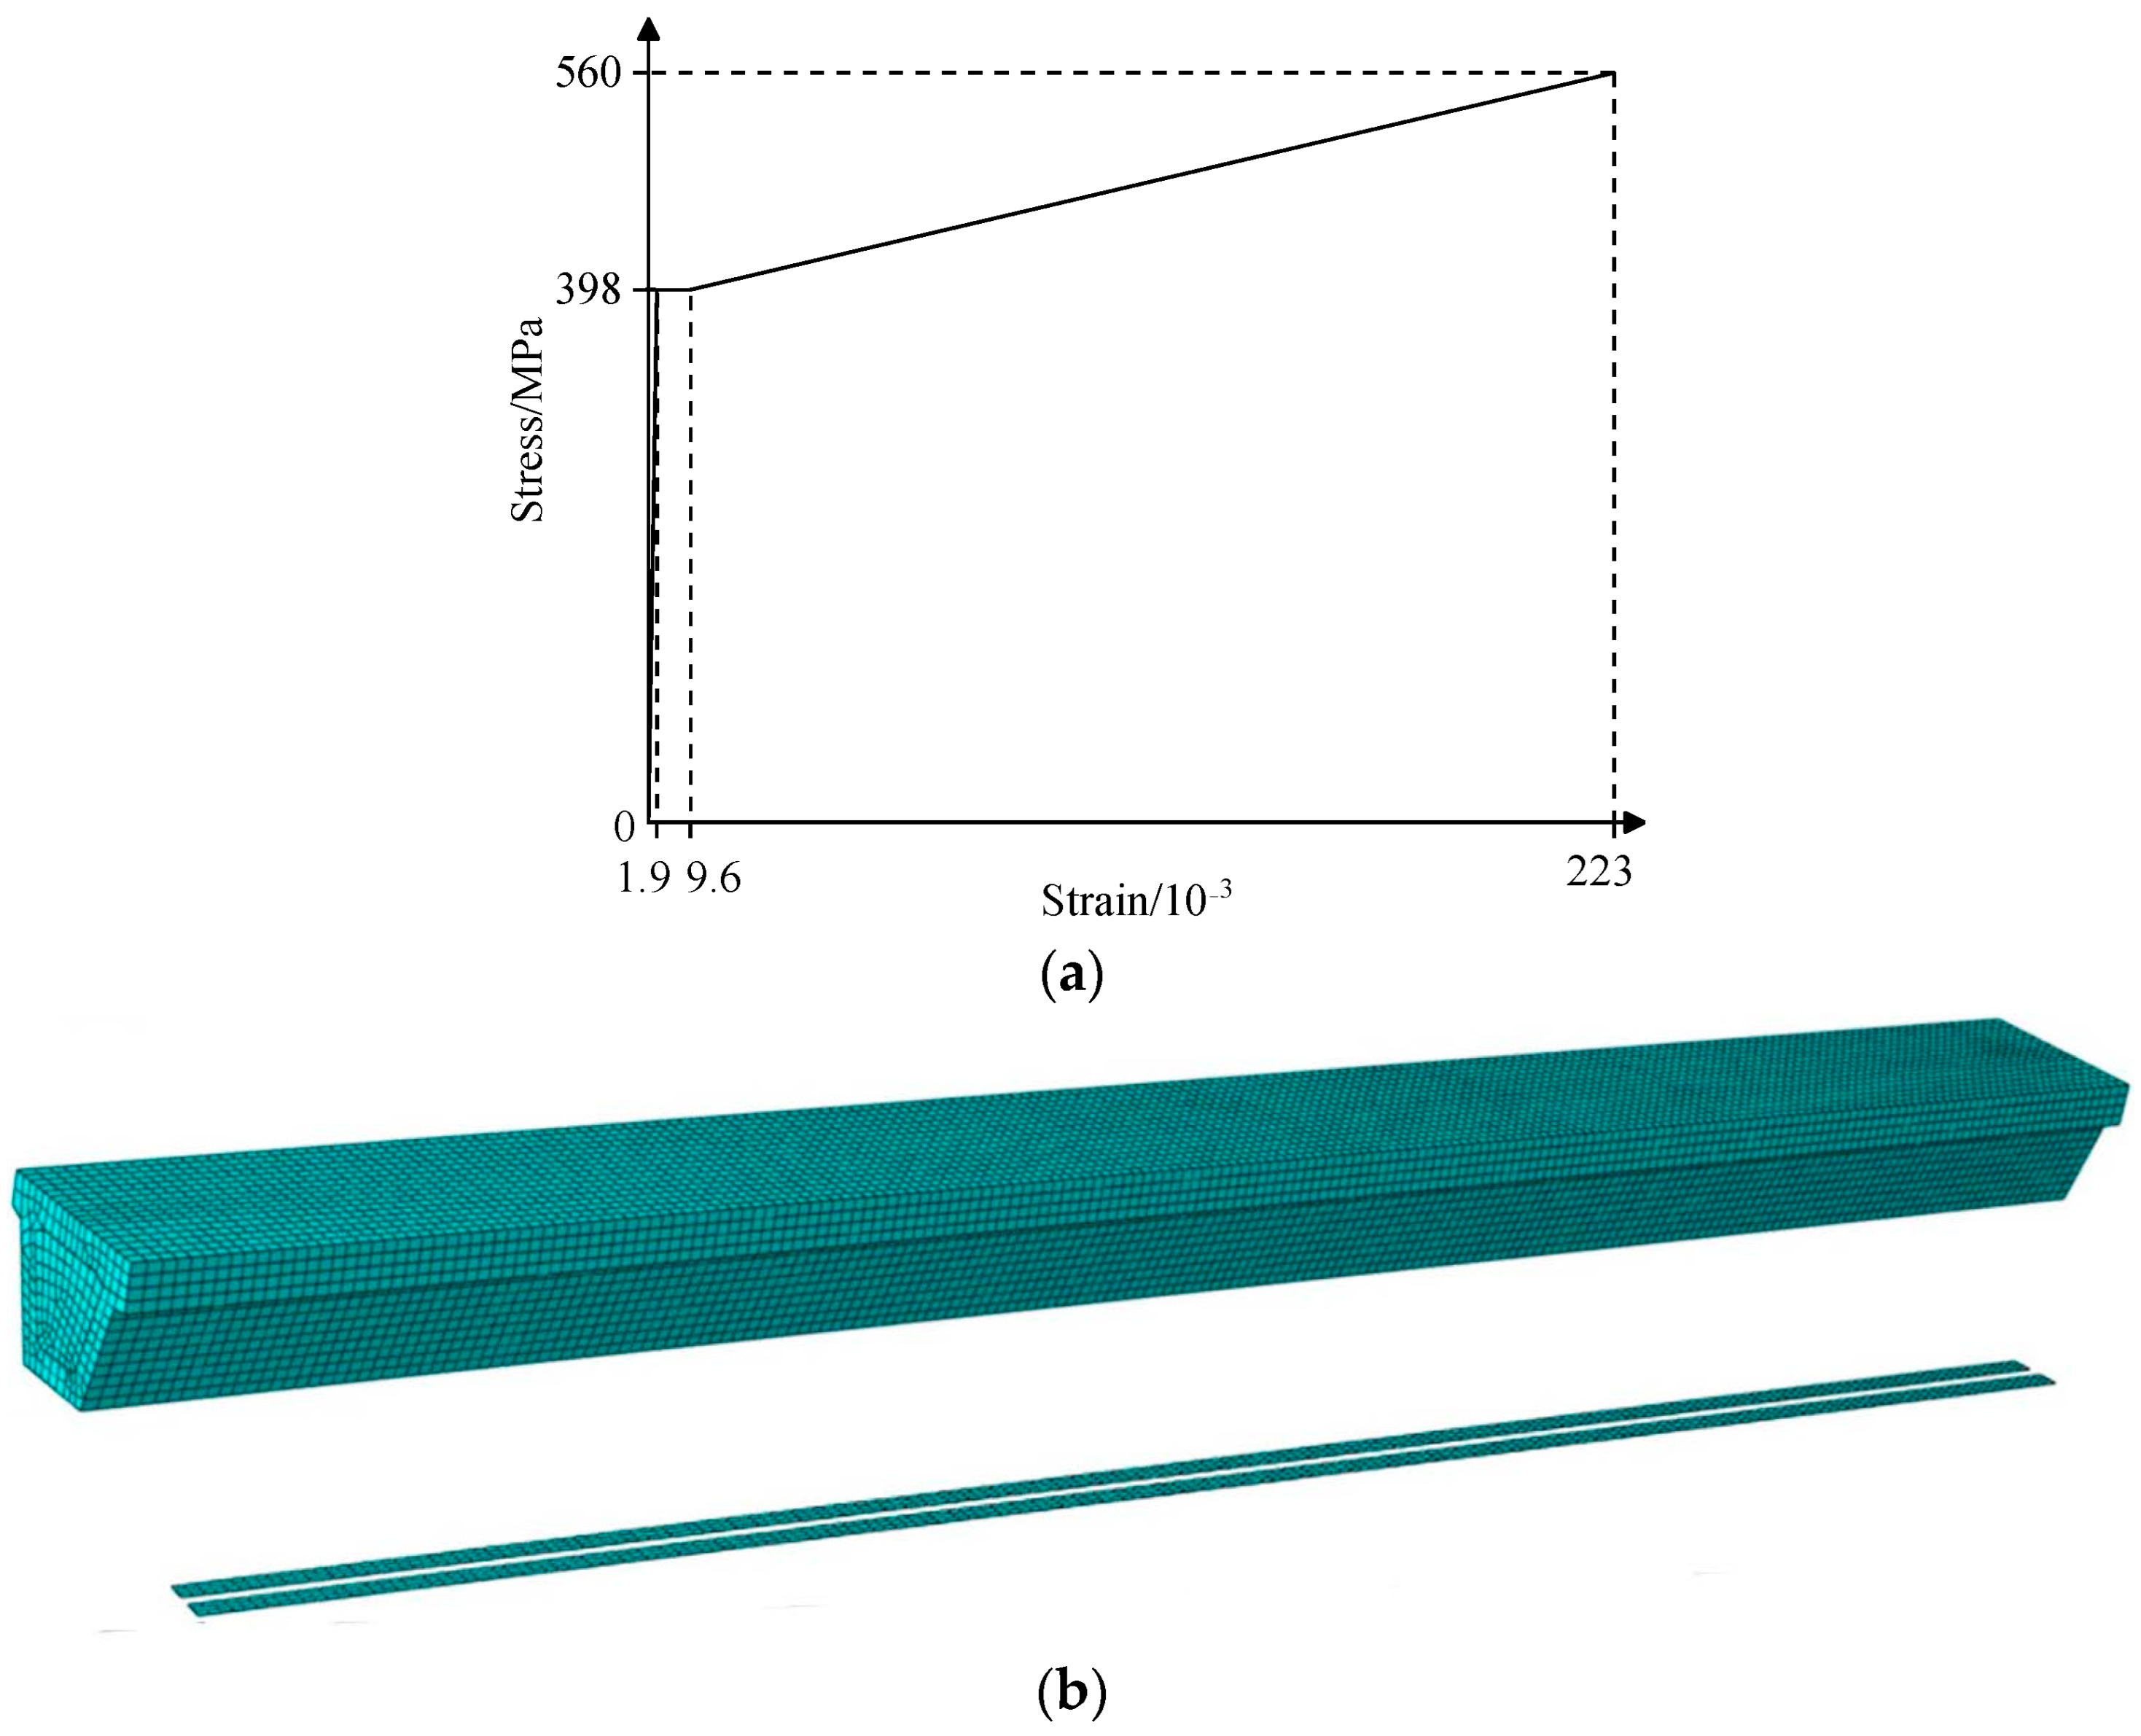
4. The Refined Finite Element Analysis
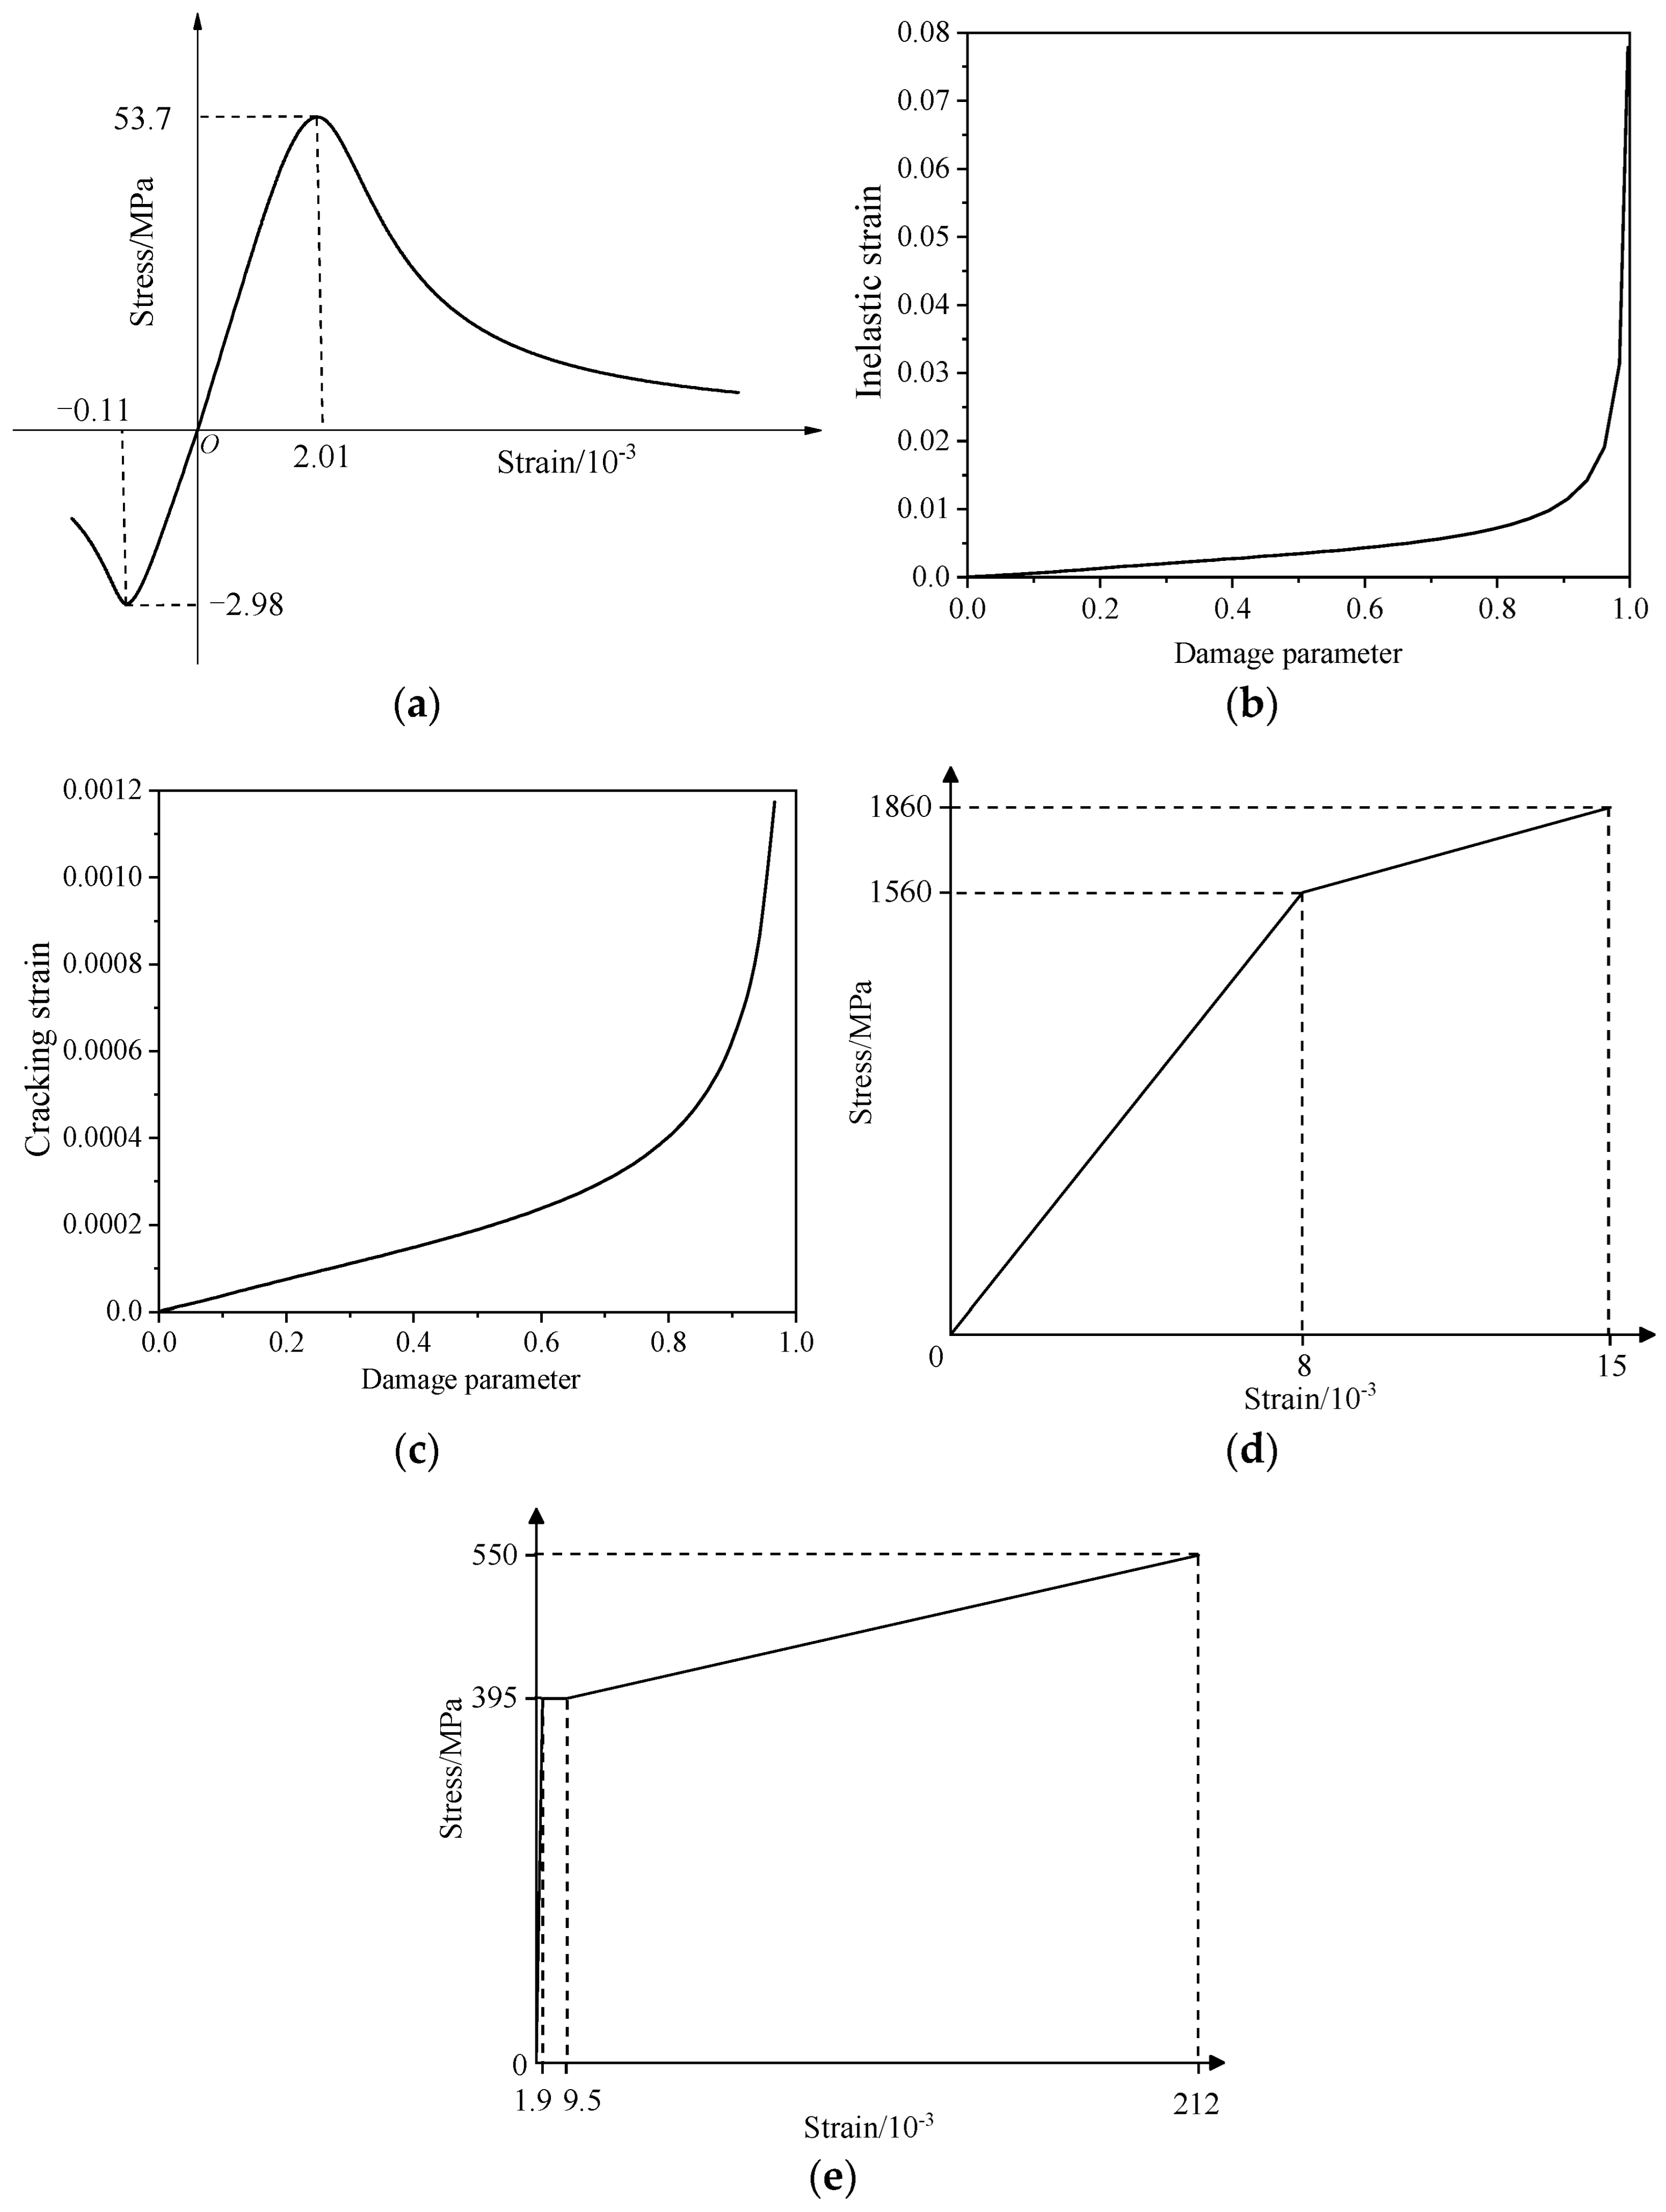
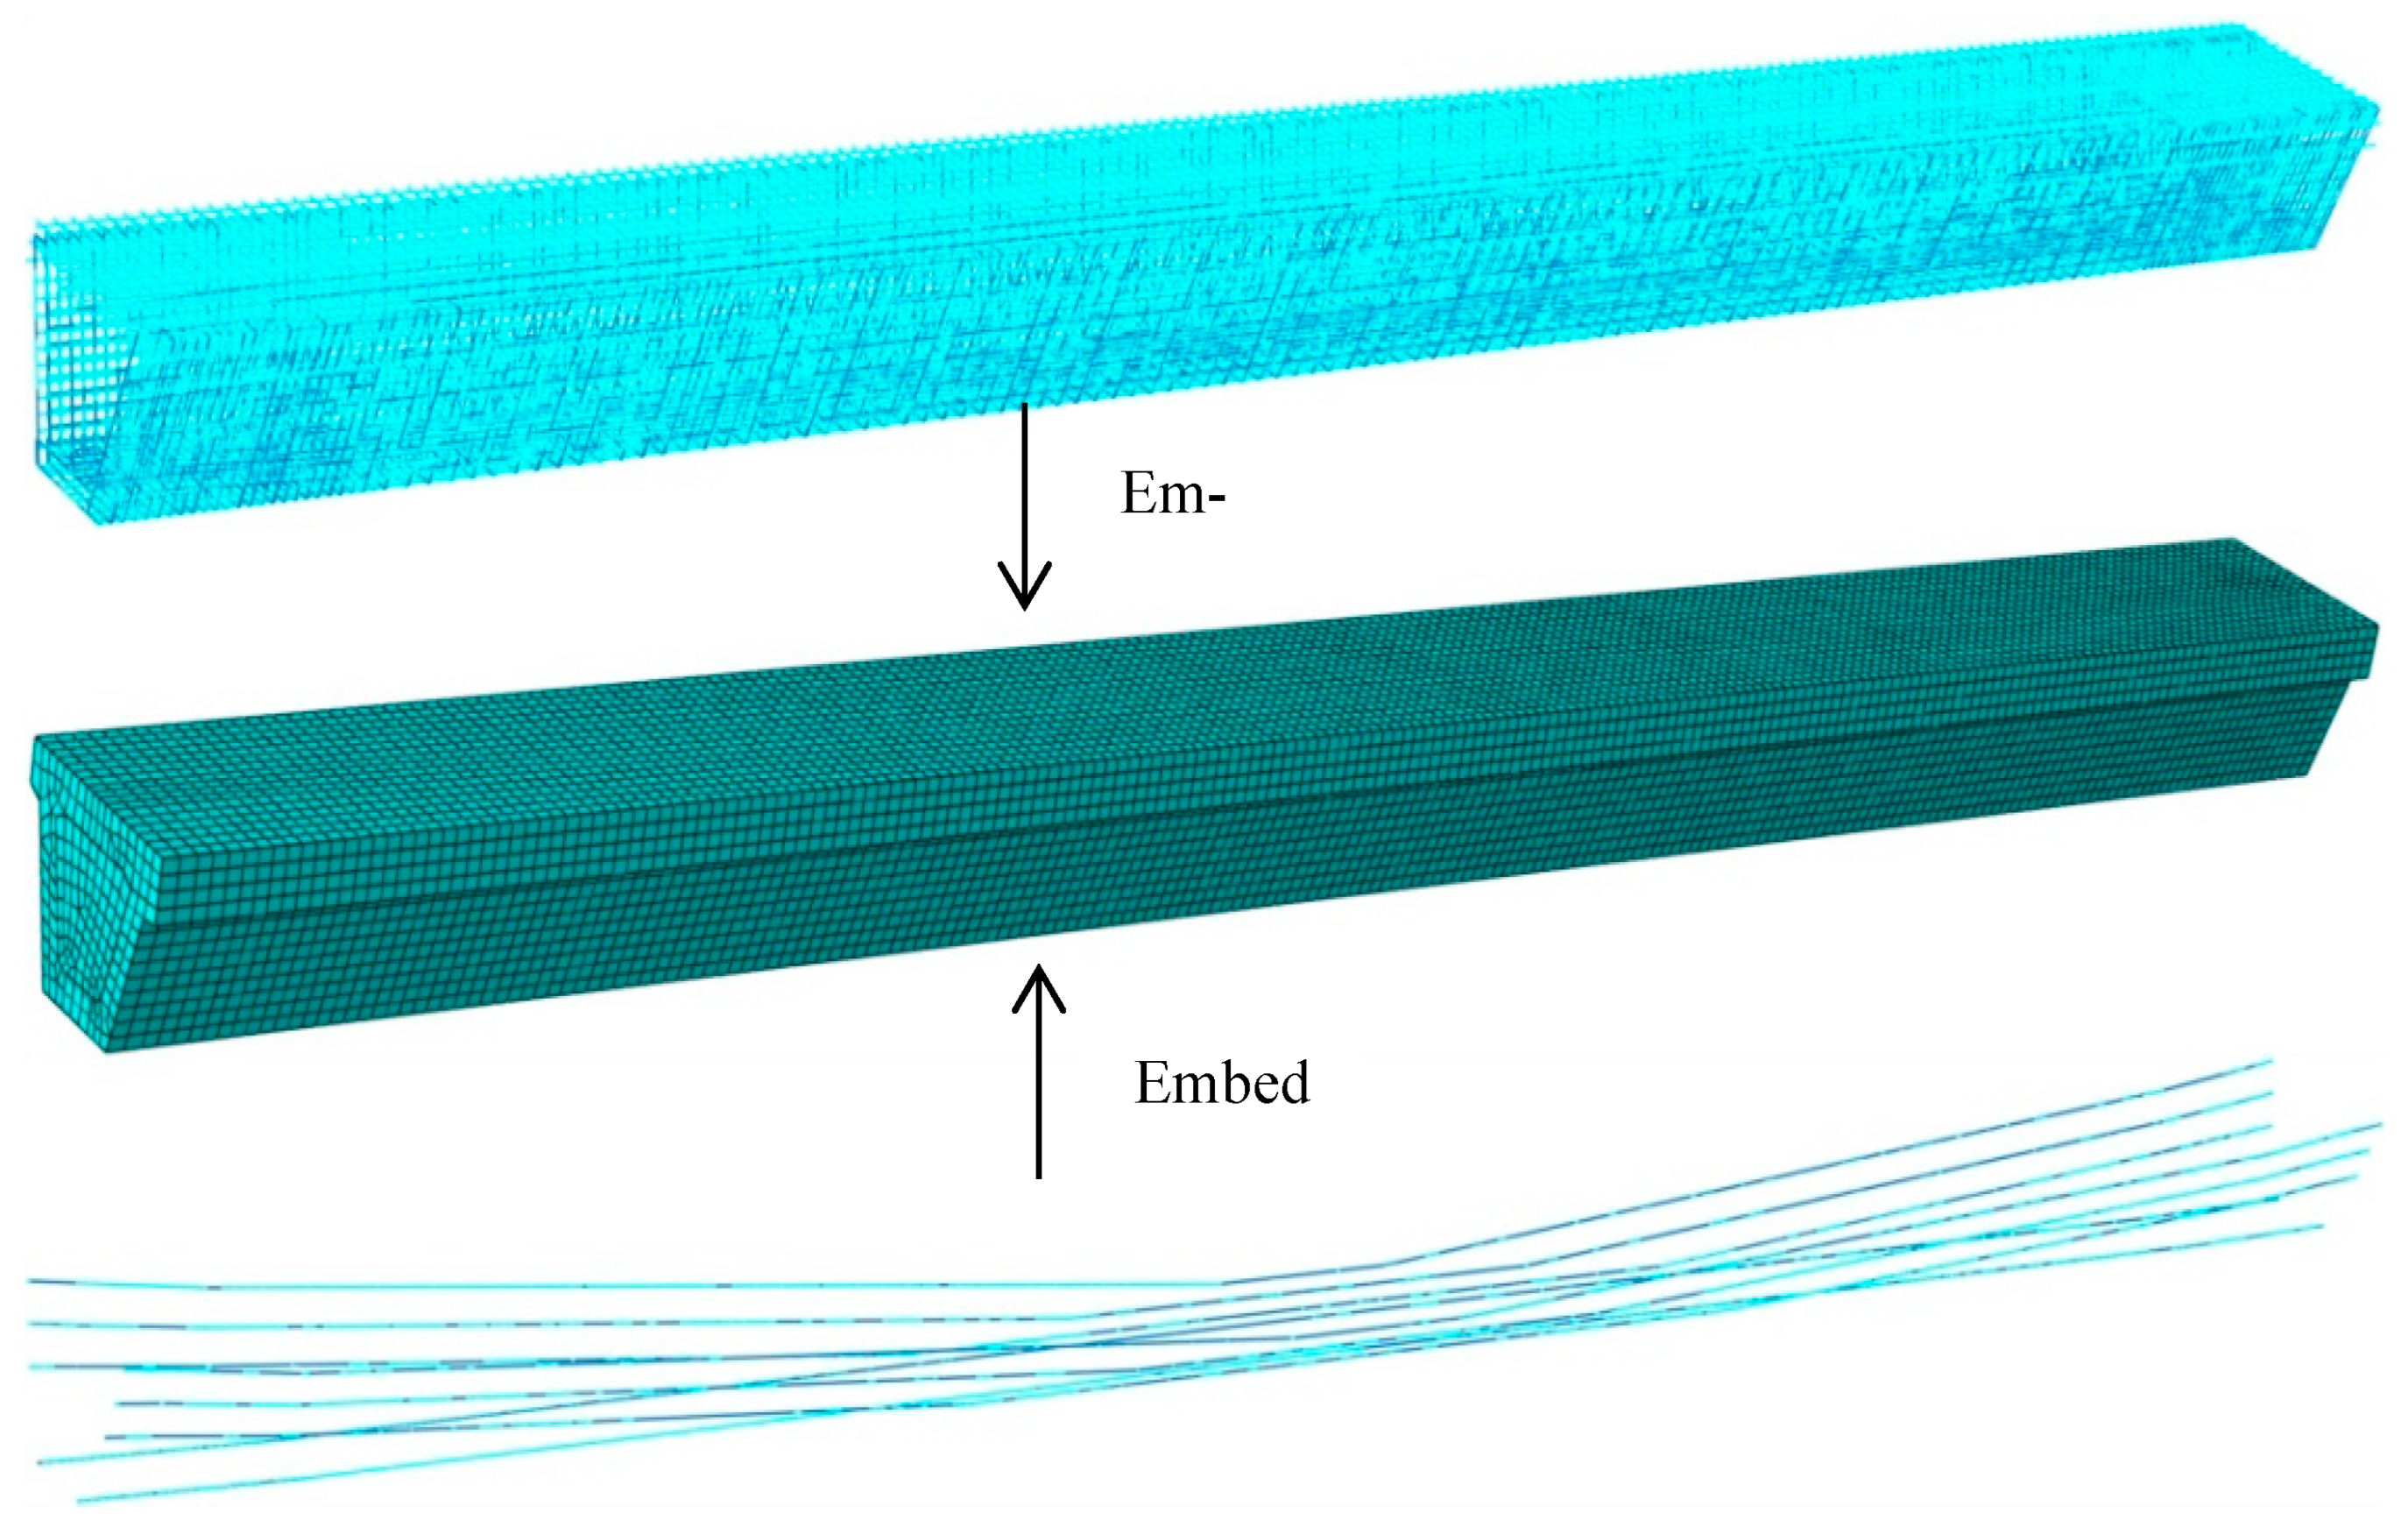
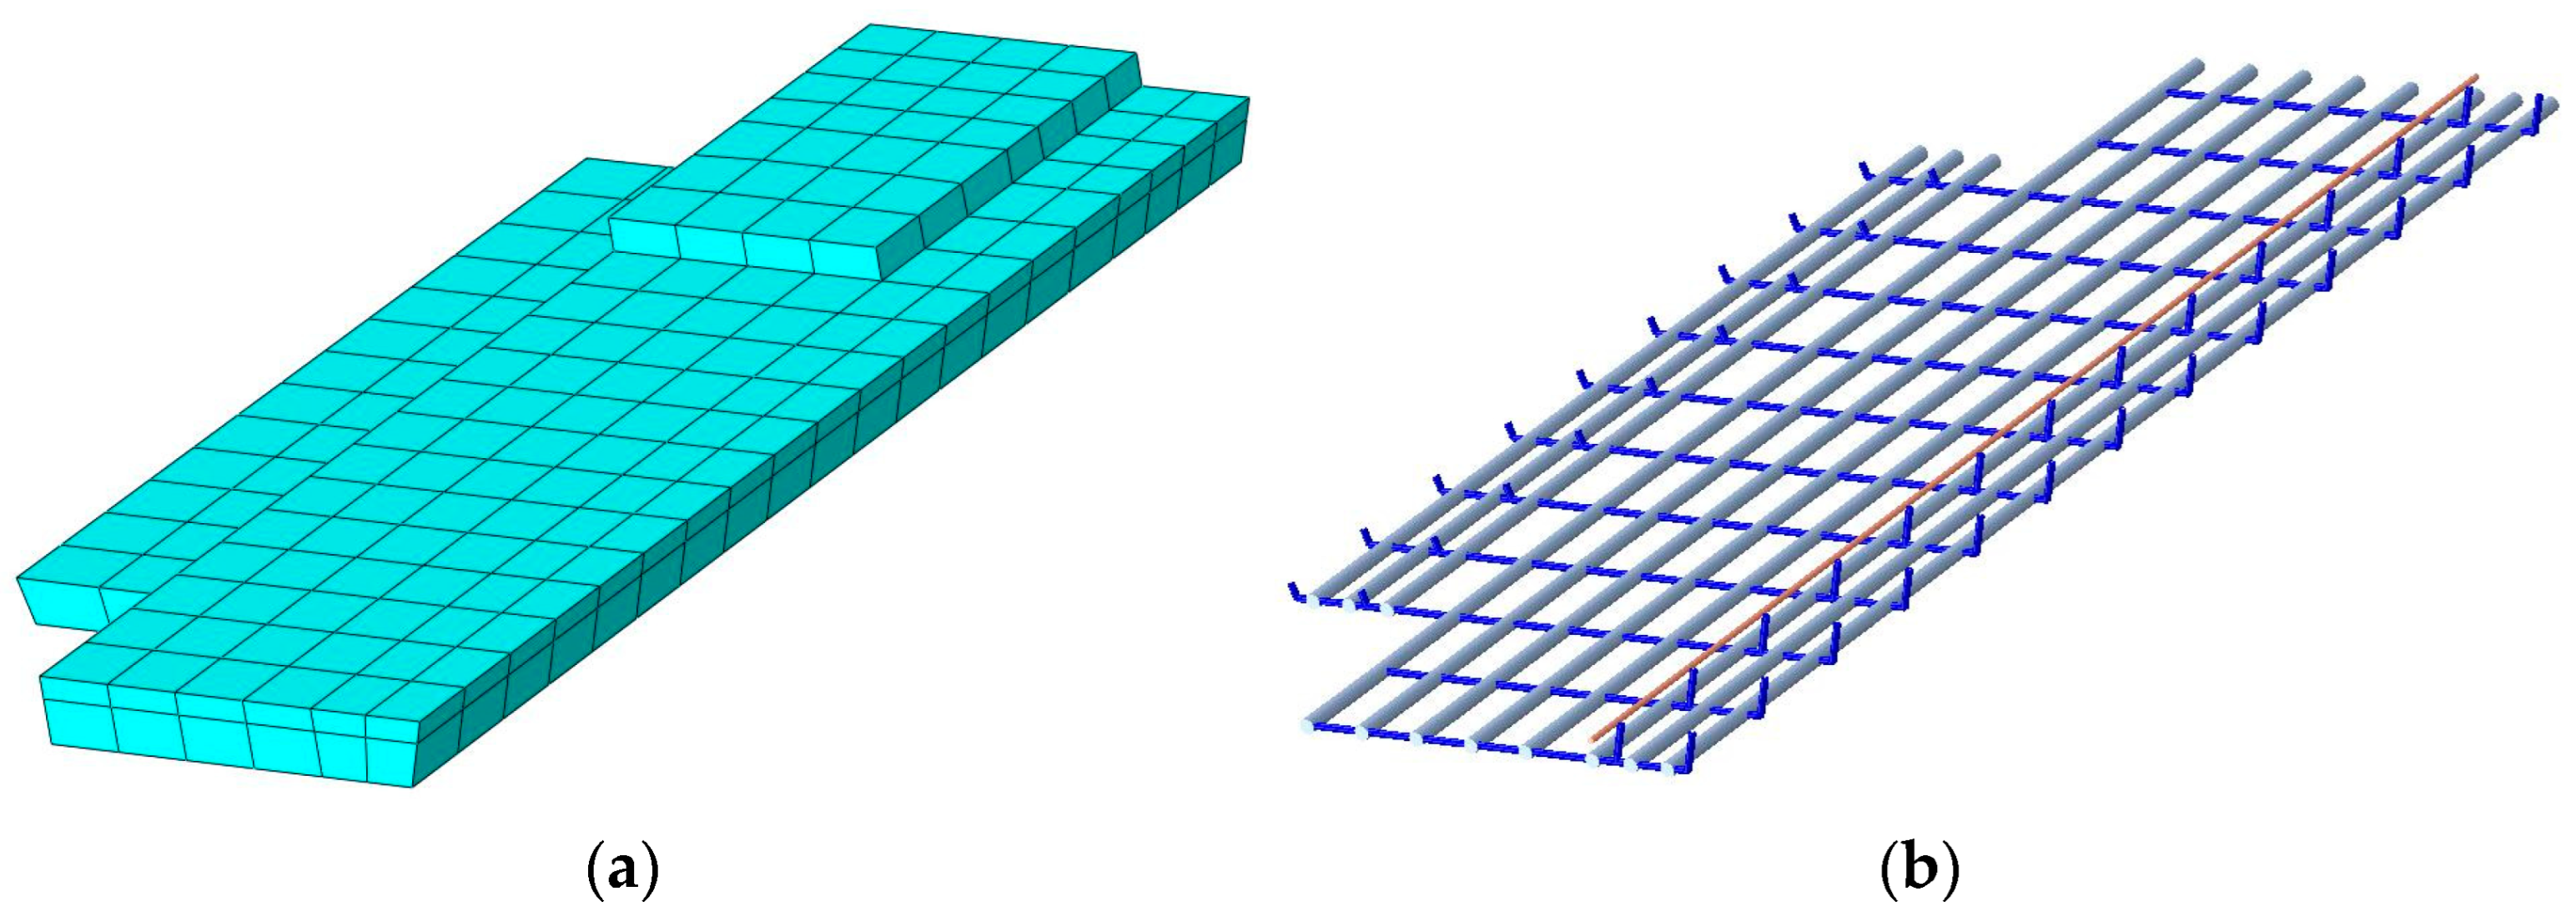
4.1. Establishment of the Model of the Undamaged #3-2 Girder
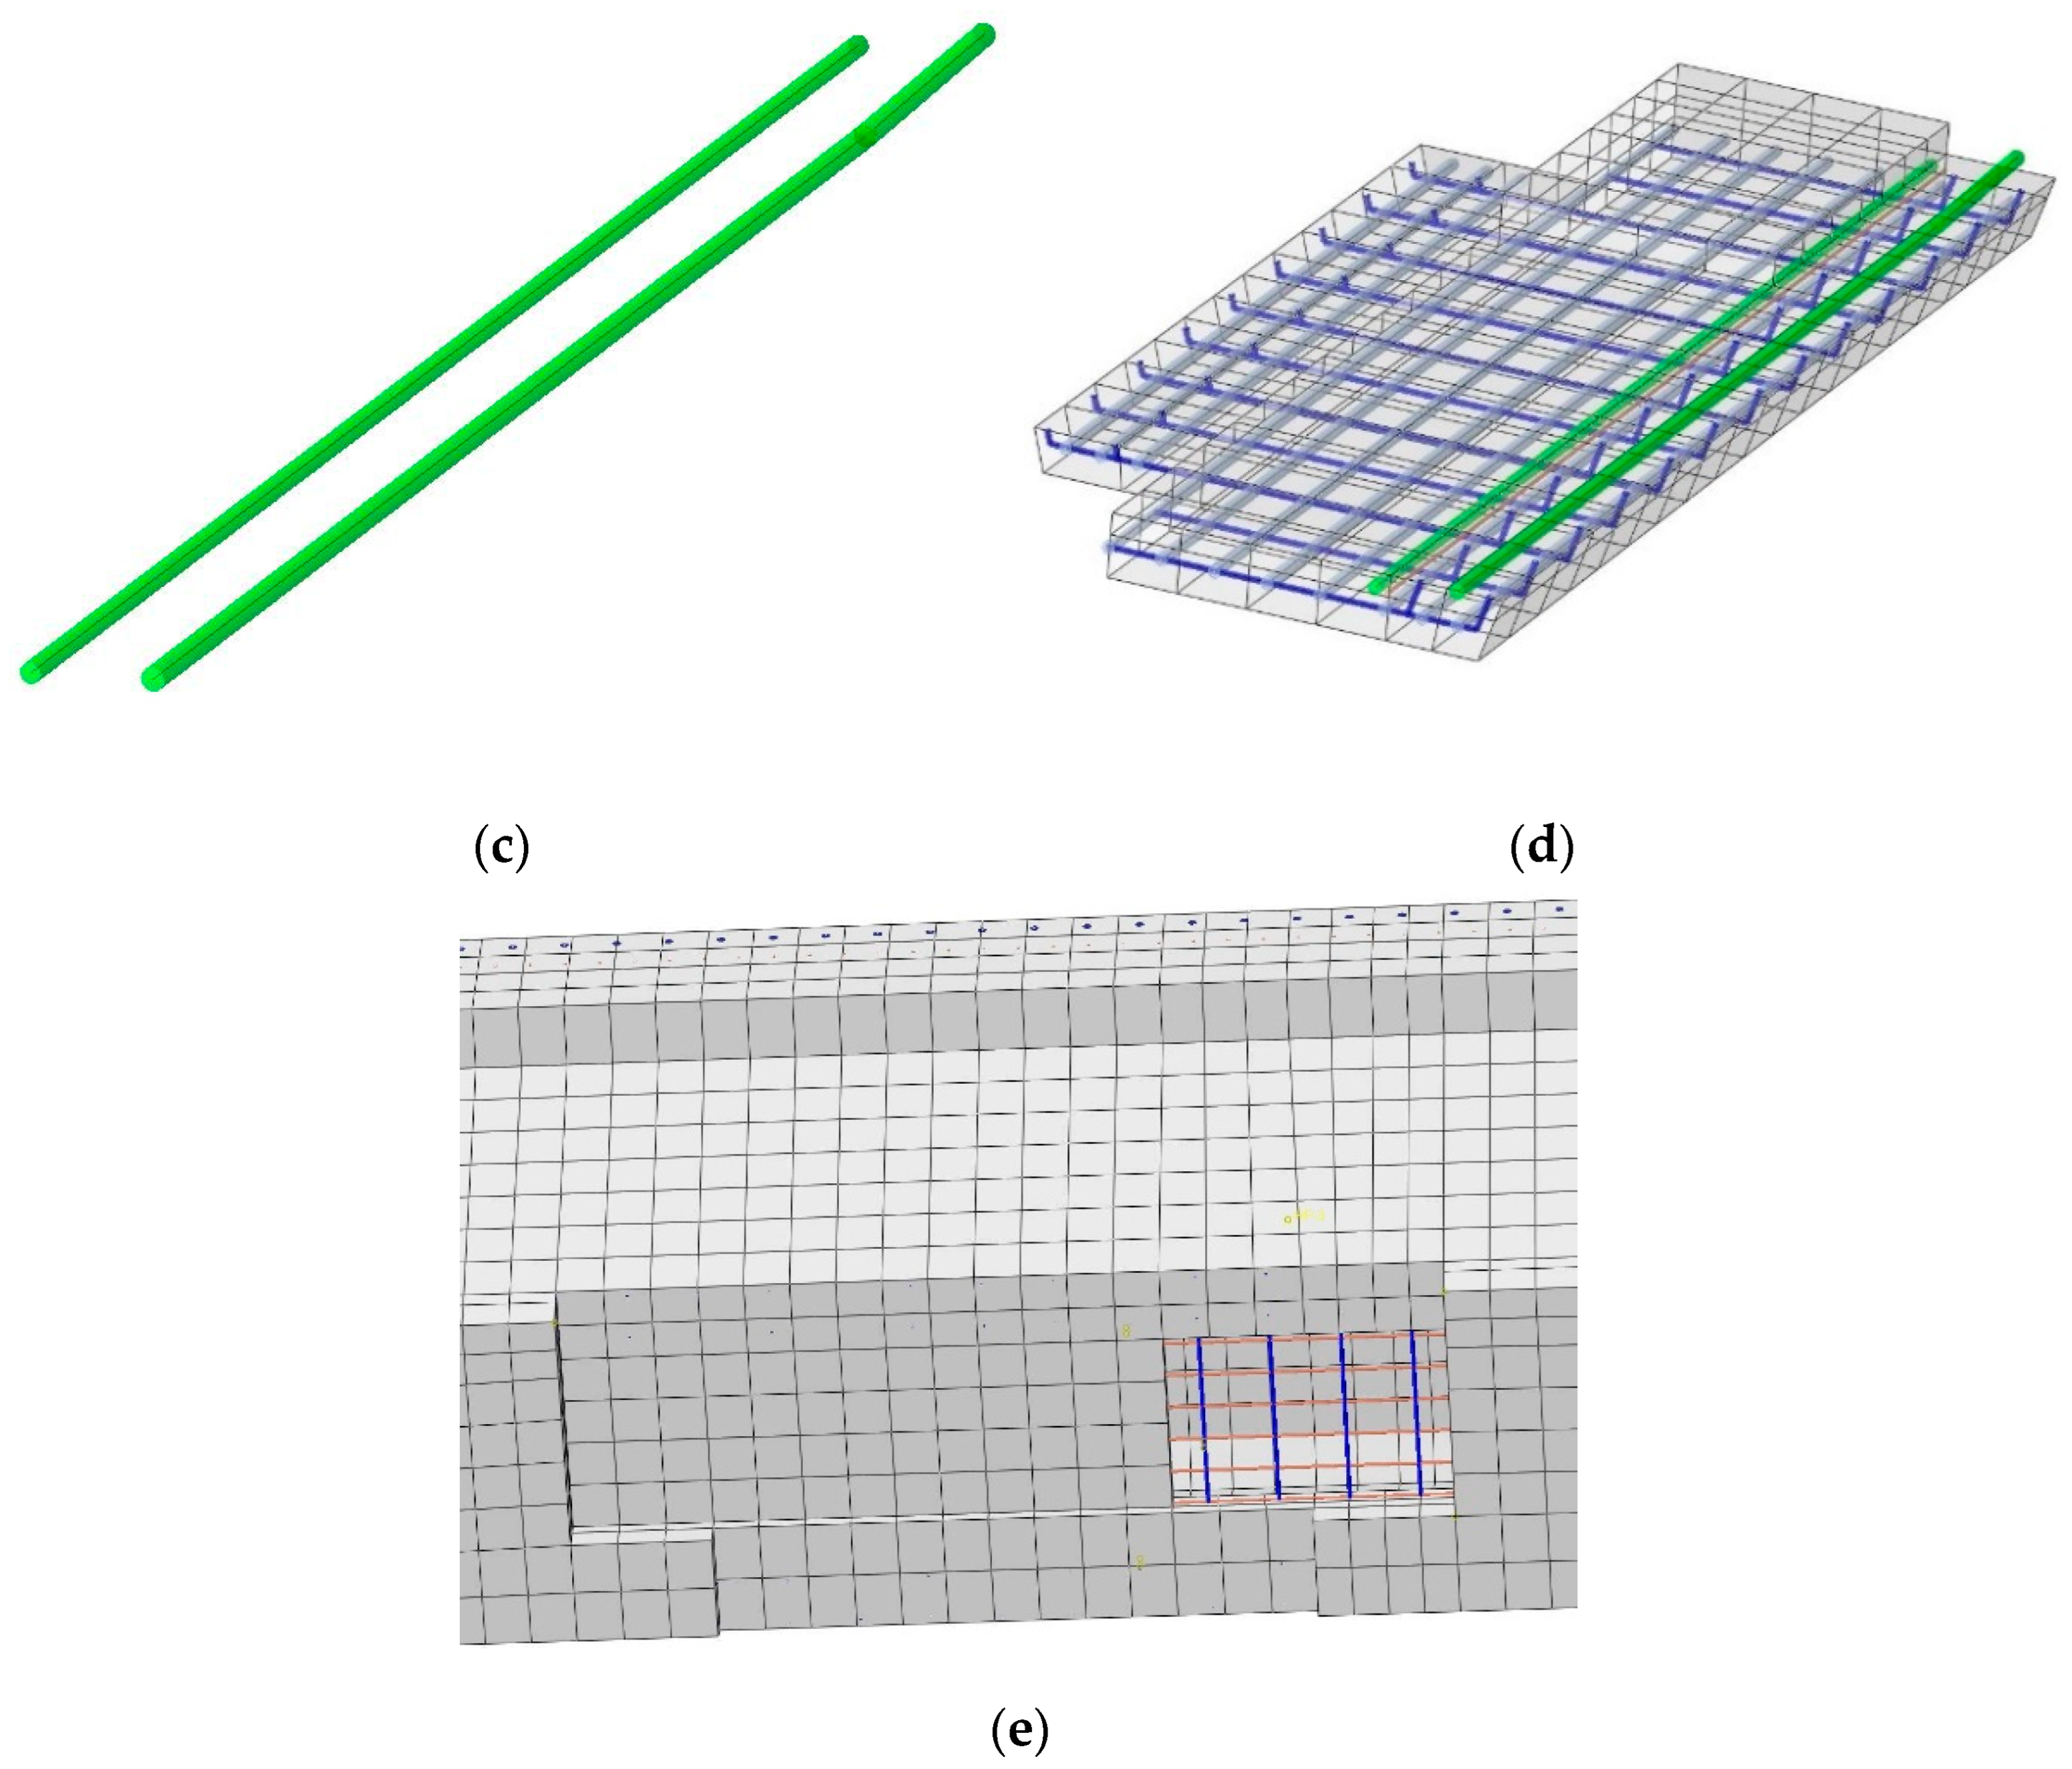
4.2. Establishment of the Refined Model of the Repaired #3-2 Girder Strengthened by Steel Plates
4.3. Establishment of the Model of the Damaged #3-2 Girder
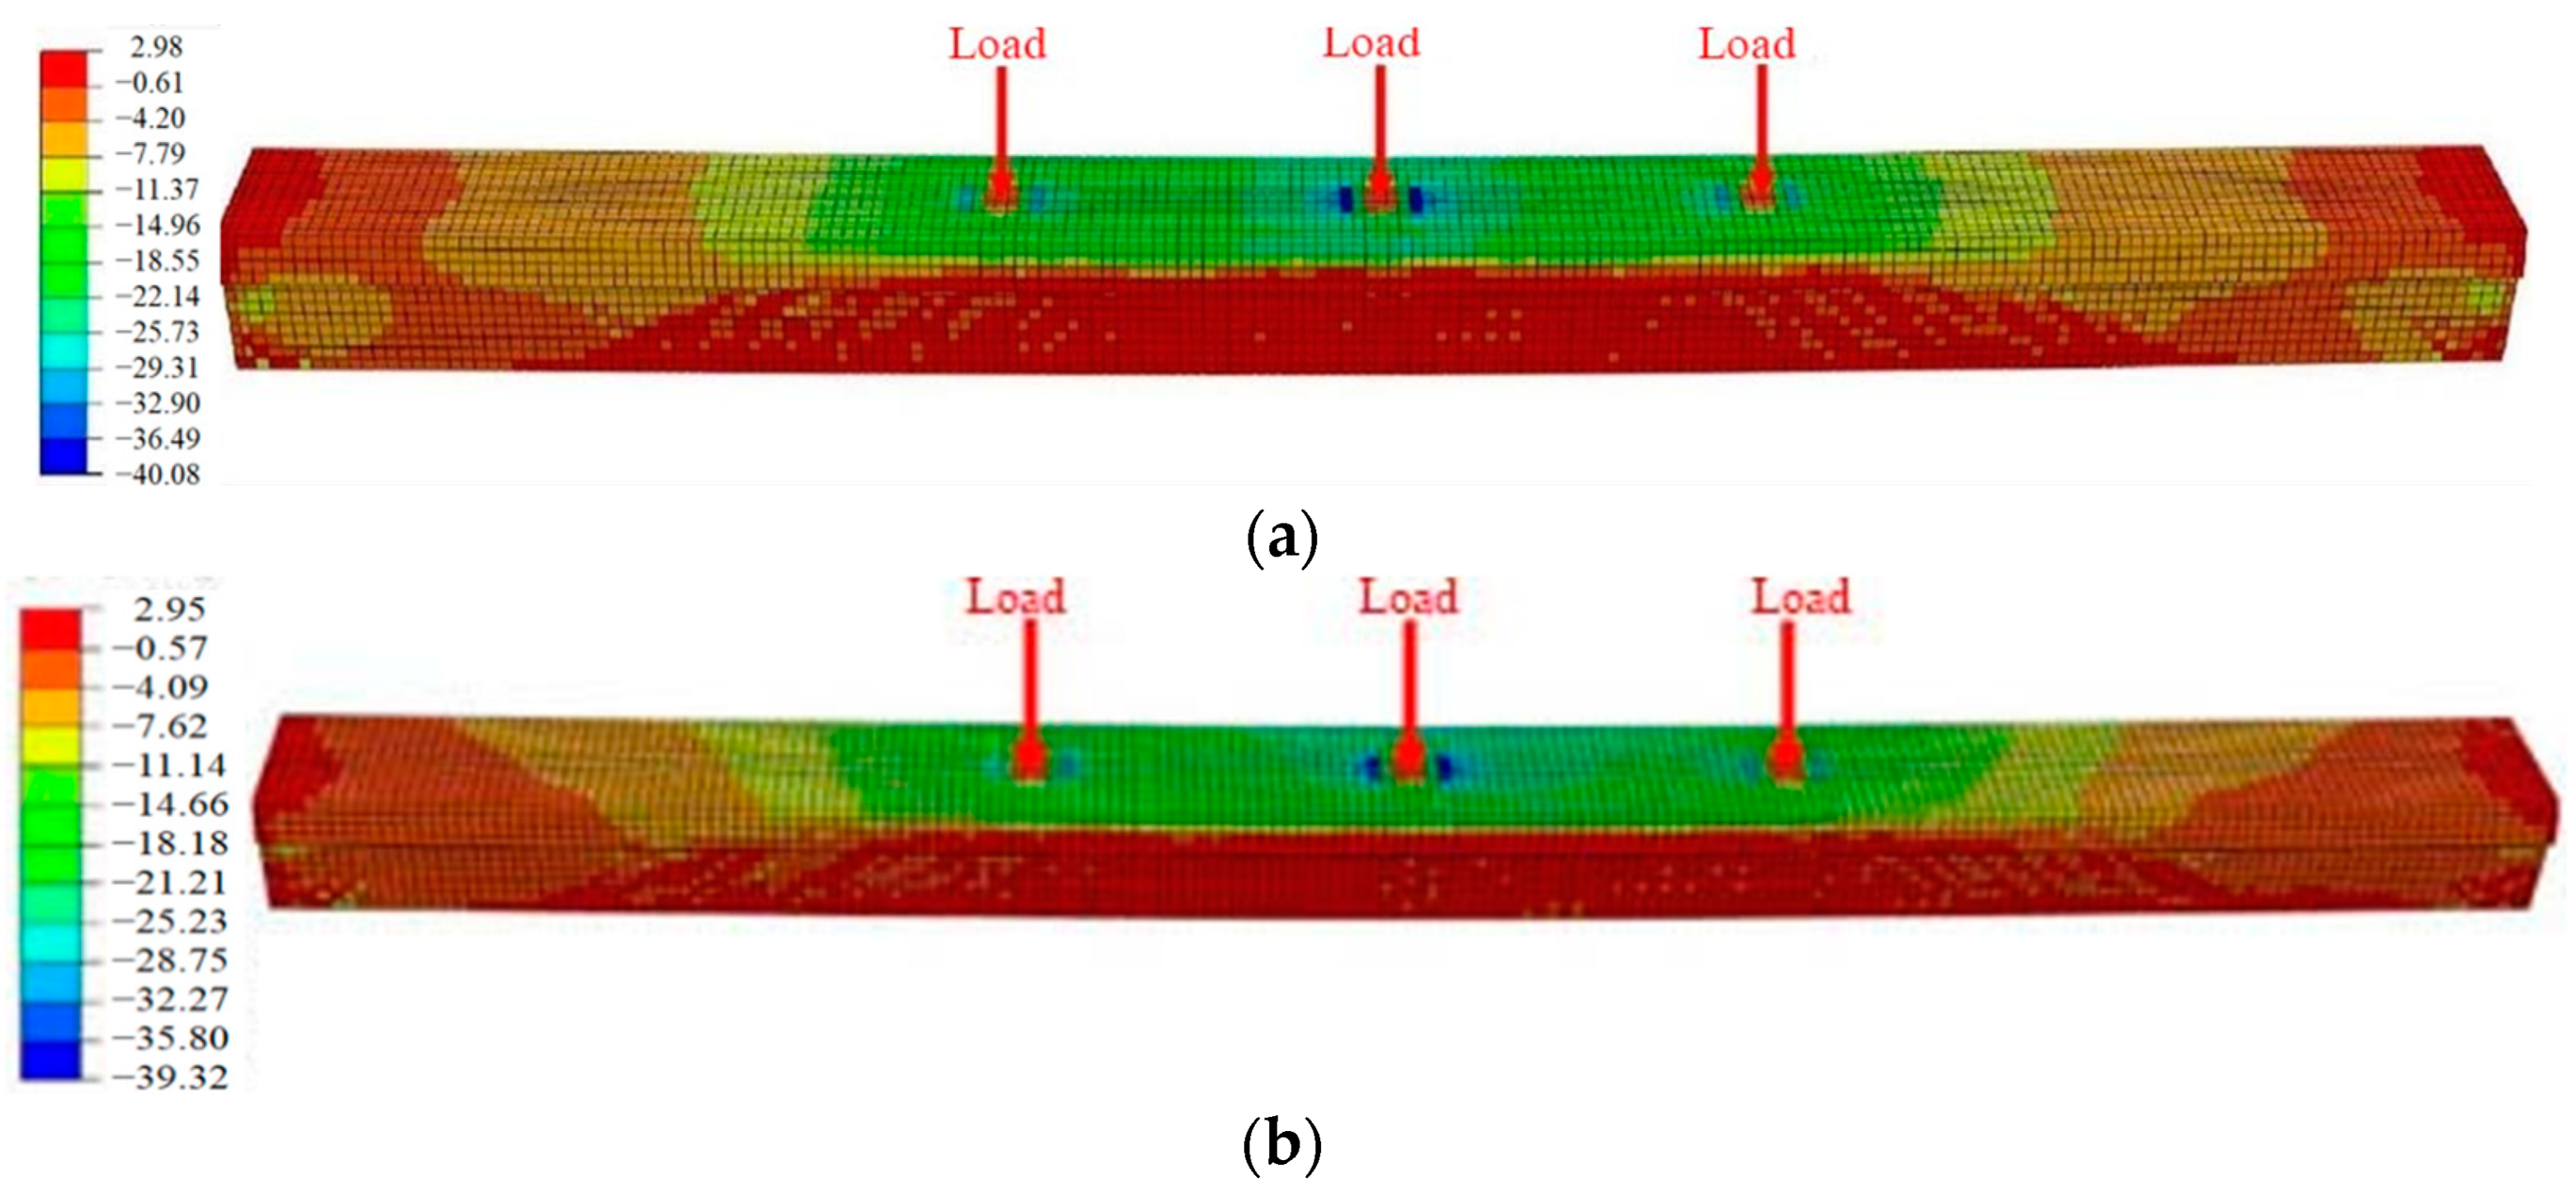
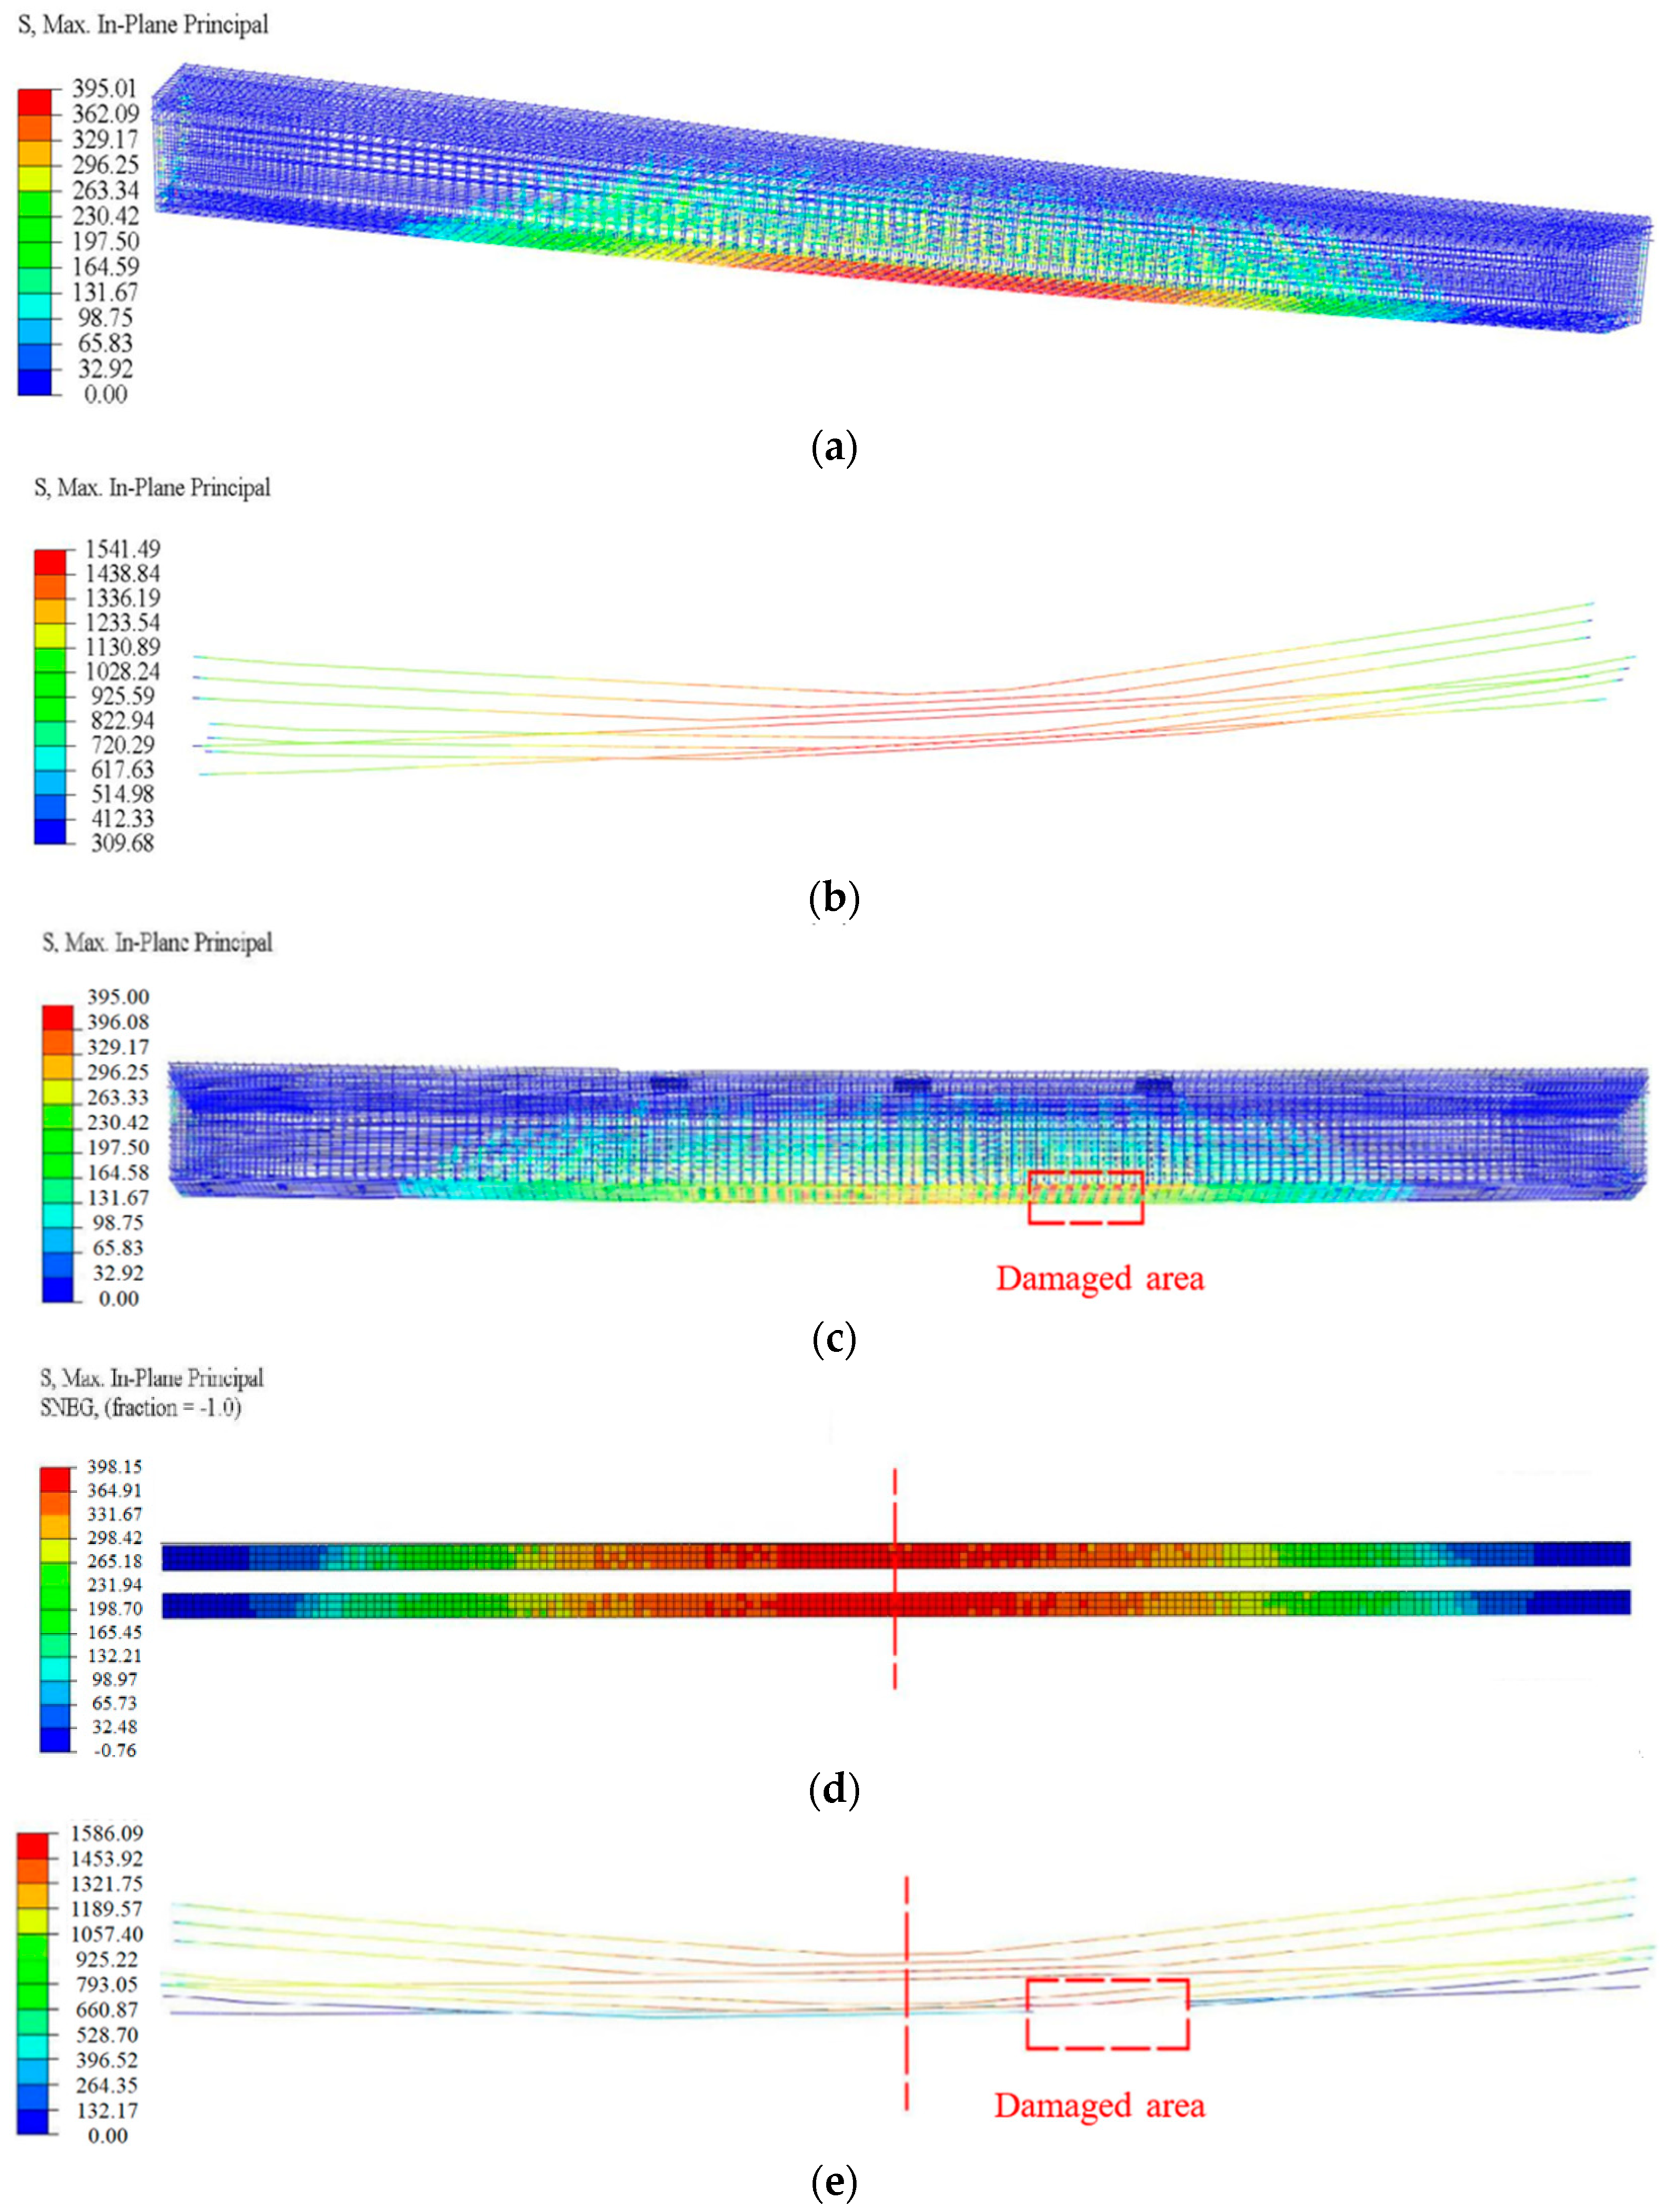
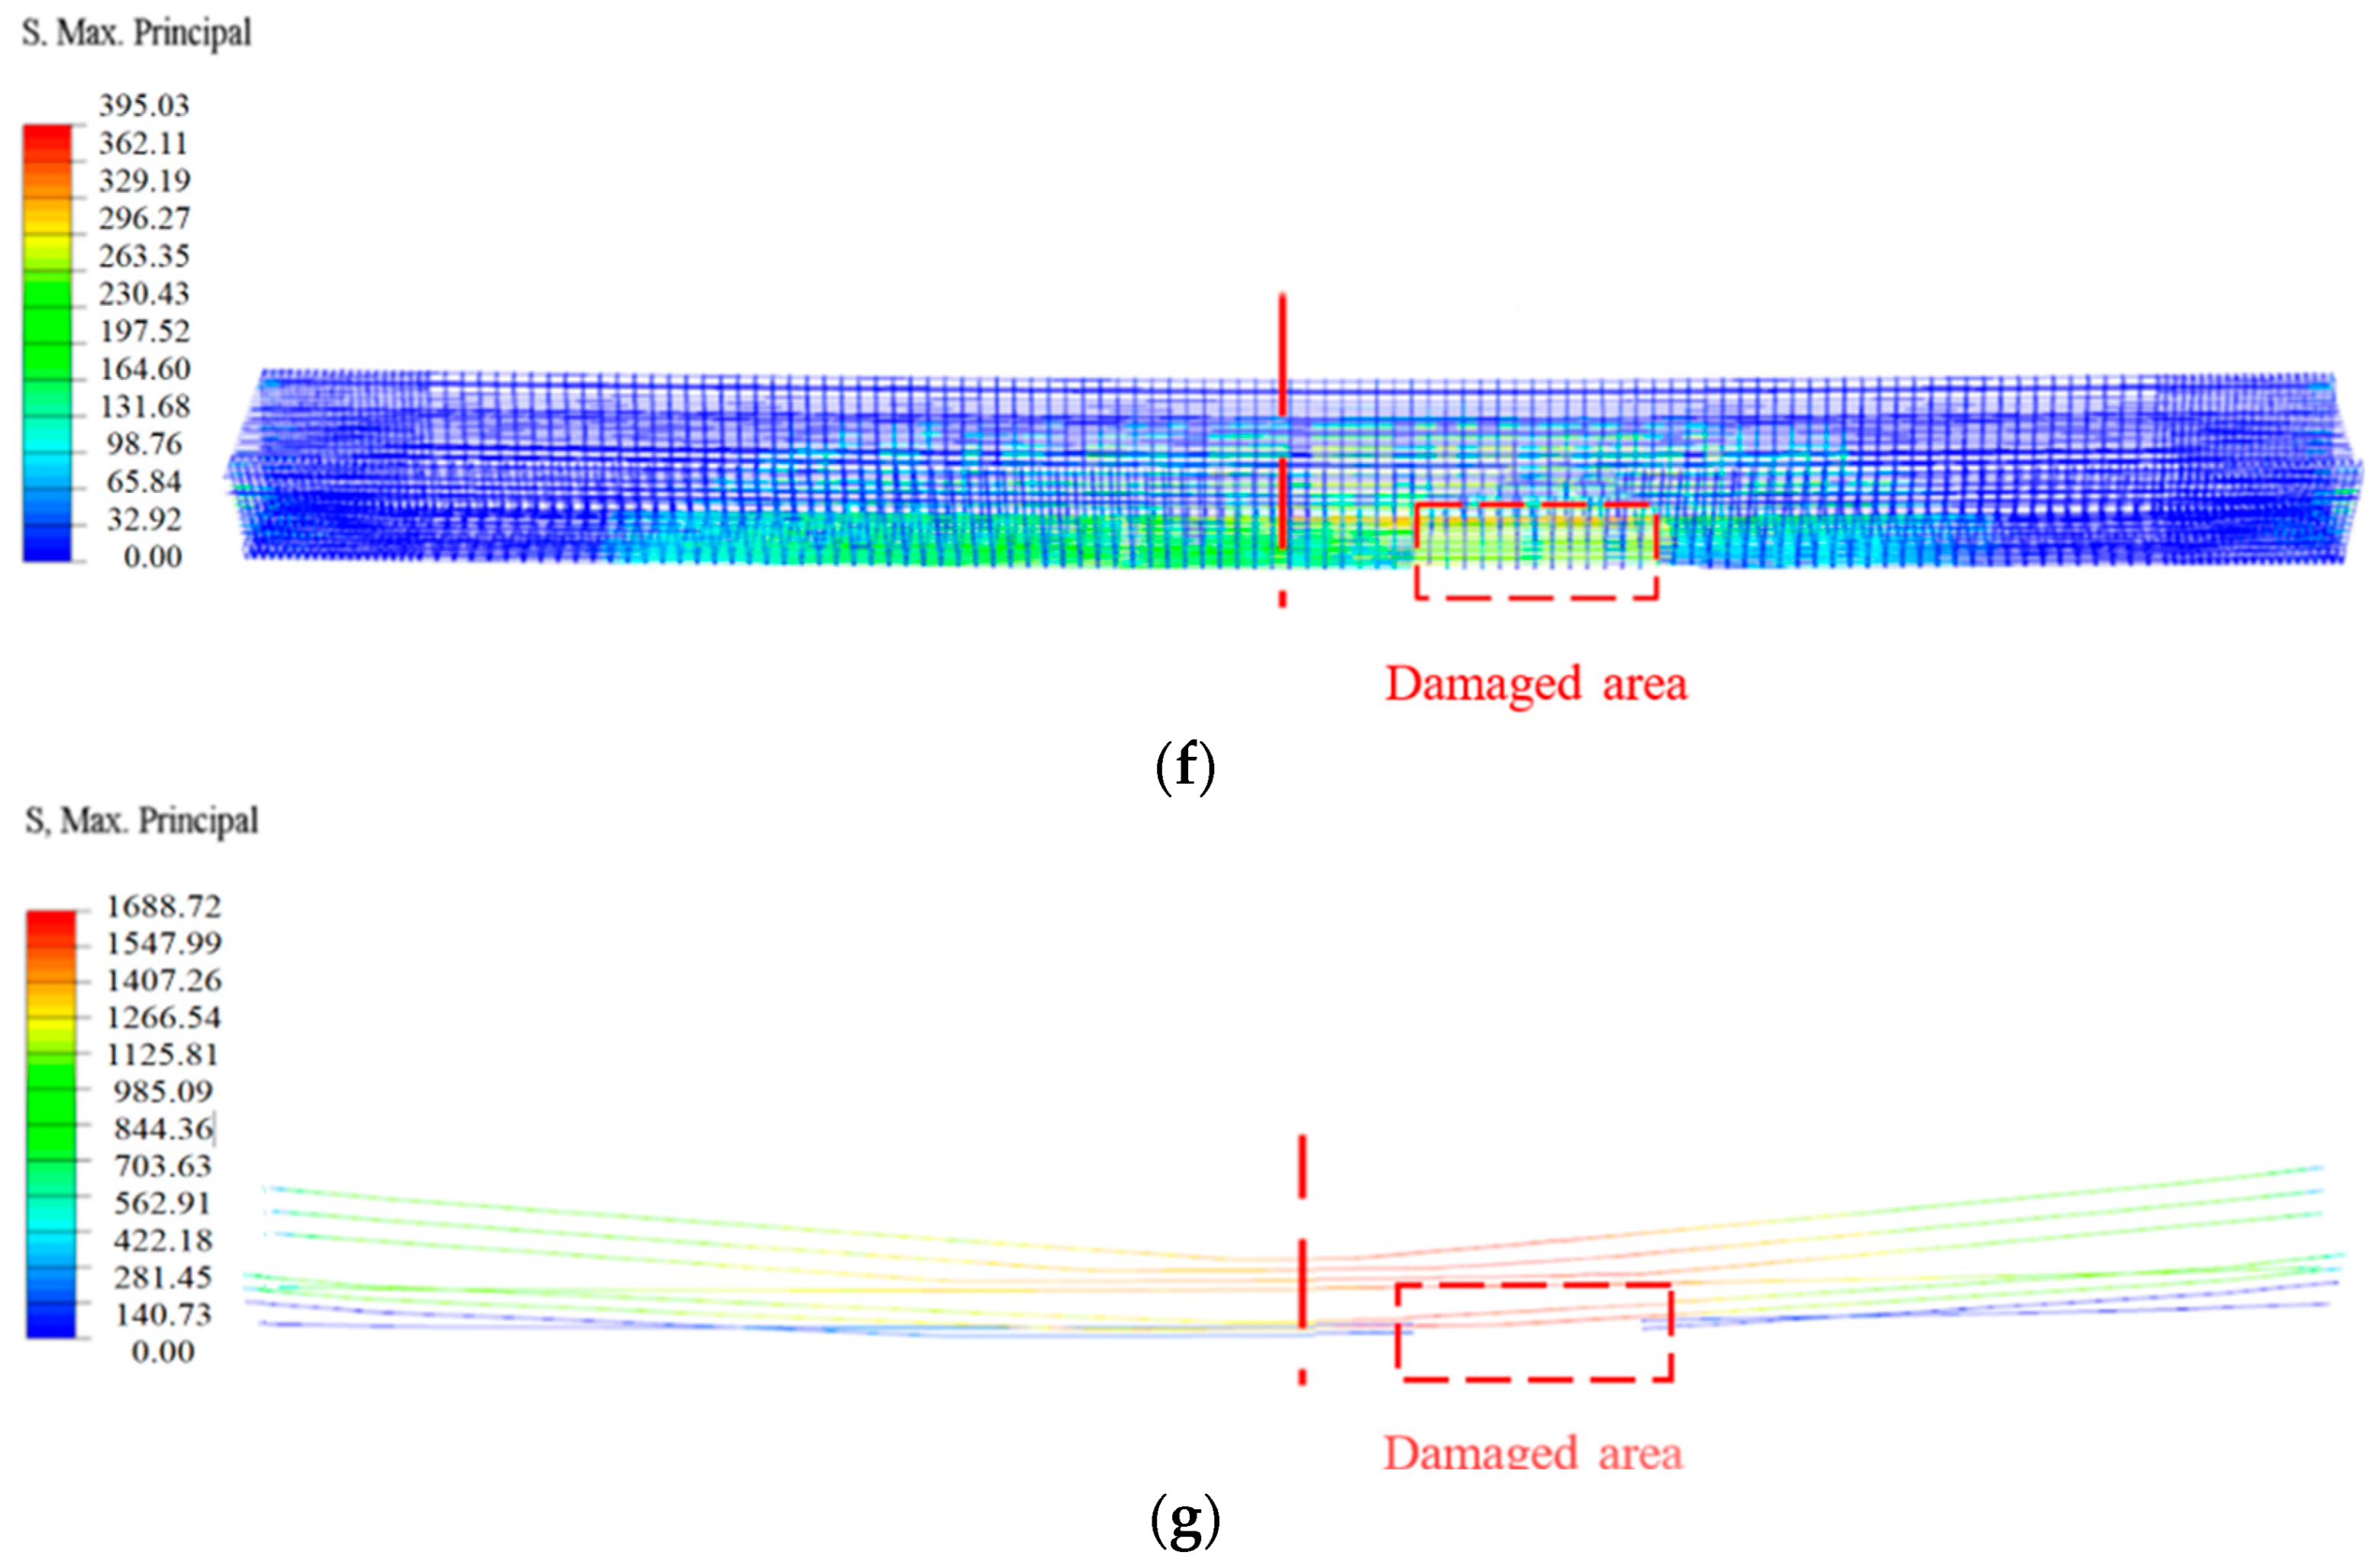
4.4. The Results of Refined Finite Element Analysis
4.5. Ultimate Flexural Capacity
5. Destructive Test
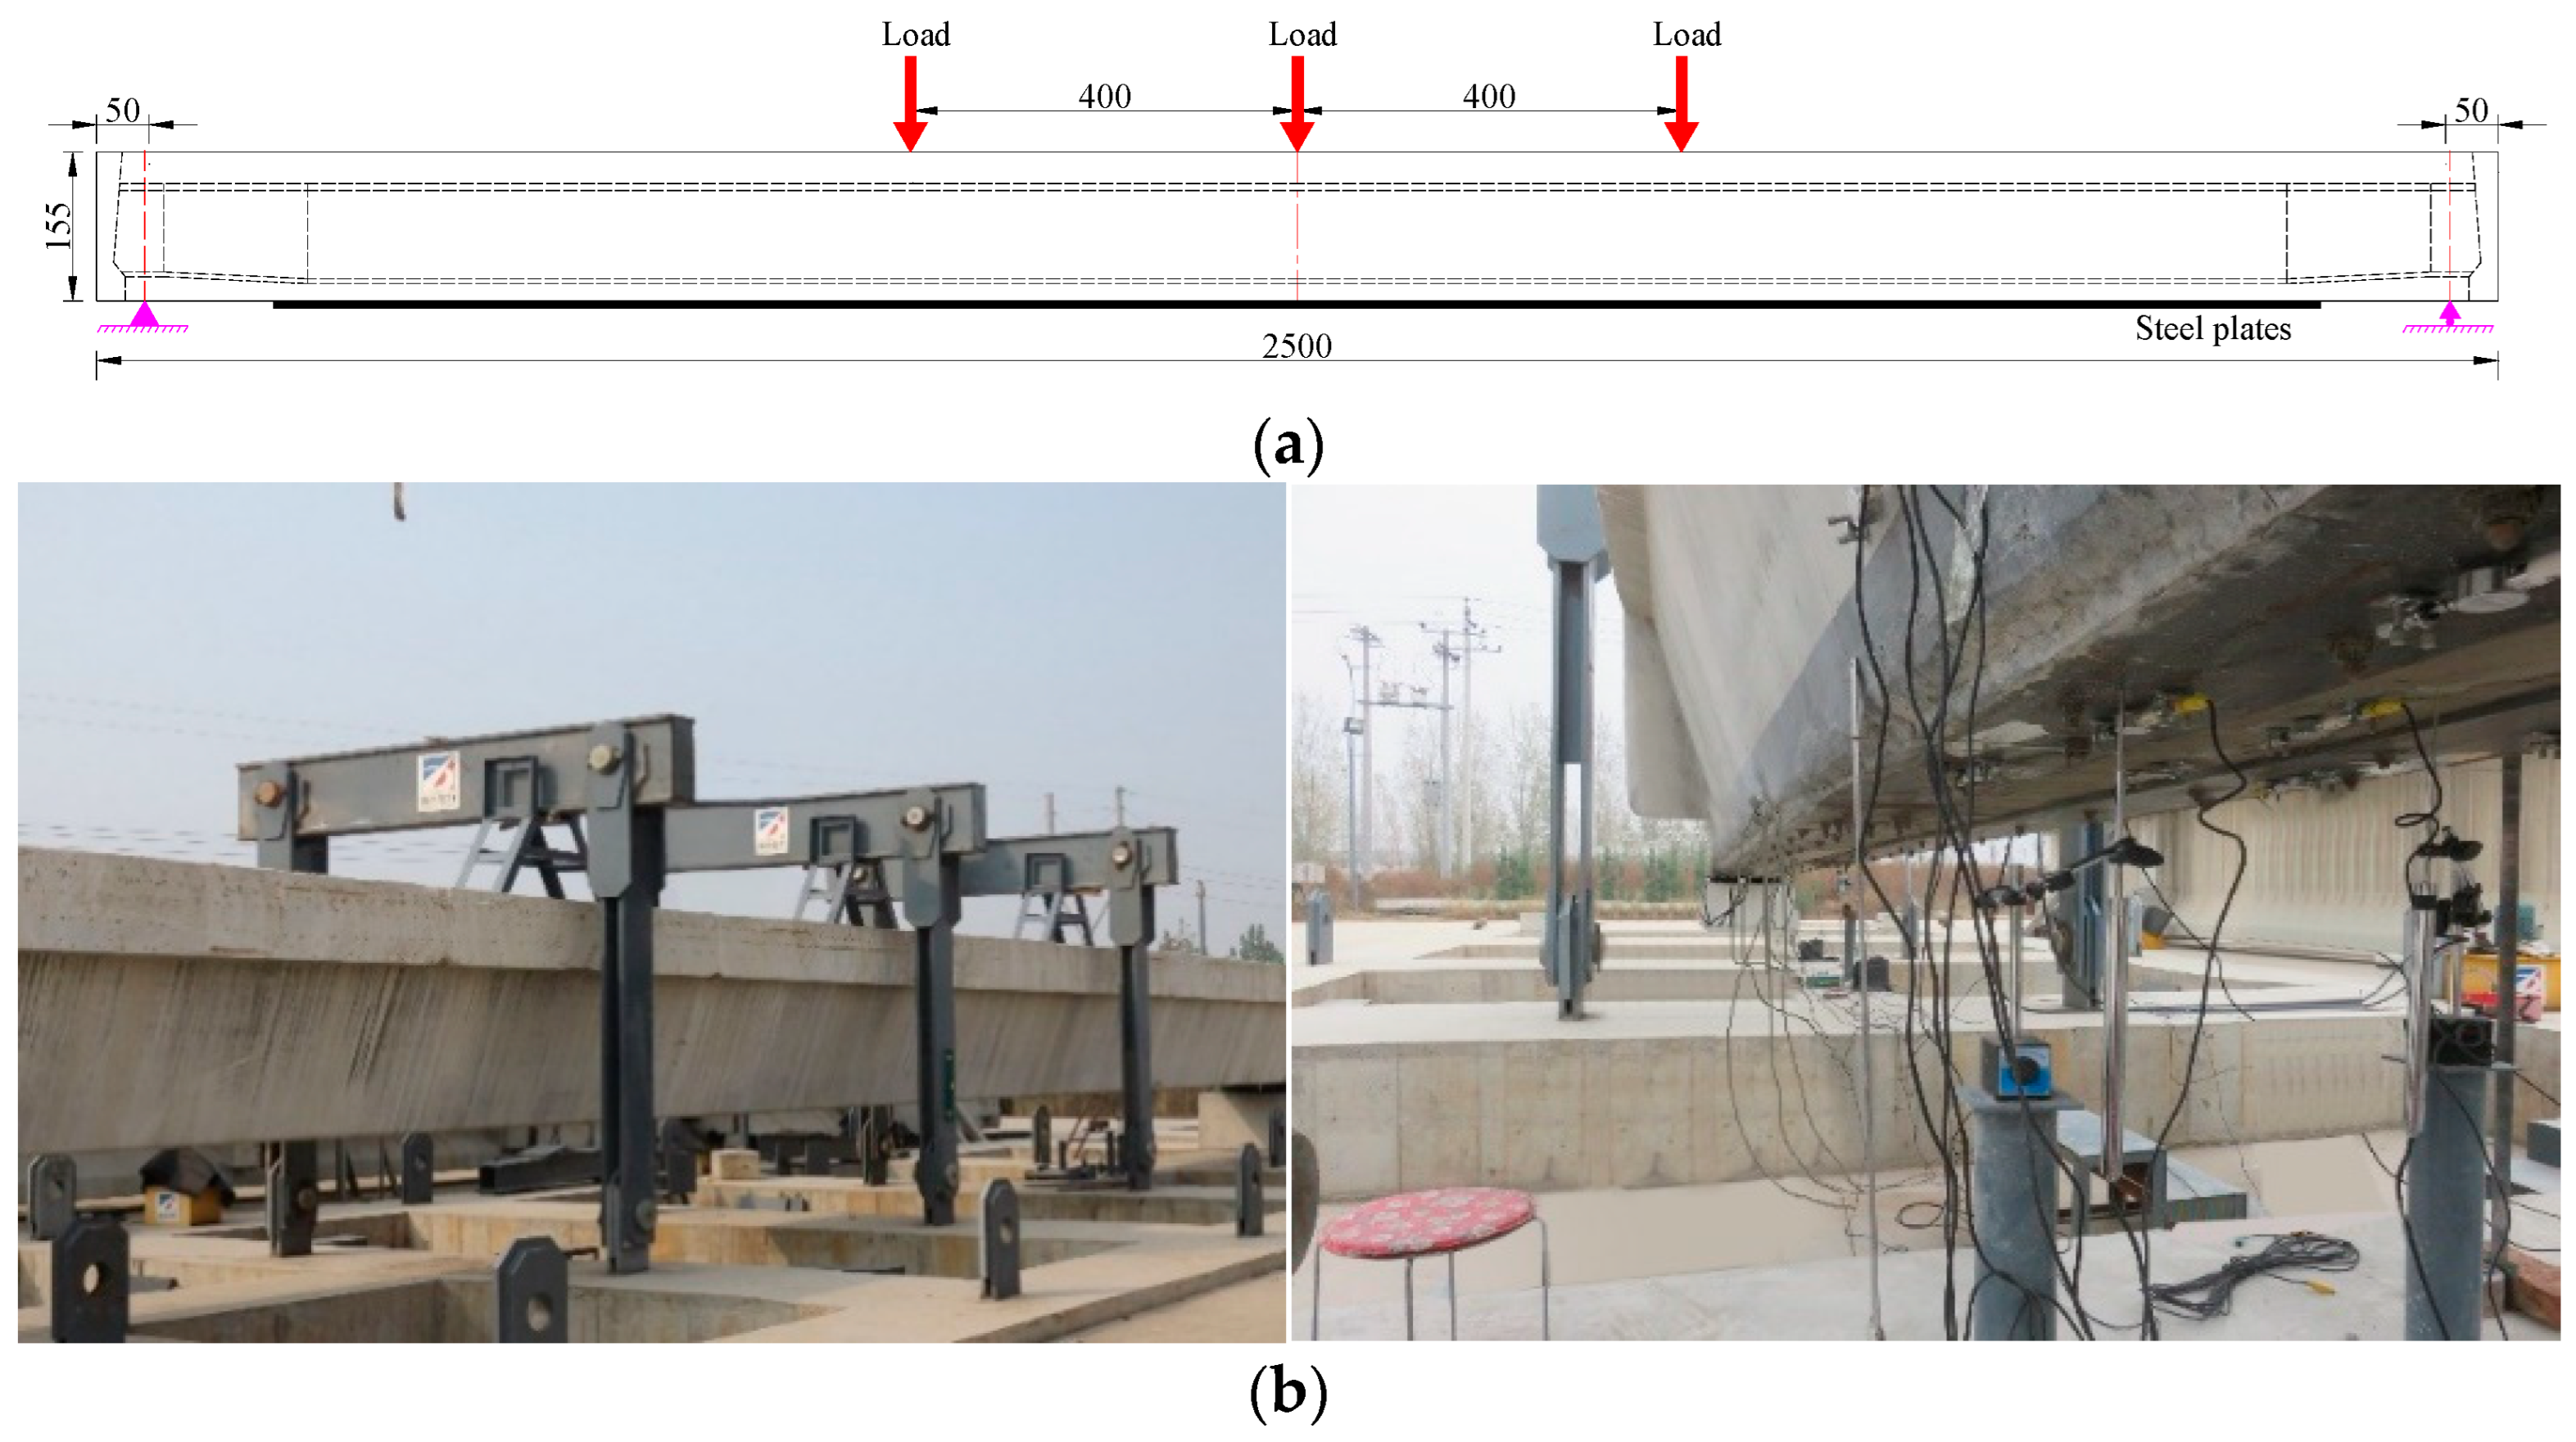
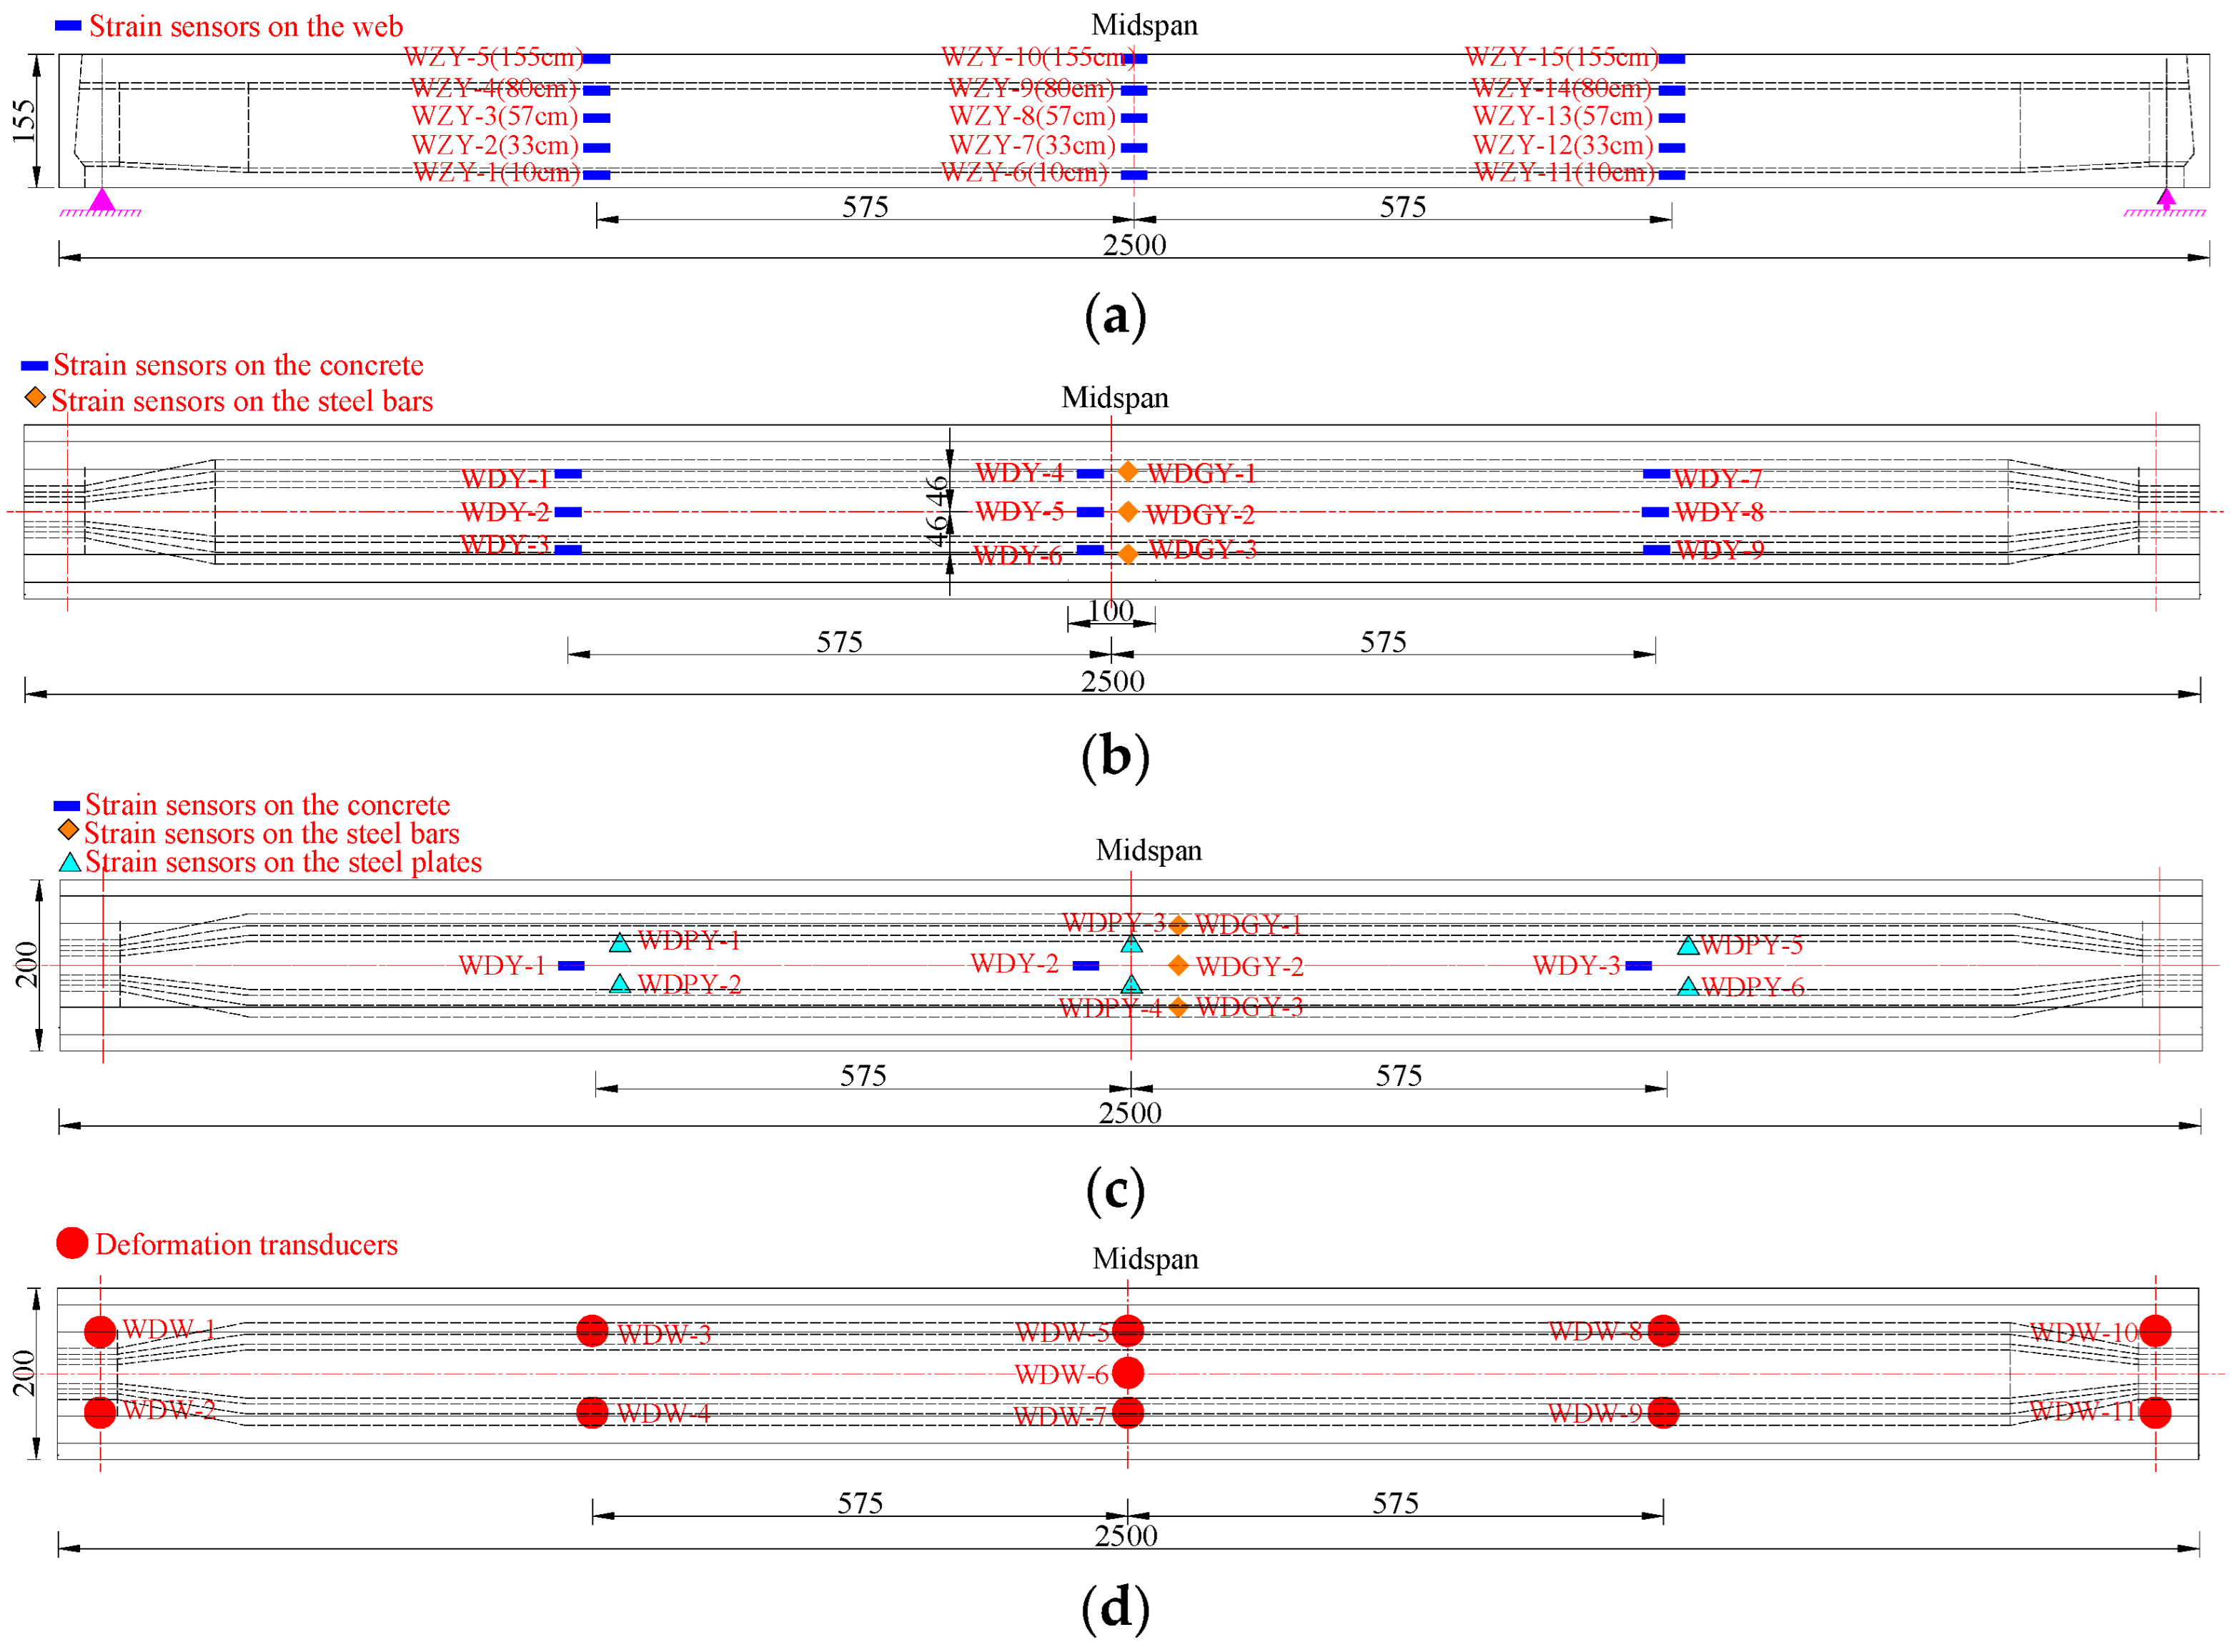
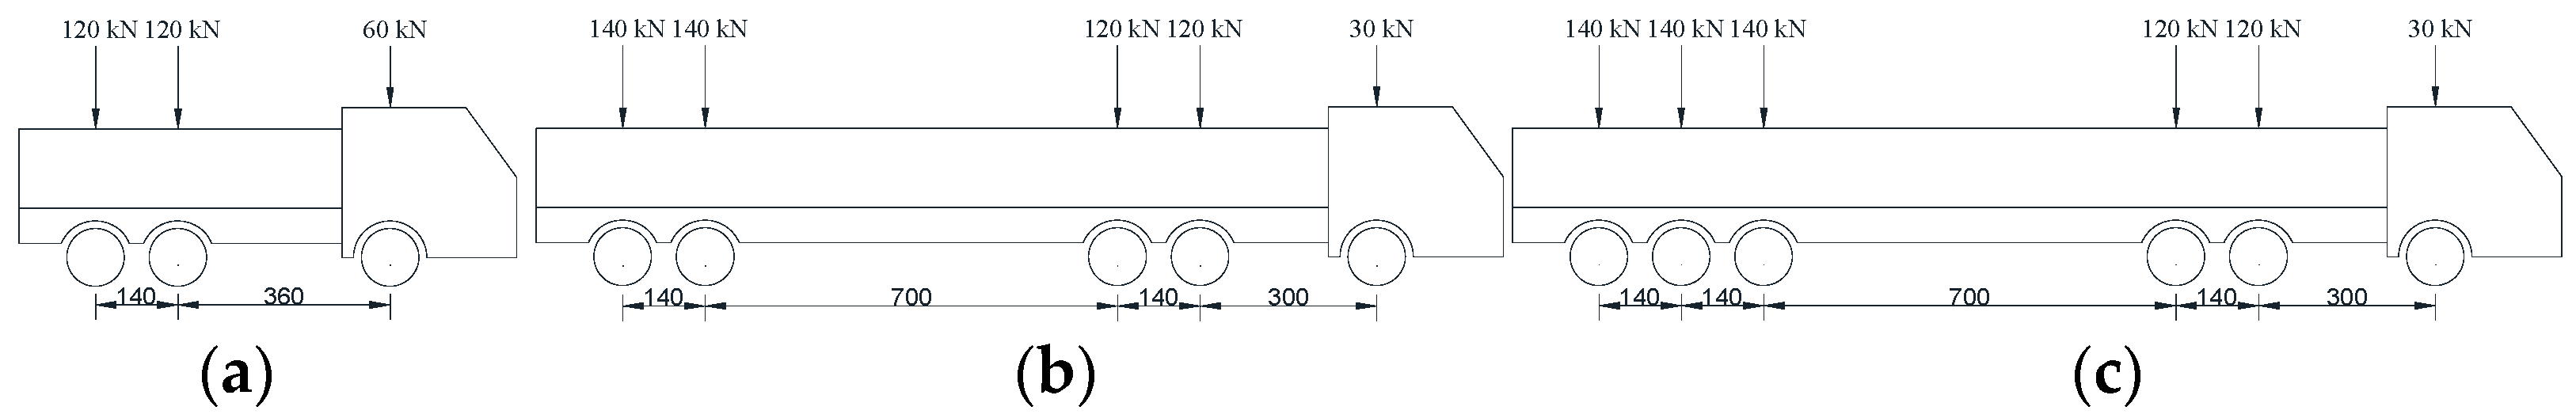
5.1. Loading System
5.2. Loading Scheme
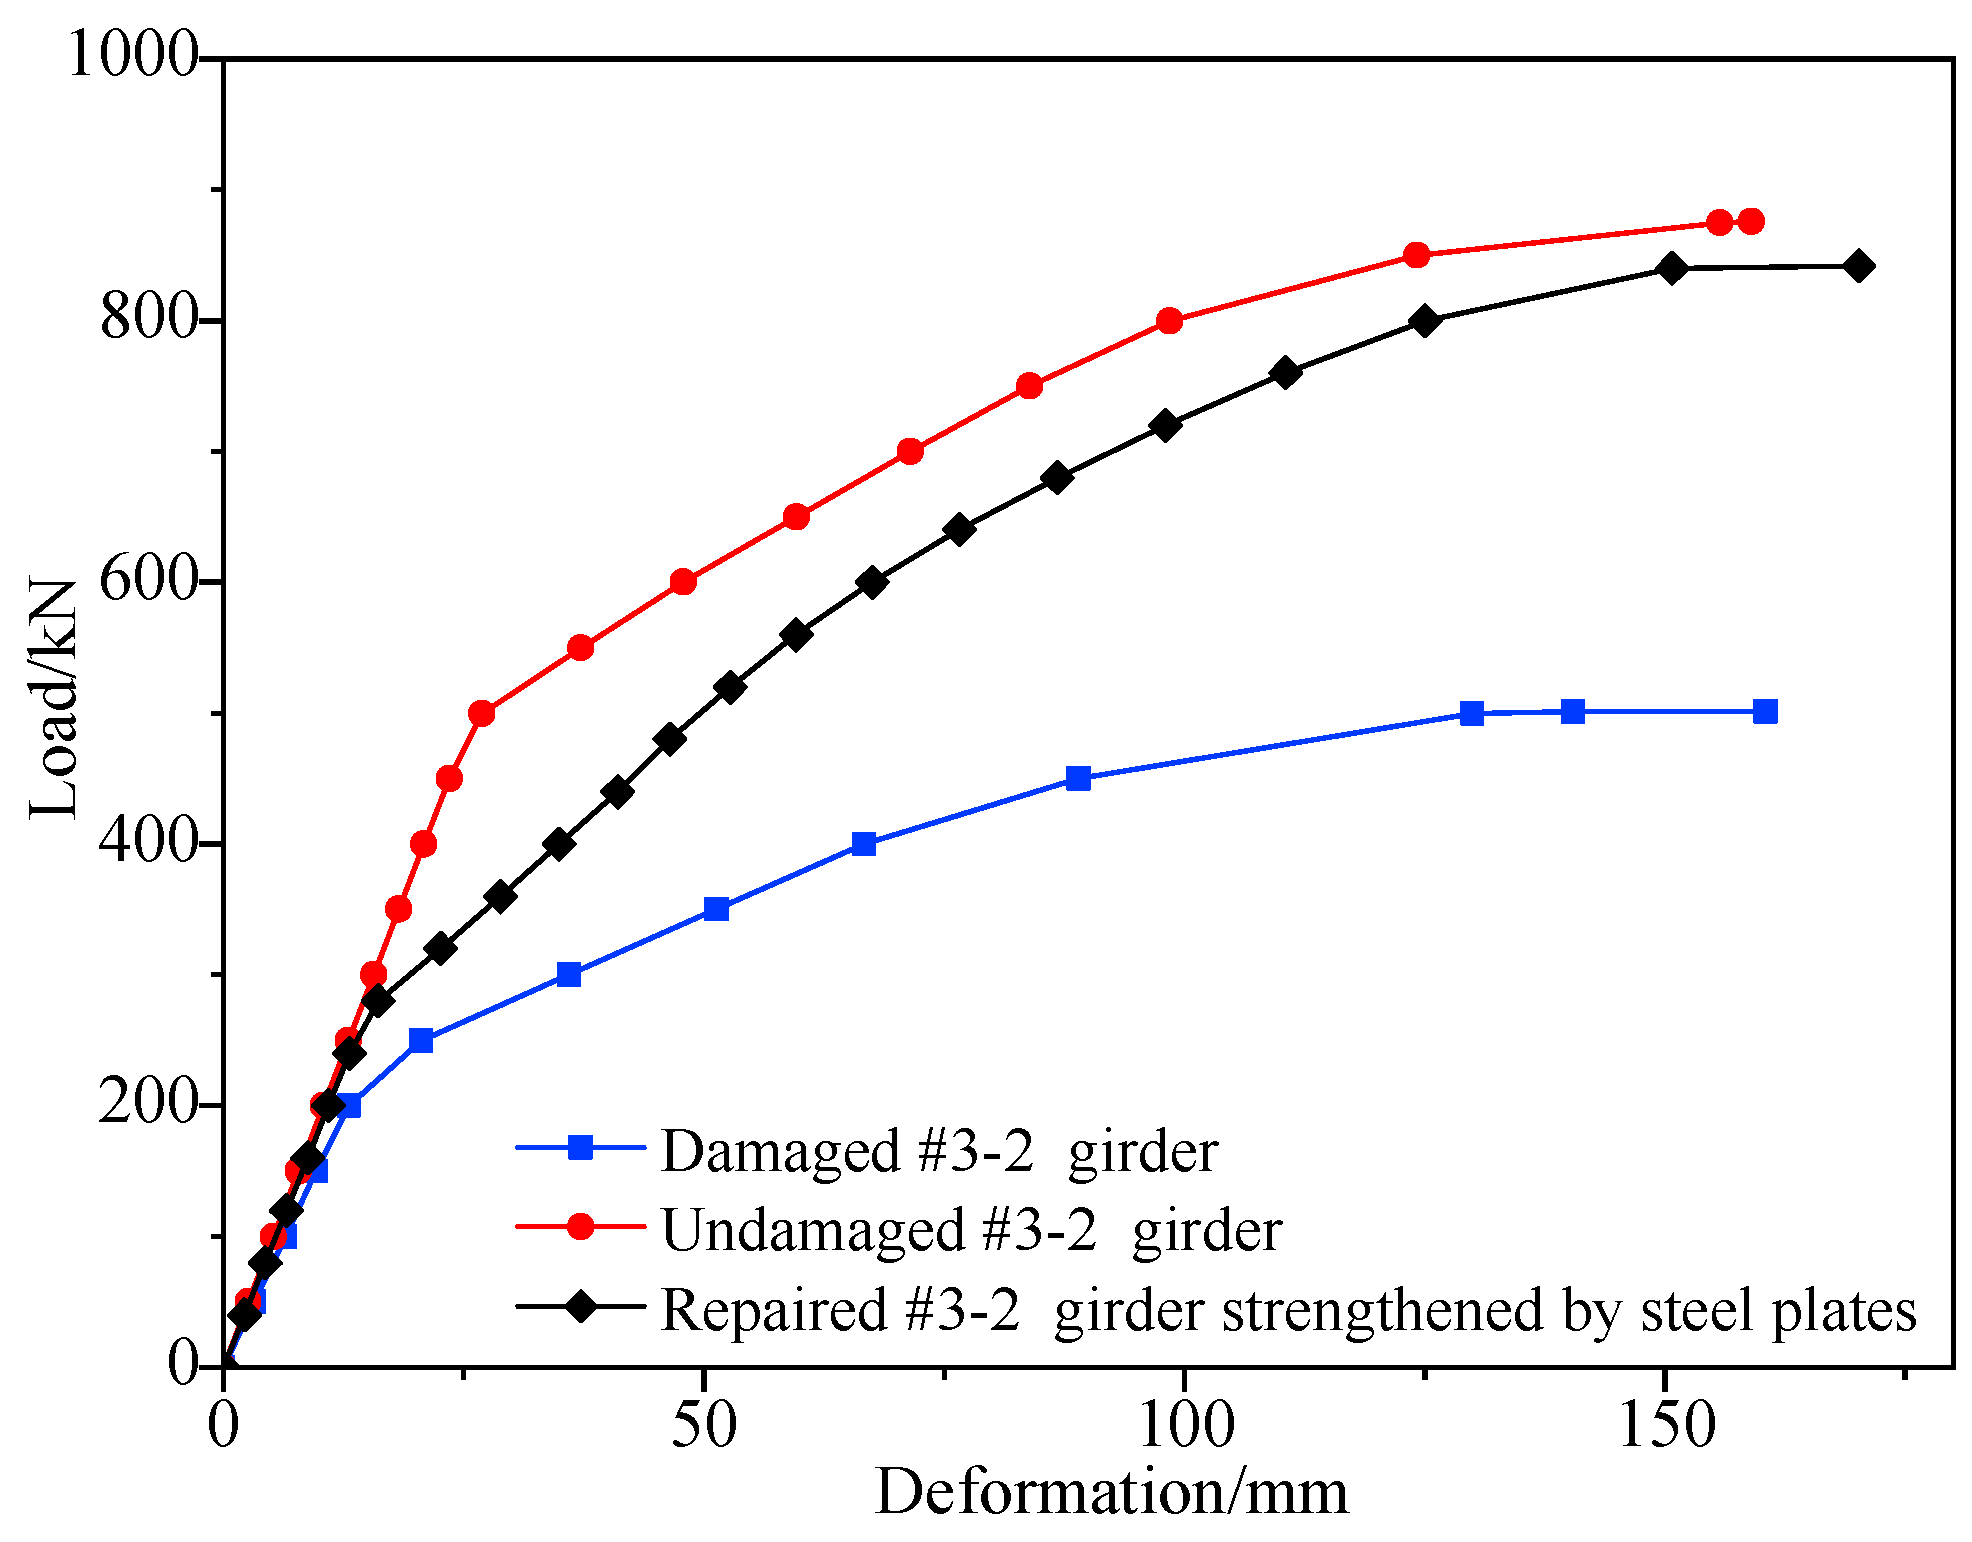
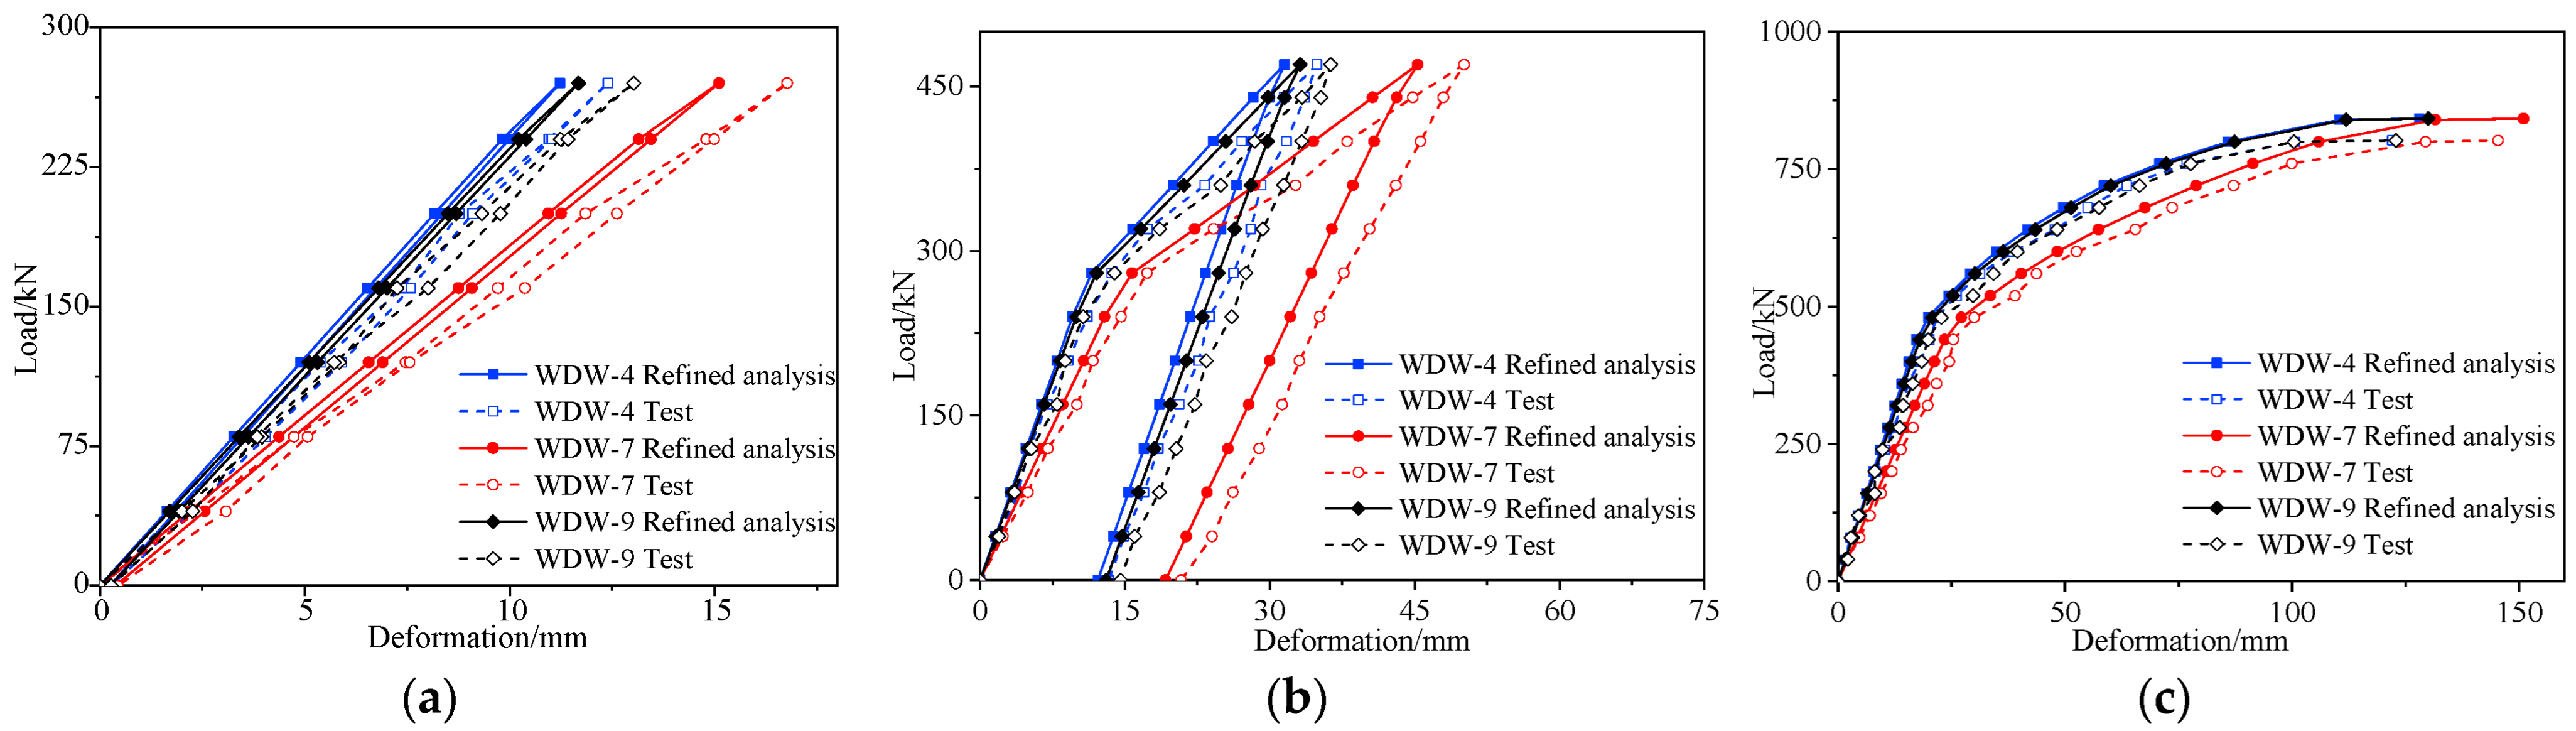
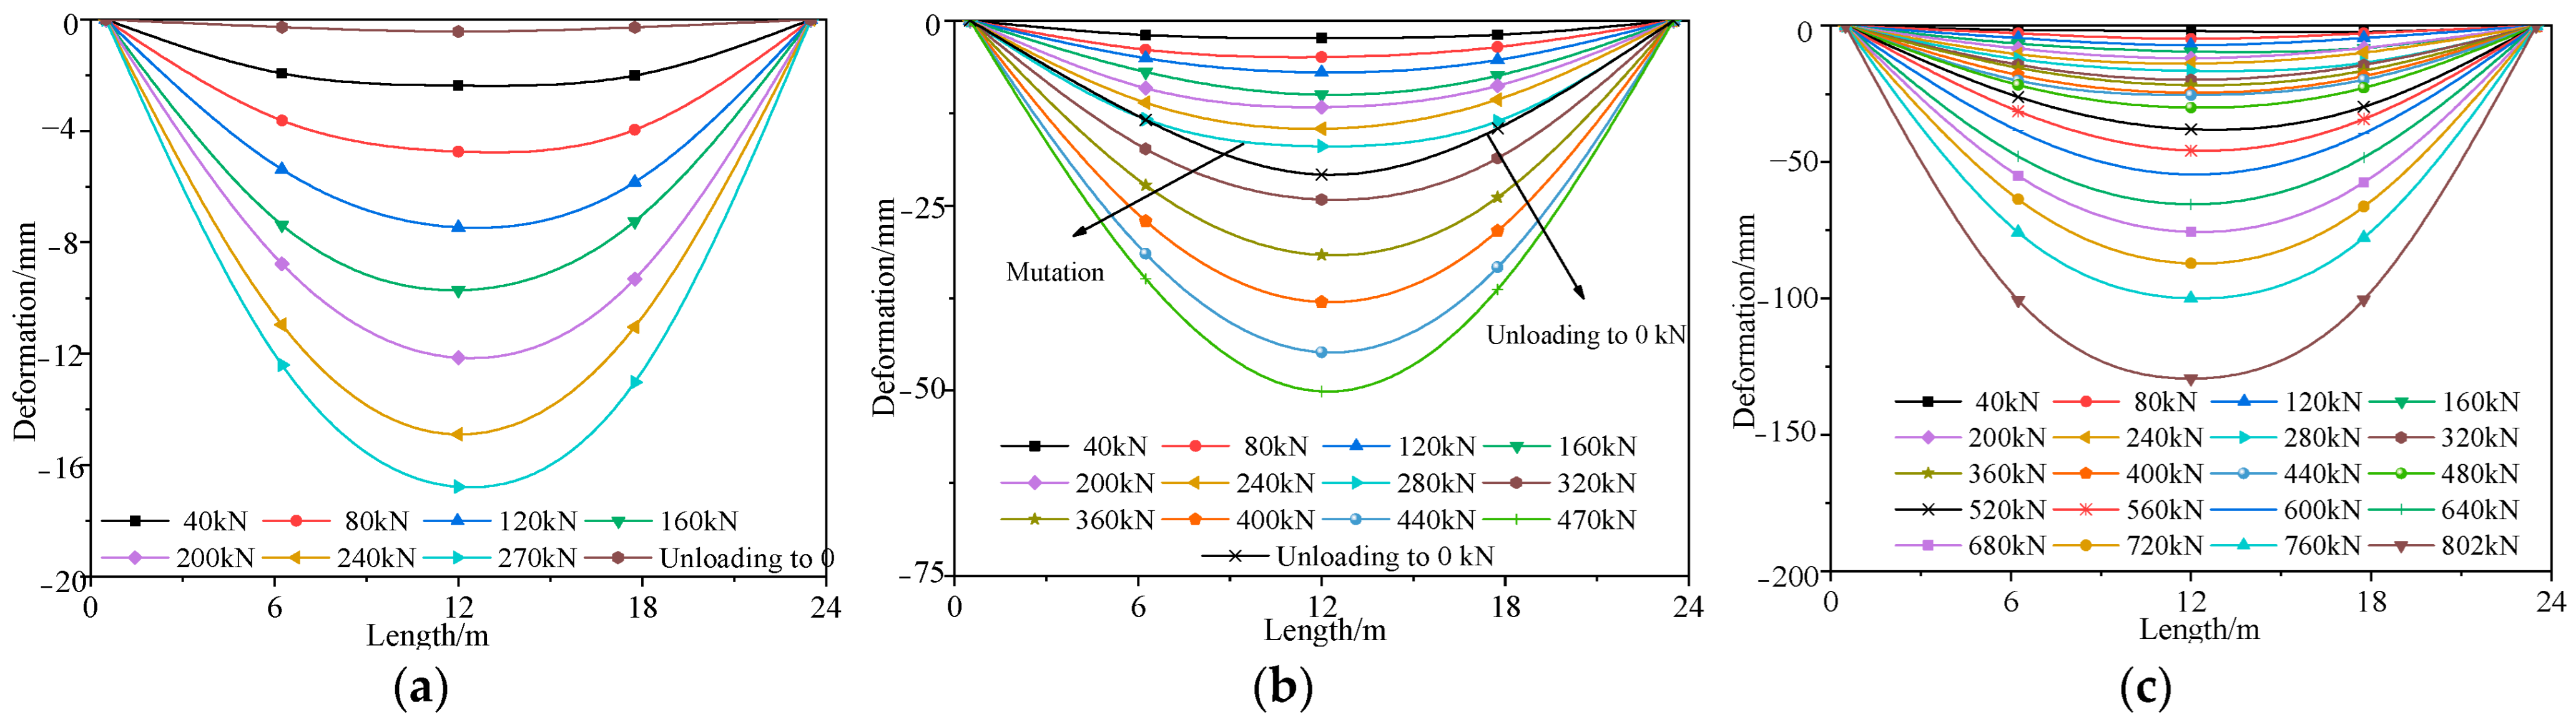
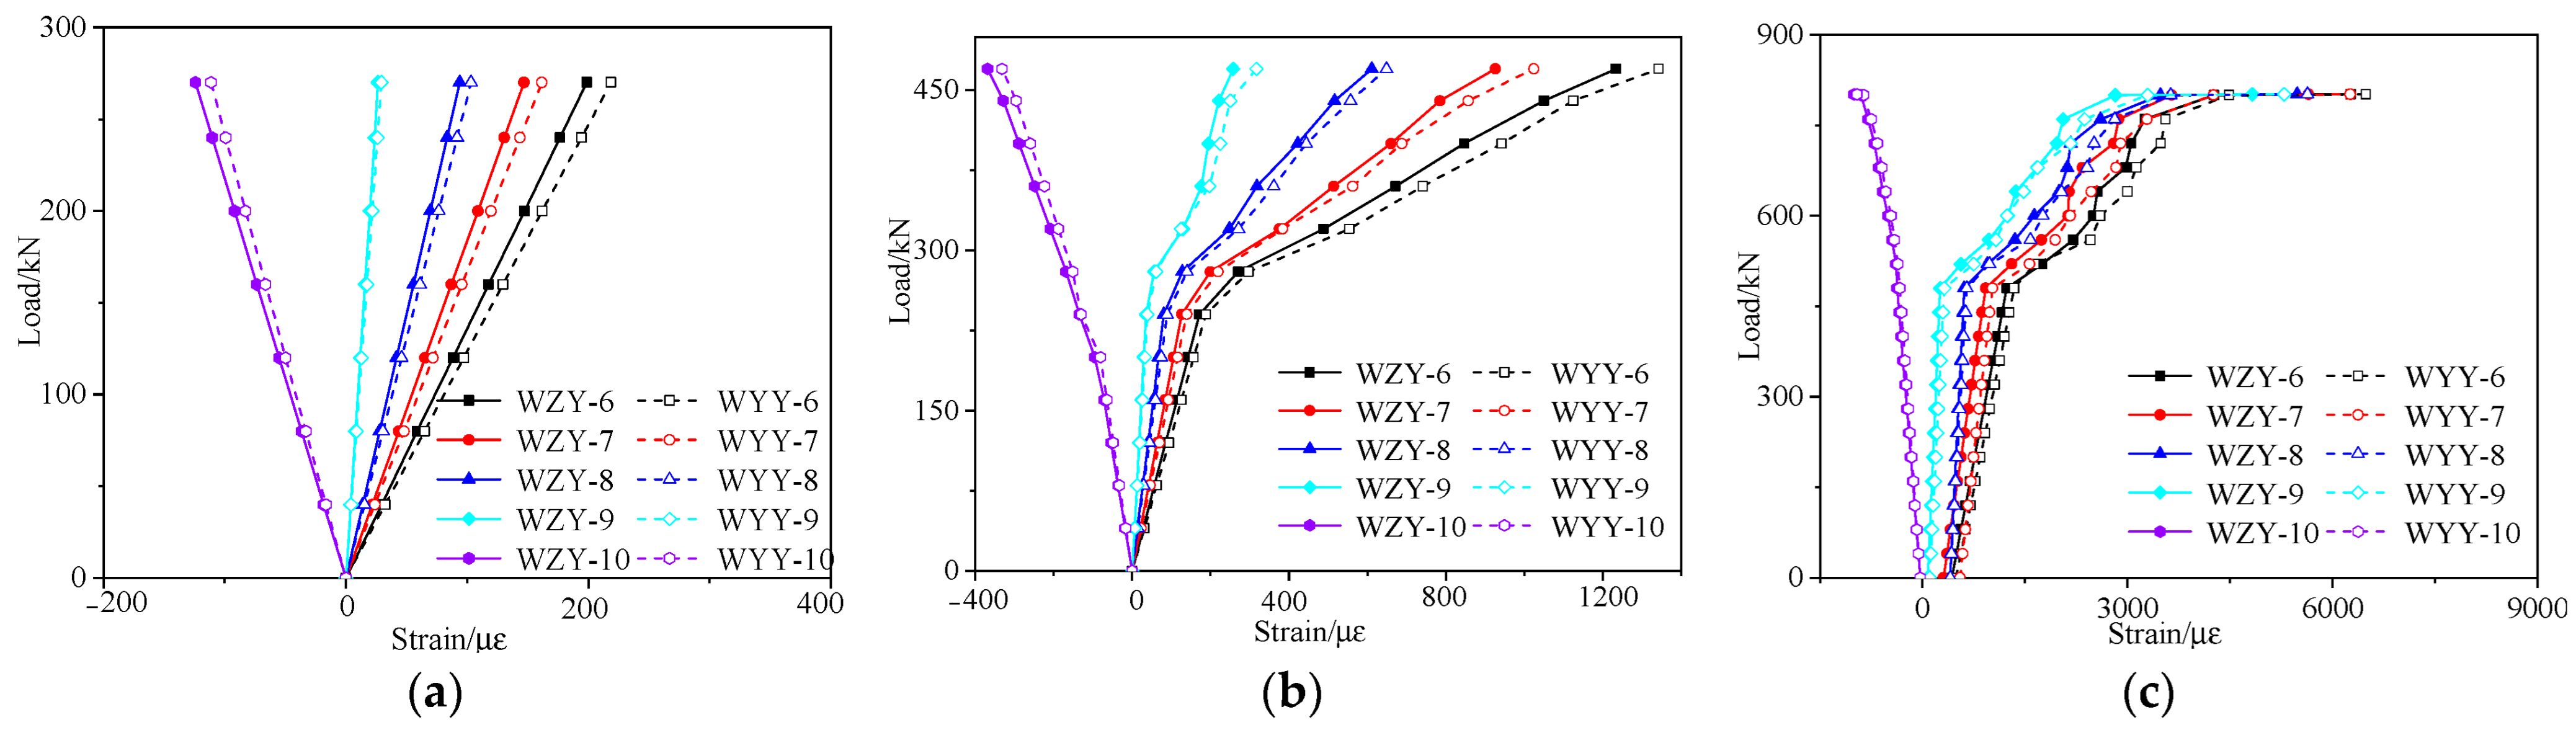
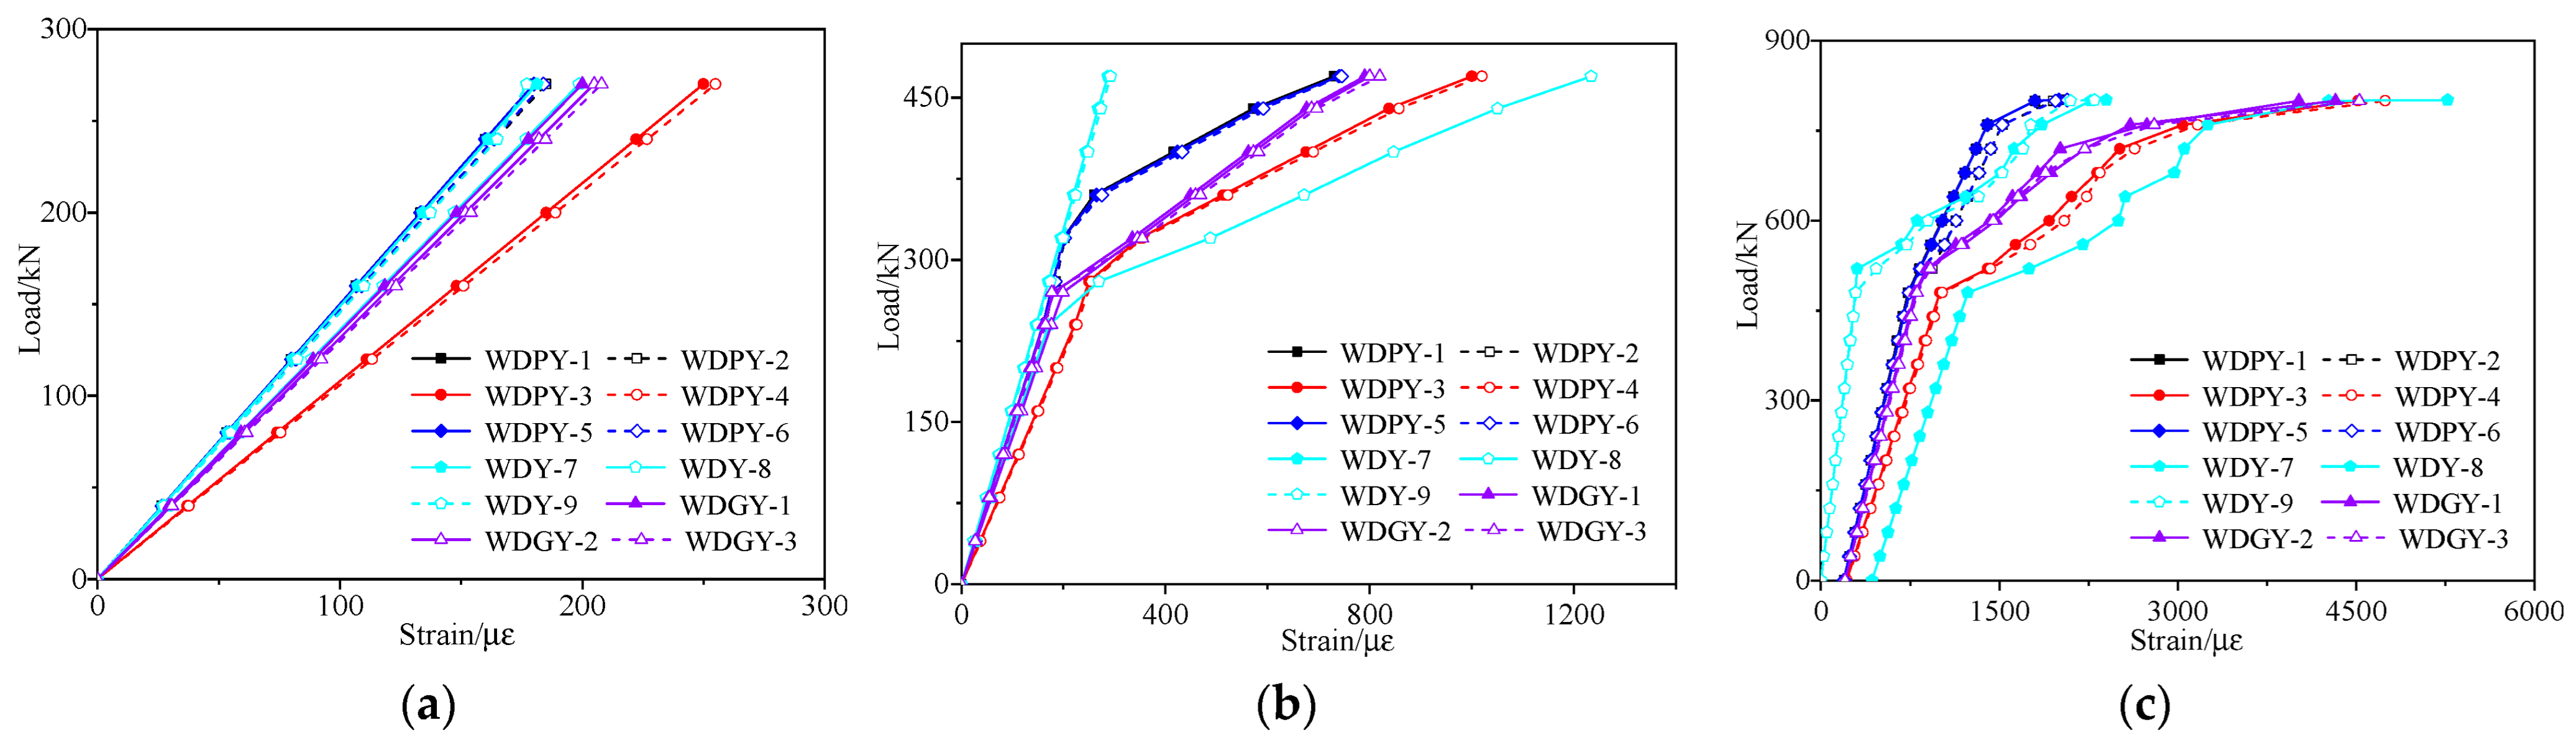
5.3. Test Results
5.4. Ultimate Flexural Capacity
6. Comparative Analysis
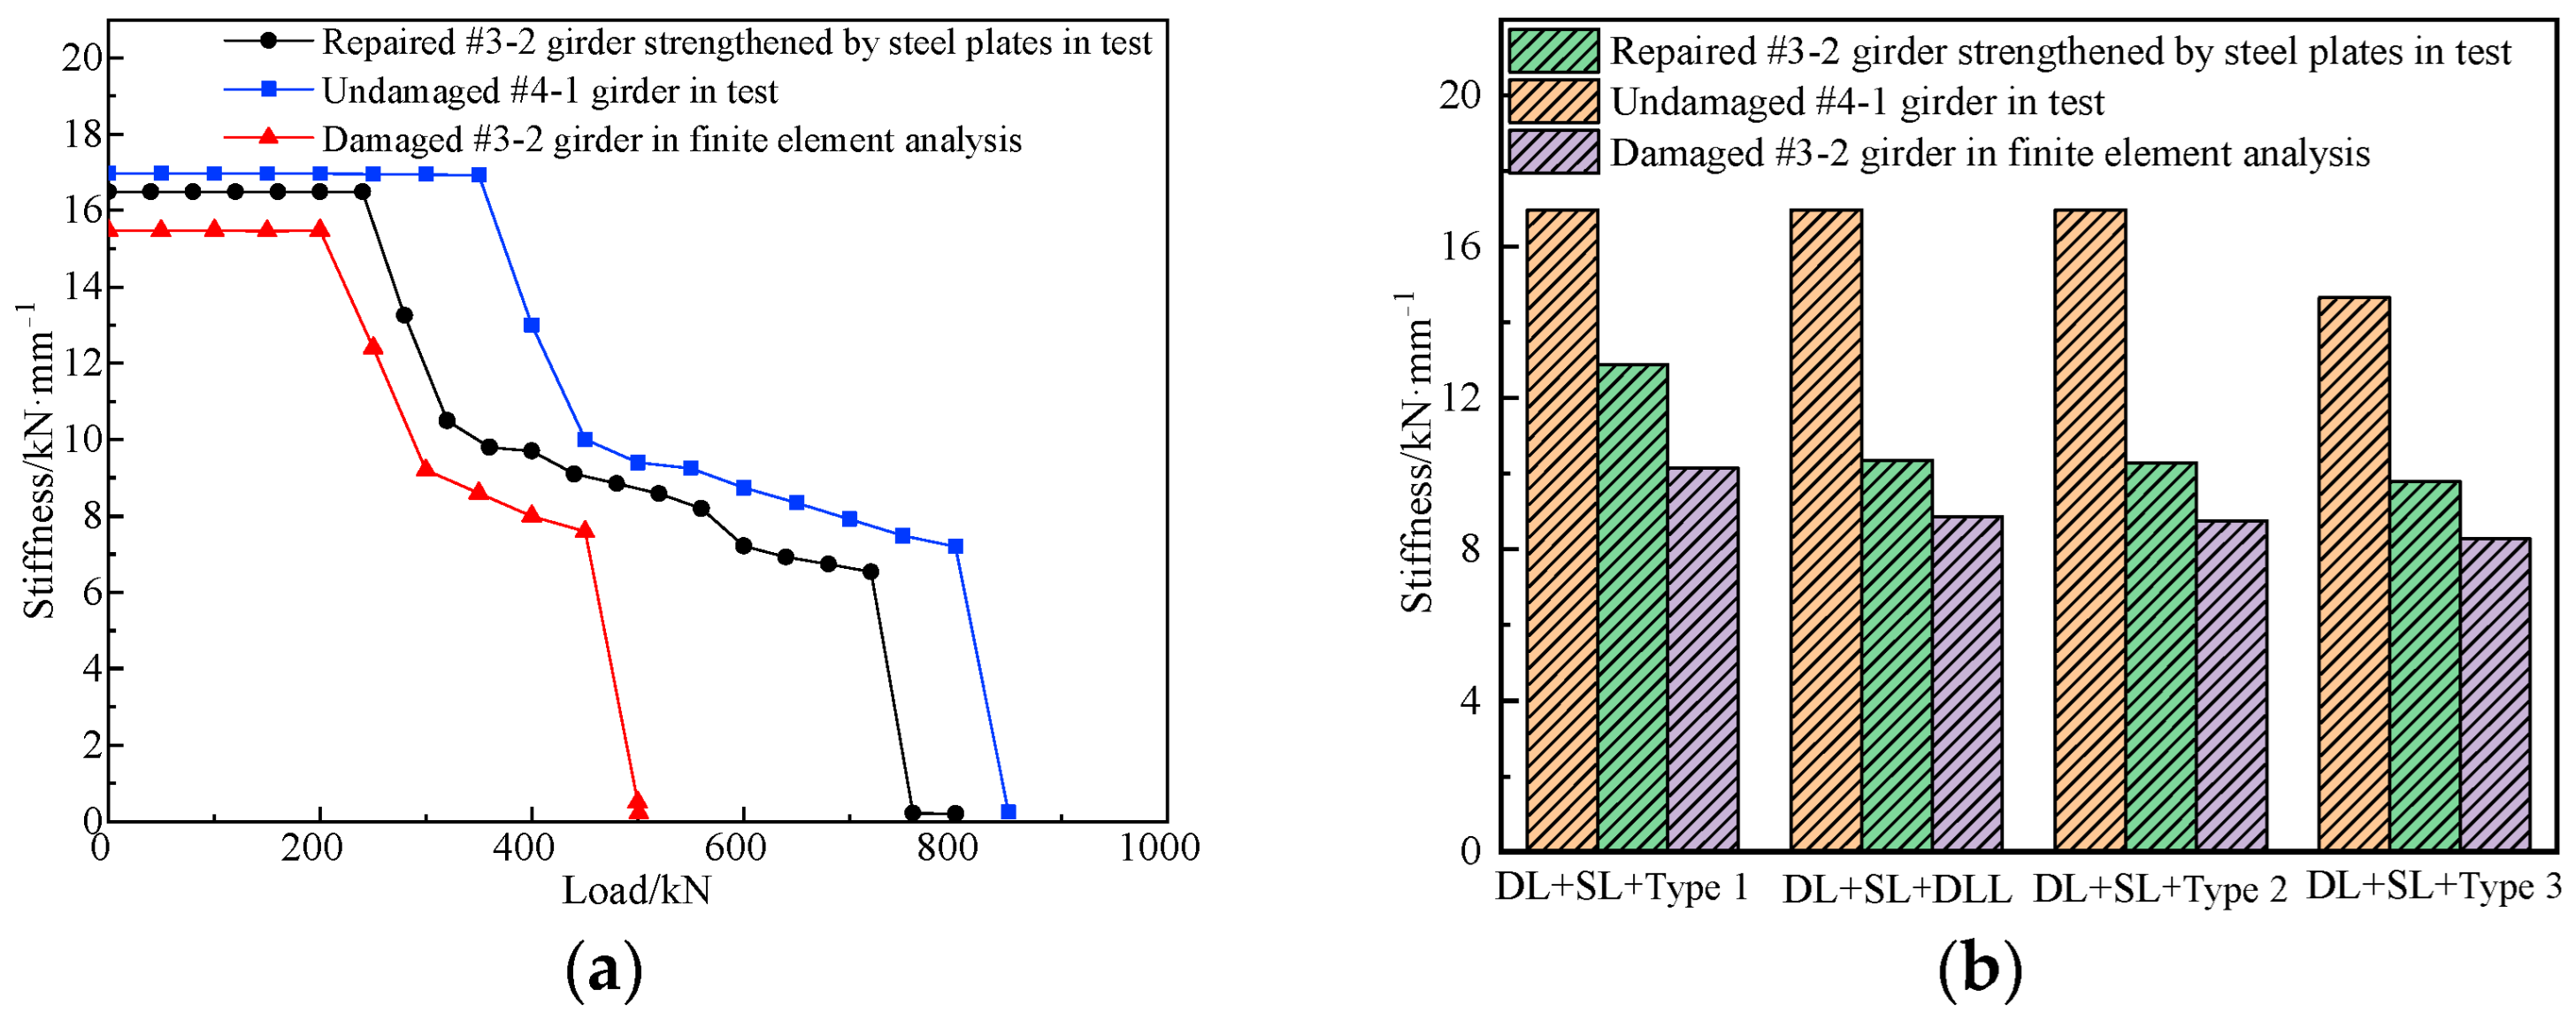
6.1. Stiffness
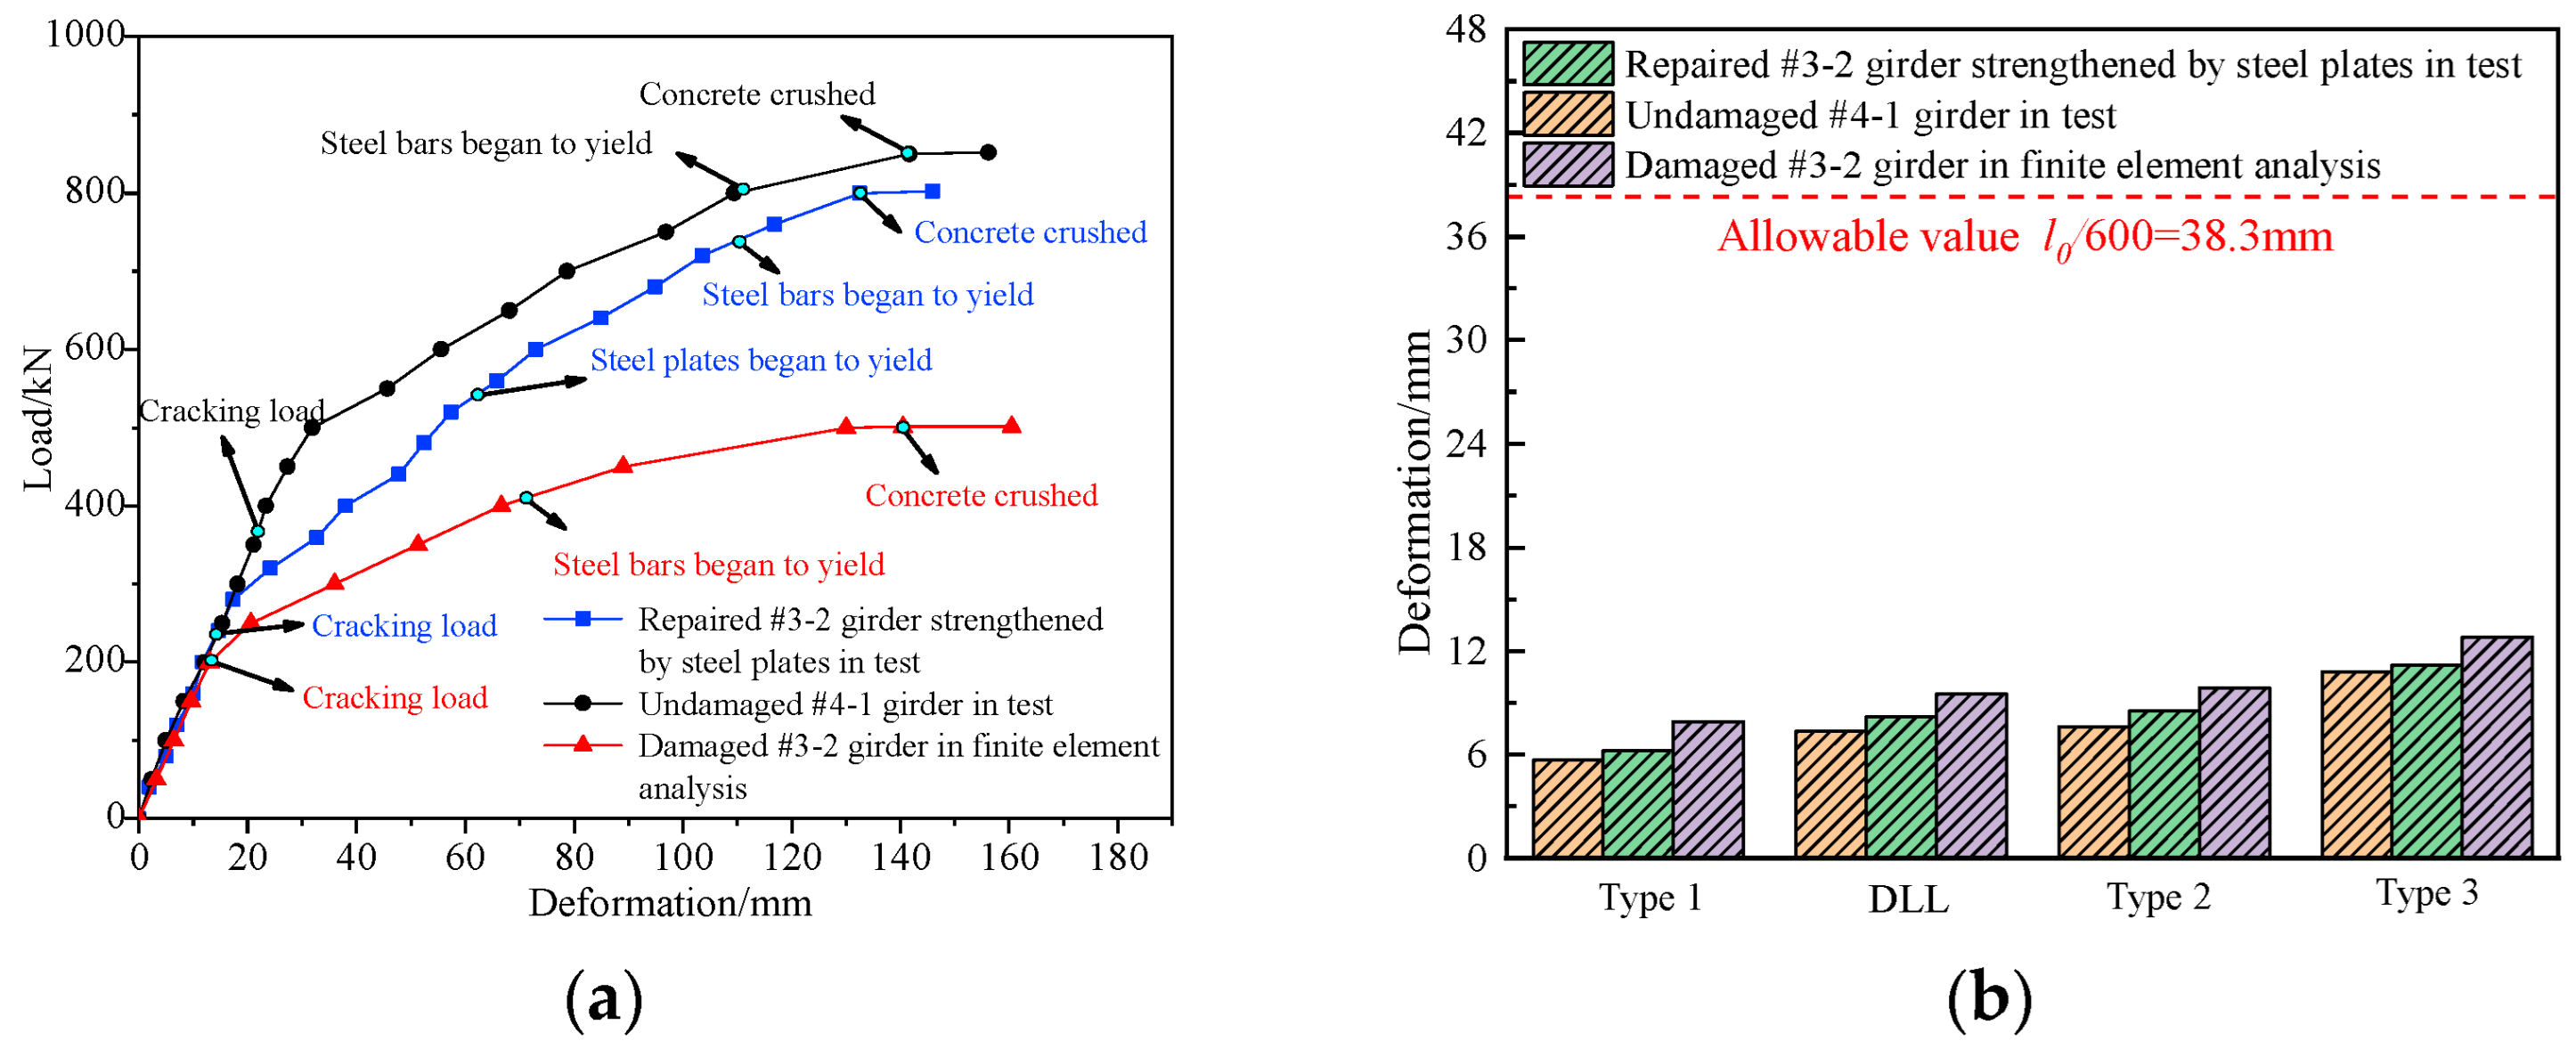
6.2. Flexural Deformation
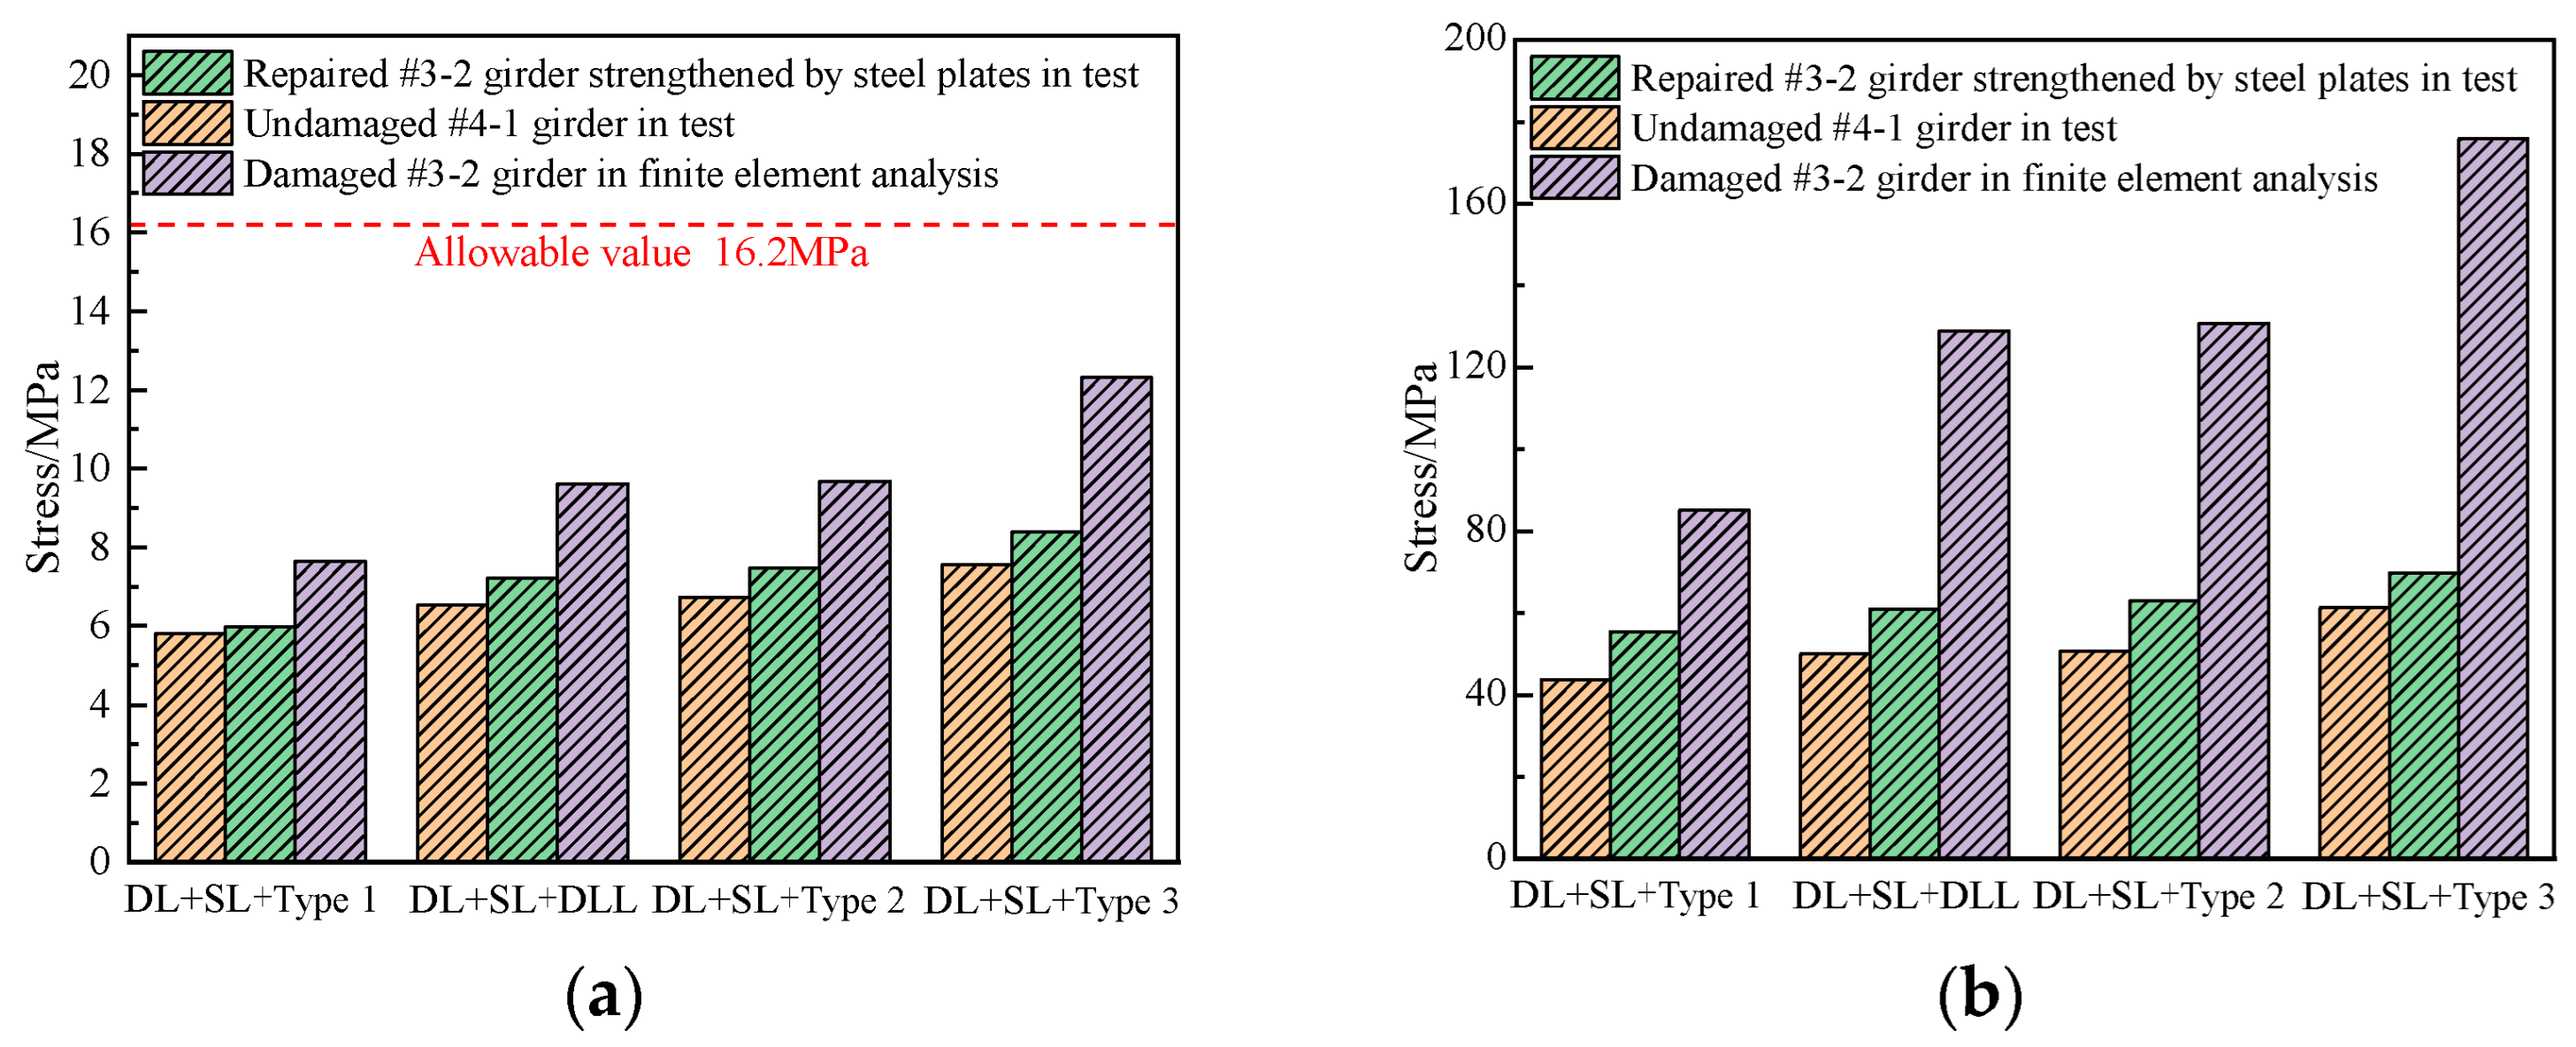
6.3. Stress
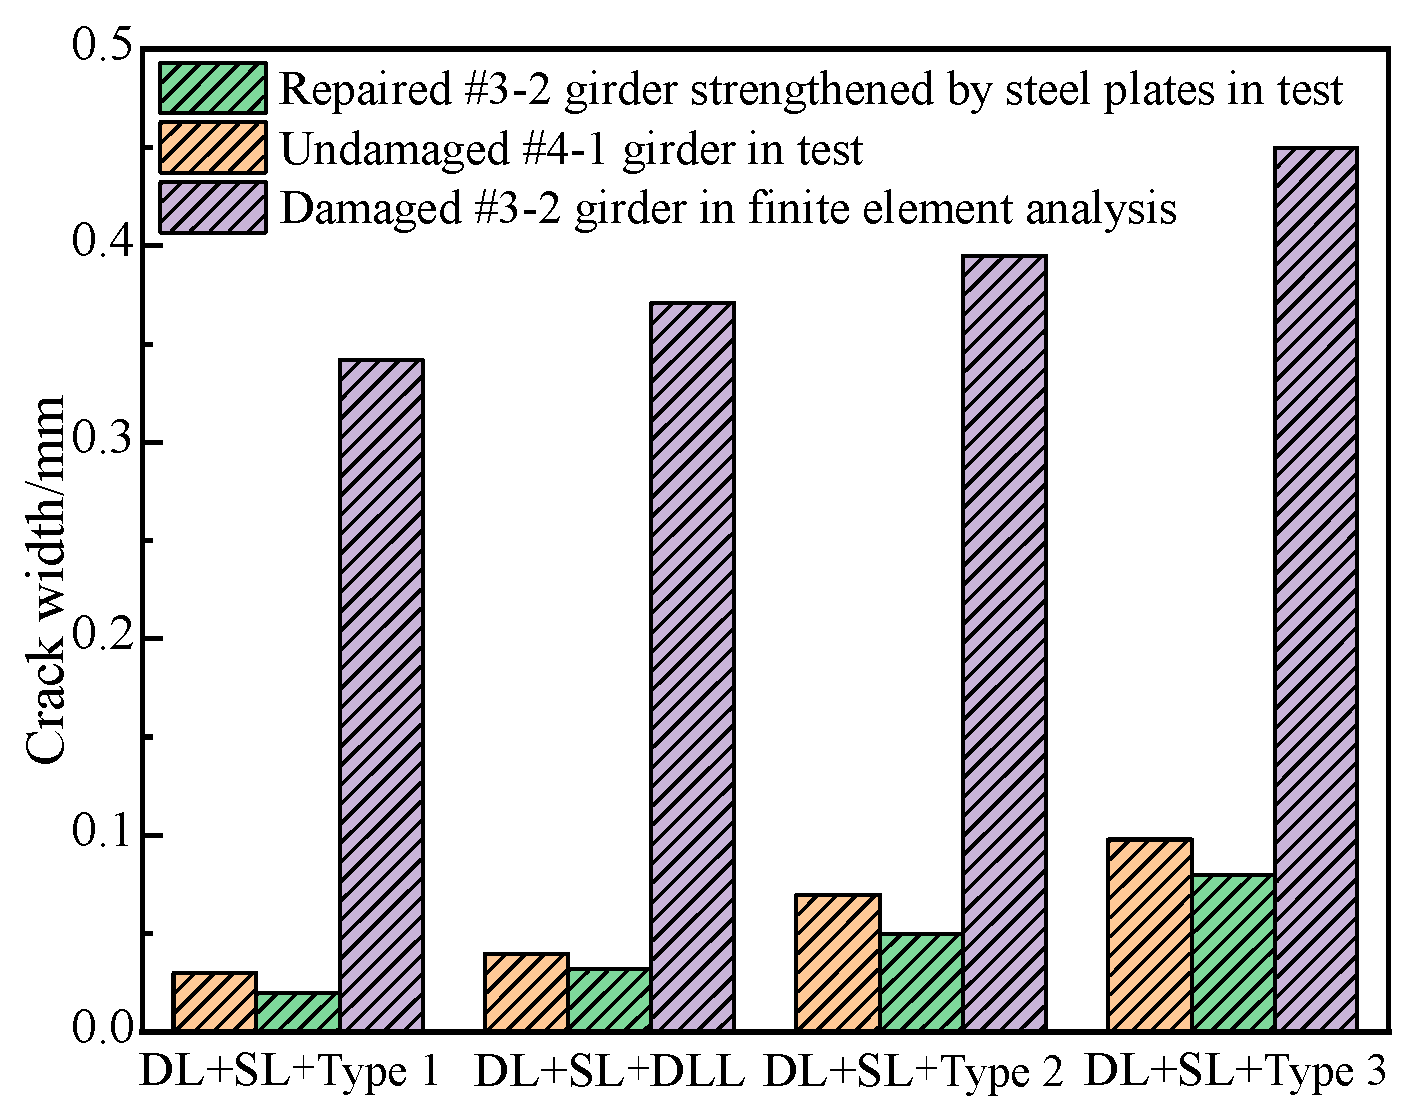
6.4. Crack Width
6.5. Traffic Load Capacity
7. Conclusions
- (1)
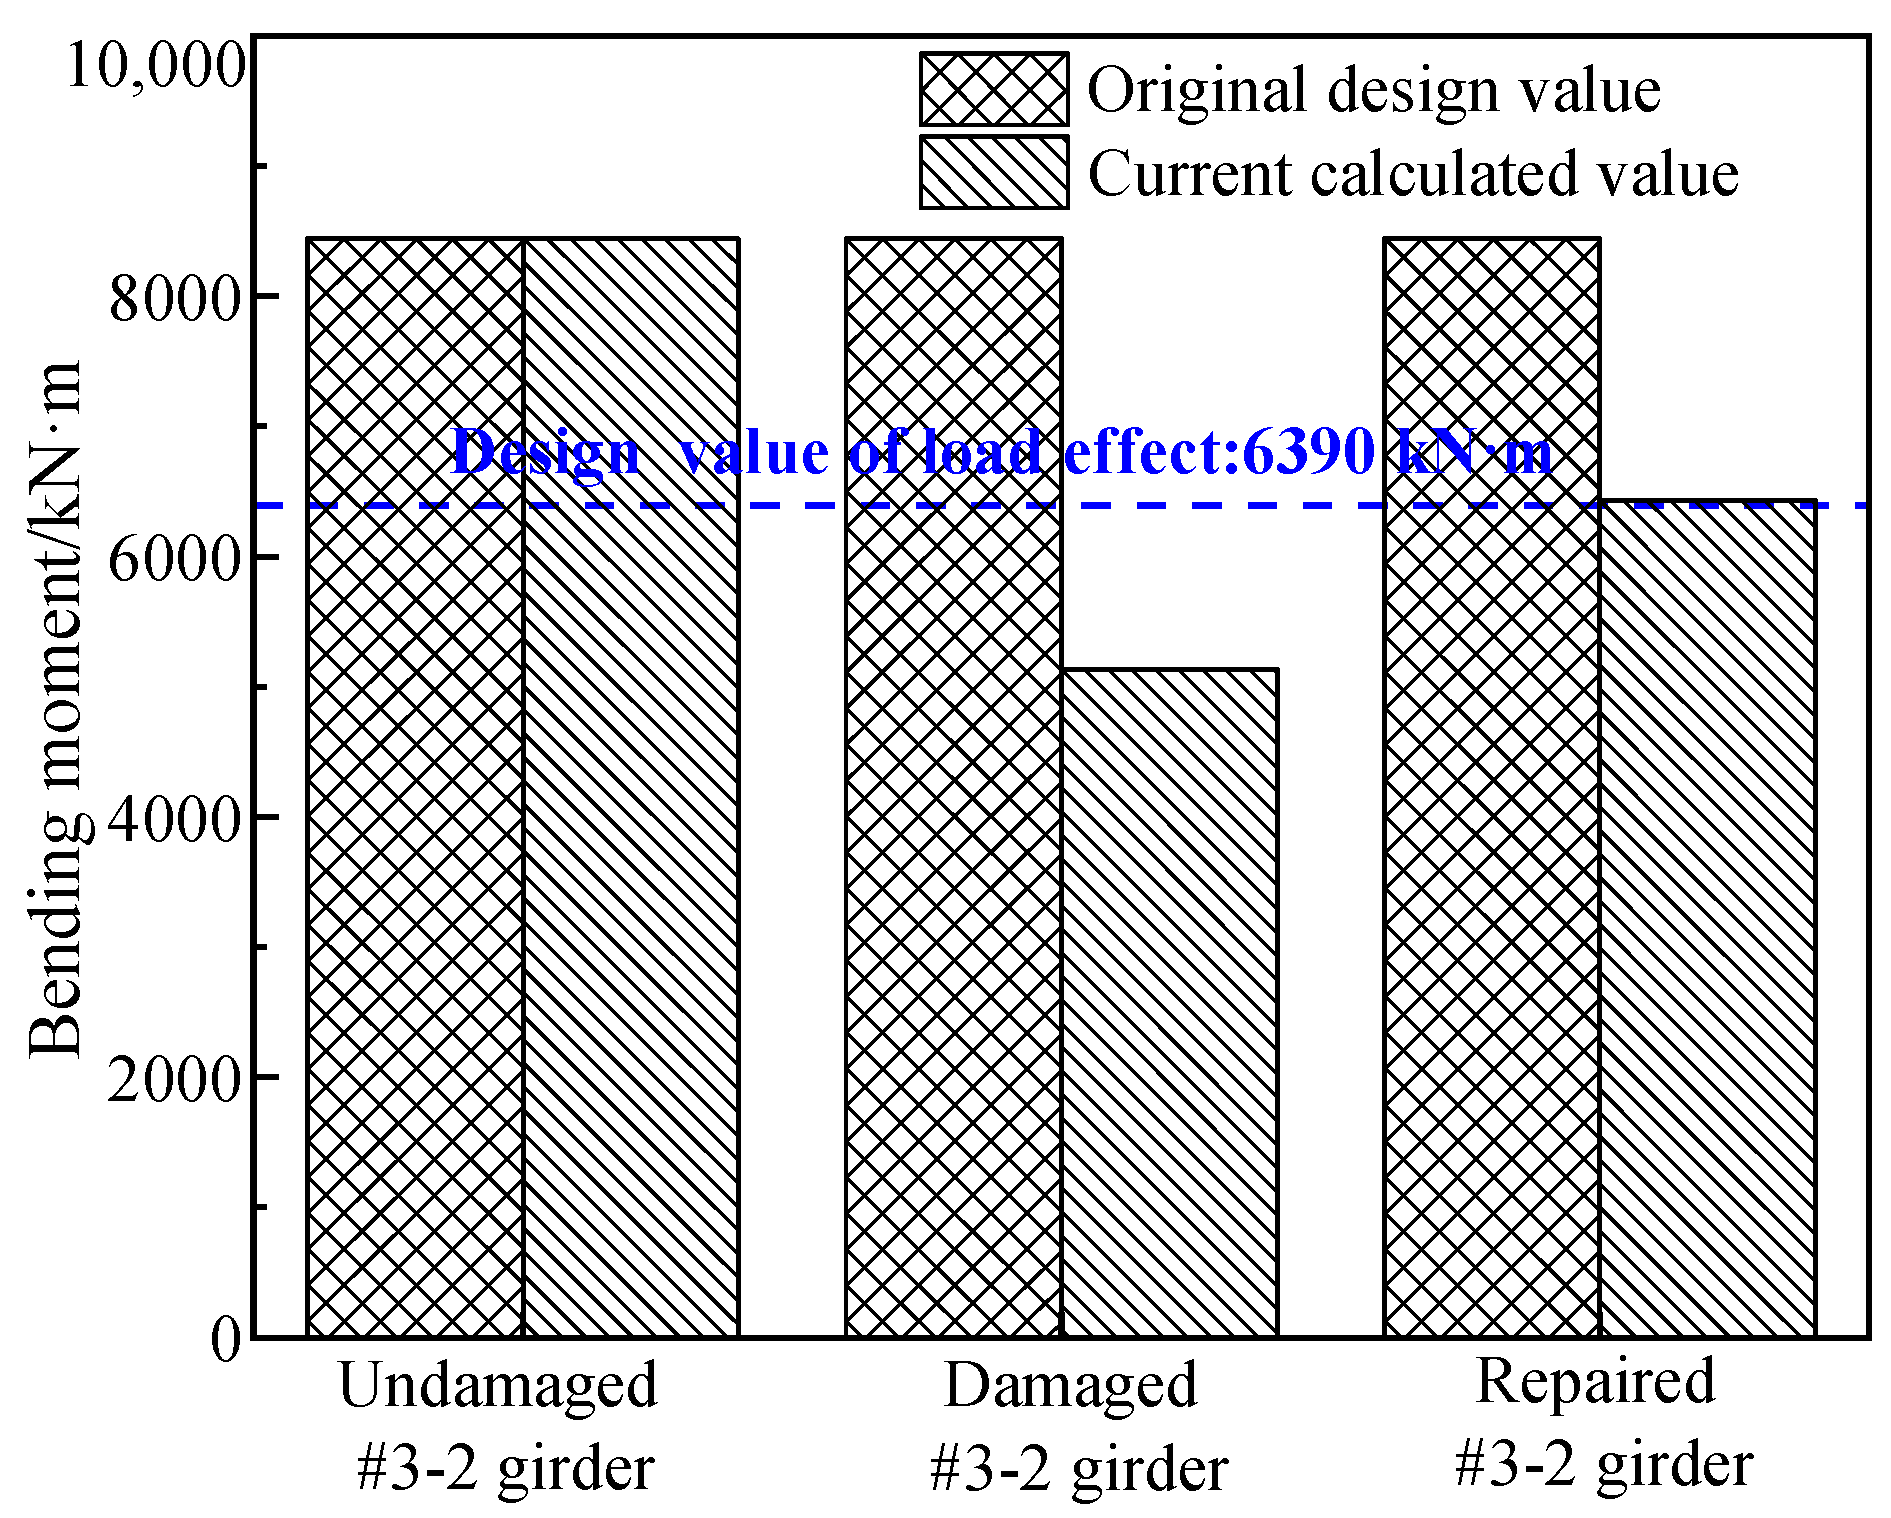
- The ultimate flexural bending capacities of the repaired #3-2 girder strengthened by steel plates and the undamaged #4-1 girder were obtained from a destructive test, and that of the damaged #3-2 girder was obtained by a refined analysis. The actual flexural bearing capacity of the repaired #3-2 girder strengthened by steel plates was 1.63 times the theoretical bearing capacity, which was calculated according to the specification [25], and 36.7% more than that of the damaged #3-2 girder, reaching 95.3% of that of the undamaged #4-1 girder. Although the theoretical flexural capacity of the repaired #3-2 girder strengthened by steel plates failed to meet the traffic requirements for six-axle vehicles, the actual safety factor was greater than three, which indicated a good capacity for vehicle traffic.
- (2)
- The analysis showed that compared with the damaged #3-2 girder, the cracking moment of the repaired #3-2 girder strengthened by steel plates was 12.5% less, the stiffness in the elastic stage was 6.6% more and the maximum deformation was 9.2% less. Compared with the undamaged #4-1 girder, the cracking moment of the repaired #3-2 girder strengthened by steel plates reached 66.3%, the maximum crack width decreased by 24.6% and the stiffness in the elastic stage reached 94.3%. When the repaired #3-2 girder strengthened by steel plates finally failed, the maximum deflection was 2.7% more than the undamaged #4-1 girder. This showed that repaired and strengthening the damaged #3-2 girder improved the ductility, reduced the degree of cracking and increased the durability. Additionally, these results showed that first repairing the damaged #3-2 girder and then strengthening it with steel plates was an effective maintenance and strengthening measure.
- (3)
- The finite element numerical analysis method based on the material testing results of the bridge reflected the mechanical properties and destruction process of the repaired #3-2 girder strengthened by steel plates and the undamaged #4-1 girder. The load vs. deformation curves obtained by this method were basically consistent with those of the failure test. The bearing capacities of the repaired #3-2 girder strengthened by steel plates and the undamaged #4-1 girder were accurately determined, and the errors with respect to the actual bearing capacities were 2.5% and 3.9%, respectively.
- (4)
- Through destructive tests and a refined analysis, some conclusions about the repaired #3-2 girder strengthened by steel plates, damaged #4-2 girder and undamaged #4-1 girder were drawn. However, the improvement of the bearing capacity of an undamaged girder after strengthening has not been explored. Therefore, the destructive test and comparative analysis of the undamaged girder strengthened by CFRP will be carried out in the future.
Author Contributions
Funding
Institutional Review Board Statement
Informed Consent Statement
Data Availability Statement
Conflicts of Interest
References
- Shubbar, A.; Al-khafaji, Z.; Nasr, M.; Falah, M. Using non-destructive tests for evaluating flyover footbridge: Case study. Knowl. -Based Eng. Sci. 2020, 1, 23–39. [Google Scholar] [CrossRef]
- Russo, F.M.; Wipf, T.J.; Klaiber, F.W. Diagnostic Load Tests of a Prestressed Concrete Bridge Damaged by Overheight Vehicle Impact. Transp. Res. Rec. 2000, 1696, 103–110. [Google Scholar]
- Tho, N.C.; Van Thom, D.; Cong, P.H.; Zenkour, A.M.; Doan, D.H.; Van Minh, P. Finite element modeling of the bending and vibration behavior of three-layer composite plates with a crack in the core layer. Compos. Struct. 2023, 305, 116529. [Google Scholar]
- Thai, D.N.; Van Minh, P.; Hoang, C.P.; Duc, T.T.; Cam, N.N.T. Bending of symmetric sandwich FGM beams with shear connectors. Math. Probl. Eng. 2021, 2021, 1–15. [Google Scholar] [CrossRef]
- Dung, N.T.; Van Minh, P.; Hung, H.M.; Tien, D.M. The third-order shear deformation theory for modeling the static bending and dynamic responses of piezoelectric bidirectional functionally graded plates. Adv. Mater. Sci. Eng. 2021, 2021, 1–15. [Google Scholar] [CrossRef]
- JTG 3362-2018; Specifications for Design of Highway Reinforced Concrete and Prestressed Concrete Bridges and Culverts. China Communication Press: Beijing, China, 2018.
- Abbas, H.Q.; Al-Zuhairi, A.H. Flexural Strengthening of Prestressed Girders with Partially Damaged Strands Using Enhancement of Carbon Fiber Laminates by End Sheet Anchorages. Eng. Technol. Appl. Sci. Res. 2022, 12, 8884–8890. [Google Scholar] [CrossRef]
- Shukla, A.K.; Goswami, P.; Maiti, P.R.; Rai, G. Damage Analysis of Simple RC Bridge Girder and its Strengthening Measures. J. Fail. Anal. Prev. 2021, 21, 1374–1386. [Google Scholar] [CrossRef]
- Hou, W.; Huang, F.; Zhang, K. Flexural Behavior on Damaged Steel Beams Strengthening with CFRP Sheets Subjected to Overloading. Polymers 2022, 14, 1419. [Google Scholar] [CrossRef]
- Lei, D.; Chen, G.; Chen, Y.; Ren, Q. Experimental research and numerical simulation of RC beams strengthening with bonded steel plates. Sci. China Technol. Sci. 2012, 55, 3270–3277. [Google Scholar] [CrossRef]
- Al-Hassani, H.M.; Al-Ta’an, S.A.; Mohammed, A.A. Behavior of damaged reinforced concrete beams strengthening with externally bonded steel plate. Tikrit J. Eng. Sci. 2013, 20, 48–59. [Google Scholar] [CrossRef]
- Daouadji, T.H. Analytical and numerical modeling of interfacial stresses in beams bonded with a thin plate. Adv. Comput. Des. 2017, 2, 57–69. [Google Scholar] [CrossRef]
- Altin, S.; Anil, Z.; Kara, M.E. Improving shear capacity of existing RC beams using external bonding of steel plates. Eng. Struct. 2005, 27, 781–791. [Google Scholar] [CrossRef]
- Aykac, S.; Kalkan, L.; Uysal, A. Strengthening of reinforced concrete beams with expoxy-bonded perforated steel plates. Struct. Eng. Mech. 2012, 44, 735–751. [Google Scholar] [CrossRef]
- Alam, M.A.; Sami, A.; Mustapha, K.N. Embedded connectors to eliminate debonding of steel plate for optimal shear strengthening of RC beam. Arab. J. Sci. Eng. 2017, 42, 4053–4068. [Google Scholar] [CrossRef]
- Esfahani, M.; Kianoush, M.; Tajari, A. Flexural behaviour of reinforced concrete beams strengthening by CFRP sheets. Eng. Struct. 2007, 29, 2428–2444. [Google Scholar] [CrossRef]
- Rasheed, H.A.; Abdalla, J.A.; Hawileh, R.A.; Al-Tamimi, A.K. Flexural behavior of reinforced concrete beams strengthening with externally bonded Aluminum Alloy plates. Eng. Struct. 2017, 147, 473–485. [Google Scholar] [CrossRef]
- Abdalla, J.A.; Abu-Obeidah, A.S.; Hawileh, R.A.; Rasheed, H.A. Shear strengthening of reinforced concrete beams using externally-bonded aluminum alloy plates: An experimental study. Constr. Build. Mater. 2016, 128, 24–37. [Google Scholar] [CrossRef]
- Rakgate, S.M.; Dundu, M. Strength and ductility of simple supported R/C beams retrofitted with steel plates of different width-to-thickness ratios. Eng. Struct. 2018, 40, 192–202. [Google Scholar] [CrossRef]
- Duc, D.H.; Van Minh, P.; Tung, N.S. Finite element modelling for free vibration response of cracked stiffened FGM plates. Vietnam. J. Sci. Technol. 2020, 58, 119–129. [Google Scholar]
- Van Phung, M.; Nguyen, D.T.; Doan, L.T.; Van Duong, T. Numerical investigation on static bending and free vibration responses of two-layer variable thickness plates with shear connectors. Iran. J. Sci. Technol. Trans. Mech. Eng. 2022, 46, 1047–1065. [Google Scholar] [CrossRef]
- Kralovanec, J.; Bahleda, F.; Moravcik, M. State of prestressing analysis of 62-year-old bridge. Materials 2022, 15, 3583. [Google Scholar] [CrossRef]
- Mateckova, P.; Bilek, V.; Sucharda, O. Comparative study of high-performance concrete characteristics and loading test of pretensioned experimental beams. Crystals 2021, 11, 427. [Google Scholar] [CrossRef]
- Li, Y.; Yu, Z.; Wu, Q.; Liu, Y.; Wang, S. Experimental-Numerical Study on the Flexural Ultimate Capacity of Prestressed Concrete Box Girders Subjected to Collision. Materials 2022, 15, 3949. [Google Scholar] [CrossRef] [PubMed]
- Nie, J.; Wang, Y.; Cai, C.S. Experimental research on fatigue behavior of RC beams strengthening with steel plate-concrete composite technique. J. Struct. Eng. 2011, 137, 772–781. [Google Scholar] [CrossRef]
- Li, Y.; Zhang, J.; Chen, Y.; Wu, L. Ultimate flexural capacity of a severely damaged reinforced concrete T-girder bridge. J. Bridge Eng. 2017, 22, 05017003. [Google Scholar] [CrossRef]
- Bagge, N.; Popescu, C.; Elfgren, L. Failure tests on concrete bridges: Have we learnt the lessons. Struct. Infrastruct. Eng. 2018, 14, 292–319. [Google Scholar] [CrossRef] [Green Version]
- Zhang, J.; Ren, H.; Yu, B. Failure Testing of a Full-Scale Reinforced Concrete T-Girder Bridge. Adv. Mater. Res. 2011, 1269, 1767–1773. [Google Scholar]
- Miller, R.A.; Aktan, A.E.; Shahrooz, B.M. Destructive Testing of Decommissioned Concrete Slab Bridge. J. Struct. Eng. 1994, 120, 2176–2198. [Google Scholar] [CrossRef]
- Zhang, J.; Peng, H.; Cai, C.S. Destructive Testing of a Decommissioned Reinforced Concrete Bridge. J. Bridge Eng. 2013, 18, 564–569. [Google Scholar] [CrossRef]
- Murray, C.; Arancibia, M.D.; Okumus, P.; Floyd, R.W. Destructive testing and computer modeling of a scale prestressed concrete I-girder bridge. Eng. Struct. 2019, 183, 195–205. [Google Scholar] [CrossRef]
- Martina, Š.; David, L.; Jiří, D.; Drahomír, N. Modeling of degradation processes in concrete: Probabilistic lifetime and load-bearing capacity assessment of existing reinforced concrete bridges. Eng. Struct. 2016, 119, 49–60. [Google Scholar]
- GB 50017-2017; Standard for Design of Steel Structures. Ministry of housing and Urban-Rural Development of China: Beijing, China, 2017.
- JTGT522-2008; Specifications for Strengthening Design of Highway Bridges. Ministry of Transport of the People’s Republic of China: Beijing, China, 2008.
- Abaqus, Inc. ABAQUS Analysis User’s Manual; Abaqus, Inc.: Providence, RI, USA, 2004. [Google Scholar]


| #3-2 Girder | ƒcd/MPa | ƒsd/MPa | ƒ′sd/MPa | ƒpd/MPa | As/mm2 | A′s/mm2 | Ap/mm2 | h0/mm | a′s/mm | x/mm |
|---|---|---|---|---|---|---|---|---|---|---|
| Undamaged | 22.4 | 280 | 280 | 1260 | 4181 | 2670 | 4726 | 1253 | 45 | 142.4 |
| Damaged | 22.4 | 195 | 280 | 1260 | 707 | 2670 | 3475 | 1178 | 45 | 84.1 |
| Repaired | 22.4 | 280 | 280 | 1260 | 4181 | 2670 | 3475 | 1211 | 45 | 107.2 |
| Materials | Design Strength/MPa | Measured Strength/MPa | Elastic Modulus/N·mm−2 | Density/N·mm−3 | |
|---|---|---|---|---|---|
| Tensile | Shear | Tensile | |||
| Q345 steel plates | 275 | 160 | 385 | 2.1 × 10⁵ | 7.7 × 10⁻⁵ |
| Q345 anchor | 160 | – | – | 2.1 × 10⁵ | 7.7 × 10⁻⁵ |
| Number of Strands | /MPa | /MPa | /MPa | /MPa | /MPa | /MPa | /MPa |
|---|---|---|---|---|---|---|---|
| N1 | 1395 | 56.71 | 120.18 | 14.33 | 24.92 | 65.36 | 1113.49 |
| N2 | 1395 | 56.71 | 120.18 | 14.33 | 24.92 | 65.36 | 1113.49 |
| N3 | 1395 | 56.71 | 120.18 | 14.33 | 24.92 | 65.36 | 1113.49 |
| N4 | 1395 | 33.63 | 92.67 | 14.94 | 30.71 | 68.38 | 1154.67 |
| Bending Moment | Undamaged #3-2 Girder | Damaged #3-2 Girder | Refined Model of the Repaired #3-2 Girder Strengthened by Steel Plates |
|---|---|---|---|
| Value/kN·m | Value/kN·m | Value/kN·m | |
| Cracking moment | 7272 | 4887 | 5748 |
| Ultimate bending moment | 13,831 | 9551 | 13,367 |
| Girder | Bending Moment | Theoretical | Refined Analysis | Destructive Test | ||
|---|---|---|---|---|---|---|
| Value/kN·m | Value/kN·m | Error/% | Value/kN·m | Error/% | ||
| Undamaged #4-1 girder | Cracking moment | 6984 | 7272 | 4.1 | 7034 | 0.7 |
| Ultimate bending moment | 8442 | 13,831 | 63.8 | 13,500 | 60.0 | |
| Repaired #3-2 girder strengthened by steel plates | Cracking moment | 5124 | 5682 | 10.9 | 5417 | 5.7 |
| Ultimate bending moment | 7913 | 13,367 | 63 | 12,864 | 53.6 | |
| Type of Truck | Bending Moment | Safety Coefficient | ||||||
|---|---|---|---|---|---|---|---|---|
| Ultimate Bearing Capacity of the Undamaged #4-1 Girder | Ultimate Bearing Capacity of the Repaired #3-2 Girder Strengthened by Steel Plates | Ultimate Bearing Capacity of the Damaged #3-2 Girder | ||||||
| The Dead Load | The Different Types of Vehicles | Theoretical Prediction | Destructive Test | Theoretical Prediction | Destructive Test | Theoretical Prediction | Refined Model | |
| /kN·m | /kN·m | (8442 kN·m) | (13,500 kN·m) | (7913 kN·m) | (12,864 kN·m) | (5127 kN·m) | (9551 kN·m) | |
| 1 | 2 053 | 1 720 | 3.71 | 6.66 | 3.41 | 6.29 | 1.79 | 4.36 |
| 2 | 2 053 | 2 301 | 2.78 | 4.97 | 2.55 | 4.70 | 1.34 | 3.26 |
| 3 | 2 053 | 2 947 | 2.17 | 3.88 | 1.99 | 3.67 | 1.04 | 2.54 |
Disclaimer/Publisher’s Note: The statements, opinions and data contained in all publications are solely those of the individual author(s) and contributor(s) and not of MDPI and/or the editor(s). MDPI and/or the editor(s) disclaim responsibility for any injury to people or property resulting from any ideas, methods, instructions or products referred to in the content. |
© 2023 by the authors. Licensee MDPI, Basel, Switzerland. This article is an open access article distributed under the terms and conditions of the Creative Commons Attribution (CC BY) license (https://creativecommons.org/licenses/by/4.0/).
Share and Cite
Li, Y.; Yu, Z.; Liu, Y. Experimental and Numerical Study of the Ultimate Flexural Capacity of a Full-Size Damaged Prestressed Concrete Box Girder Strengthened with Bonded Steel Plates. Materials 2023, 16, 2476. https://doi.org/10.3390/ma16062476
Li Y, Yu Z, Liu Y. Experimental and Numerical Study of the Ultimate Flexural Capacity of a Full-Size Damaged Prestressed Concrete Box Girder Strengthened with Bonded Steel Plates. Materials. 2023; 16(6):2476. https://doi.org/10.3390/ma16062476
Chicago/Turabian StyleLi, Yong, Zijie Yu, and Yongqian Liu. 2023. "Experimental and Numerical Study of the Ultimate Flexural Capacity of a Full-Size Damaged Prestressed Concrete Box Girder Strengthened with Bonded Steel Plates" Materials 16, no. 6: 2476. https://doi.org/10.3390/ma16062476