Article

Experimental and Statistical Study on the Properties of Basic Oxygen Furnace Slag and Ground Granulated Blast Furnace Slag Based Alkali-Activated Mortar

1
Oyak Cement Concrete Paper Group/Betâo Liz SA, 1099-020 Lisbon, Portugal
2
Department of Civil Engineering, Yildiz Technical University, Istanbul 34220, Turkey
3
LBA Design and Consultancy, Istanbul 34750, Turkey
*
Author to whom correspondence should be addressed.
Materials 2023, 16(6), 2357; https://doi.org/10.3390/ma16062357
Submission received: 30 January 2023 / Revised: 27 February 2023 / Accepted: 10 March 2023 / Published: 15 March 2023
(This article belongs to the Special Issue Research on Novel Sustainable Binders, Concretes and Composites)

Abstract

:
Basic oxygen furnace slag (BOFS) is a waste material generated during the steelmaking process and has the potential to harm both the environment and living organisms when disposed of in a landfill. However, the cementitious properties of BOFS might help in utilizing this waste as an alternative material in alkali-activated systems. Therefore, in this study, BOFS and blast furnace slag were activated with varying dosages of NaOH, and the fresh, physical, mechanical, and microstructural properties were determined along with statistical analysis to reach the optimal mix design. The test results showed that an increase in BOFS content decreased compressive and flexural strengths, whereas it slightly increased the water absorption and permeable pores of the tested mortar samples. On the contrary, the increase in NaOH molarity resulted in a denser microstructure, reduced water absorption and permeable pores, and improved mechanical properties. Statistically significant relationships were obtained through response surface methodology with optimal mix proportions, namely, (i) 24.61% BOFS and 7.74 M and (ii) 20.00% BOFS and 8.90 M, which maximize the BOFS content with lower molarity and improve the mechanical properties with lower water absorption and porosity, respectively. The proposed methodology maximizes the utilization of waste BOFS in alkali-activated systems and may promote environmental and economic benefits.

1. Introduction

The utilization of waste materials has become crucial within the past decades due to challenges in minimizing waste disposal and preventing environmental degradation. Construction materials industries are regarded as the third-largest source of CO2 emissions among industrial sectors throughout the world and account for about 10% of global anthropogenic CO2 emissions [1]. Construction materials sectors are mostly related to concrete manufacturing, and significantly increasing construction activities have caused the production of cement to increase at an alarming rate. The fact that cement production releases approximately 8 to 10% of total CO2 [2] has prompted researchers across the world to explore substitutions for traditional cement or concrete with the purpose of minimizing the carbon footprint and reducing environmental concerns. The increasing demand for cement has led to the significant consumption of raw materials and CO2 emissions and thus requires environmentally friendly alternative materials as substitutes for cement.
Slags generated by metallurgical industries are classified on the basis of (i) the ironmaking process and (ii) the steelmaking process. The ironmaking process produces blast furnace slag, and, on the other hand, the steelmaking process results in the generation of basic oxygen furnace slag (BOFS), electric-arc furnace slag (EAFS), and ladle slag (LS) [3]. BOFS is one of the waste materials generated in considerable amounts during the steelmaking process [4,5]. Approximately 71.9% of steel was reported to be produced via an oxygen furnace [6], with a BOFS generation of about 100 to 200 kg per ton of steel production [7], exemplifying the considerable amount of BOFS generation. Moreover, about 15.7 million tons of steelmaking slag production was reported for 2018 in Europe, from which around 2.0 Mtons was reported to be disposed of as waste [8]. The disposed BOFS might be harmful to both the environment and living organisms since it releases toxic species during the processes of aging and the leaching of metallic compounds such as Fe2O3, Al2O3, and MgO present in BOFS [9]. Therefore, an alternative approach should be established to efficiently utilize generated BOFS waste.
Several studies on the utilization of BOFS in road construction, in asphalt, and as an aggregate have been reported in the literature. However, the expansion behavior of BOFS due to the existence of free CaO and MgO limits its application, which remains a challenge [10]. Several attempts have been made to stabilize free lime to minimize the expansion. Liu et al. [11] remelted and solidified raw BOFS under Ar and air atmosphere conditions and reported that BOFS processed in air significantly stabilized the free lime content and decreased the RO phases. Similarly, Morone et al. [12] claimed that a carbonation and granulation treatment might be a reliable technique to stabilize the volumetric instability of BOFS. In this methodology, BOFS was exposed to CO2 to allow the formation of CaCO3 via its reaction with free CaO present in BOFS particles. BOFS, having fineness similar to that of cement, can be used in small amounts as an additive in cement without undermining the integrity of the cement [13]. A study by Ma et al. [14] revealed that the compressive strength of the paste formulated with carbonated BOFS and cement was reduced with increasing BOFS content. Lin et al. [15] studied the synergetic valorization of BOFS and stone coal with the aim to recover metal and prepare glass ceramics. They obtained a final modified slag, which was successfully utilized to produce glass ceramics with a maximum bending strength of 95.83 MPa. Sun et al. [16] utilized BOFS aggregate to replace natural limestone in a metakaolin-based geopolymer. The metakaolin-based geopolymer concrete that completely replaced natural limestone yielded enhanced physical and mechanical properties.
Several studies concerning the application of BOFS have been reported in the literature. However, studies regarding the alkali activation of BOFS are still limited. Alkali-activated materials are synthesized using aluminosilicate materials and alkaline activators [17], which have gained significant attention from researchers. Alkali-activated materials exhibit remarkably superior mechanical durability properties or even outperform Portland cement [17,18]. Industrial by-products or mineral admixtures such as fly ash [19,20], ground granulated blast furnace slag (GGBFS) [21,22], metakaolin [23,24], and waste glass [25,26] are used to produce alkali-activated materials, whose major hydration component is silica-alumina gel [27,28].
A few studies have been reported on the utilization of BOFS either in alkaline activation [4,29] or as a cement replacement [14]. However, the use of an alkali-activated mortar (AAM) incorporating BOFS and GGBFS activated with an alkaline solution of sodium hydroxide (NaOH) remains unexplored. More attention has been paid to using steelmaking slags such as EAFS [30,31,32,33] and LS [34,35,36,37,38], while less attention has been paid to using other waste products such as BOFS for AAMs. Therefore, this study primarily aimed to propose an environmentally friendly method that efficiently utilizes BOFS generated as waste from steel industries to potentially promote environmental benefits and address economic problems related to waste BOFS. In the present study, the fresh, hardened, and microstructural properties of AAM consisting of different ratios of BOFS blended with GGBFS activated with various NaOH molarities have been investigated. The reason behind blending GGBFS with BOFS is the pozzolanic properties of GGBFS, which is involved in the reaction with precipitated Ca(OH)2 [32,39] produced due to free CaO present in BOFS, and this may stabilize the volume expansion [40]. Statistical interpretation and mathematical modeling were also performed using response surface methodology (RSM) to investigate the effect of the BOFS ratio and the concentration of NaOH on the investigated properties. RSM is a vital tool that involves analyzing and modeling the response of interest when it is influenced by several input parameters [41]. RSM offers an effective way to design experimental conditions and assess the relationship between independent and dependent variables with an aim to optimize and obtain targeted results [42]. The material consumption and cost can be significantly minimized once a reliable prediction model for the investigated properties of AAM is established.

2. Materials and Methodology
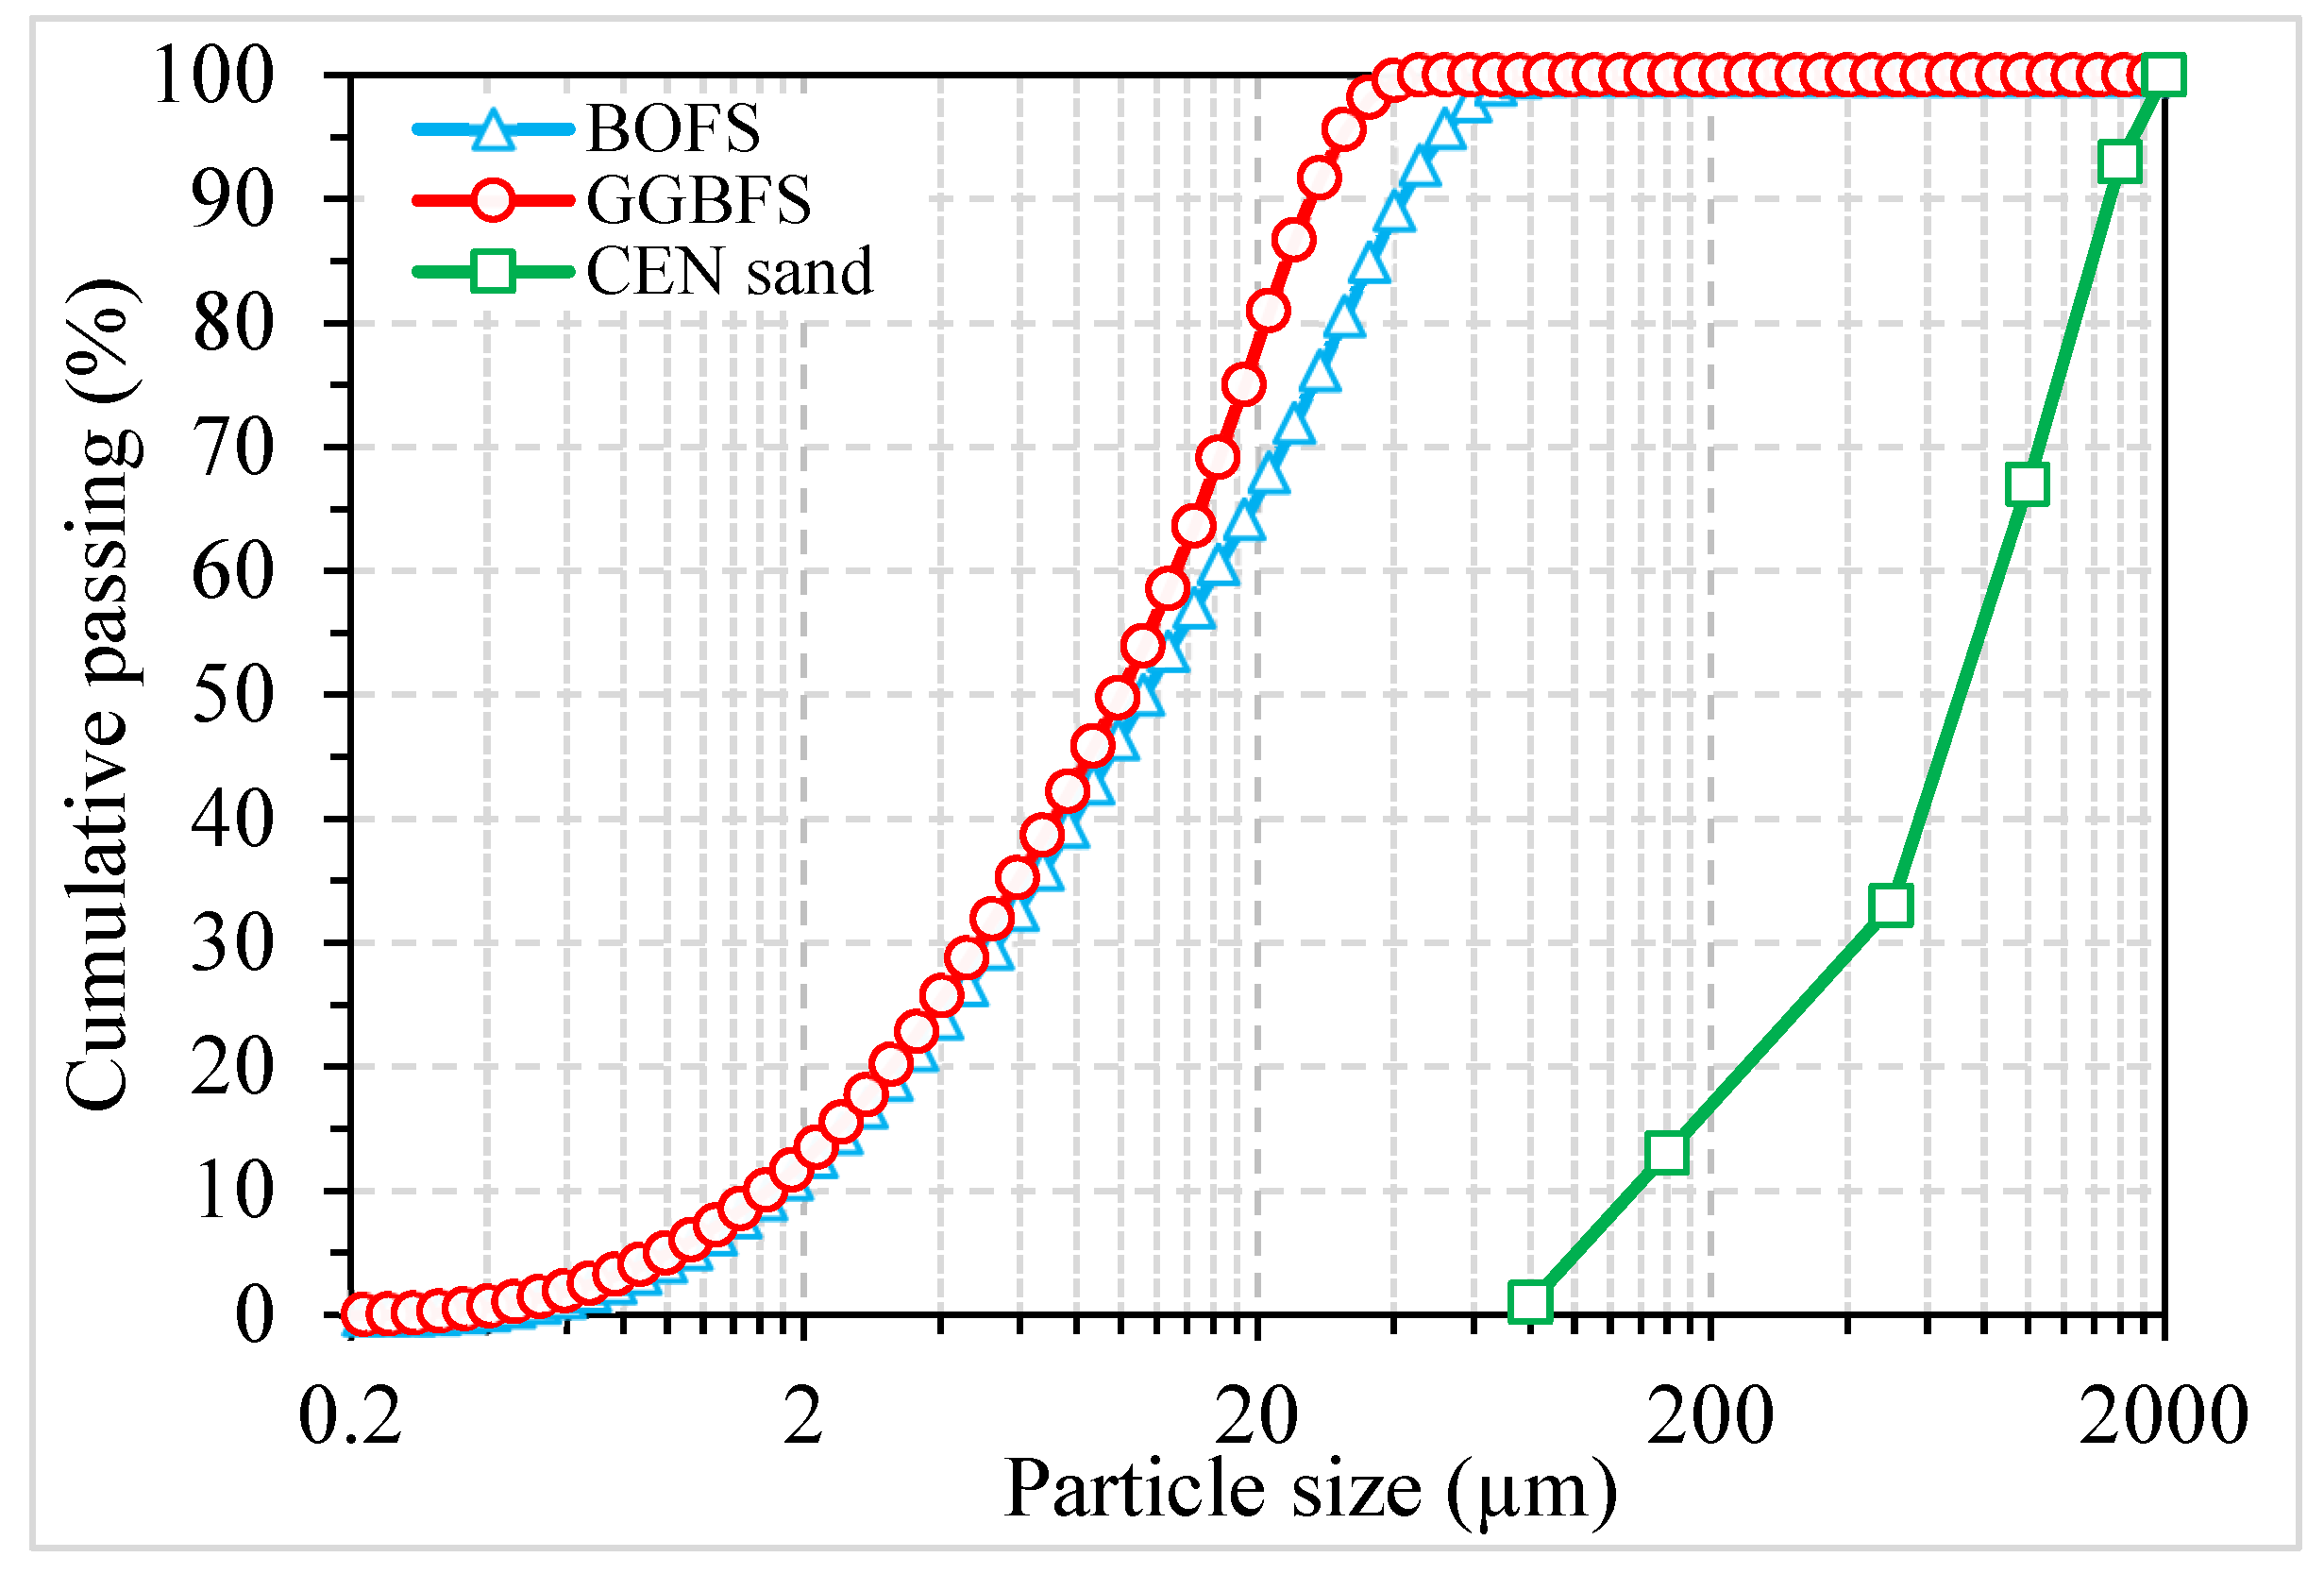
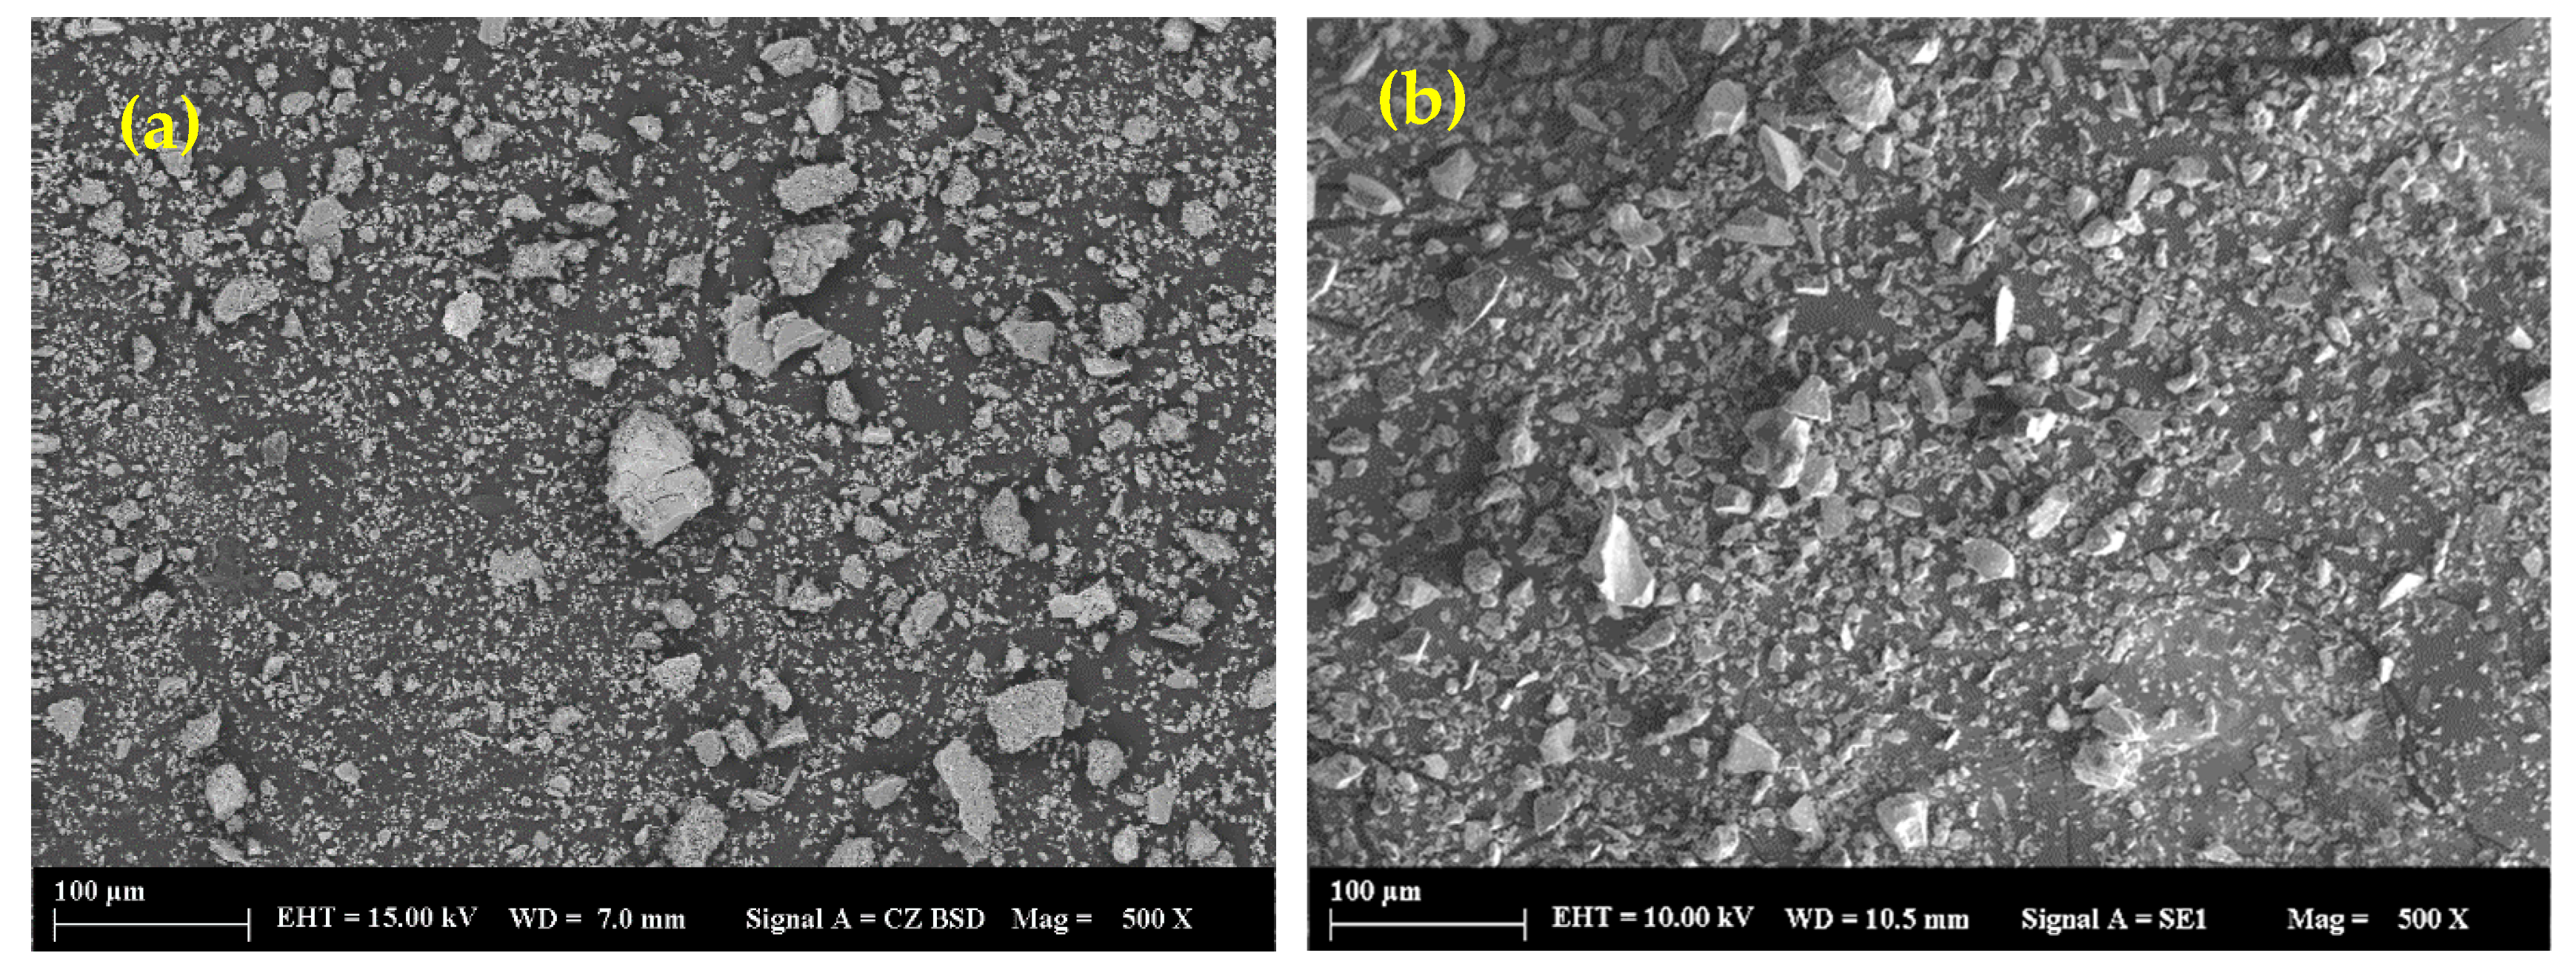
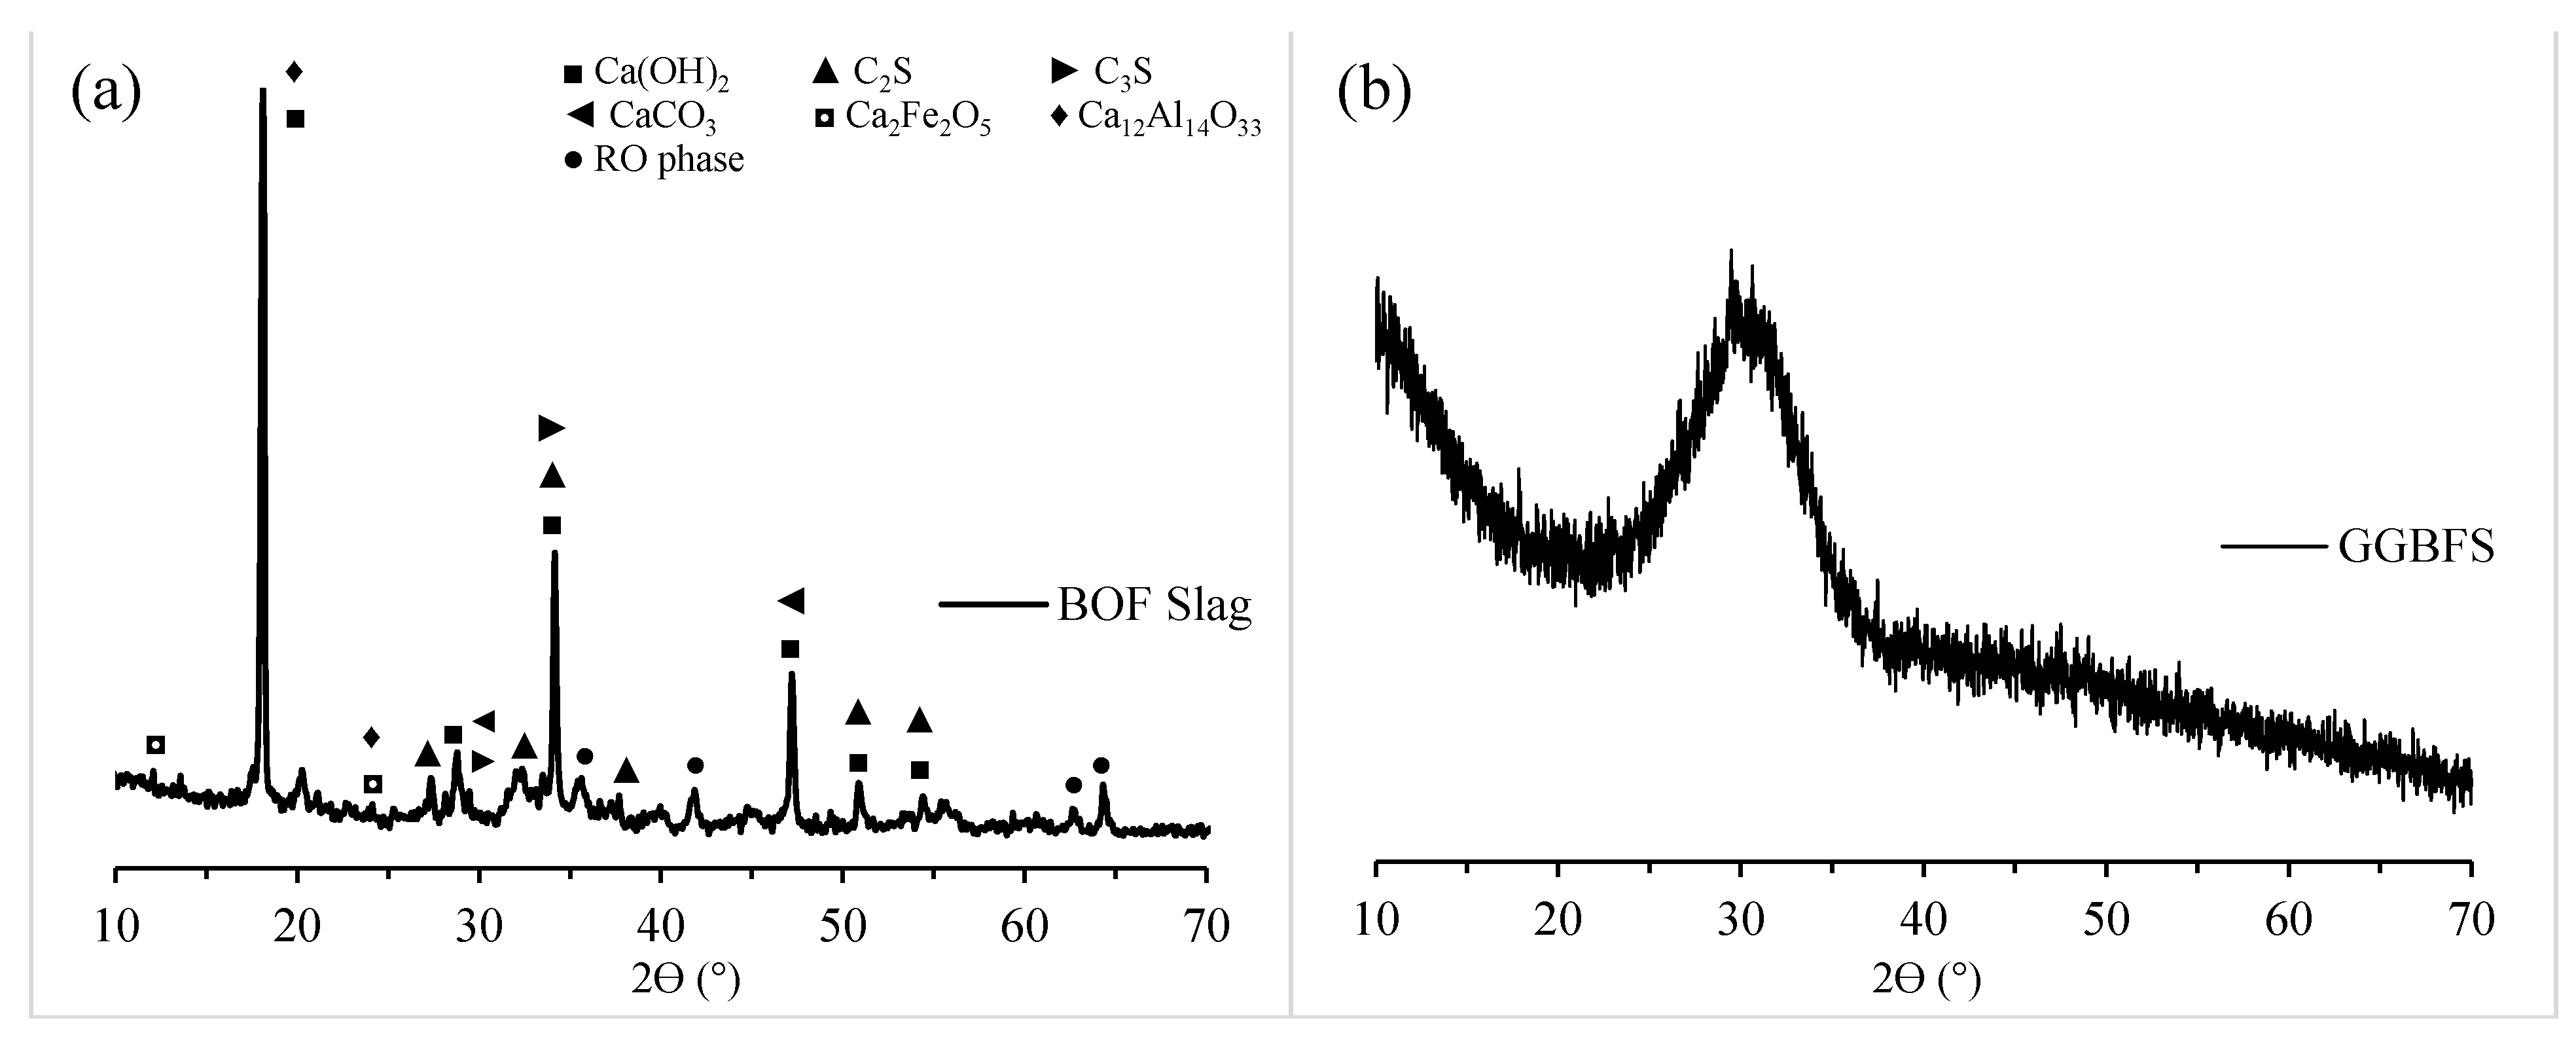
2.1. Raw Materials

Basic oxygen furnace slag (BOFS) and ground granulated blast furnace slag (GGBFS), supplied by Erdemir Steel factory (Ereğli, Turkey) and Oyak Cement factory (Bolu, Turkey), respectively, were used to investigate the various properties of AAM. BOFS was initially dried and ground using mechanical disc grinder. Commercial NaOH with a pH value >14.0 and a molecular weight of 40.0 was used as the alkaline activator. CEN standard sand with particle sizes ranging between 0.08 and 2.00 mm was utilized as fine aggregate to manufacture mortar samples. Figure 1 shows the particle size distributions of BOFS, GGBFS, and sand. It can be observed that BOFS particles were slightly coarser compared to those of GGBFS since the d50 and d90 of BOFS were 11.2 and 41.4 µm, and those of GGBFS were 9.93 and 26.2 µm, respectively. The SEM images of the binders shown in Figure 2 indicate that BOFS has a rather rough surface texture compared to GGBFS, and both show a highly angular particle shape. The specific gravities of the ground BOFS, GGBFS, and sand were 3.01, 2.91, and 2.67, respectively. An X-ray fluorescence analysis was performed to determine the chemical composition of the binding materials, and the results are tabulated in Table 1. X-ray diffractometry analysis (XRD) was performed in the raw BOFS and GGBFS to determine their crystalline phases, and the results are shown in Figure 3. The majority of the crystalline phases present in BOFS were Ca(OH)2, C2S, C3S, Ca2Fe2O5, Ca12Al14O33, and RO phases [4]. Moreover, GGBFS had an amorphous structure (Figure 3b), showing a broader hump in the range between 25 and 40° 2θ, with crystalline phases such as SiO2, MgCO3, and CaCO3.

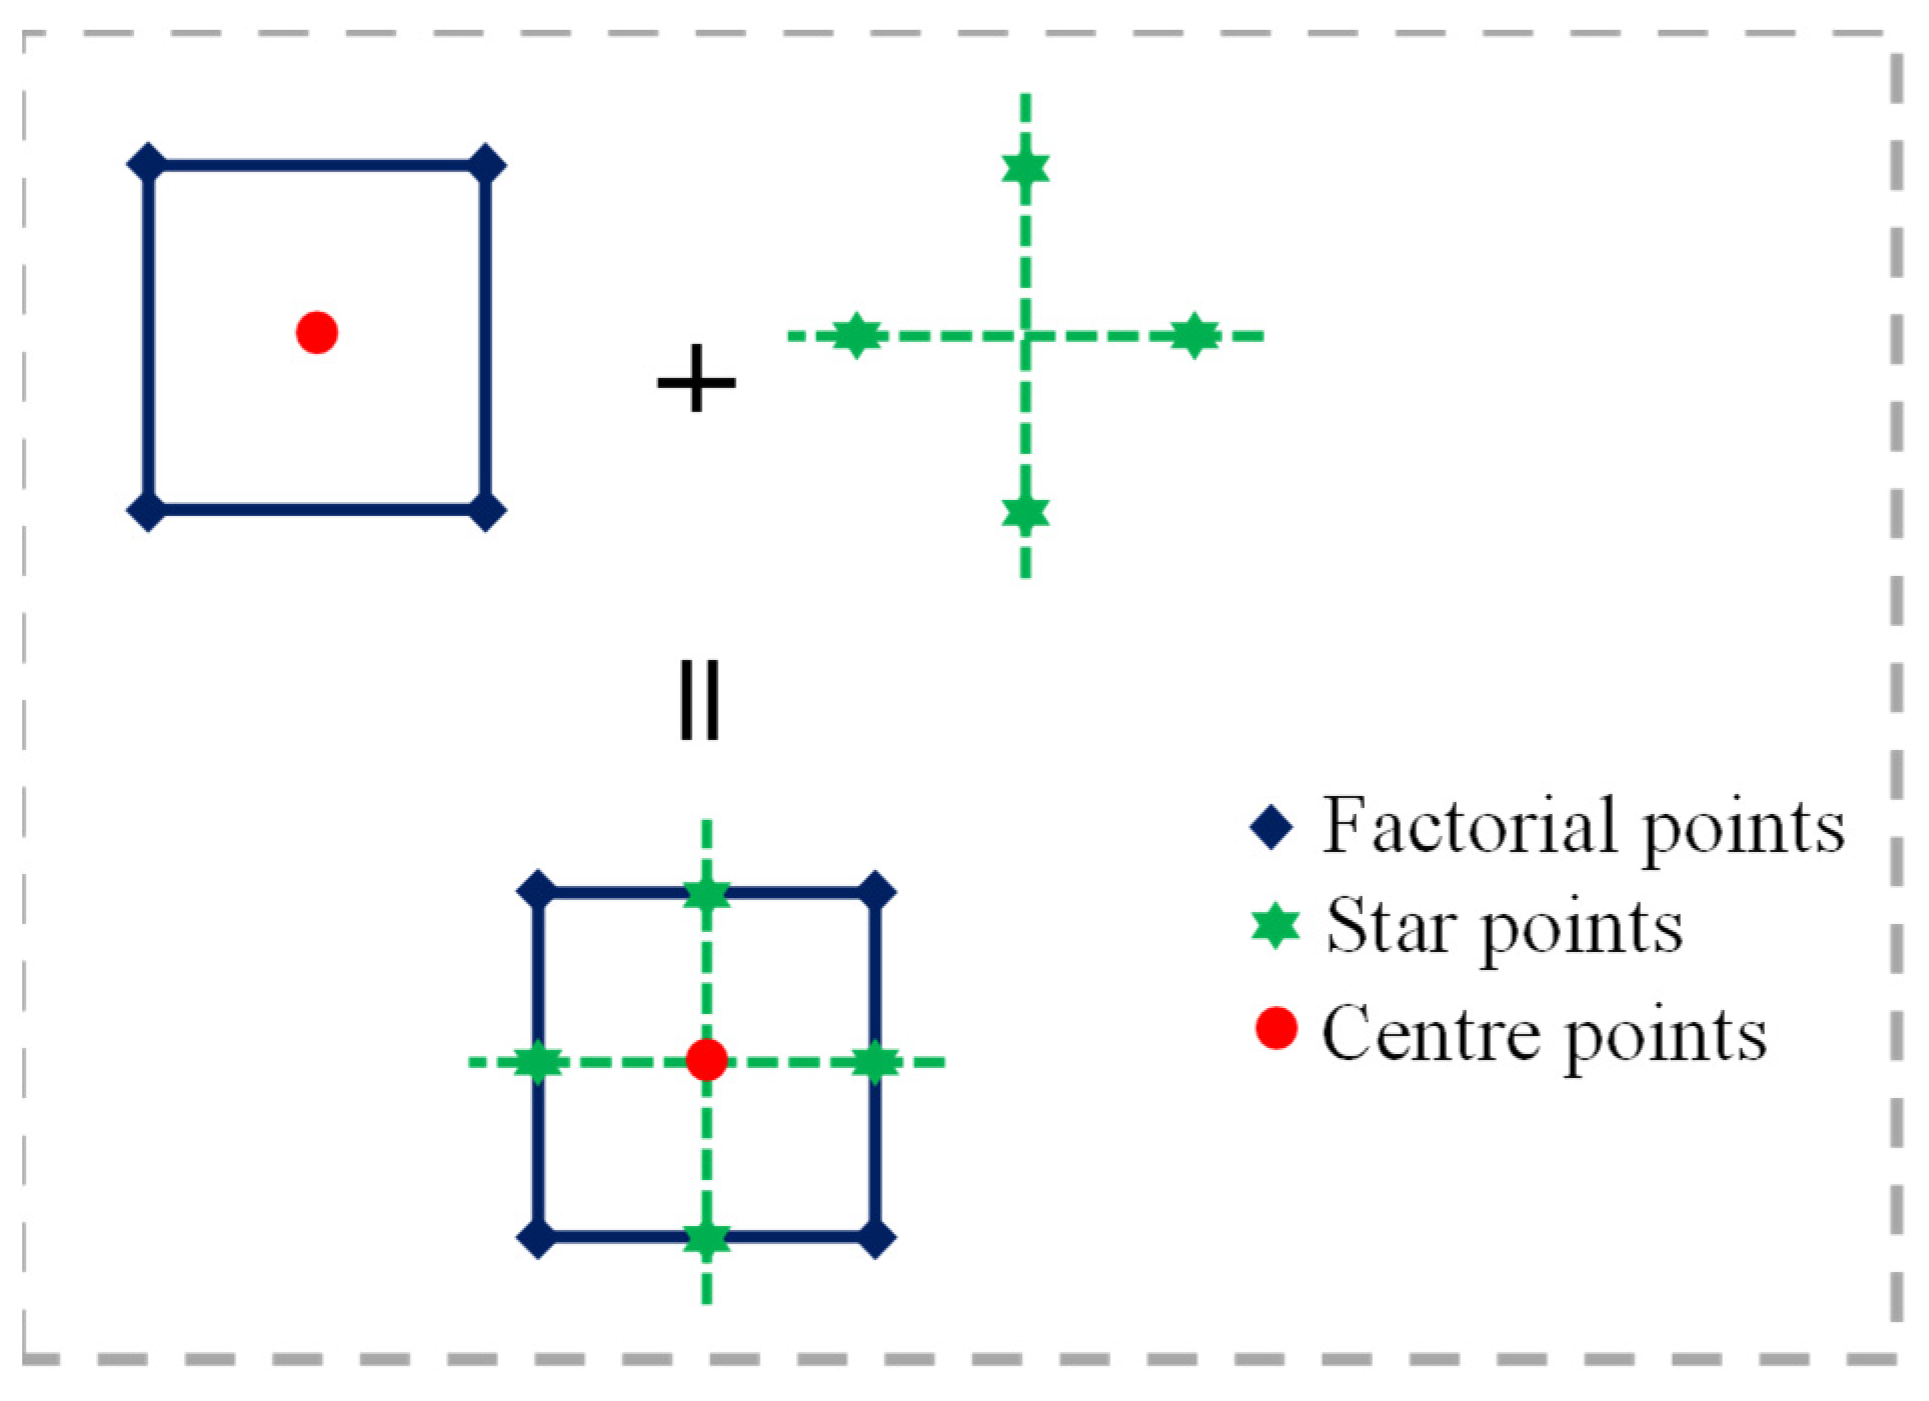
2.2. Design of Experiment, Model Efficacy Evaluation, and Mix Proportion

In this study, the commercially available Design-Expert® 11 software was implemented to perform statistical interpretation, mathematical modeling, and the optimization of the mix designs using RSM. RSM is considered an efficacious statistical tool that is mainly employed for experimental design, mathematical modeling, and optimization [43]. RSM assists in the evaluation of responses that are affected by one or more factors [44]. Face-centered central composite design (FCCD), a subset of RSM, was used to statistically examine the effects of the independent parameters, namely, the BOF ratio and the molarity of NaOH, on the dependent variables: flow values, compressive strength, flexural strength, and water absorption. The influence of each parameter and the interaction among the variables were investigated using analysis of variance (ANOVA). A second-order regression model was used to determine the optimum condition of the investigated responses, as shown in the general formula in Equation (1) [45].
Y = β o + i = 1 k β i i X i + i = 1 k β i i X i 2 + i = 1 k 1 j = i + 1 k β i i X i X j + Ѐ  
where Y and β represent the predicted response and regression coefficient, respectively. Xi and Xj denote the coded terms of parameters, k denotes the number of parameters studied in the experiment, i and j are the linear coefficient and quadratic coefficient, respectively, and ɛ is the observed error.
The values of the BOFS ratio by mass of binder and NaOH molarity varied in the ranges of 20–60% and 2–10 M, respectively. A visual representation of FCCD is shown in Figure 4, and Table 2 depicts the actual and coded terms of the input parameters. The BOFS ratio and NaOH molarity varied in three different levels, namely, axial or star points (±α) = 1, corner or factorial points (±1), and the center points. A total of 13 mix proportions, tabulated in Table 3, were obtained and consisted of 2 independent factors, 8 non-center points, and 5 replicates at the center points. Replicates at the center are very important since they assist in the estimation of the experimental error [45]. The water-to-binder ratio was kept constant at 0.4 for all mixes. Similarly, the volumes of sand and paste were used in equal amounts for each mix.
The assessment of the predicted RSM models was performed based on the mean square error (MSE), root-mean-square error (RMSE), and Nash–Sutcliffe coefficient efficiency (NSE), shown in Equations (2)–(5) [46,47]. These values were determined using experimental/observed values (OVs) and predicted values (PVs).
M S E = P V O V 2 N
R M S E = P V O V 2 N = M S E  
N t = S D R M S E 1  
N S E = 1 1 N t + 1 2
where N is the sample size, SD represents the standard deviation of the observed values, and Nt denotes the number of times the SD is greater than RMSE. The efficiency of the predicted RSM models can be categorized in terms of very good, good, acceptable, and satisfactory for NSE ≥ 0.90, 0.80–0.90, 0.65–0.80, and <0.65, respectively. In addition, the performance of a model can be categorized as very good, good, acceptable, and satisfactory if the SD value is in the ranges of ≥3.2RMSE, 2.2RMSE–3.2RMSE, 1.2RMSE–2.2RMSE, and <1.7RMSE, respectively [46].

2.3. Specimen Preparation

The mix proportions obtained from FCCD (Table 3) were used to manufacture the AAM specimens. The mix ID, for instance, designated by B0.2-6 denotes 20% BOFS content by mass of total binder and 6 M NaOH. The AAM mixes contained 50% sand by volume. The alkaline solution was prepared by mixing solid NaOH flakes with tap water in graduated cylinders, air-tightened, and left to cool under laboratory conditions prior to mixing. The blend of BOFS and GGBFS powder was initially mixed and introduced into a mixer bowl containing the alkaline solution, and thereafter, mixing was initiated. The sand was gradually added, and the mixing of the mortar continued to ensure a homogeneous mixture. The fresh mortar was used to determine the flow values and subsequently poured into molds for specified tests. The mortar was cast into 50 × 50 × 50 mm3 cubic molds to determine the compressive strength and water absorption and 40 × 40 × 160 mm3 prismatic molds to examine the flexural strength. The prepared samples along with the molds were covered with a waterproof plastic sheet and kept in laboratory conditions. The specimens were demolded after 24 h and conditioned in a humidity cabin having a relative humidity of 55–57% and a temperature of 20–22 °C until tested.

2.4. Laboratory Experimental Program

2.4.1. Flow

The flow value of the fresh mortar was determined in accordance with ASTM C1437 to evaluate the workability. A minimum of four diameter readings were recorded to the nearest millimeter. The flow diameter of each mortar mix was calculated to the nearest 1% using Equation (6).
F l o w = Φ Φ 0 × 100 %  
where Φ is the difference between the average of four diameter readings and the original base diameter, and Φo is the diameter of the original base.

2.4.2. Compressive Strength

Compressive strength tests were performed on 50 × 50 × 50 mm3 cubic mortar samples at 28 days following ASTM C109. A minimum of three samples for each mortar mix were tested using a universal compression machine (Alşa, Istanbul, Turkey) with a loading rate of 900 to 1800 N/s at the specified age, and the average values were recorded.

2.4.3. Flexural Strength

A flexural strength test of the mortar specimens was performed at 28 days in accordance with the ASTM C348 standard. The test was performed using a universal compression machine with a loading rate of 40 ± 5 N/s on 3 specimens for each mix, and the flexural strength was calculated using Equation (7).
F l e x u r a l   s t r e n g t h = 0.0028 × N  
where N is the average of maximum loads (in N).

2.4.4. Water Absorption and Permeable Pore Volume

The water absorption and permeable pore volume were determined in accordance with ASTM C 642-13, with a slight modification to the pre-drying process of the mortar specimens. The mortar specimens were dried at 60 °C instead of 110 ± 5 °C to prevent excessive desiccation of the binding phases caused by thermal drying [48]. The specimens were placed in an oven at a temperature of 60 °C for 24 h. After removing the samples from the oven, they were allowed to cool in a desiccator to room temperature, and the mass (A) was measured. Subsequently, the samples were immersed in water for 48 h. After removing the specimens from the water, excess water was removed using a towel, and the saturated surface-dry mass (B) after immersion was recorded. The specimens were kept in boiling water for 5 h and allowed to cool down to room temperature. The soaked, boiled, and surface-dried masses (C) were measured, followed by the determination of the apparent mass (D) in water. The water absorption and permeable pore volume of the AAM specimens were determined by using Equations (8) and (9). Three specimens were used for each batch of mortar mixes, and the average values were recorded.
W a t e r   a b s o r p t i o n = B A A × 100 %  
P e r m e a b l e   p o r e   v o l u m e = C A C D × 100 %  

2.4.5. Microstructural Analysis

Alkali-activated paste specimens were prepared in plastic tubes with a volume of 50 mL to investigate the microstructural properties. The specimens in sealed tubes were maintained in laboratory conditions at 22 ± 2 °C. The samples were soaked in acetone to stop the hydration reactions at the test age and kept for analysis. A scanning electron microscopy (SEM) test was performed on slices cut from the selected paste samples at 28 days using a Zeiss EVO® LS 10 SEM instrument (Carl Zeiss Microscopy GmbH, Jena, Germany) equipped with energy-dispersive X-ray spectroscopy (EDS) to analyze the surface morphology and determine reaction products.
An XRD analysis was performed on the raw precursors with a PANalytical X’Pert PRO diffractometer instrument (Malvern Panalytical Ltd., Malvern, United Kingdom) to distinguish the crystalline patterns in the powder precursor samples.

3. Results and Discussion

3.1. Fresh, Hardened, and Microstructural Properties
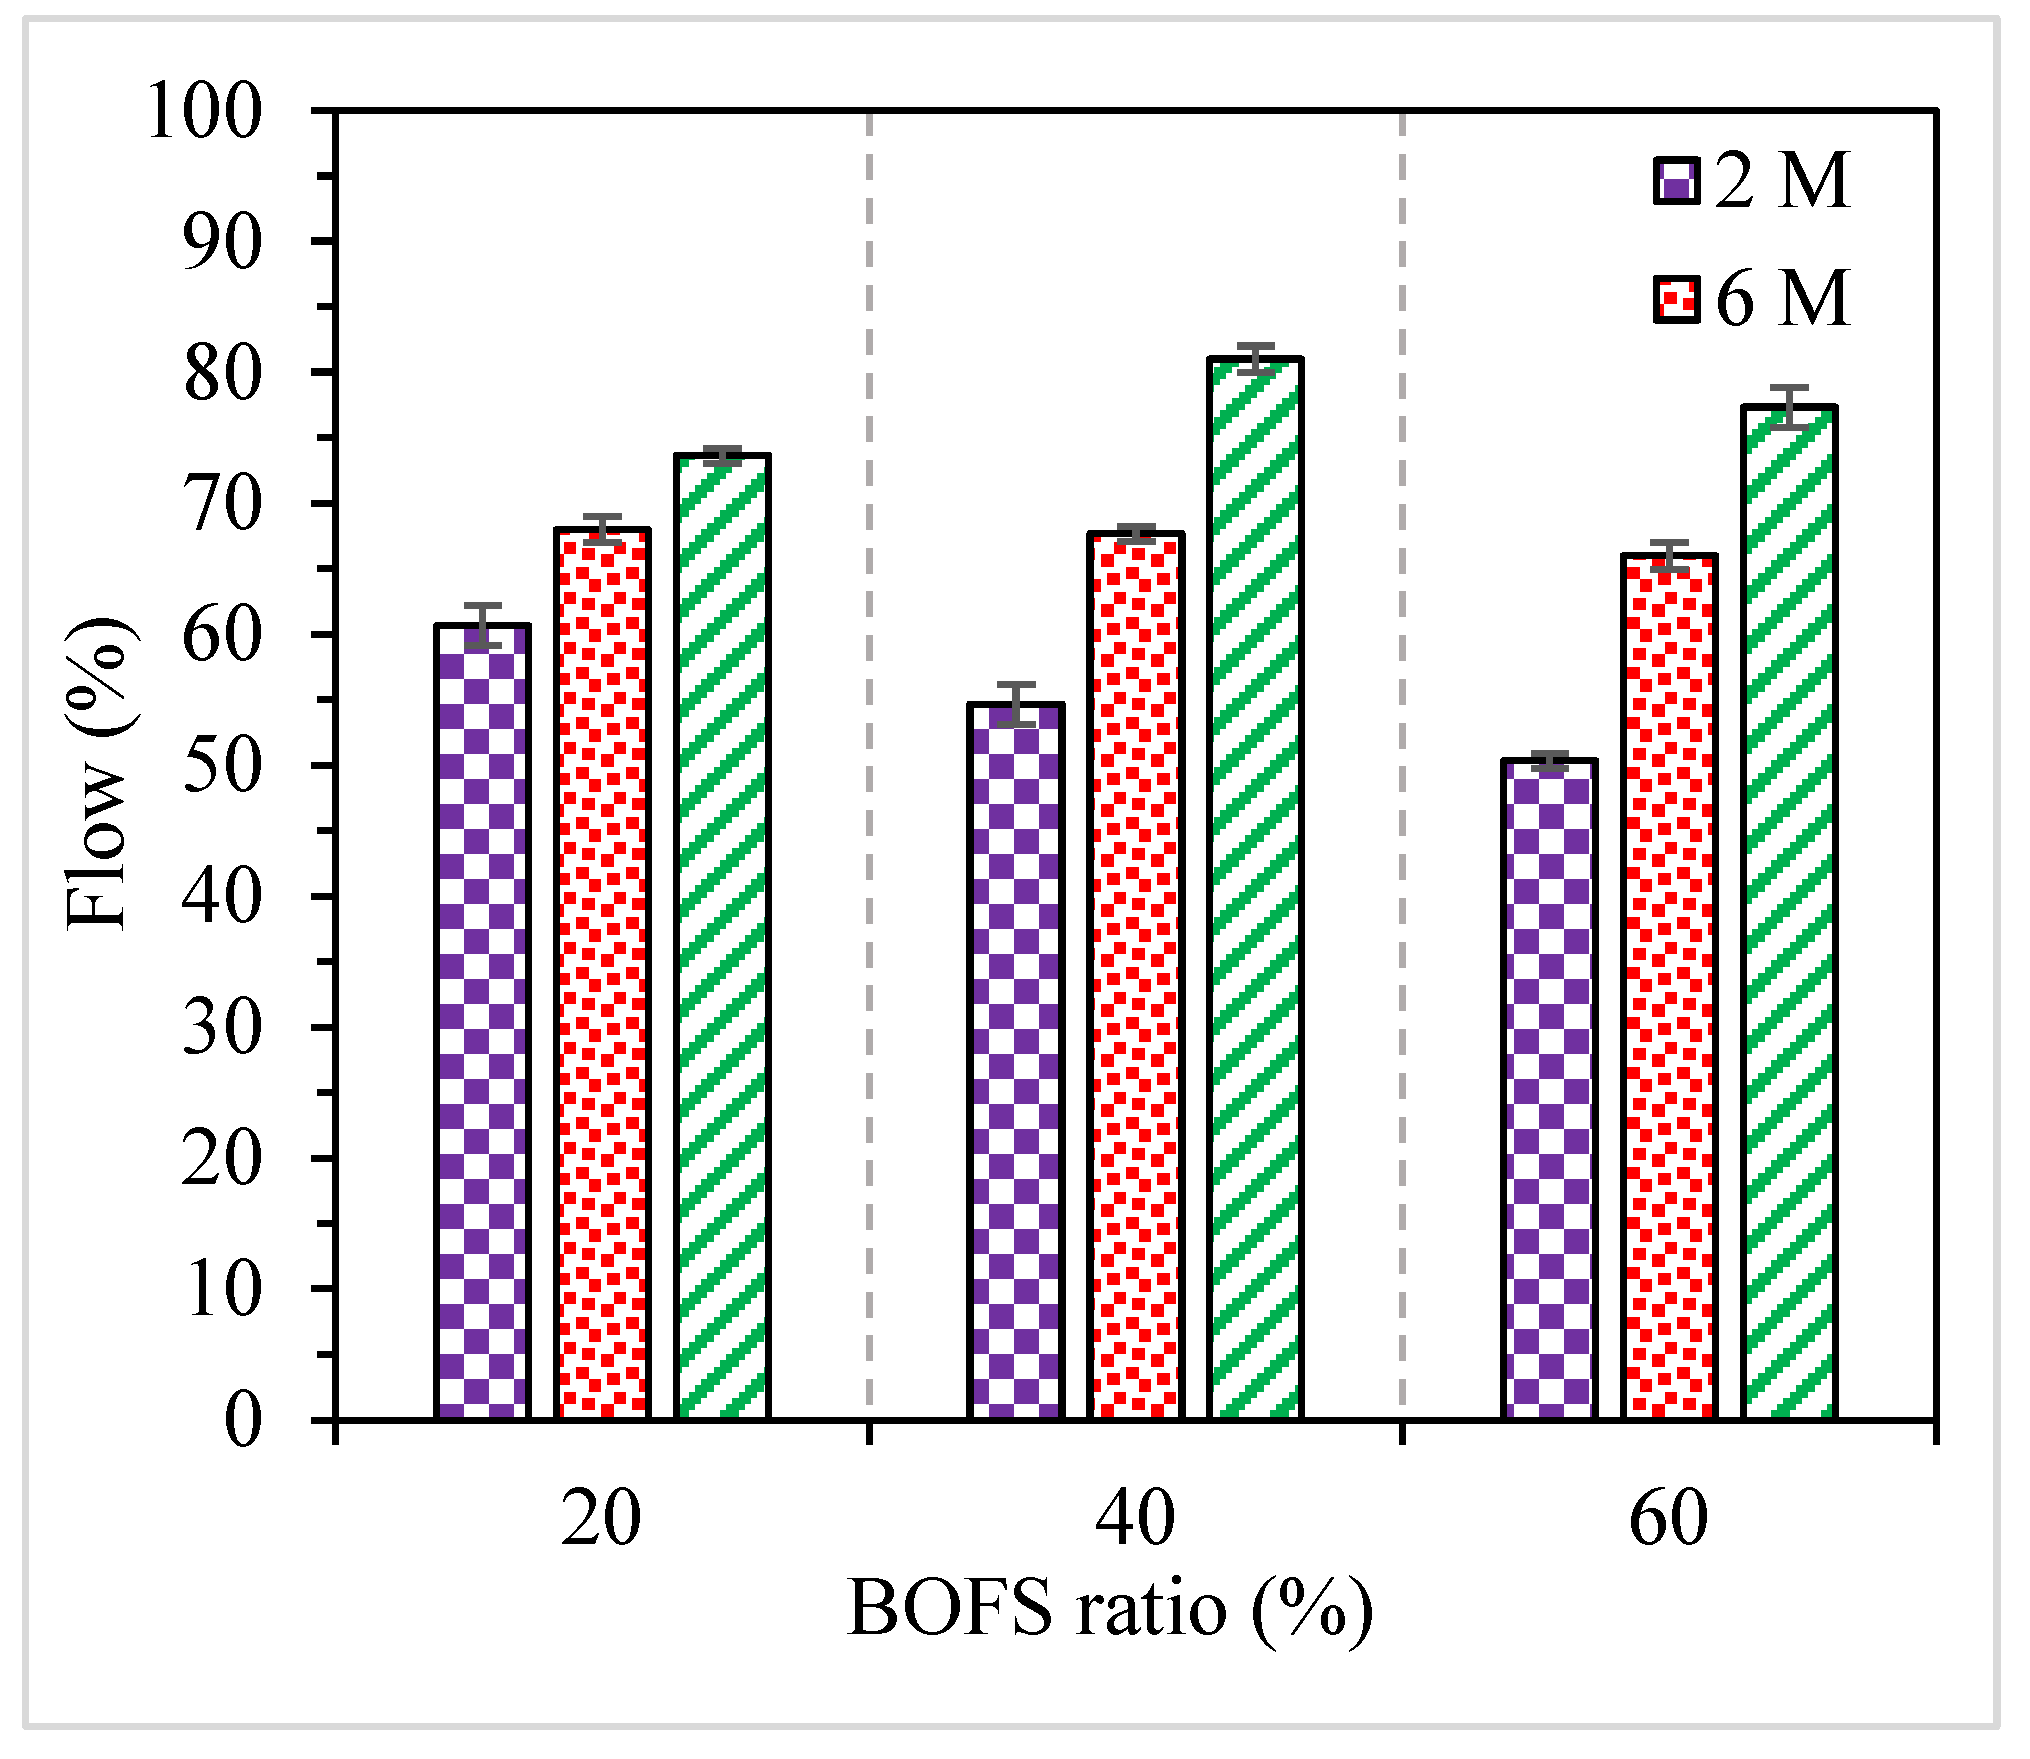
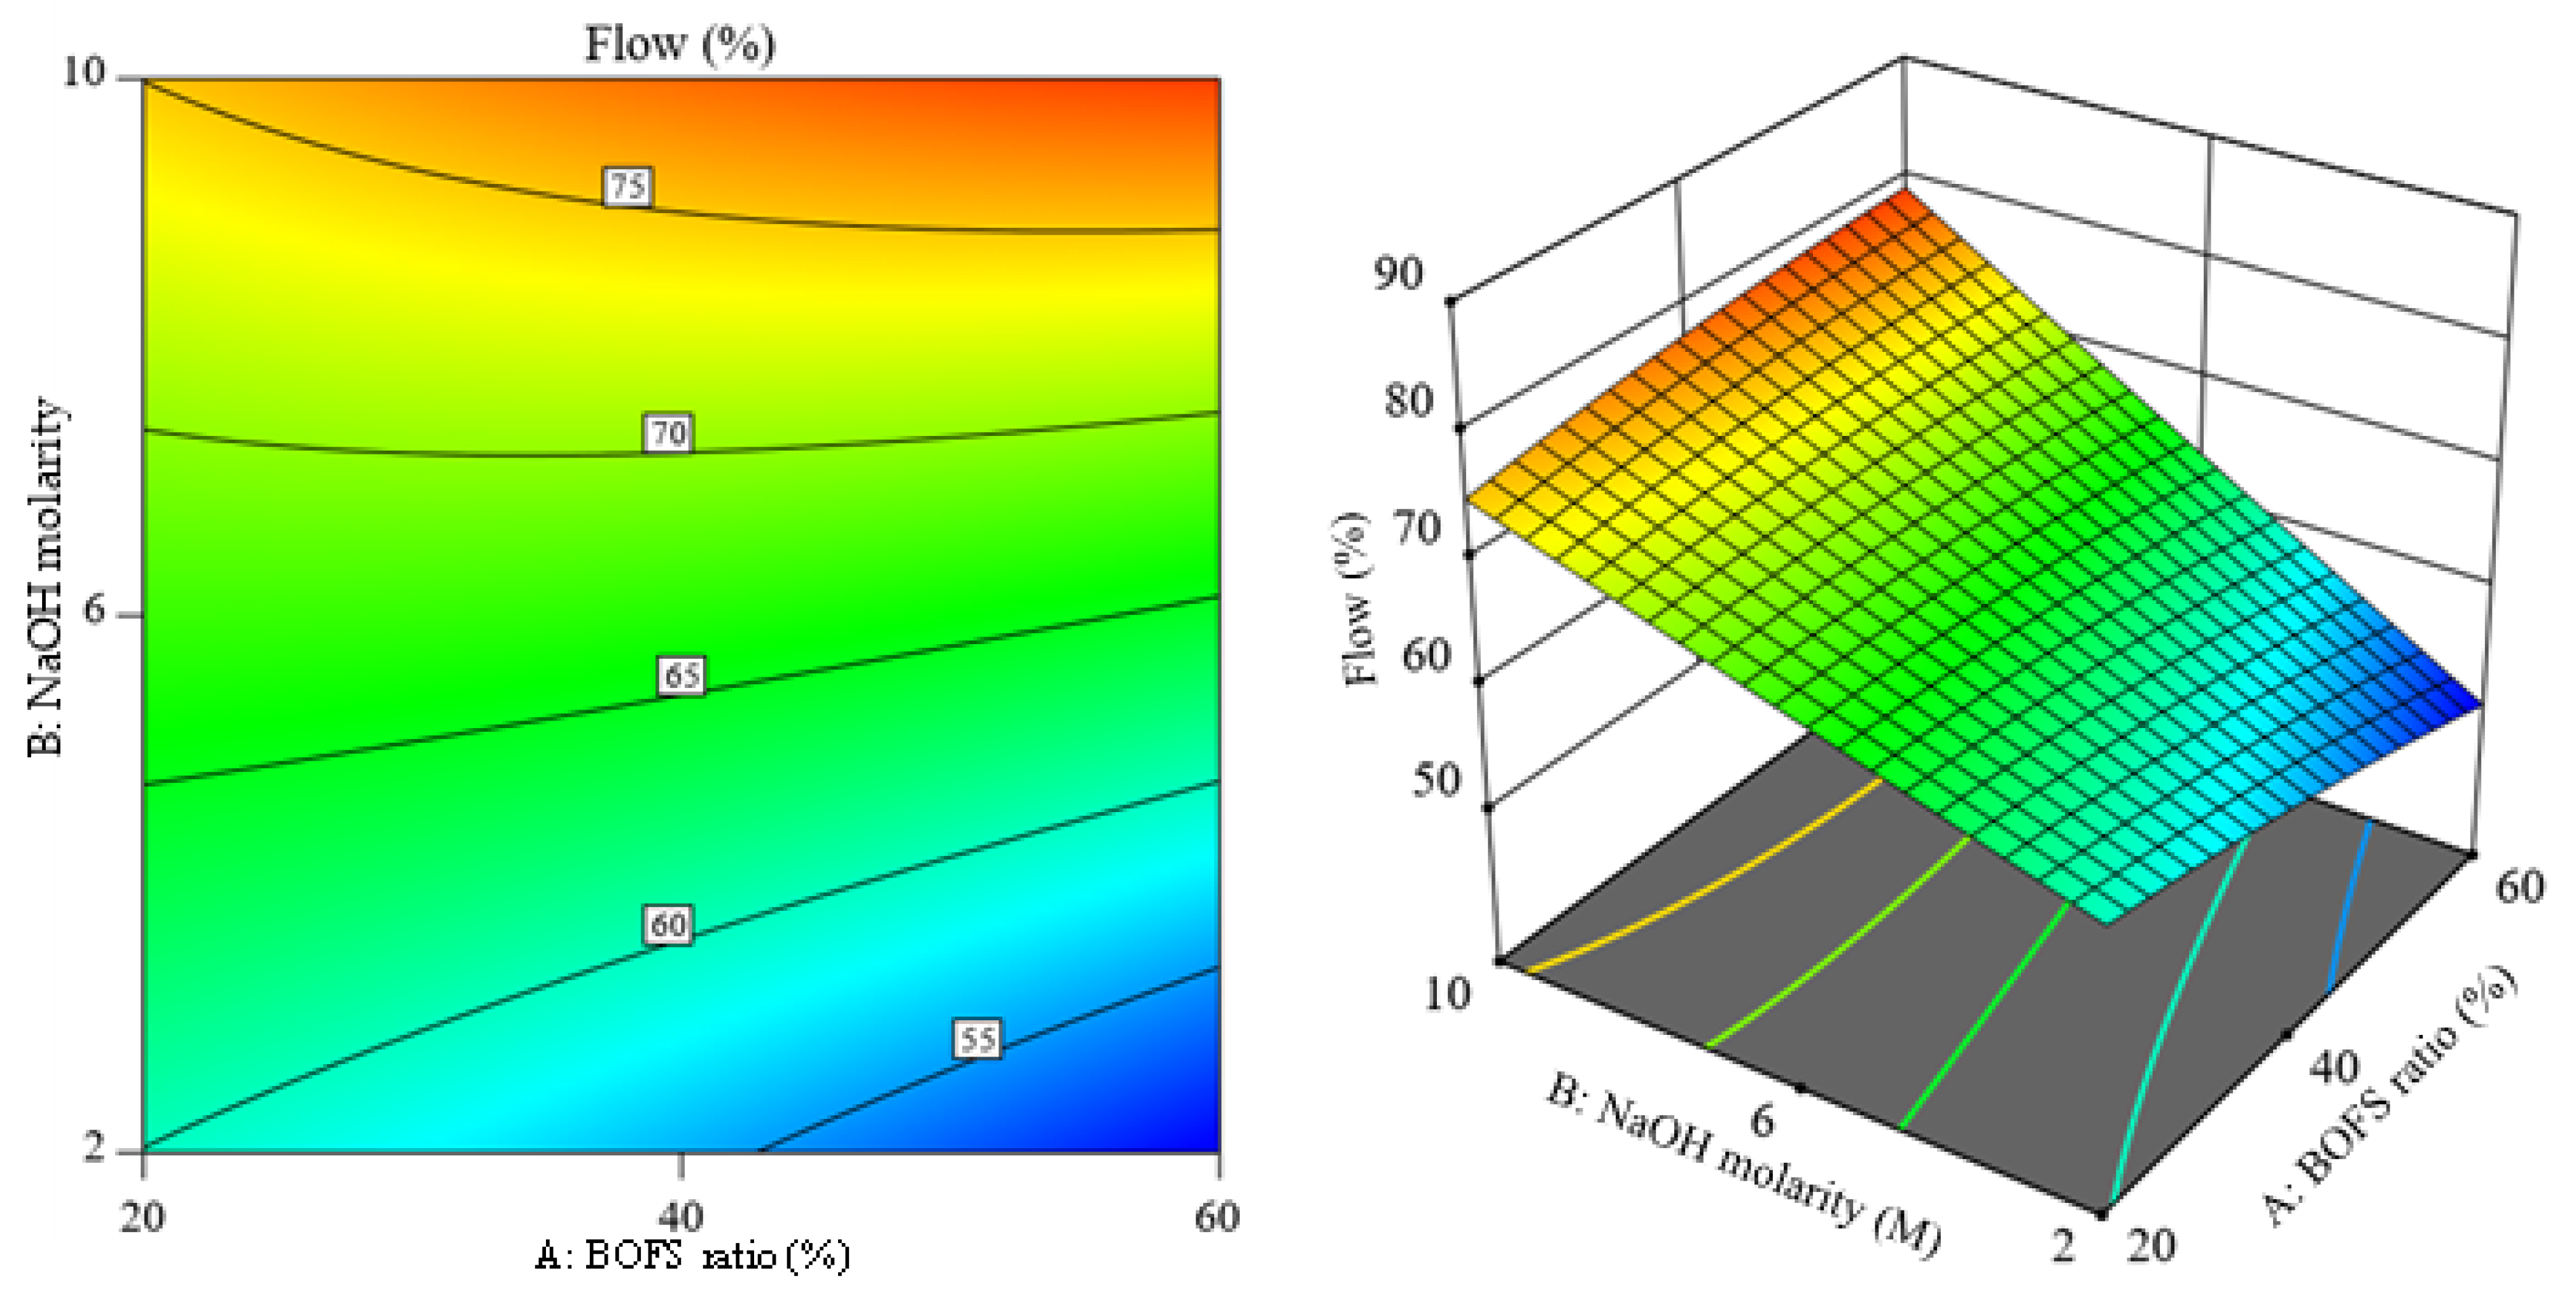
3.1.1. Flow

The variations in the flow of the fresh AAM mixes corresponding to their BOFS ratios and NaOH molarities are depicted in Figure 5, where the error bars indicate the standard deviation (SD). The flow values of the fresh mortar mix should be greater than 50%, which can be considered the minimum value for ease of molding [49]. The flow values of fresh AAM mixes varied in the range between 50 and 81%, and the fresh mortars were easily cast into the molds. The flow values of the AAM incorporating 20, 40, and 60% BOFS were obtained in ranges from 61 to 74%, 55 to 81%, and 50 to 77%, respectively. The lowest flow value was found in the mix incorporating 60% BOFS activated with 6 M NaOH, whereas the mortar mix containing 40% BOFS and 10 M NaOH corresponded to the highest flow value. It can be observed (Figure 5) that the increase in the molarity of NaOH consistently improved the flowability of the AAM mixes. The higher concentration of NaOH might have improved the dissolution of precursors, which subsequently resulted in more dissolved binders and hence enhanced the flow values [50]. Figure 5 shows that the effect of BOFS on the flow values of the mixes was inconsistent. In the case of 2 M NaOH, the flow was reduced from 61% to 50% when the BOFS ratio increased from 20% to 60%. On the other hand, with an increase in molarity, the flow remained constant or slightly increased as the BOFS ratio increased. The results indicate that the negative effect of BOFS on the flowability is compensated by a higher NaOH molarity, which improves the workability of the mixes.

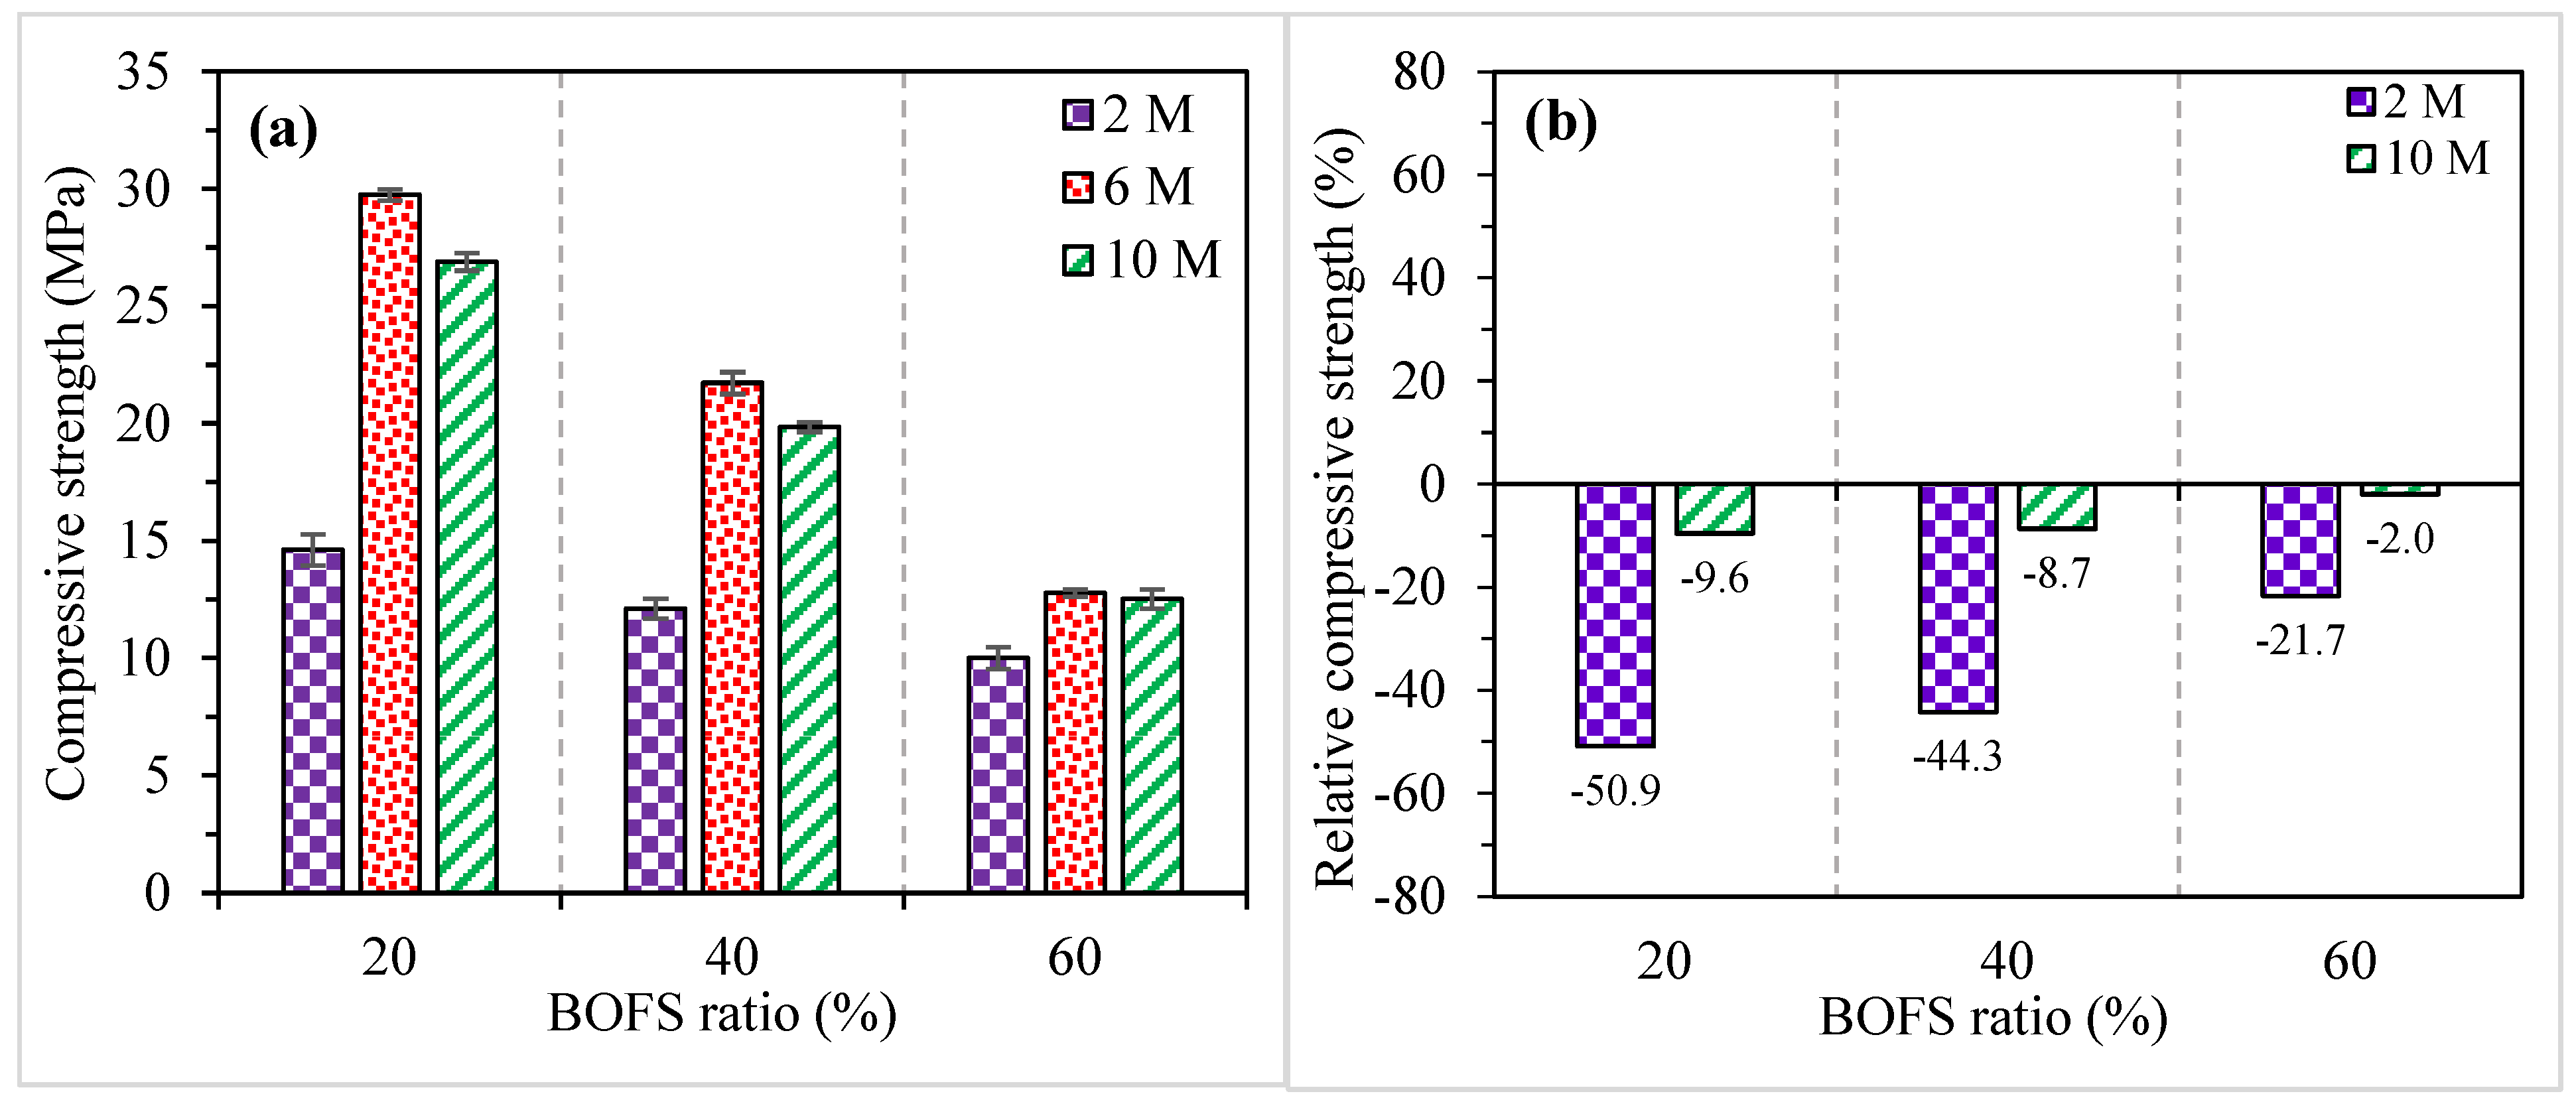
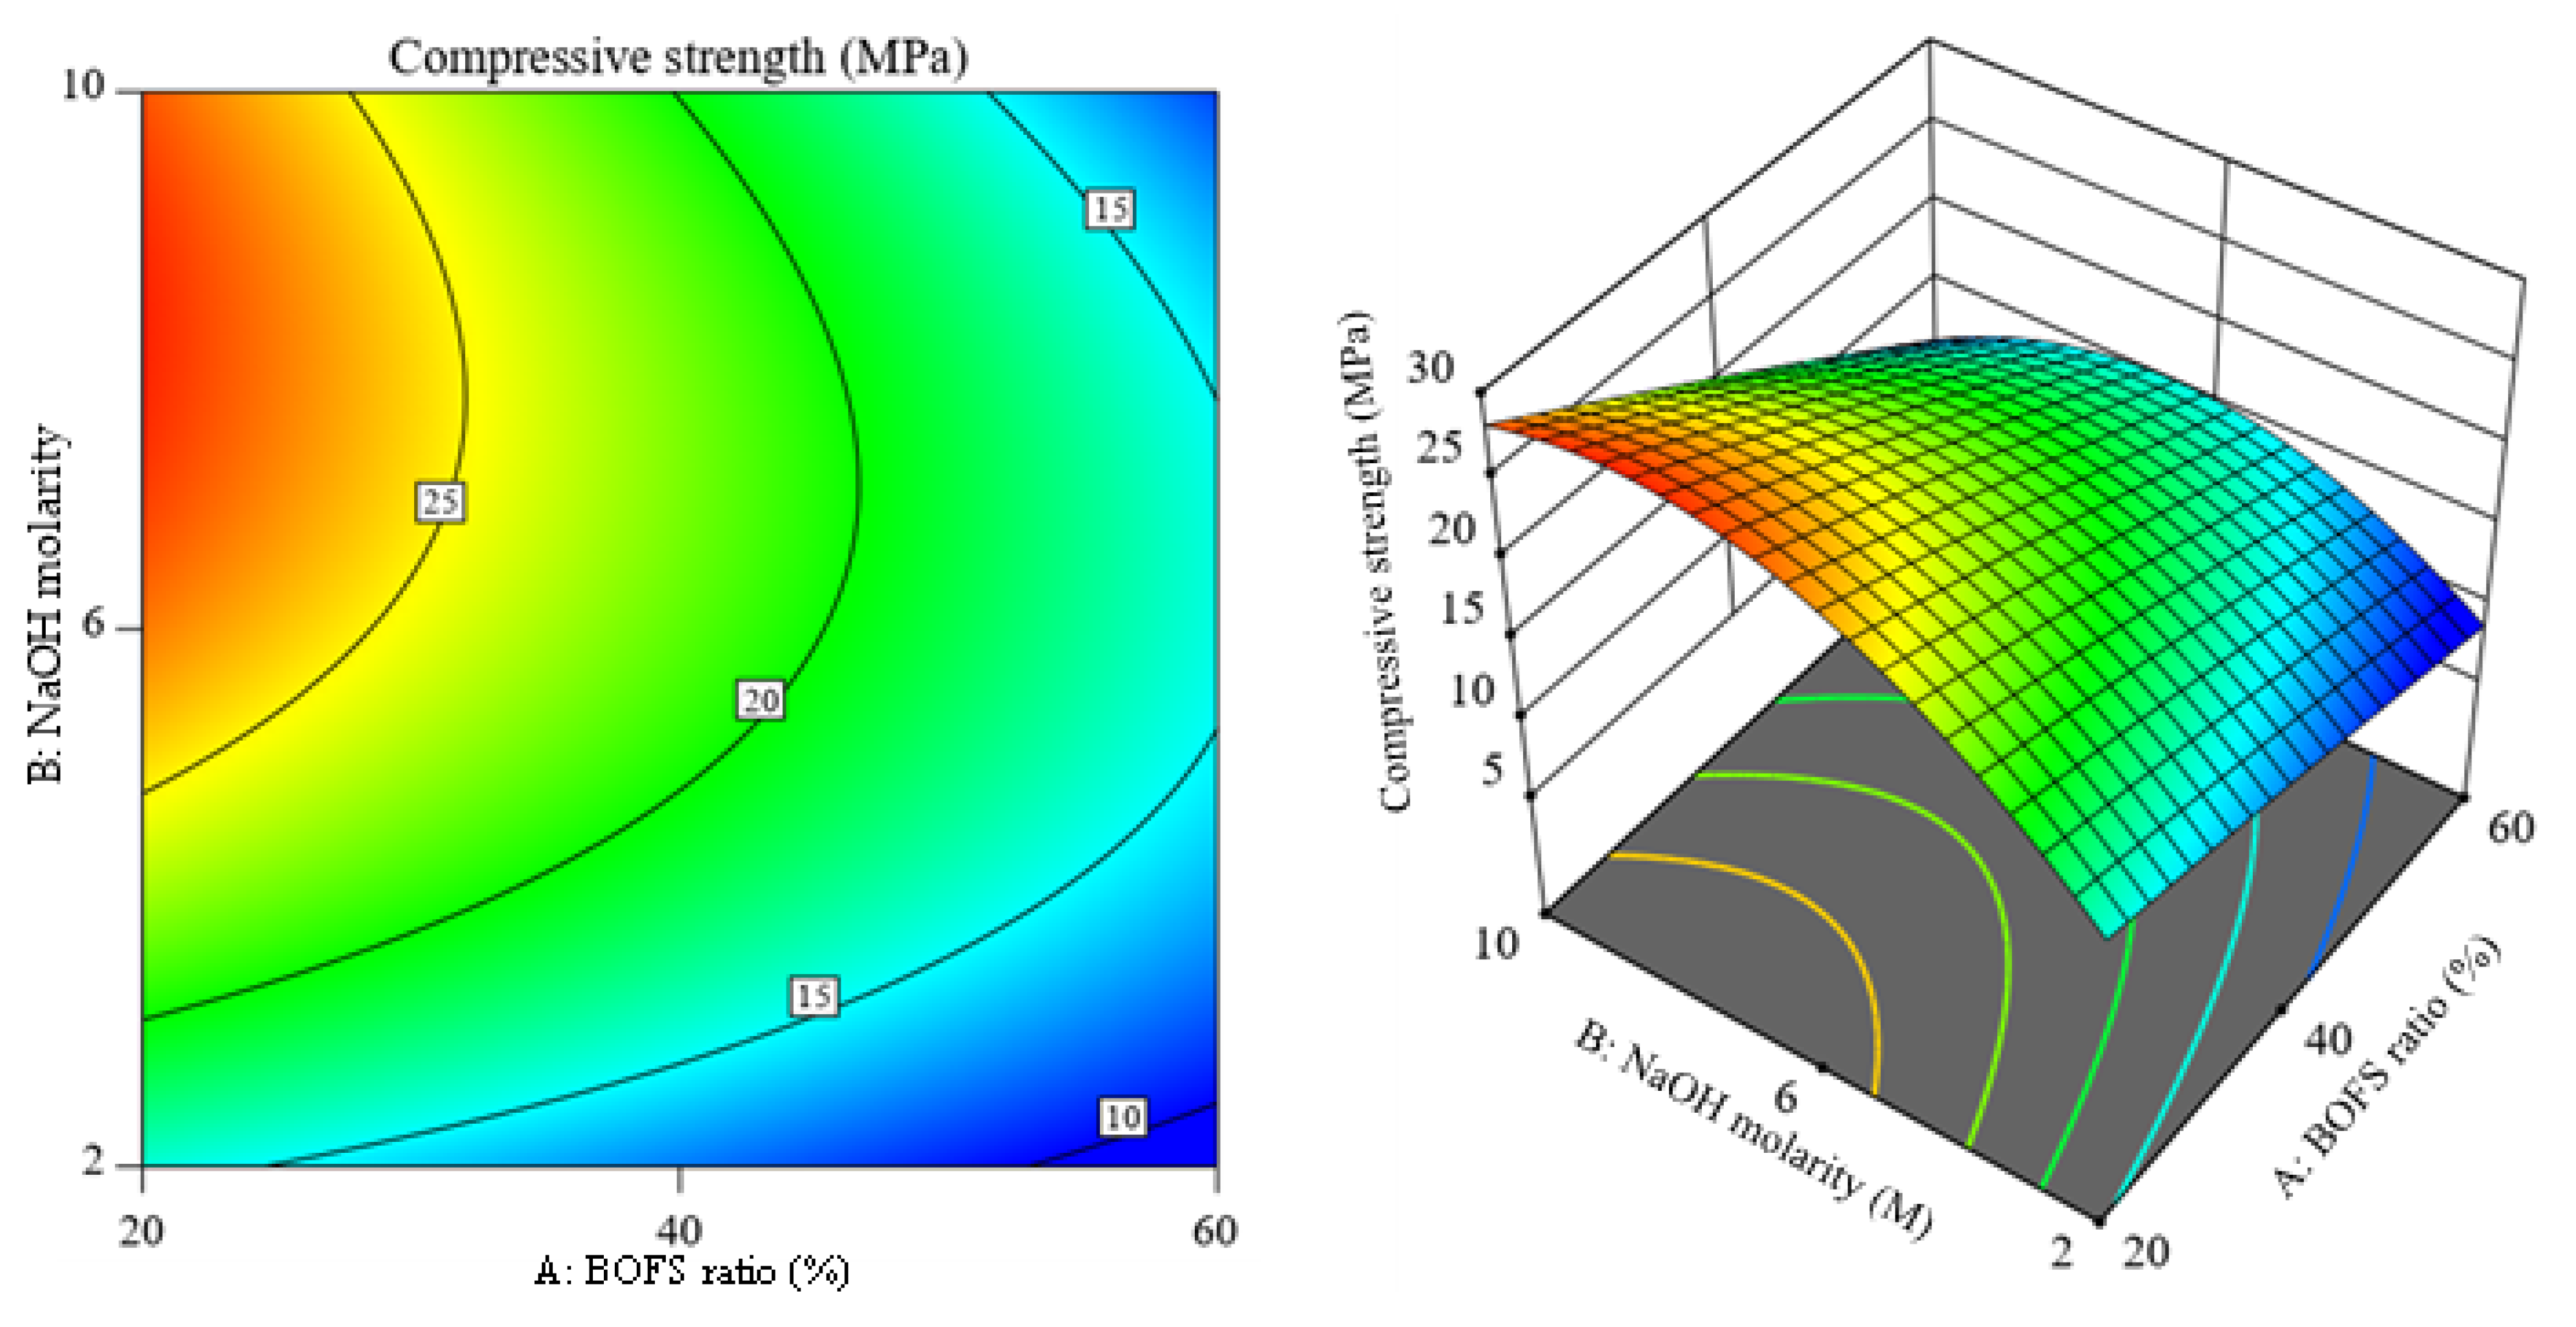
3.1.2. Compressive Strength

Figure 6a shows the compressive strength results (the error bars indicate SD) and their variations with different BOFS ratios and NaOH molarities of the AAM samples at 28 days. The compressive strength of AAM specimens incorporating 20, 40, and 60% BOFS varied between 14.6 and 29.8 MPa, 12.1 and 21.7 MPa, and 10.0 and 12.8 MPa, respectively. It can be noticed that the compressive strength of the mortars consistently decreased with an increase in the BOFS ratio. Ismail et al. [48] also verified that the compressive strength of AAM containing GGBFS progressively decreased with the increasing GGBFS ratio. BOFS is generally recognized to be less reactive [51], and its higher inclusion level might have resulted in reduced compressive strength. In addition, the lower amounts of SiO2 and Al2O3 in BOFS might have resulted in the reduced formation of strength-giving reaction products when used in higher quantities.
On the other hand, the increase in NaOH molarity improved the compressive strength up to a certain limit, after which it decreased. The compressive strength of mortar specimens synthesized with 6 M NaOH outperformed both 2 and 10 M irrespective of the BOFS content. The reason behind the decrease in the compressive strength of samples containing 10 M NaOH might be due to the higher NaOH concentration, which might have hindered the reaction process due to the existence of surplus hydroxide ions and consequently reduced aluminosilicate gel precipitation [52]. Another reason might be the lack of silicates [53] required to equivalently react with excess hydroxide ions for the same group of samples.
Figure 6b compares the relative compressive strength of the AAM mixes with 2 and 10 M NaOH to that of the mixes activated with 6 M NaOH. The AAM mixes containing 20, 40, and 60% BOFS had 50.9, 44.3, and 21.7% lower compressive strength compared to the mixes with 6 M NaOH, respectively. Similarly, the compressive strength slightly decreased by 9.6, 8.7, and 2.0% in the AAM mixes with 10 M containing 20, 40, and 60% BOFS ratios, respectively, compared to the mortar mixes activated with 6 M NaOH. It can be further noticed that the reduction in compressive strength in 2 and 10 M AAM is lower in the mixes with higher contents of BOFS.

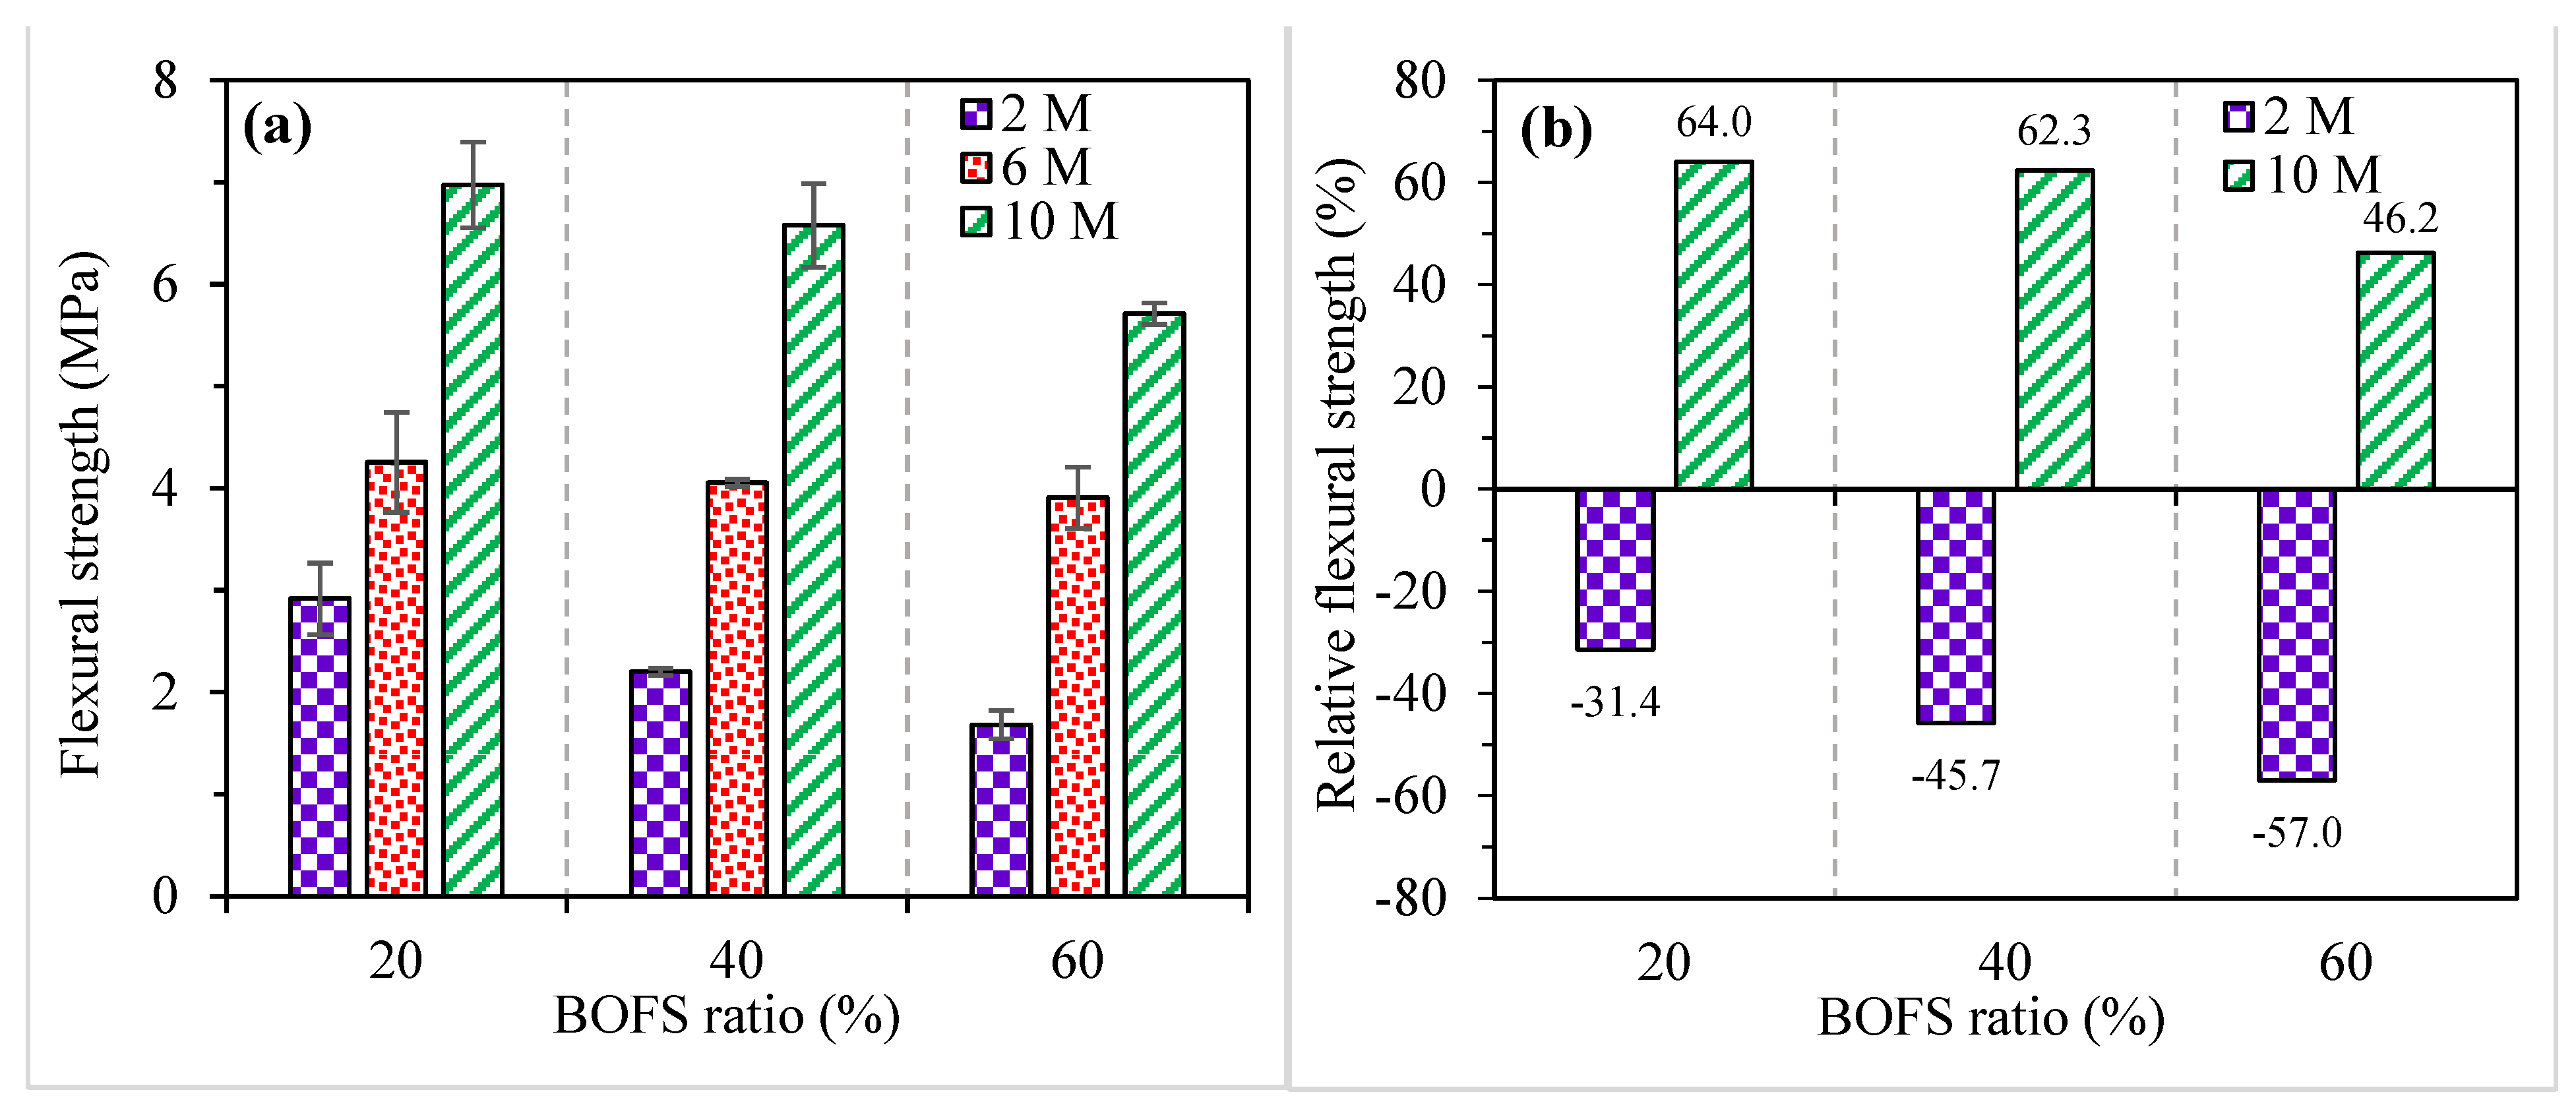
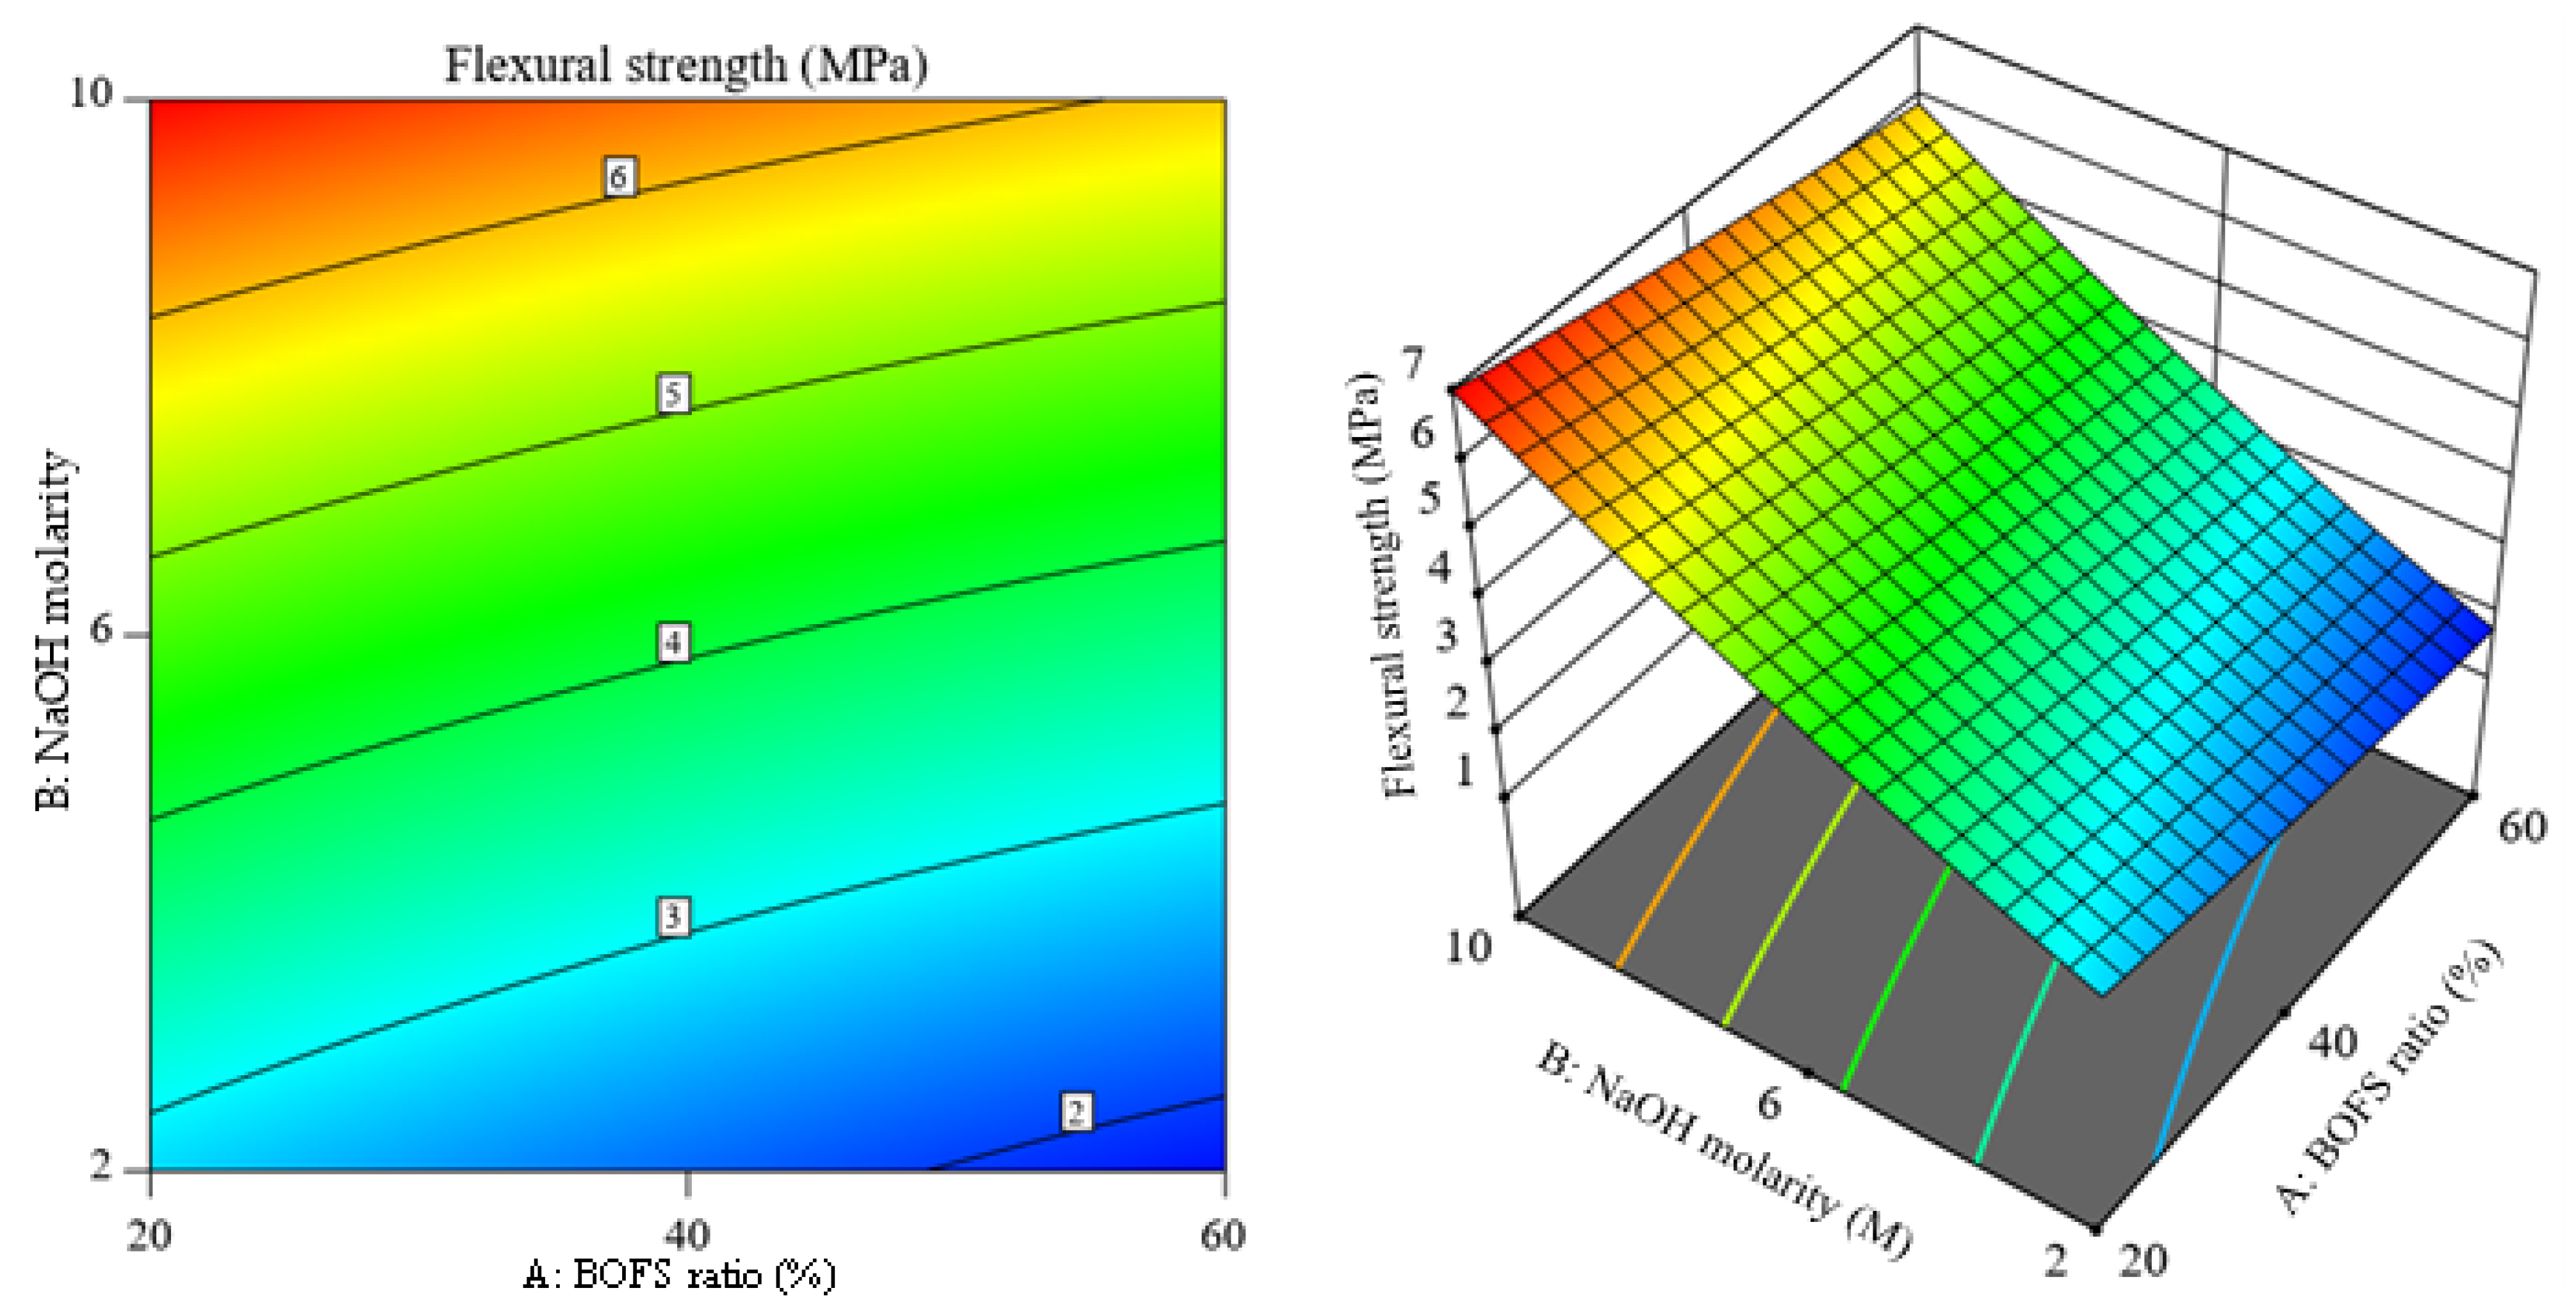
3.1.3. Flexural Strength

The flexural strength results of the AAM specimens with various replacement ratios of BOFS and NaOH molarities at 28 days are depicted in Figure 7a (the error bars indicate SD). The flexural strength of AAM samples consistently decreased upon the addition of BOFS (reduction in GGBFS), which is consistent with the compressive strength results. The flexural strength for the AAM mixes containing 20, 40, and 60% BOFS varied between 2.9 and 7.0 MPa, 2.2 and 6.6 MPa, and 1.7 and 5.7 MPa, respectively. The maximum flexural strength (7.0 MPa) was achieved in the AAM mix incorporating 20% BOFS with 10 M NaOH, whereas the mix with 60% BOFS and 2 M NaOH had the minimum flexural strength (1.7 MPa). From the results, it is worth noting that the flexural strength of the AAM samples significantly improved with the increase in NaOH molarity, which provided a denser microstructure, as verified by the SEM micrographs.
The relative flexural strength of AAM samples containing 2 and 10 M ranged between −31.4% and −57.4% and between 64.0% and 46.2% respectively, in comparison with the specimens activated with 6 M NaOH, as shown in Figure 7b.

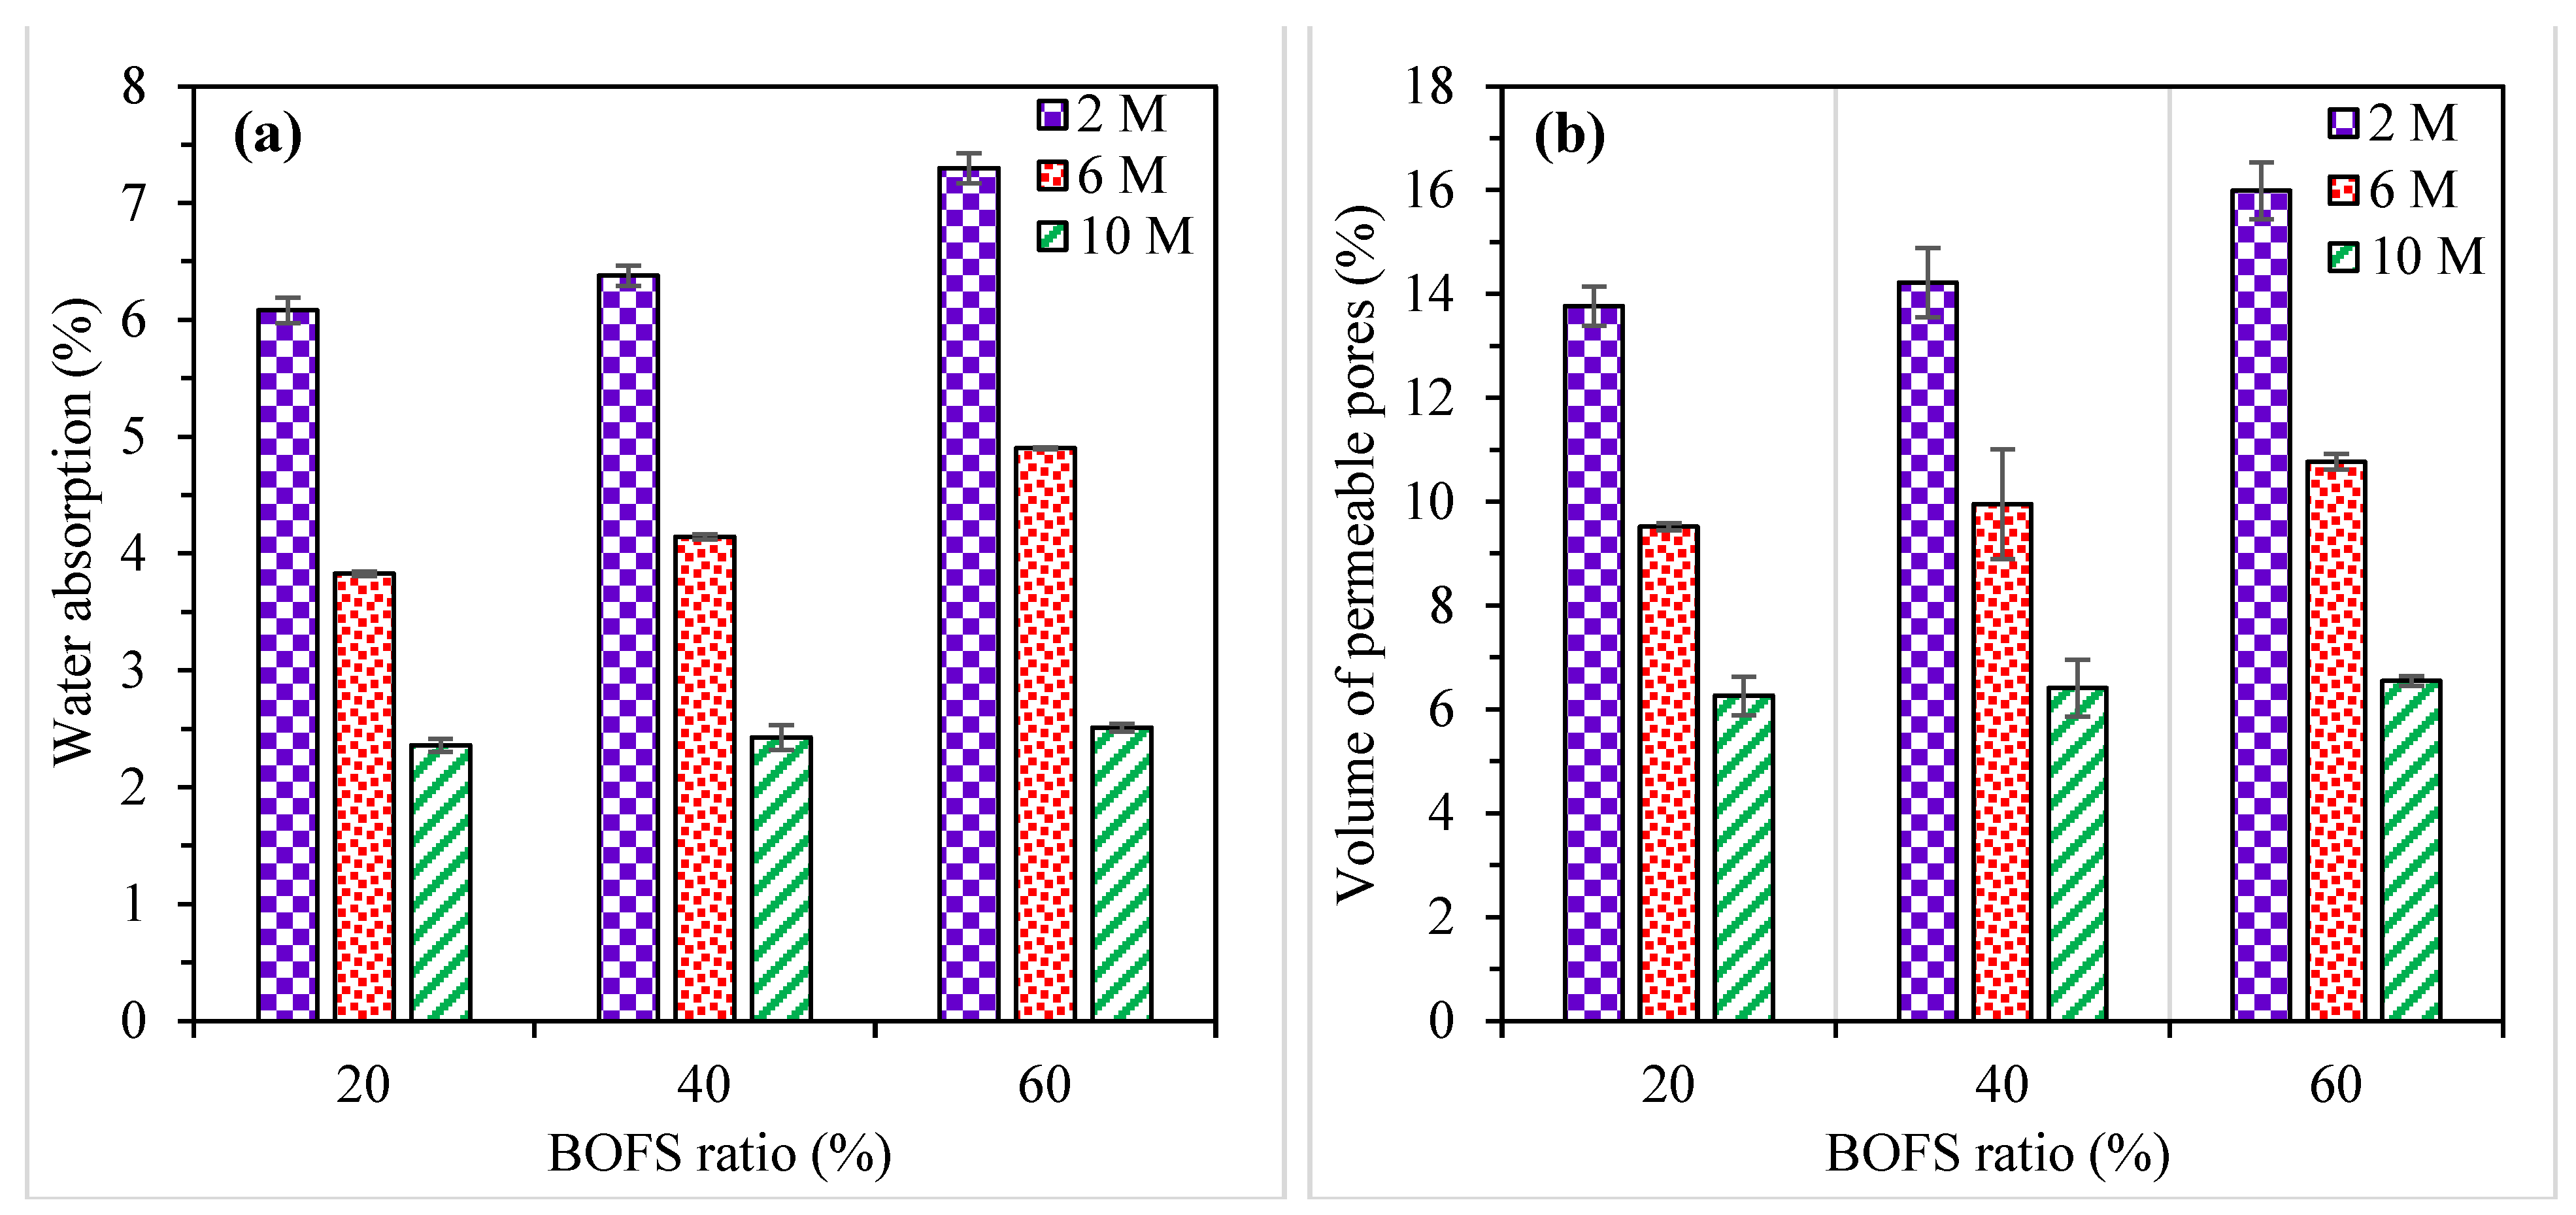
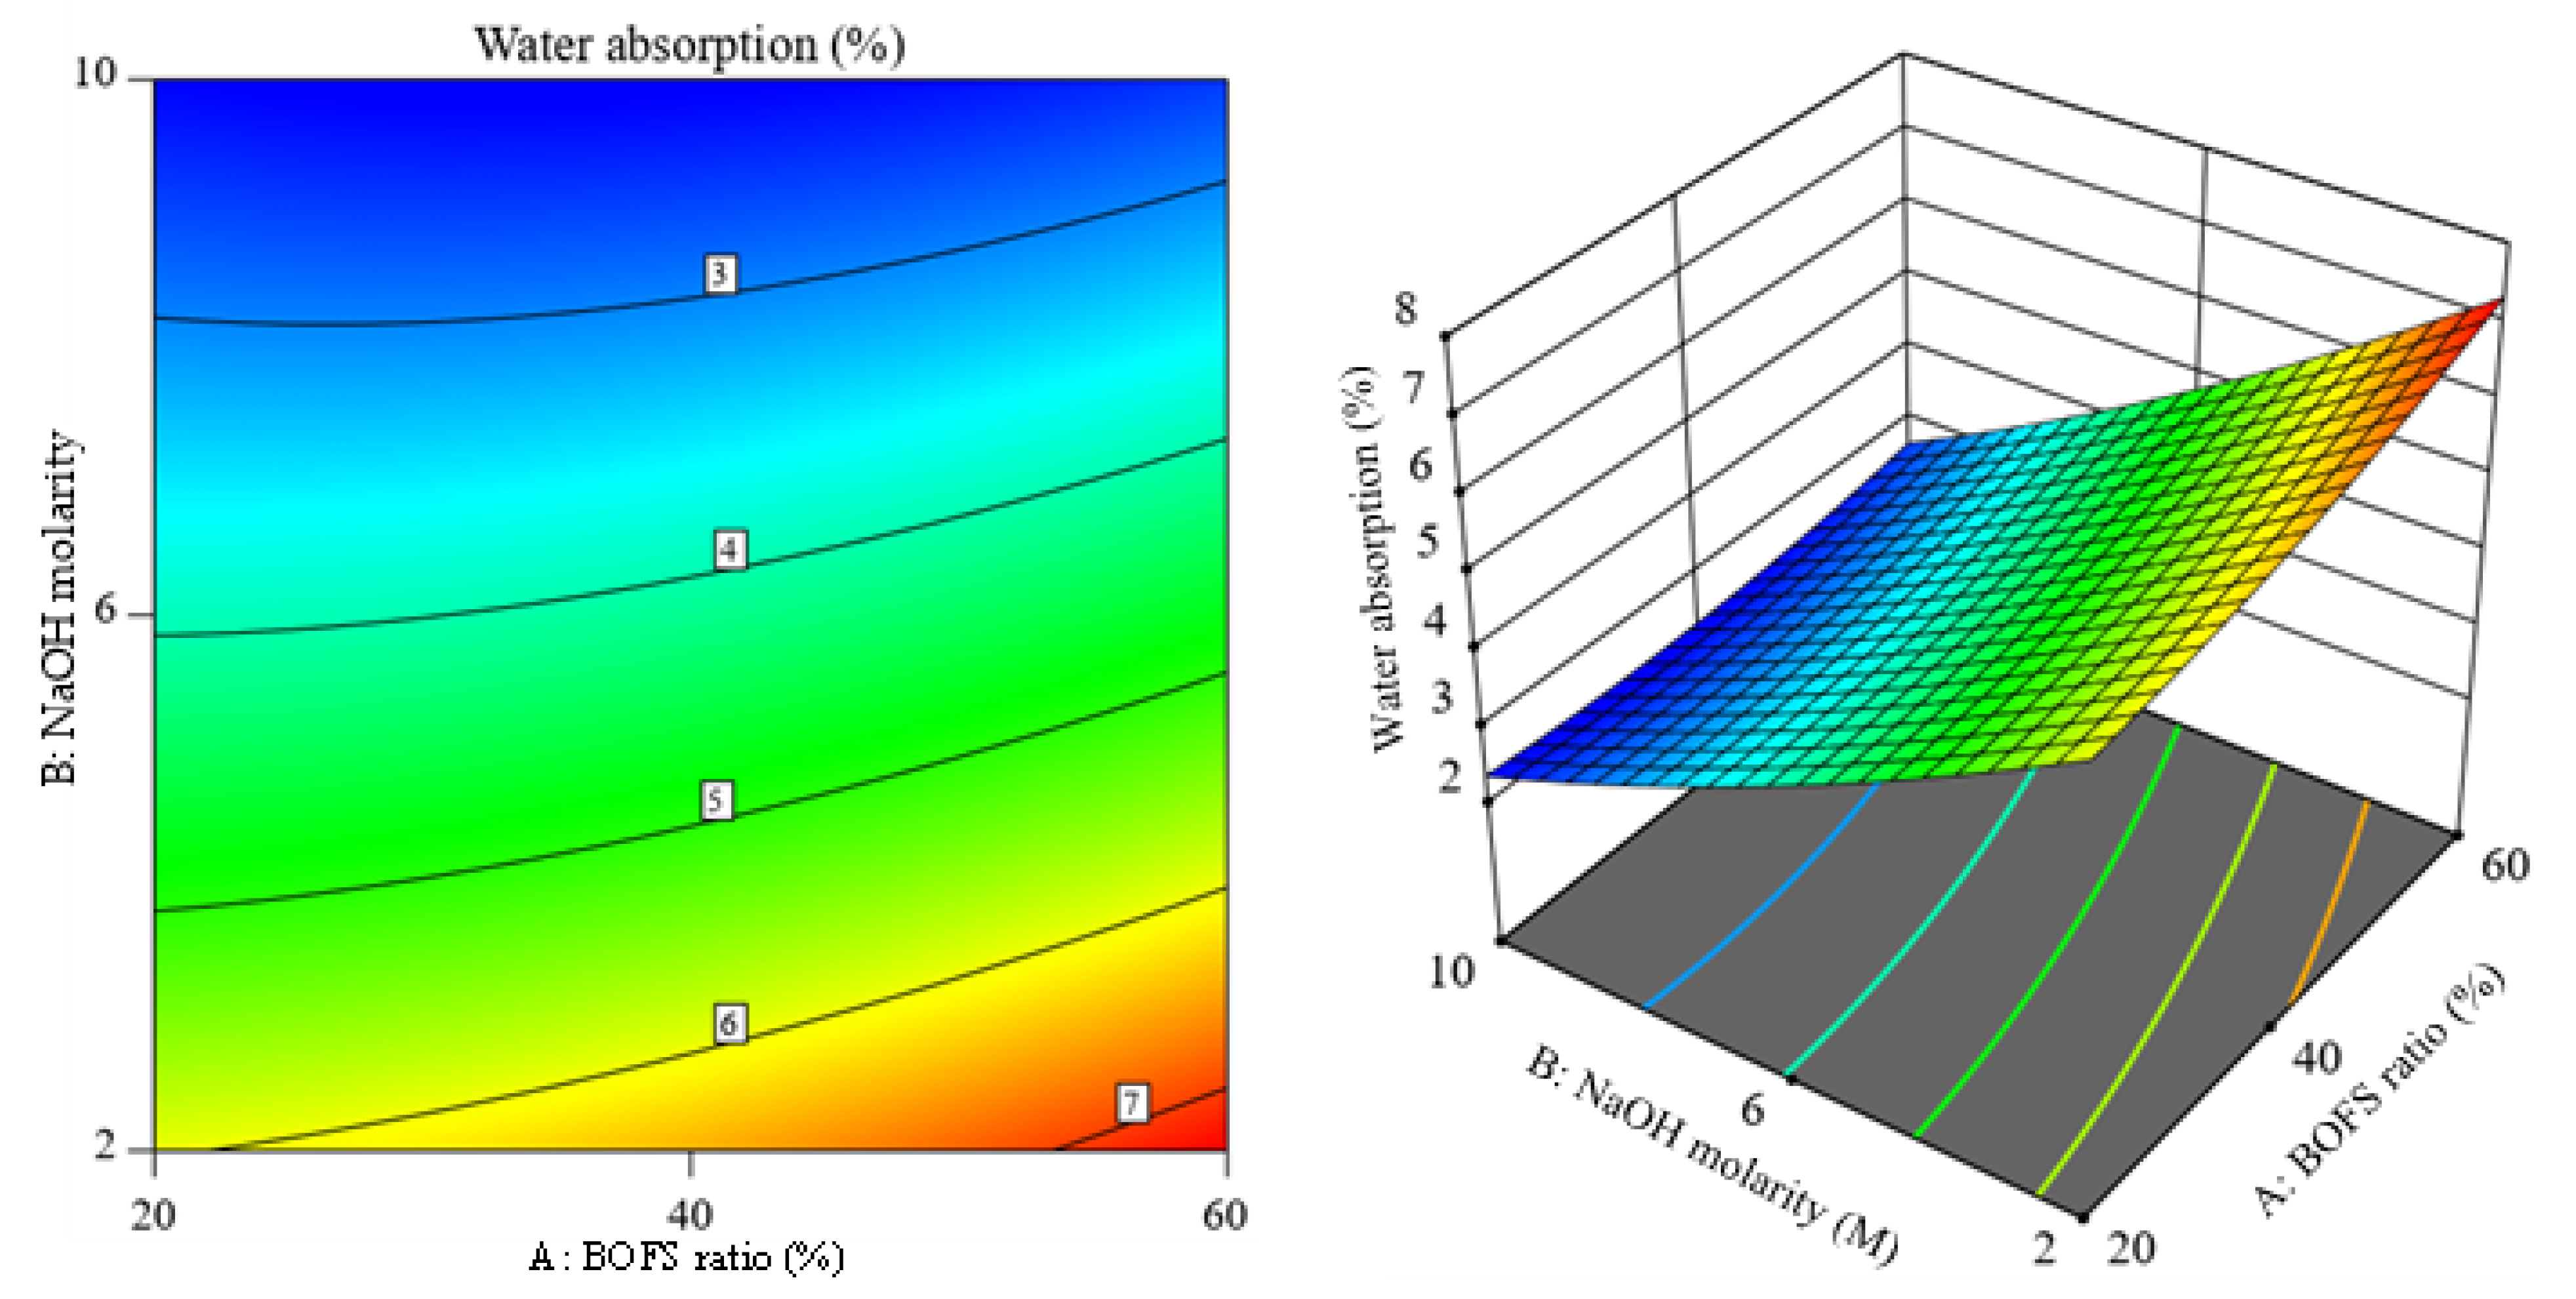
3.1.4. Water Absorption and Volume of Permeable pores

The water absorption and volume of permeable pores of AAM mixes are illustrated in Figure 8, where the error bars indicate SD. Figure 8a shows that the inclusion of BOFS moderately increased the water absorption. This observation can be attributed to the reduced GGBFS content. GGBFS has a slightly finer particle size (see Figure 1) than BOFS, which might have assisted in filling the pores and consequently resulted in lower water absorption [54]. On the contrary, the increase in NaOH molarity significantly reduced the water absorption at all replacement ratios of BOFS. The water absorption of mortar mixes with lower NaOH molarity (2 M) was in the range between 6.1 and 7.3%, whereas the samples activated with 10 M NaOH varied between 2.4 and 2.5%. The higher water absorption values of mortar mixes with a lower alkaline concentration can be attributed to the higher volume of permeable pores and vice versa. Similar observations were also reported by [55,56], in which the increase in the concentration of the NaOH activator decreased the water absorption values.
The increment in NaOH molarity induced a significant reduction in the volume of permeable pores, whereas this value slightly increased with the increase in the BOFS ratio (Figure 8b). The trend observed in the volume of permeable pores was similar to that in the water absorption of the AAM specimens. The volume of permeable pores varied between 6.3 and 13.8%, 6.4 and 14.2%, and 6.6 and 16.0% for the AAM samples containing 20, 40, and 60% BOFS, respectively. For the mortar specimens activated with 2, 6, and 10 M, the volume of permeable pores ranged between 13.8 and 16.0%, 9.5 and 10.8%, and 6.3 and 6.6%, respectively. The volume of permeable pores was the lowest (6.3%) in the mortar specimens formulated with 20% BOFS and 10 M, and it was the highest (16.0%) in samples composed of 60% BOFS activated with 2 M NaOH.

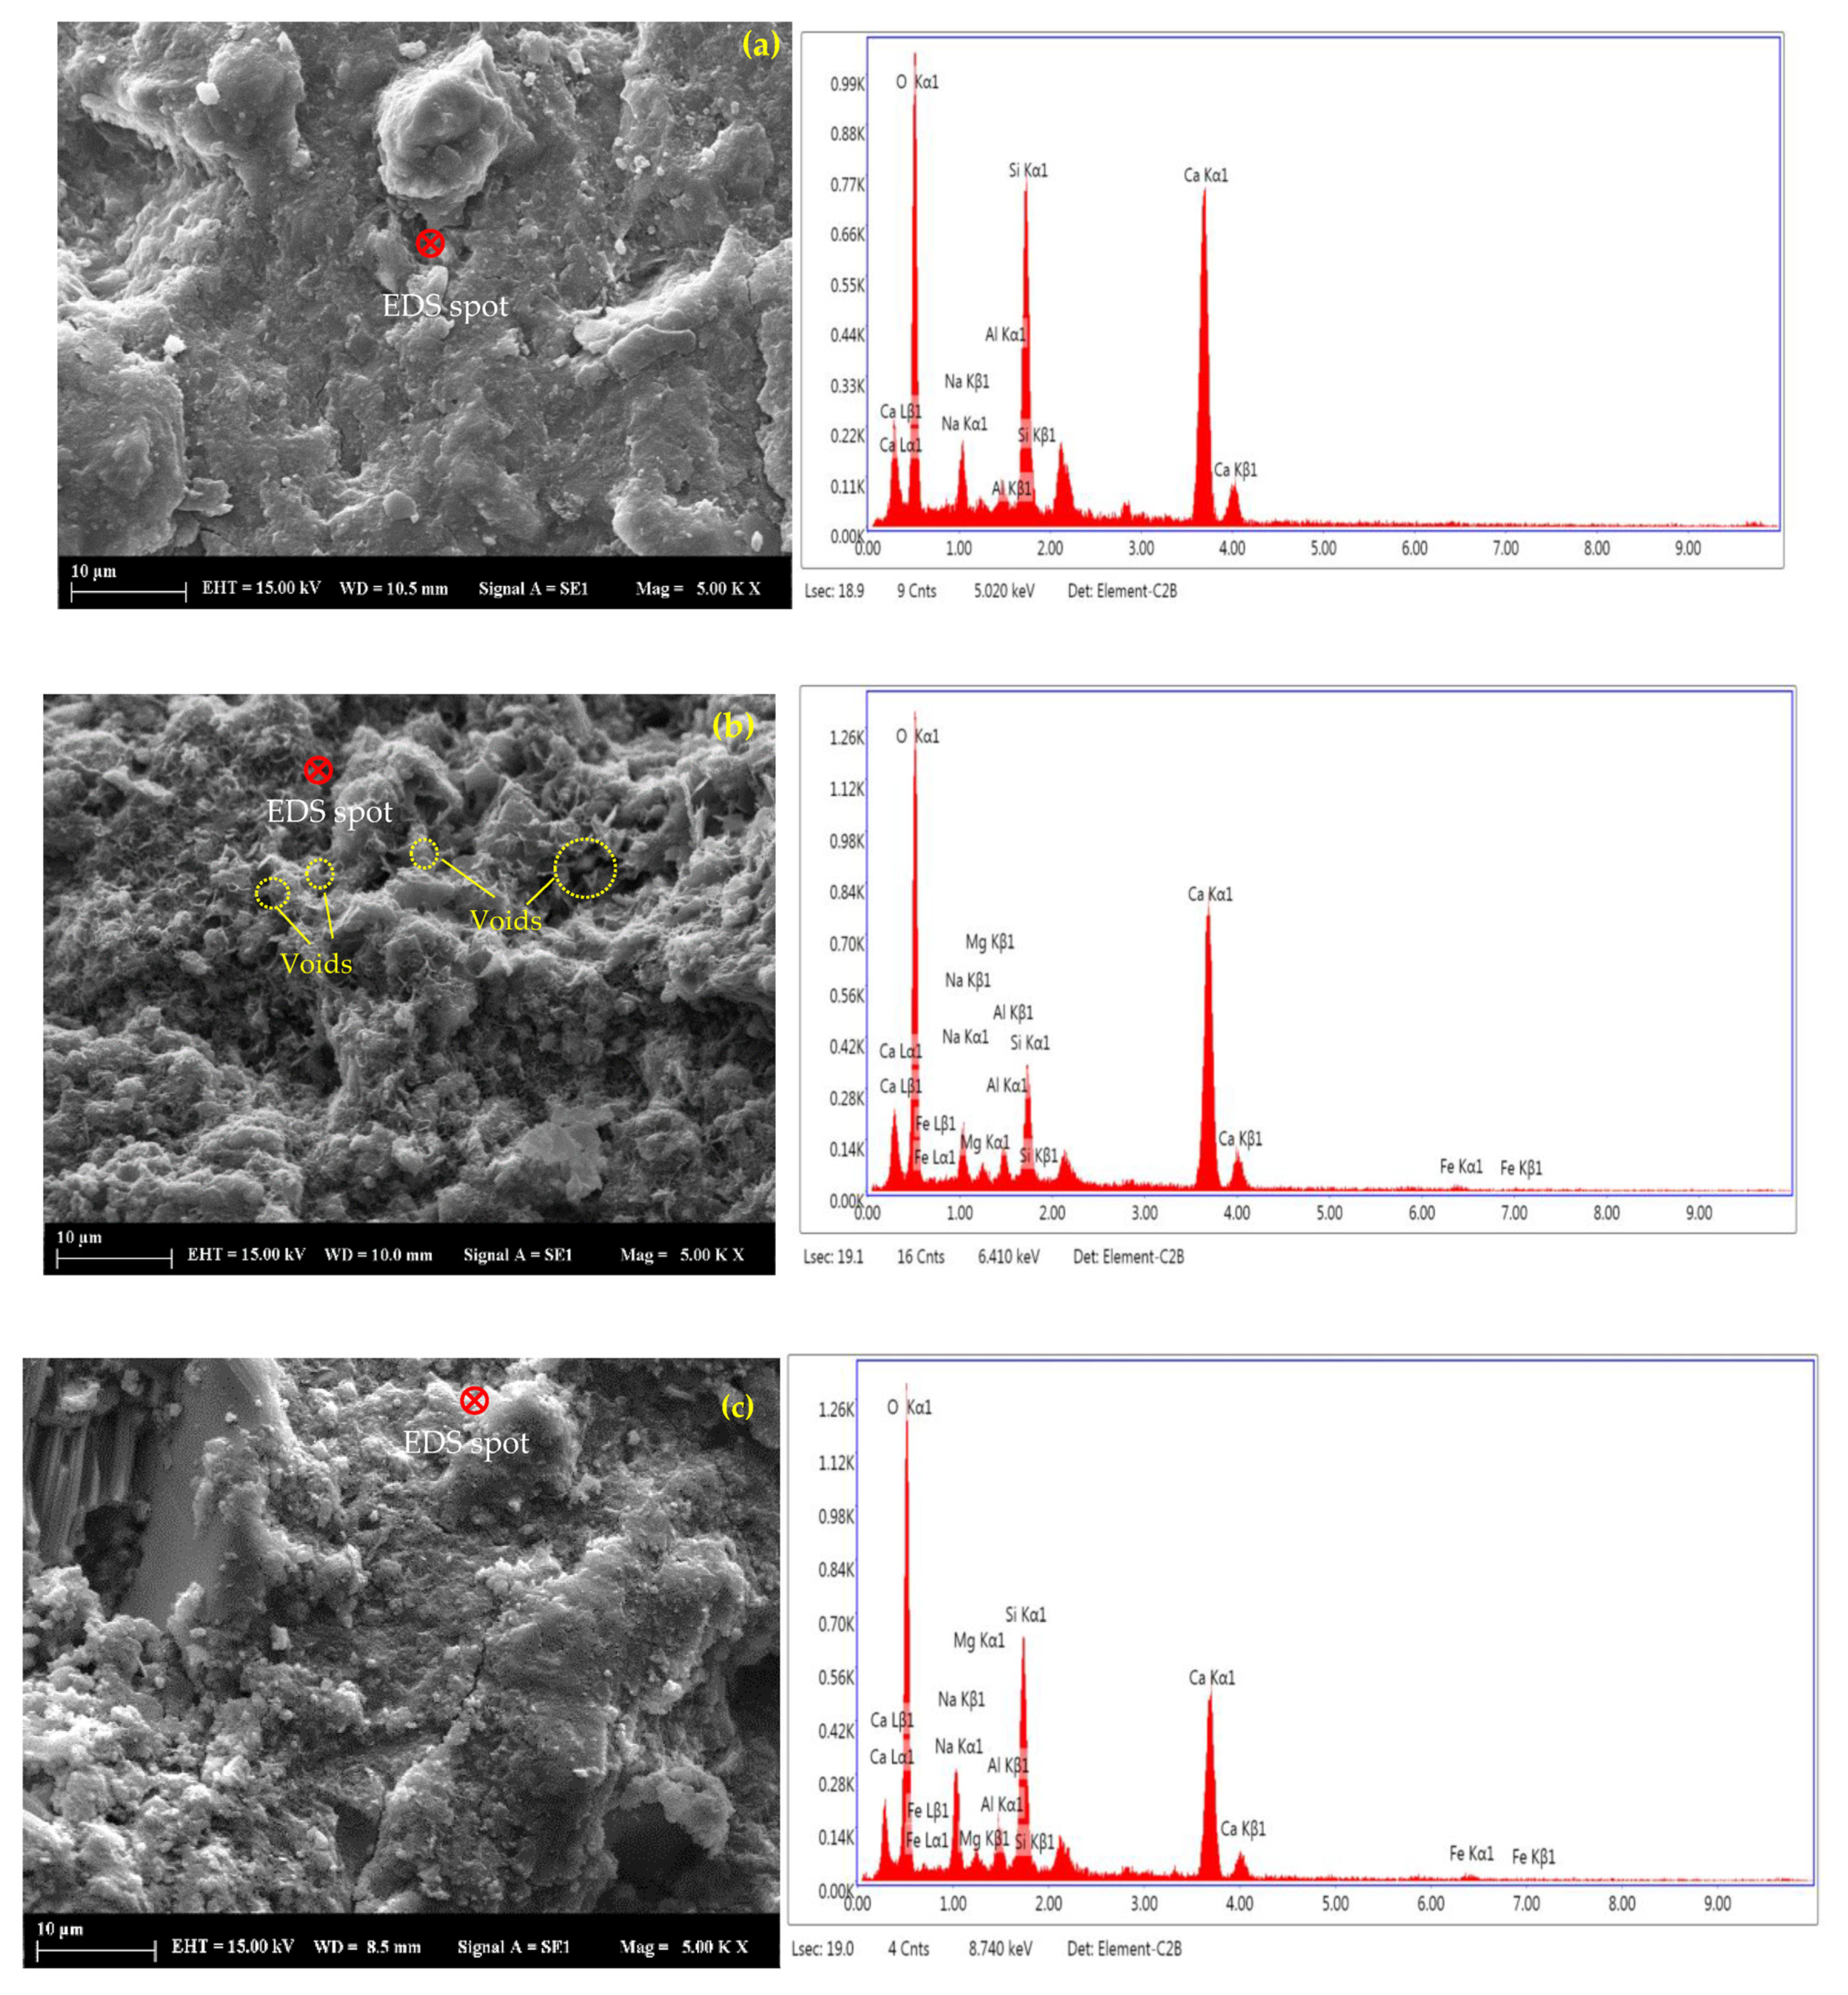
3.1.5. SEM-EDS Analysis

SEM imaging was conducted on the corresponding selected alkali-activated pastes of B0.2-6, B0.6-2, and B0.6-6 at 28 days to study the effect of the BOFS ratio and NaOH molarity on the microstructural features. The SEM micrographs along with the EDS results of the paste samples are shown in Figure 9. The EDS analysis showed the abundant presence of Si, Ca, and Na elements, as well as Mg and Fe elements in lower amounts, which may indicate the formation of hydrated reaction products such as C-A-S-H and N-A-S-H. The SEM images show that B0.6-2 had a distinctive morphology compared to B0.6-6, and B0.6-2 exhibited a more porous structure than B0.6-6, which might have contributed to the increase in water absorption and permeable pore volume. Figure 9a,c reveals that for the same NaOH molarity, a lower BOFS ratio yielded a denser microstructure. The same was also noticed when comparing Figure 9b,c, where an increase in NaOH molarity at a constant BOFS ratio reduced the voids. These observations are in line with the mechanical test results, as an increase in NaOH molarity and an increase in the GGBFS ratio generally improved the compressive and flexural strengths.

3.2. Analysis of Variance and Regression Model Equations

The experimental results of flow, compressive strength, flexural strength, and water absorption were analyzed using RSM to determine the effects of the BOFS replacement ratio and NaOH molarity. The ANOVA results for the investigated properties are presented in Table 4. The coefficient of determination (R2) values were considered to examine the precision of the predicted quadratic models. A greater R2 (close to unity) denotes a desirable and reasonable relationship between the predicted and actual values [57]. It can be noticed that the R2 values of the analyzed responses were 0.95, indicating efficient predictive models. The R2 values for flow, compressive strength, flexural strength, and water absorption were found to be 0.97, 0.95, 0.95, and 0.99, respectively. Furthermore, the significance of the model terms was evaluated using the probability (p-value) at a 95% confidence interval level. A p-value lower than 0.05 shows that the model or model terms are statistically significant. The p-values for flow, compressive strength, flexural strength, and water absorption models were calculated as <0.0001, 0.0002, 0.0002, and <0.0001, respectively, which indicated that all models were statistically significant. The model terms B and AB were significant for flow values, whereas all model terms (A, B, AB, and B2) were statistically significant, except quadratic term A for compressive strength. Similarly, only linear terms A and B were significant for flexural strength, while for water absorption, all model terms (both linear and quadratic) were significant.
In addition, the ratio of Fischer variation (F-value), which measures the variation in the data about its mean value, was also considered to validate the obtained response models. The higher the F-value is than 1.00, the more reliable the model [58]. The F-values for flow, compressive strength, flexural strength, and water absorption were 43.26, 25.76, 28.70, and 458.72, respectively. Even though B and AB were statistically significant, the model’s higher R2 value of 0.97, lower p-value < 0.0001, higher F-value of 43.26, and insignificant lack of fit (LOF) statistically validated the flow model. It is worth noting that the p-value (0.0012) of LOF is significant for water absorption, but it did not invalidate the analyzed model since the R2 value was about 0.99, implying that 99% of the total variability was well explained by the predicted model. The greater R2 values, lower p-values, higher F-values, and insignificant LOF (except water absorption) described the adequacy of the predicted quadratic models for all investigated properties.
Furthermore, the adequate precision (AP) values for flow, compressive strength, flexural strength, and water absorption were found to be 22.33, 15.82, 17.46, and 67.46, respectively. The AP values for all responses were greater than 4, which is desirable and supports that the developed quadratic models can be efficiently utilized for navigating the defined design space by FCCD. The actual regression equations for all investigated responses, in terms of both significant and insignificant influencing terms, are expressed by quadratic Equations (10)–(13).
F l o w = + 60.8630 0.1921 A + 0.9226 B + 0.0438 A B 0.0018 A 2 + 0.0076 B 2          
C o m p r e s s i v e   s t r e n g t h = + 7.4843 0.0759 A + 6.2761 B 0.0305 A B 0.0005 A 2 0.3429 B 2                          
F l e x u r a l   s t r e n g t h = + 2.7718 0.0405 A + 0.3670 B 0.0001 A B + 0.0002 A 2 + 0.0129 B 2
W a t e r   a b s o r p t i o n = + 6.9300 + 0.0020 A 0.5587 B 0.0034 A B + 0.0005 A 2 + 0.0146 B 2                                            
where A and B represent the BOFS ratio and NaOH molarity, respectively.

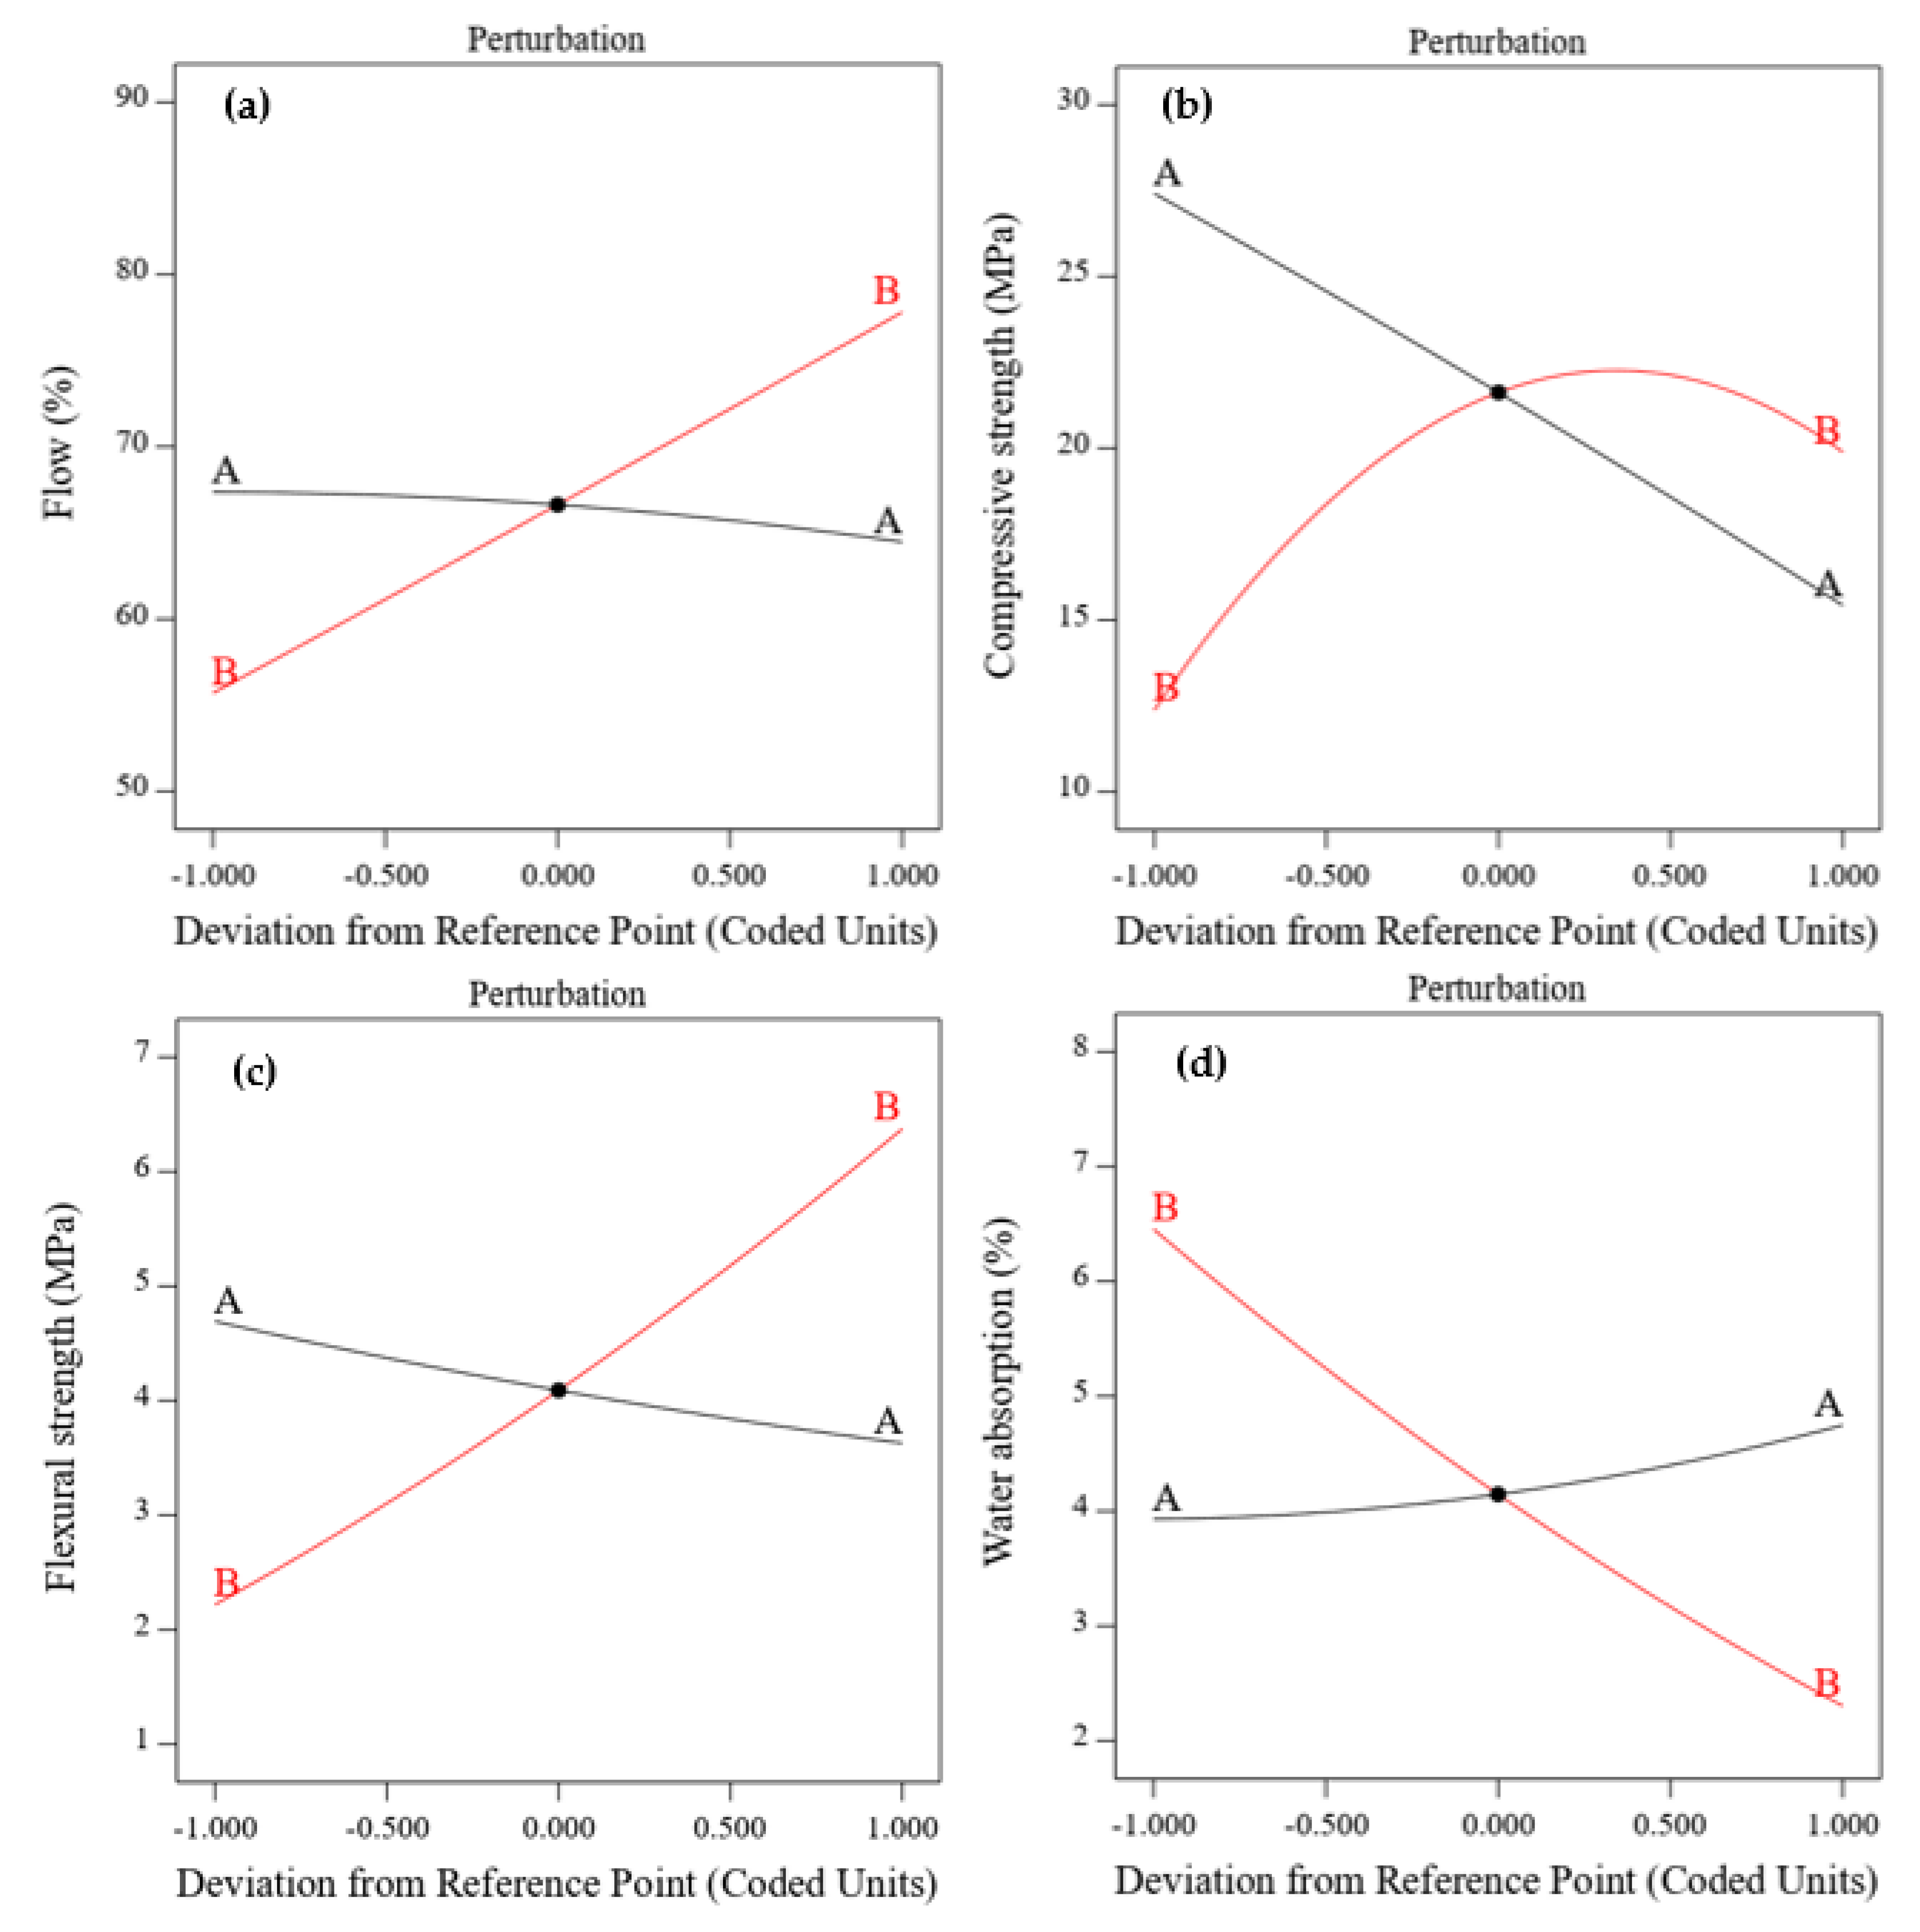
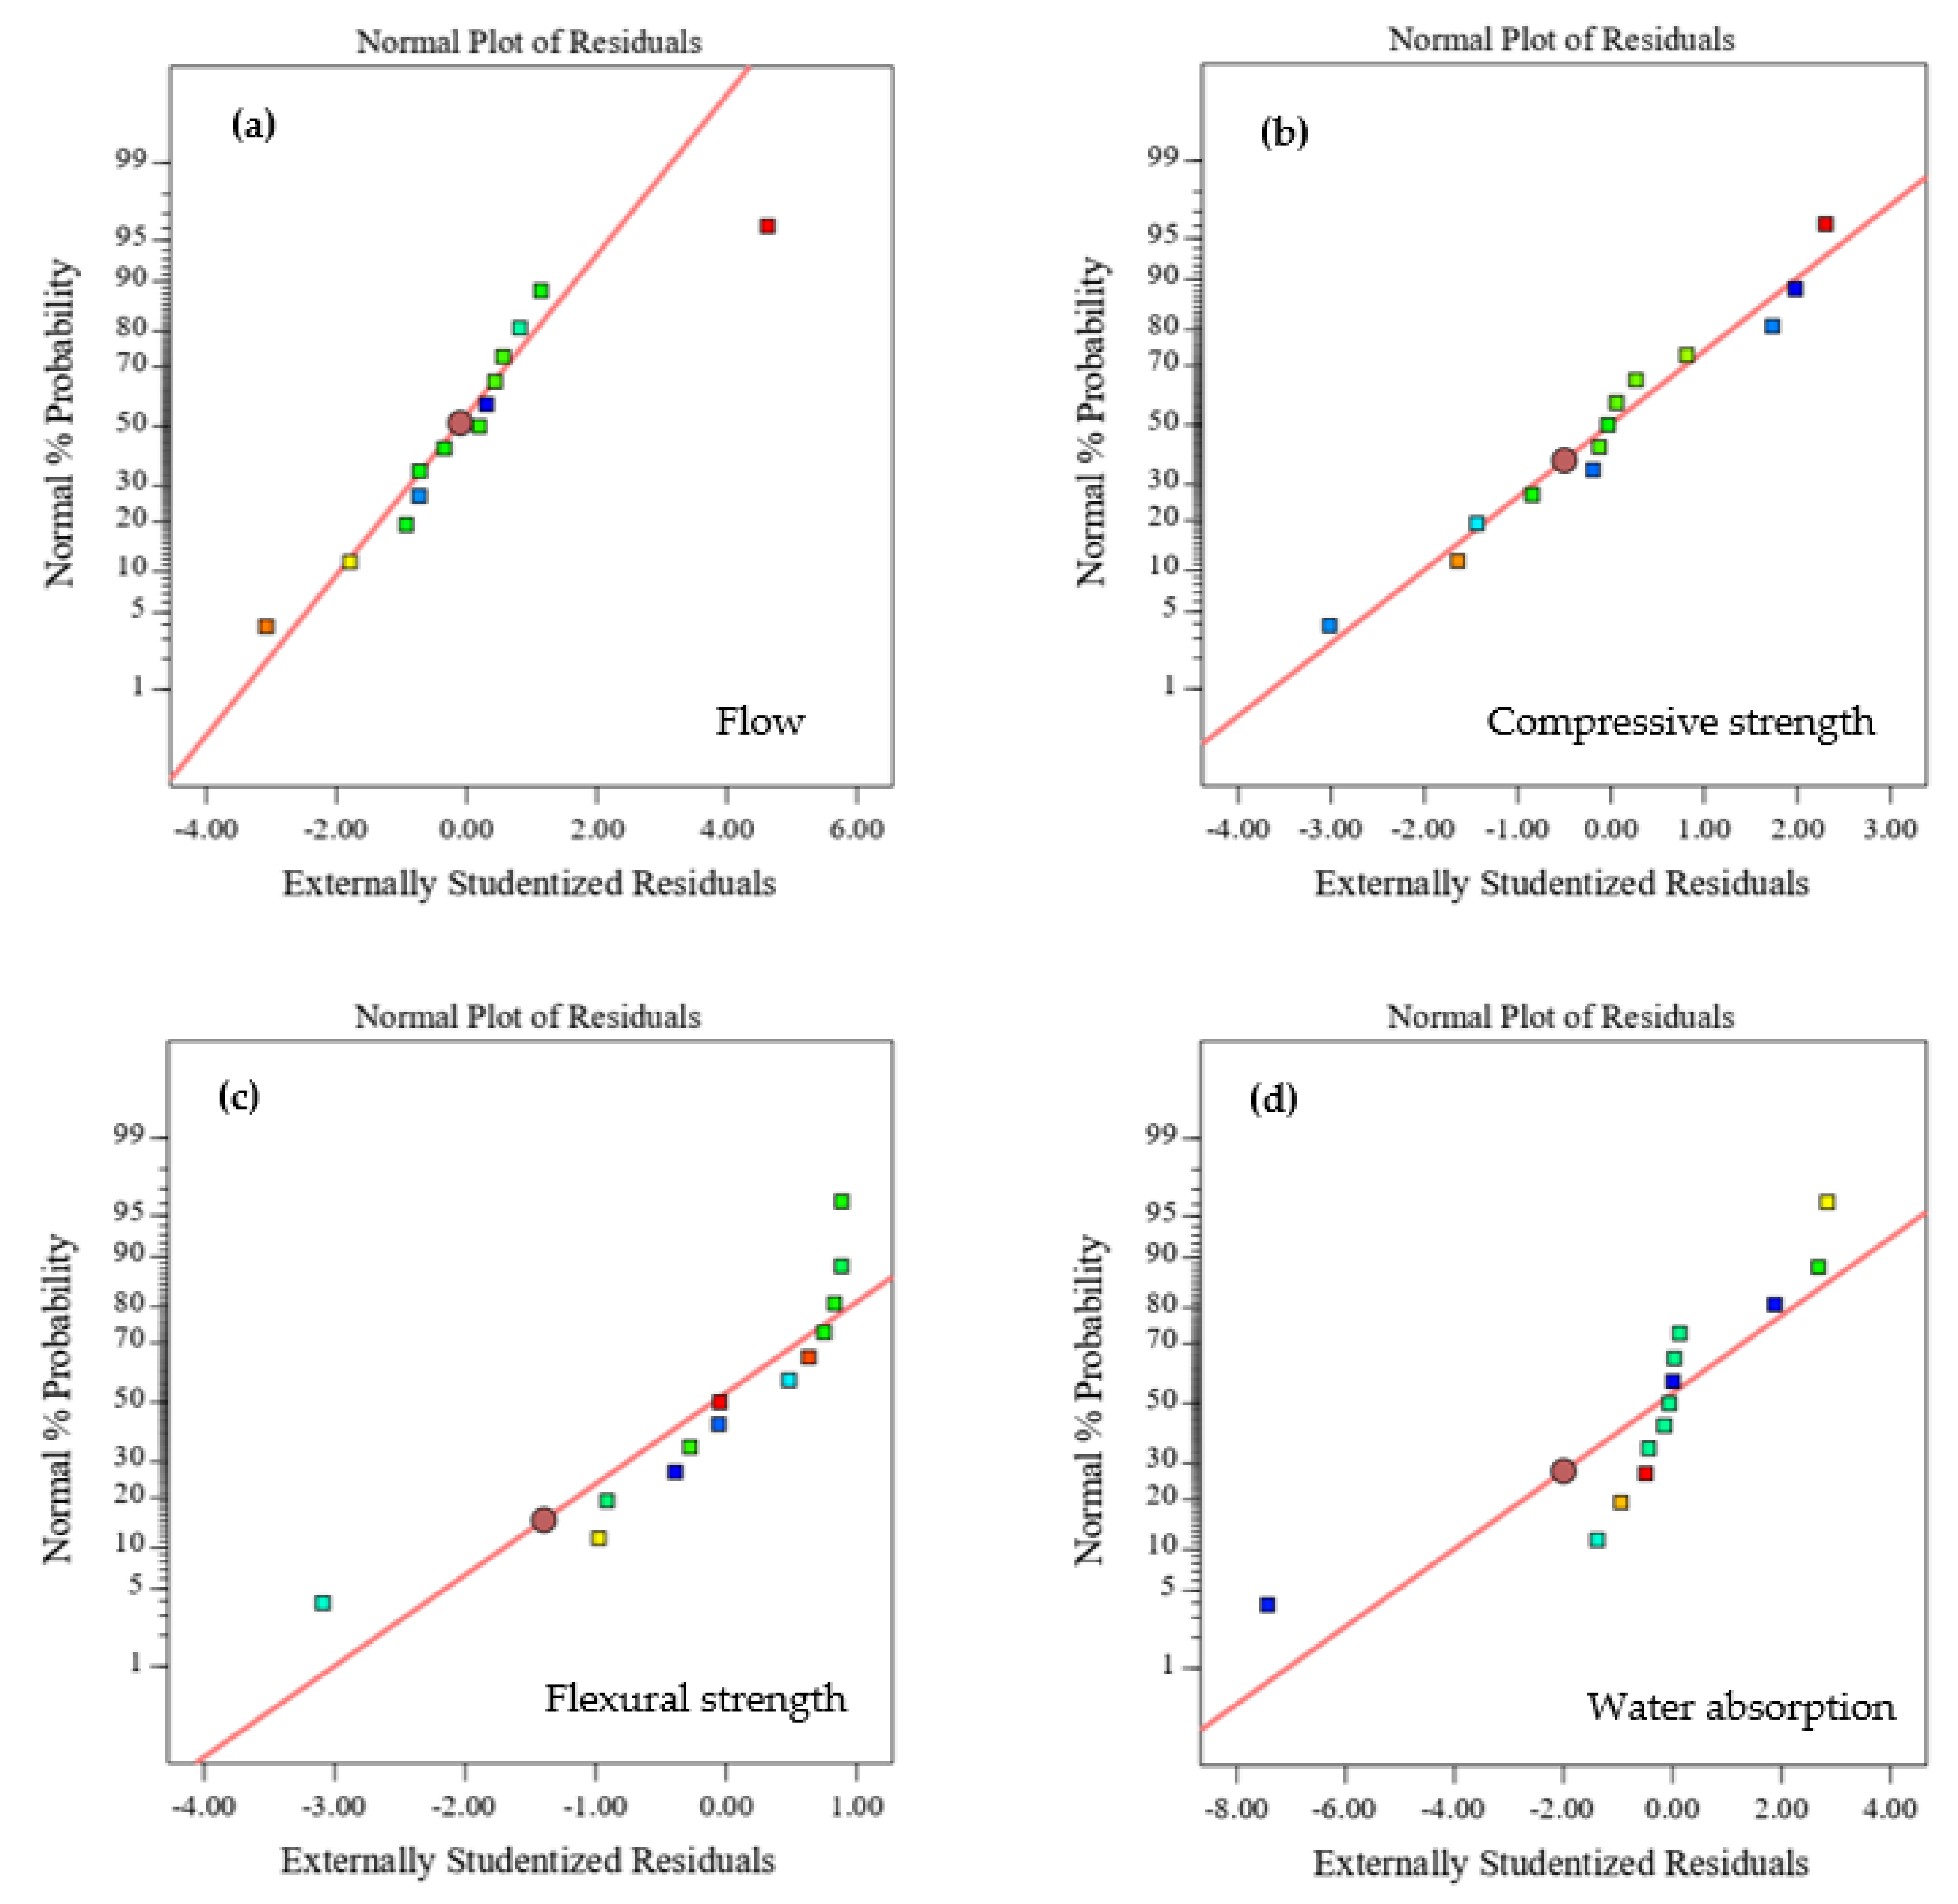
3.3. Perturbation and Normal Probability Plots

The perturbation plot explains the influence of independent variables on the response at a particular point [59]. The BOFS ratio formed a slight curvature, showing its low sensitivity to the flow and water absorption properties, as shown in Figure 10a,d, respectively. The observation from the perturbation plot (Figure 10b) implies that the effect of NaOH molarity was more sensitive to the compressive strength due to the formation of a sharp curvature compared to that of BOFS content. The formation of this sharp curvature indicates that NaOH molarity enhances the compressive strength up to a certain molarity.
However, both the BOFS ratio and NaOH molarity seemed to form linear straight lines (Figure 10c) for flexural strength. Figure 11 presents the normal plots of the residual values for all responses, which aided in defining the appropriateness of the model. Figure 11a–c show that the flow values, compressive strength, and flexural strength residual plots formed straight lines, which satisfied the plot of the studentized residual against the normal percentage of probability; the exception was water absorption, which showed comparatively scattered data points (Figure 11d).

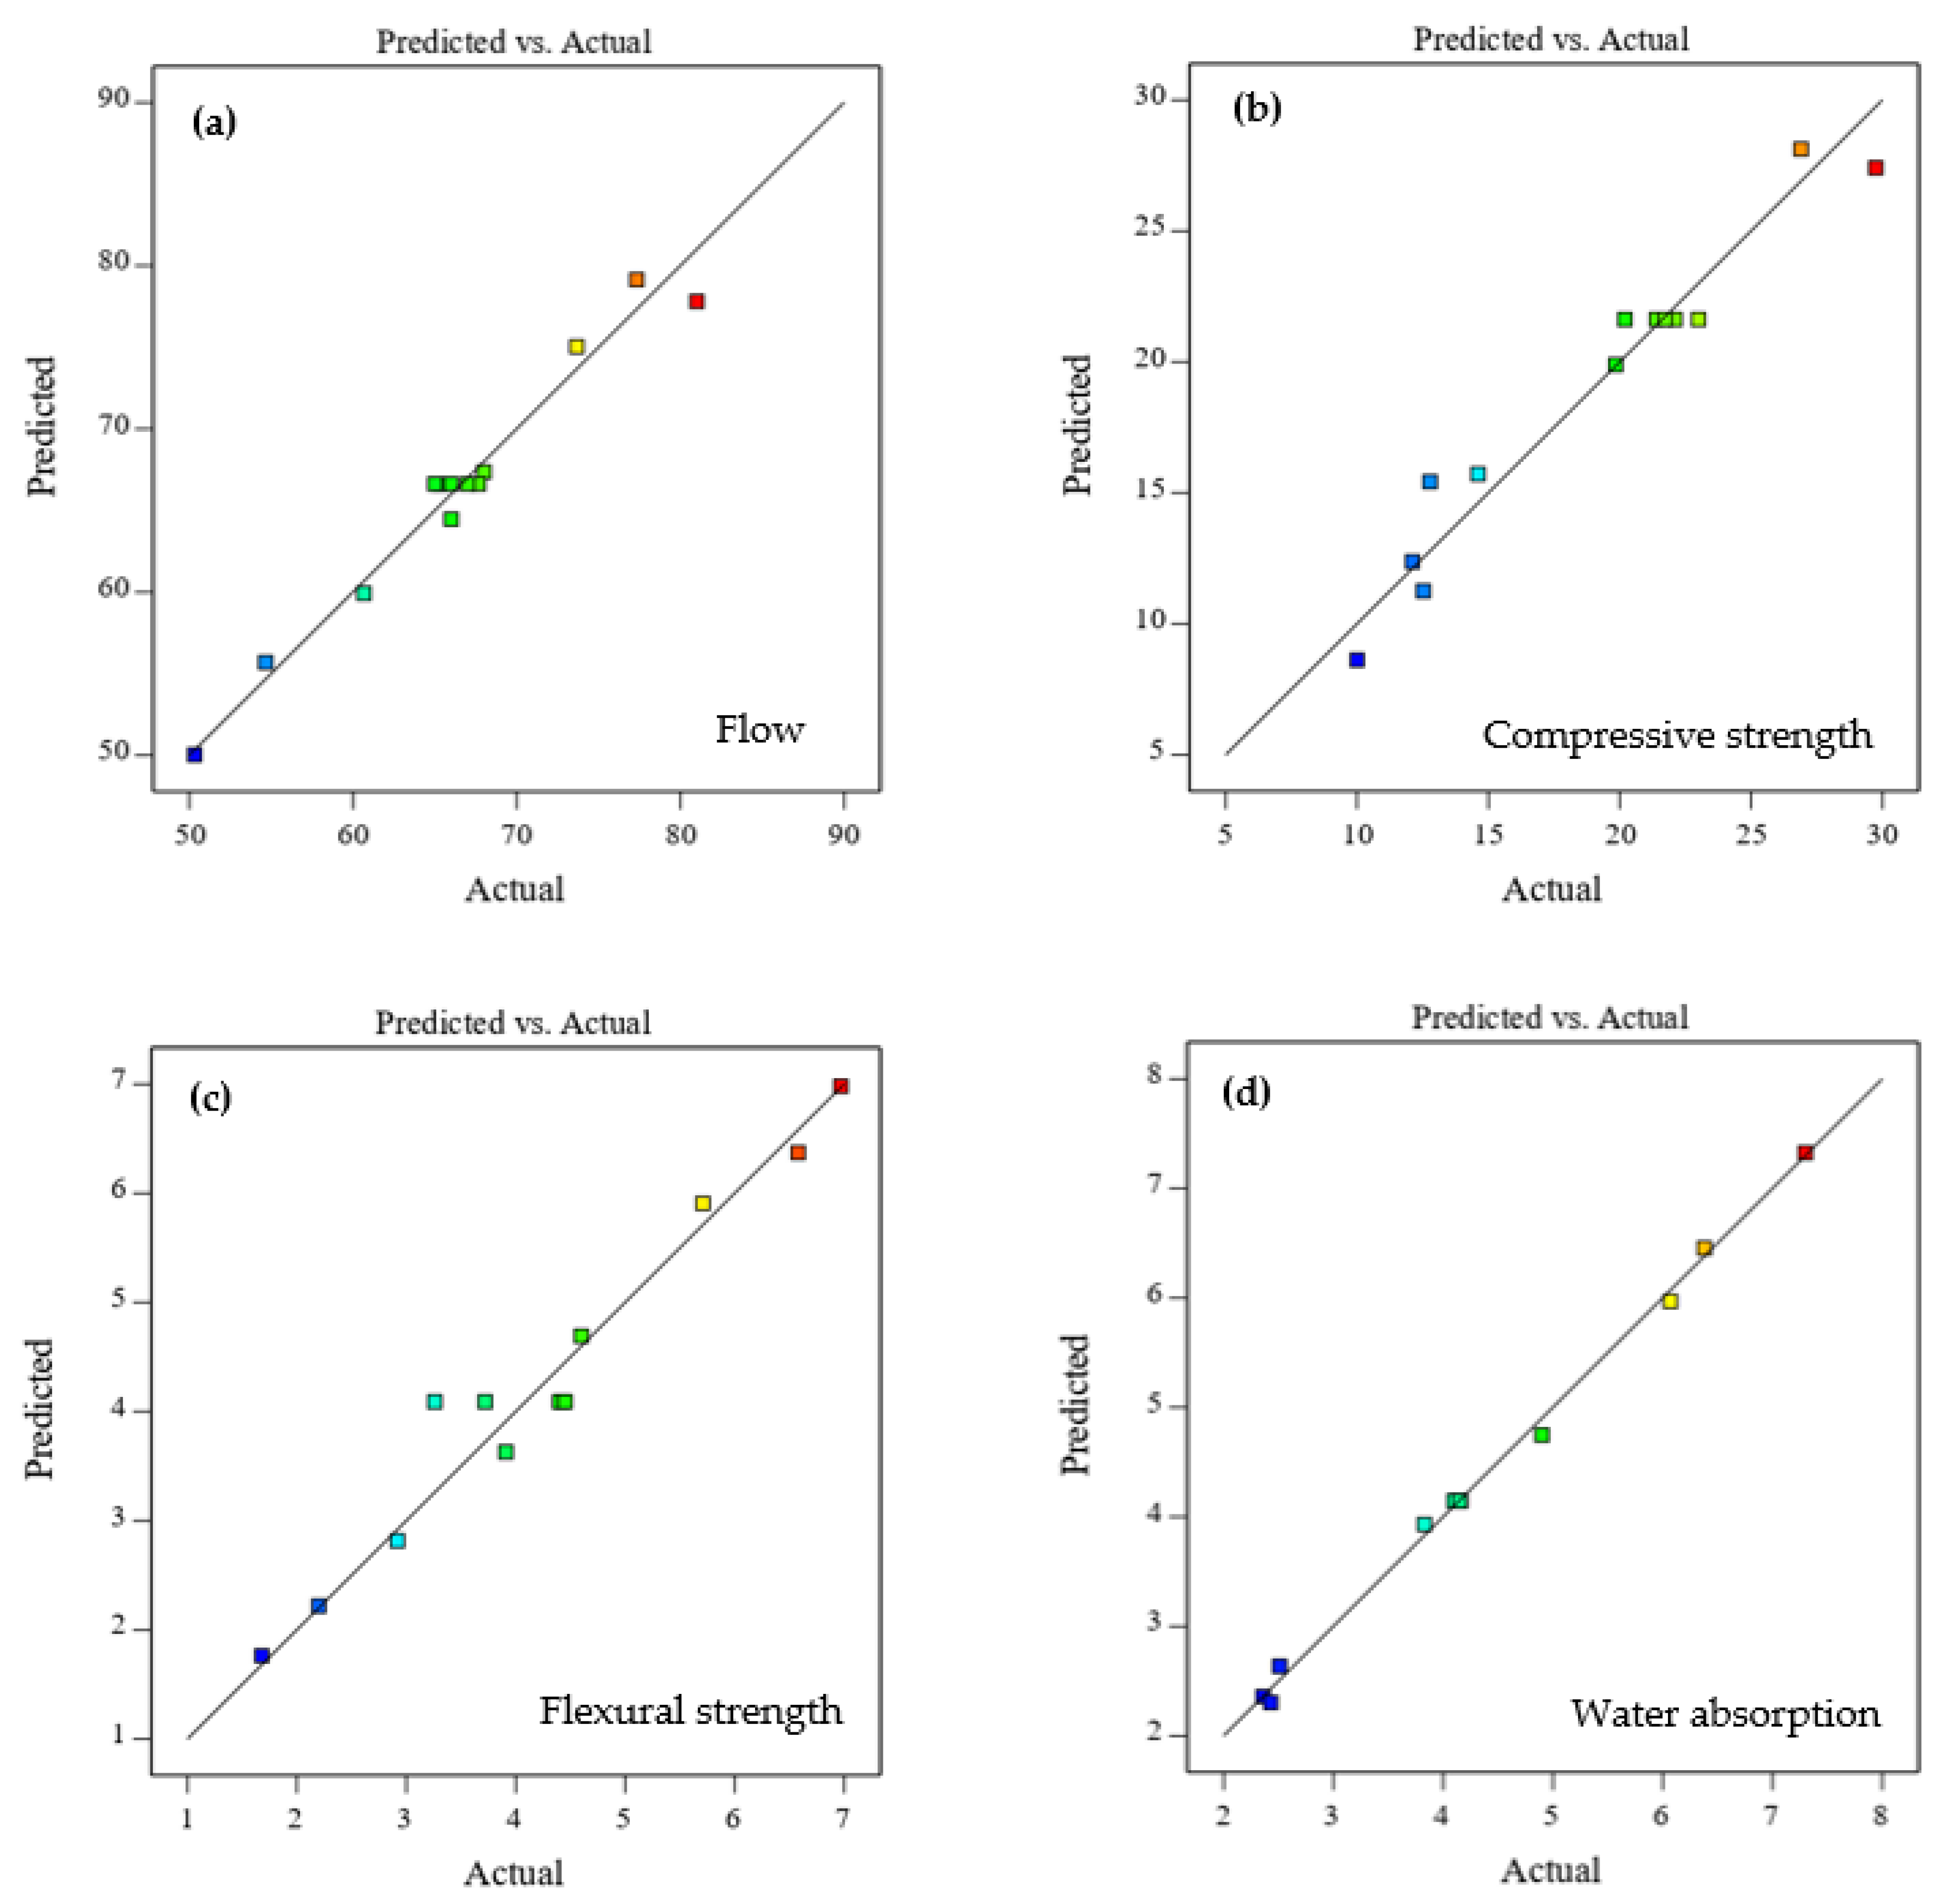
3.4. Predicted vs. Actual Plots

The predicted values compared to the actual values of the investigated properties are shown in Figure 12. The predicted values were very close to the actual values of flow, compressive strength, flexural strength, and water absorption. However, a few points were not on the line for compressive and flexural strengths, as shown in Figure 12b,c. On the other hand, the consistency of the predicted and experimental flow values was higher compared to compressive and flexural strengths since very few points were dispersed far from the line, as confirmed in Figure 12a. The predicted values of water absorption (Figure 12d) were found to be more consistent with and closer to the experimental values compared to the other responses, which can also be confirmed by the maximum R2 value of 0.99. Nevertheless, the predicted and experimental values followed linear trends for each response and thus verified the reliability and prediction of the response models.

3.5. Contour and 3D Response Surface Plots of the Responses

Figure 13 illustrates the 3D response surface and its corresponding contour plot for the response flow of the AAM samples, and it shows a slight curvature with the BOFS ratio. The alteration of NaOH molarity was more sensitive to the flowability for the selected range of BOFS content. The distorted contours observed in Figure 14 imply that there is less interaction between independent variables. However, the curvature seen along the molarity axis denotes the possible optimal value for NaOH molarity. The curvature of the 3D response surface graph shown in Figure 15 depicts that the NaOH molarity more markedly influenced the flexural strength compared to the BOFS ratio. Figure 16 visualizes the variation in the response surface and contour plots with the BOFS ratio and NaOH molarity, in which the contours are slightly curved, denoting comparatively fewer interactions between the independent variables for water absorption. The bluish section (Figure 16) provides the preferred water absorption values for the studied mortar specimens.

3.6. Predictive Performance of the Derived RSM Models

The predictive efficiency of the models obtained by RSM defined by FCCD was classified based on NSE, SD, and RMSE values, and the results are tabulated in Table 5. In terms of NSE criteria, the RSM models were categorized as very good for predicting flow, compressive strength, flexural strength, and water absorption since their corresponding NSE values were greater than 0.90. Water absorption had the maximum NSE value (1.00), followed by flow (0.97), flexural strength (0.96), and compressive strength (0.95). It has been previously reported that higher efficiency and goodness of fit are directly related to lower MSE and RMSE [60]. The lower MSE and RMSE values for water absorption imply the appropriate efficiency of the predicted RSM models, which is also consistent with the corresponding NSE value of 1.00. Furthermore, all responses were categorized as very good based on the SD and RMSE specifications, as the corresponding SD values of the responses were greater than 3.2RMSE. The obtained results and model efficiency classification clearly suggest that the predicted RSM models can be accurately used to navigate the defined design space to estimate the flow, compressive strength, flexural strength, and water absorption of the AAM samples.

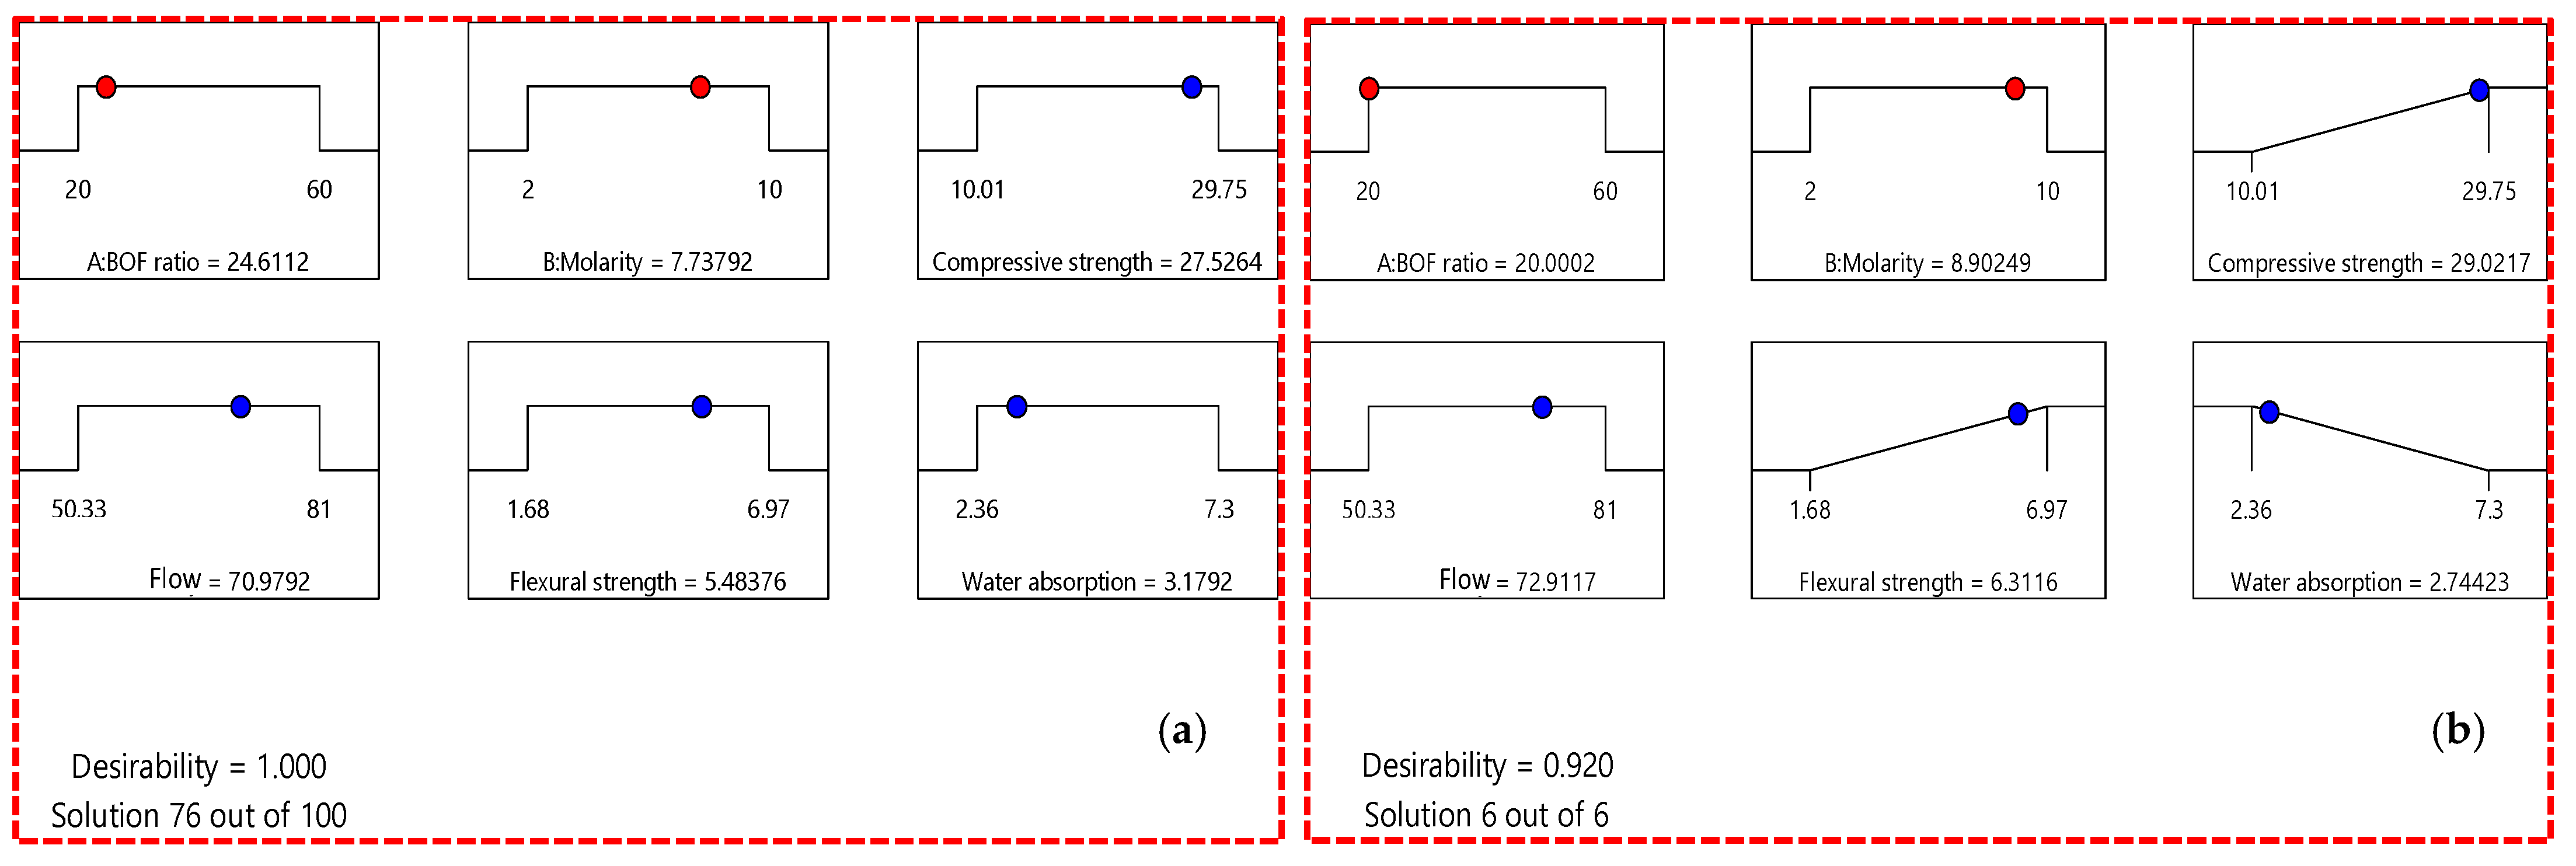
3.7. Optimization and Experimental Validation

In this part of the study, numerical optimization was performed using the multi-objective optimization technique, as this method assists in optimizing several responses concurrently [61,62]. The optimal values of the independent parameters (A: BOFS ratio; B: NaOH molarity) were determined by setting the optimization targets, namely, optimization-1, in which the goals of all parameters were within the range, and optimization-2, where compressive strength and flexural strength were maximized, water absorption was minimized, and the remaining parameter goals were within the range. The optimal values of BOFS and NaOH molarity in optimization-1 were found to be 24.61% and 7.74 M, respectively, whereas BOFS content and NaOH molarity were calculated as 20.00% and 8.90 M, respectively, in optimization-2, and their corresponding values of dependent variables are illustrated in Table 6. The outcome of multi-objective optimization was assessed by the desirability value (dj), which can be computed using the geometrical mean of each response’s desirability, as expressed in Equation (14) [63].
D = ( d 1 r 1 × d 1 r 1 × × d n r n ) 1 n
where ri and n represent the importance level for each objective function di and the total number of responses considered, respectively.
The dj value ranges between 0 and 1, where 1 represents the ideal response and 0 denotes an undesirable response. The desirability of optimization-1 and optimization-2 was found to be 1.00 and 0.920, respectively. The predicted optimized mix proportions of optimization-1 and optimization-2 were experimentally investigated three times, and the average values were noted to validate the appropriateness of the response models and optimization results. In addition, the error between the predicted and experimental results was calculated by using Equation (15). The results of the optimization study are tabulated in Table 6. Similarly, the graphical representation of the independent factors and the responses are presented through the optimization ramp shown in Figure 17. In both optimization-1 and optimization-2, the experimental values were comparable to the predicted values, with errors ranging between 0.57 and 1.43%, 0.87 and 1.56%, 2.05 and 0.31%, and 2.58 and 6.20% for flow, compressive strength, flexural strength, and water absorption, respectively.
In optimization-1, the BOFS content was higher, and NaOH molarity was lower; however, these values were reversed in optimization-2. On the other hand, optimization-1 can be considered efficient in terms of a higher amount of BOFS utilization with a lower dosage of the activator, whereas optimization-2 can be appropriate to achieve higher flow, greater compressive and flexural strengths, and lower water absorption. Considering the optimization study, the predicted response models were appropriate and suitable to navigate the defined design space since the experimental and predicted results were well correlated and thus validated the obtained response models.
E r r o r   % = 1 P r e d i c t e d   v a l u e E x p e r i m e n t a l   v a l u e × 100 %  

4. Conclusions

The present study aimed to propose the efficient utilization of BOFS generated as waste to potentially promote environmental benefits. The properties of mortar mixes synthesized with different ratios of BOFS and GGBFS activated with NaOH were investigated. RSM was employed to statistically interpret and optimize independent and dependent variables. The following conclusions are outlined based on the experimental and statistical study:
  • The compressive strength of AAM samples activated with 6 M NaOH reached about 30 MPa and was superior to those activated using 2 and 10 M. In addition, increasing the BOFS content consistently decreased the compressive strength and flexural strength of AAM samples.
  • The water absorption and permeable pore volumes of AAM samples significantly decreased with an increase in NaOH molarity, whereas they slightly increased with an increase in the BOFS ratio.
  • The SEM observations revealed that increasing the NaOH molarity and reducing the BOFS ratio resulted in a denser microstructure, which is in agreement with the physical and mechanical test results.
  • The ANOVA results revealed that the obtained response models were accurate and statistically significant. The proposed quadratic models can be appropriately used to predict the response by navigating the defined design space by FCCD.
  • The optimal mix proportions of BOFS and NaOH molarity were found to be 24.61% and 7.74 M (optimization-1) for the efficient utilization of BOFS with a lower NaOH concentration. In addition, the optimal mix design of 20.00% BOFS and 8.90 M NaOH (optimization-2) performed better in achieving higher flow, greater compressive and flexural strengths, and lower water absorption.
  • The proposed methodology can promote environmental benefits by utilizing BOFS to produce alkali-activated mortars. This method may also address the economic and environmental issues due to the disposal of BOFS. Furthermore, this study might also create awareness among steel manufacturers that are involved in BOFS generation by visualizing its commercial importance in construction.

Author Contributions

Conceptualization, N.K. and N.M.; methodology, N.K. and N.M.; software, N.M., T.O. and N.K.; validation, N.K., T.O., H.Ö. and N.M.; formal analysis, N.K., N.M. and T.O.; investigation, N.M., T.O. and N.K.; resources, H.Ö.; data curation, N.M. and T.O.; writing—original draft preparation, N.M. and N.K.; writing—review and editing, N.K., N.M., T.O. and H.Ö.; visualization, N.M.; supervision, N.K.; project administration, N.K.; funding acquisition, N.K. and H.Ö. All authors have read and agreed to the published version of the manuscript.

Funding

The APC was funded by CIMPOR Global Holdings.

Institutional Review Board Statement

Not applicable.

Informed Consent Statement

Not applicable.

Data Availability Statement

Not applicable.

Acknowledgments

This research was carried out at the Construction Materials Laboratory of Yildiz Technical University. The authors would like to thank to the CIMPOR Global Holdings for support. The authors would also like to thank the laboratory staff for their help.

Conflicts of Interest

The authors declare no conflict of interest.

References

  1. D’Amico, B.; Pomponi, F.; Hart, J. Global potential for material substitution in building construction: The case of cross laminated timber. J. Clean. Prod. 2020, 279, 123487. [Google Scholar] [CrossRef]
  2. Nehdi, M.L.; Yassine, A. Mitigating Portland Cement CO2 Emissions Using Alkali-Activated Materials: System Dynamics Model. Materials 2020, 13, 4685. [Google Scholar] [CrossRef] [PubMed]
  3. Yildirim, I.Z.; Prezzi, M. Chemical, Mineralogical, and Morphological Properties of Steel Slag. Adv. Civ. Eng. 2011, 2011, 1–13. [Google Scholar] [CrossRef] [Green Version]
  4. Kabay, N.; Miyan, N.; Özkan, H. Basic oxygen furnace and ground granulated blast furnace slag based alkali-activated pastes: Characterization and optimization. J. Clean. Prod. 2021, 327, 129483. [Google Scholar] [CrossRef]
  5. Kim, S.H.; Jeong, S.; Chung, H.; Nam, K. Mechanism for Alkaline Leachate Reduction through Calcium Carbonate Precipita-tion on Basic Oxygen Furnace Slag by Different Carbonate Sources: Application of NaHCO3 and CO2 Gas. Waste Manag. 2020, 103, 122–127. [Google Scholar] [CrossRef]
  6. World Steel in Figures World Steel Association; Brussels, Belgium. 2020. Available online: www.worldsteel.org (accessed on 10 May 2021).
  7. Belhadj, E.; Diliberto, C.; Lecomte, A. Properties of hydraulic paste of basic oxygen furnace slag. Cem. Concr. Compos. 2014, 45, 15–21. [Google Scholar] [CrossRef]
  8. Euroslag Statistics. 2018. Available online: https://www.euroslag.com/products/statistics/statistics-2018/ (accessed on 5 October 2021).
  9. Chaurand, P.; Rose, J.; Domas, J.; Bottero, J.-Y. Speciation of Cr and V within BOF steel slag reused in road constructions. J. Geochem. Explor. 2006, 88, 10–14. [Google Scholar] [CrossRef]
  10. Lee, W.-H.; Cheng, T.-W.; Lin, K.-Y.; Lin, K.-L.; Wu, C.-C.; Tsai, C.-T. Geopolymer Technologies for Stabilization of Basic Oxygen Furnace Slags and Sustainable Application as Construction Materials. Sustainability 2020, 12, 5002. [Google Scholar] [CrossRef]
  11. Liu, C.; Guo, M.; Pandelaers, L.; Blanpain, B.; Huang, S. Stabilization of Free Lime in BOF Slag by Melting and Solidification in Air. Met. Mater. Trans. B 2016, 47, 3237–3240. [Google Scholar] [CrossRef]
  12. Morone, M.; Costa, G.; Polettini, A.; Pomi, R.; Baciocchi, R. Valorization of Steel Slag by a Combined Carbonation and Gran-ulation Treatment. Miner. Eng. 2014, 59, 82–90. [Google Scholar] [CrossRef] [Green Version]
  13. Wang, Q.; Yan, P.; Han, S. The influence of steel slag on the hydration of cement during the hydration process of complex binder. Sci. China Technol. Sci. 2011, 54, 388–394. [Google Scholar] [CrossRef]
  14. Ma, M.; Mehdizadeh, H.; Guo, M.-Z.; Ling, T.-C. Effect of direct carbonation routes of basic oxygen furnace slag (BOFS) on strength and hydration of blended cement paste. Constr. Build. Mater. 2021, 304, 124628. [Google Scholar] [CrossRef]
  15. Lin, Y.; Yan, B.; Shu, Q.; Fabritius, T. Synergetic valorization of basic oxygen furnace slag and stone coal: Metal recovery and preparation of glass-ceramics. Waste Manag. 2021, 135, 158–166. [Google Scholar] [CrossRef]
  16. Sun, K.; Peng, X.; Chu, S.; Wang, S.; Zeng, L.; Ji, G. Utilization of BOF steel slag aggregate in metakaolin-based geopolymer. Constr. Build. Mater. 2021, 300, 124024. [Google Scholar] [CrossRef]
  17. Provis, J.L. Alkali-Activated Materials. Cem. Concr. Res. 2018, 114, 40–48. [Google Scholar] [CrossRef]
  18. Davidovits, J.; Huaman, L.; Davidovits, R. Ancient organo-mineral geopolymer in South-American Monuments: Organic matter in andesite stone. SEM and petrographic evidence. Ceram. Int. 2019, 45, 7385–7389. [Google Scholar] [CrossRef]
  19. Alehyen, S.; Achouri, M.E.L.; Taibi, M. Characterization, Microstructure and Properties of Fly Ash-Based Geopolymer. J. Mater. Environ. Sci. 2017, 8, 1783–1796. [Google Scholar]
  20. Kabay, N.; Miyan, N. A Comparative Study on the Physical and Mechanical Properties of Alkali Activated Materials. Sigma 2020, 38, 649–658. [Google Scholar]
  21. Keulen, A.; van Zomeren, A.; Dijkstra, J. Leaching of monolithic and granular alkali activated slag-fly ash materials, as a function of the mixture design. Waste Manag. 2018, 78, 497–508. [Google Scholar] [CrossRef]
  22. Abdollahnejad, Z.; Mastali, M.; Luukkonen, T.; Kinnunen, P.; Illikainen, M. Fiber-reinforced one-part alkali-activated slag/ceramic binders. Ceram. Int. 2018, 44, 8963–8976. [Google Scholar] [CrossRef]
  23. Moudio, A.; Tchakouté, H.; Ngnintedem, D.; Andreola, F.; Kamseu, E.; Nanseu-Njiki, C.; Leonelli, C.; Rüscher, C. Influence of the synthetic calcium aluminate hydrate and the mixture of calcium aluminate and silicate hydrates on the compressive strengths and the microstructure of metakaolin-based geopolymer cements. Mater. Chem. Phys. 2021, 264, 124459. [Google Scholar] [CrossRef]
  24. Aboulayt, A.; Riahi, M.; Touhami, M.O.; Hannache, H.; Gomina, M.; Moussa, R. Properties of metakaolin based geopolymer incorporating calcium carbonate. Adv. Powder Technol. 2017, 28, 2393–2401. [Google Scholar] [CrossRef]
  25. Letelier, V.; Henríquez-Jara, B.I.; Manosalva, M.; Moriconi, G. Combined use of waste concrete and glass as a replacement for mortar raw materials. Waste Manag. 2019, 94, 107–119. [Google Scholar] [CrossRef] [PubMed]
  26. Samarakoon, M.H.; Ranjith, P.G.; Duan, W.H.; Haque, A.; Chen, B.K. Extensive Use of Waste Glass in One-Part Alkali-Activated Materials: Towards Sustainable Construction Practices. Waste Manag. 2021, 130, 1–11. [Google Scholar] [CrossRef]
  27. Zhang, P.; Han, X.; Zheng, Y.; Wan, J.; Hui, D. Effect of PVA fiber on mechanical properties of fly ash-based geopolymer concrete. Rev. Adv. Mater. Sci. 2021, 60, 418–437. [Google Scholar] [CrossRef]
  28. Zhang, P.; Wang, K.; Wang, J.; Guo, J.; Ling, Y. Macroscopic and Microscopic Analyses on Mechanical Performance of Metakaolin/Fly Ash Based Geopolymer Mortar. J. Clean. Prod. 2021, 294, 126193. [Google Scholar] [CrossRef]
  29. Mashifana, T.; Sebothoma, J.; Sithole, T. Alkaline Activation of Basic Oxygen Furnace Slag Modified Gold Mine Tailings for Building Material. Adv. Civ. Eng. 2021, 2021, 1–11. [Google Scholar] [CrossRef]
  30. Ozturk, M.; Bankir, M.B.; Bolukbasi, O.S.; Sevim, U.K. Alkali Activation of Electric Arc Furnace Slag: Mechanical Properties and Micro Analyzes. J. Build. Eng. 2019, 21, 97–105. [Google Scholar] [CrossRef]
  31. Rashad, A.M.; Khafaga, S.A.; Gharieb, M. Valorization of fly ash as an additive for electric arc furnace slag geopolymer cement. Constr. Build. Mater. 2021, 294, 123570. [Google Scholar] [CrossRef]
  32. Li, J.; Yu, Q.; Wei, J.; Zhang, T. Structural characteristics and hydration kinetics of modified steel slag. Cem. Concr. Res. 2011, 41, 324–329. [Google Scholar] [CrossRef]
  33. Apithanyasai, S.; Supakata, N.; Papong, S. The potential of industrial waste: Using foundry sand with fly ash and electric arc furnace slag for geopolymer brick production. Heliyon 2020, 6, e03697. [Google Scholar] [CrossRef] [PubMed]
  34. Hui-Teng, N.; Cheng-Yong, H.; Yun-Ming, L.; Abdullah, M.M.A.B.; Hun, K.E.; Razi, H.M.; Yong-Sing, N. Formulation, Me-chanical Properties and Phase Analysis of Fly Ash Geopolymer with Ladle Furnace Slag Replacement. J. Mater. Res. Technol. 2021, 12, 1212–1226. [Google Scholar] [CrossRef]
  35. Yong-Sing, N.; Yun-Ming, L.; Cheng-Yong, H.; Abdullah, M.M.A.B.; Chan, L.W.L.; Hui-Teng, N.; Shee-Ween, O.; Wan-En, O.; Yong-Jie, H. Evaluation of flexural properties and characterisation of 10-mm thin geopolymer based on fly ash and ladle furnace slag. J. Mater. Res. Technol. 2021, 15, 163–176. [Google Scholar] [CrossRef]
  36. Bignozzi, M.C.; Manzi, S.; Lancellotti, I.; Kamseu, E.; Barbieri, L.; Leonelli, C. Mix-Design and Characterization of Alkali Ac-tivated Materials Based on Metakaolin and Ladle Slag. Appl. Clay Sci. 2013, 73, 78–85. [Google Scholar] [CrossRef]
  37. Wang, W.-C.; Wang, H.-Y.; Tsai, H.-C. Study on engineering properties of alkali-activated ladle furnace slag geopolymer. Constr. Build. Mater. 2016, 123, 800–805. [Google Scholar] [CrossRef]
  38. Pinheiro, C.; Rios, S.; da Fonseca, A.V.; Fernández-Jiménez, A.; Cristelo, N. Application of the response surface method to optimize alkali activated cements based on low-reactivity ladle furnace slag. Constr. Build. Mater. 2020, 264, 120271. [Google Scholar] [CrossRef]
  39. Wang, Q.; Yan, P. Hydration properties of basic oxygen furnace steel slag. Constr. Build. Mater. 2010, 24, 1134–1140. [Google Scholar] [CrossRef]
  40. Mahieux, P.-Y.; Aubert, J.-E.; Escadeillas, G. Utilization of weathered basic oxygen furnace slag in the production of hydraulic road binders. Constr. Build. Mater. 2009, 23, 742–747. [Google Scholar] [CrossRef]
  41. Gao, Y.; Xu, J.; Luo, X.; Zhu, J.; Nie, L. Experiment Research on Mix Design and Early Mechanical Performance of Alkali-Activated Slag Using Response Surface Methodology (RSM). Ceram. Int. 2016, 42, 11666–11673. [Google Scholar] [CrossRef]
  42. Barahimi, V.; Moghimi, H.; Taheri, R.A. Cu Doped TiO2-Bi2O3 Nanocomposite for Degradation of Azo Dye in Aqueous Solution: Process Modeling and Optimization Using Central Composite Design. J. Environ. Chem. Eng. 2019, 7, 103078. [Google Scholar] [CrossRef]
  43. Hlangwani, E.; Doorsamy, W.; Adebiyi, J.A.; Fajimi, L.I.; Adebo, O.A. A modeling method for the development of a bioprocess to optimally produce umqombothi (a South African traditional beer). Sci. Rep. 2021, 11, 1–15. [Google Scholar] [CrossRef]
  44. Zhai, C.; Xu, J.; Nie, X.; Tian, J.; Yu, H. Multiple nonlinear regression model of cutting force for C/SiC composites by laser-assisted micromachining. Int. J. Appl. Ceram. Technol. 2021, 18, 2273–2283. [Google Scholar] [CrossRef]
  45. Auta, M.; Hameed, B. Optimized waste tea activated carbon for adsorption of Methylene Blue and Acid Blue 29 dyes using response surface methodology. Chem. Eng. J. 2011, 175, 233–243. [Google Scholar] [CrossRef]
  46. Ritter, A.; Muñoz-Carpena, R. Performance evaluation of hydrological models: Statistical significance for reducing subjectivity in goodness-of-fit assessments. J. Hydrol. 2013, 480, 33–45. [Google Scholar] [CrossRef]
  47. Sojobi, A.; Aladegboye, O.; Awolusi, T. Green interlocking paving units. Constr. Build. Mater. 2018, 173, 600–614. [Google Scholar] [CrossRef]
  48. Ismail, I.; Bernal, S.A.; Provis, J.L.; Nicolas, R.S.; Brice, D.G.; Kilcullen, A.R.; Hamdan, S.; van Deventer, J.S. Influence of fly ash on the water and chloride permeability of alkali-activated slag mortars and concretes. Constr. Build. Mater. 2013, 48, 1187–1201. [Google Scholar] [CrossRef]
  49. Fang, G.; Ho, W.K.; Tu, W.; Zhang, M. Workability and mechanical properties of alkali-activated fly ash-slag concrete cured at ambient temperature. Constr. Build. Mater. 2018, 172, 476–487. [Google Scholar] [CrossRef]
  50. Nadoushan, M.J.; Ramezanianpour, A.A. The effect of type and concentration of activators on flowability and compressive strength of natural pozzolan and slag-based geopolymers. Constr. Build. Mater. 2016, 111, 337–347. [Google Scholar] [CrossRef]
  51. Polettini, A.; Pomi, R.; Stramazzo, A. CO2 sequestration through aqueous accelerated carbonation of BOF slag: A factorial study of parameters effects. J. Environ. Manag. 2016, 167, 185–195. [Google Scholar] [CrossRef]
  52. Lee, W.; van Deventer, J. The effects of inorganic salt contamination on the strength and durability of geopolymers. Colloids Surf. A Physicochem. Eng. Asp. 2002, 211, 115–126. [Google Scholar] [CrossRef]
  53. Shrivas, R.; Paramkusam, B.R.; Dwivedi, S.B. Effect of Alkali Concentration on Strength Development in Jointly Activated Pond Ash-GGBFS Mixtures through Geopolymeric Reactions. KSCE J. Civ. Eng. 2021, 25, 1600–1608. [Google Scholar] [CrossRef]
  54. Chi, M.; Huang, R. Binding Mechanism and Properties of Alkali-Activated Fly Ash/Slag Mortars. Constr. Build Mater. 2013, 40, 291–298. [Google Scholar] [CrossRef]
  55. Mishra, A.; Choudhary, D.; Jain, N.; Kumar, M.; Sharda, N.; Dutt, D. Effect of Concentration of Alkaline Liquid and Curing Time on Strength and Water Absorption of Geopolymer Concrete. ARPN J. Eng. Appl. Sci. 2008, 3, 14–18. [Google Scholar]
  56. Jeyasehar, C.A.; Saravanan, G.; Ramakrishnan, A.K.; Kandasamy, S. Strength and Durability Studies on Fly Ash Based Geopolymer Bricks. Asian J. Civ. Eng. 2013, 14, 797–808. [Google Scholar]
  57. Mora, Z.; Suharyanto, A.; Yahya, M. Effect of Work Safety and Work Healthy towards Employee’s Productivity in PT. Sisirau Aceh Tamiang. Burns 2020, 2, 1. [Google Scholar] [CrossRef]
  58. Nazari, E.; Rashchi, F.; Saba, M.; Mirazimi, S.M.J. Simultaneous Recovery of Vanadium and Nickel from Power Plant Fly-Ash: Optimization of Parameters Using Response Surface Methodology. Waste Manag. 2014, 34, 2687–2696. [Google Scholar] [CrossRef]
  59. Hafeez, A.; Taqvi, S.A.A.; Fazal, T.; Javed, F.; Khan, Z.; Amjad, U.S.; Bokhari, A.; Shehzad, N.; Rashid, N.; Rehman, S. Optimization on Cleaner Intensification of Ozone Production Using Artificial Neural Network and Response Surface Methodology: Parametric and Comparative Study. J. Clean. Prod. 2020, 252, 119833. [Google Scholar] [CrossRef]
  60. Rathankumar, A.K.; Vaithyanathan, V.K.; Saikia, K.; Anand, S.S.; Vaidyanathan, V.K.; Cabana, H. Effect of Alkaline Treatment on the Removal of Contaminants of Emerging Concern from Municipal Biosolids: Modelling and Optimization of Process Parameters Using RSM and ANN Coupled GA. Chemosphere 2022, 286, 131847. [Google Scholar] [CrossRef] [PubMed]
  61. Liu, J.-C.; Tan, K.H.; Zhang, D. Multi-response optimization of post-fire performance of strain hardening cementitious composite. Cem. Concr. Compos. 2017, 80, 80–90. [Google Scholar] [CrossRef]
  62. Burke, E.K.; Burke, E.K.; Kendall, G.; Kendall, G. Search Methodologies: Introductory Tutorials in Optimization and Decision Support Techniques; Springer: Berlin/Heidelberg, Germany, 2014; ISBN 1461469406. [Google Scholar]
  63. Achara, B.E.; Mohammed, B.S.; Liew, M. Bond behaviour of nano-silica-modified self-compacting engineered cementitious composite using response surface methodology. Constr. Build. Mater. 2019, 224, 796–814. [Google Scholar] [CrossRef]
Figure 1. Particle size distribution of binders and sand.
Materials 16 02357 g001
Figure 2. SEM photographs of (a) BOFS and (b) GGBFS.
Materials 16 02357 g002
Figure 3. XRD of raw (a) BOFS and (b) GGBFS.
Materials 16 02357 g003
Figure 4. Visual representation of FCCD.
Materials 16 02357 g004
Figure 5. Flow values of AAM mixes (green is 10 M).
Materials 16 02357 g005
Figure 6. (a) Compressive strength and (b) relative compressive strength of specimens in comparison with 6 M.
Materials 16 02357 g006
Figure 7. (a) Flexural strength and (b) relative flexural strength of specimens in comparison with 6 M.
Materials 16 02357 g007
Figure 8. (a) The variation in the water absorption and (b) volume of permeable pores of AAM specimens.
Materials 16 02357 g008
Figure 9. SEM-EDS of alkali-activated pastes: (a) B0.2-6, (b) B0.6-2, and (c) B0.6-6.
Materials 16 02357 g009
Figure 10. Perturbation plots of (a) flow, (b) compressive strength, (c) flexural strength, and (d) water absorption.
Materials 16 02357 g010
Figure 11. Normal probability plots of (a) flow, (b) compressive strength, (c) flexural strength, and (d) water absorption.
Materials 16 02357 g011
Figure 12. Predicted vs. actual plots for (a) flow, (b) compressive strength, (c) flexural strength, and (d) water absorption.
Materials 16 02357 g012
Figure 13. Contour plot and 3D response surface of flow values.
Materials 16 02357 g013
Figure 14. Contour plot and 3D response surface of 28-day compressive strength.
Materials 16 02357 g014
Figure 15. Contour plot and 3D response surface of 28-day flexural strength.
Materials 16 02357 g015
Figure 16. Contour plot and 3D response surface of water absorption.
Materials 16 02357 g016
Figure 17. Ramp diagram of multi-objective optimization for (a) optimization-1 and (b) optimization-2.
Materials 16 02357 g017
Table 1. Oxide compositions of BOFS and GGBFS.
PrecursorComponent (wt%)
SiO2Al2O3Fe2O3CaOMgOSO3K2ONa2OTiO2P2O5Cr2O3Mn2O3LOI *
BOFS8.84.2723.2841.075.251.740.010.10.20.650.152.5313.12
GGBFS3912.5137.550.30.20.6----0.02
*: Loss on ignition (LOI).
Table 2. Face-centered central composite design for 2 factors at 3 levels.
LevelsFactor 1
A: BOF Ratio (wt%)
Factor 2
B: NaOH Molarity (M)
−1202
0406
+16010
Table 3. Details of experimental mix design.
Mixture IDCodedActualMix Proportion
ABA
(wt%)
B
(M)
BOFS
(wt%)
GGBFS
(wt%)
NaOH Molarity
(M)
B0.2-2−1−120220802
B0.4-20−140240602
B0.6-21−160260402
B0.2-6−1020620806
B0.4-6 *0040640606
0040640606
0040640606
0040640606
0040640606
B0.6-61060660406
B0.2-10−112010208010
B0.4-10014010406010
B0.6-10116010604010
A: BOFS. B: NaOH molarity. * Represents identical mix designs (5 center points).
Table 4. ANOVA results of the analyzed responses.
ResponseSourceSSDFMSF-Valuep-Value
FlowModel796.315159.2643.26<0.0001 *SD = 1.92
R2 = 0.97
AP = 22.33
A: BOFS ratio12.56112.563.410.1073
B: Molarity733.281733.28199.18<0.0001 *
AB49.00149.0013.310.0082 *
1.4111.410.380.5562
0.0410.040.010.9191
Residual25.7773.68
Lack of fit20.7336.915.490.0668
Pure Error5.03841.259
Cor. Total822.0812
Compressive strengthModel424.03584.8125.760.0002 *SD = 1.81
R2 = 0.95
AP = 15.82
A: BOFS ratio215.281215.2865.390.0001 *
B: Molarity84.75184.7525.740.0014 *
AB23.86123.867.250.0310 *
0.1110.110.030.8584
83.16183.1625.260.0015 *
Residual23.0473.29
Lack of fit18.8536.286.000.0581
Pure Error4.19041.047
Cor. Total447.0712
Flexural strengthModel27.7655.5528.700.0002 *SD = 0.44
R2 = 0.95
AP = 17.46
A: BOFS ratio1.7011.708.770.0211 *
B: Molarity25.88125.88133.74<0.0001 *
AB0.0010.000.000.9825
0.0110.010.070.7957
0.1210.120.610.4614
Residual1.3570.19
Lack of fit0.1930.060.220.8757
Pure Error1.16040.290
Cor. Total29.1212
Water absorptionModel27.5355.51458.72<0.0001 *SD = 0.11
R2 = 0.99
AP = 67.46
A: BOFS ratio1.0011.0083.34<0.0001 *
B: Molarity25.83125.832152.05<0.0001 *
AB0.2910.2924.290.0017 *
0.1010.108.590.0220 *
0.1510.1512.520.0095 *
Residual0.0870.01
Lack of fit0.0830.0351.520.0012 *
Pure Error0.00240.001
Cor. Total27.6212
*: Significant; SS: summation of squares; Cor. Total: corrected total summation of squares; DF: degree of freedom; MS: mean square; AP: adequate precision.
Table 5. The goodness-of-fit assessment of response models.
ResponseSDMSERMSENSENtOutcome
Flow8.281.981.410.974.88Very good
Compressive strength6.101.771.330.953.58Very good
Flexural strength1.560.100.320.963.83Very good
Water absorption1.520.010.081.0017.87Very good
Table 6. Multi-objective optimization of the mix design and response.
Dependent and Independent FactorsOptimization
Goal
DesirabilityPredicted
Values
Experimental
Values
SDError (%)
Optimization-1A: BOFS ratio (%)In range1.00024.61
B: Molarity (M)In range 7.74
FlowIn range 70.9772.001.411.43
Compressive strengthIn range 27.5327.771.540.87
Flexural strengthIn range 5.485.370.052.05
Water absorptionIn range 3.183.103.182.58
Optimization-2A: BOFS ratio (%)In range0.92020.00
B: Molarity (M)In range 8.90
FlowIn range 72.9173.001.290.57
Compressive strengthMaximize 29.0229.482.041.56
Flexural strengthMaximize 6.316.330.500.31
Water absorptionMinimize 2.742.580.106.20
Disclaimer/Publisher’s Note: The statements, opinions and data contained in all publications are solely those of the individual author(s) and contributor(s) and not of MDPI and/or the editor(s). MDPI and/or the editor(s) disclaim responsibility for any injury to people or property resulting from any ideas, methods, instructions or products referred to in the content.

