
Microstructure and Cavitation Damage Characteristics of GX40CrNiSi25-20 Cast Stainless Steel by TIG Surface Remelting
 and
and 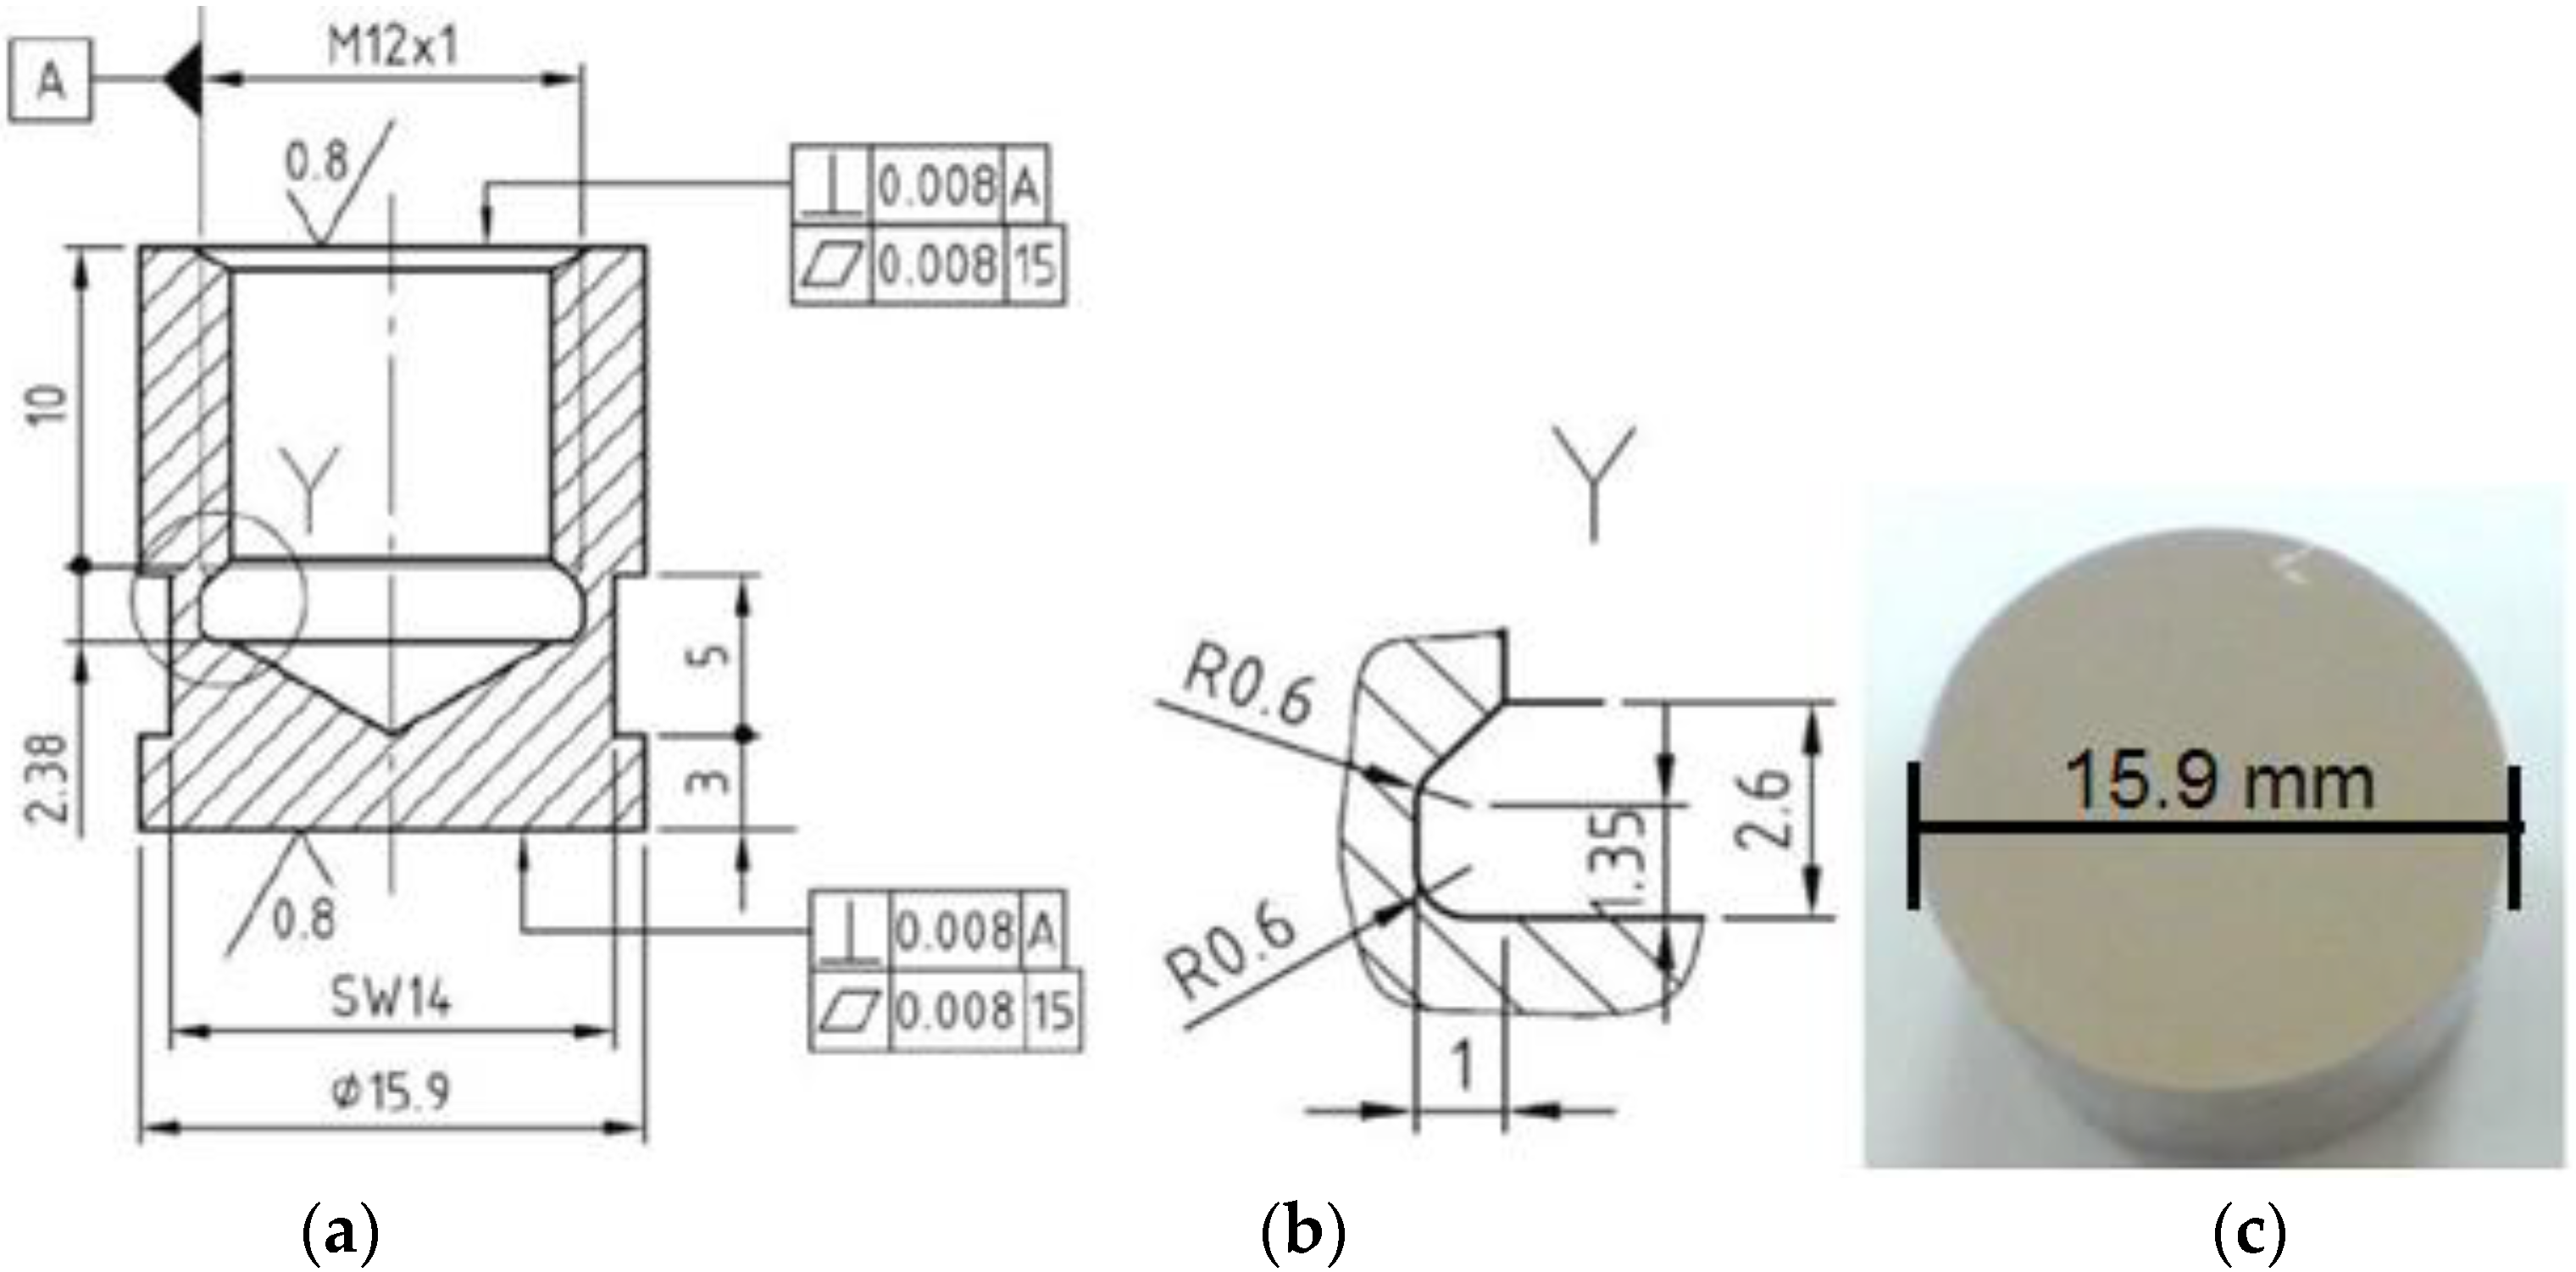
Abstract
:1. Introduction
2. Experimental Procedure
- power of the electronic ultrasound generator, 500 W;
- vibration frequency, 20,000 ± 2% Hz;
- vibration amplitude, 50 μm;
- sample diameter: 15,9 ± 0.05 mm;
- power supply: 220 V/50 Hz;
- testing liquid: distilled water, having a temperature of 22 ± 1 °C.
- weighing each sample and recording the initial mass (first on an electronic balance and then on a precision analytical balance, type Zatklady Mechaniki Precyzyjnej WP 1);
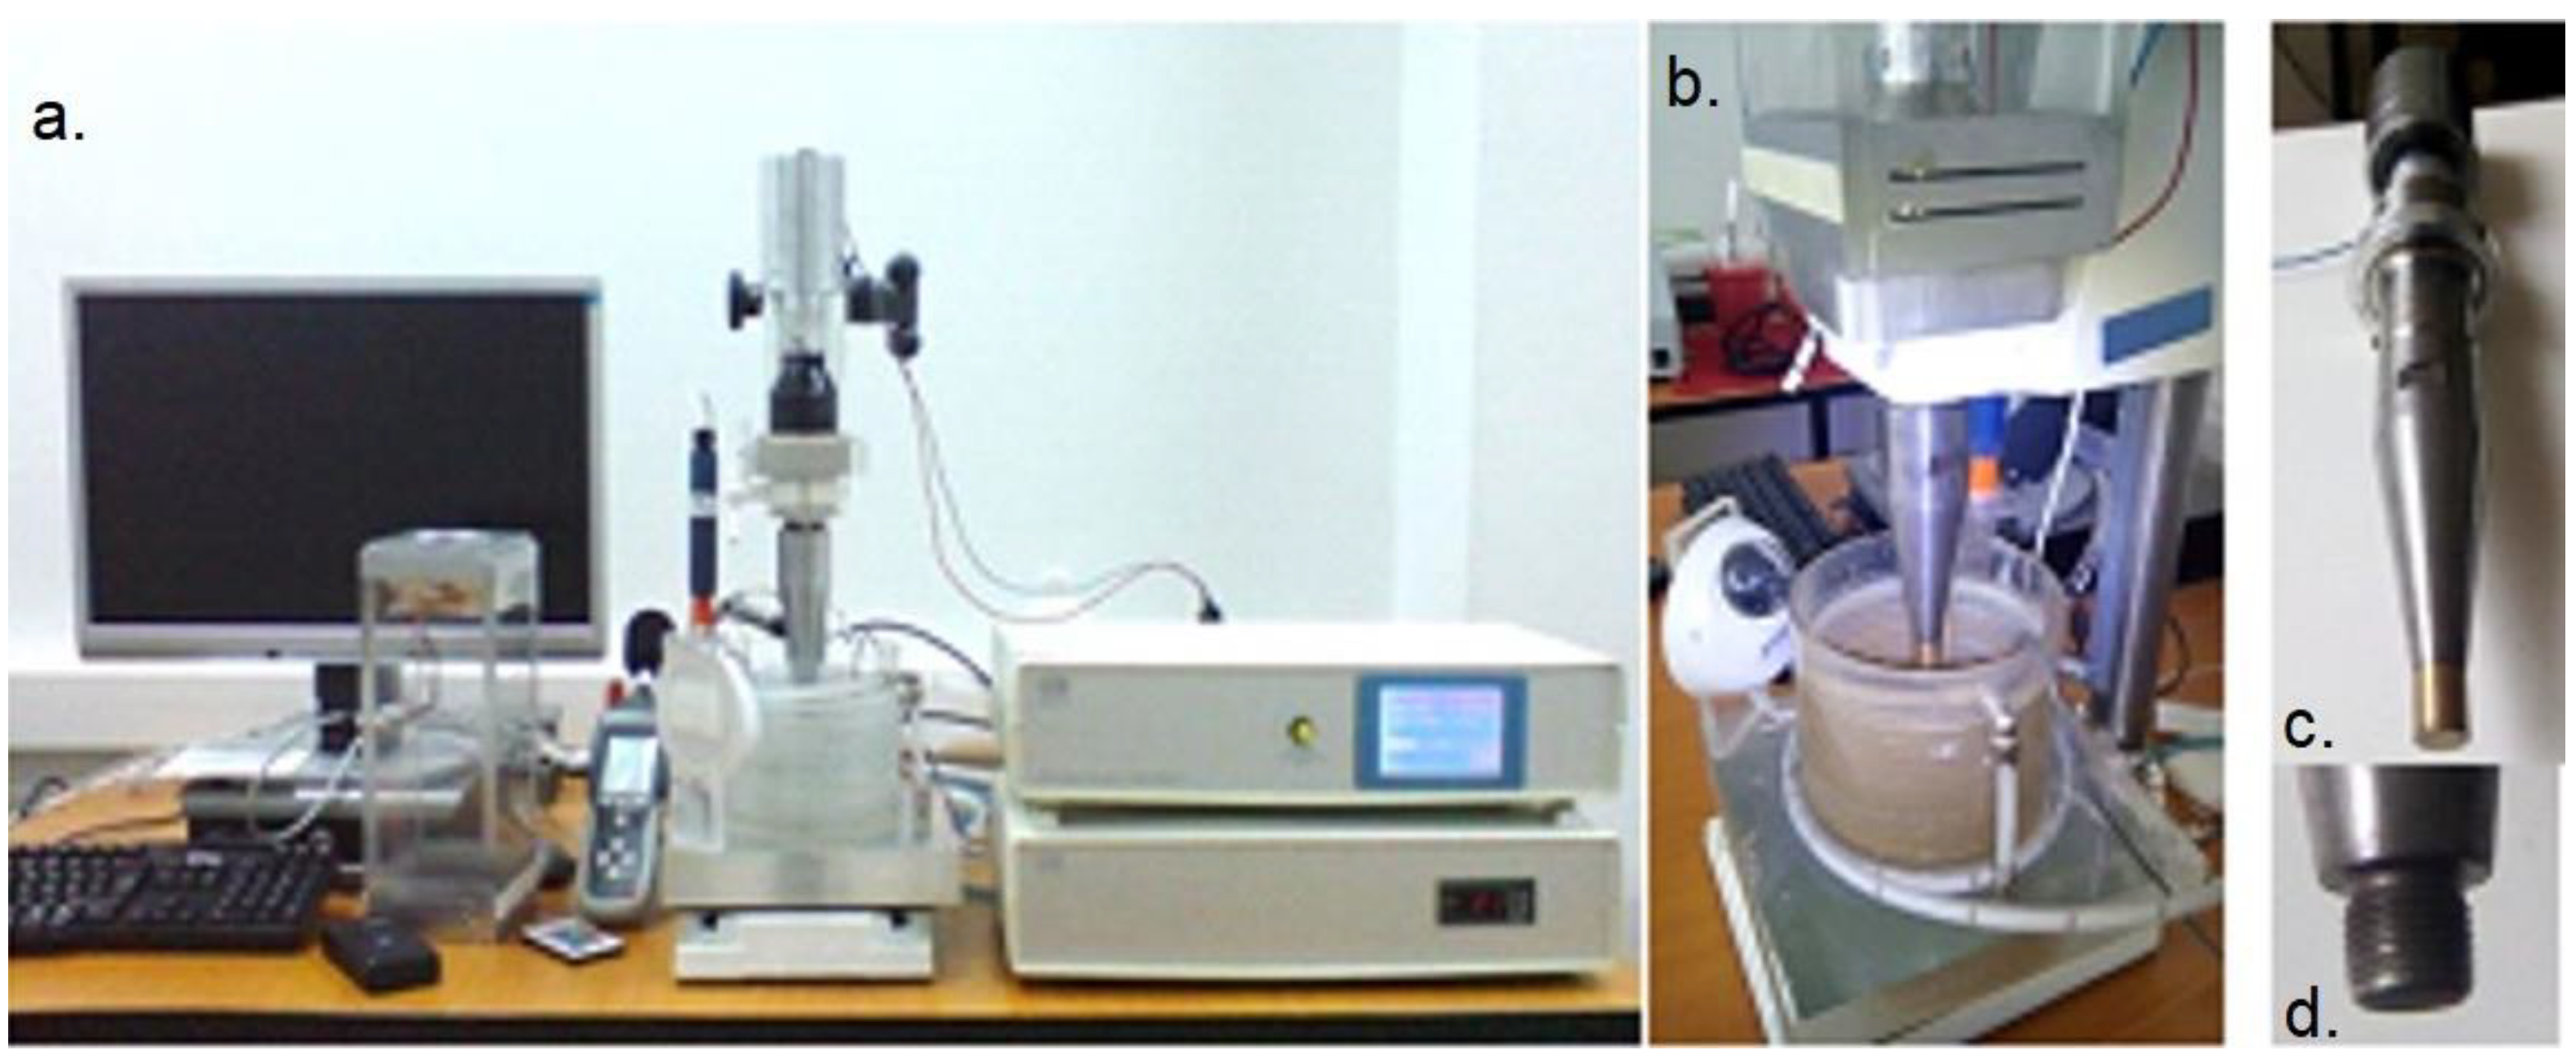
- fixing the sample in the sonotrode by threading;
- fixing the sonotrode in the vibrator support and connecting the piezoceramic transducer to the power source;
- immersing the sample in the vessel with the testing liquid (distilled or potable water from the network), to a depth of 5–10 mm;
- setting up the intermediate cavitation attack duration (5, 10 and 15 min, respectively) and starting the electronic ultrasound generator simultaneously with the cooling water recirculation system from the copper coil in the testing liquid vessel;
- after the end of each time period allocated to the cavitational attack, every sample was washed in acetone solution and dried with a blower, after which it was weighed on the electronic and precision balance to determine the eroded mass;
- after each test period, every sample was photographed using a Canon PowerShot Sx200 IS camera, 12 × Optical Zoom, whose resolution allows the damage expanding on the surface to be highlighted; they were also analyzed using an optical microscope.
3. Results and Discussion
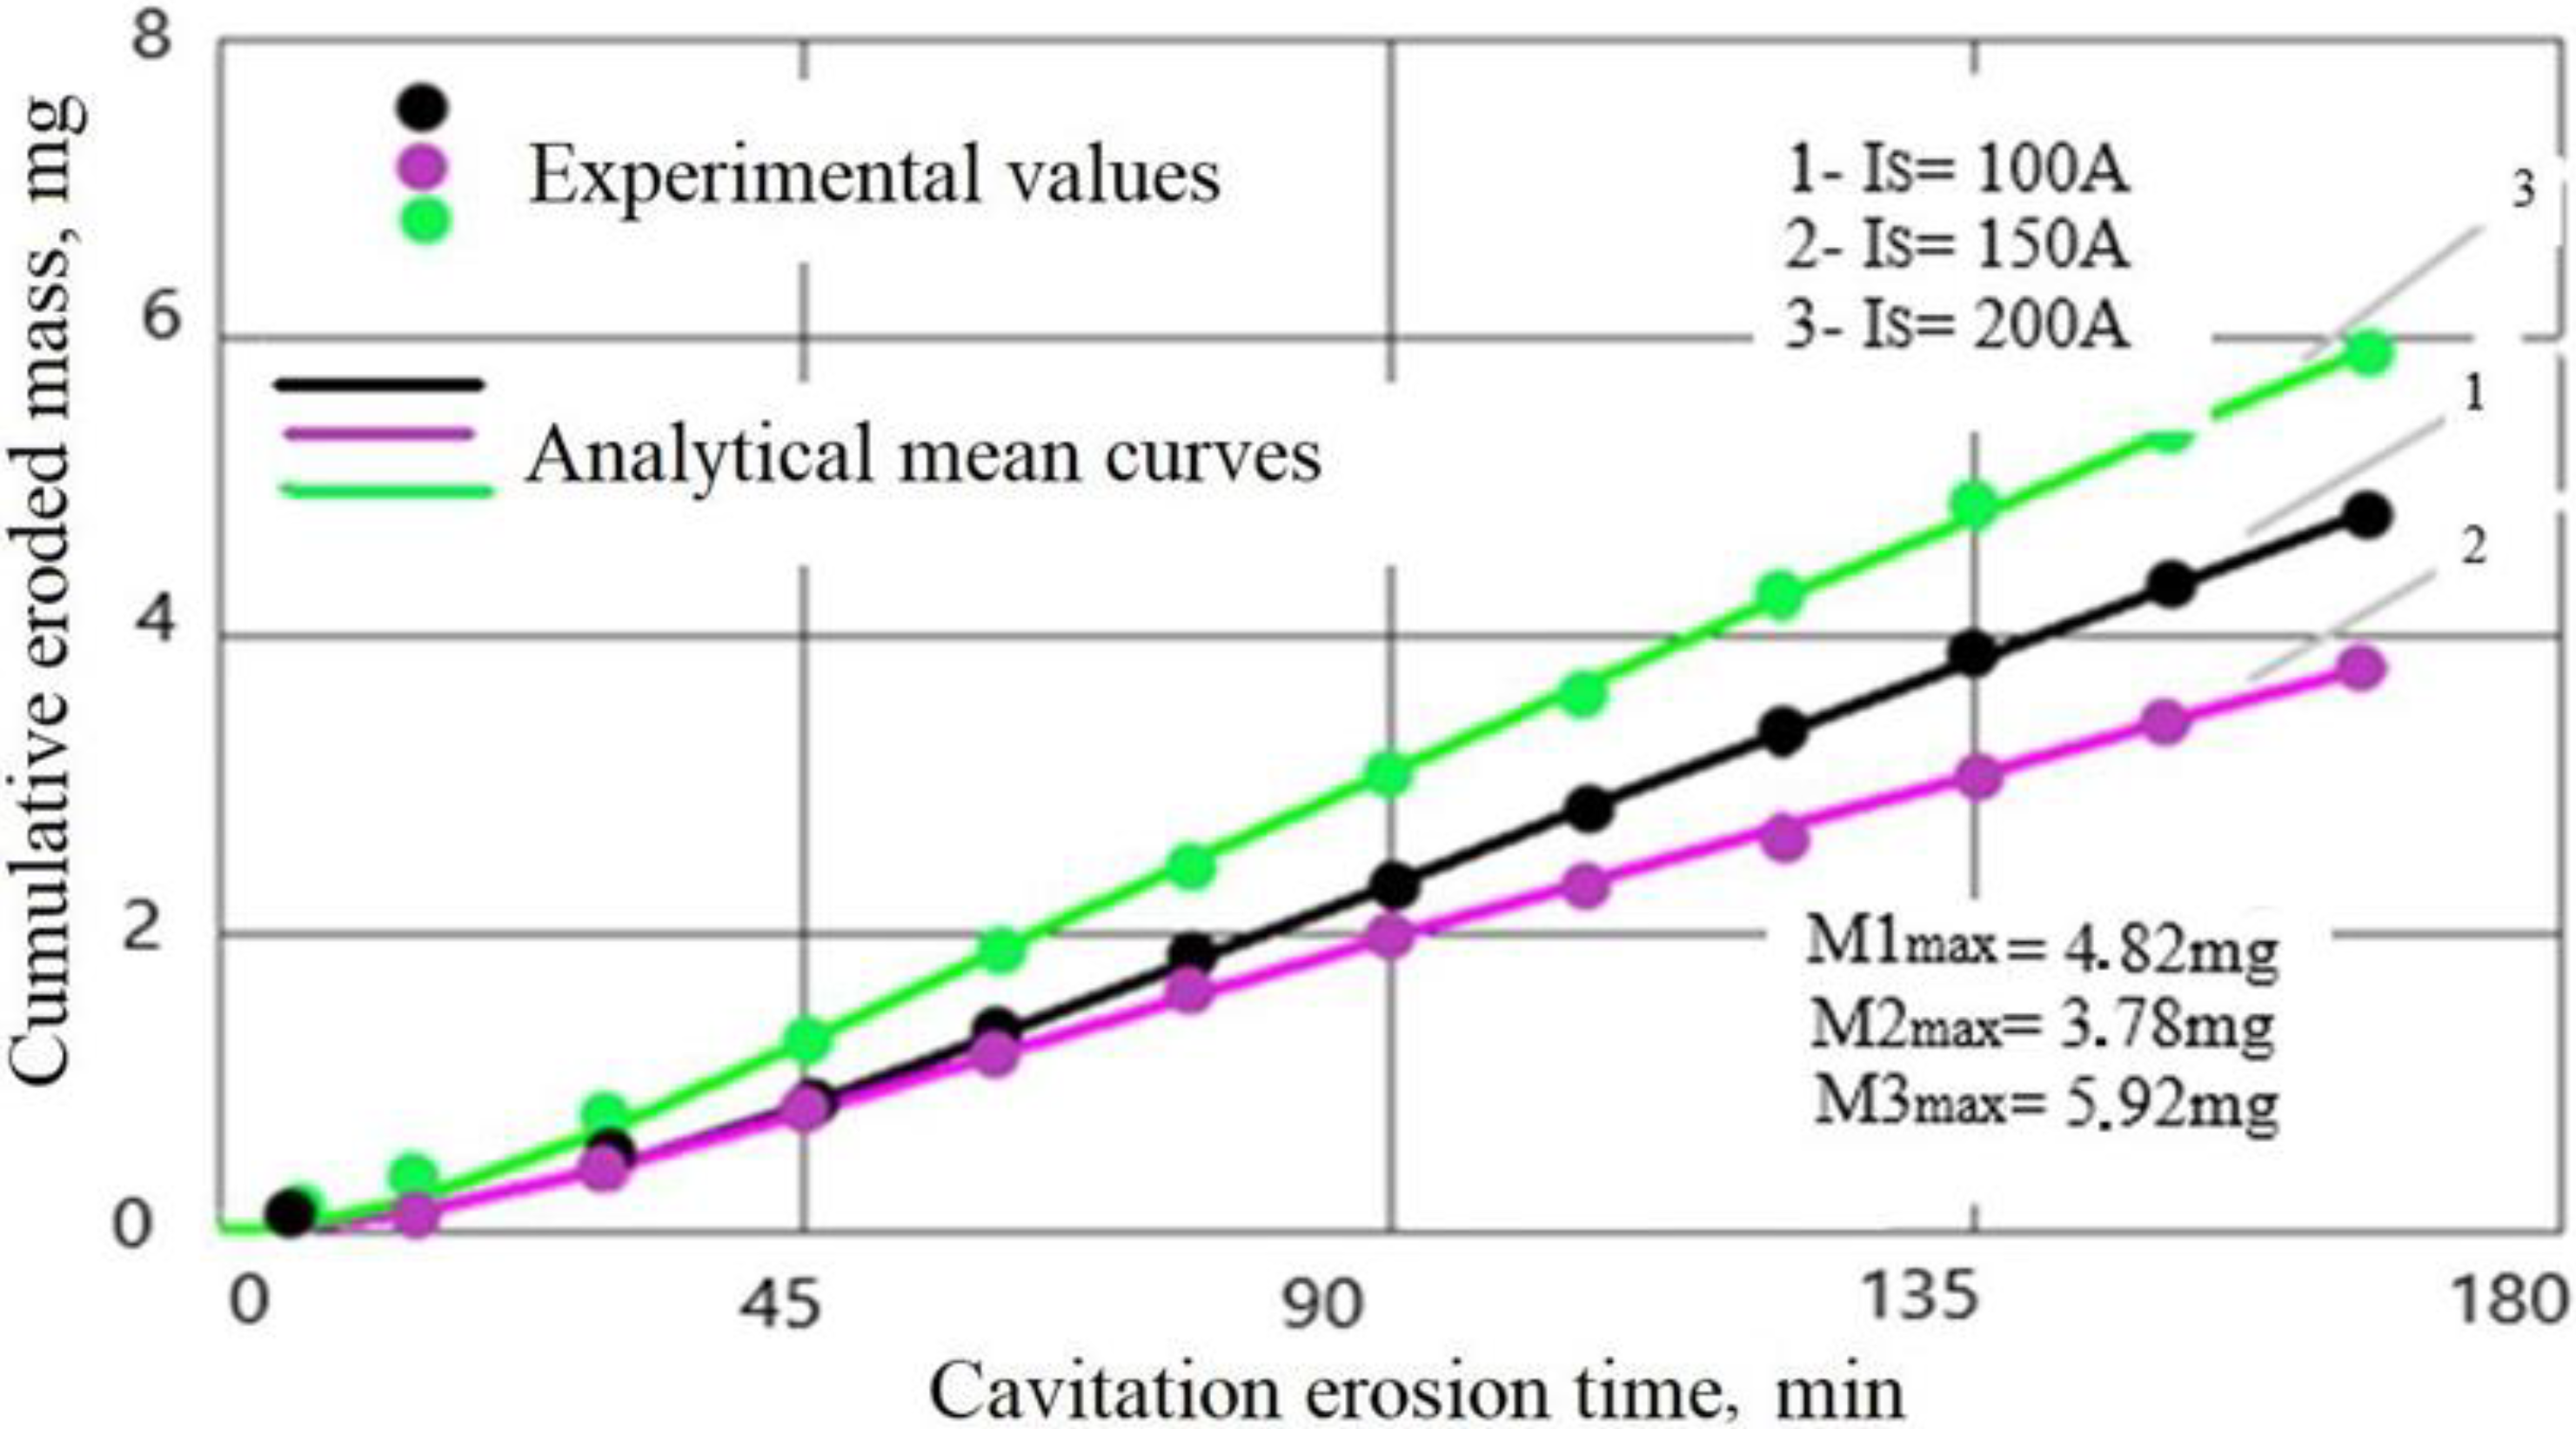
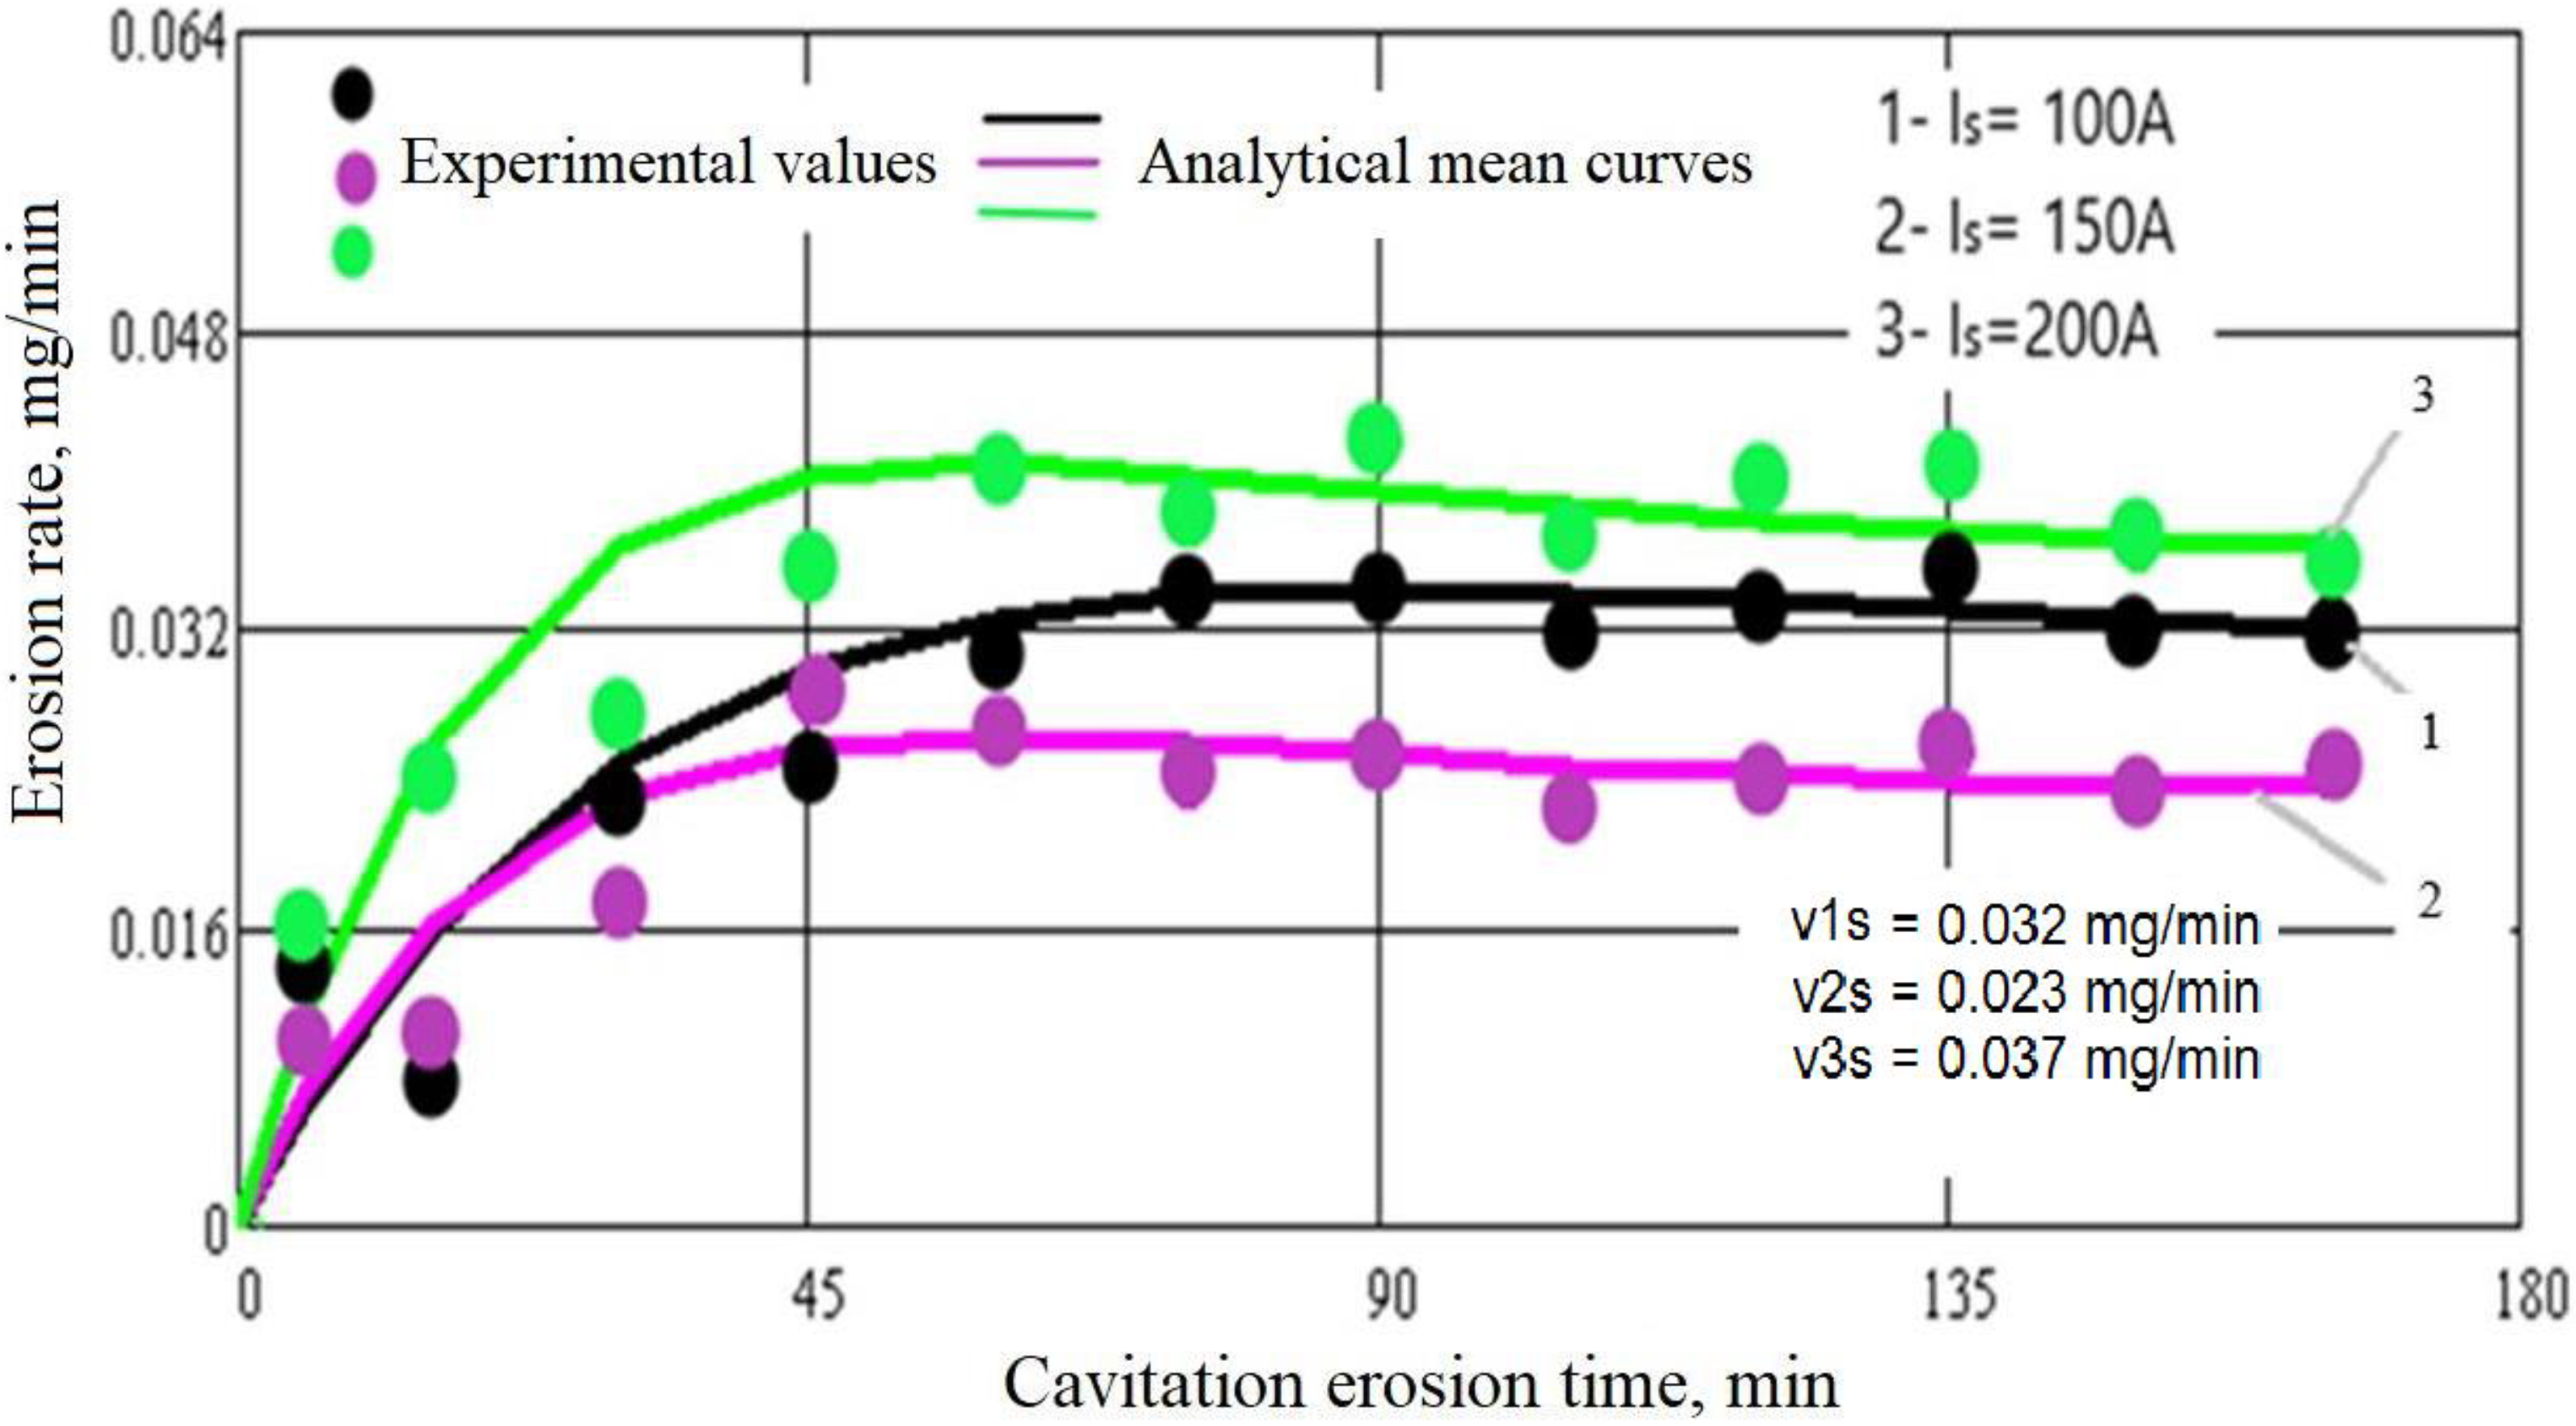
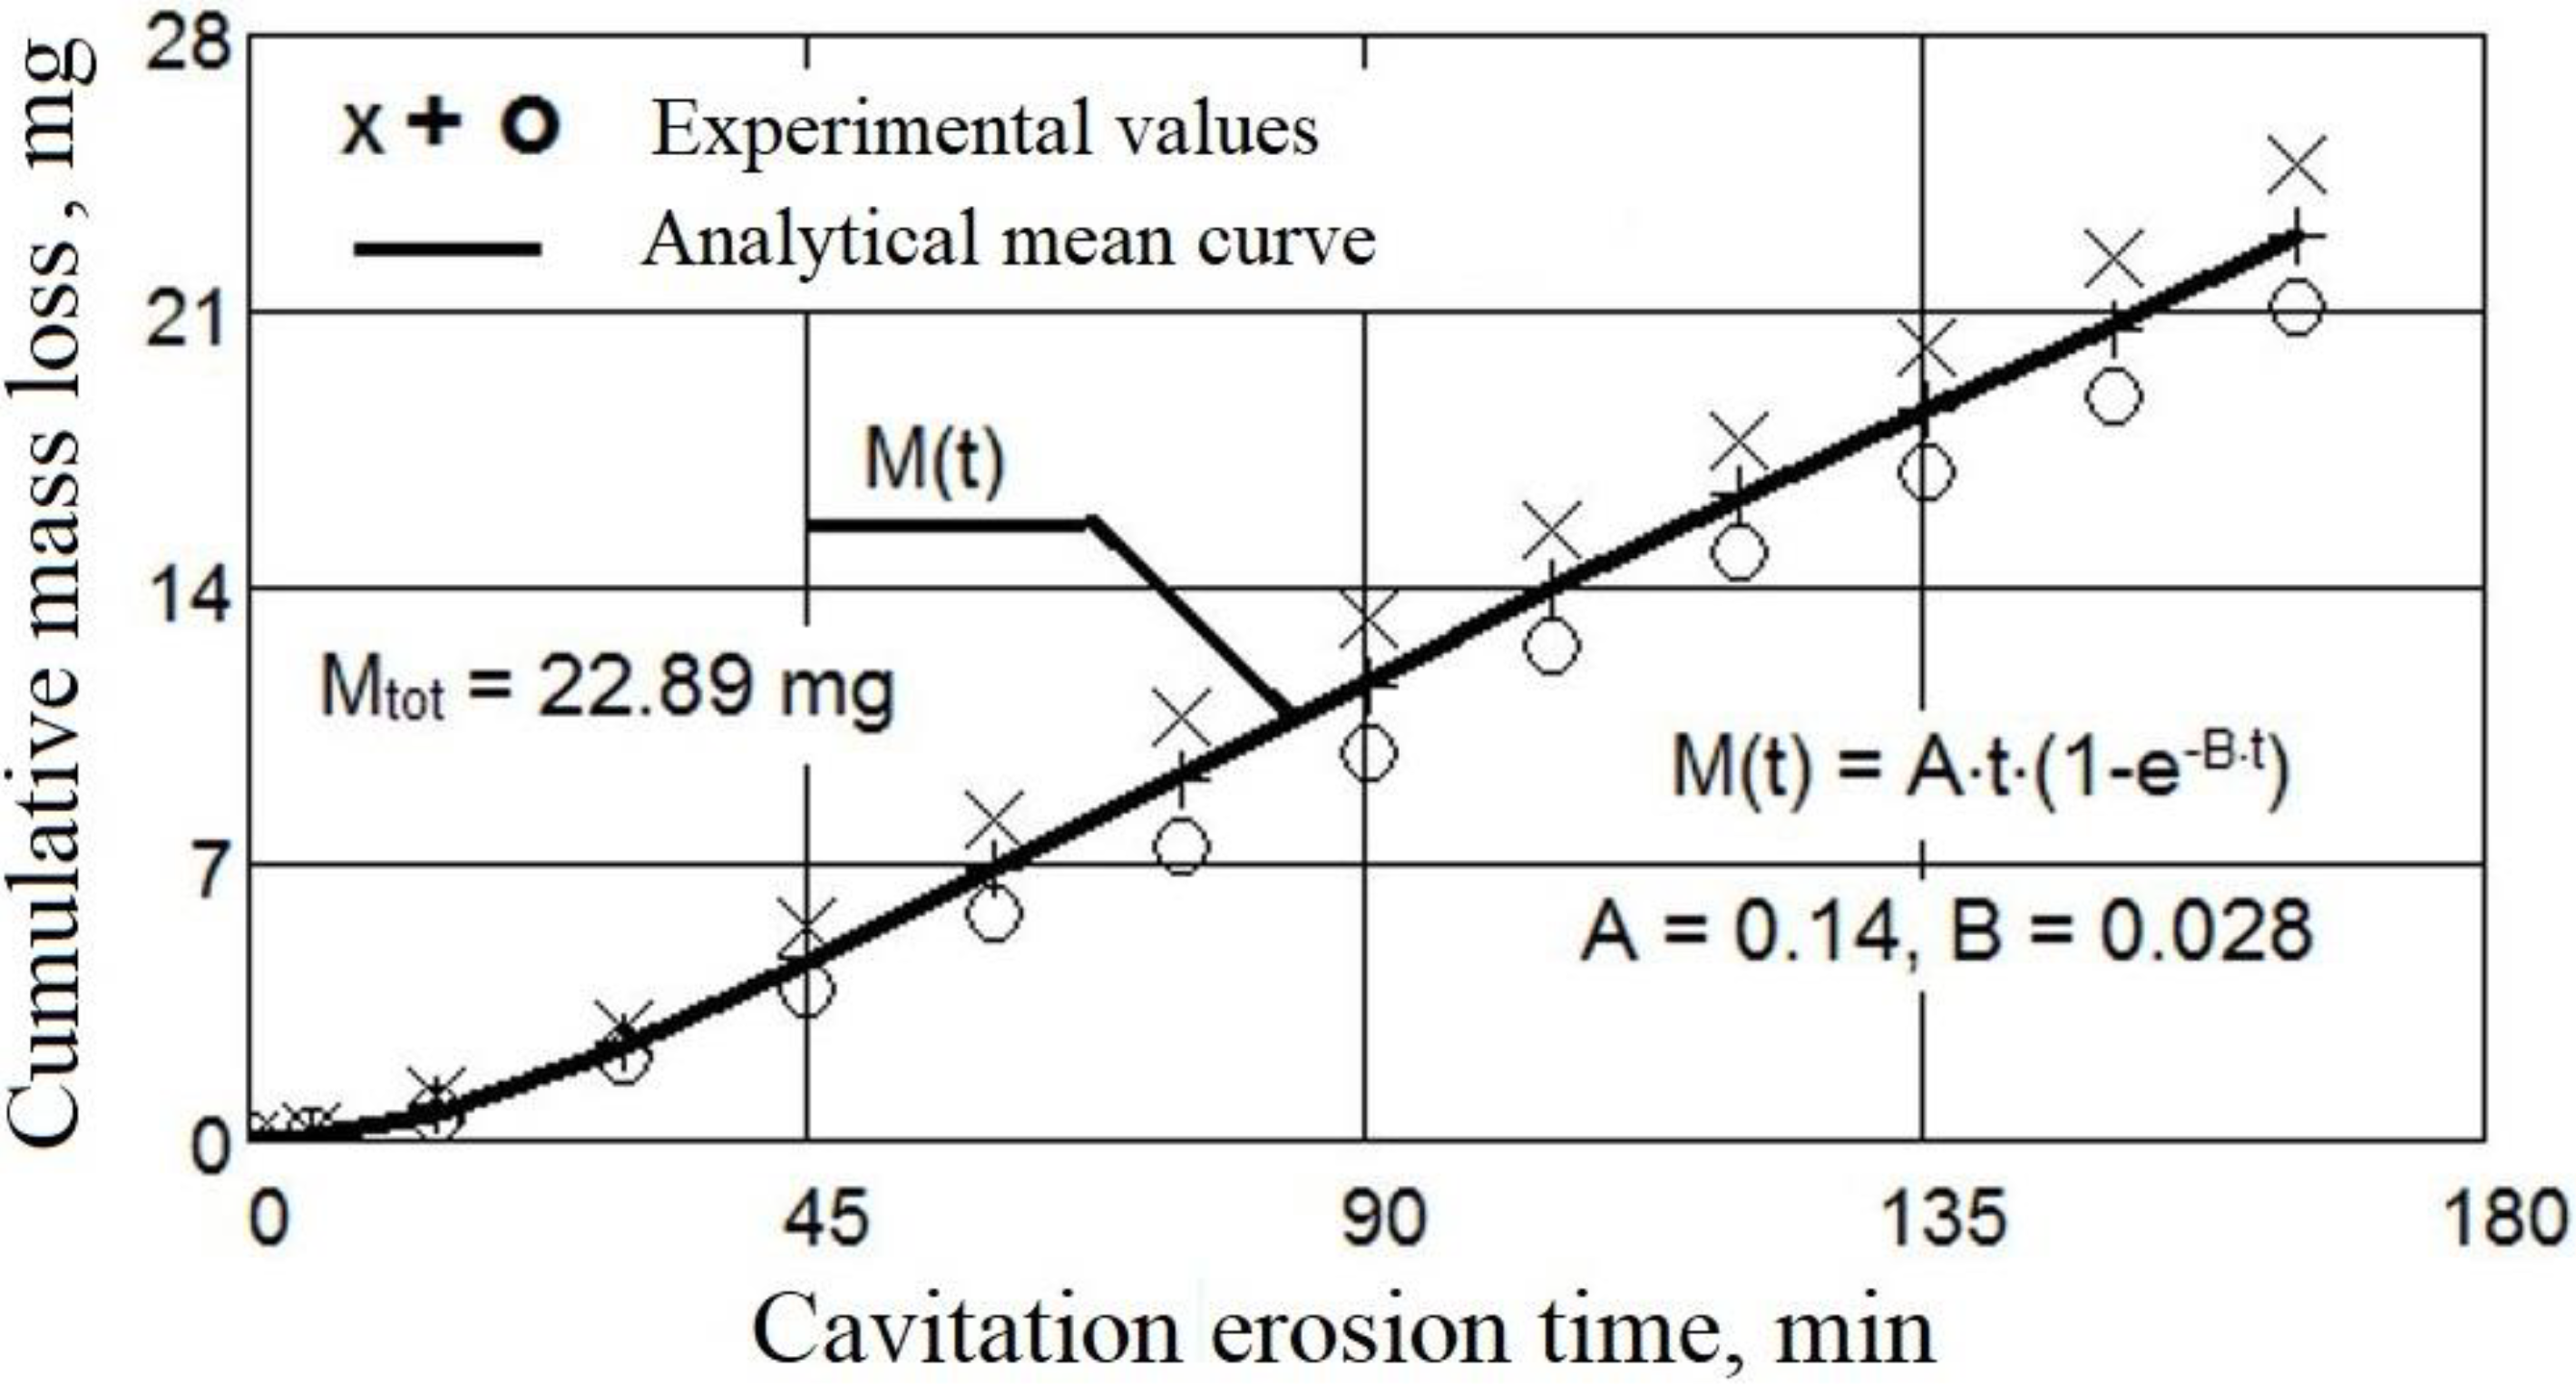
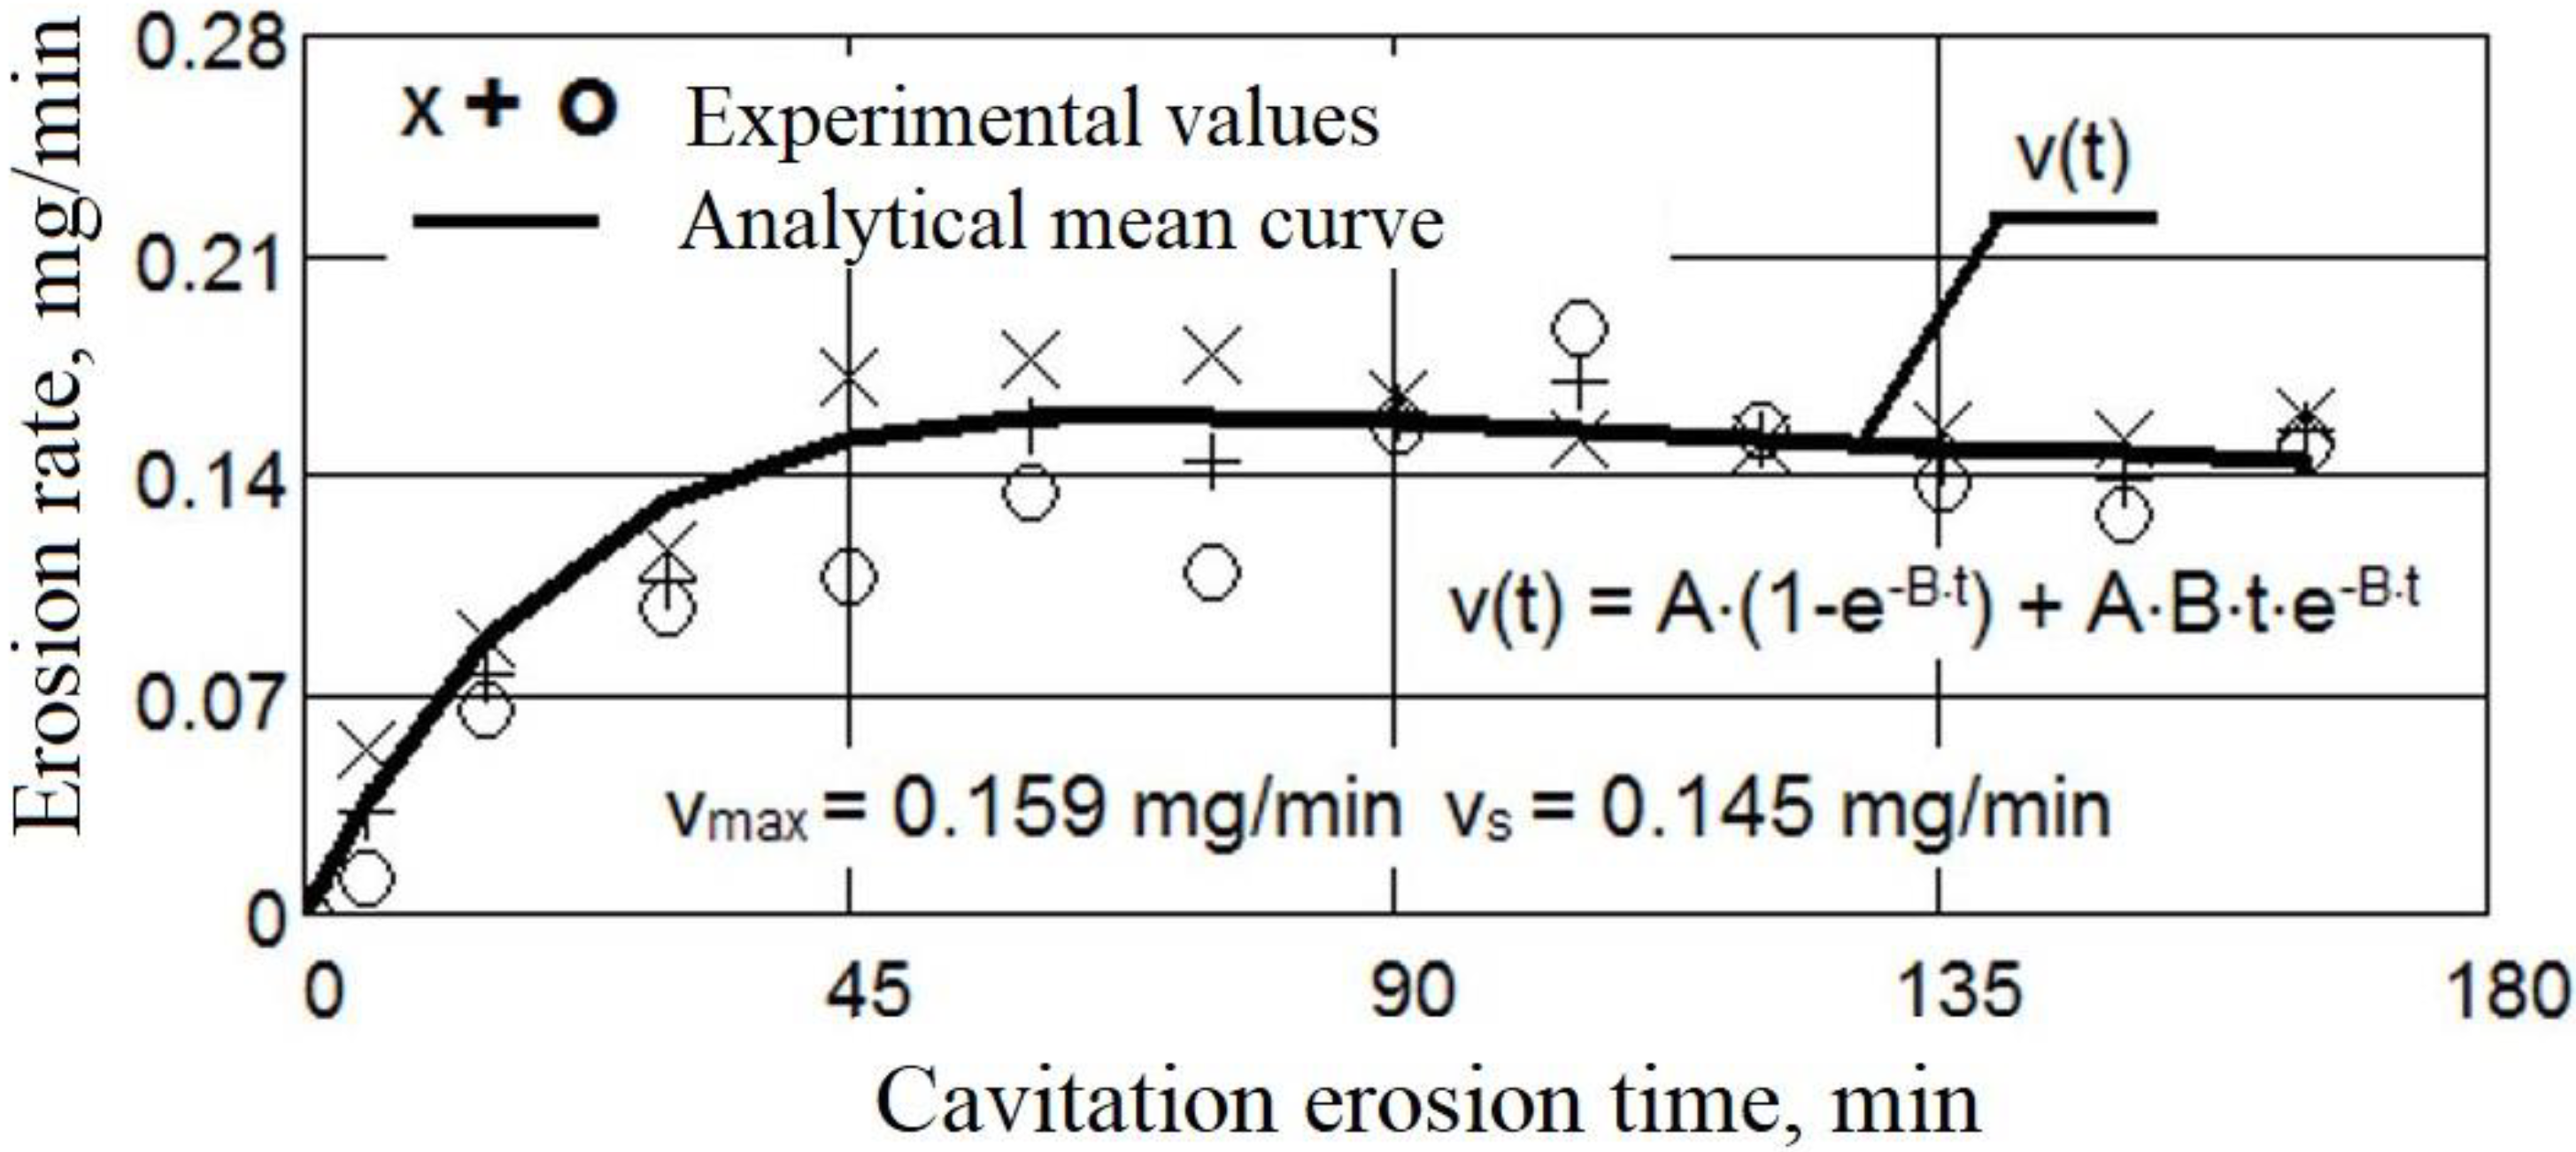
3.1. Cavitation Curves
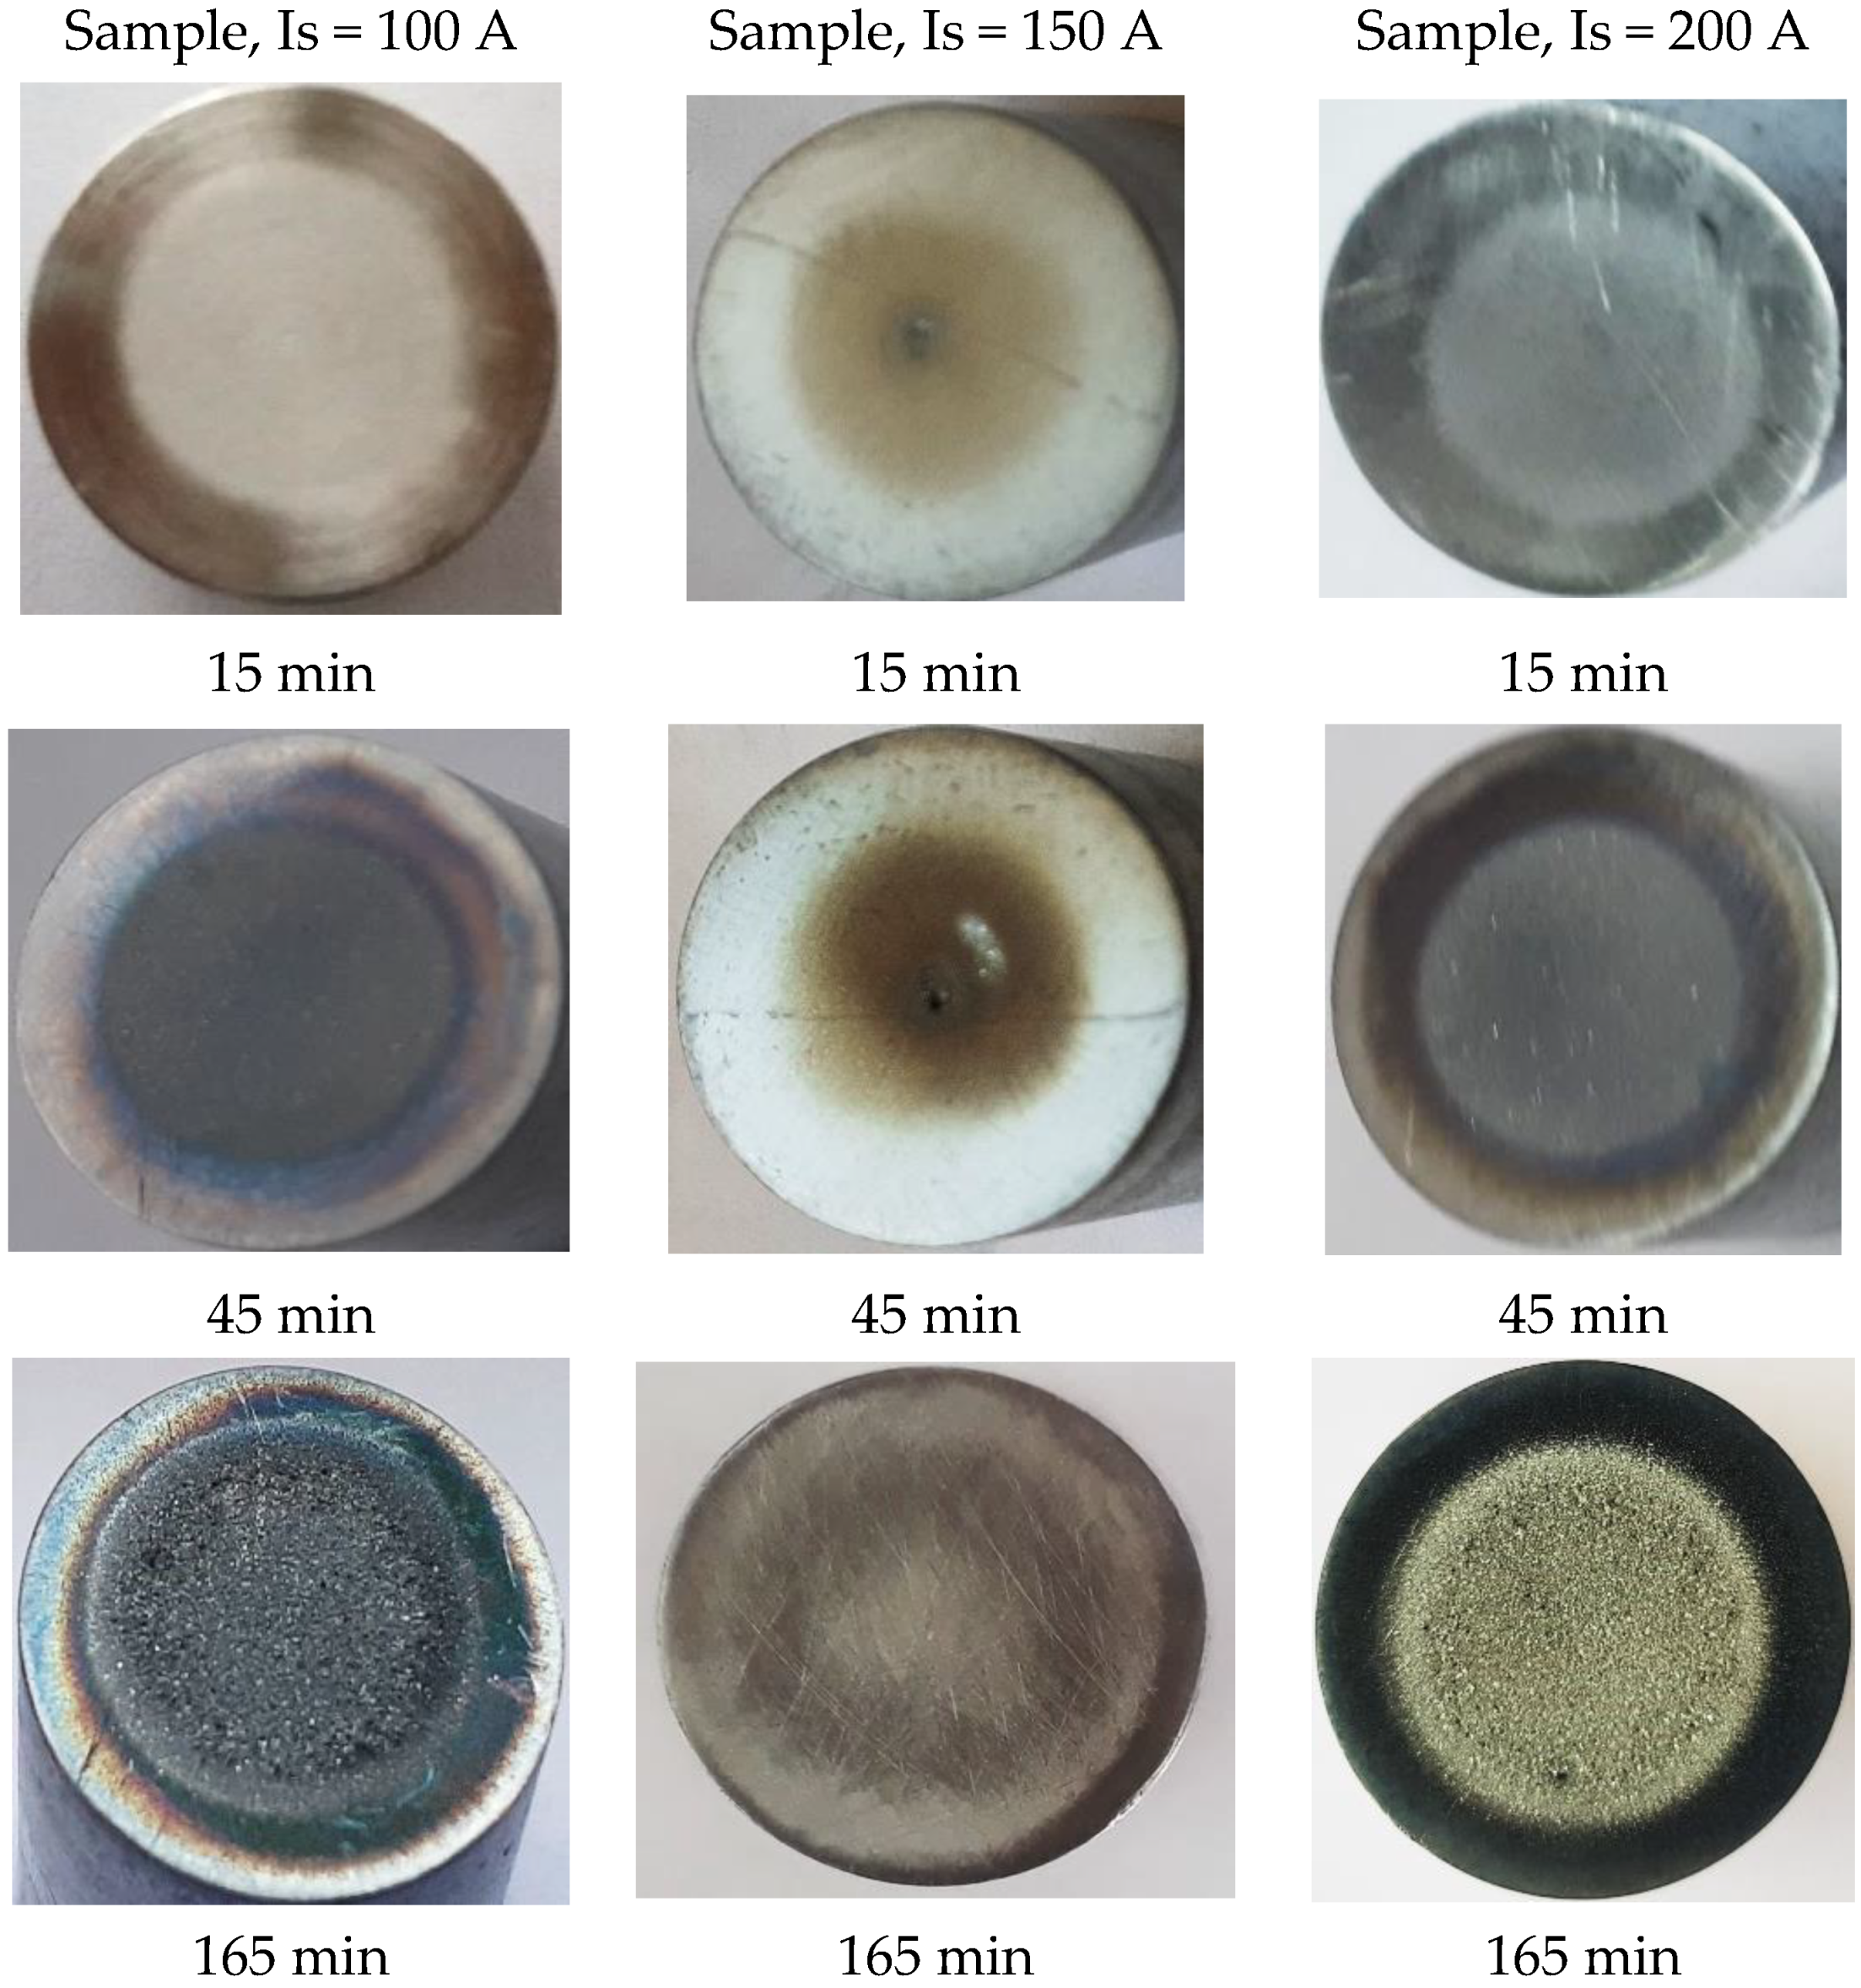
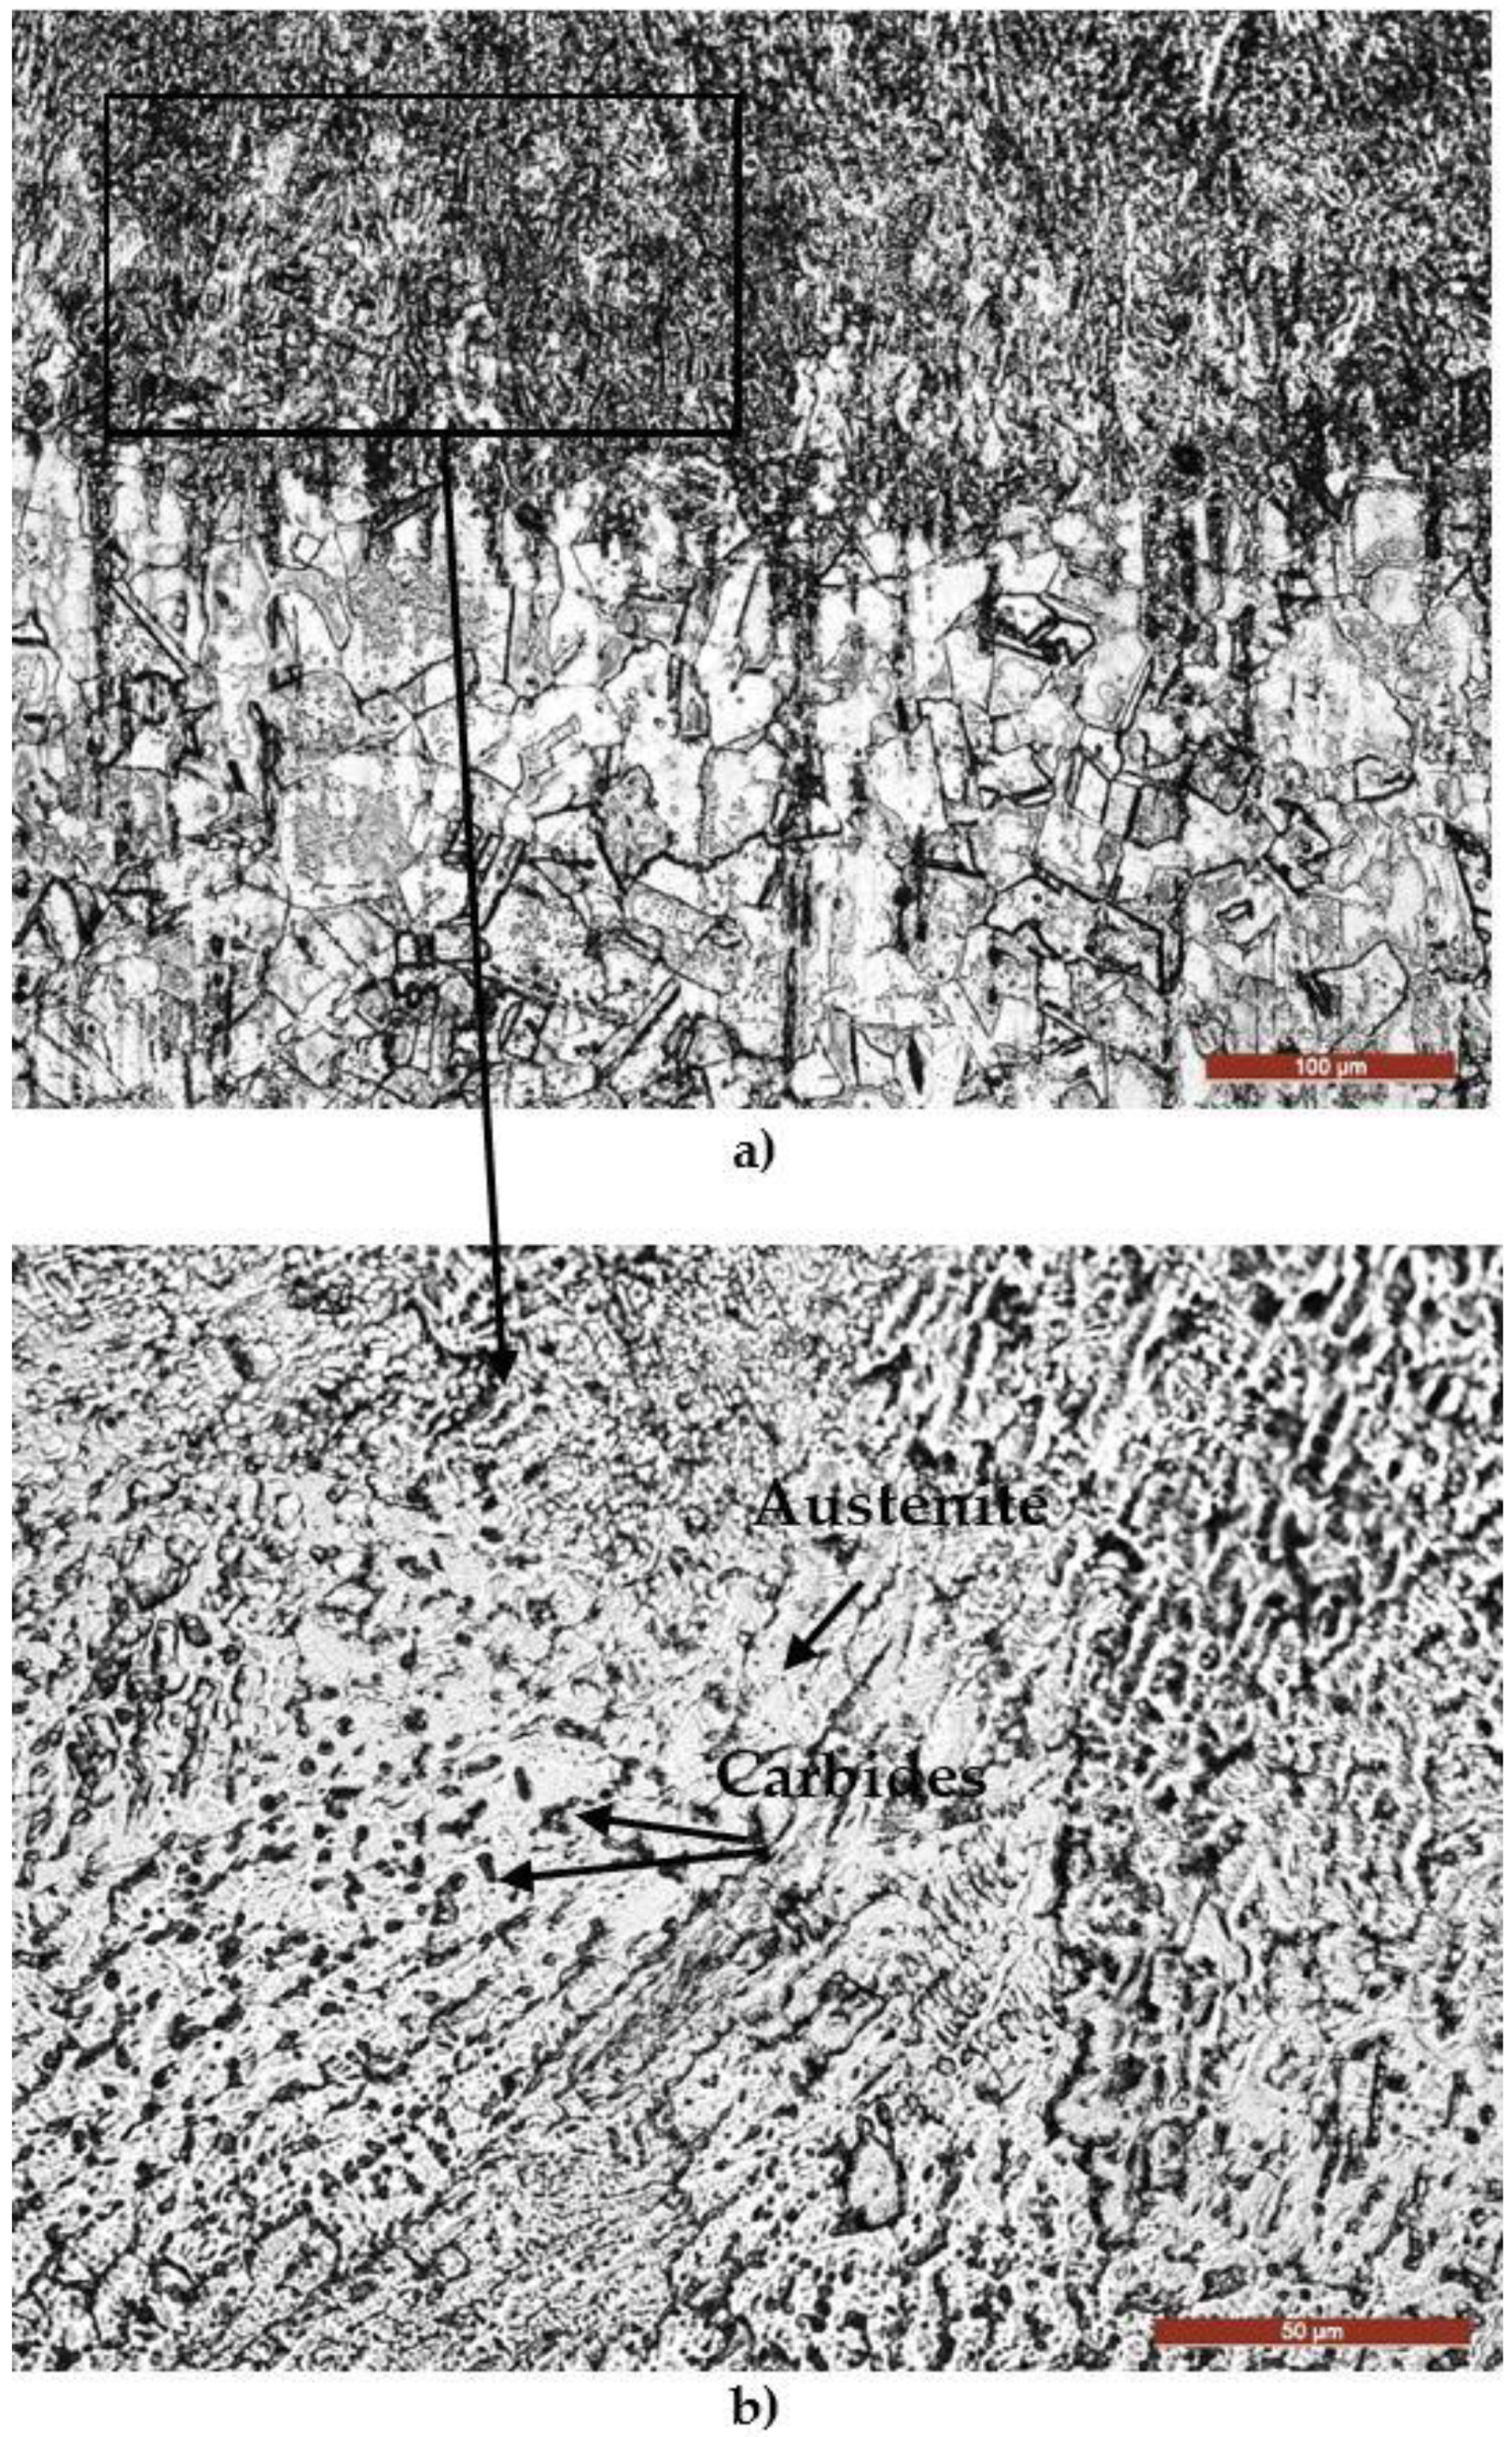
3.2. Macro- and Micrographic Examinations
- -
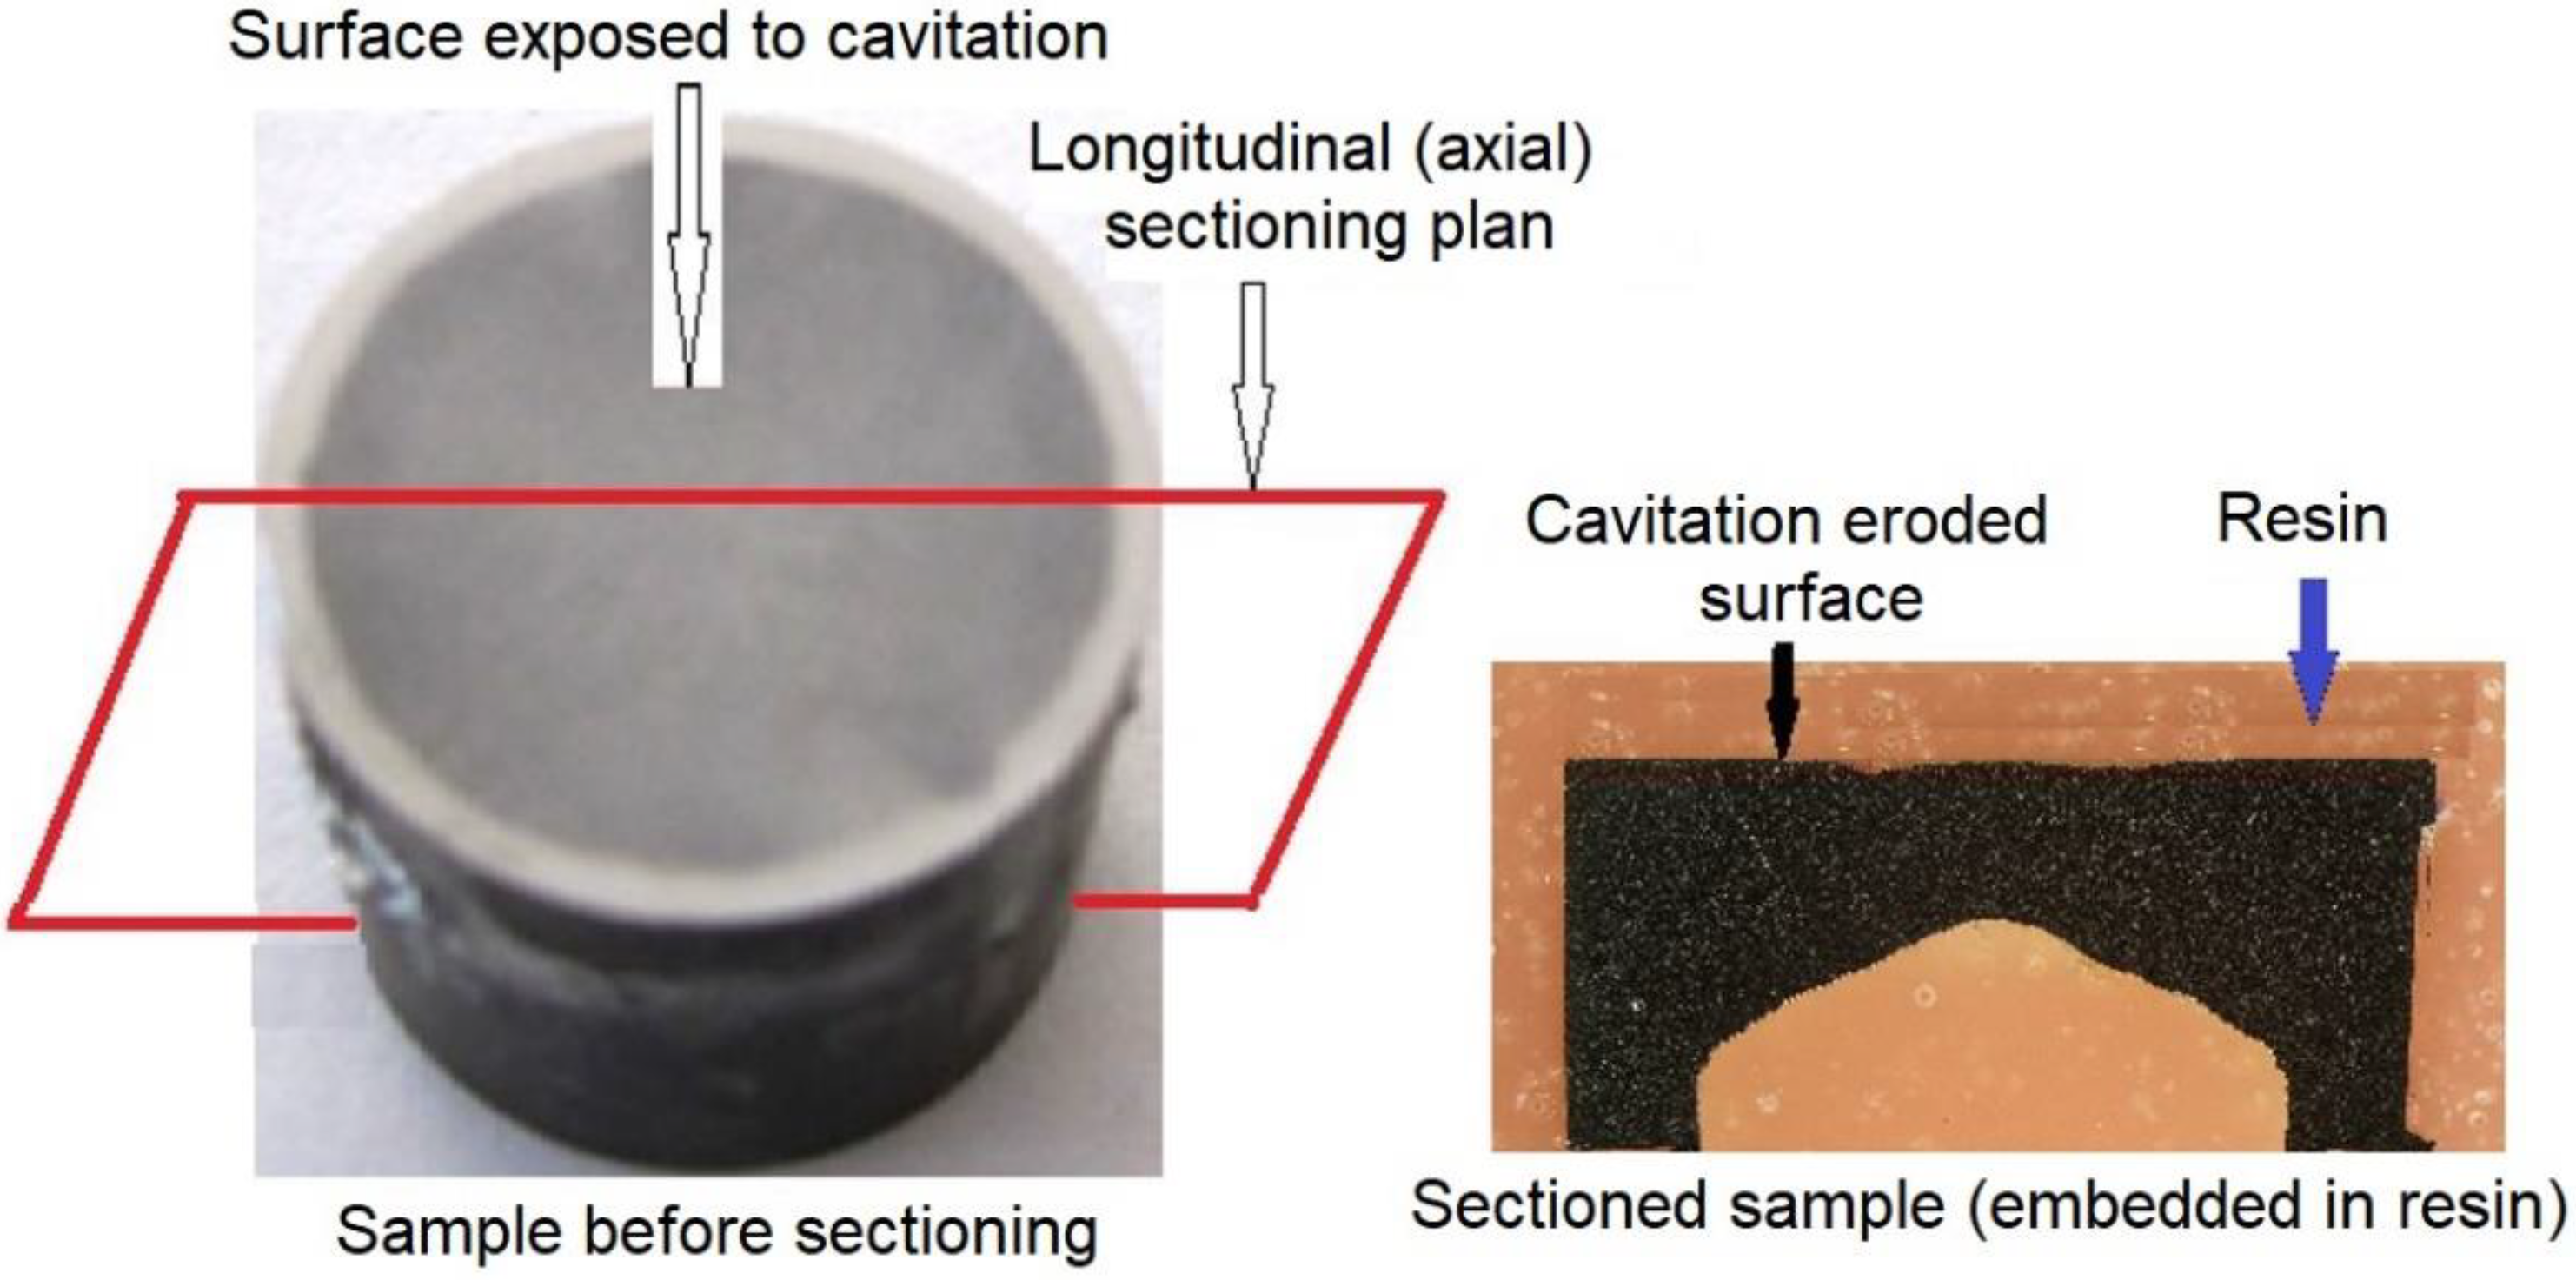
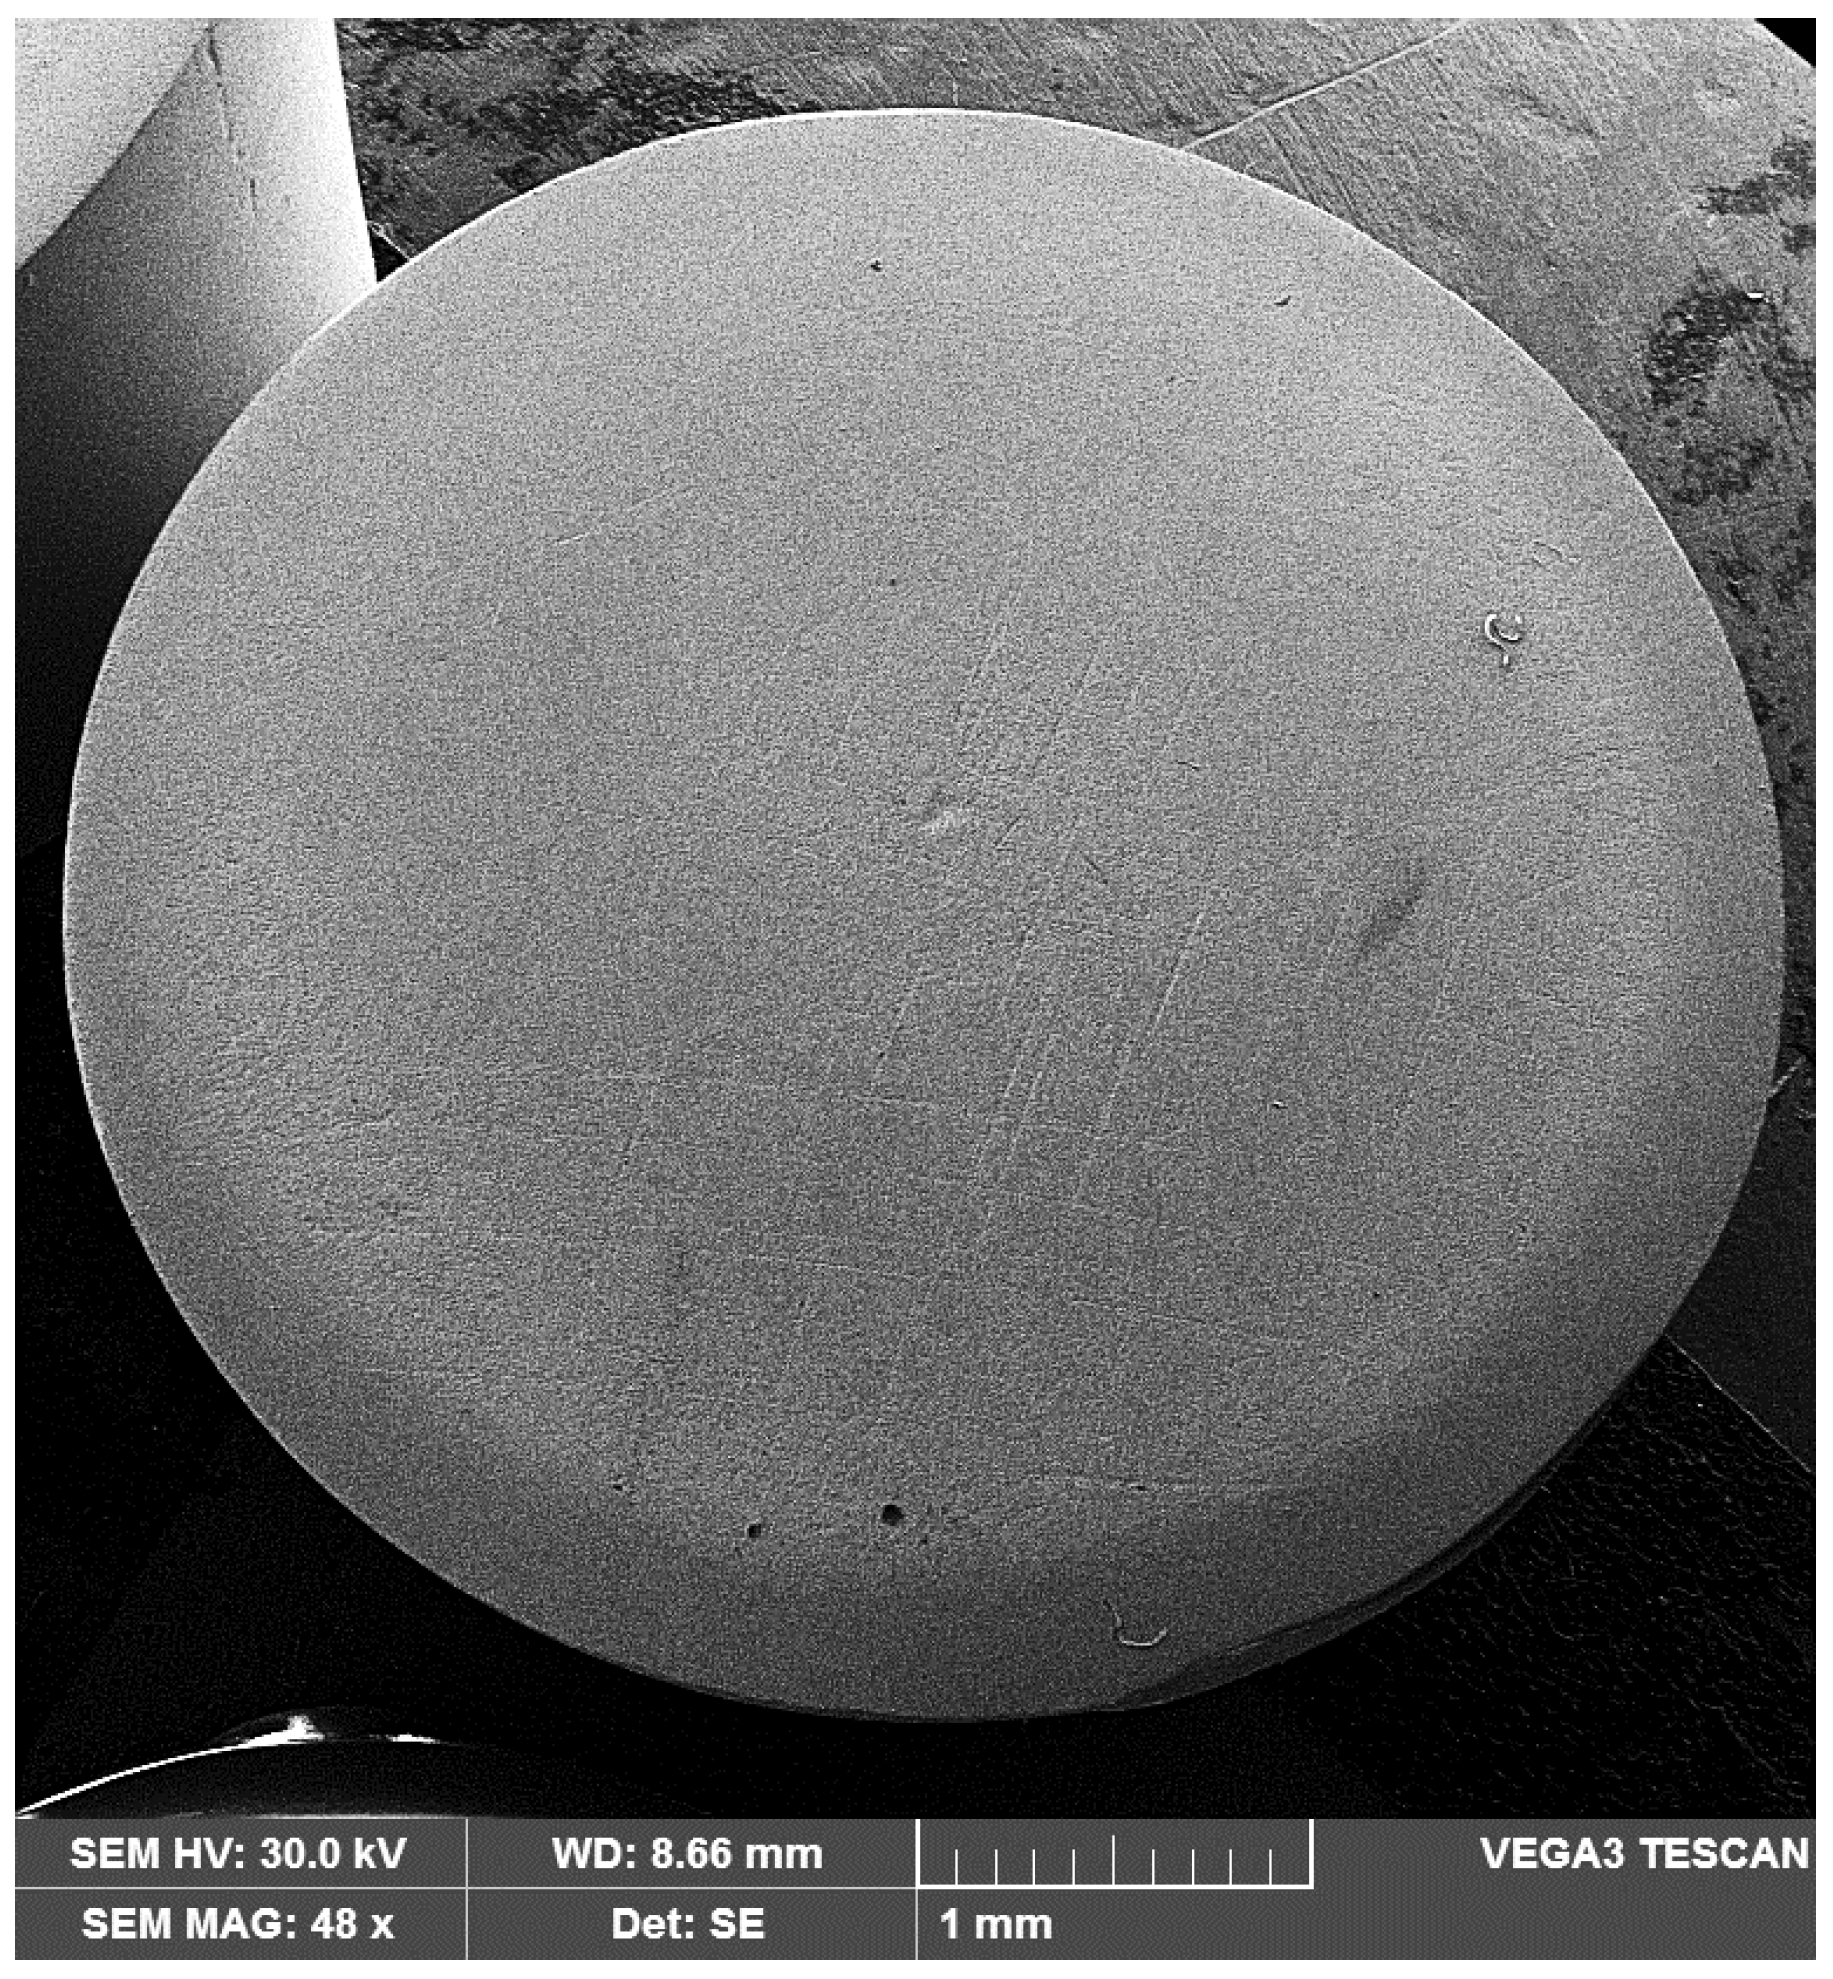
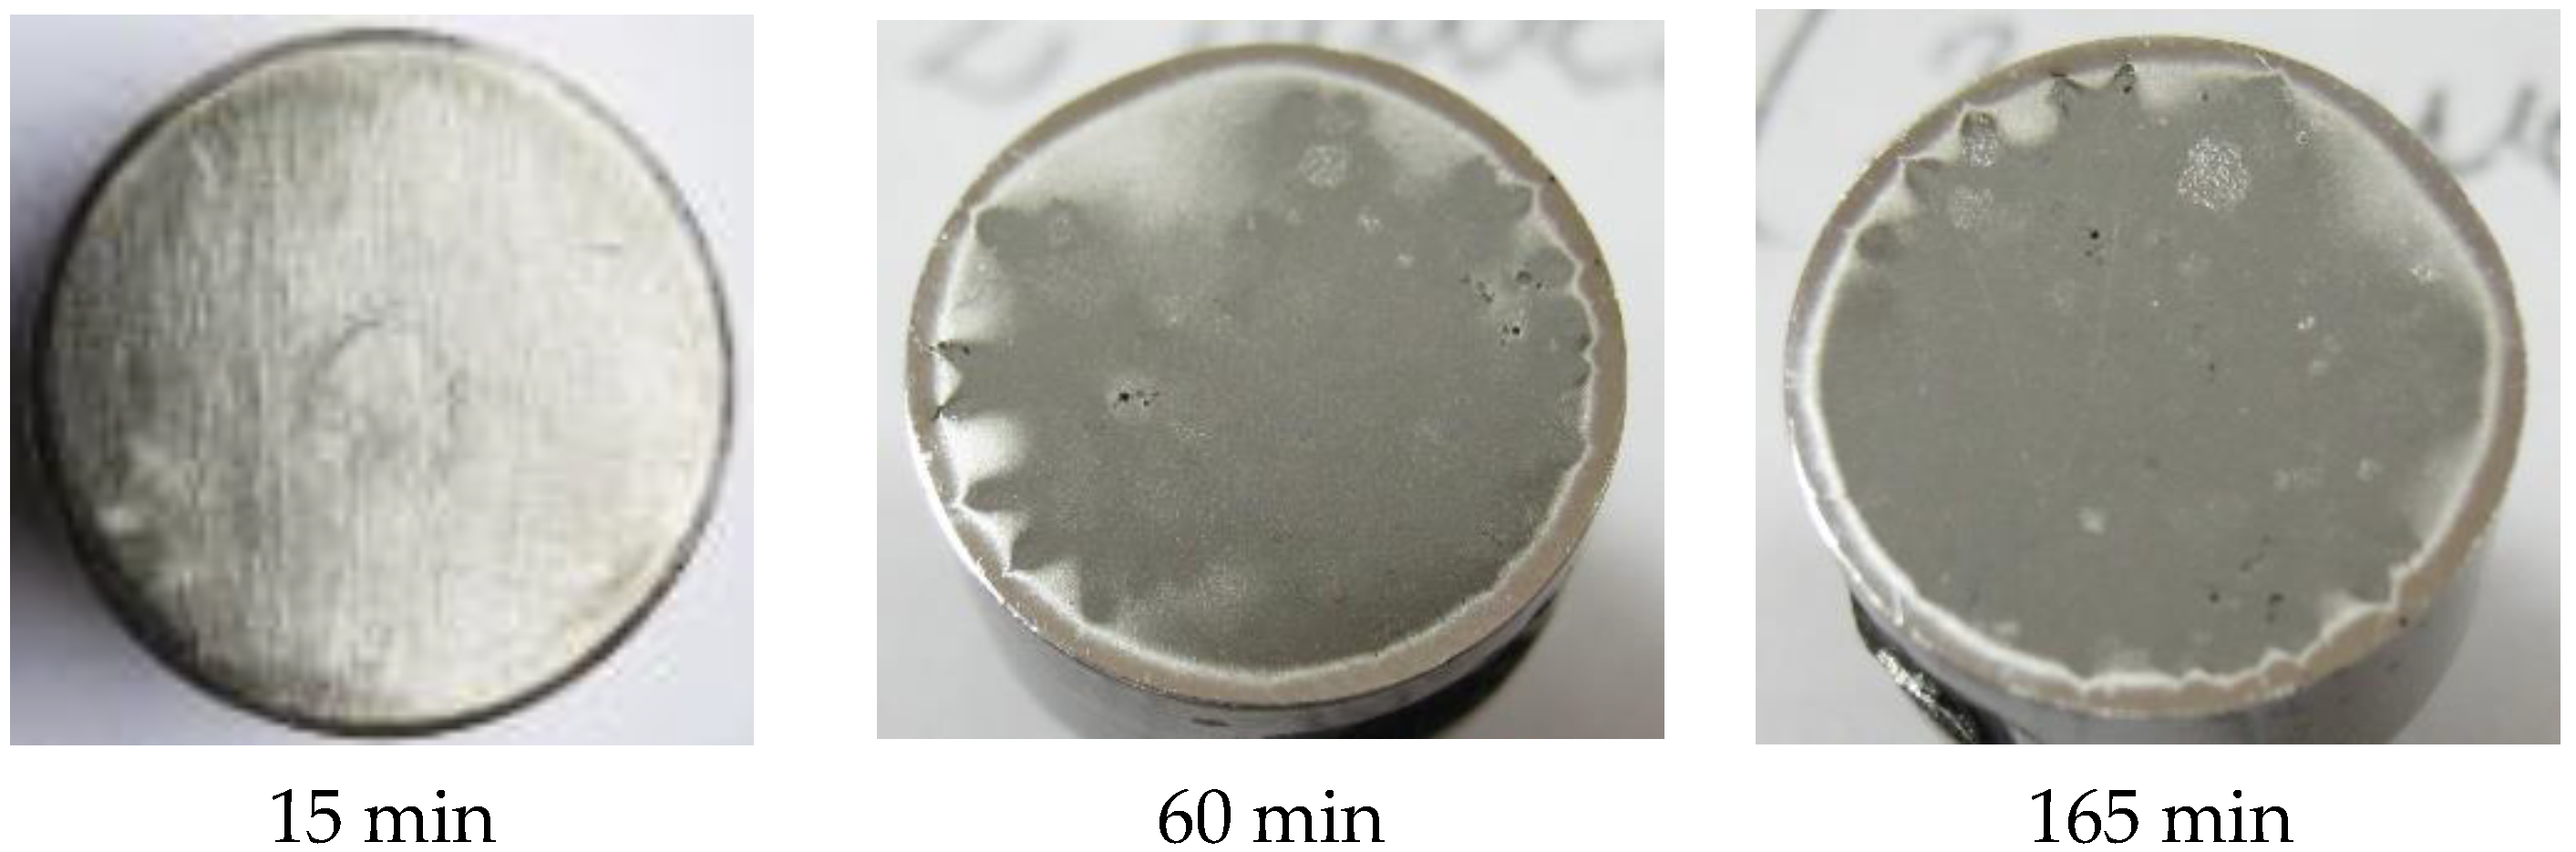
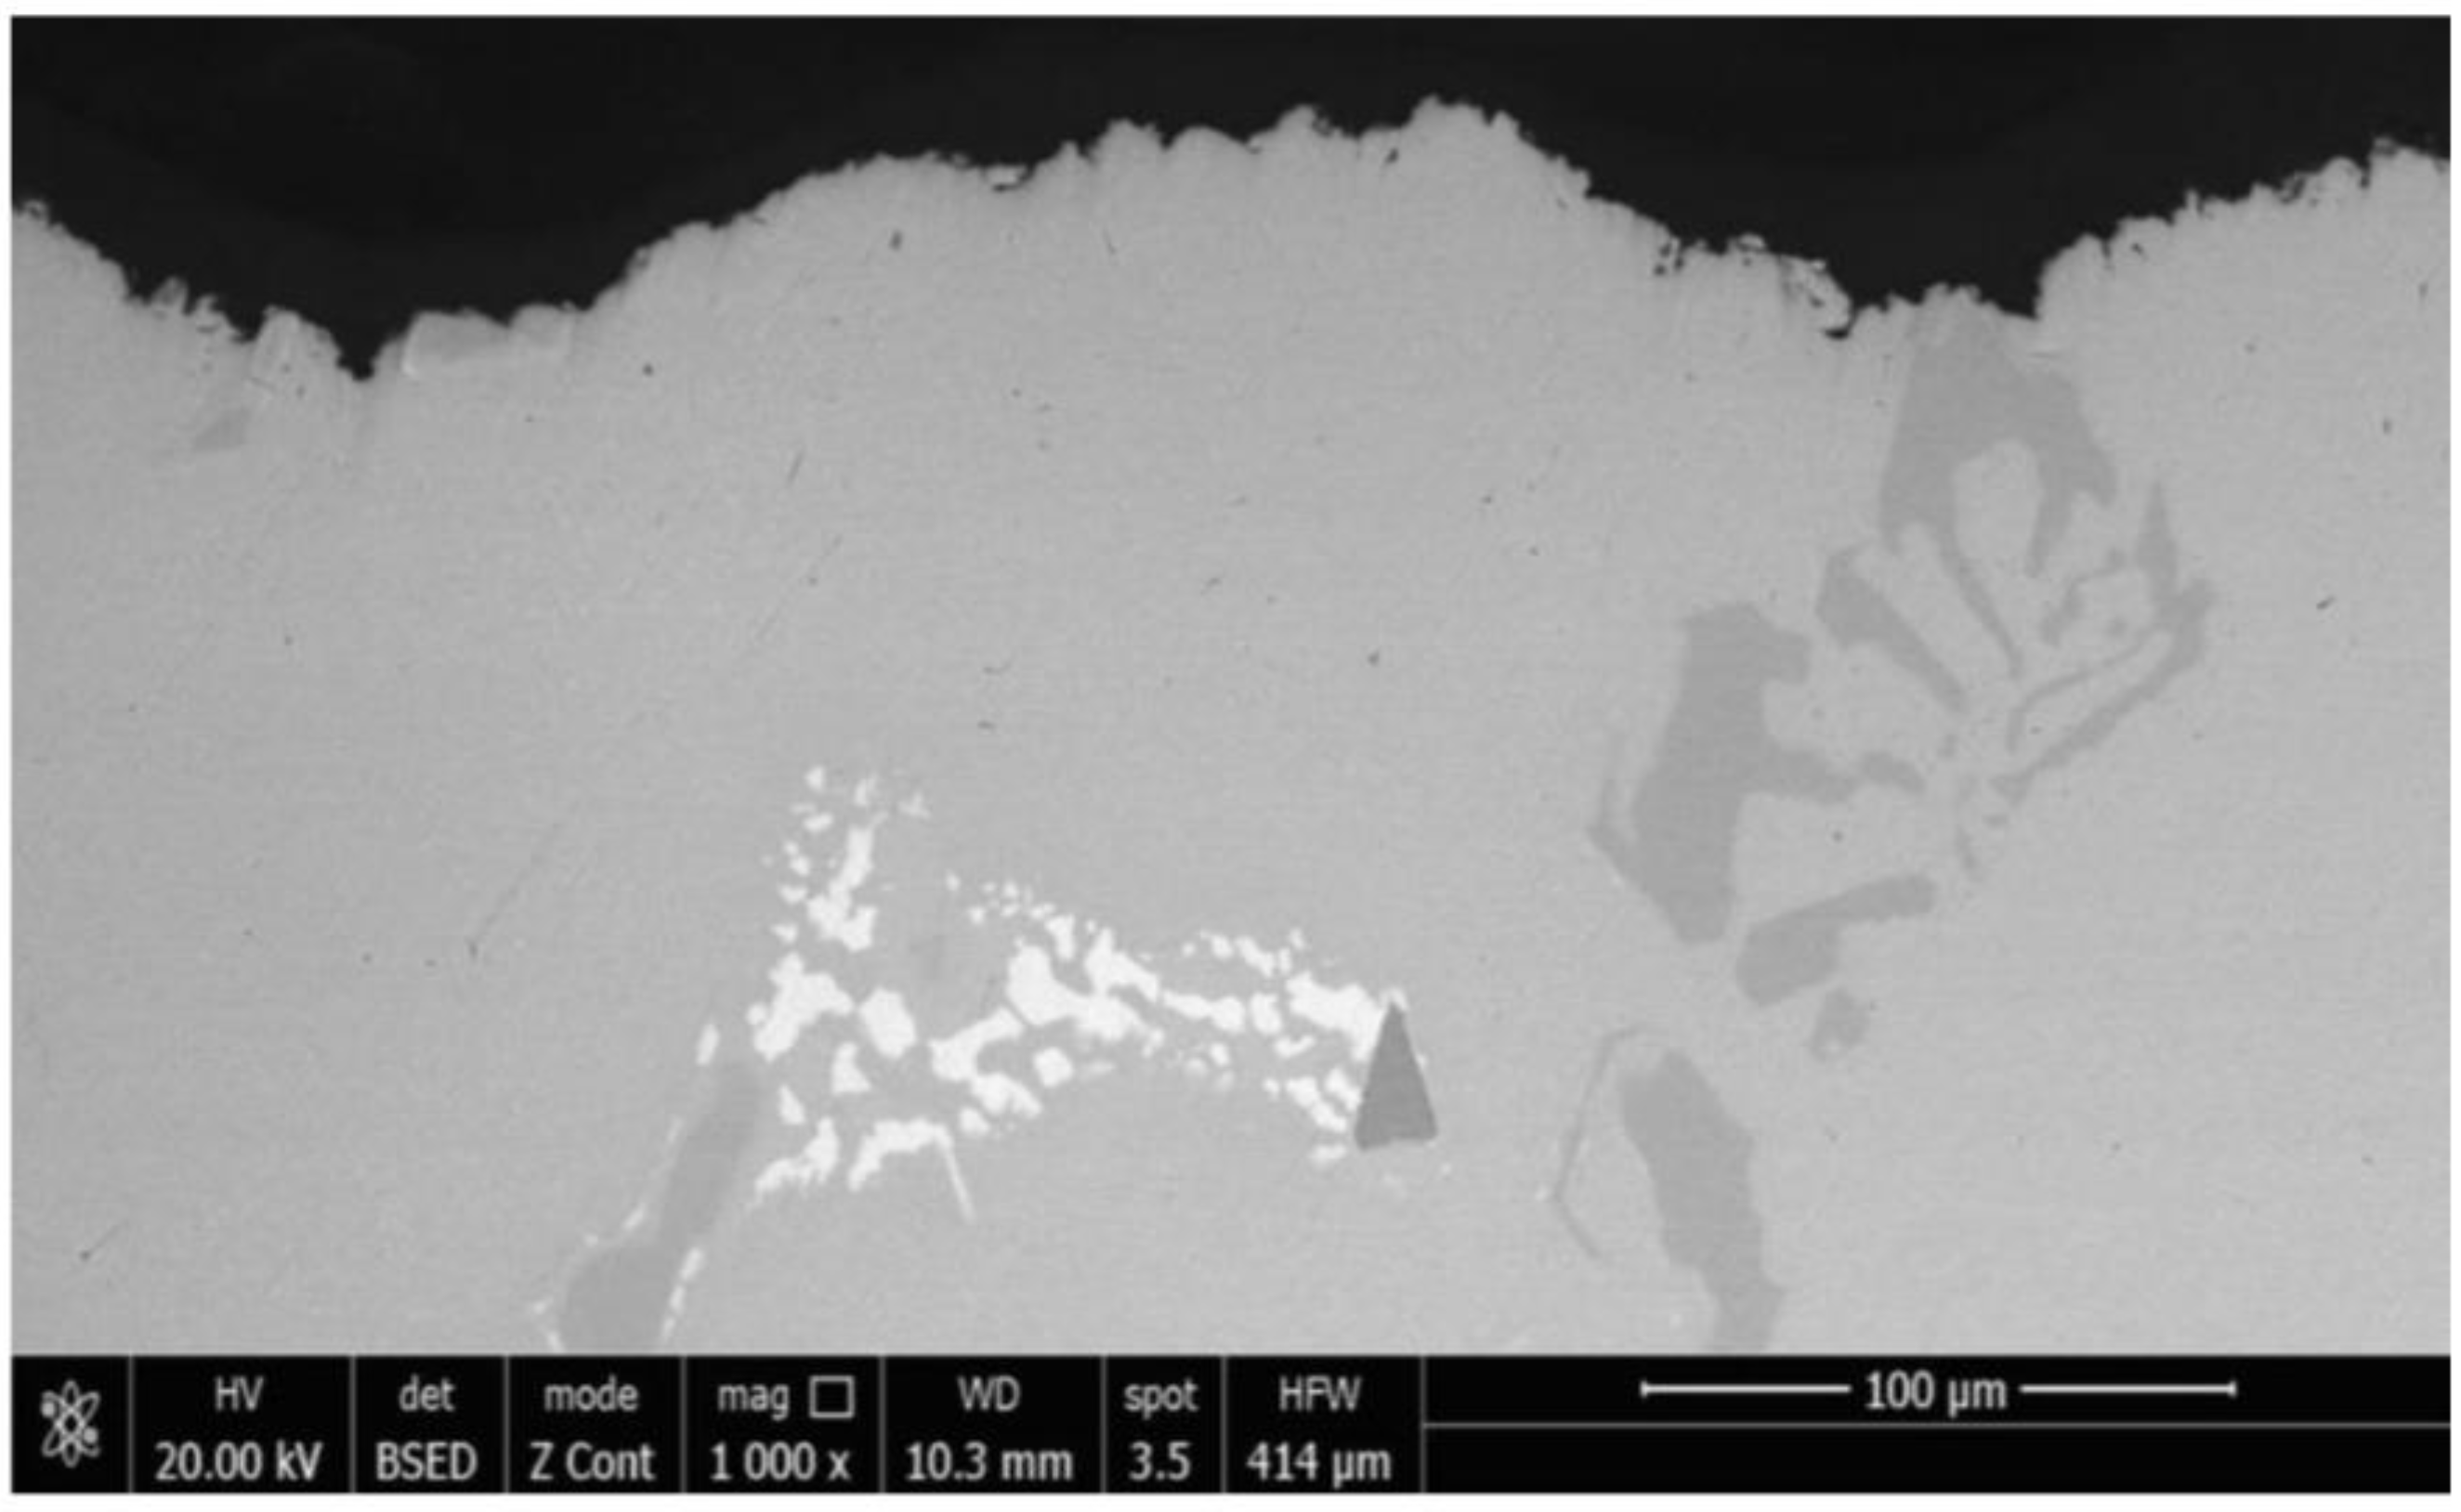
- regardless of the heat adopted regime, the erosion is manifested by the appearance of a peripheral ring, which advances towards the center surface with the increase in the duration of the cavitation attack; the damage is in the form of pitting, as a result of cyclic stresses, created by the impact with the cavitational microjets;
- -
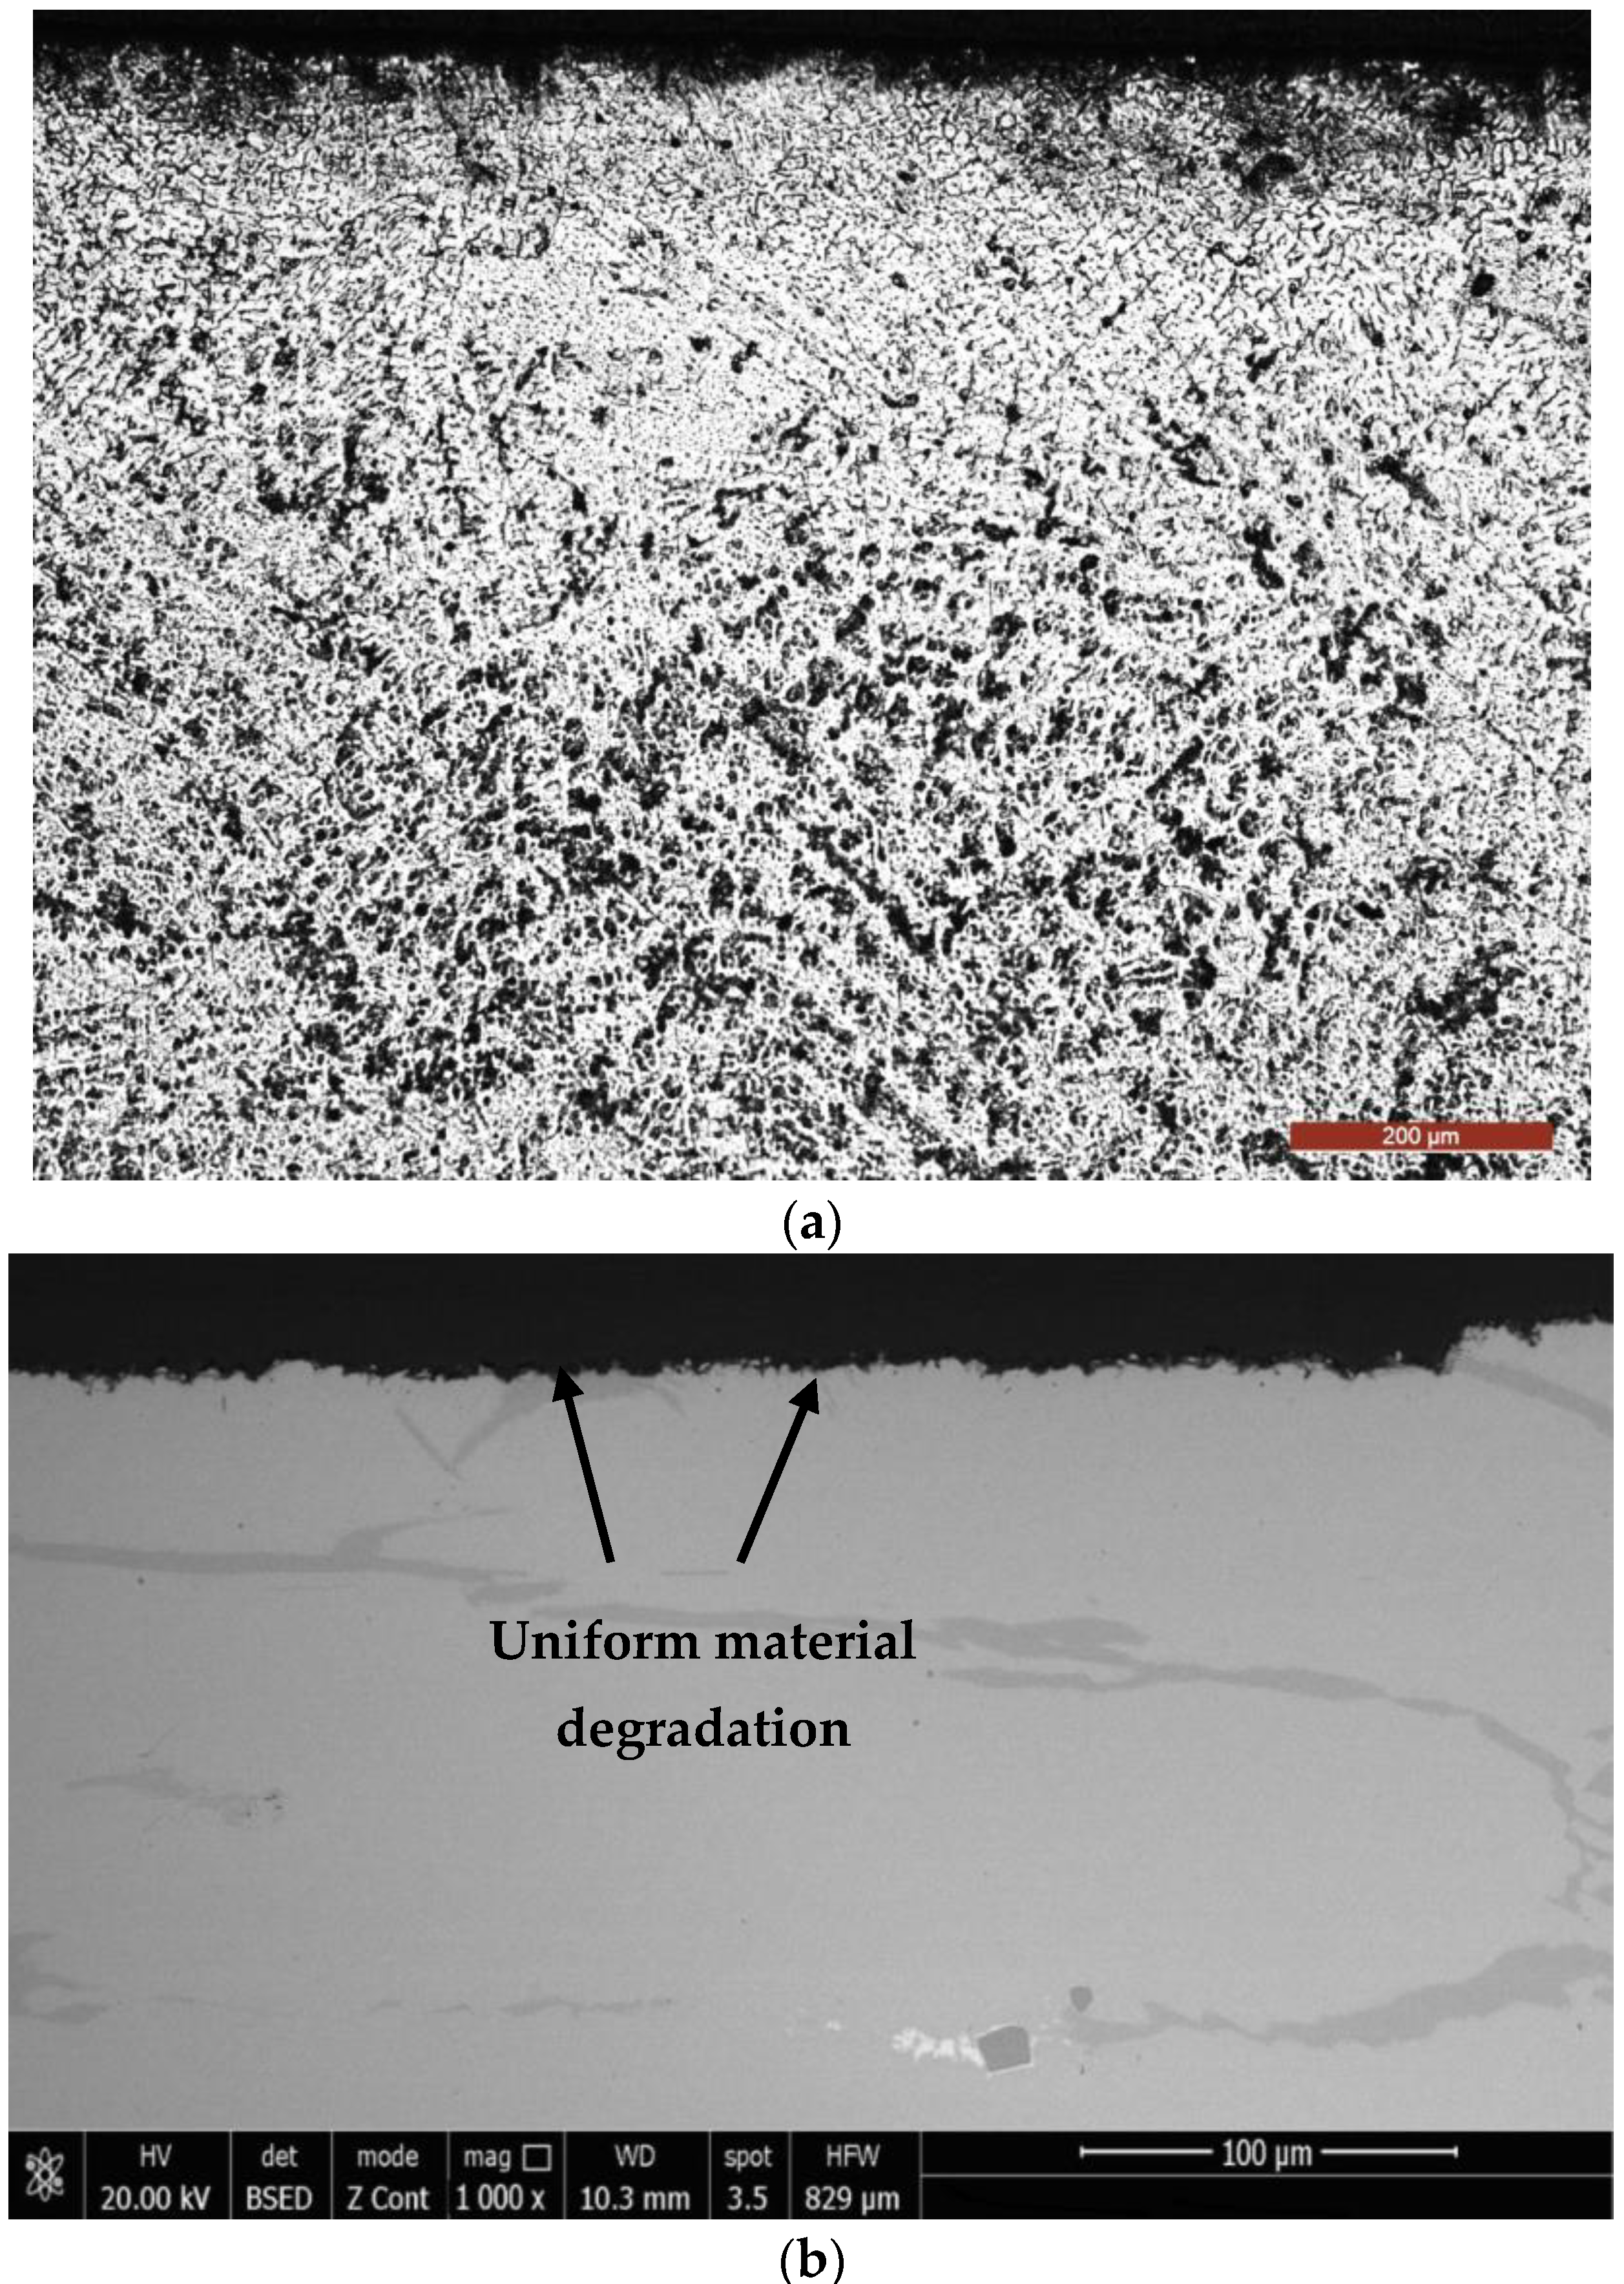
- as cavitation duration increases, the resulting surface roughness for the remelting current Is = 200 A is the most affected, showing that the use of this TIG regime leads to the lowest wear resistance;
- -
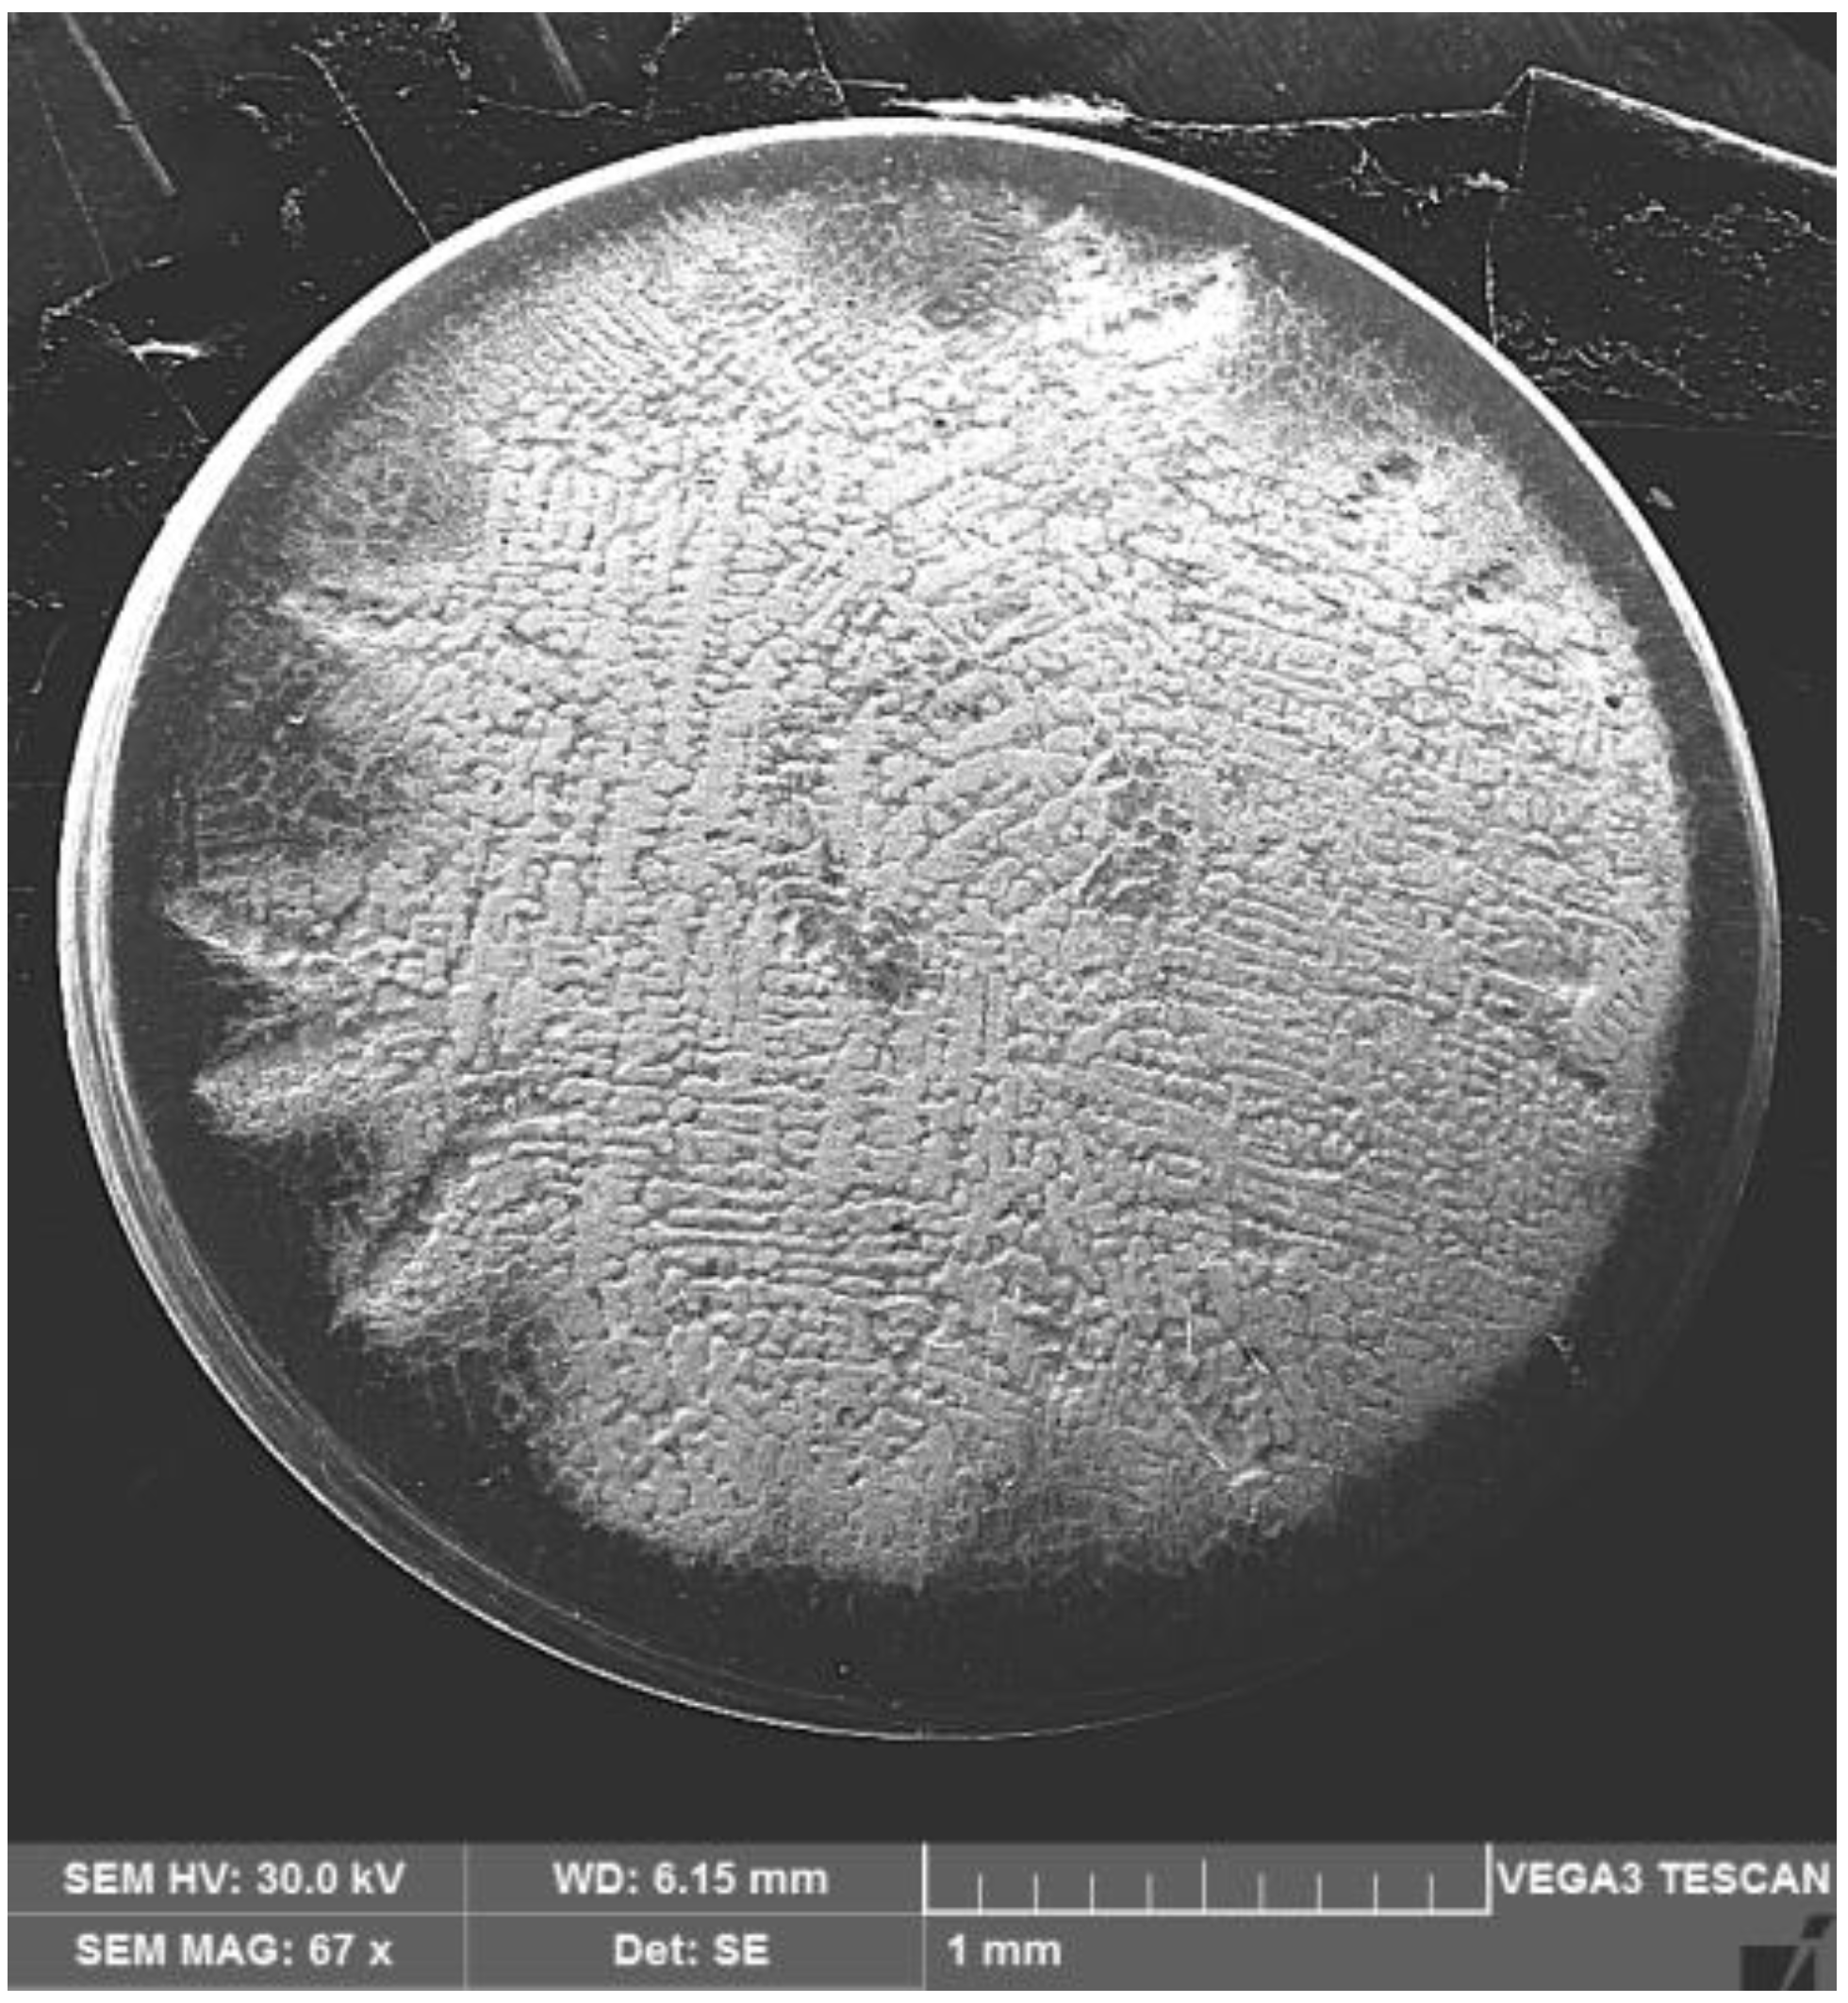
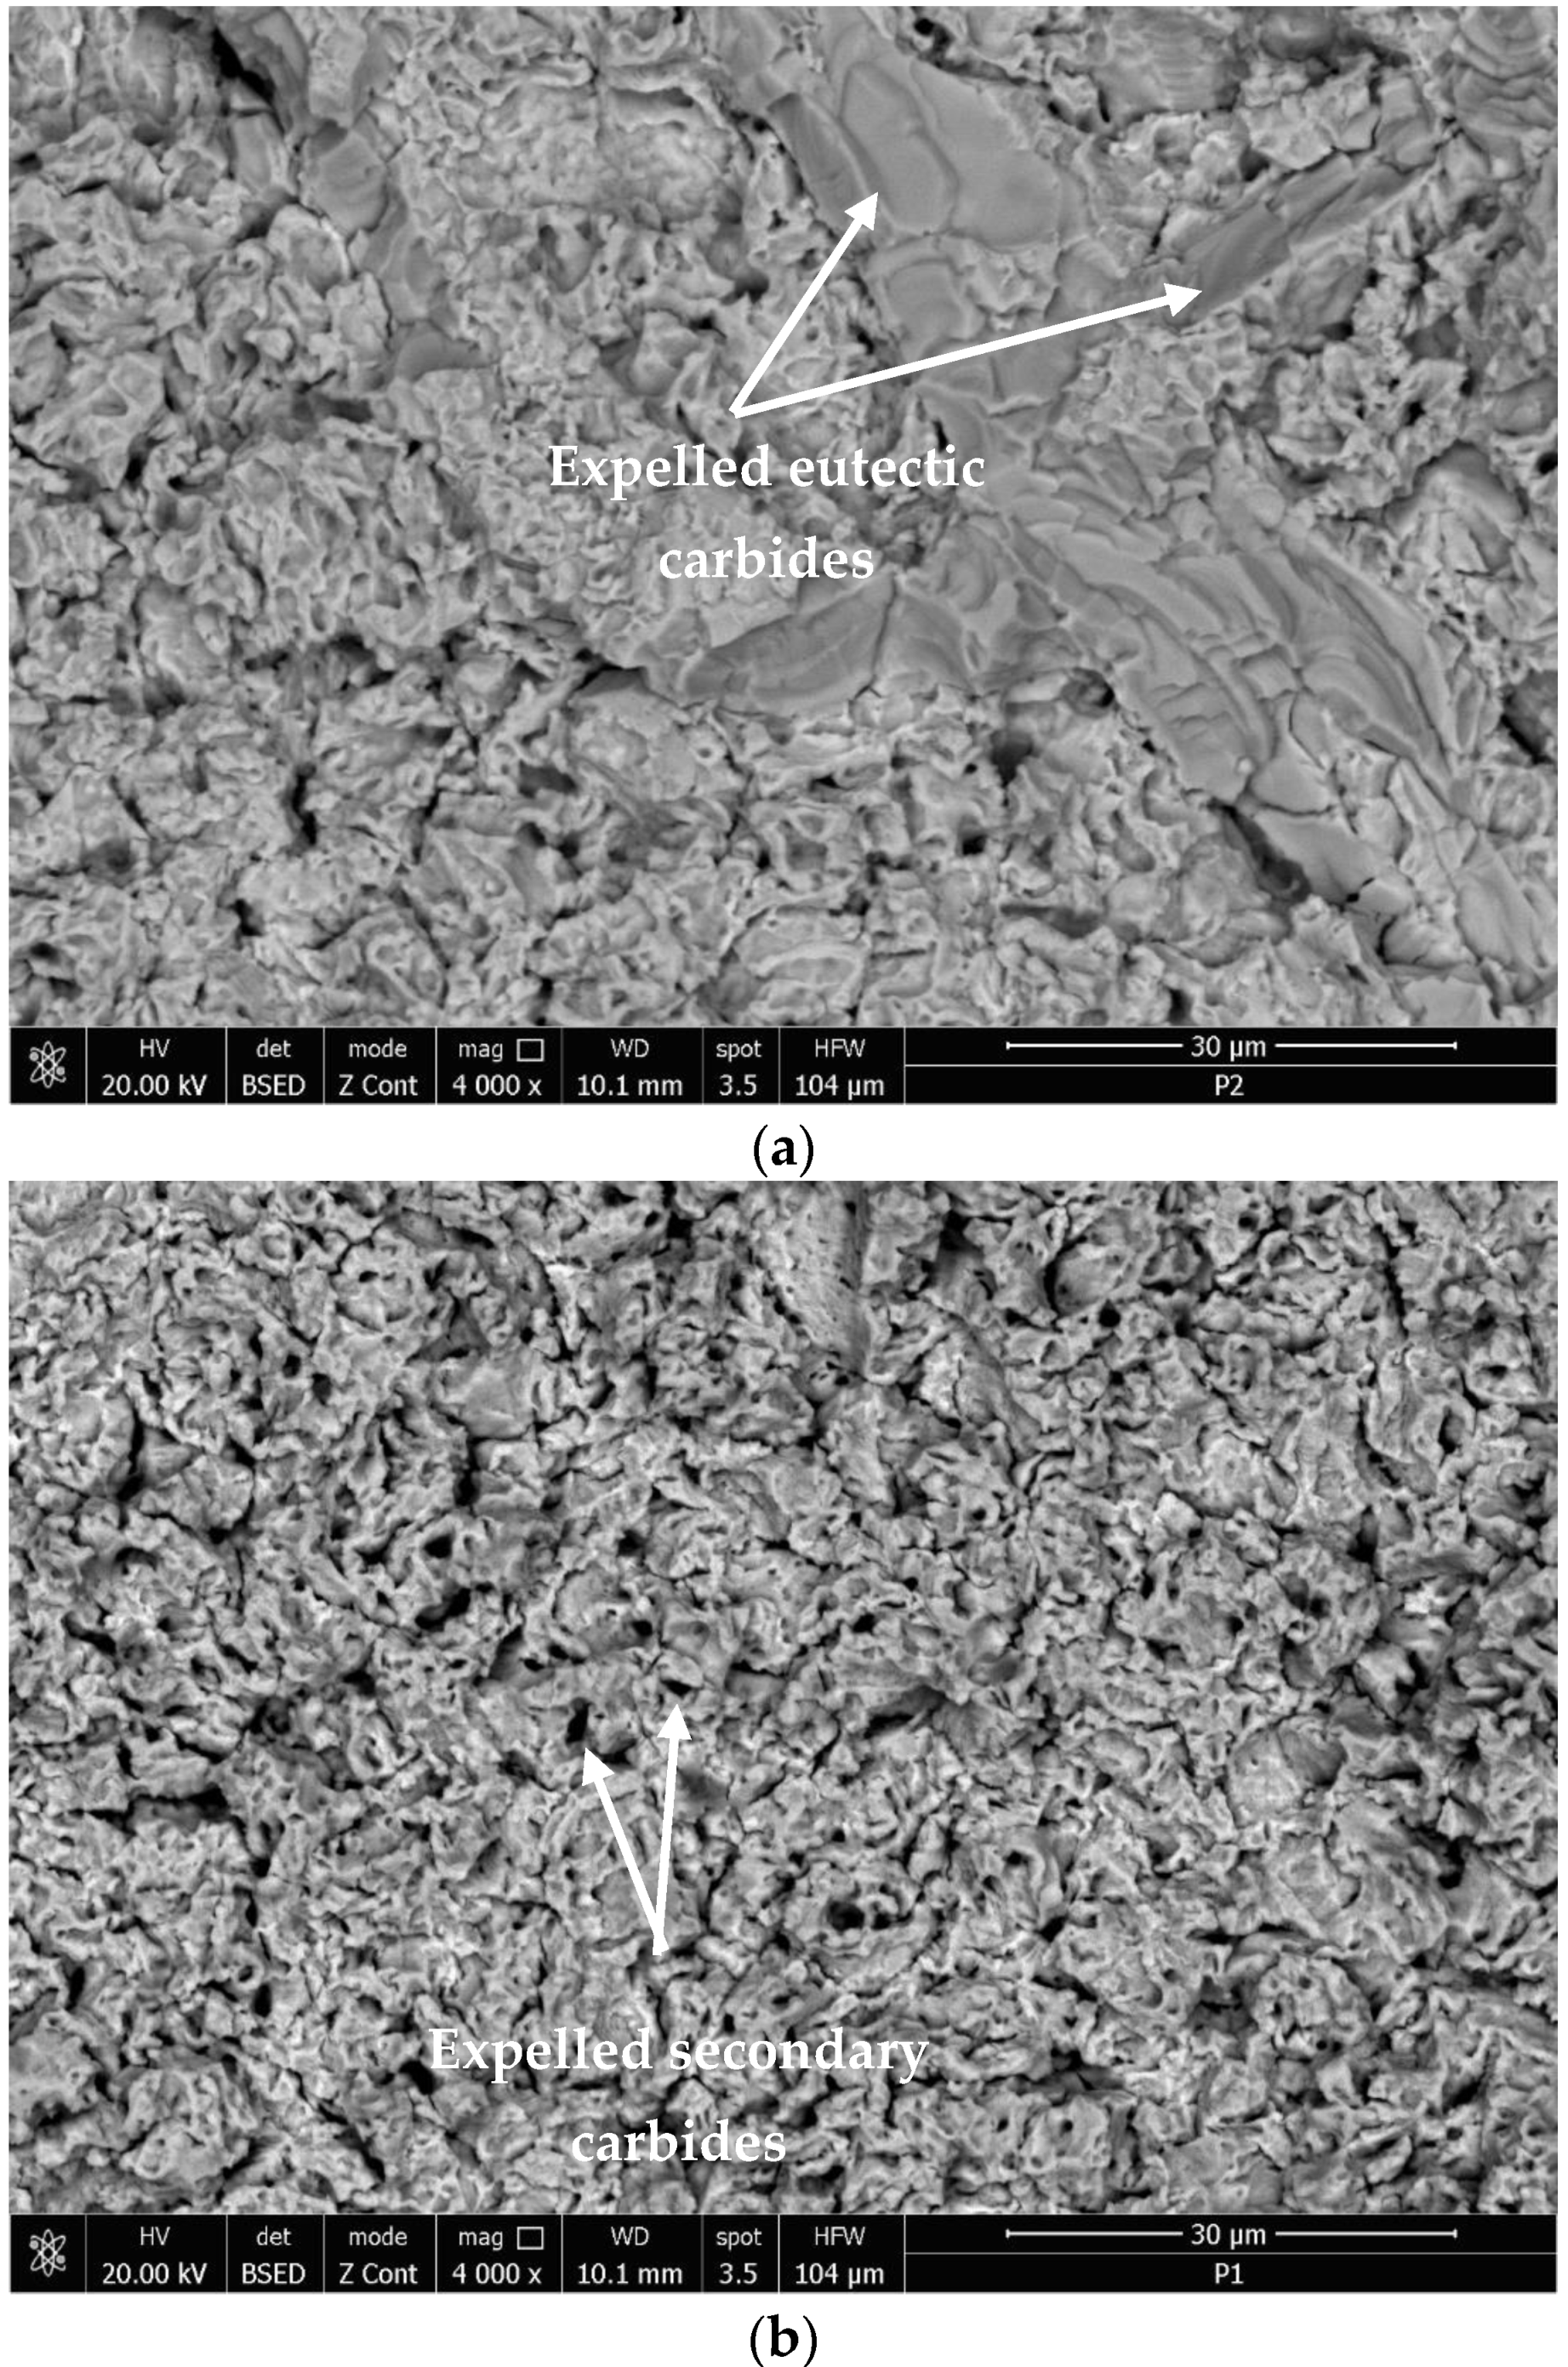
- the best resistance to the vibrating cavitation demands is obtained by the remelted surface Is = 150 A, the destruction evolution in terms of area and depth being the most advantageous. The SEM image in Figure 9 proves this fact;
- -
- the use of a remelting current Is = 100 A leads to an intermediate interaction between its other two values;
- -
3.3. Topography of the Surfaces Tested for Cavitation
4. Conclusions
Author Contributions
Funding
Institutional Review Board Statement
Informed Consent Statement
Data Availability Statement
Acknowledgments
Conflicts of Interest
References
- Franc, J.-P.; Michel, J.M. Fundamentals of Cavitation; Kluwer Academic Publishers: Dordrecht, The Netherlands; Boston, MA, USA; London, UK, 2004. [Google Scholar]
- Guiyan, G.; Zheng, Z. Cavitation erosion mechanism of 2Cr13 stainless steel. Wear 2022, 488–489, 204137. [Google Scholar]
- Warren, D.A.; Griffiths, I.J.; Harniman, R.L.; Flewitt, P.E.J.; Scott, T.B. The role of ferrite in Type 316H austenitic stainless steels on the susceptibility to creep cavitation. Mater. Sci. Eng. A 2015, 635, 59–69. [Google Scholar] [CrossRef]
- Xia, D.; Deng, C.; Chen, Z.; Li, T.; Hu, W. Modeling Localized Corrosion Propagation of Metallic Materials by Peridynamics: Progresses and Challenges. Acta Metall Sin 2022, 58, 1093–1107. [Google Scholar]
- Romero, M.C.; Tschiptschin, A.P.; Scandian, C. Low temperature plasma nitriding of a Co30Cr19Fe alloy for improving cavitation erosion resistance. Wear 2019, 426–427, 581–588. [Google Scholar] [CrossRef]
- Mitelea, I.; Bena, T.; Bordeasu, I.; Utu, I.D.; Craciunescu, C.M. Enhancement of Cavitation Erosion Resistance of Cast Iron with TIG Remelted Surface. Metall. Mater. Trans. A 2019, 50A, 3767–3775. [Google Scholar] [CrossRef]
- Wang, Y.; Anp, Y.; Hou, G.; Zhao, X.; Zhou, H.; Chen, J. Effect of cooling rate during annealing on microstructure and ultrasonic cavitation behaviors of Ti6Al4V alloy. Wear 2023, 512–513, 204529. [Google Scholar] [CrossRef]
- Si, C.; Sun, W.; Tian, Y.; Cai, J. Cavitation erosion resistance enhancement of the surface modified 2024T351 Al alloy by ultrasonic shot peening. Surf. Coat. Technol. 2023, 452, 129122. [Google Scholar] [CrossRef]
- Singh, N.K.; Vinay, G.; Ang, A.S.M.; Mahajan, D.K.; Singh, H. Cavitation erosion mechanisms of HVOF-sprayed Ni-based cermet coatings in 3.5% NaCl environment. Surf. Coat. Technol. 2022, 434, 128194. [Google Scholar] [CrossRef]
- Mitelea, I.; Bordeasu, I.; Belin, C.; Utu, I.D.; Craciunescu, C.M. Cavitation Resistance, Microstructure, and Surface Topography of Plasma Nitrided Nimonic 80 A Alloy. Materials 2022, 15, 6654. [Google Scholar] [CrossRef] [PubMed]
- Chen, J.H.; Wu, W. Cavitation erosion behavior of Inconel 690 alloy. Mater. Sci. Eng. A 2008, 489, 451–456. [Google Scholar] [CrossRef]
- Chen, F.; Jianhua Du, J.; Zhou, S. Cavitation erosion behaviour of incoloy alloy 865 in NaCl solution using ultrasonic vibration. J. Alloy. Compd. 2020, 831, 1547832. [Google Scholar] [CrossRef]
- Mitelea, I.; Bordeasu, I.; Belin, C.; Utu Craciunescu, C.M. TIG processing of Nimonic 80A alloy for enhanced cavitation erosion resistance, Metal 2019. In Proceedings of the 28th International Conference on Metallurgy and Materials, Brno, Czech Republic, 22–24 May 2019; pp. 1399–1404. [Google Scholar]
- Han, S.; Lin, J.H.; Kuo, J.J.; He, J.L.; Shih, H.C. The cavitation-erosion phenomenon of chromium nitride coatings deposited using cathodic arc plasma deposition on steel. Surf. Coat. Technol. 2002, 161, 20–25. [Google Scholar] [CrossRef]
- Berchiche, N.A.; Franc, J.-P.; Michel, J.M. A cavitation erosion model for ductile materials. J. Fluids Eng. 2002, 124, 601–606. [Google Scholar] [CrossRef]
- Mitelea, I.; Bordeasu, I.; Riemschneider, E.; Utu, I.D.; Craciunescu, C.M. Cavitation erosion improvement following TIG surface-remelting of gray cast iron. Wear 2022, 496–497, 204282. [Google Scholar] [CrossRef]
- Hattori, S.; Kitagawa, T. Analysis of cavitation erosion resistance of cast iron and nonferrous metals based on database and comparison with carbon steel data. Wear 2010, 269, 443–448. [Google Scholar] [CrossRef]
- Mitelea, I.; Dimian, E.; Bordeasu, I.; Craciunescu, C. Ultrasonic cavitation erosion of gas nitrided Ti-6Al-4V alloys. Ultrason. Sonochemistry 2014, 21, 1544–1548. [Google Scholar] [CrossRef] [PubMed]
- Abbasi, M.; Vahdatnia, M.; Navaei, A. Solidification Microstructure of HK Heat Resistant Steel. Int. J. Met. 2015, 9, 14–26. [Google Scholar] [CrossRef]
- Bordeaşu, I.; Patrascoiu, C.; Badarau, R.; Sucitu, L.; Popoviciu, M.; Balasoiu, V. New contributions in cavitation erosion curves modeling. FME Trans. 2006, 34, 39–43. [Google Scholar]
- Steller, J.K. International cavitation erosion test-summary of results. In Proceedings of the ImechE Cavitation Conference, Cambridge, UK, 9–11 December 1992; pp. 95–102. [Google Scholar]
- Steller, J.K. International Cavitation Erosion Test-Test Facilities and Experimental Results; 2-émés Journées Cavitation: Paris, France, 1992. [Google Scholar]
- Steller, J.; Giren, B.G. International Cavitation Erosion Test; Final Report; Gdansk: Gdansk, Poland, 2015. [Google Scholar]
- Standard G32-2016; Standard Method of Vibratory Cavitation Erosion Test. ASTM: West Conshohocken, PA, USA, 2016.
- Bordeaşu, I. Eroziunea Cavitaţională a Materialelor; Editura Politehnica: Timișoara, Romania, 2006. [Google Scholar]
- Li, Z.; Han, J.; Lu, J.; Zhou, J.; Chen, J. Vibratory cavitation erosion behaviour of AISI 304 stainless steel in water at elevated temperatures. Wear 2014, 321, 33–37. [Google Scholar] [CrossRef]
- Yucheng, L.; Chang, H.; Guo, X.; Li, T.; Xiao, L. Ultrasonic cavitation erosion of 316L steel weld joint in liquid Pb-Bi eutectic alloy at 550 °C. Ultrason. Sonochem. 2017, 39, 77–86. [Google Scholar]


Disclaimer/Publisher’s Note: The statements, opinions and data contained in all publications are solely those of the individual author(s) and contributor(s) and not of MDPI and/or the editor(s). MDPI and/or the editor(s) disclaim responsibility for any injury to people or property resulting from any ideas, methods, instructions or products referred to in the content. |
© 2023 by the authors. Licensee MDPI, Basel, Switzerland. This article is an open access article distributed under the terms and conditions of the Creative Commons Attribution (CC BY) license (https://creativecommons.org/licenses/by/4.0/).
Share and Cite
Mitelea, I.; Bordeaşu, I.; Cosma, D.; Uțu, I.-D.; Crăciunescu, C.M. Microstructure and Cavitation Damage Characteristics of GX40CrNiSi25-20 Cast Stainless Steel by TIG Surface Remelting. Materials 2023, 16, 1423. https://doi.org/10.3390/ma16041423
Mitelea I, Bordeaşu I, Cosma D, Uțu I-D, Crăciunescu CM. Microstructure and Cavitation Damage Characteristics of GX40CrNiSi25-20 Cast Stainless Steel by TIG Surface Remelting. Materials. 2023; 16(4):1423. https://doi.org/10.3390/ma16041423
Chicago/Turabian StyleMitelea, Ion, Ilare Bordeaşu, Daniela Cosma (Alexa), Ion-Dragoș Uțu, and Corneliu Marius Crăciunescu. 2023. "Microstructure and Cavitation Damage Characteristics of GX40CrNiSi25-20 Cast Stainless Steel by TIG Surface Remelting" Materials 16, no. 4: 1423. https://doi.org/10.3390/ma16041423