
Characteristics of Hydroxyapatite-Modified Coatings Based on TiO2 Obtained by Plasma Electrolytic Oxidation and Electrophoretic Deposition
 , , , , and
Abstract
:1. Introduction
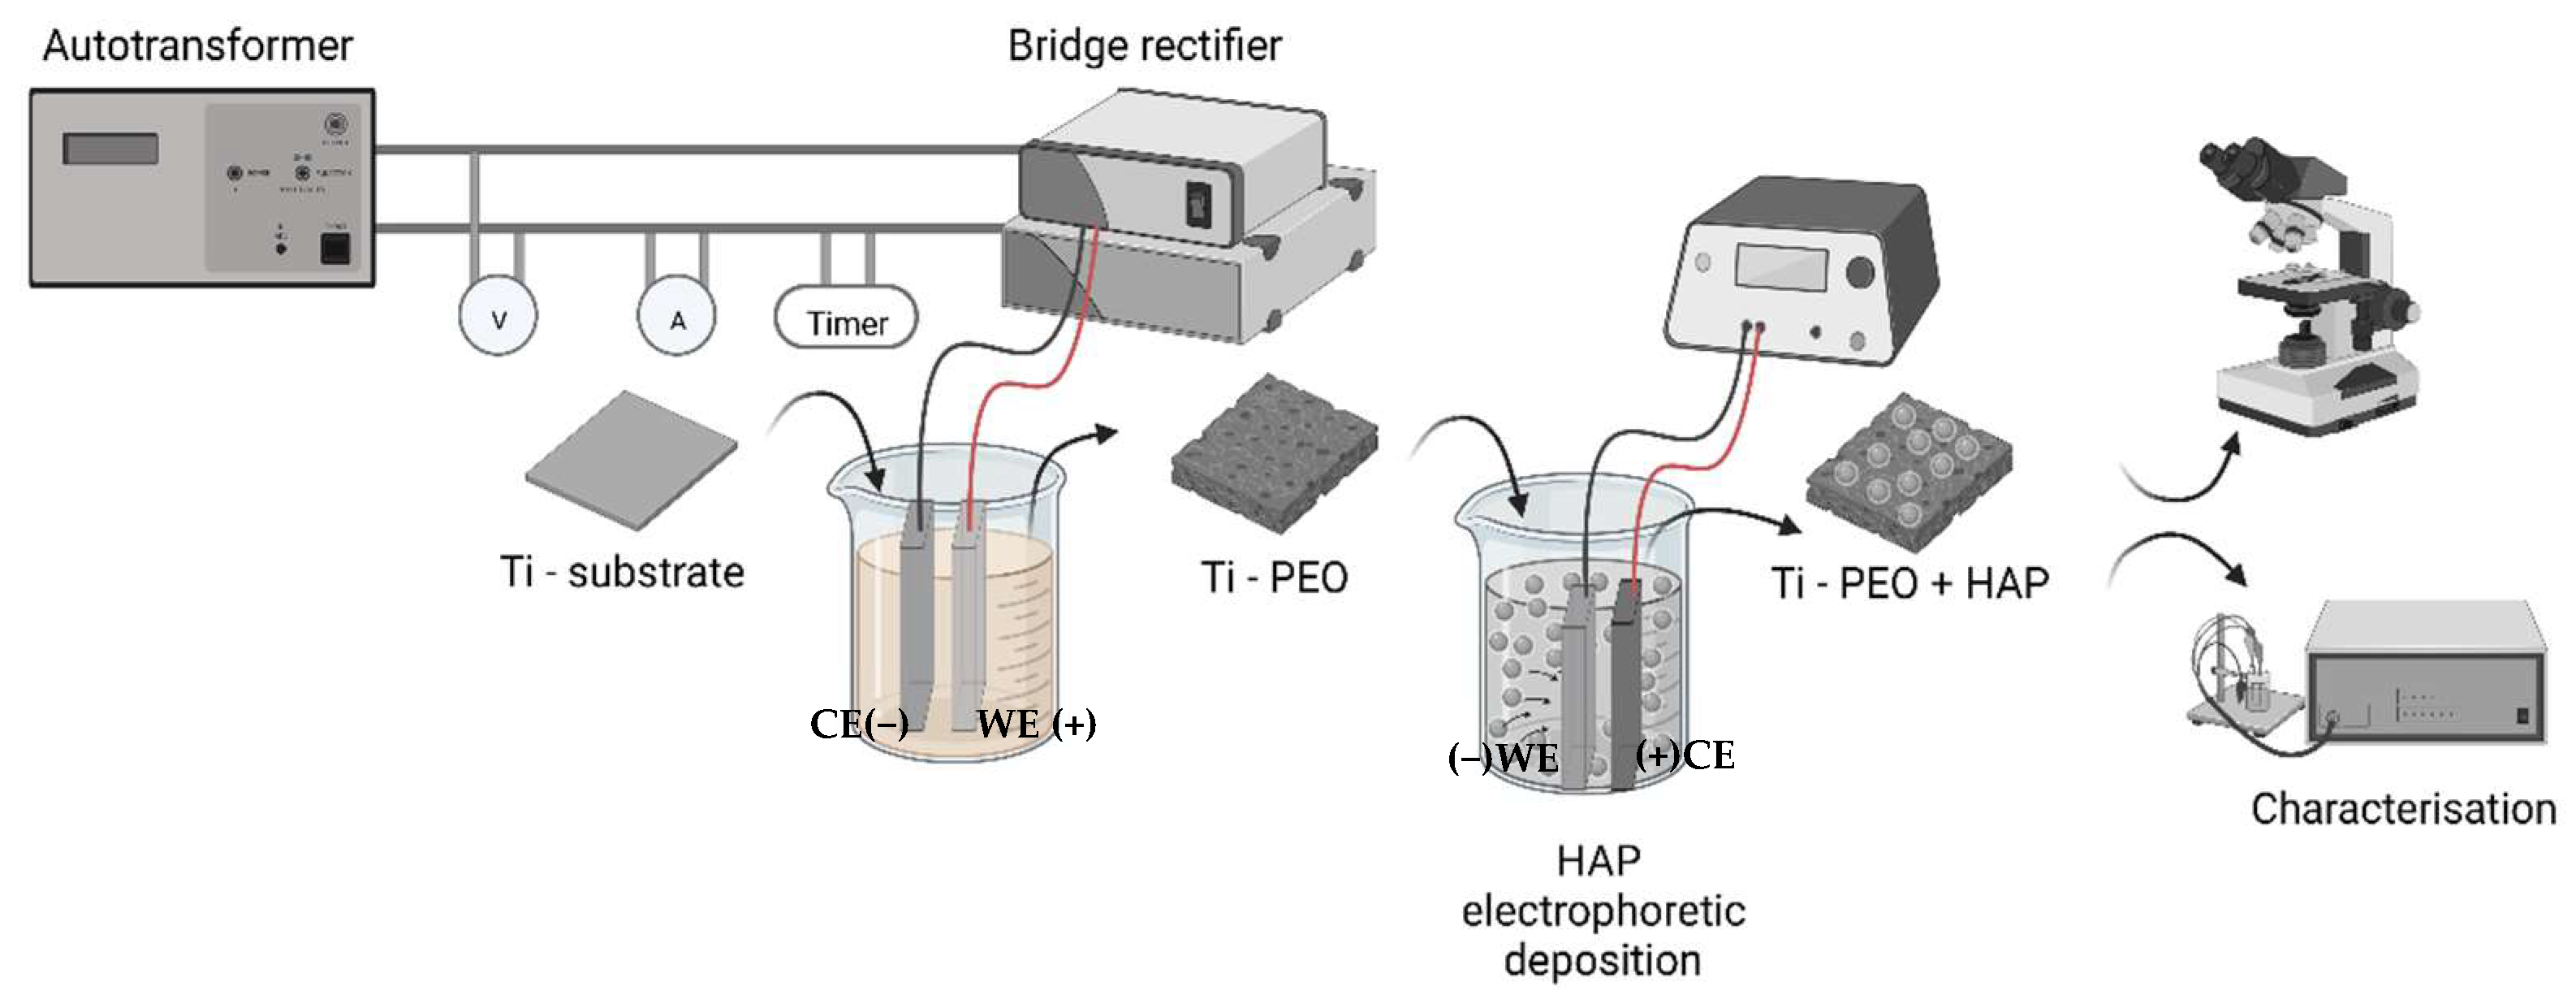
2. Materials and Methods
3. Results and Discussion
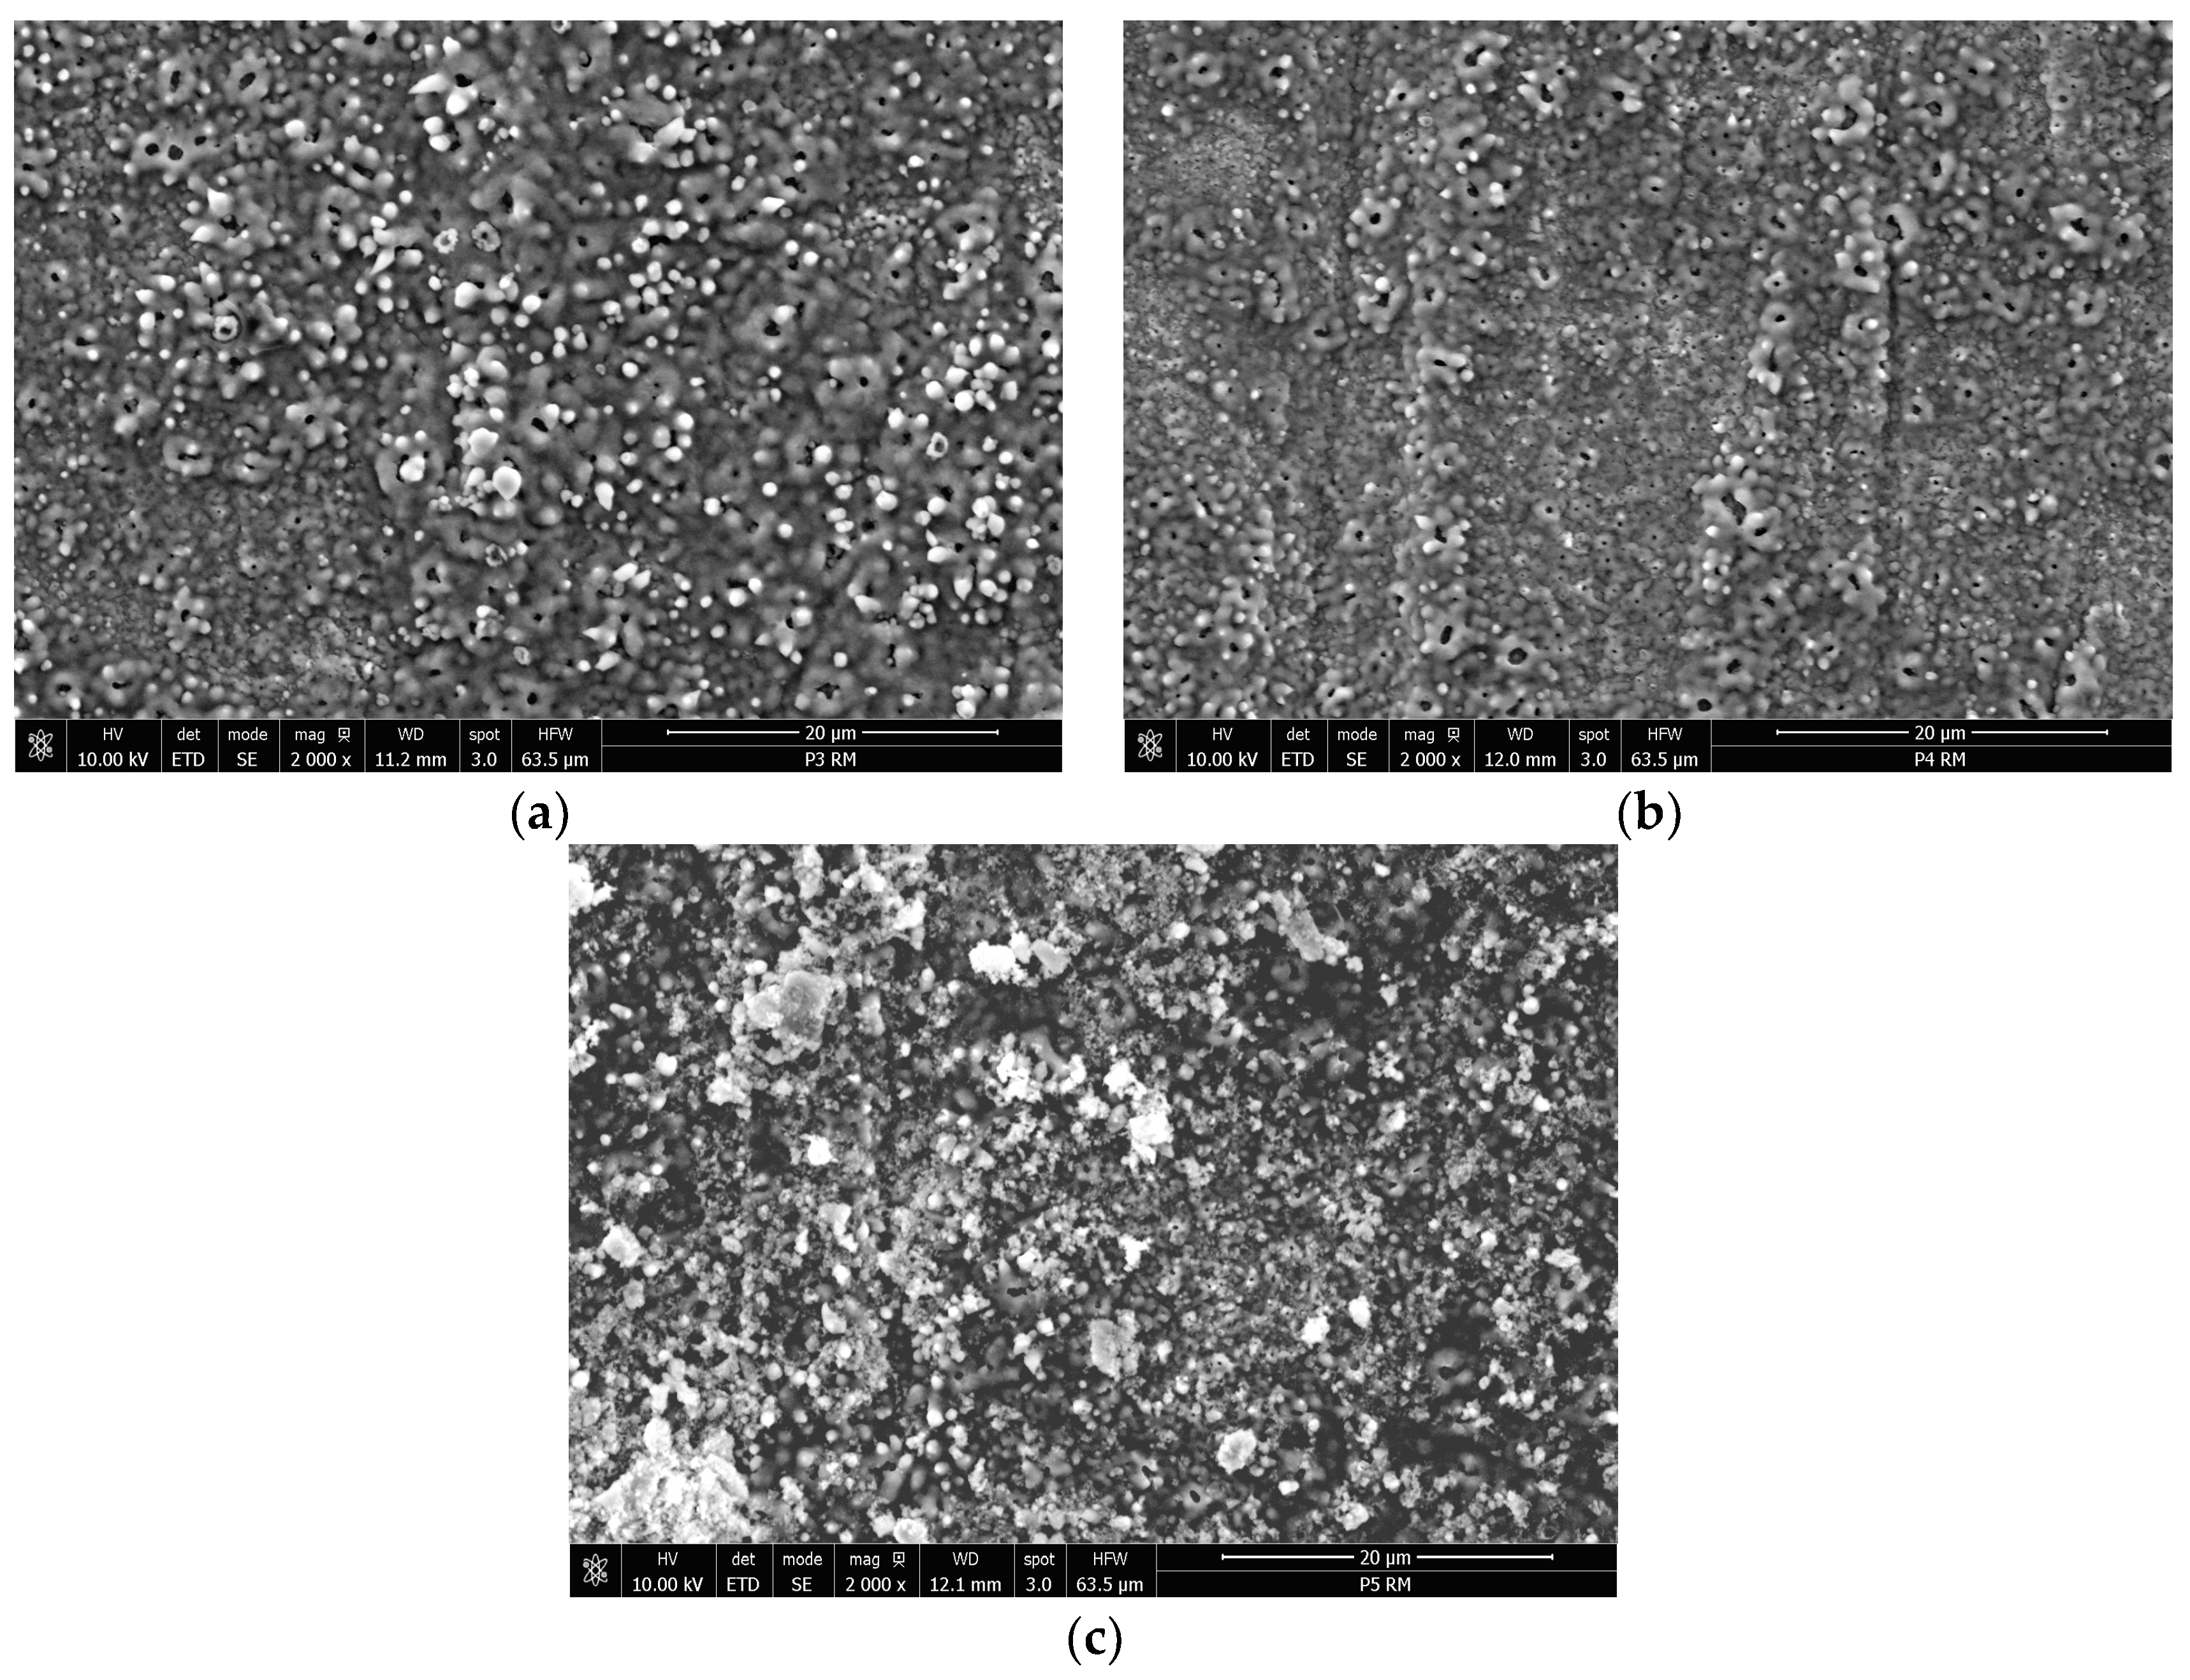
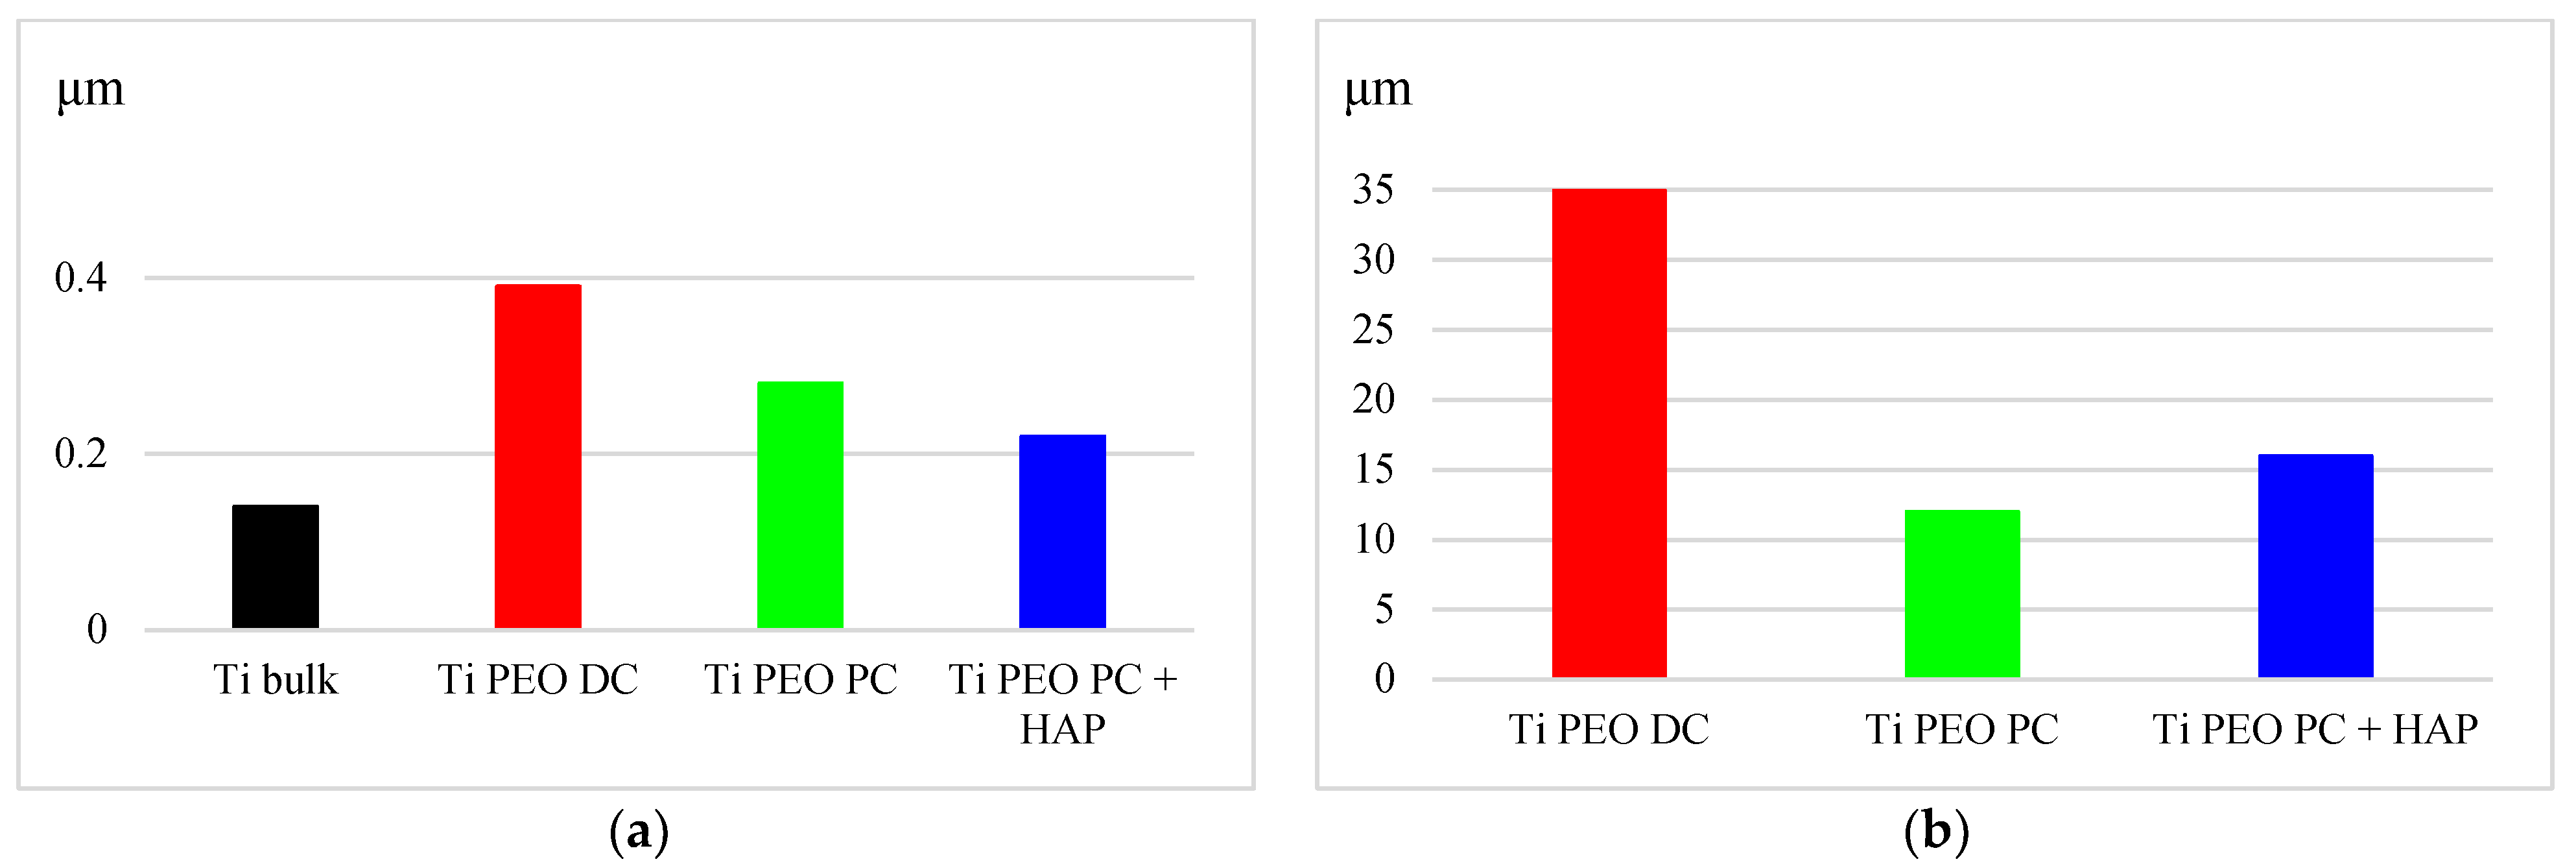
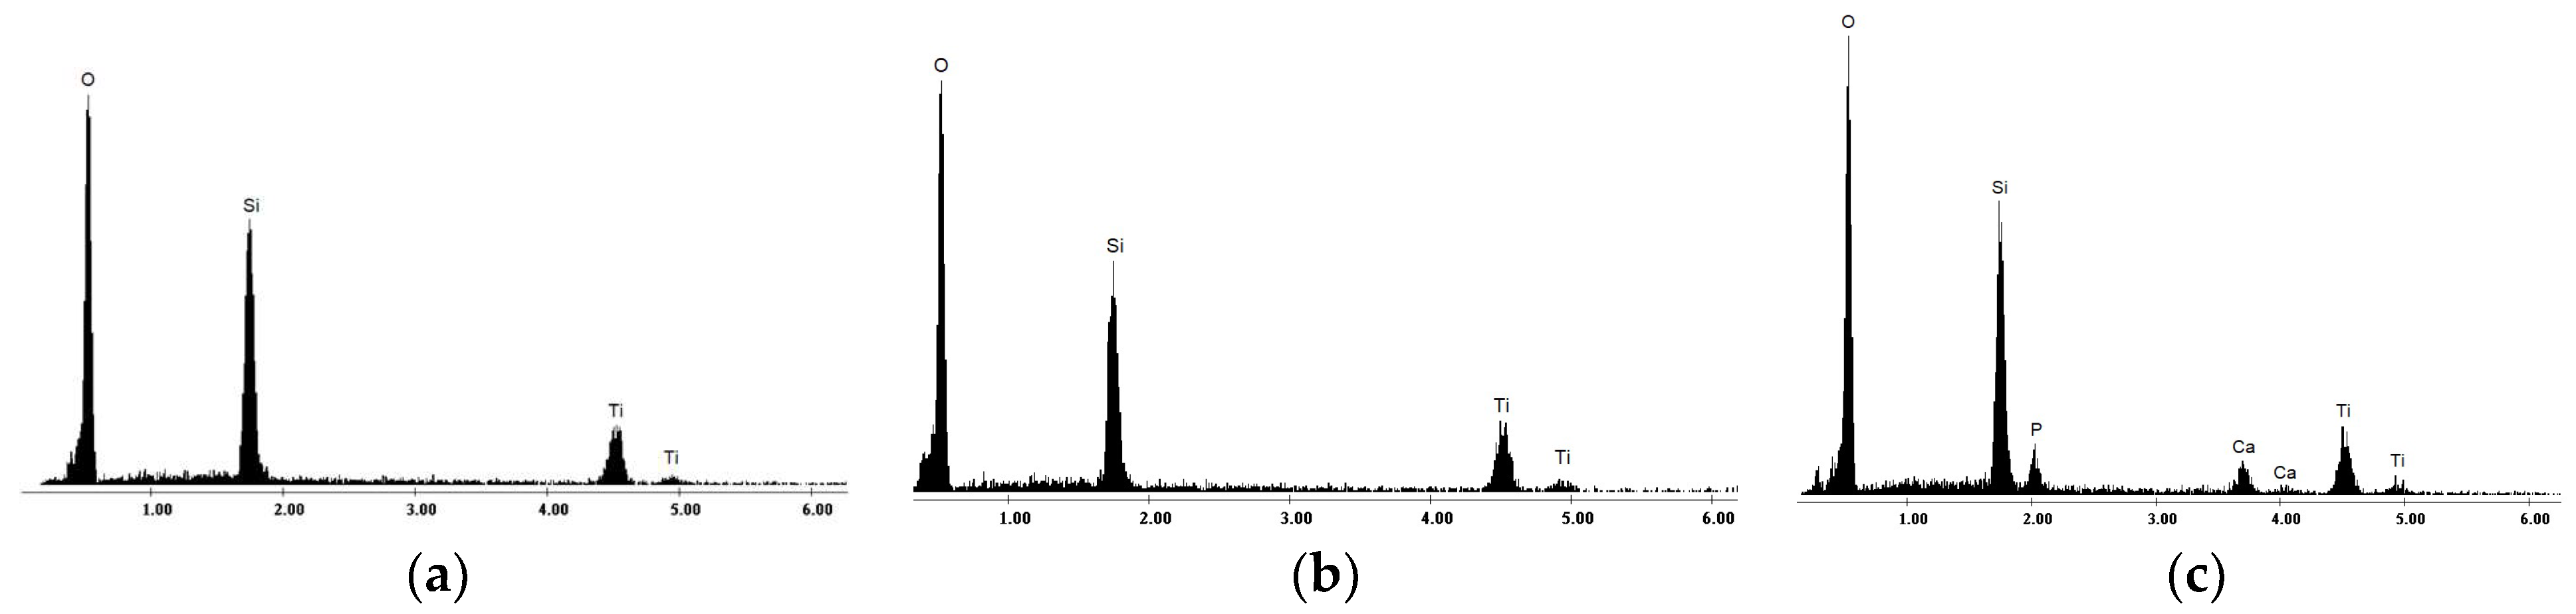
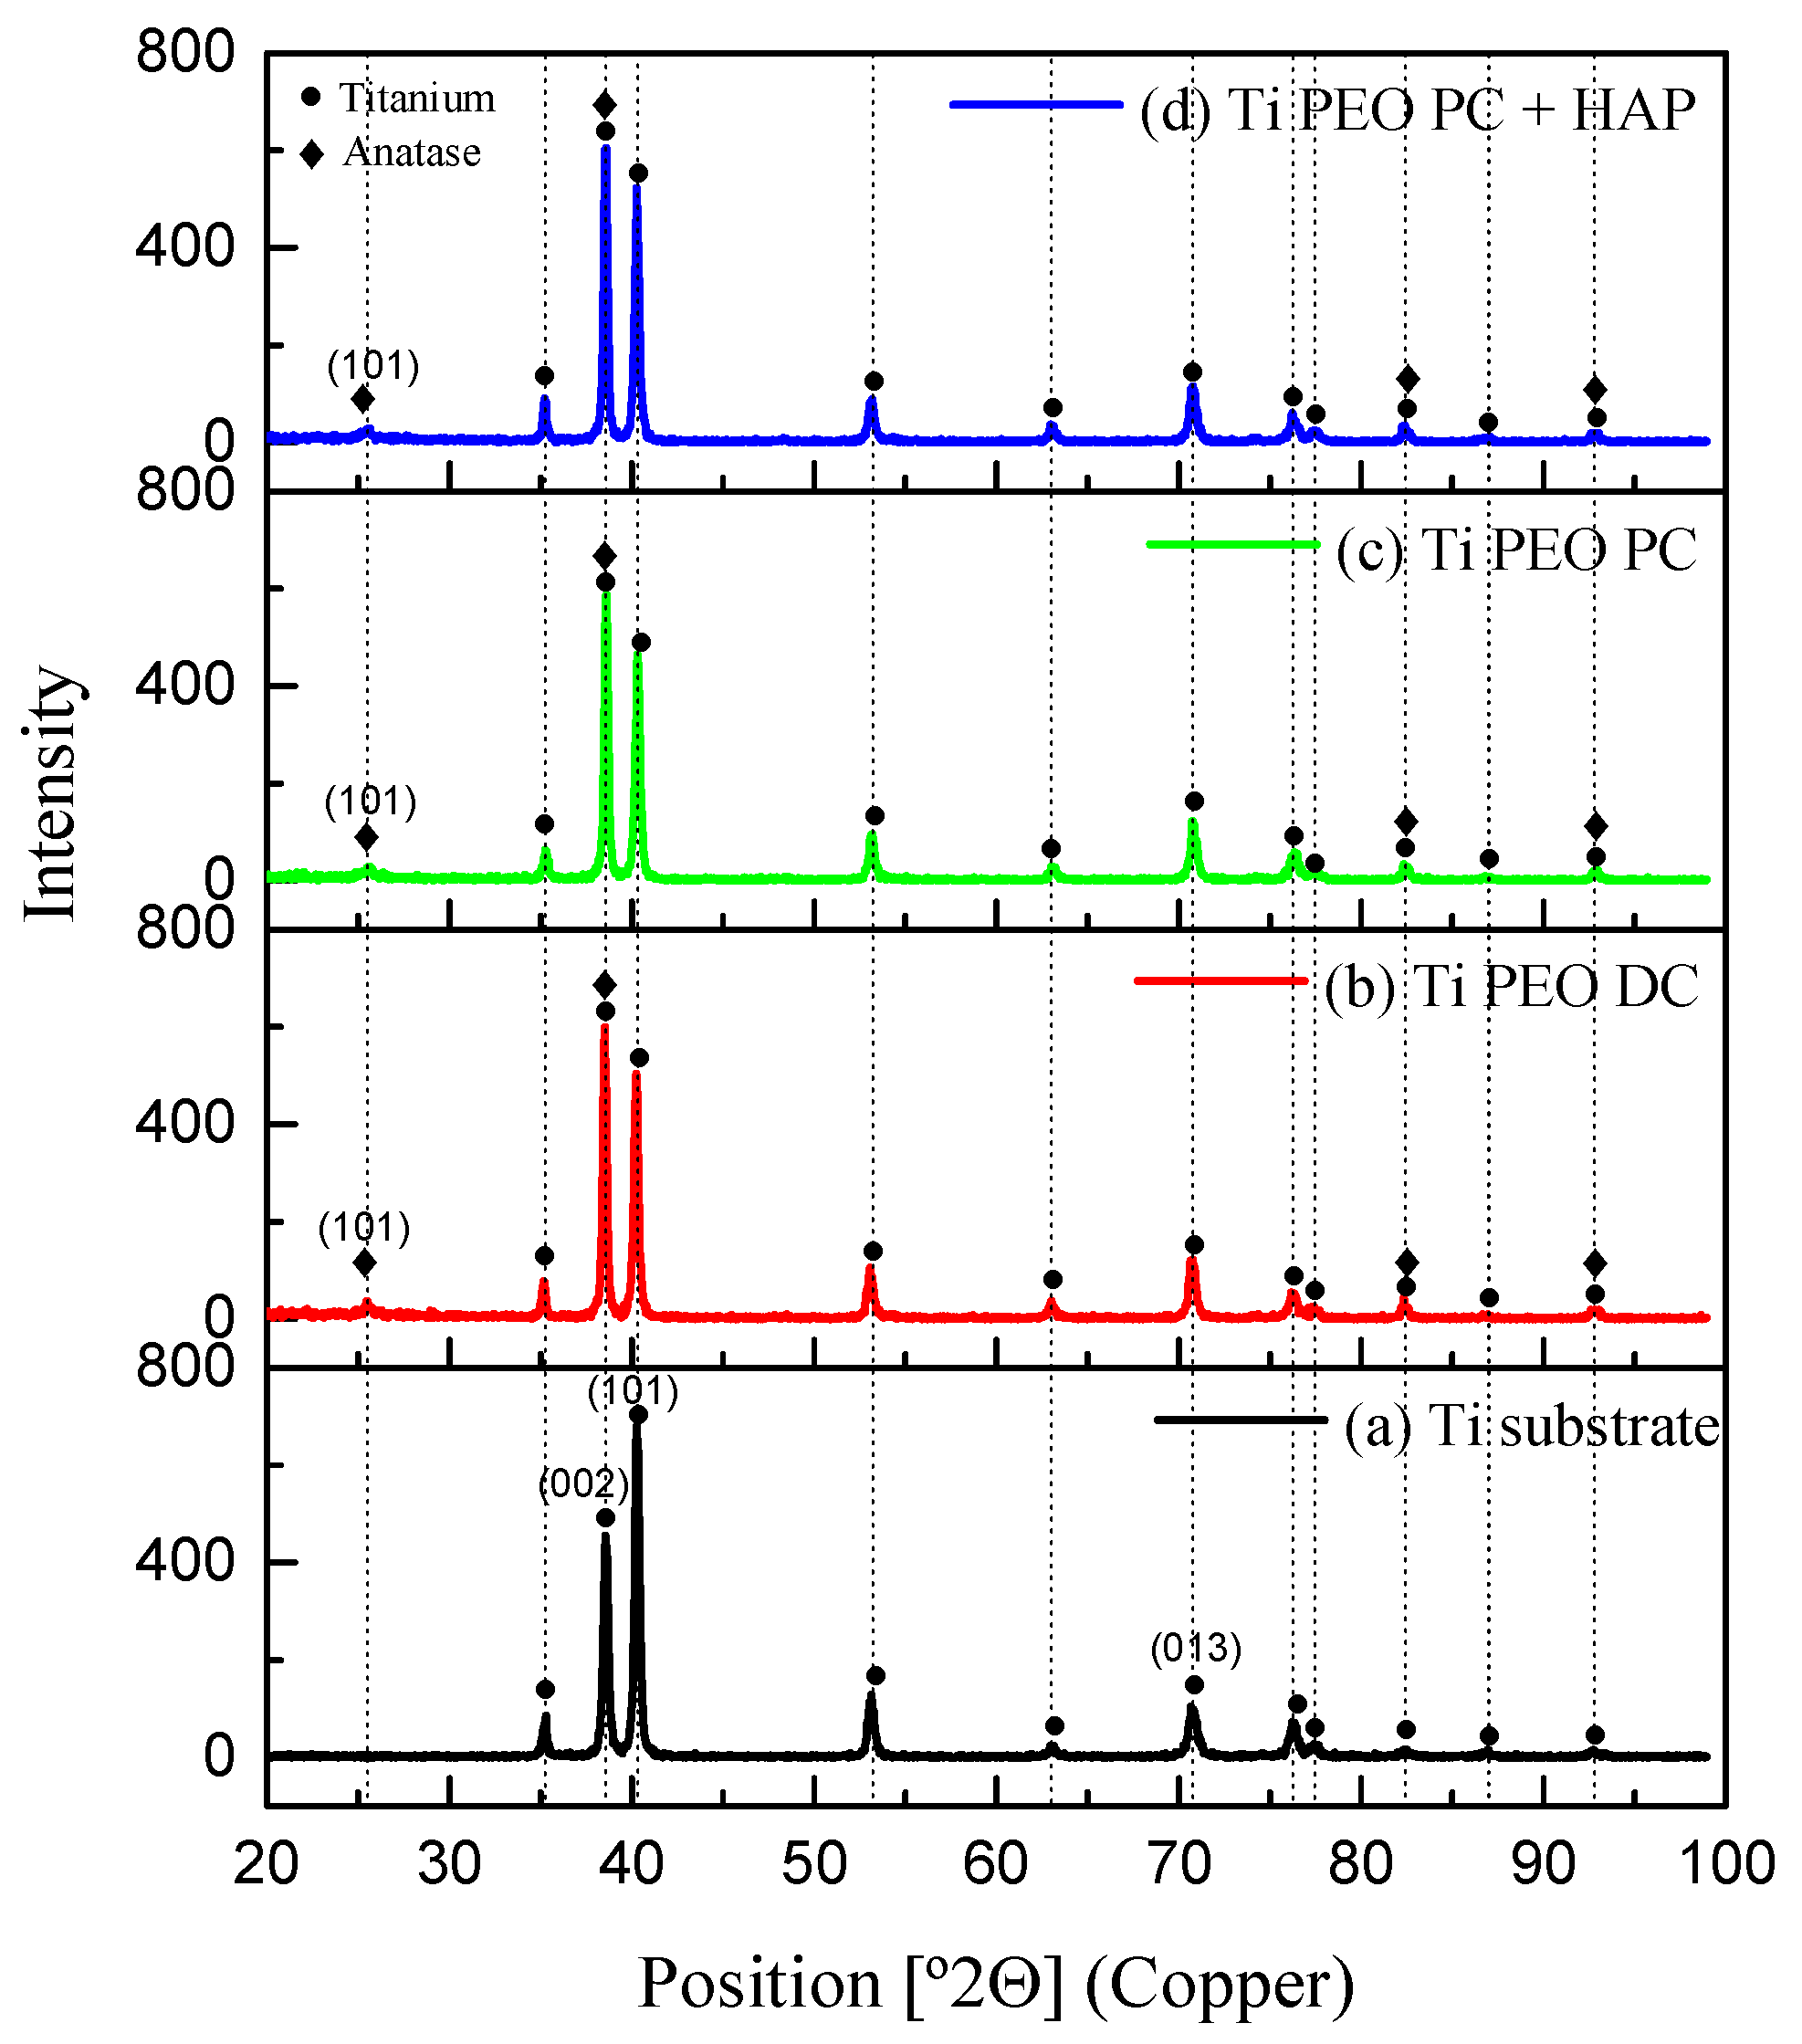
3.1. Coating Morphology and Composition
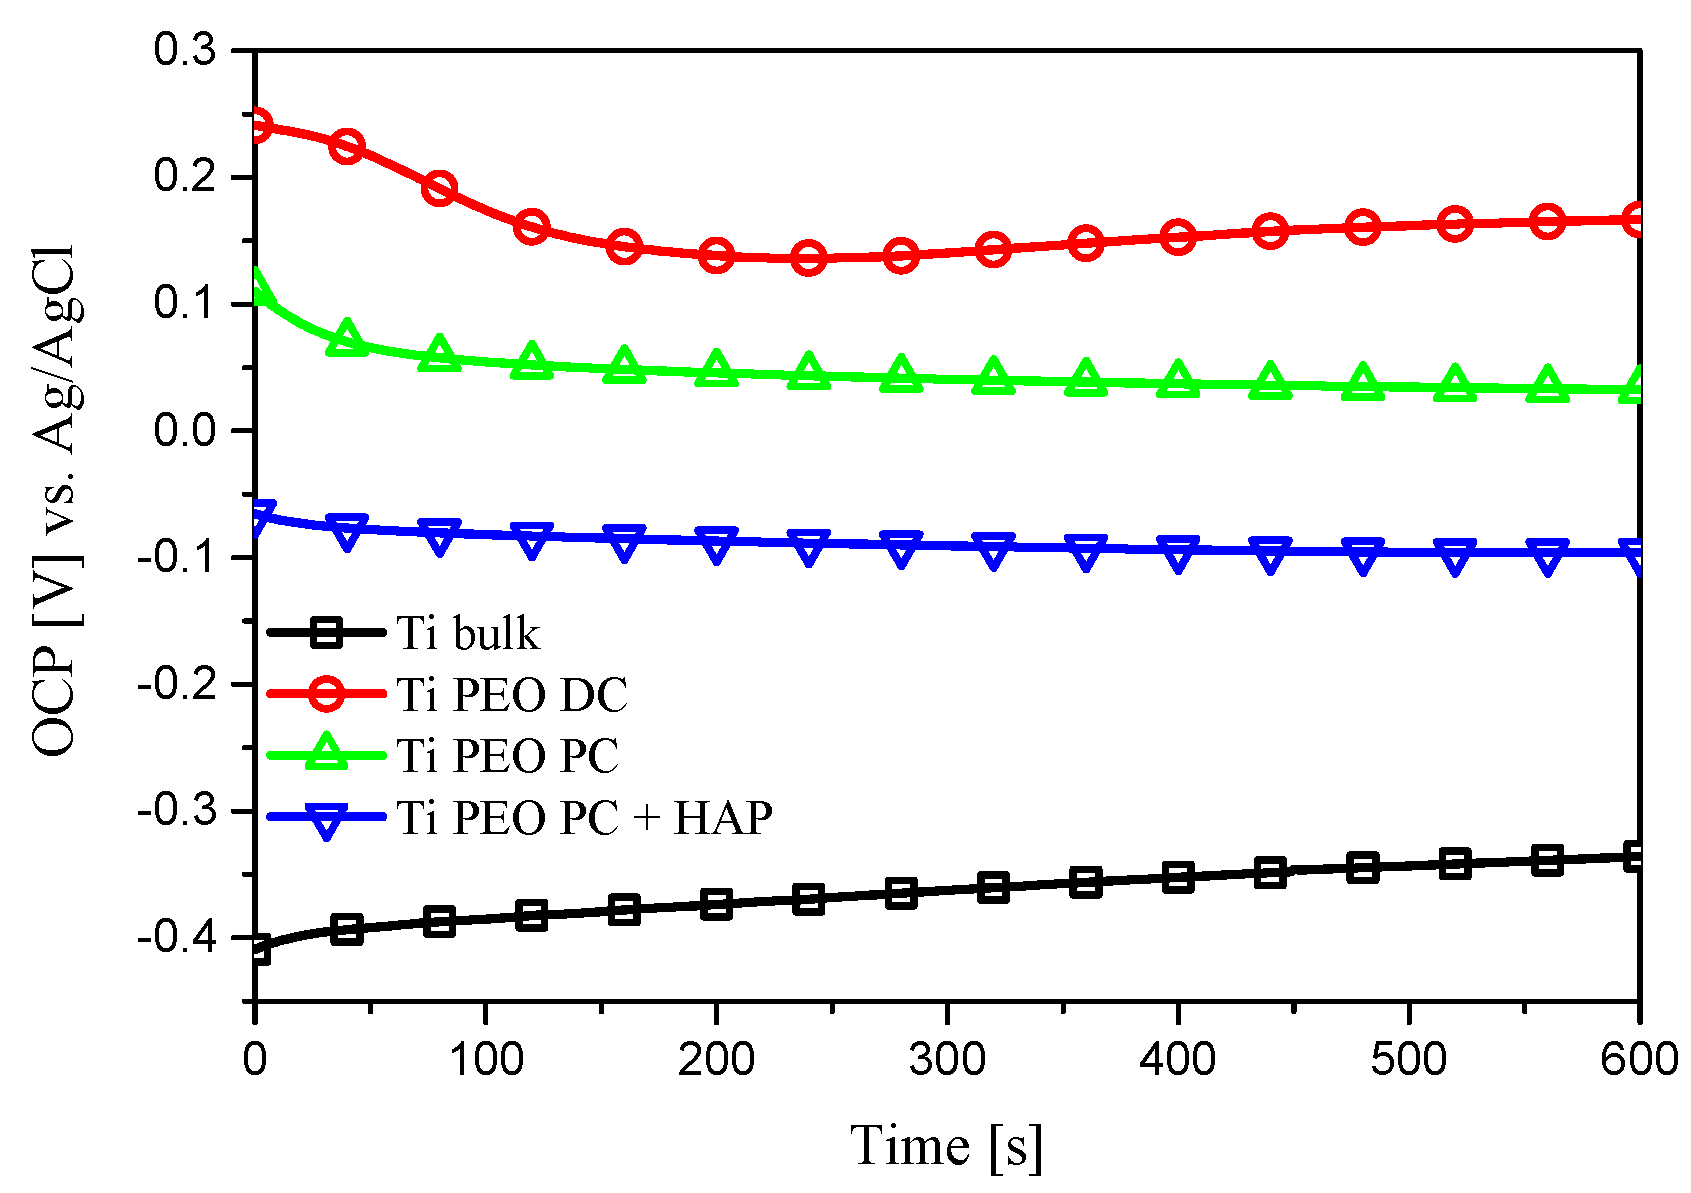
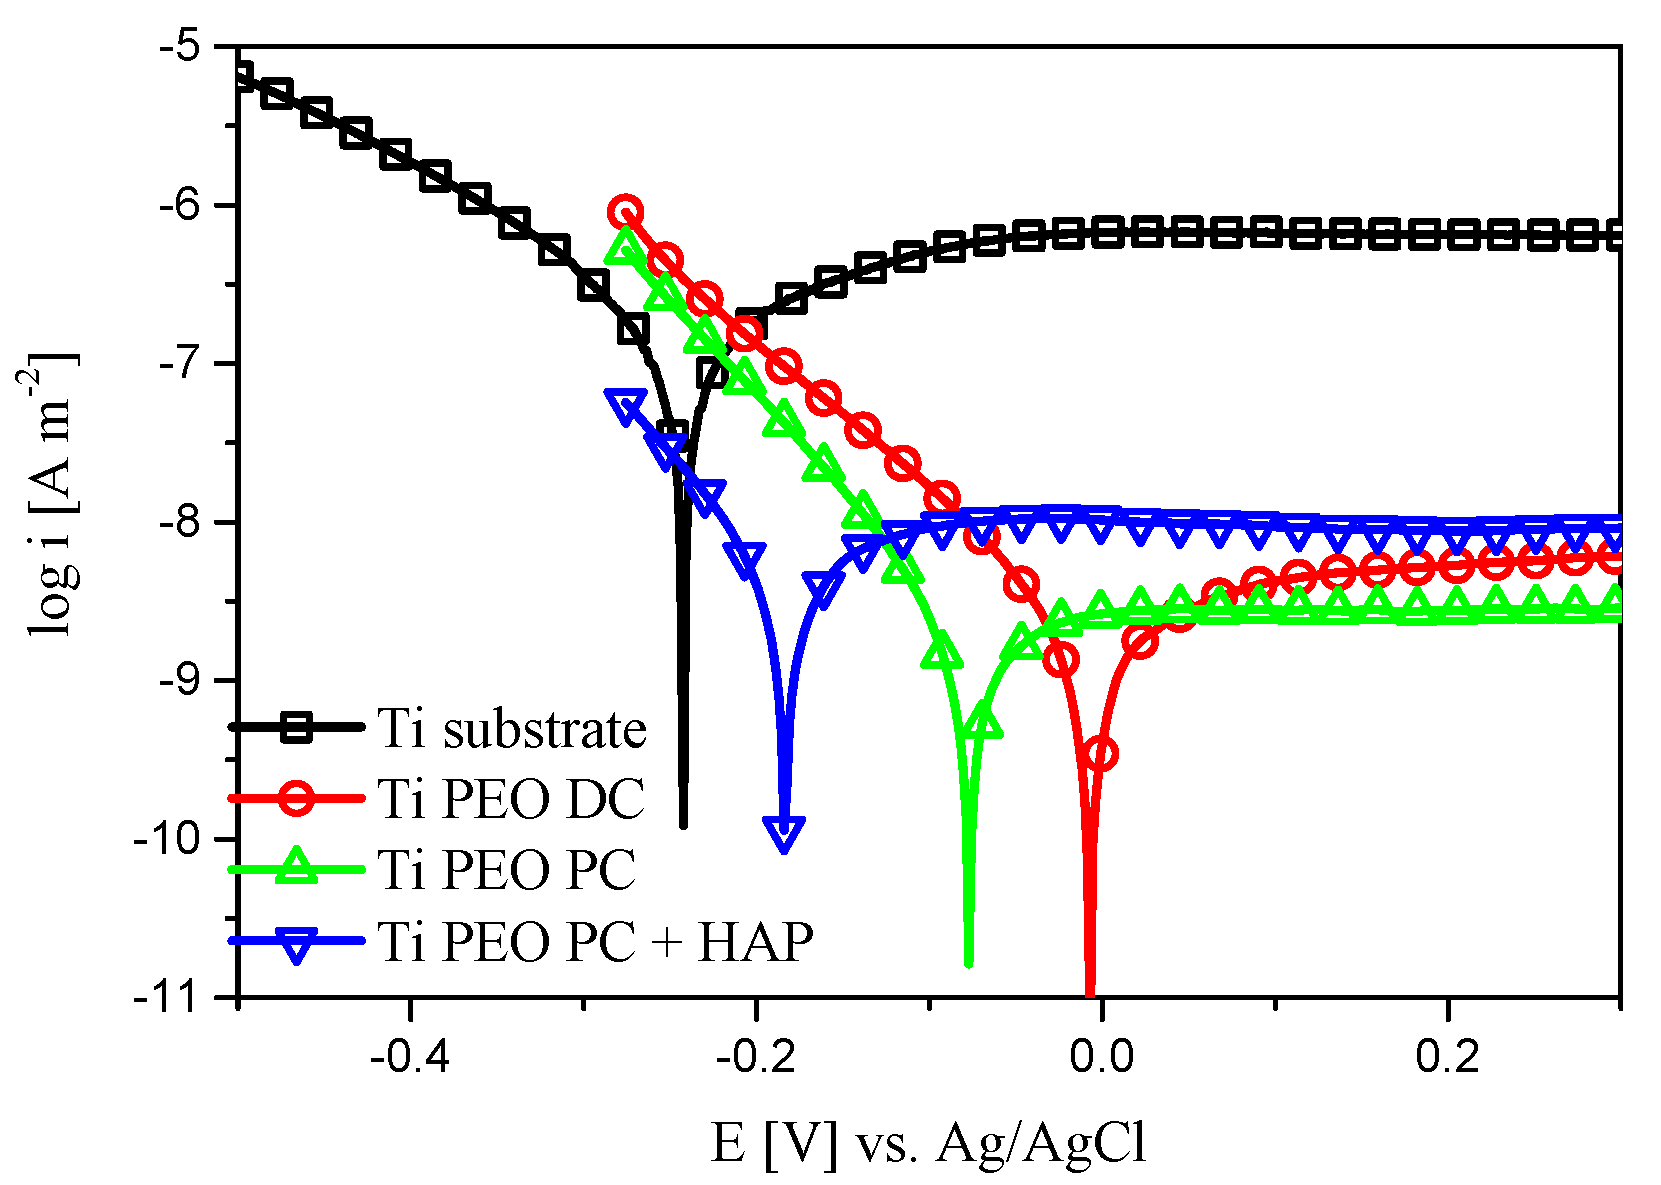
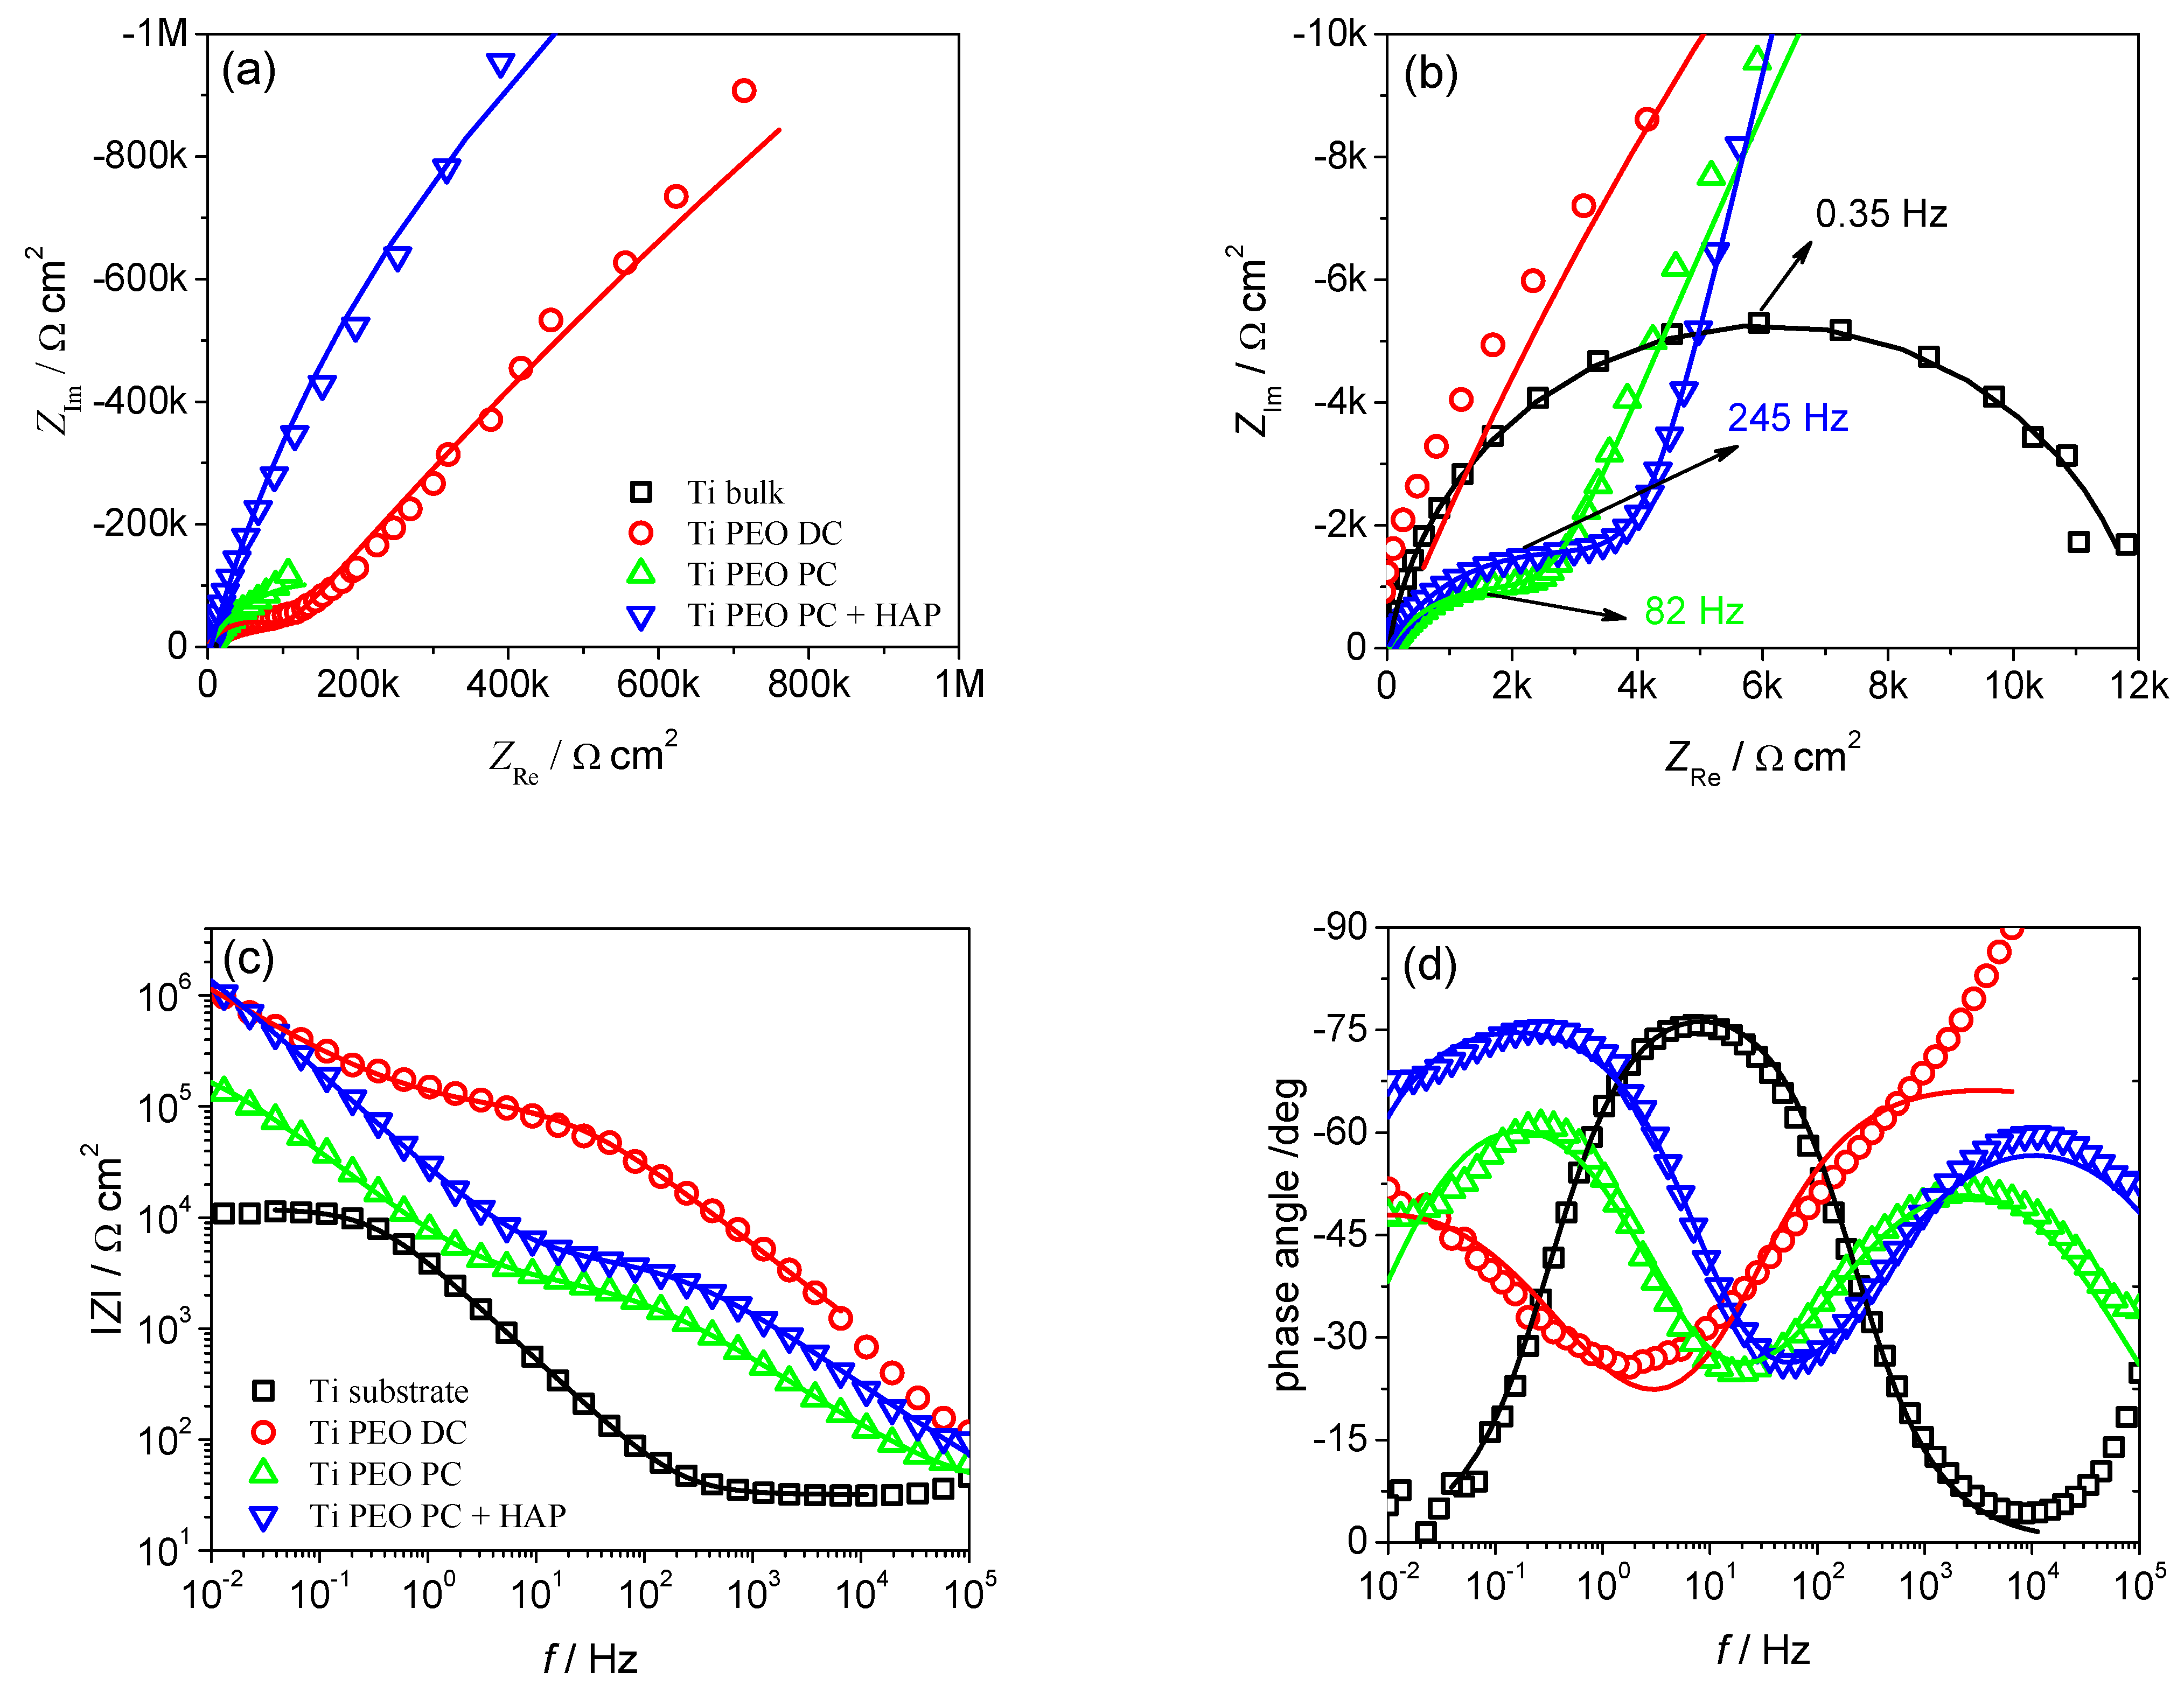
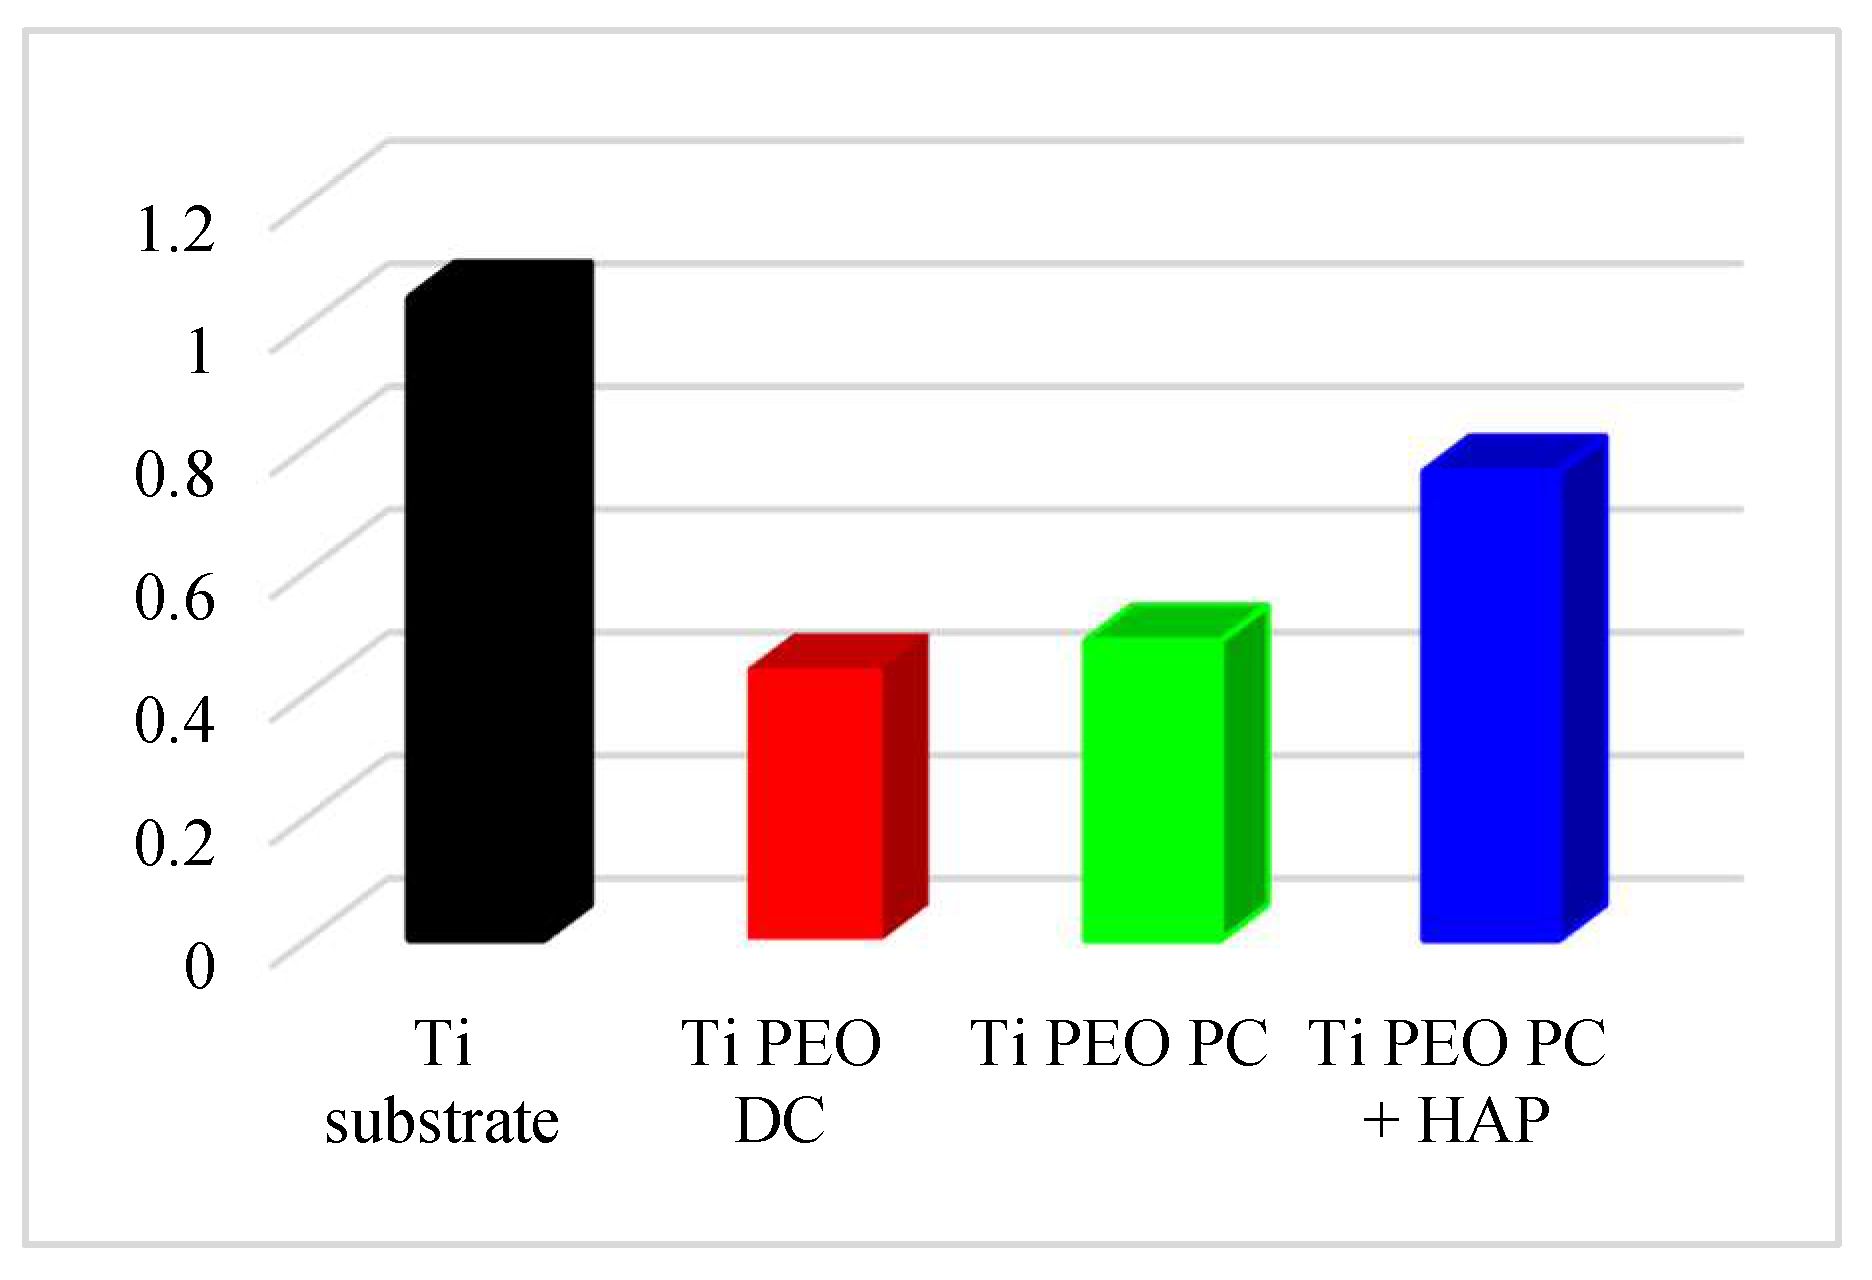
3.2. Corrosion Behavior
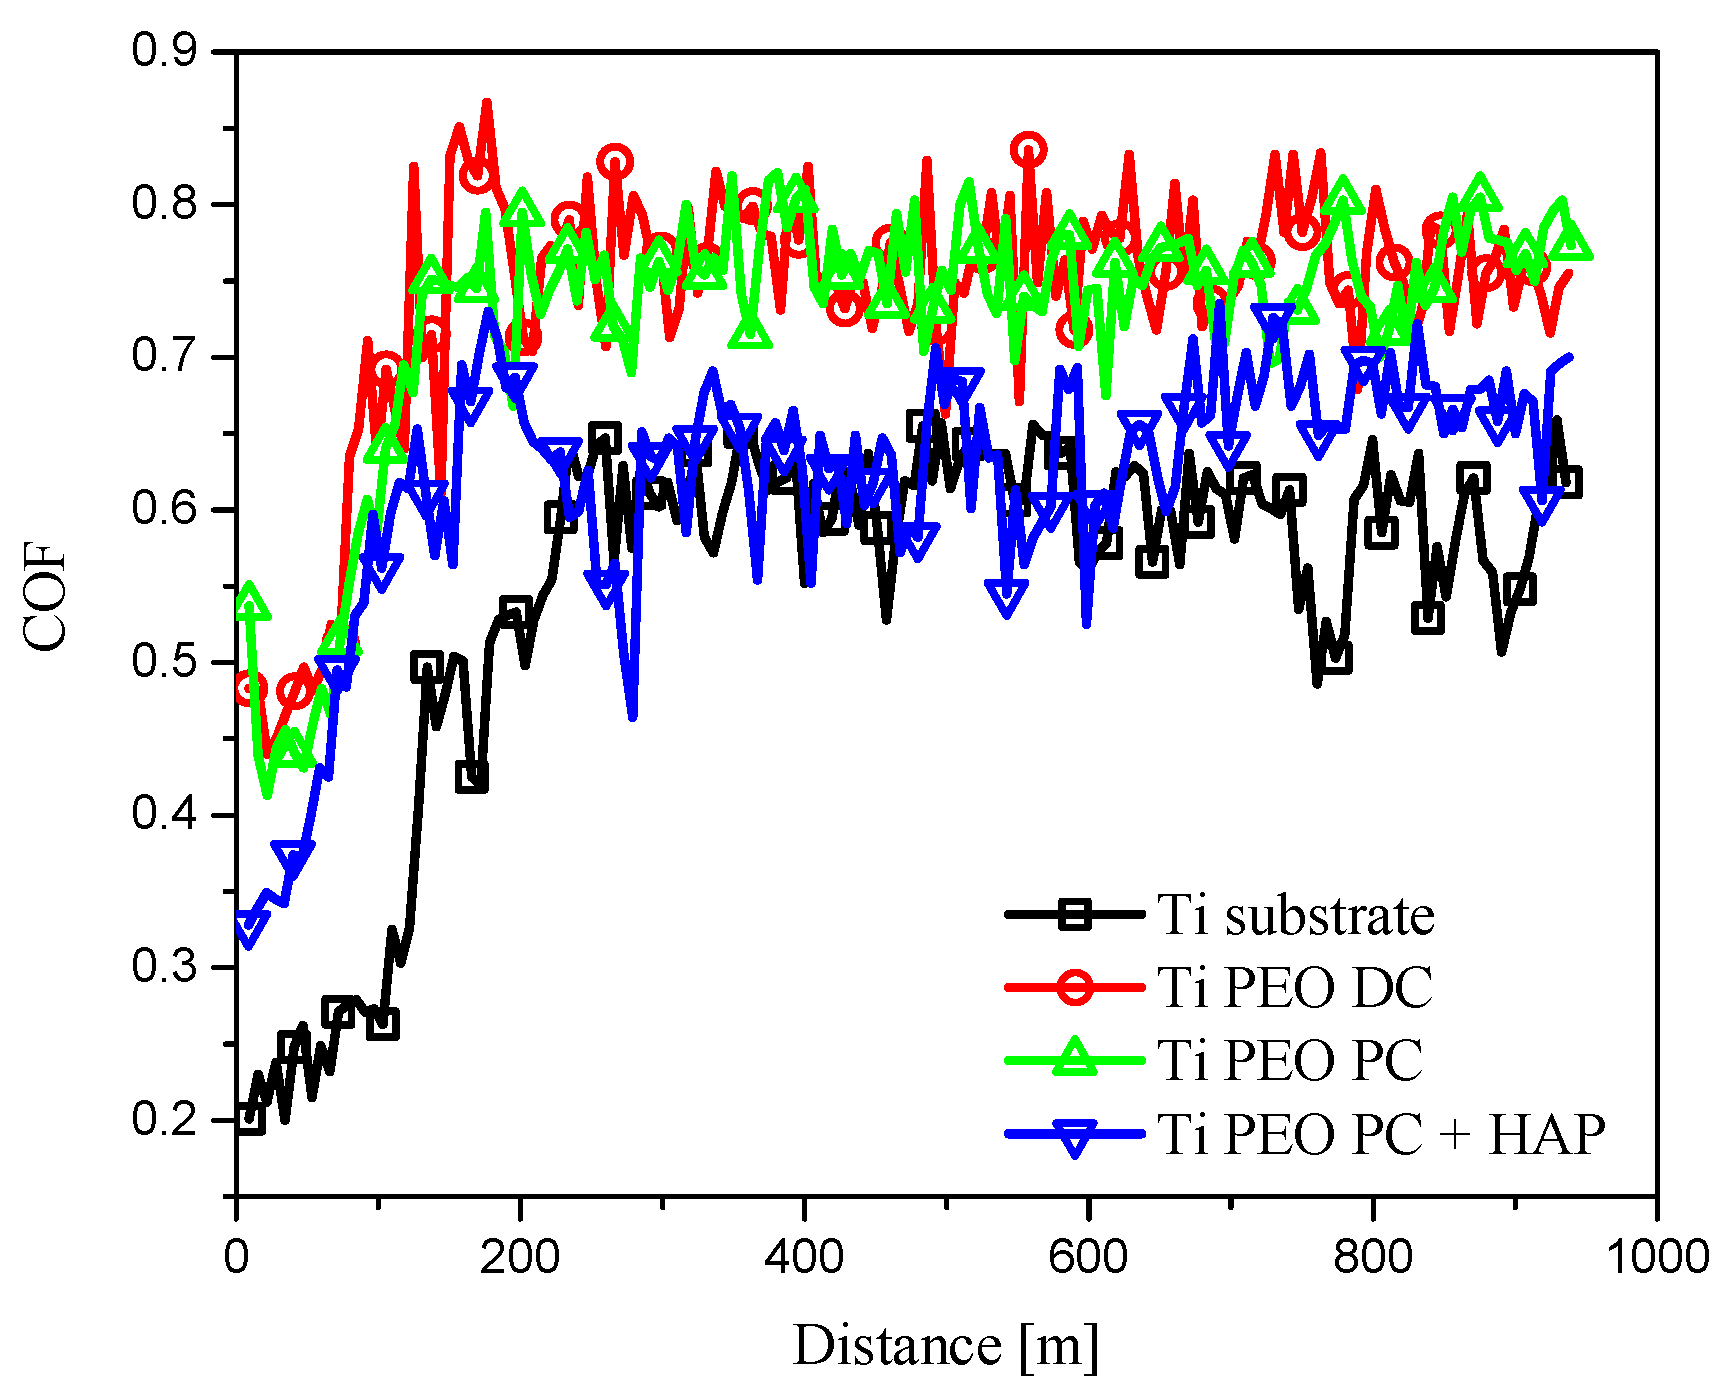
3.3. Sliding Wear Tests
4. Conclusions
Author Contributions
Funding
Institutional Review Board Statement
Informed Consent Statement
Data Availability Statement
Conflicts of Interest
References
- Mortazavi, G.; Jiang, J.; Meletis, E.I. Investigation of the plasma electrolytic oxidation mechanism of titanium. Appl. Surf. Sci. 2019, 488, 370–382. [Google Scholar] [CrossRef]
- Hartjen, P.; Hoffmann, A.; Henningsen, A.; Barbeck, M.; Kopp, A.; Kluwe, L.; Precht, C.; Quatela, O.; Gaudin, R.; Heiland, M.; et al. Plasma Electrolytic Oxidation of Titanium Implant Surfaces: Microgroove-Structures Improve Cellular Adhesion and Viability. In Vivo 2018, 32, 241–247. [Google Scholar] [CrossRef] [PubMed]
- Aliofkhazraei, M.; Macdonald, D.D.; Matykina, E.; Parfenov, E.; Egorkin, V.; Curran, J.; Troughton, S.; Sinebryukhov, S.; Gnedenkov, S.; Lampke, T.; et al. Review of plasma electrolytic oxidation of titanium substrate: Mechanism, properties, applications, and limitation. Appl. Surf. Sci. Adv. 2021, 5, 100121. [Google Scholar] [CrossRef]
- Aliasghari, S.; Skeldon, P.; Thompson, G.E. Plasma electrolytic oxidation of titanium in a phosphate/silicate electrolyte and tribological performance of the coatings. Appl. Surf. Sci. 2014, 316, 463–476. [Google Scholar] [CrossRef]
- Hou, F.; Gorthy, R.; Mardon, I.; Tang, D.; Goode, C. Low voltage environmentally friendly plasma electrolytic oxidation process for titanium alloys. Sci. Rep. 2022, 12, 6037. [Google Scholar] [CrossRef]
- Alves, S.A.; Bayon, R.; Igartua, A.; de Viteri, V.S.; Rocha, L.A. Tribocorrosion behaviour of anodic titanium oxide films produced by plasma electrolytic oxidation for dental implants. Lubr. Sci. 2013, 26, 500–513. [Google Scholar] [CrossRef]
- Molaei, M.; Nouri, M.; Babaei, K.; Fattah-Alhosseini, A. Improving surface features of PEO coatings on titanium and titanium alloys with zirconia particles: A review. Surf. Interfaces 2021, 22, 100888. [Google Scholar] [CrossRef]
- Garcia-Cabezon, C.; Rodriguez-Mendez, M.L.; Borras, V.A.; Raquel, B.; Cabello, J.C.R.; Fonseca, A.I.; Martin-Pedrosa, F. Application of Plasma Electrolytic Oxidation Coating on Powder Metallurgy Ti-6Al-4V for Dental Implants. Metals 2020, 10, 1167. [Google Scholar] [CrossRef]
- Molaei, M.; Fattah-Alhosseini, A.; Kashavarz, M.K. Influence of different sodium-based additives on corrosion resistance of PEO coatings on pure Ti. J. Asian Ceram. Soc. 2019, 7, 247–255. [Google Scholar] [CrossRef]
- Rokosz, K.; Hryniewicz, T.; Malorny, W. Characterization of coatings created on selected titanium alloys by plasma electrolytic oxidation. Adv. Mater. Sci. 2016, 16, 6–16. [Google Scholar] [CrossRef] [Green Version]
- Rokosz, K.; Hryniewicz, T.; Gaiaschi, S.; Chapon, P.; Raaen, S.; Dudek, Ł.; Pietrzak, K.; Malorny, W.; Ciuperca, R. Characterisation of porous coatings formed on titanium under AC plasma electrolytic oxidation. MATEC Web Conf. 2018, 178, 03008. [Google Scholar] [CrossRef]
- Sobolev, A.; Zinigrad, M.; Borodianskiy, K. Ceramic coating on Ti-6Al-4V by plasma electrolytic oxidation in molten salt: Development and characterization. Surf. Coat. Technol. 2021, 408, 126847. [Google Scholar] [CrossRef]
- Shokouhfar, M.; Dehghanian, C.; Montazeri, M.; Baradaran, A. Preparation of ceramic coating on Ti substrate by plasma electrolytic oxidation in different electrolytes and evaluation of its corrosion resistance: Part II. Appl. Surf. Sci. 2012, 258, 2416–2423. [Google Scholar] [CrossRef]
- Santos-Coquillat, A.; Martinez-Campos, E.; Mohedano, M.; Martínez-Corriá, R.; Ramos, V.; Arrabal, R.; Matykina, E. In vitro and in vivo evaluation of PEO-modified titanium for bone implant applications. Surf. Coat. Technol. 2018, 347, 358–368. [Google Scholar] [CrossRef]
- Cheng, Y.L.; Wu, X.C.; Xue, Z.G.; Matykina, E.; Skeldon, P.; Thompson, G. Microstructure, corrosion and wear performance of plasma electrolytic oxidation coatings formed on Ti–6Al–4V alloy in silicate-hexametaphosphate electrolyte. Surf. Coat. Technol. 2013, 217, 129–139. [Google Scholar] [CrossRef]
- Ahmadnia, S.; Aliasghari, S.; Ghorbani, M. Improved Electrochemical Performance of Plasma Electrolytic Oxidation coating on Titanium in Simulated Body Fluid. J. Mater. Eng. Perform. 2019, 28, 4120–4127. [Google Scholar] [CrossRef]
- Ulasevich, S.A.; Kulak, A.I.; Poznyak, S.K.; Karpushenkov, S.A.; Lisenkov, A.D.; Skorb, E.V. Deposition of hydroxyapatite-incorporated TiO2 coating on titanium using plasma electrolytic oxidation coupled with electrophoretic deposition. RSC Adv. 2016, 6, 62540. [Google Scholar] [CrossRef]
- Parfenov, E.; Parfenova, L.; Mukaeva, V.; Farrakhov, R.; Stotskiy, A.; Raab, A.; Danilko, K.; Rameshbabu, N.; Valiev, R. Biofunctionalization of PEO coatings on titanium implants with inorganic and organic substances. Surf. Coat. Technol. 2020, 404, 126486. [Google Scholar] [CrossRef]
- Zhu, L.; Petrova, R.S.; Gashinski, J.P.; Yang, Z. The effect of surface roughness on PEO-treated Ti-6Al-4V alloy and corrosion resistance. Surf. Coat. Technol. 2017, 325, 22–29. [Google Scholar] [CrossRef]
- He, T.; Cao, C.; Xu, Z.; Li, G.; Cao, H.; Liu, X.; Zhang, C.; Dong, Y. A comparison of micro-CT and histomorphometry of PEO-coated titanium implants in a rat model. Sci. Rep. 2017, 7, 16270. [Google Scholar] [CrossRef] [Green Version]
- Frutuoso, F.G.d.O.; Vitoriano, J.D.O.; Alves, C. Controlling plasma electrolytic oxidation of titanium using current pulses compatible with the duration of microdischarges. Results Mater. 2022, 15, 100310. [Google Scholar] [CrossRef]
- Bertuccioli, C.; Garzone, A.; Martini, C.; Morri, A.; Rondelli, G. Plasma Electrolytic Oxidation (PEO) Layers from Silicate/Phosphate Baths on Ti-6Al-4V for Biomedical Components: Influence of Deposition Conditions and Surface Finishing on Dry Sliding Behaviour. Materials 2019, 9, 614. [Google Scholar] [CrossRef]
- Mashtalyar, D.V.; Nadaraia, K.V.; Gnedenkov, A.S.; Imshinetskiy, I.M.; Piatkova, M.A.; Pleshkova, A.I.; Belov, E.A.; Filonina, V.S.; Suchkov, S.N.; Sinebryukhov, S.L.; et al. Bioactive Coatings Formed on Titanium by Plasma Electrolytic Oxidation: Composition and Properties. Materials 2020, 13, 4121. [Google Scholar] [CrossRef]
- Friedemann, A.E.R.; Gesing, T.M.; Plagemann, P. Electrochemical rutile and anatase formation on PEO surfaces. Surf. Coat. Technol. 2017, 315, 139–149. [Google Scholar] [CrossRef]
- Sobolev, A.; Kossenko, A.; Borodianskiy, K. Study of the Effect of Current Pulse Frequency on Ti-6Al-4V Alloy Coating Formation by Micro Arc Oxidation. Materials 2019, 12, 3983. [Google Scholar] [CrossRef] [PubMed]
- Kostelac, L.; Pezzato, L.; Settimi, A.G.; Franceschi, M.; Gennari, C.; Brunelli, K.; Rampazzo, C.; Dabalà, M. Investigation of hydroxyapatite (HAP) containing coating on grade 2 titanium alloy prepared by plasma electrolytic oxidation (PEO) at low voltage. Surf. Interfaces 2022, 30, 101888. [Google Scholar] [CrossRef]
- Avila, J.D.; Stenberg, K.; Bose, S.; Bandyopadhyay, A. Hydroxyapatite reinforced Ti6A4V composites for load-bearing implants. Acta Biomater. 2021, 123, 379–392. [Google Scholar] [CrossRef]


| Sample | Treatment Conditions | ||||
|---|---|---|---|---|---|
| Current Density, i [mA cm−2] | Voltage, [V] | Total Time, [s] | d.c., [%] | HAP Deposition | |
| Ti PEO DC | 10 | max 240 | 600 | - | - |
| Ti PEO PC | 1250 | 20 | - | ||
| Ti PEO PC + HAP | 1250 | 20 | 600 s at 150 V | ||
| Sample | icorr, [A cm−2] | Ecorr, [V] vs. Ag/AgCl | Corr. Rate [mm Year−1] |
|---|---|---|---|
| Ti substrate | 687 × 10−10 | −0.242 | 598 × 10−6 |
| Ti PEO DC | 3.30 × 10⁻¹⁰ | −0.007 | 2.87 × 10⁻⁶ |
| Ti PEO PC | 3.64 × 10⁻¹⁰ | −0.077 | 3.17 × 10⁻⁶ |
| Ti PEO PC + HAP | 10.1 × 10⁻¹⁰ | −0.187 | 8.77 × 10⁻⁶ |
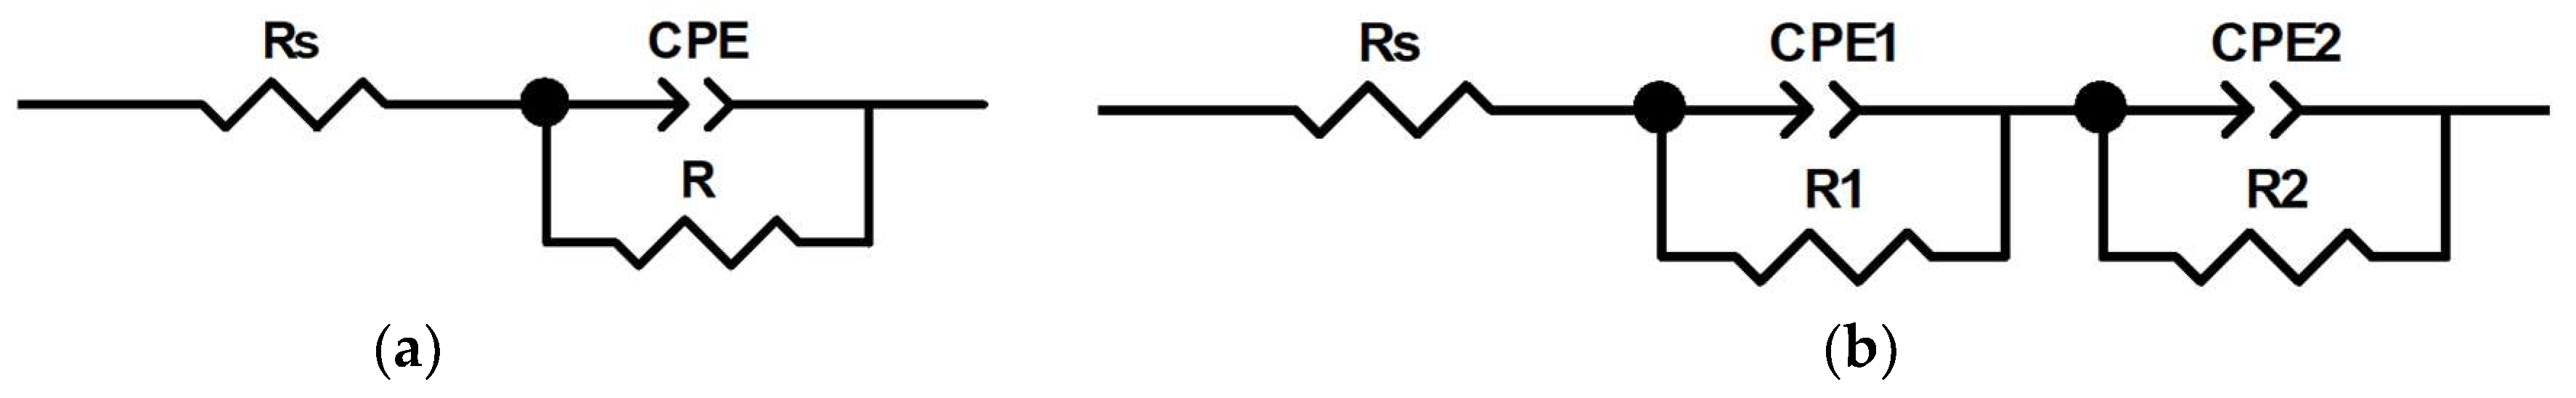
| Parameter | Ti Substrate | Ti PEO DC | Ti PEO PC | Ti PEO PC + HAP |
|---|---|---|---|---|
| RS/Ω | 31.8 (0.7%) | 20.6 (0.7%) | 32.6 (1.5%) | 30.6 (2.7%) |
| CPE-T1/F cm−2 sn−1 | - | 4.18 × 10⁻⁷ (3.7%) | 5.20 × 10⁻⁶ (7.03%) | 1.41 × 10⁻⁶ (7.3%) |
| n1 | - | 0.69 (1.4%) | 0.67 (1.1%) | 0.70 (1.0%) |
| R1/Ω cm2 | - | 11.6 × 10⁴ (6.9%) | 0.25 × 10⁴ (3.1%) | 0.40 × 10⁴ (2.4%) |
| CPE-T2/F cm−2 sn−1 | 4.35 × 10⁻⁵ (1.0%) | 5.42 × 10⁻⁶ (4.9%) | 3.54 × 10⁻⁵ (1.2%) | 7.30 × 10⁻⁶ (1.0%) |
| n2 | 0.91 (0.2%) | 0.66 (5.6%) | 0.78 (1.0%) | 0.86 (0.5%) |
| R2/Ω cm2 | 1.2 × 10⁴ (0.9%) | 8.14 × 10⁶ (88%) | 0.29 × 10⁶ (5.7%) | 5.02 × 10⁶ (11.5%) |
| χ2 | 2.5 × 10⁻³ | 1.9 × 10⁻² | 4.5 × 10⁻³ | 5.1 × 10⁻³ |
Disclaimer/Publisher’s Note: The statements, opinions and data contained in all publications are solely those of the individual author(s) and contributor(s) and not of MDPI and/or the editor(s). MDPI and/or the editor(s) disclaim responsibility for any injury to people or property resulting from any ideas, methods, instructions or products referred to in the content. |
© 2023 by the authors. Licensee MDPI, Basel, Switzerland. This article is an open access article distributed under the terms and conditions of the Creative Commons Attribution (CC BY) license (https://creativecommons.org/licenses/by/4.0/).
Share and Cite
Muntean, R.; Brîndușoiu, M.; Buzdugan, D.; Nemeș, N.S.; Kellenberger, A.; Uțu, I.D. Characteristics of Hydroxyapatite-Modified Coatings Based on TiO2 Obtained by Plasma Electrolytic Oxidation and Electrophoretic Deposition. Materials 2023, 16, 1410. https://doi.org/10.3390/ma16041410
Muntean R, Brîndușoiu M, Buzdugan D, Nemeș NS, Kellenberger A, Uțu ID. Characteristics of Hydroxyapatite-Modified Coatings Based on TiO2 Obtained by Plasma Electrolytic Oxidation and Electrophoretic Deposition. Materials. 2023; 16(4):1410. https://doi.org/10.3390/ma16041410
Chicago/Turabian StyleMuntean, Roxana, Mihai Brîndușoiu, Dragoș Buzdugan, Nicoleta Sorina Nemeș, Andrea Kellenberger, and Ion Dragoș Uțu. 2023. "Characteristics of Hydroxyapatite-Modified Coatings Based on TiO2 Obtained by Plasma Electrolytic Oxidation and Electrophoretic Deposition" Materials 16, no. 4: 1410. https://doi.org/10.3390/ma16041410