
Improving the Thermal Stability of the Fine-Grained Structure in the Cu-15Ni-8Sn Alloy during Solution Treatment by the Additions of Si and Ti
 ,
,
Abstract
:1. Introduction
2. Materials and Methods
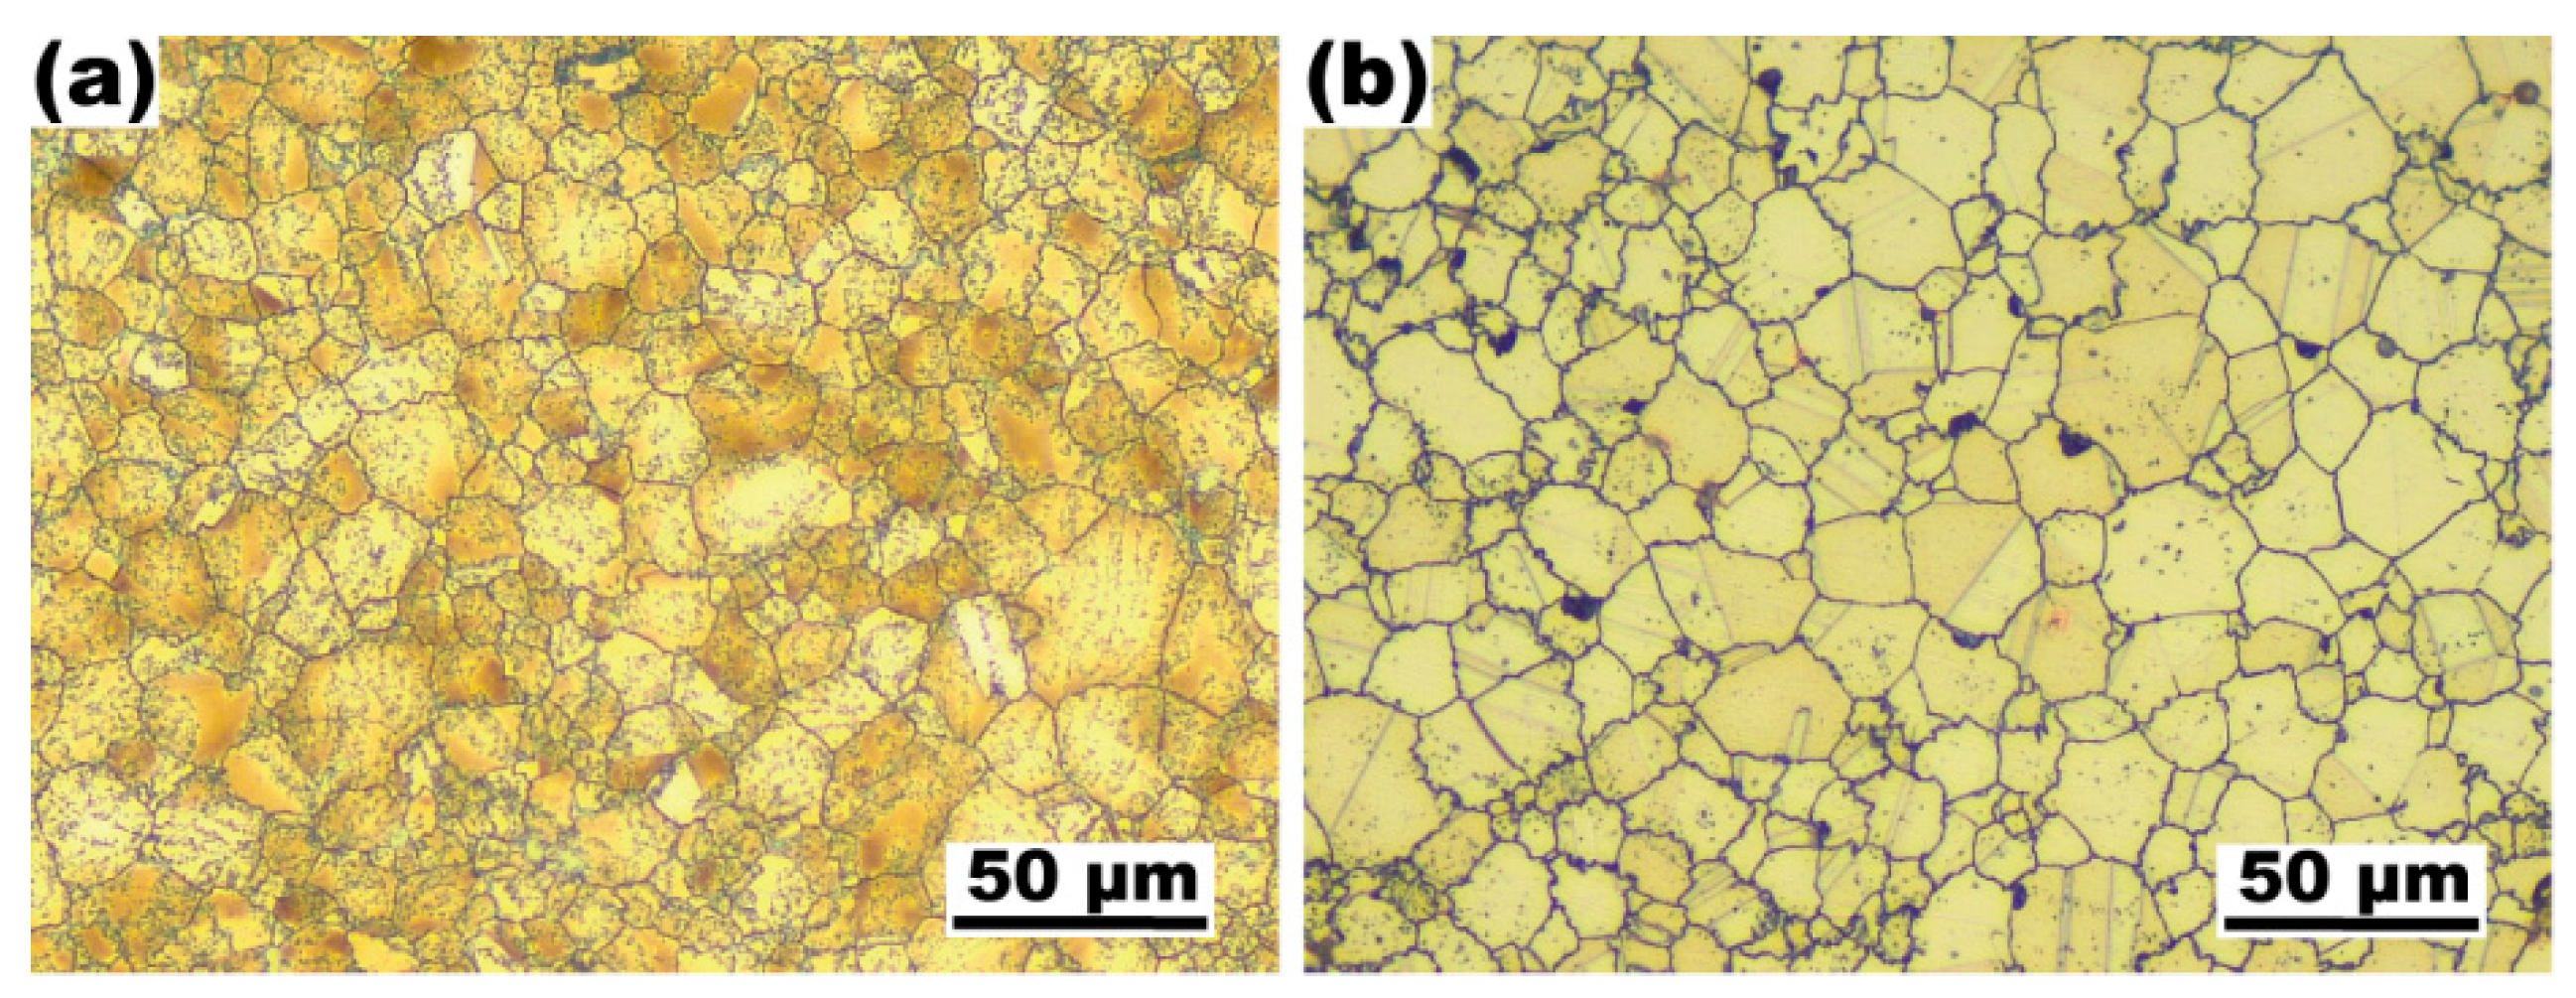
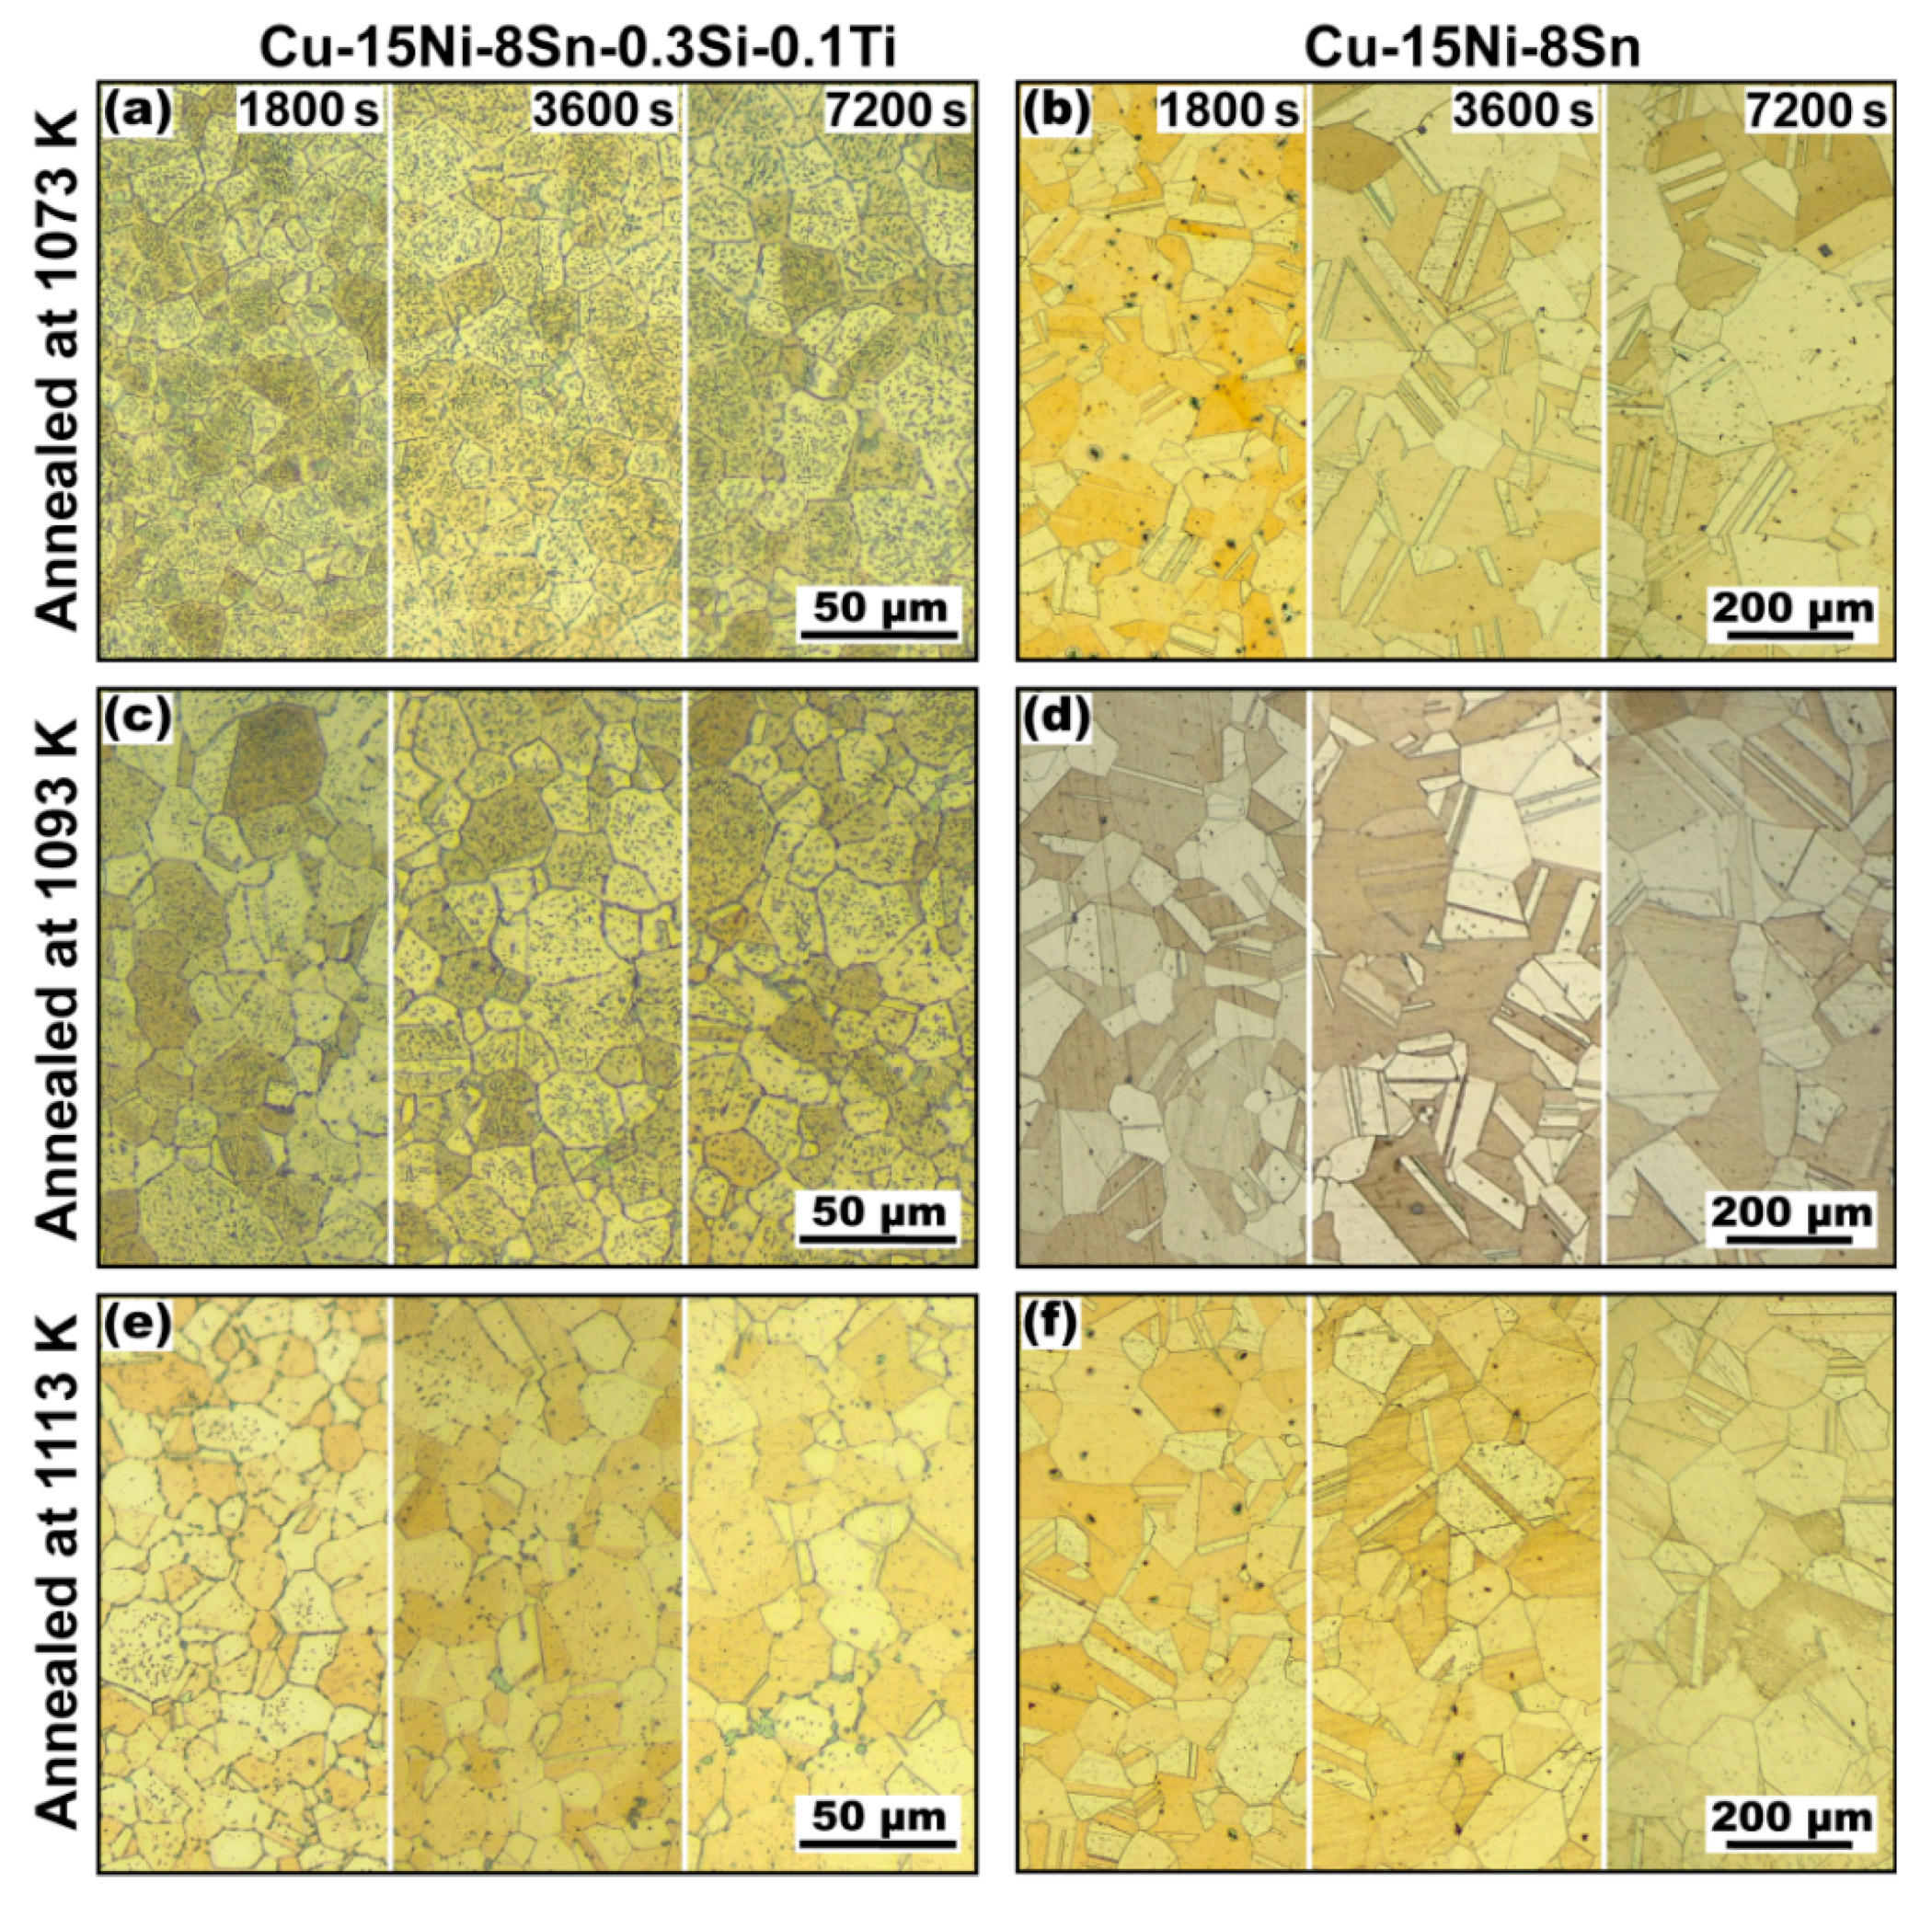
3. Results
4. Discussion
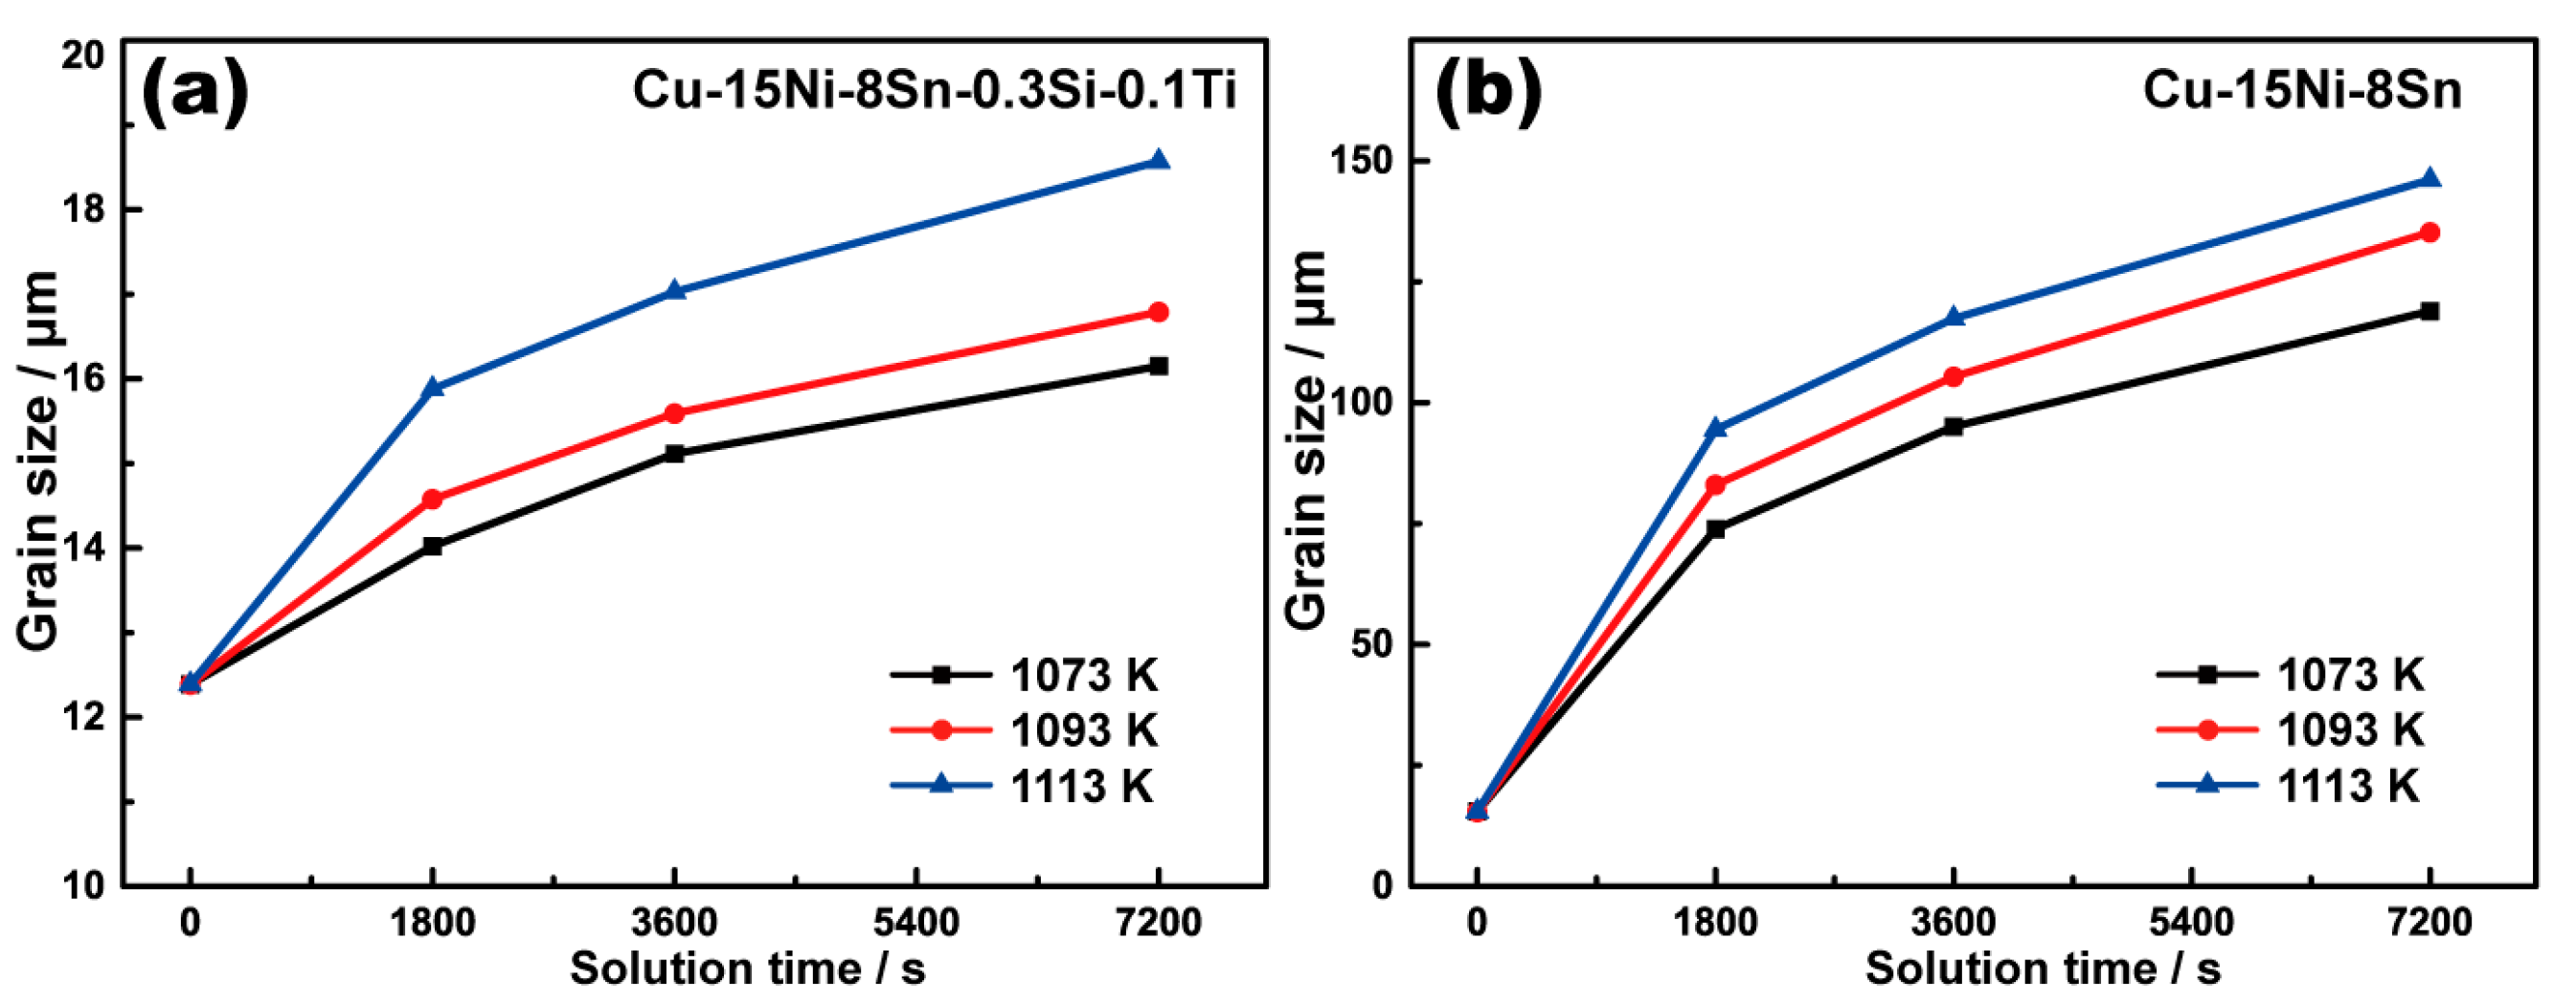
4.1. Kinetics of Grain Growth of the Alloys with and without Additions
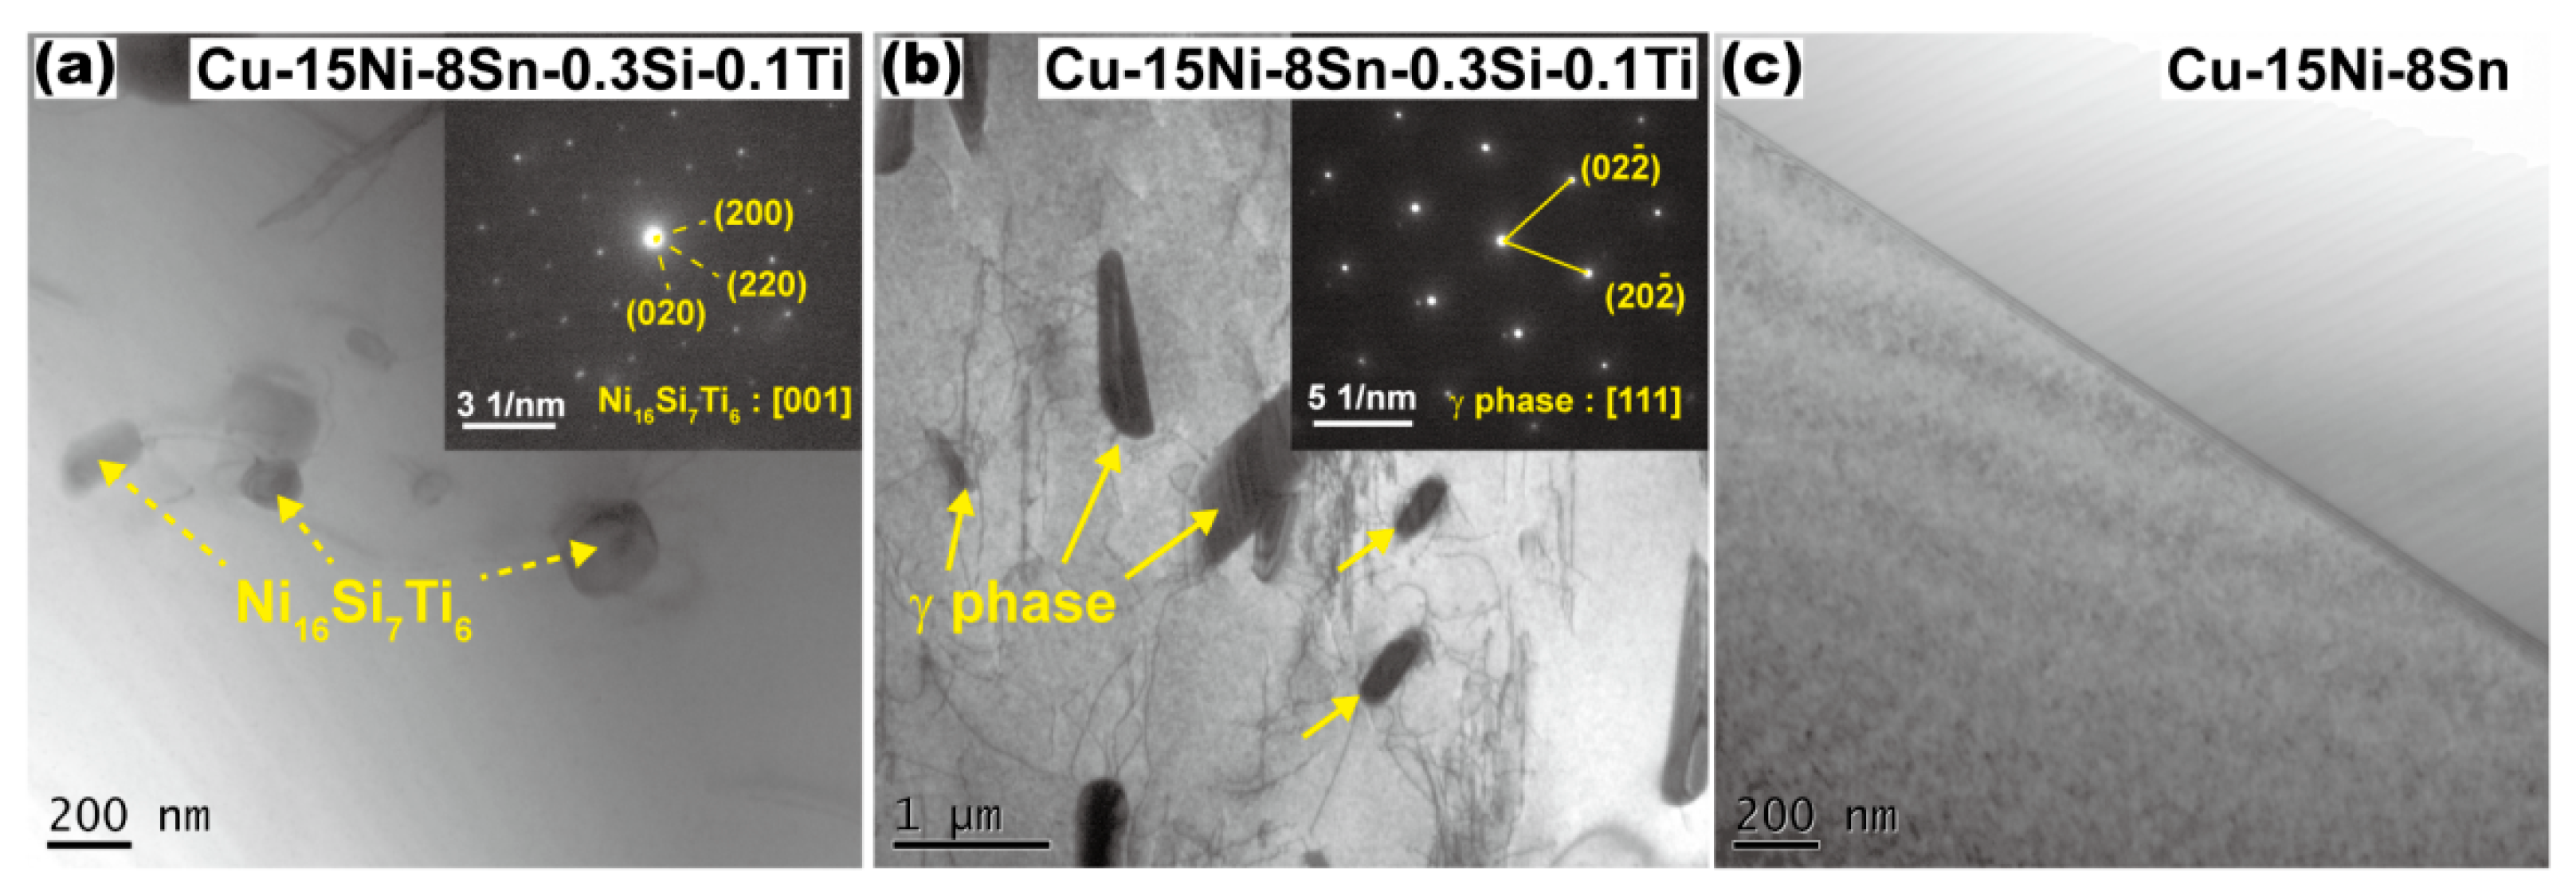
4.2. Effects of the Additions of Trace Elements on the Grain Growth
5. Conclusions
Author Contributions
Funding
Institutional Review Board Statement
Informed Consent Statement
Data Availability Statement
Conflicts of Interest
References
- Cribb, W.R. Copper spinodal alloys for aerospace. Adv. Mater. Process. 2006, 6, 44. [Google Scholar]
- Li, D.X.; Wang, Z.; Zhao, C.; Luo, Z.Q.; Yang, C.; Zhang, W.W. Comprehensive characterisation of tribo-layer in a Cu-15Ni-8Sn alloy during dry sliding wear. Mater. Sci. Technol. 2022, 38, 57–68. [Google Scholar] [CrossRef]
- Zhang, K.; Zhang, L.M.; Shu, C.L.; Fan, W.X.; Li, S.; Yuan, X.; Zhao, J.; Wang, Y.; Wang, P. Effect of different Mo addition on microstructure and mechanical properties of Cu-15Ni-8Sn alloy. Materials 2022, 15, 5521. [Google Scholar] [CrossRef] [PubMed]
- Zhao, C.; Wang, Z.; Li, D.X.; Kollo, L.; Luo, Z.Q.; Zhang, W.W.; Prashanth, G.K. Selective laser melting of Cu-Ni-Sn: A comprehensive study on the microstructure, mechanical properties, and deformation behavior. Int. J. Plast. 2021, 138, 102926. [Google Scholar] [CrossRef]
- Johnsen, R.; Lange, T.; Stenerud, G.; Olsen, J.S. Environmentally assisted degradation of spinodal copper alloy C72900. Corros. Sci. 2018, 142, 45–55. [Google Scholar] [CrossRef]
- Plewes, J.T. High-strength Cu-Ni-Sn alloys by thermomechanical processing. Metall. Mater. Trans. A 1975, 6A, 537–544. [Google Scholar] [CrossRef]
- Zhao, C.; Wang, Z.; Li, D.X.; Pan, D.Q.; Lou, B.M.; Luo, Z.Q.; Zhang, W.W. Optimization of strength and ductility in an as-extruded Cu-15Ni-8Sn alloy by the additions of Si and Ti. J. Alloys Comp. 2020, 823, 153759. [Google Scholar] [CrossRef]
- Zhao, C.; Wang, Z.; Pan, D.Q.; Li, D.X.; Luo, Z.Q.; Zhang, D.T.; Yang, C.; Zhang, W.W. Effect of Si and Ti on dynamic recrystallization of high-performance Cu-15Ni-8Sn alloy during hot deformation. Trans. Nonferrous Met. Soc. China 2019, 29, 2556–2565. [Google Scholar] [CrossRef]
- Niu, D.X.; Zhao, C.; Li, D.X.; Wang, Z.; Luo, Z.Q.; Zhang, W.W. Constitutive modeling of the flow stress behavior for the hot deformation of Cu-15Ni-8Sn alloys. Front. Mater. 2020, 7, 577867. [Google Scholar] [CrossRef]
- Cribb, W.R.; Ratka, J.O. Copper spinodal alloys. Adv. Mater. Process. 2002, 12, 1–4. [Google Scholar]
- Zhao, J.C.; Notis, M.R. Spinodal decomposition, ordering transformation, and discontinuous precipitation in a Cu-15Ni-8Sn alloy. Acta Mater. 1998, 42, 4203–4218. [Google Scholar] [CrossRef]
- Zhao, C.; Zhang, W.W.; Wang, Z.; Li, D.X.; Luo, Z.Q.; Yang, C.; Zhang, D.T. Improving the mechanical properties of Cu-15Ni-8Sn alloys by addition of Titanium. Materials 2017, 10, 1038. [Google Scholar] [CrossRef] [Green Version]
- Hoseini-Athar, M.M.; Mahmudi, R.; Babu, R.P.; Hedströmb, P. Effect of Zn content on the microstructural stability and grain growth kinetics of fine-grained extruded Mg-Gd-Zn alloys. J. Alloys Comp. 2020, 831, 154766. [Google Scholar] [CrossRef]
- Klimova, M.V.; Shaysultanov, D.G.; Zherebtsov, S.V.; Stepanov, N.D. Effect of second phase particles on mechanical properties and grain growth in a CoCrFeMnNi high entropy alloy. Mat. Sci. Eng. A 2019, 748, 228–235. [Google Scholar] [CrossRef]
- Qian, X.Y.; Zeng, Y.; Jiang, B.; Yang, Q.R.; Wan, Y.J.; Quan, G.F.; Pan, F.S. Grain refinement mechanism and improved mechanical properties in Mg-Sn alloy with trace Y addition. J. Alloys Comp. 2020, 820, 153122. [Google Scholar] [CrossRef]
- Xing, Q.Y.; Wu, X.H.; Zang, J.X.; Meng, L.G.; Zhang, X.G. Effect of Er on microstructure and corrosion behavior of Al-Zn-Mg-Cu-Sc-Zr aluminum alloys. Materials 2022, 15, 1040. [Google Scholar] [CrossRef]
- Li, D.X.; Wang, Z.; Zhao, C.; Luo, Z.Q.; Zhang, W.W. The role of the transfer layer on the sliding wear behaviour of a Cu-15Ni-8Sn alloy under different loads. Tribol. Lett. 2022, 70, 9. [Google Scholar] [CrossRef]
- Vaidya, M.; Anupam, A.; Bharadwaj, J.V.; Srivastava, C.; Murty, B.S. Grain growth kinetics in CoCrFeNi and CoCrFeMnNi high entropy alloys processed by spark plasma sintering. J. Alloys Comp. 2019, 791, 1114–1121. [Google Scholar] [CrossRef]
- Liu, W.H.; Wu, Y.; He, J.Y.; Nieh, T.G.; Lu, Z.P. Grain growth and the Hall-Petch relationship in a high-entropy FeCrNiCoMn alloy. Scr. Mater. 2013, 68, 526–529. [Google Scholar] [CrossRef]
- Burke, J.E.; Turnbull, D. Recrystallization and grain growth. Prog. Met. Phys. 1952, 3, 220–292. [Google Scholar] [CrossRef]
- Fan, D.; Chen, L.Q. Diffusion-controlled grain growth in two-phase solids. Acta Metall. 1997, 45, 3297–3310. [Google Scholar] [CrossRef]
- Gerhard, N.; Cornelis, T. Self-diffusion and impurity diffusion in Group I metals. Pergamon Mater. Ser. 2008, 14, 37–97. [Google Scholar]
- Guo, F.; Pei, R.S.; Jiang, L.Y.; Zhang, D.F.; Korte-Kerzel, S.; Al-Samman, T. The role of recrystallization and grain growth in optimizing the sheet texture of magnesium alloys with calcium addition during annealing. J. Magnes. Alloy. 2020, 8, 252–268. [Google Scholar] [CrossRef]
- Miki, M.; Ogino, Y. Influence of Solution-Treatment Conditions on the Cellular Precipitation in Si-doped Cu-10Ni-8Sn alloy. Mater. Trans. 1991, 32, 1135–1140. [Google Scholar] [CrossRef] [Green Version]


| Alloy Designation | Ni | Sn | Si | Ti | Cu |
|---|---|---|---|---|---|
| Cu-15Ni-8Sn (based alloy) | 15.03 | 8.12 | - | - | bal. |
| Cu-15Ni-8Sn-0.3Si-0.1Ti (modified alloy) | 15.23 | 7.92 | 0.29 | 0.09 | bal. |
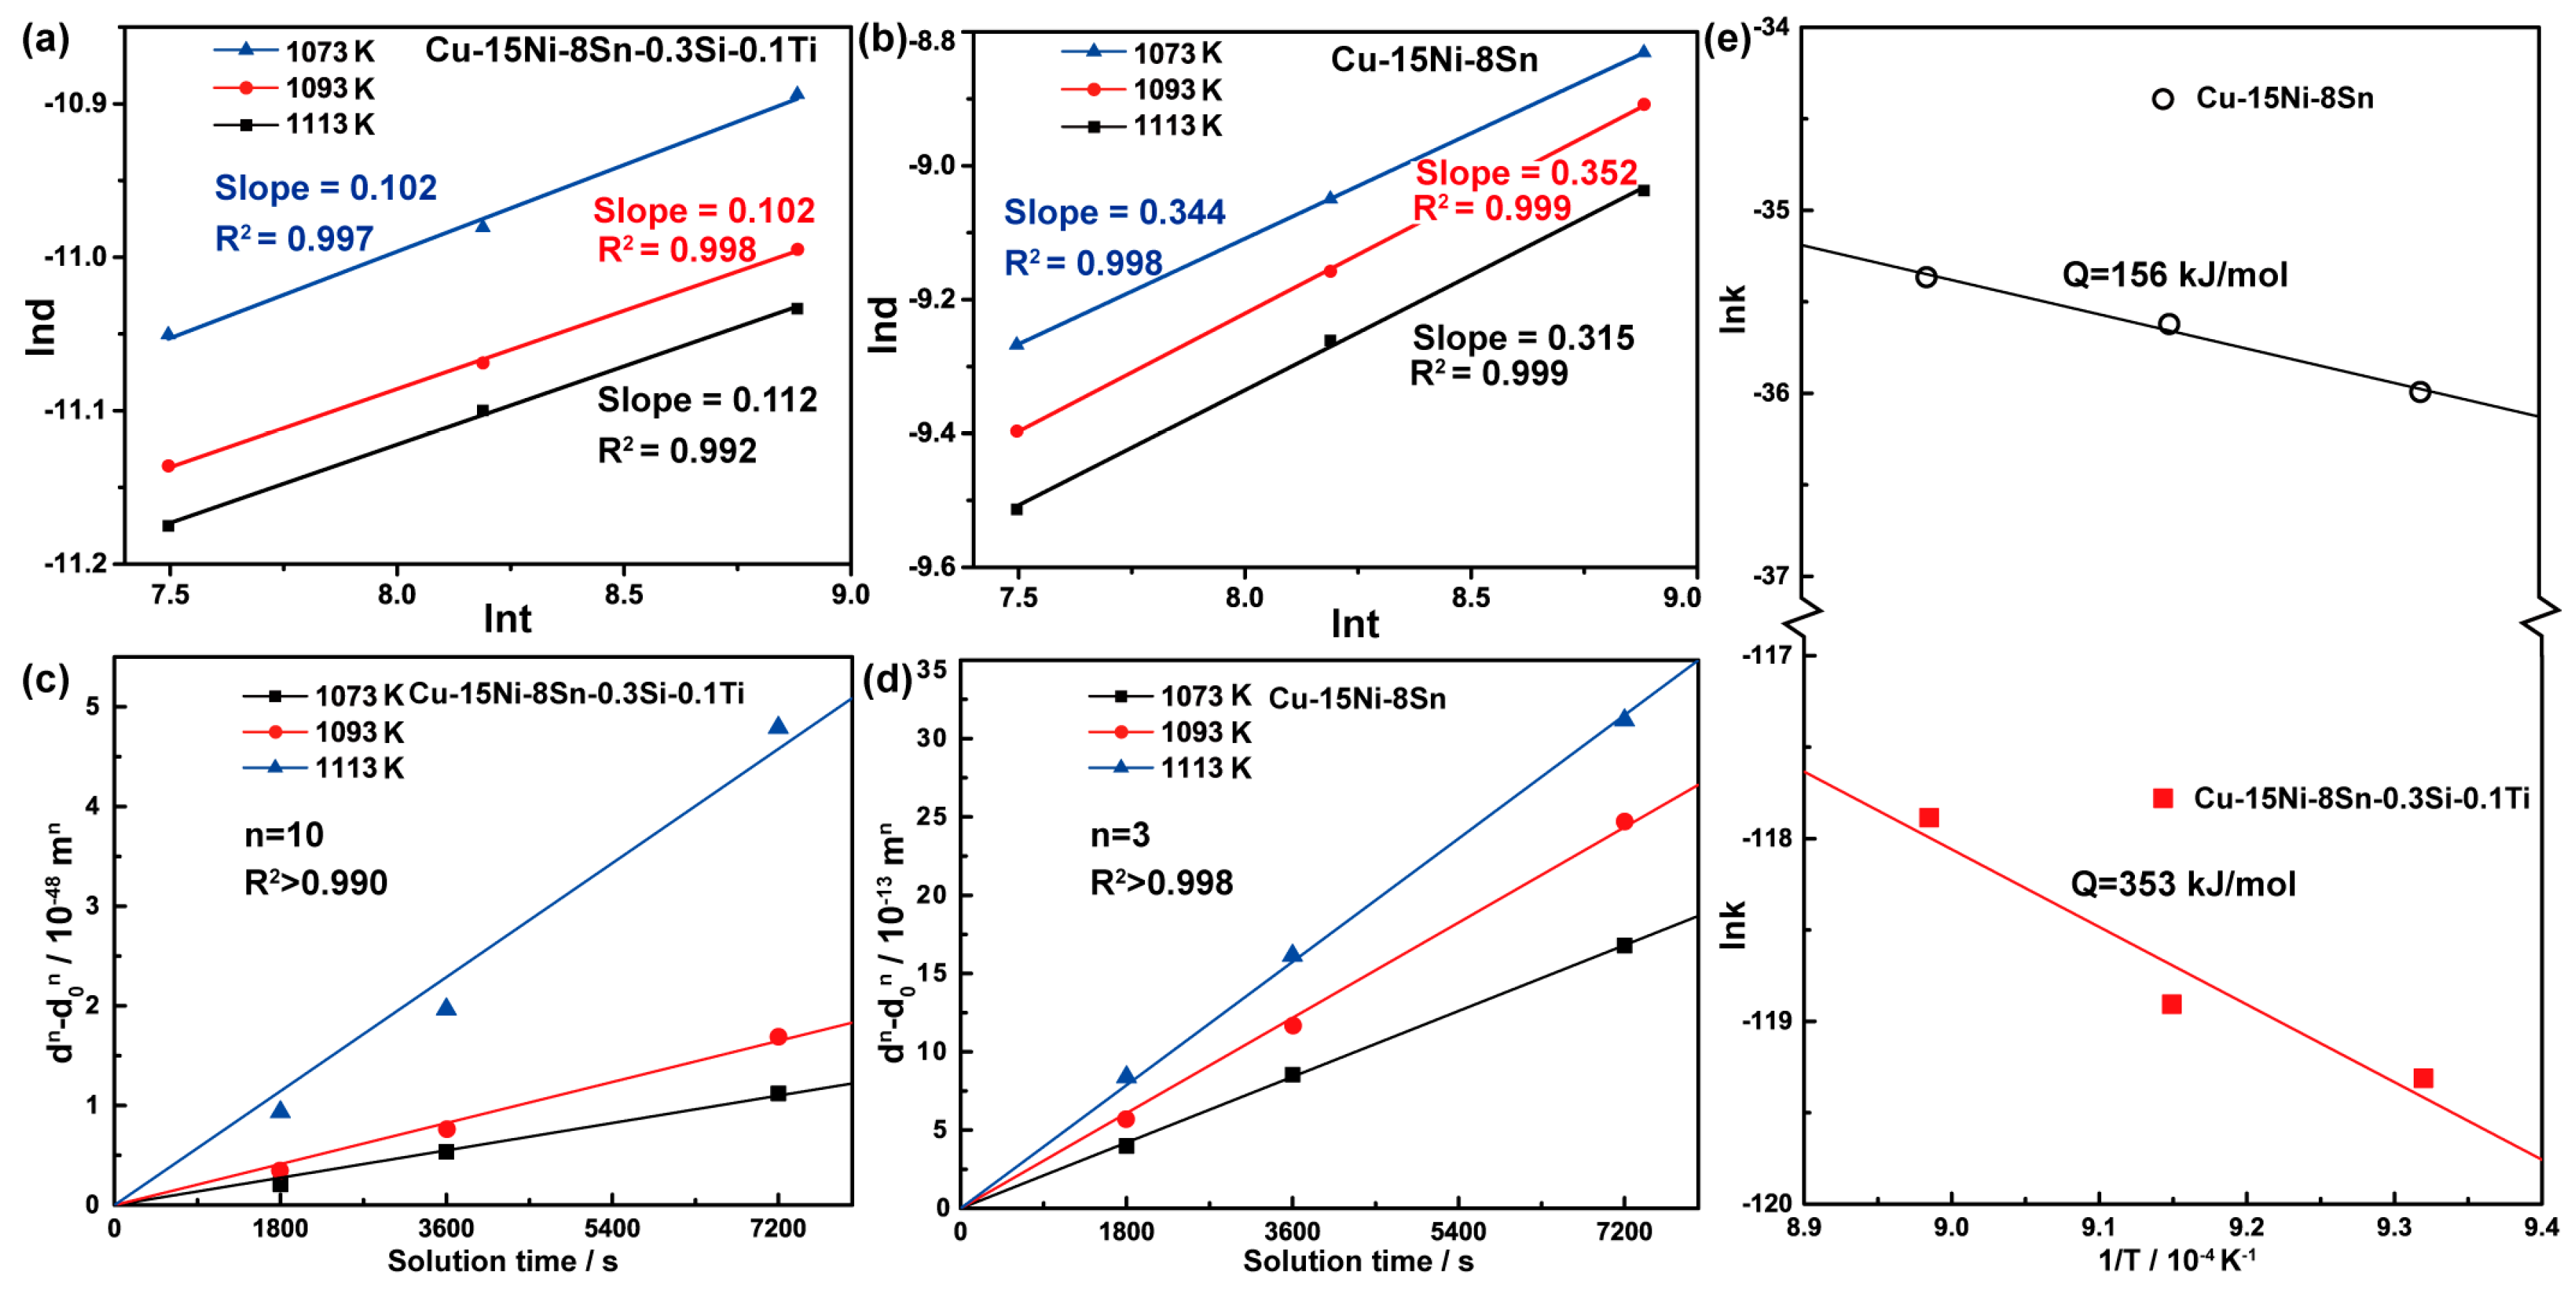
| Alloy | T (K) | Gf | n | Q (kJ/mol) |
|---|---|---|---|---|
| Cu-15Ni-8Sn | 1073 | 6.70 | 3 | 156 |
| 1093 | 7.76 | |||
| 1113 | 8.46 | |||
| Cu-15Ni-8Sn-0.3Si-0.1Ti | 1073 | 0.30 | 10 | 353 |
| 1093 | 0.36 | |||
| 1113 | 0.50 |
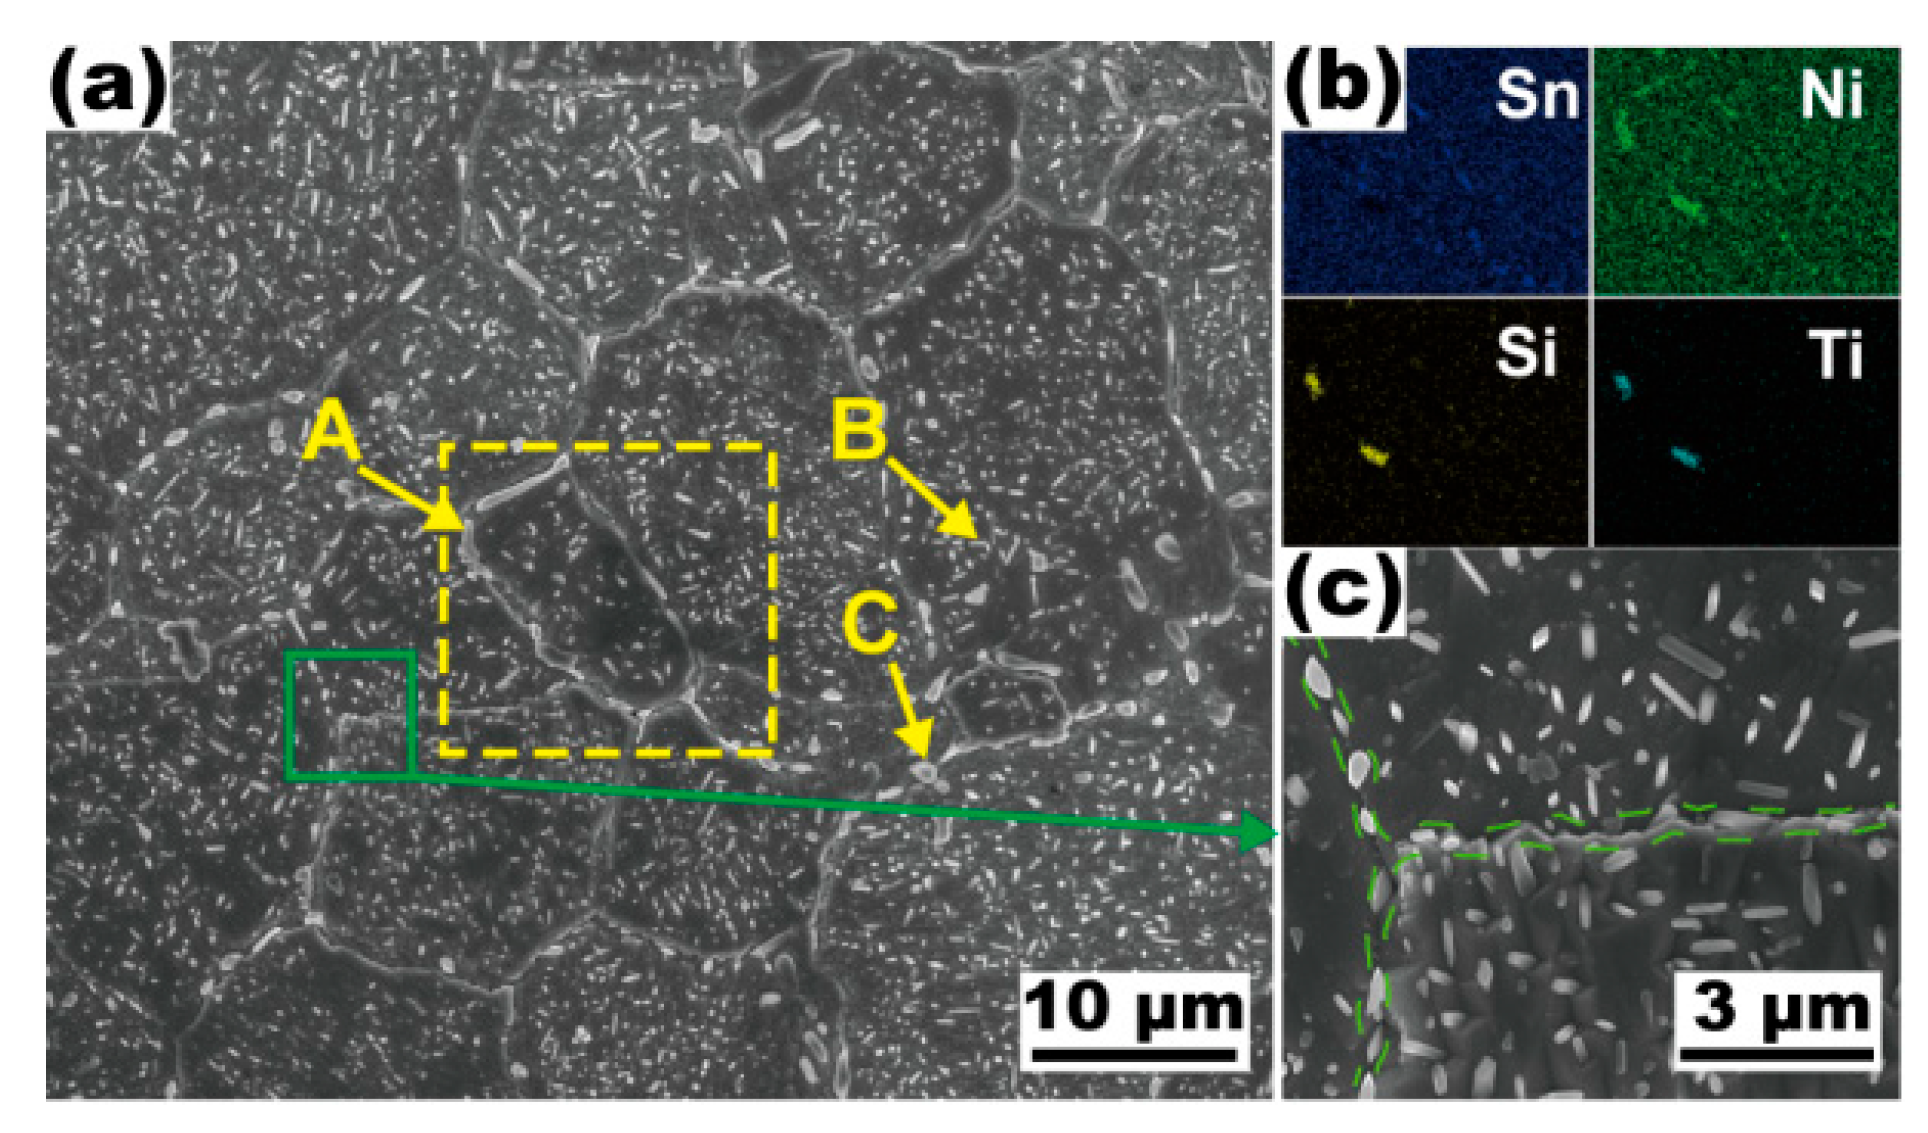
| Positions | Phases | Cu | Ni | Sn | Si | Ti |
|---|---|---|---|---|---|---|
| A | Ni16Si7Ti6 | 33.29 | 41.02 | 6.78 | 8.44 | 10.47 |
| B | γ | 74.7 | 17.07 | 9.62 | 0.35 | - |
| C | γ | 37.74 | 30.63 | 29.81 | 1.82 | - |
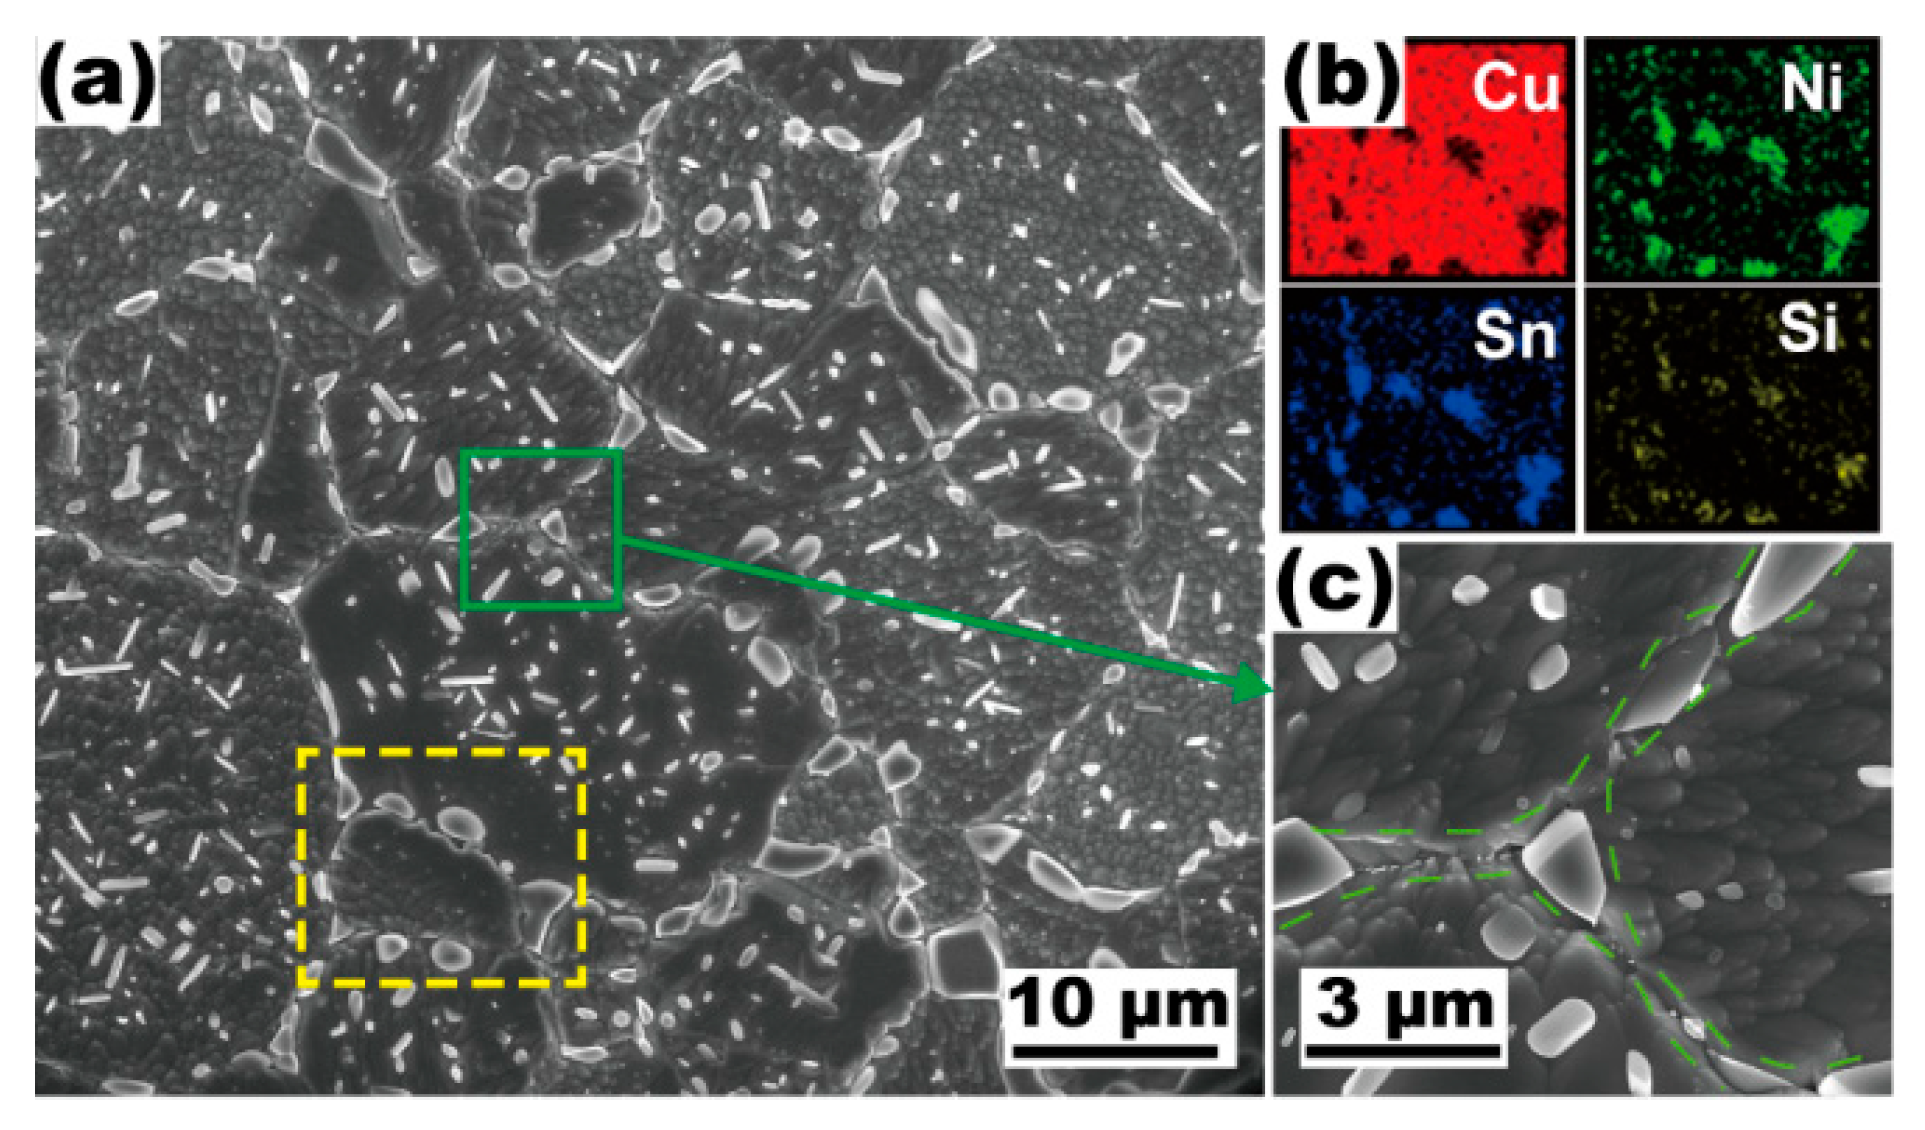
| Positions | Phases | Cu | Ni | Sn | Si | Ti |
|---|---|---|---|---|---|---|
| A | γ | 36.34 | 32.2 | 29.54 | 1.92 | - |
| B | Ni16Si7Ti6 | 49.87 | 31.31 | 4.38 | 7.27 | 7.16 |
| Solutes | D (10−4 m2/s) | T-Range (K) |
|---|---|---|
| Sn | 0.84 | 1011–1321 |
| Si | 0.21 | 998–1173 |
| Ti | 0.693 | 973–1283 |
| Fv | r (μm) | γ (J/m2) [24] | Pz (MPa) |
|---|---|---|---|
| 0.0075 | 0.444 | 0.65 | 0.0165 |
Disclaimer/Publisher’s Note: The statements, opinions and data contained in all publications are solely those of the individual author(s) and contributor(s) and not of MDPI and/or the editor(s). MDPI and/or the editor(s) disclaim responsibility for any injury to people or property resulting from any ideas, methods, instructions or products referred to in the content. |
© 2023 by the authors. Licensee MDPI, Basel, Switzerland. This article is an open access article distributed under the terms and conditions of the Creative Commons Attribution (CC BY) license (https://creativecommons.org/licenses/by/4.0/).
Share and Cite
Zhao, C.; Li, D.; Liu, X.; Sun, M.; Wang, Z.; Luo, Z.; Zhang, W. Improving the Thermal Stability of the Fine-Grained Structure in the Cu-15Ni-8Sn Alloy during Solution Treatment by the Additions of Si and Ti. Materials 2023, 16, 1252. https://doi.org/10.3390/ma16031252
Zhao C, Li D, Liu X, Sun M, Wang Z, Luo Z, Zhang W. Improving the Thermal Stability of the Fine-Grained Structure in the Cu-15Ni-8Sn Alloy during Solution Treatment by the Additions of Si and Ti. Materials. 2023; 16(3):1252. https://doi.org/10.3390/ma16031252
Chicago/Turabian StyleZhao, Chao, Daoxi Li, Xiaotao Liu, Minghan Sun, Zhi Wang, Zongqiang Luo, and Weiwen Zhang. 2023. "Improving the Thermal Stability of the Fine-Grained Structure in the Cu-15Ni-8Sn Alloy during Solution Treatment by the Additions of Si and Ti" Materials 16, no. 3: 1252. https://doi.org/10.3390/ma16031252