
Multipass Friction Stir Processing of Laser-Powder Bed Fusion AlSi10Mg: Microstructure and Mechanical Properties
 , ,
, ,  and
and
Abstract
:1. Introduction
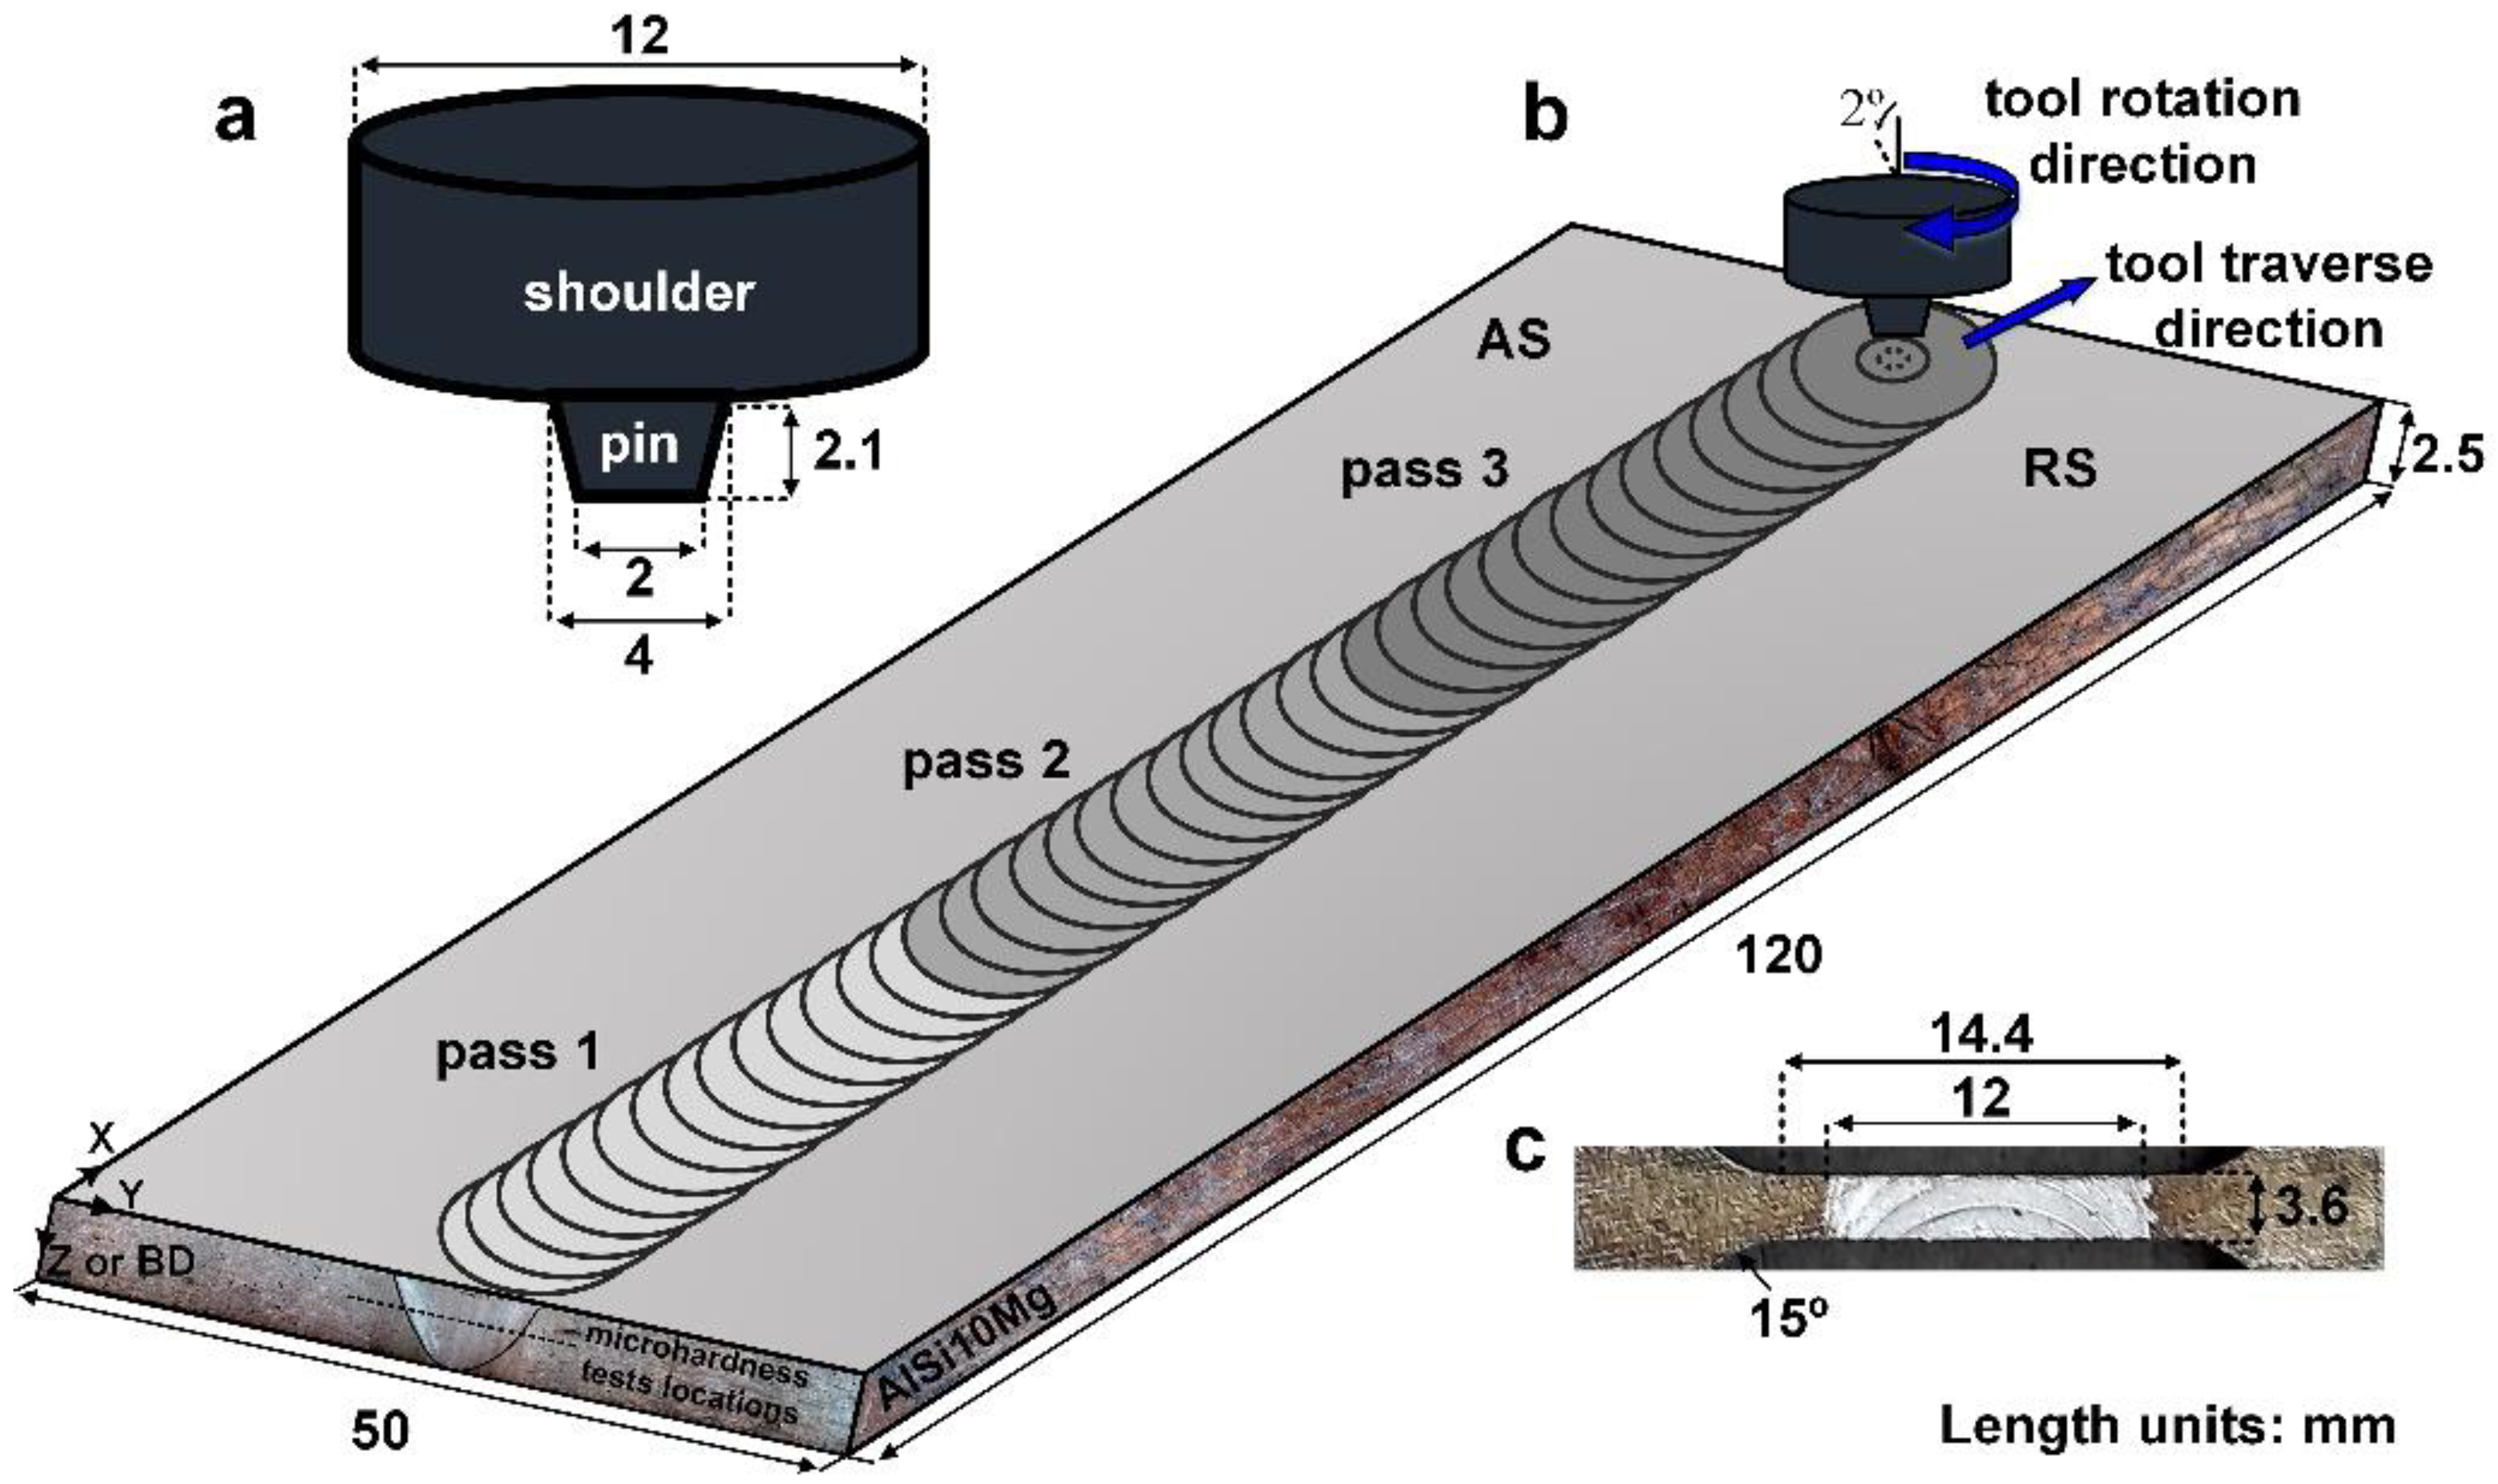
2. Materials and Methods
3. Results
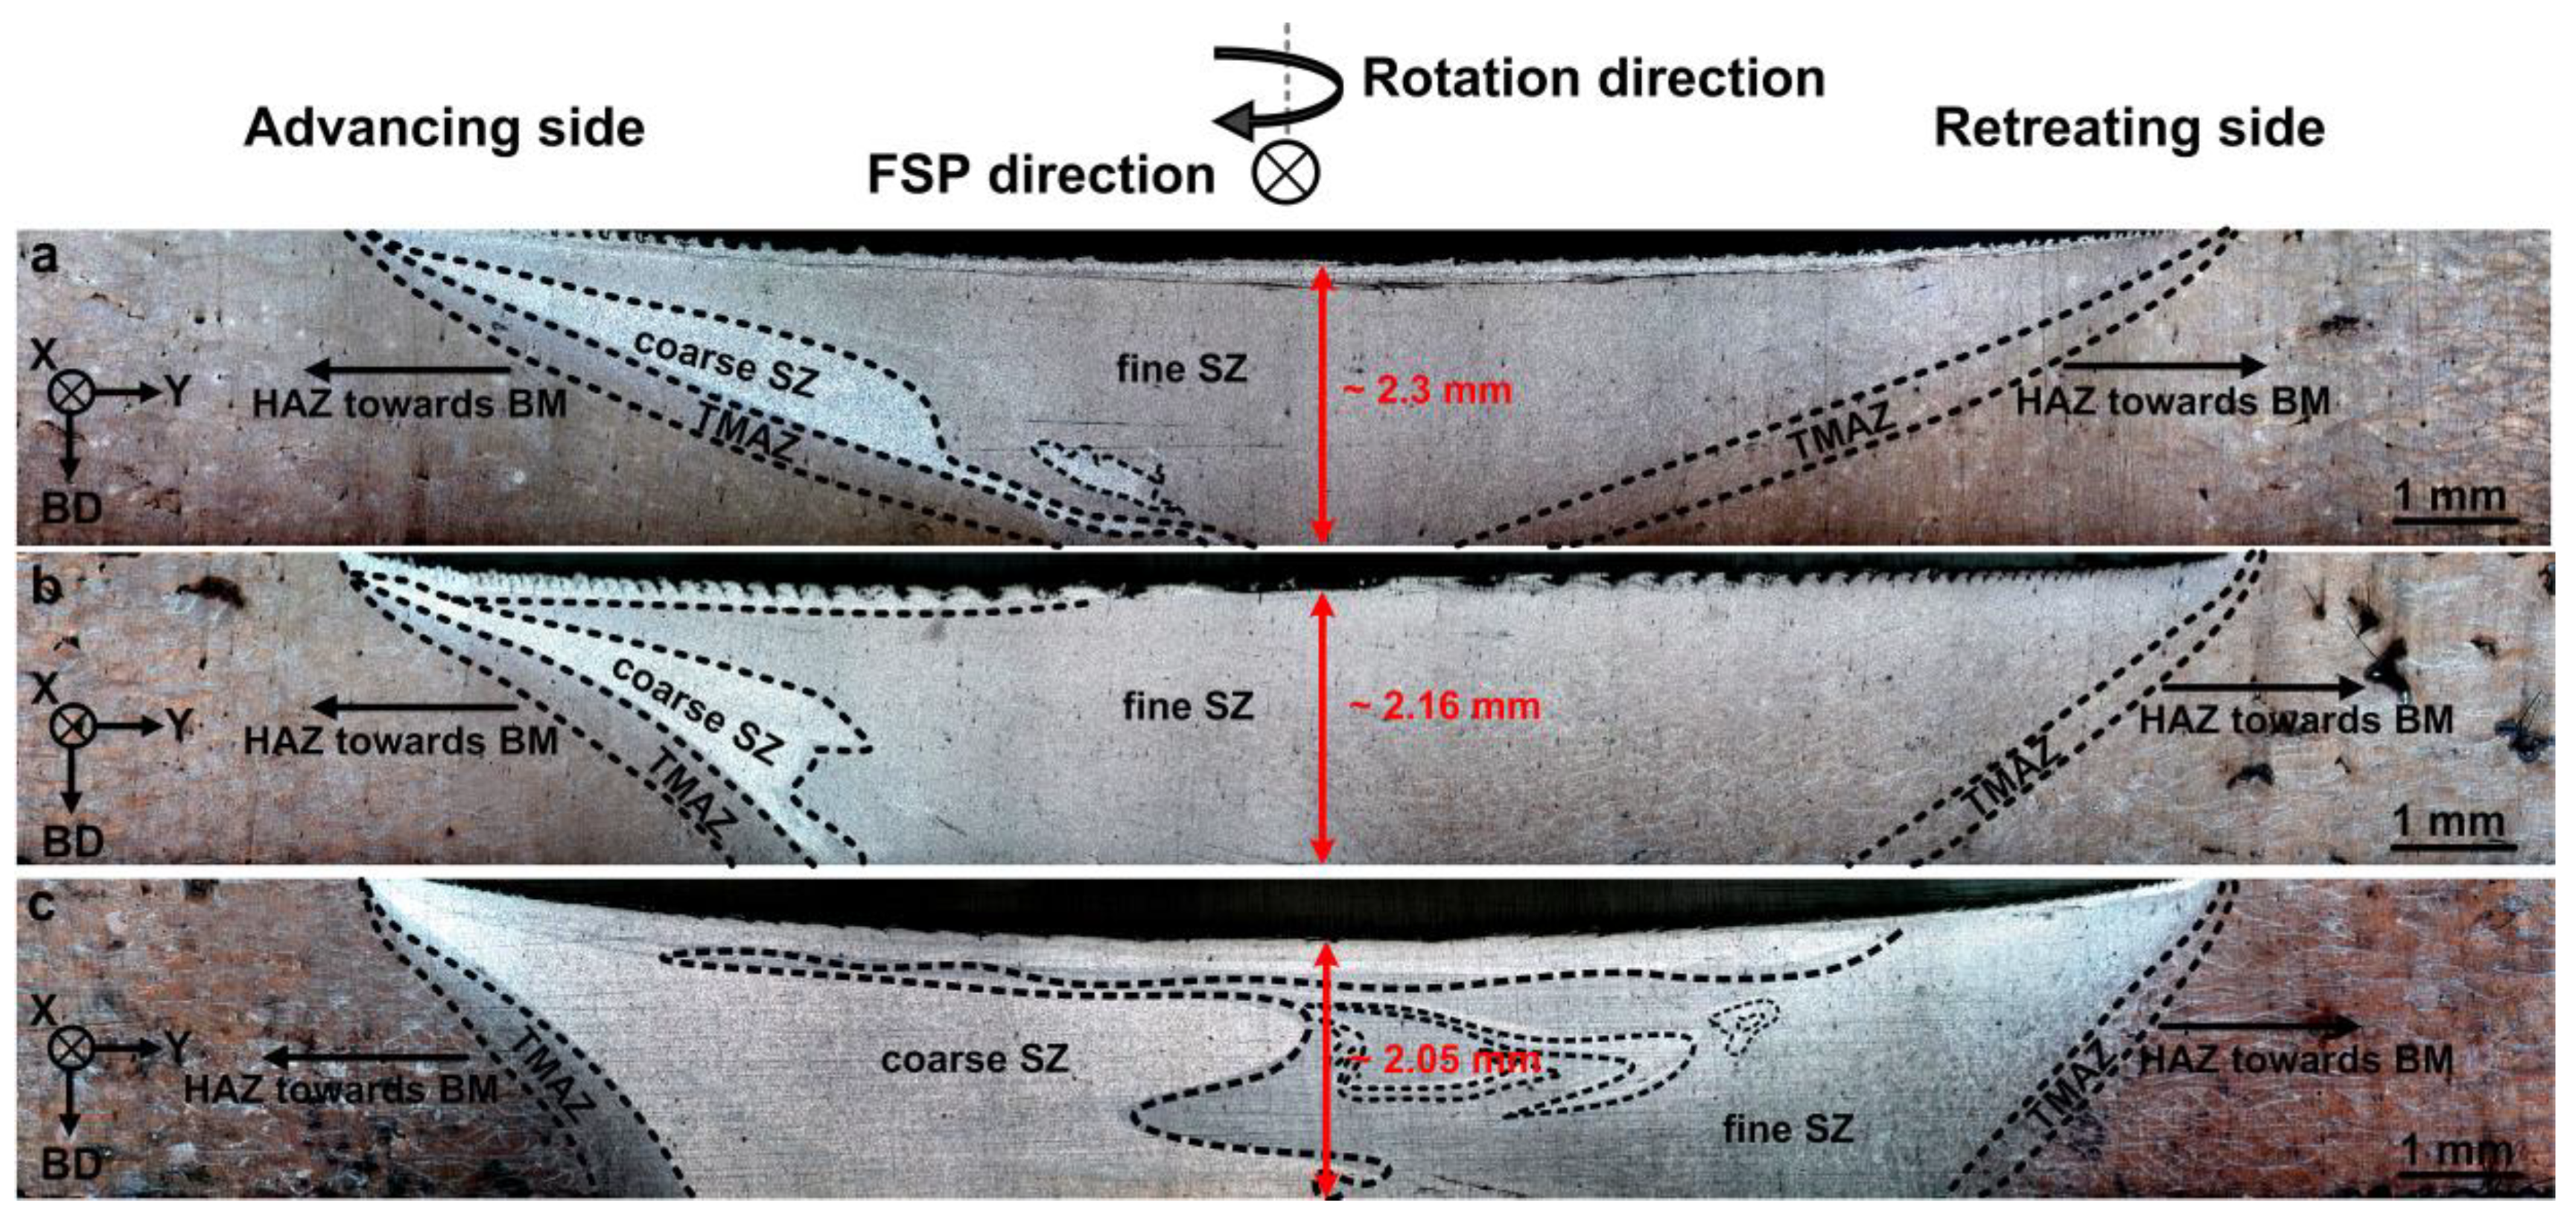
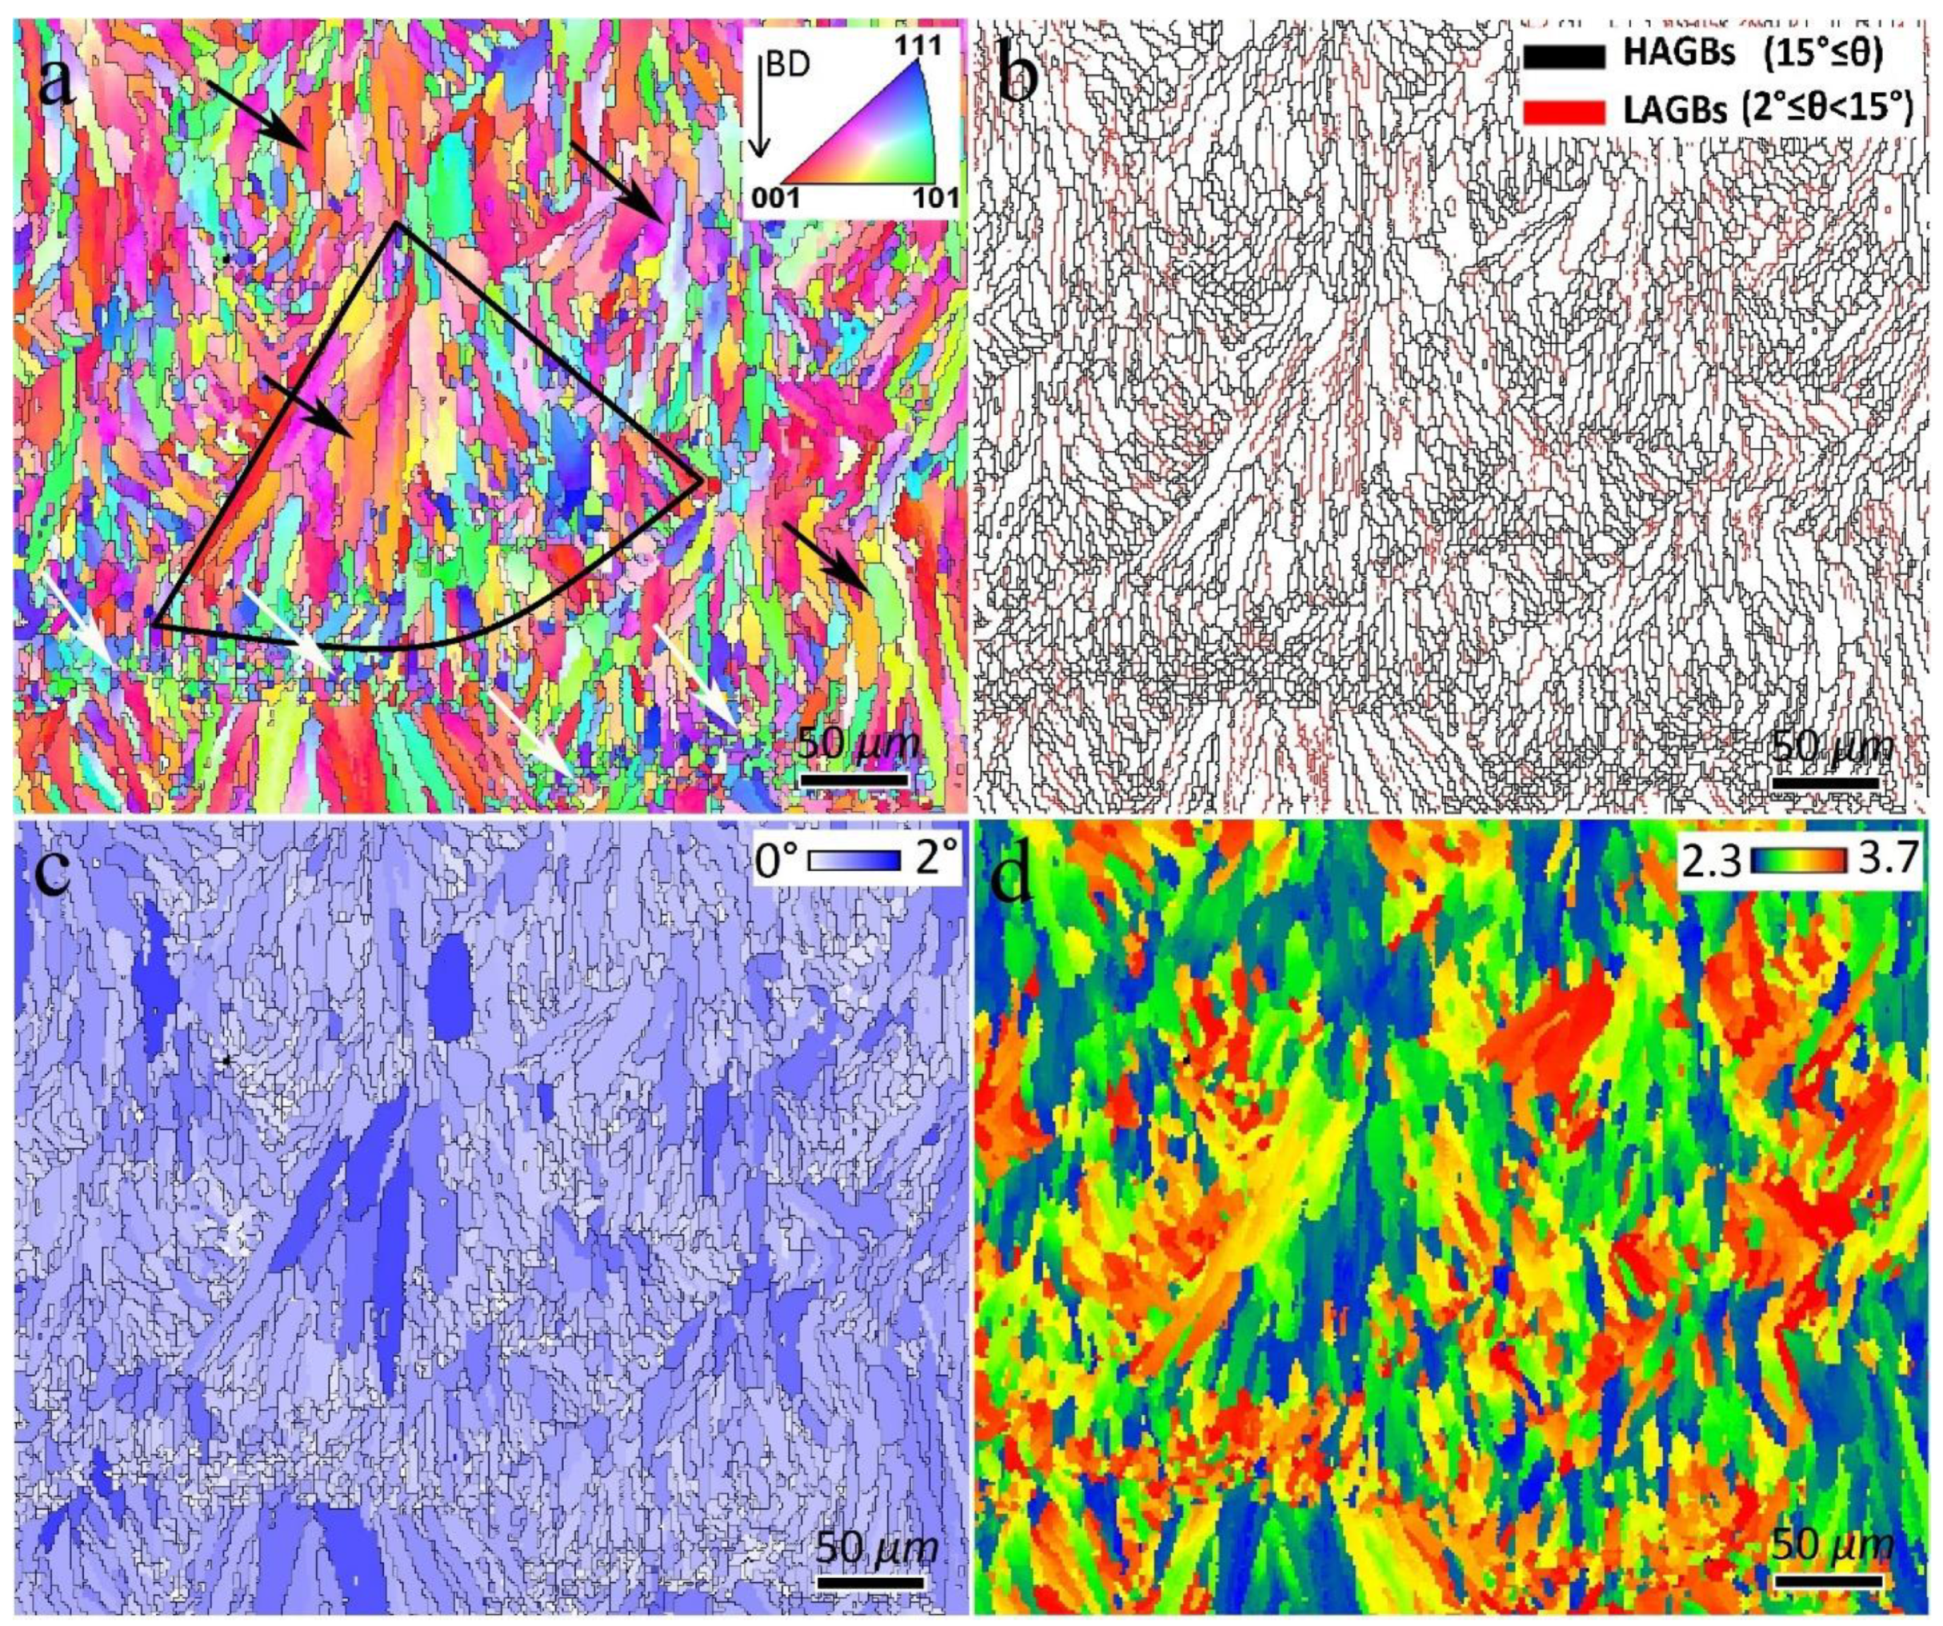
3.1. Microstructural Zones
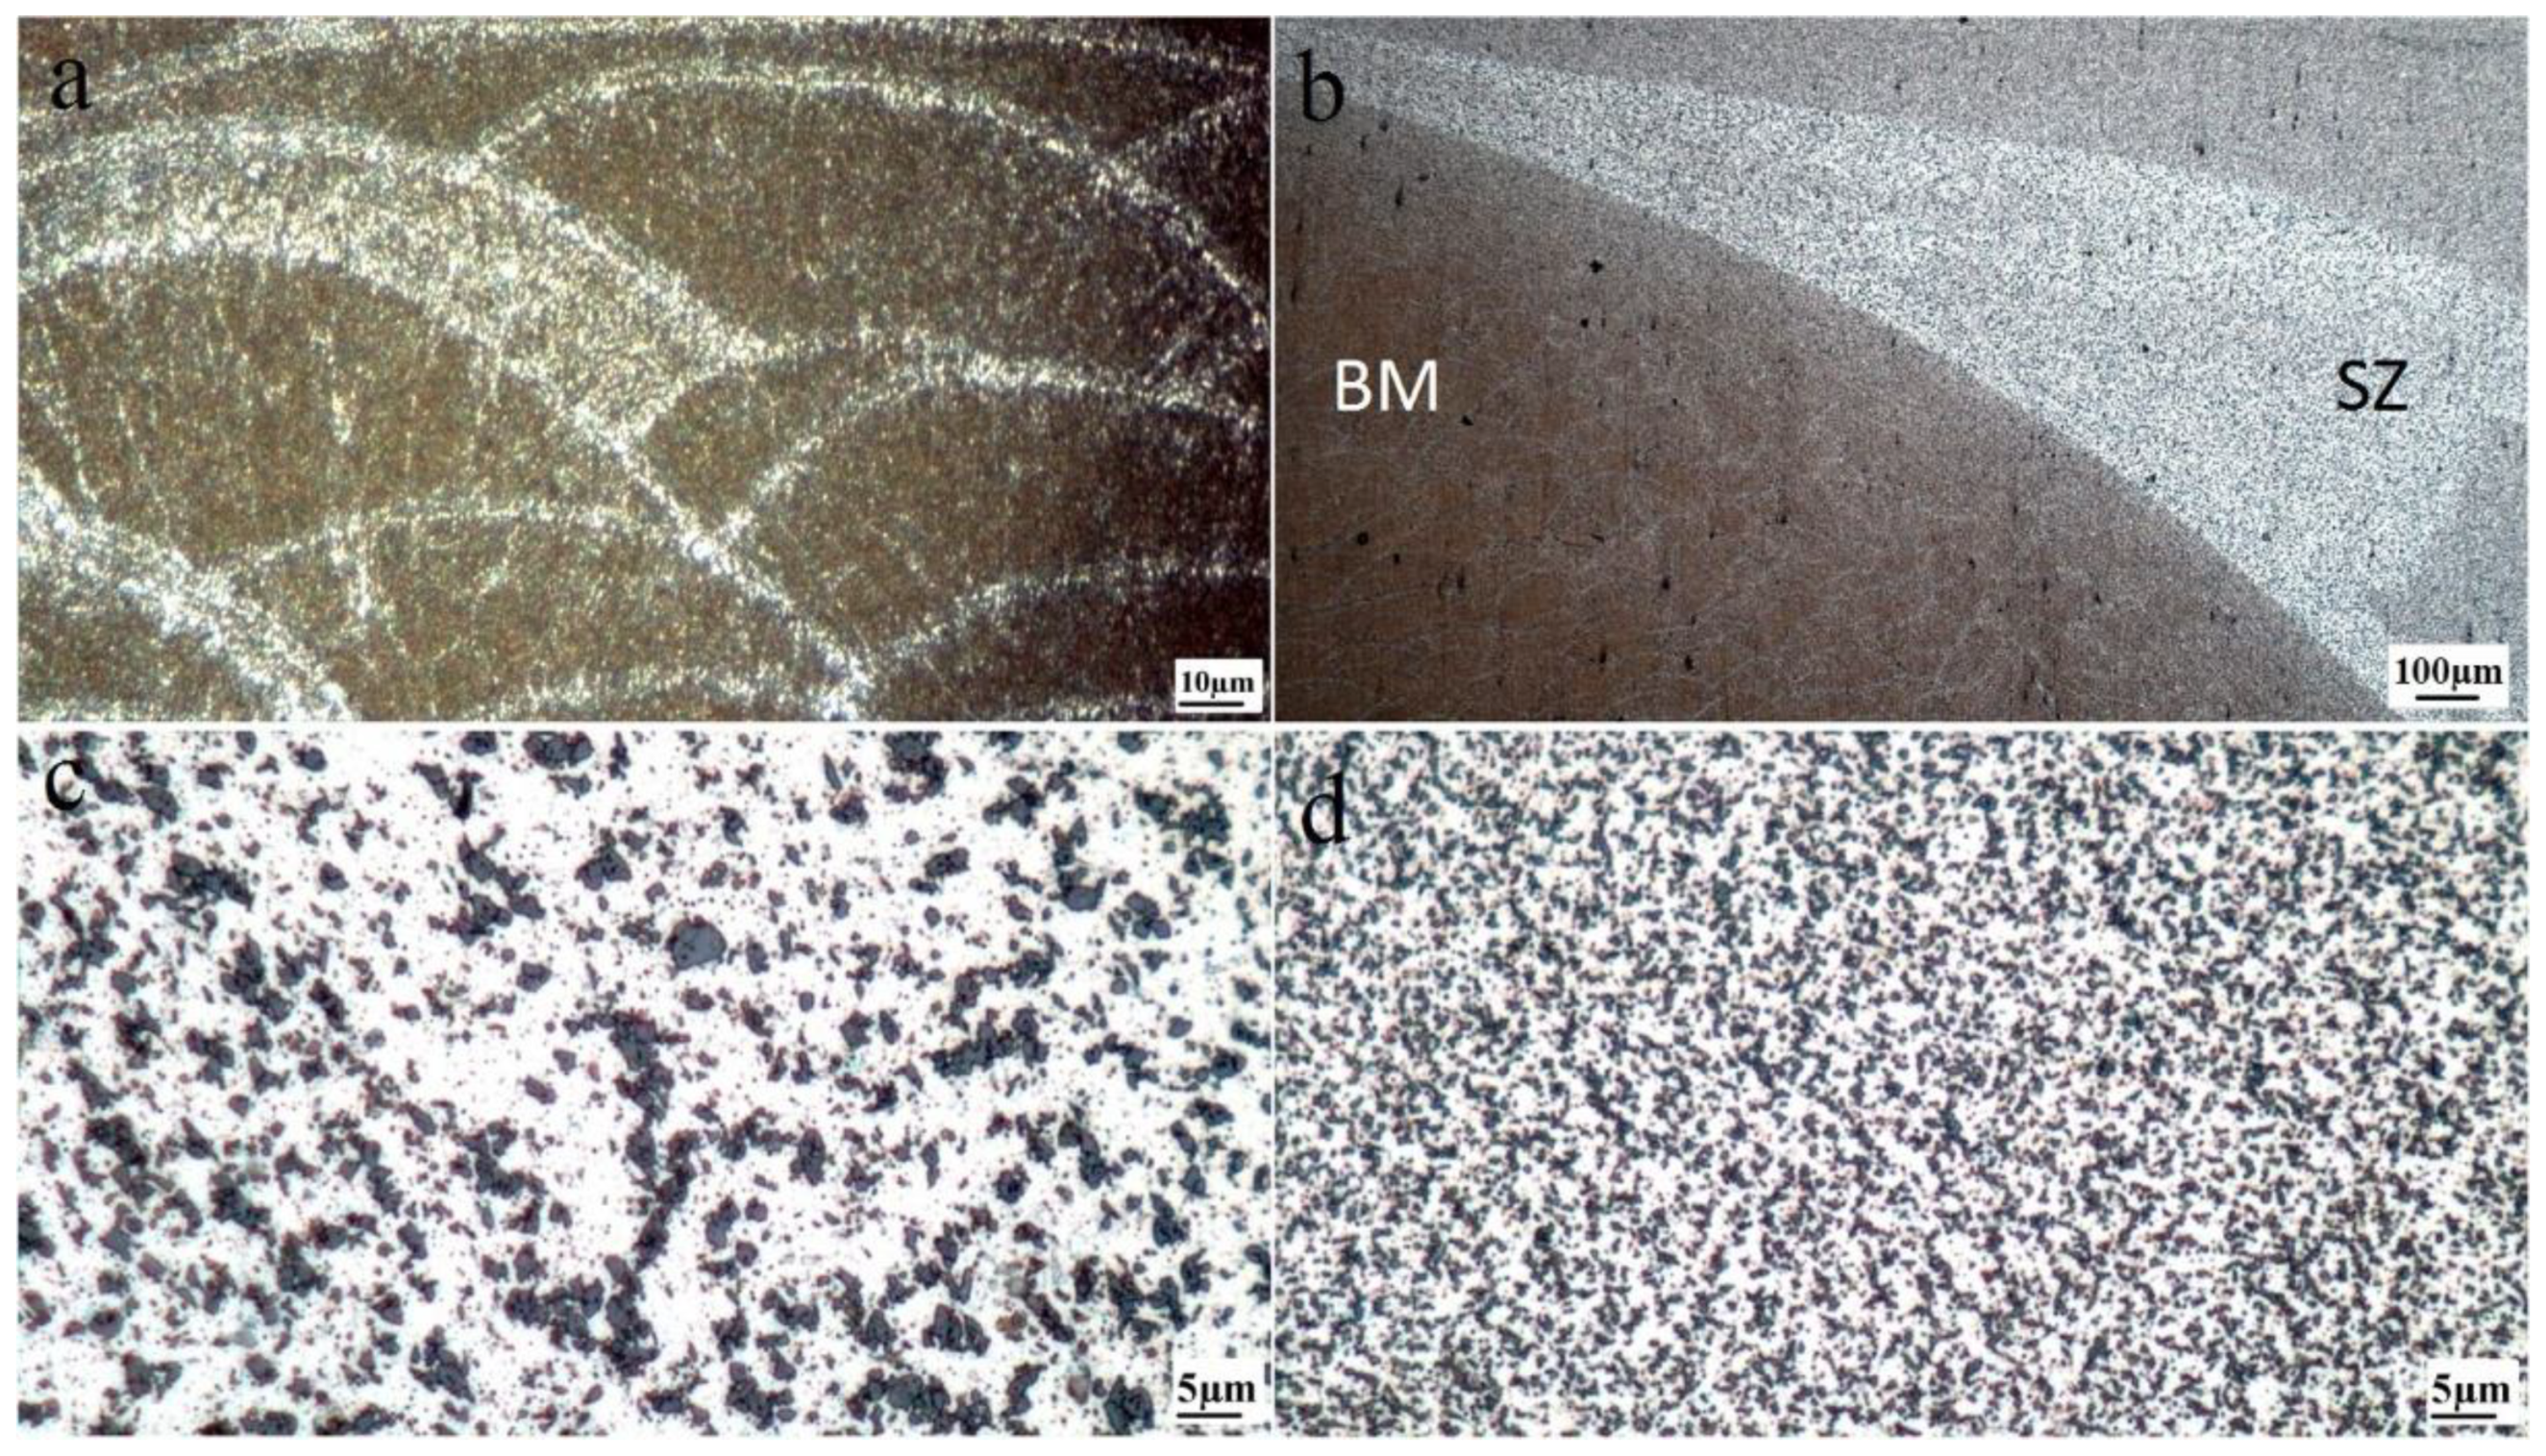
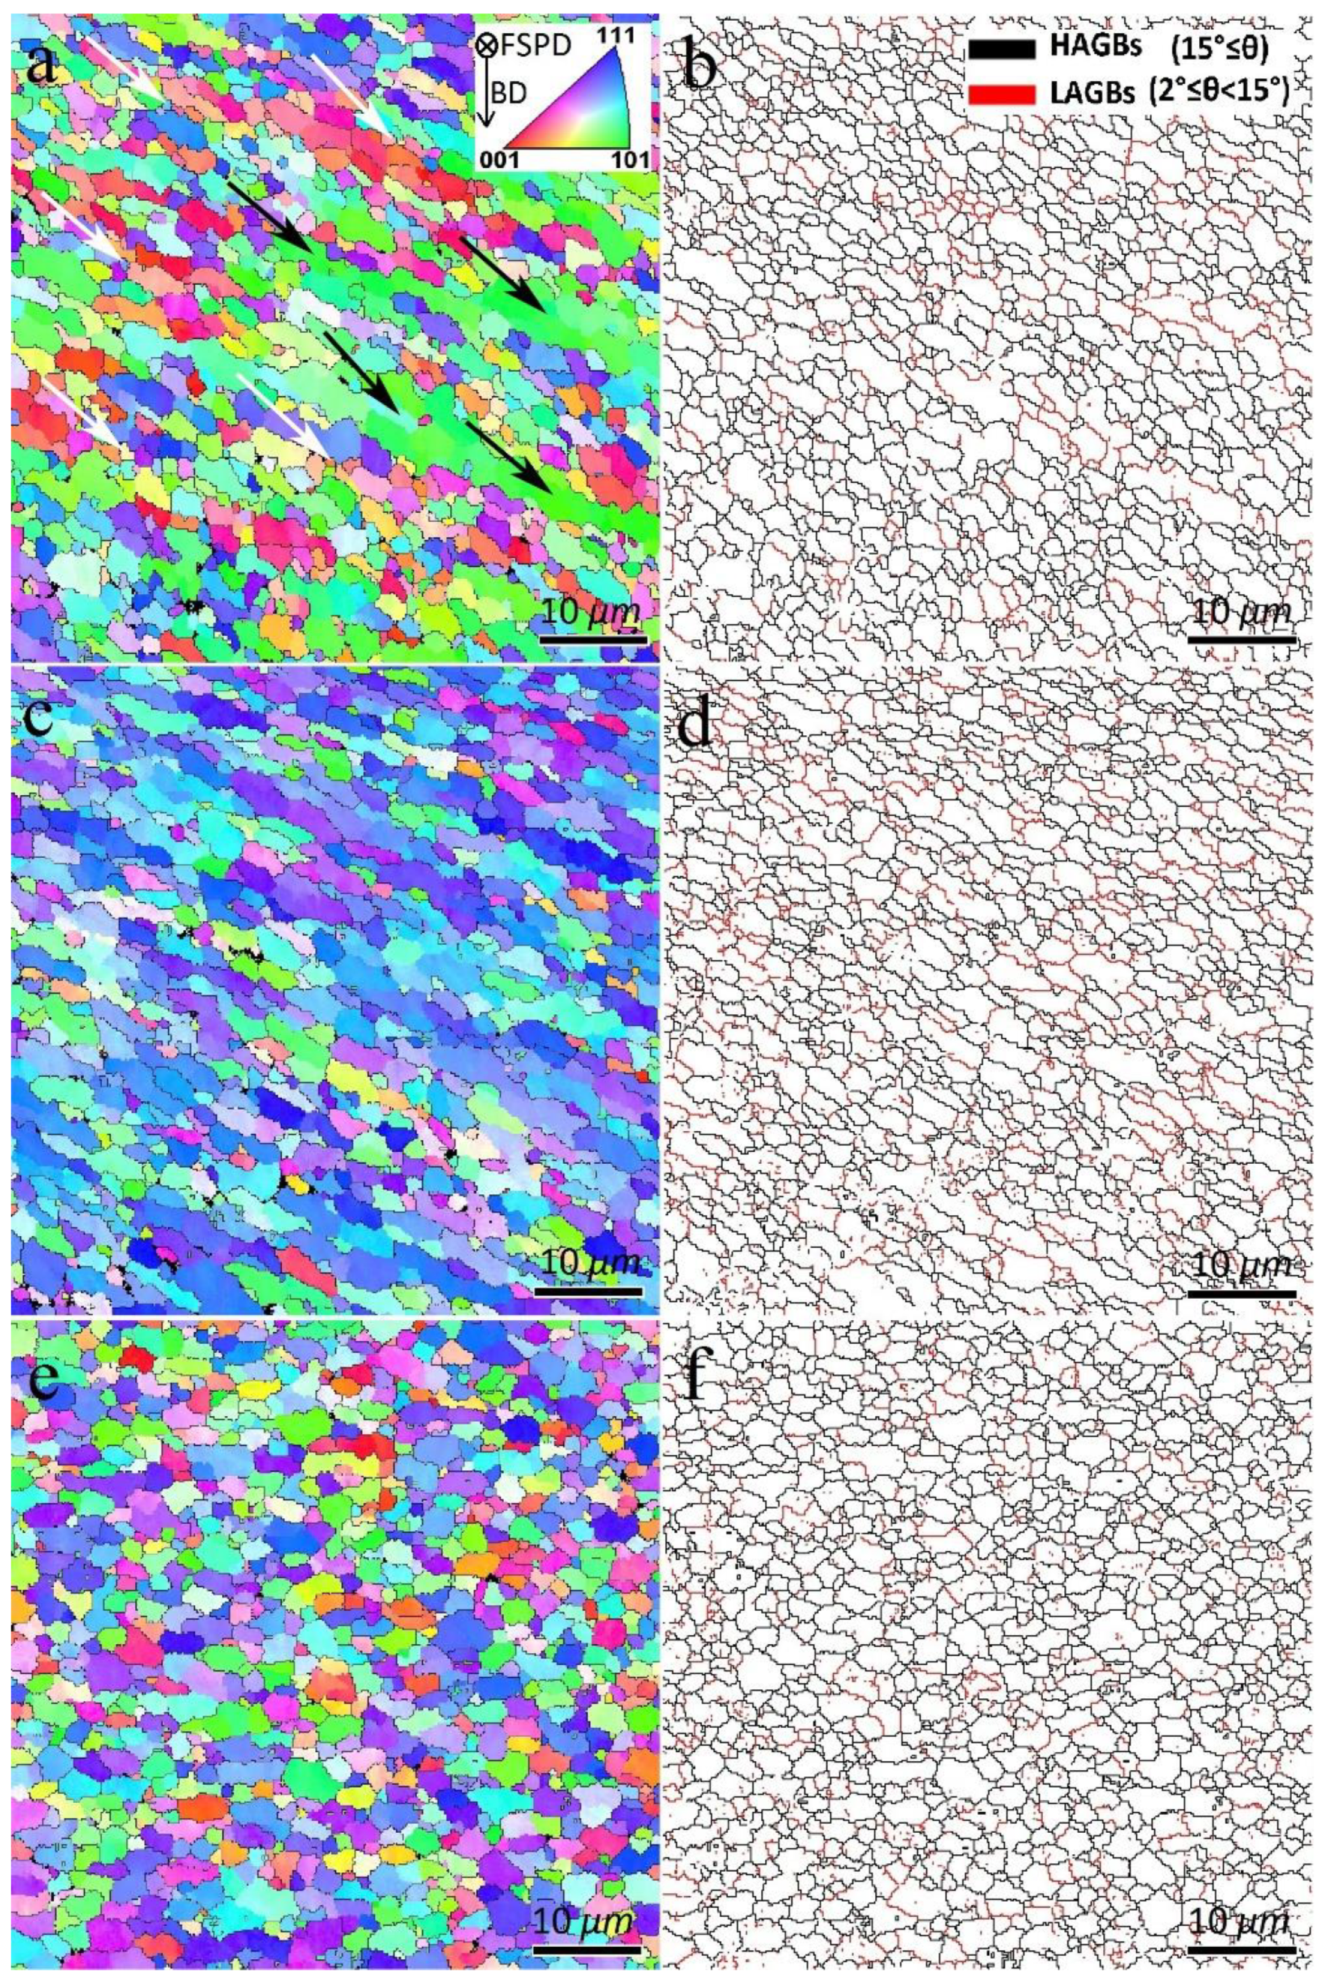
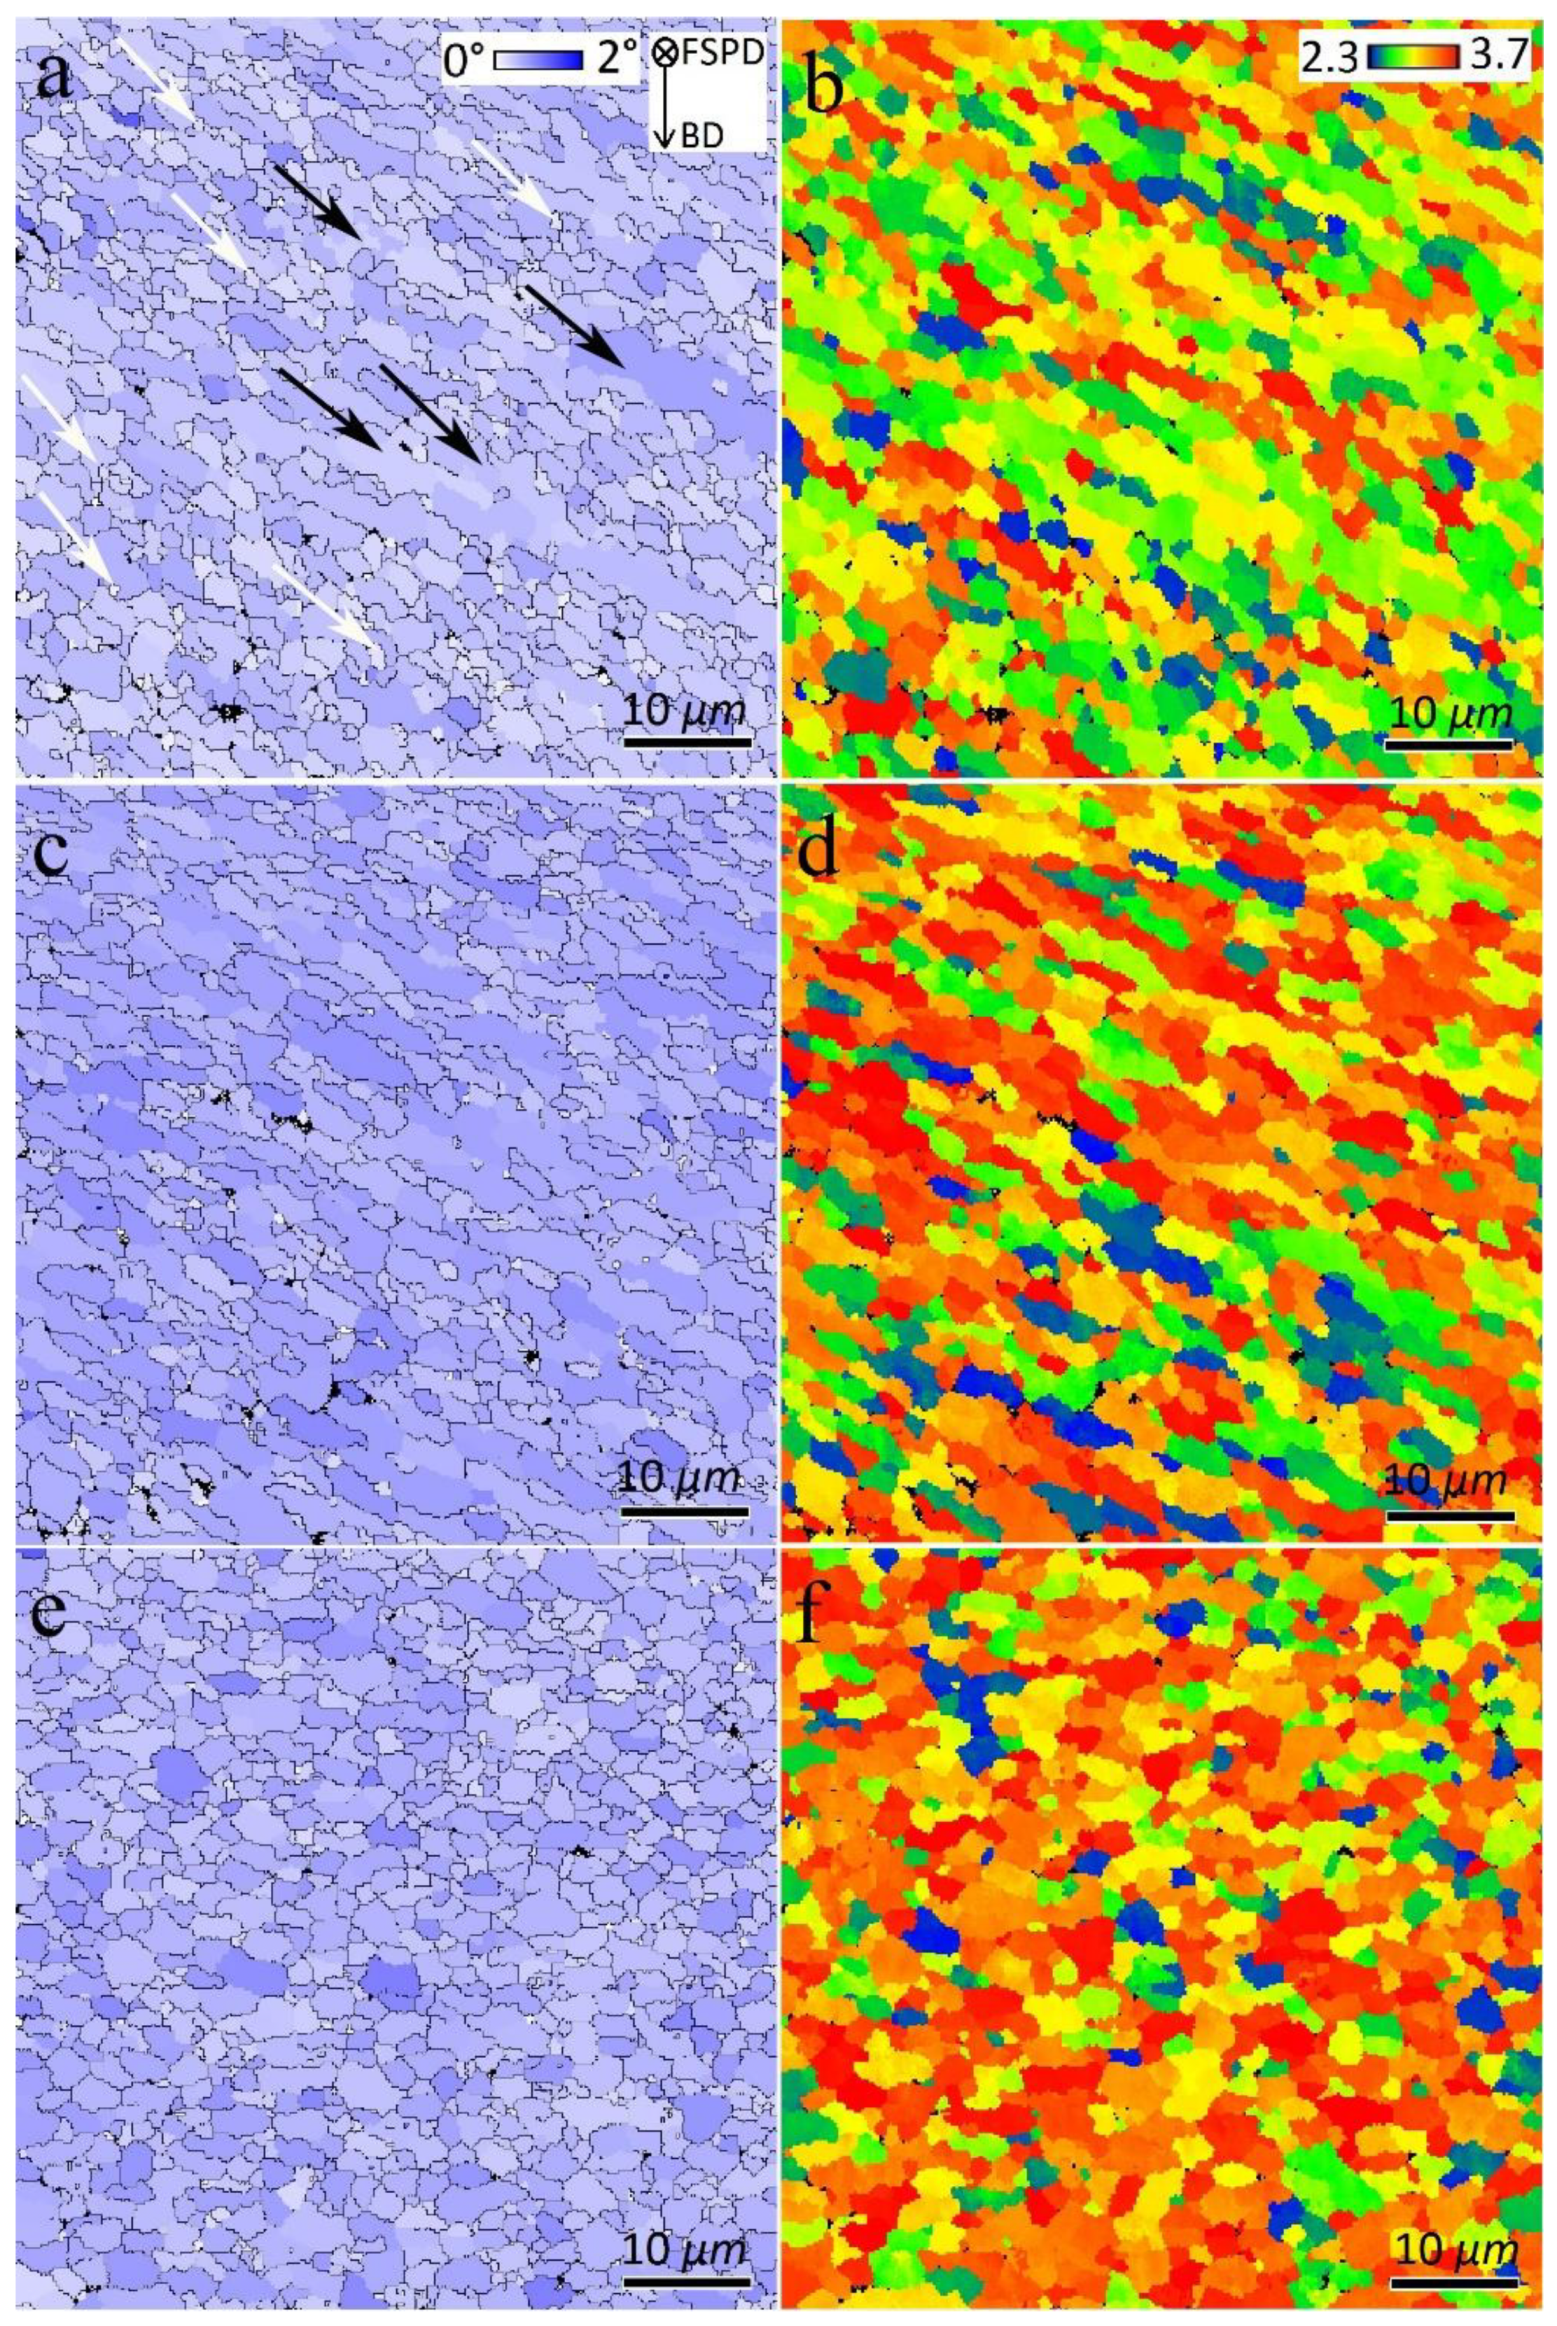
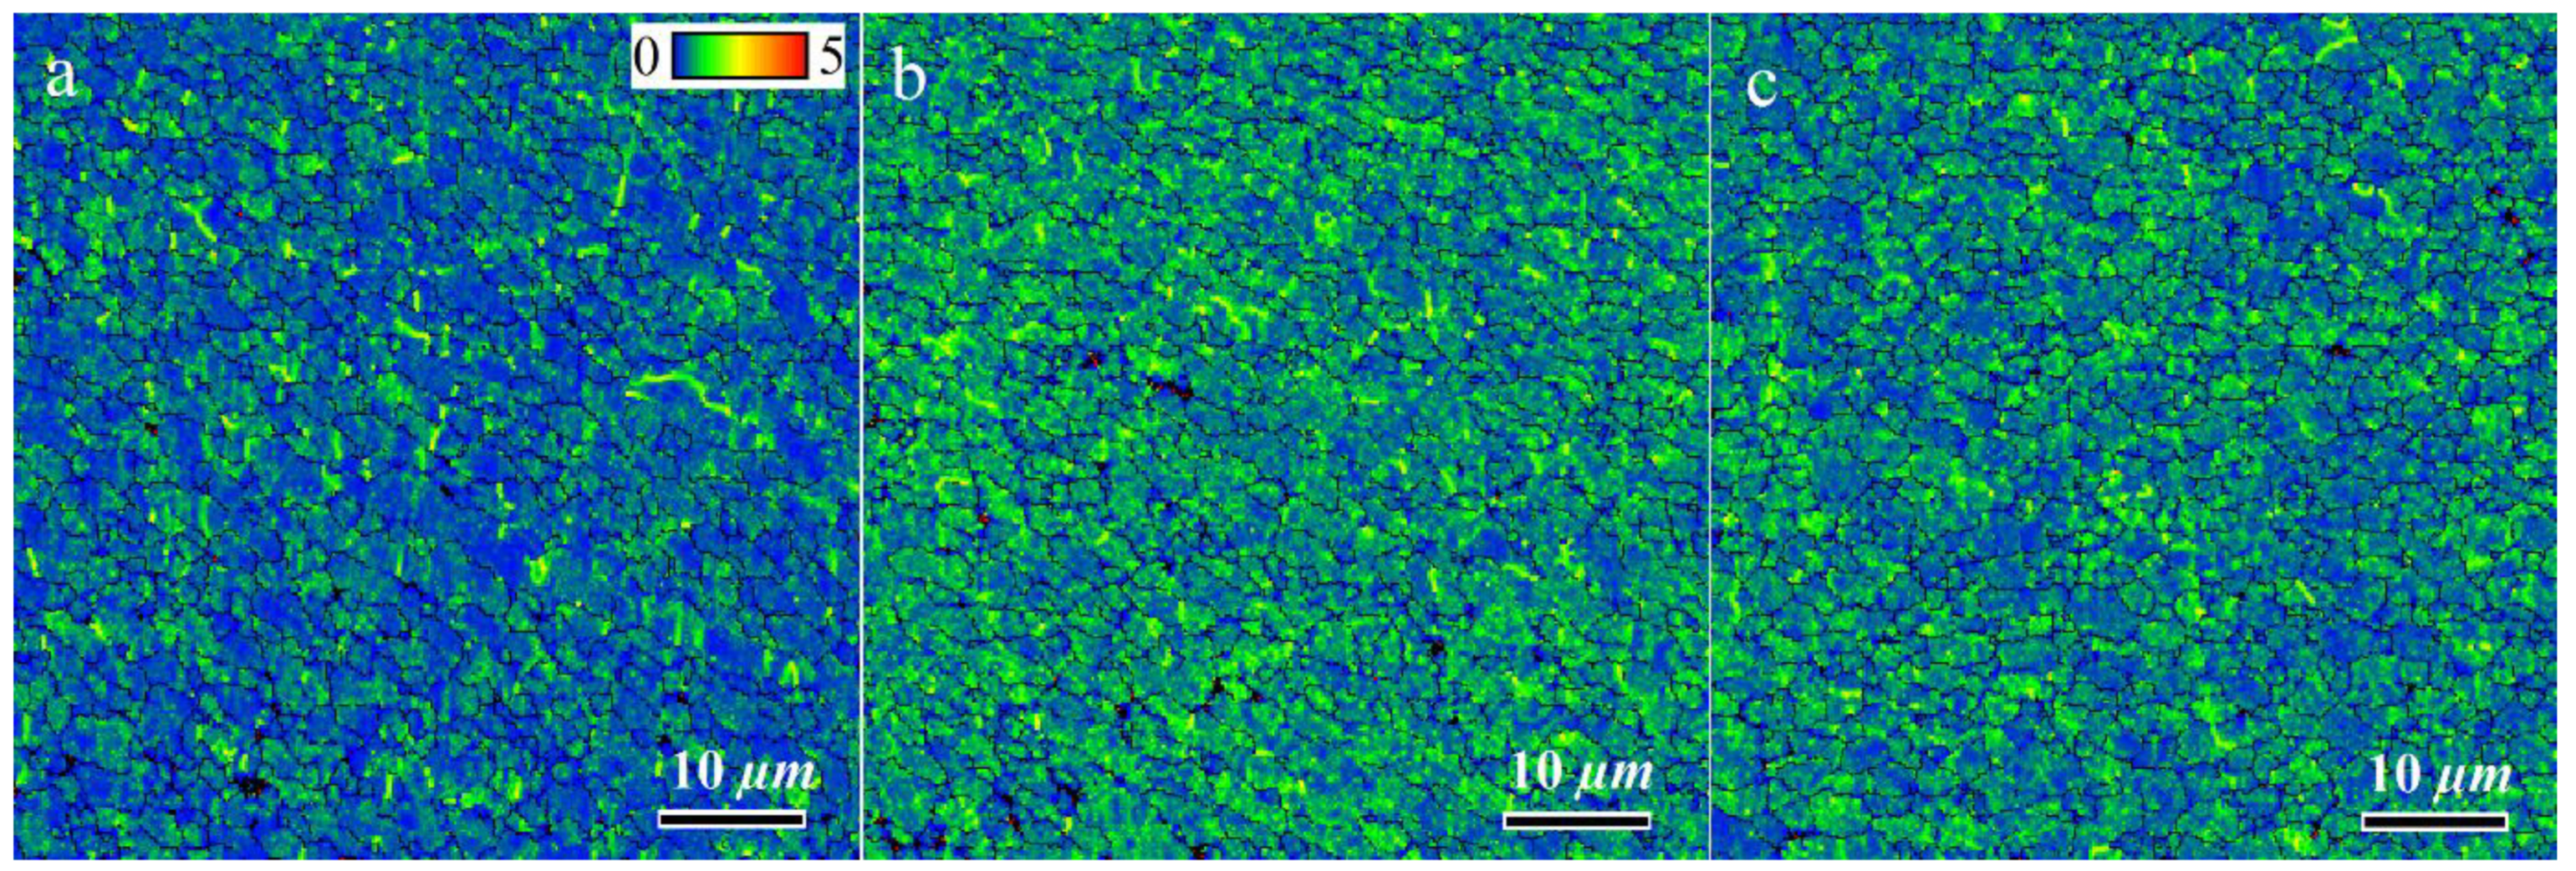
3.2. EBSD Maps
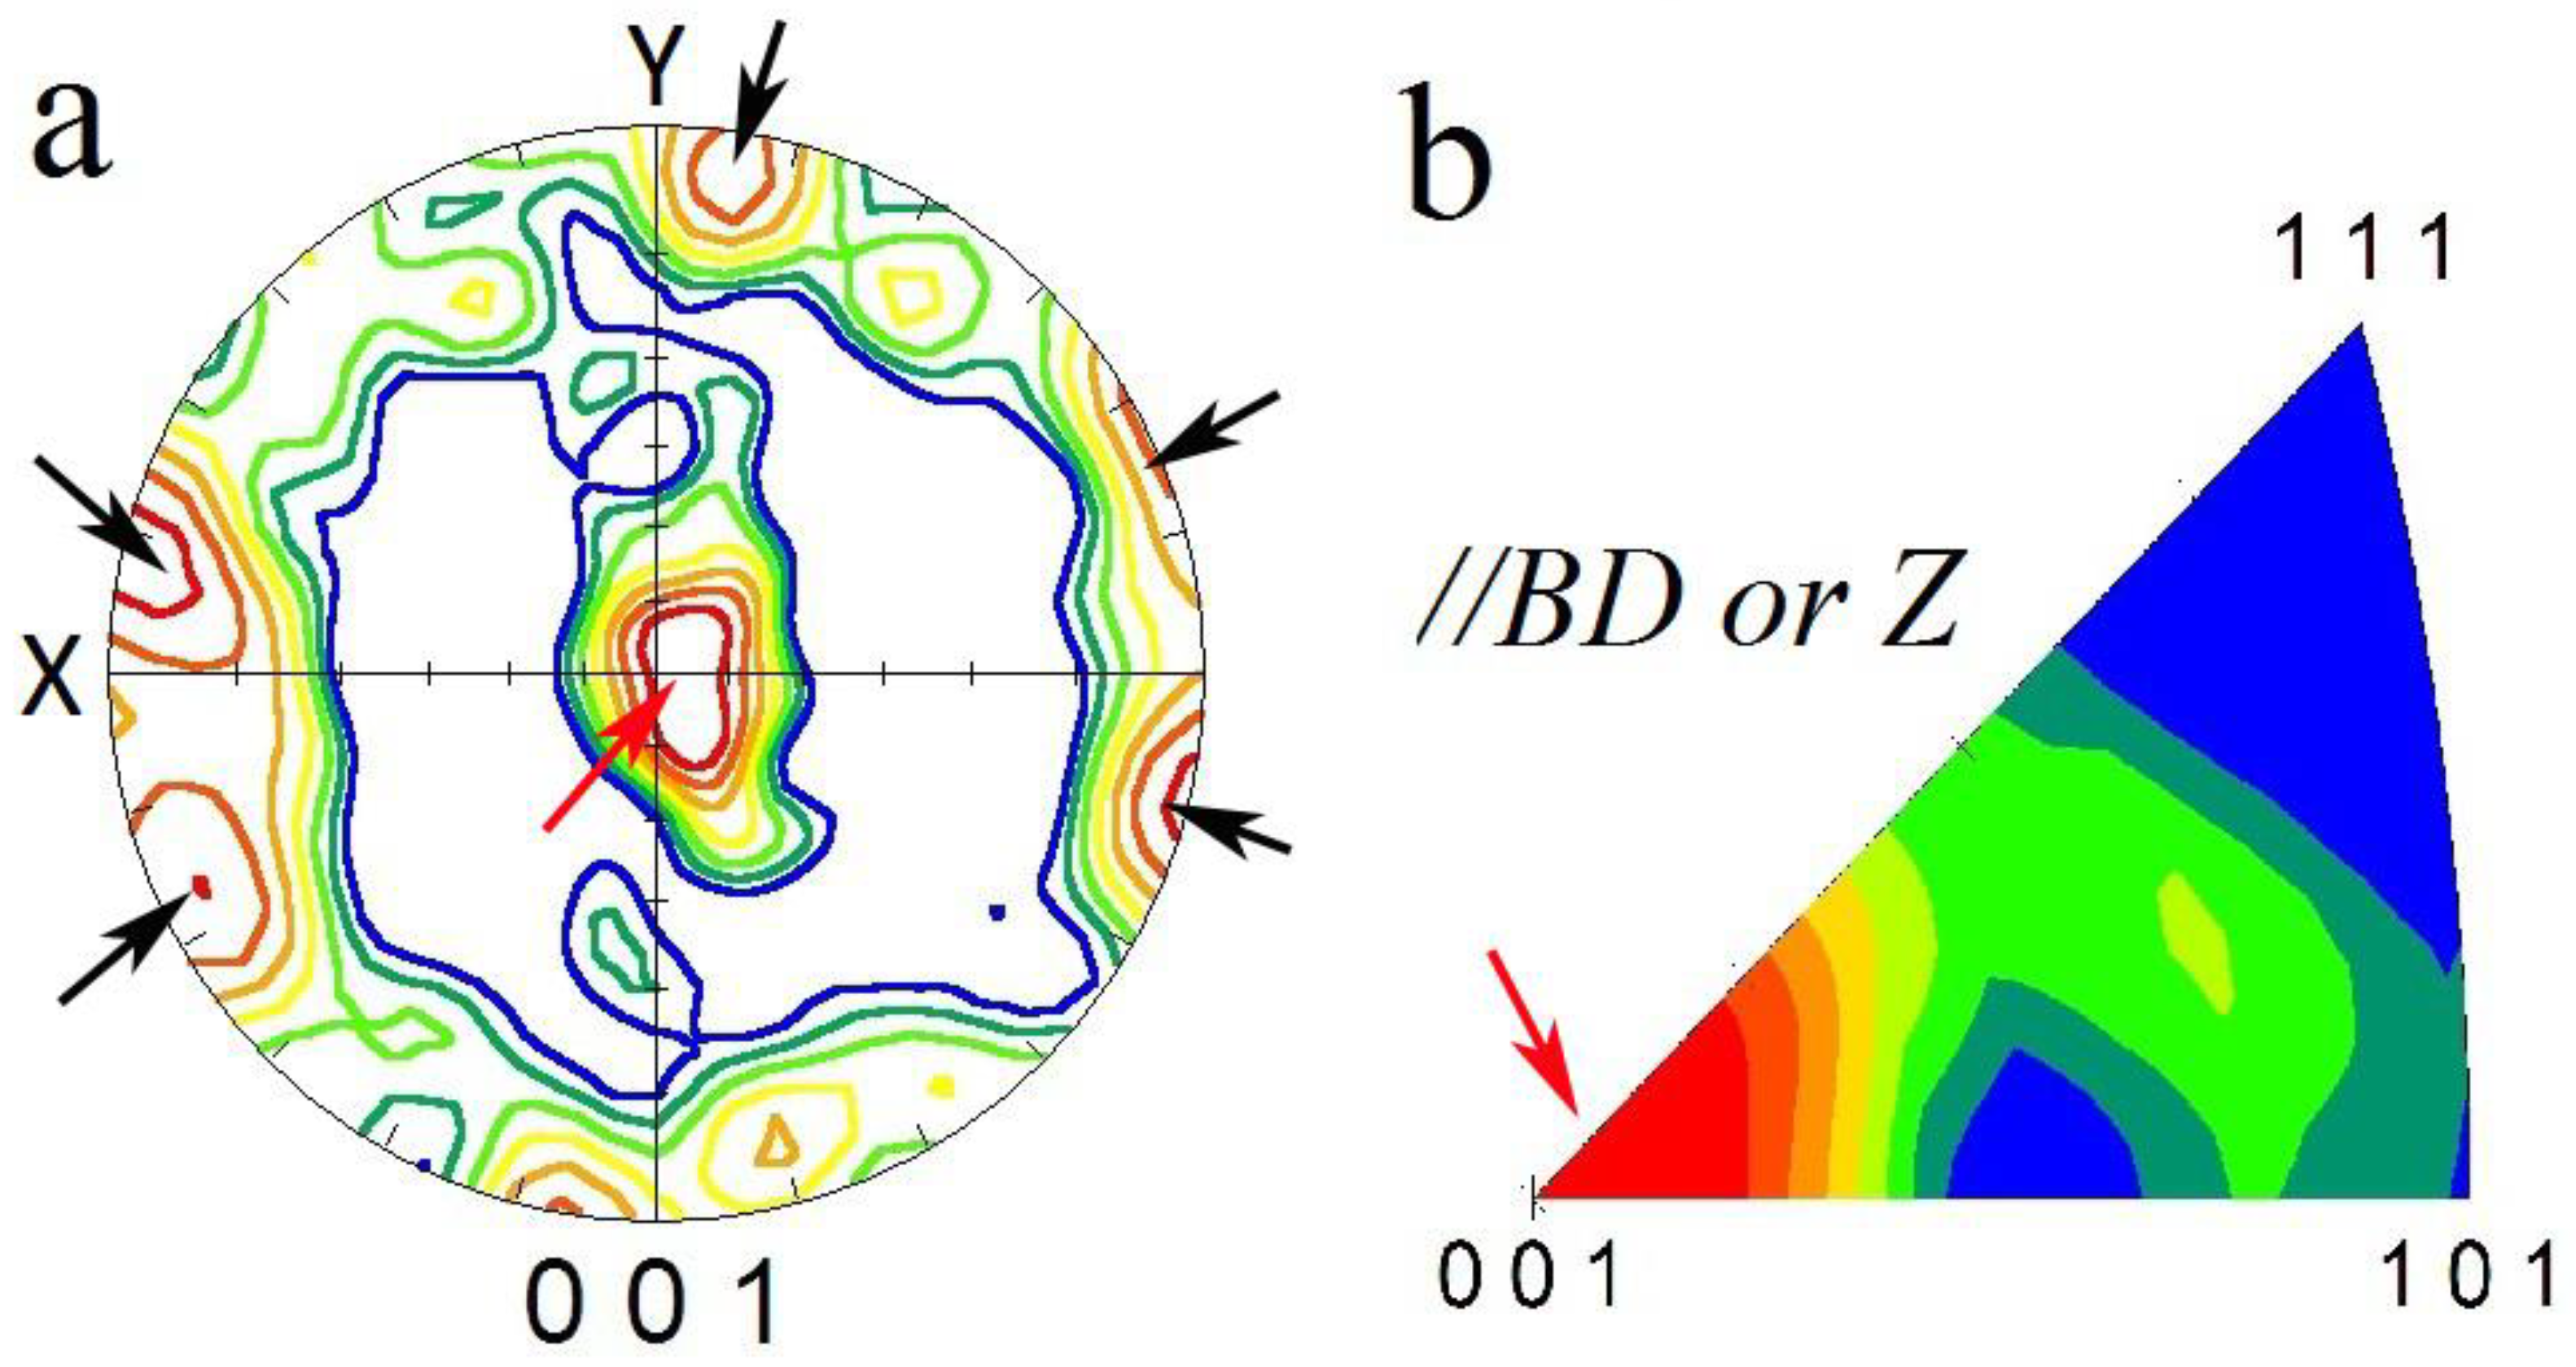
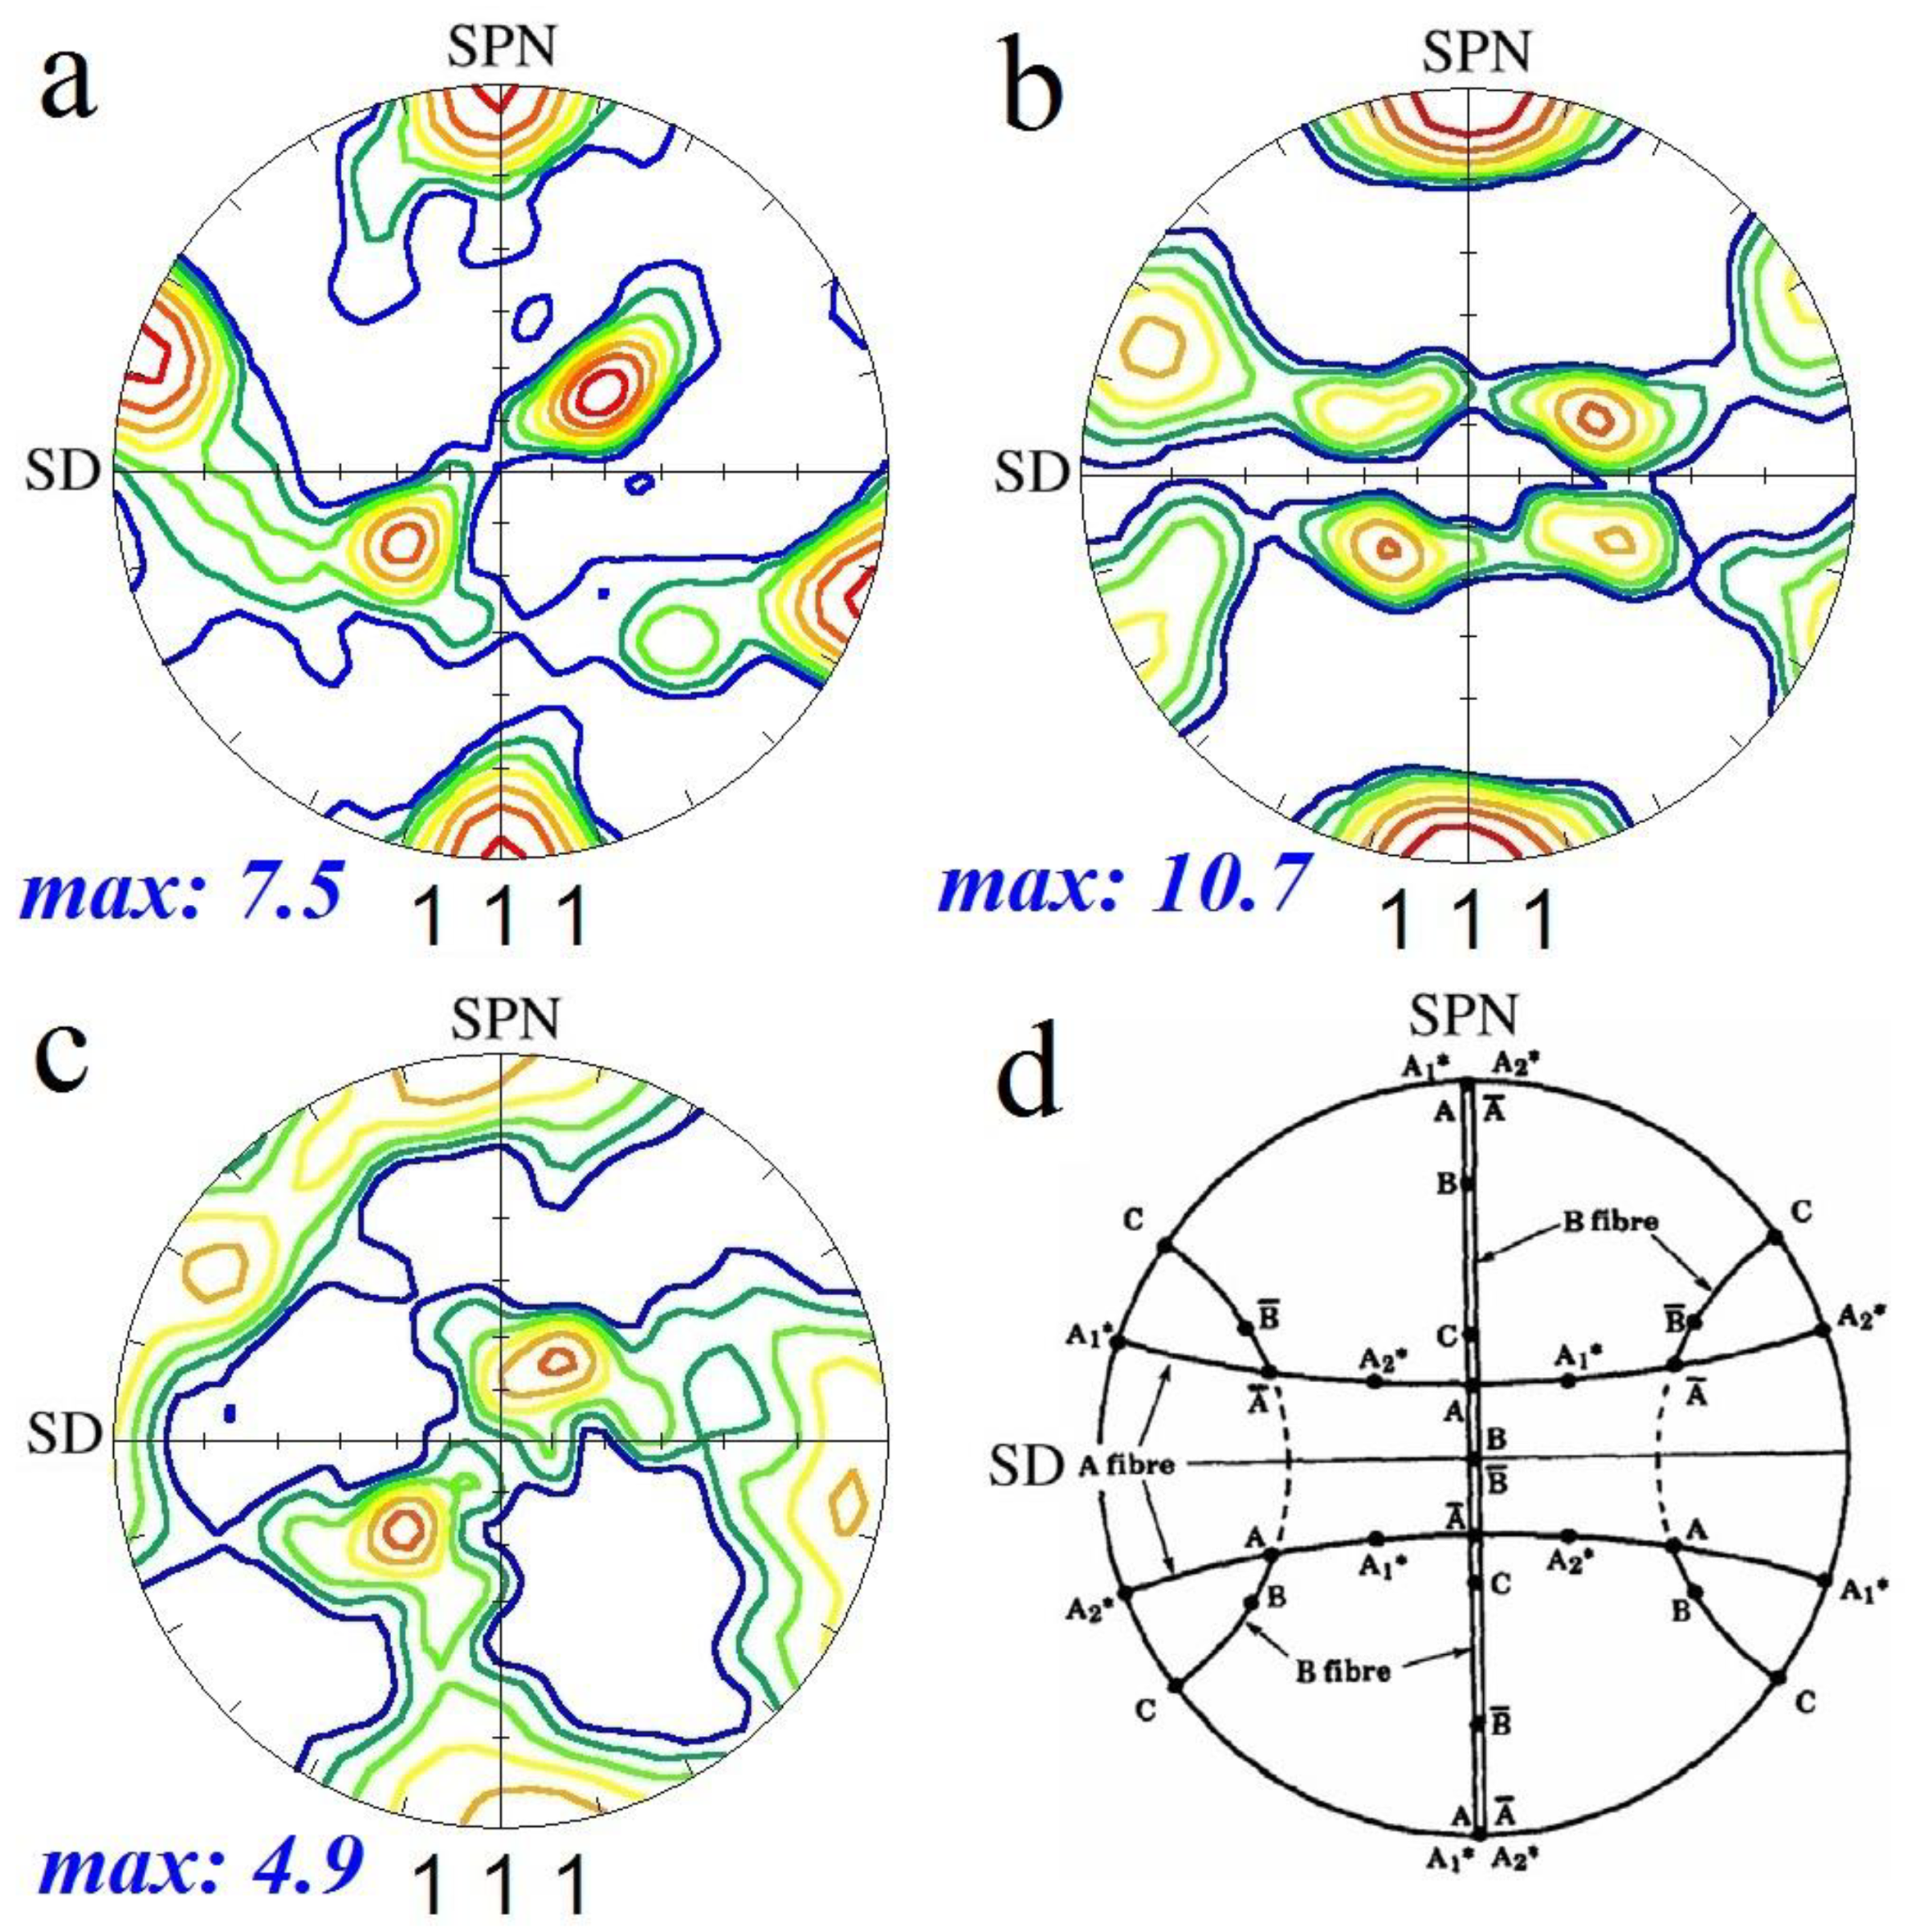
3.3. Texture
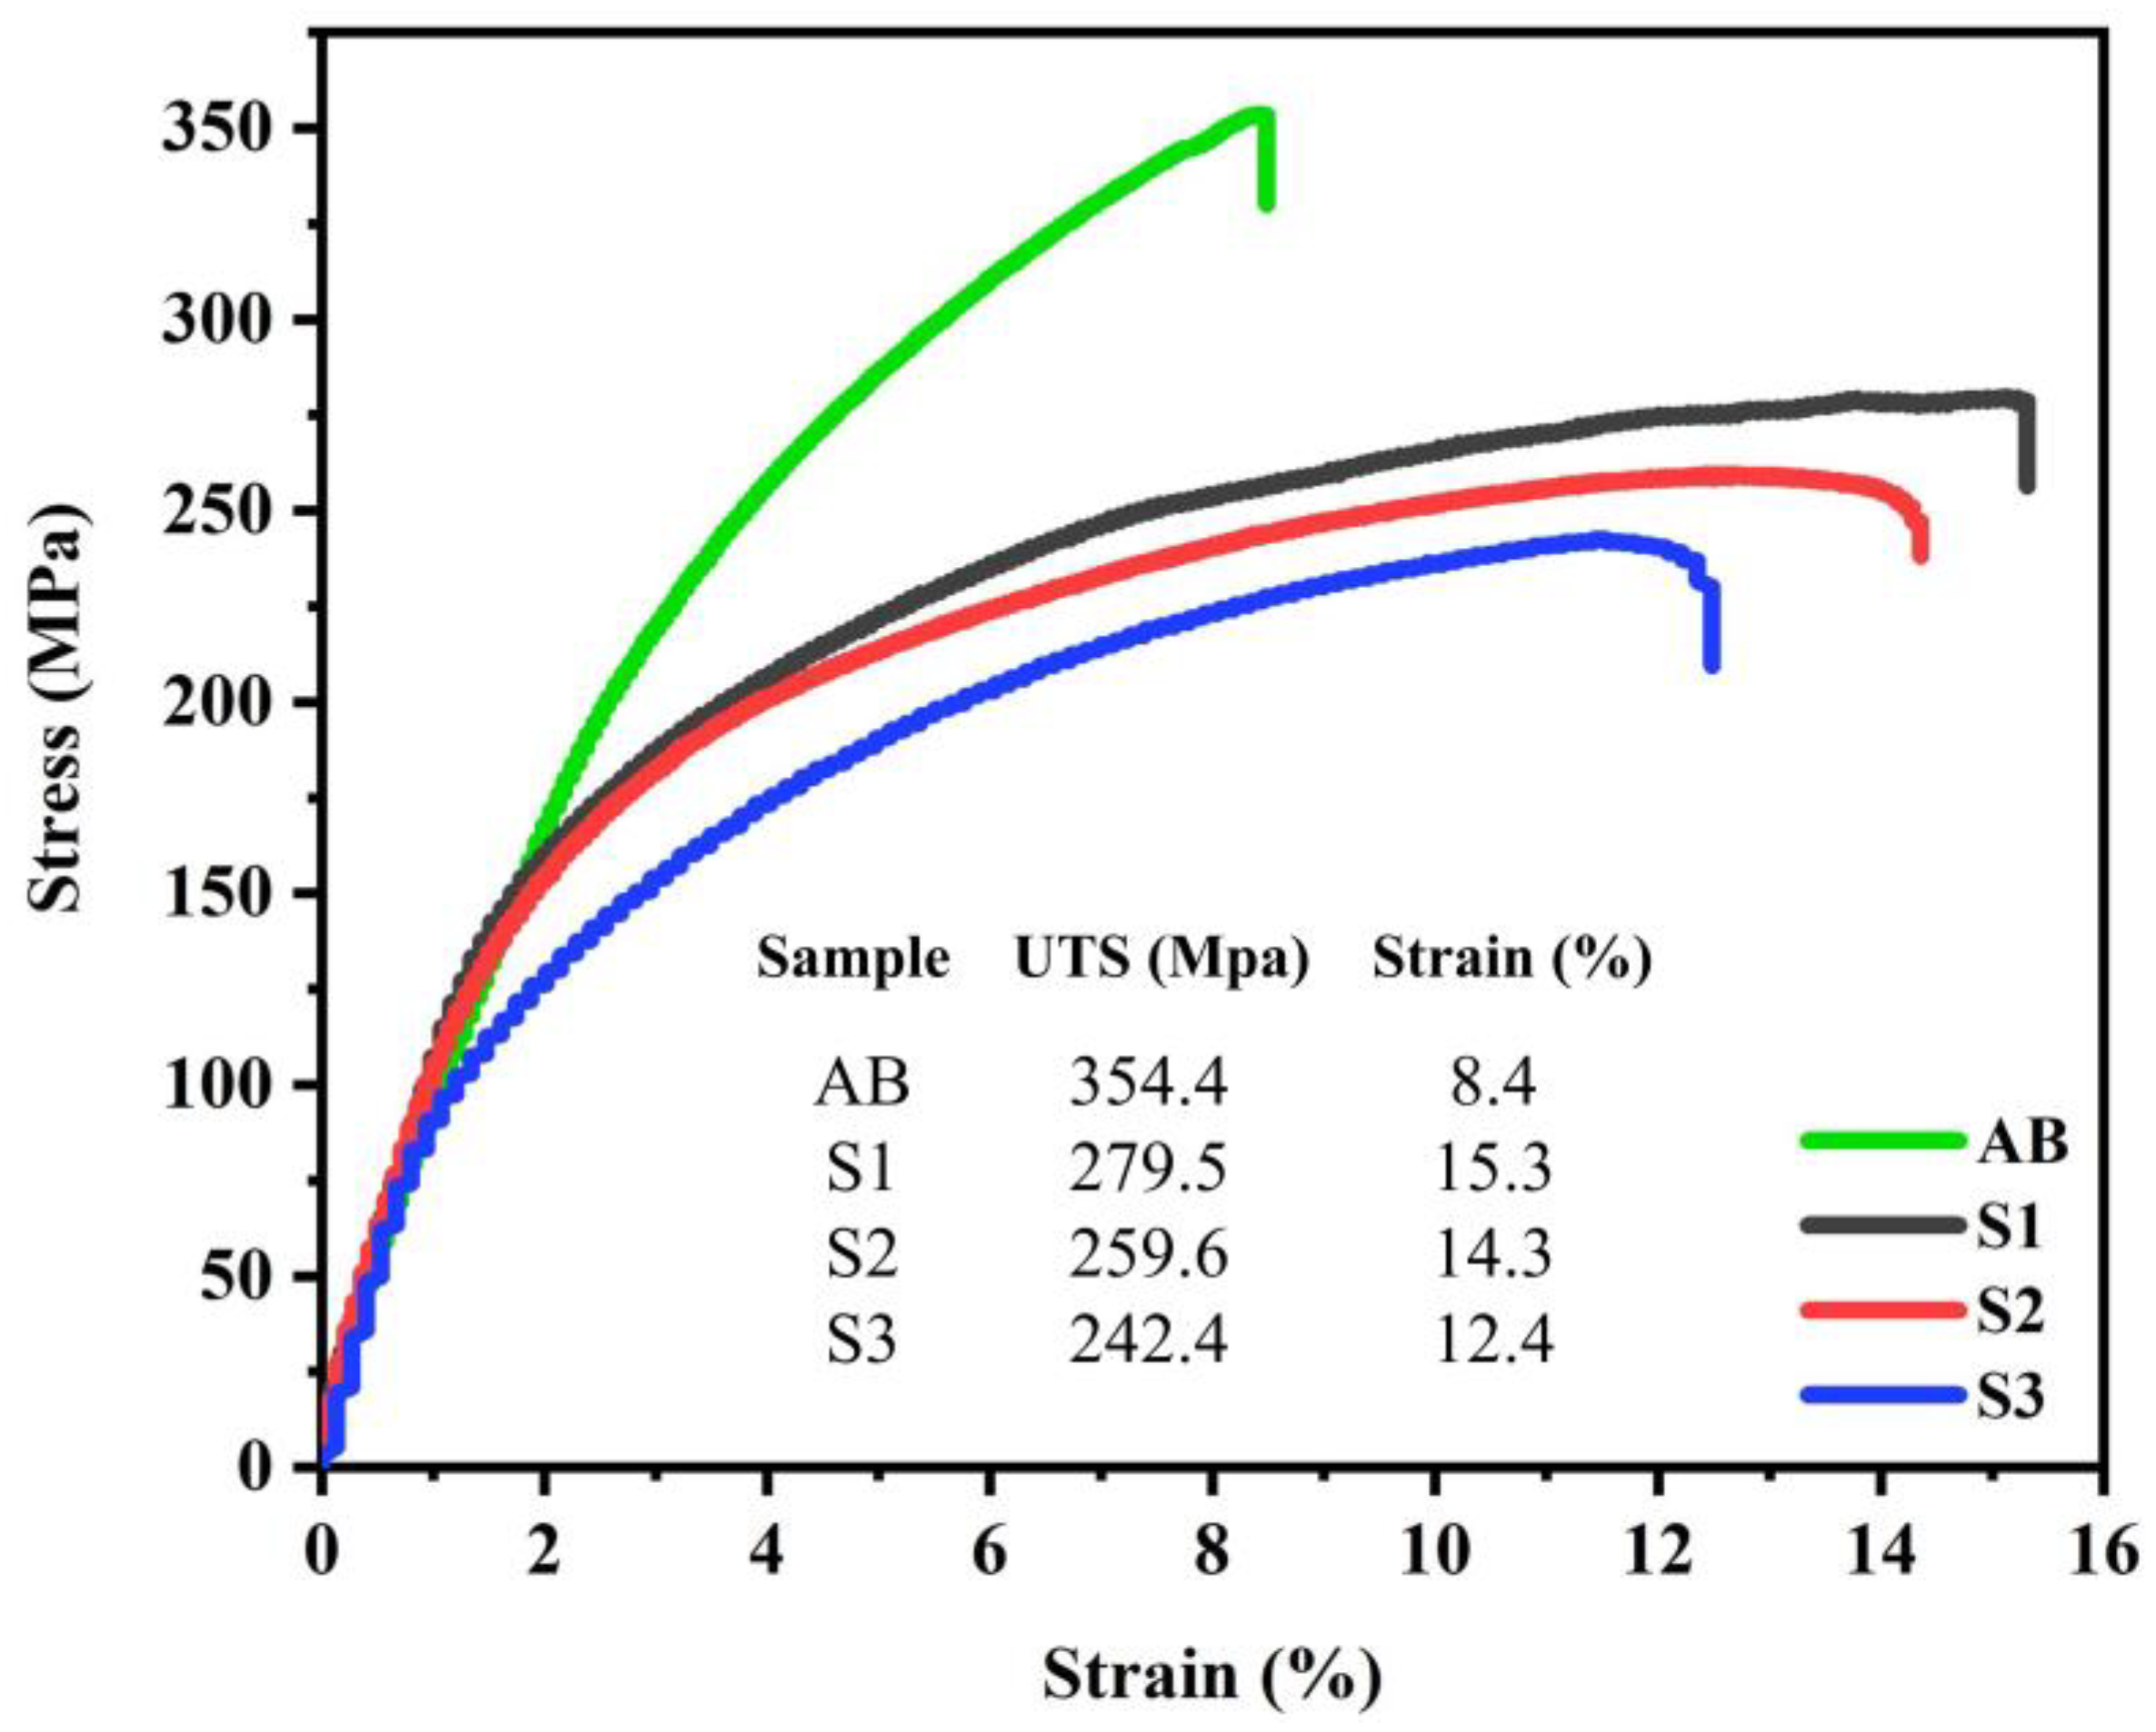
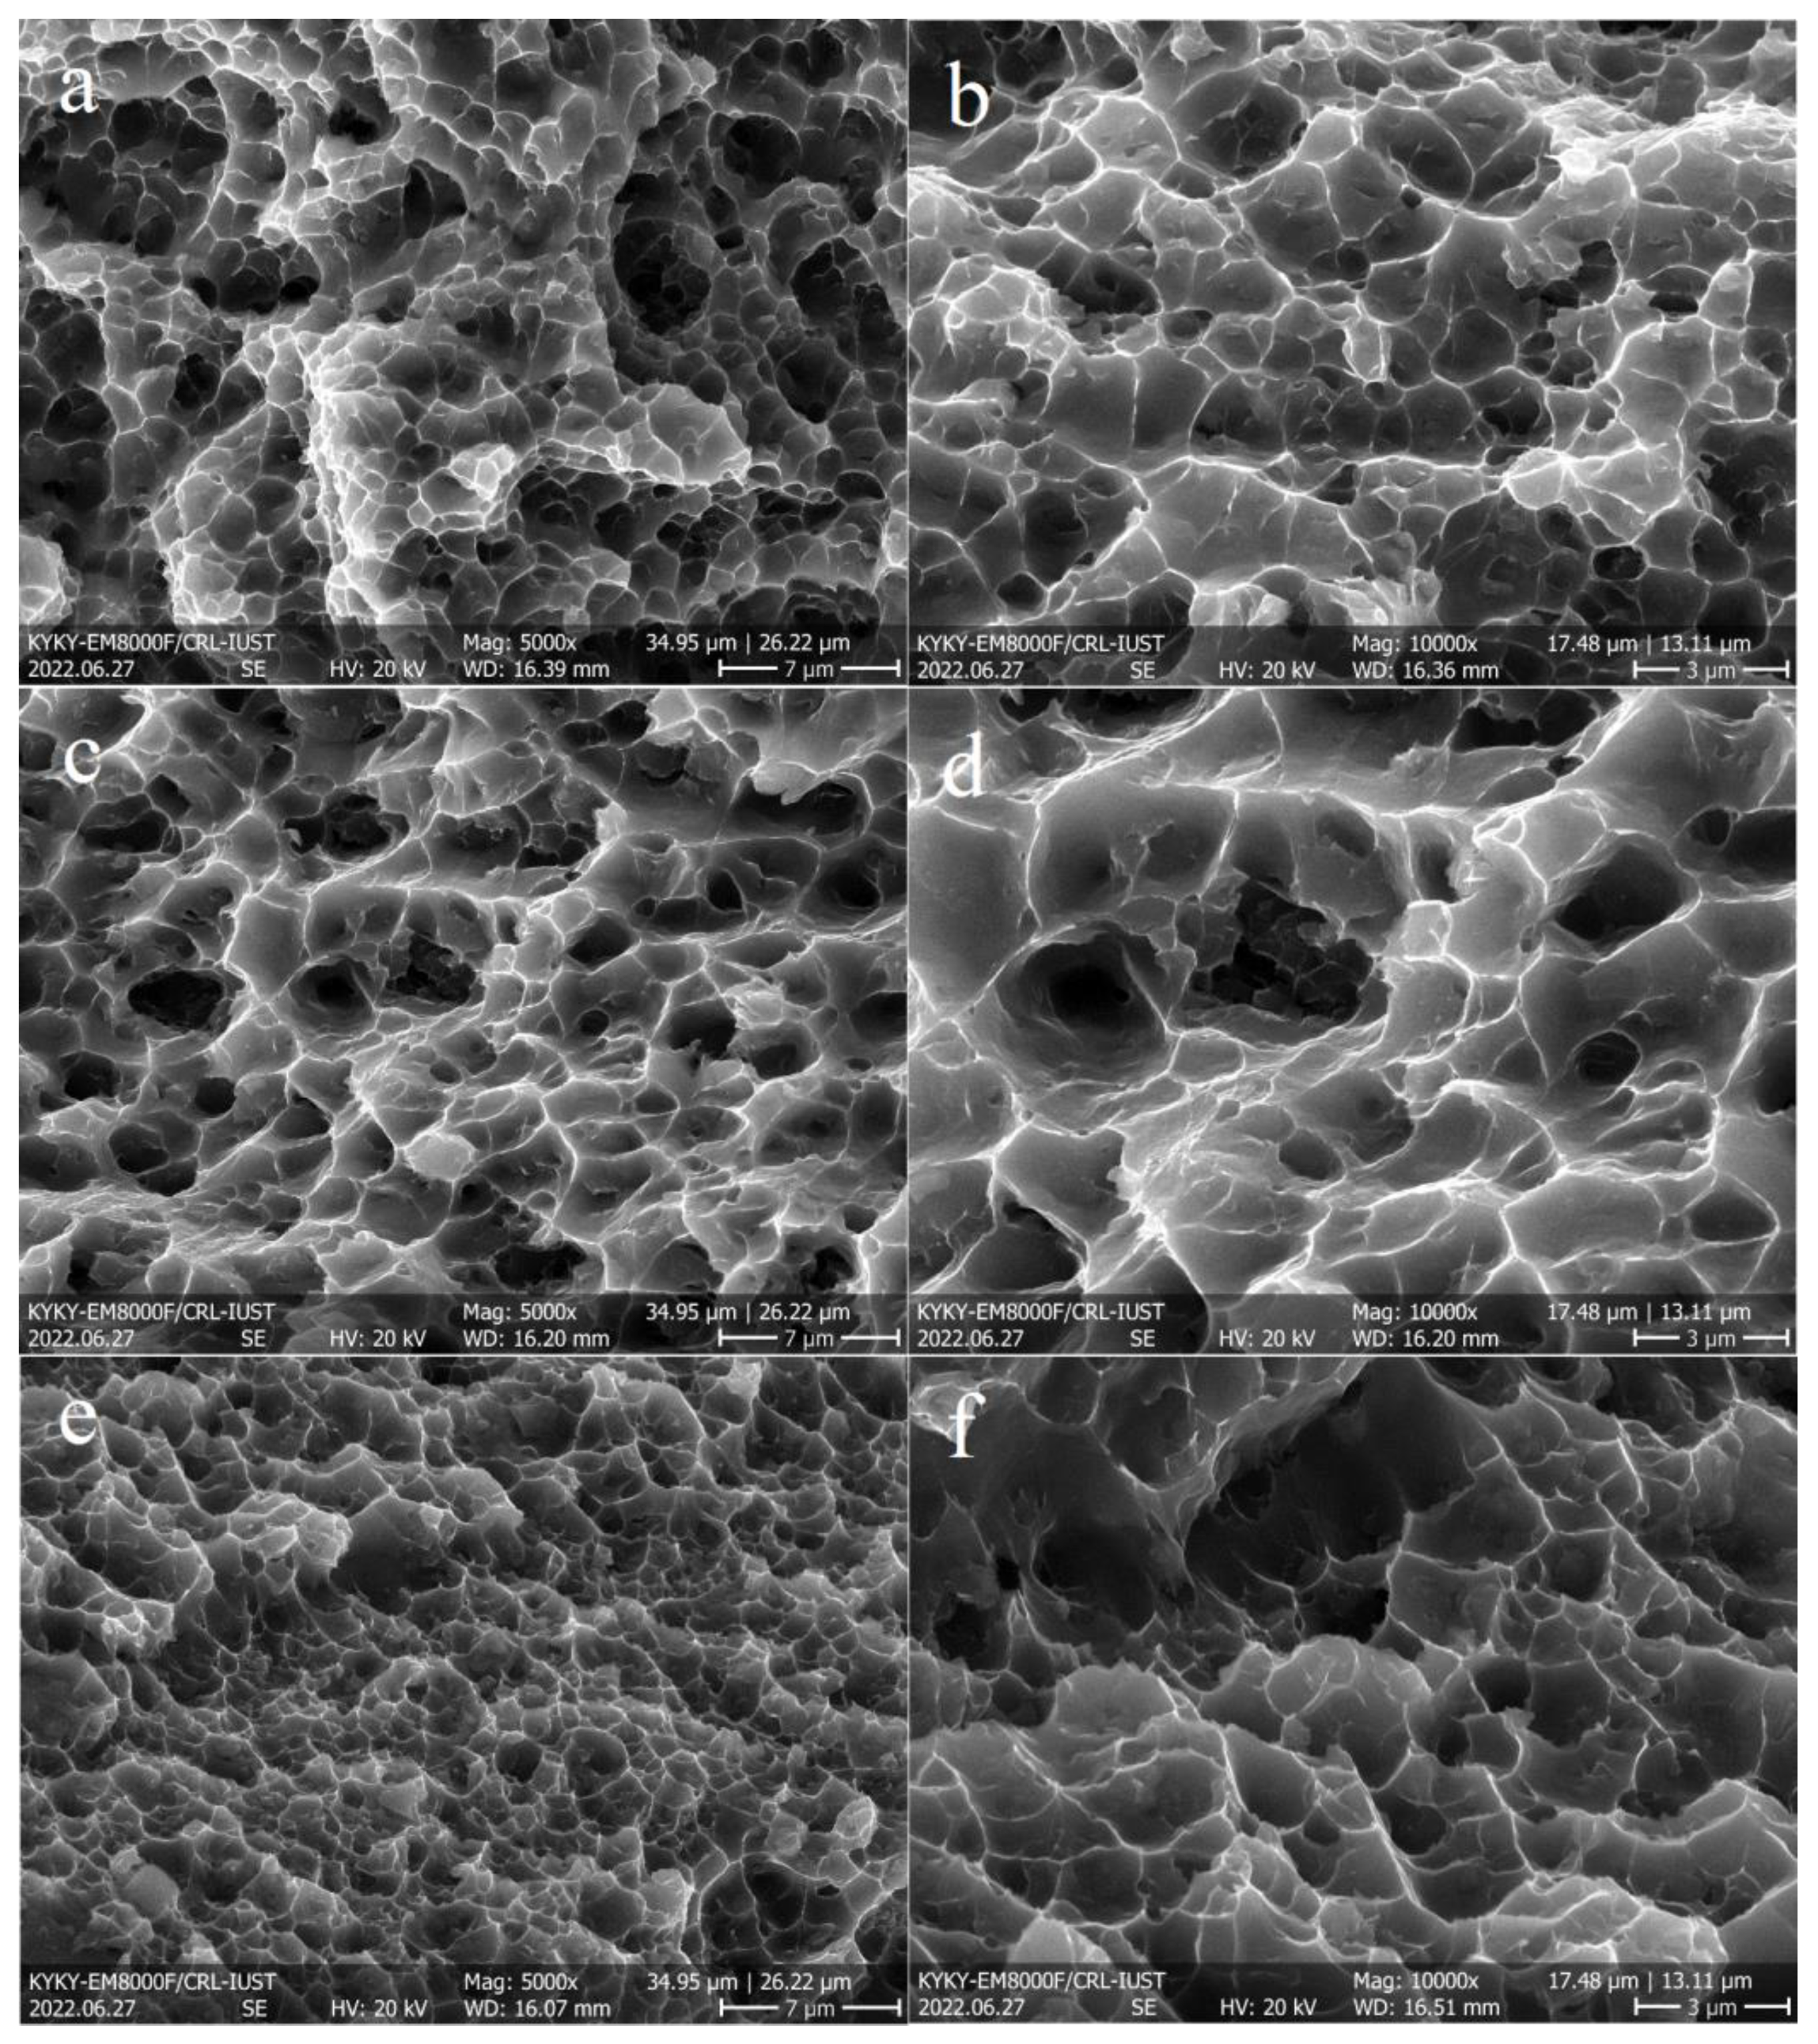
3.4. Mechanical Properties
4. Discussion
5. Conclusions
- (1)
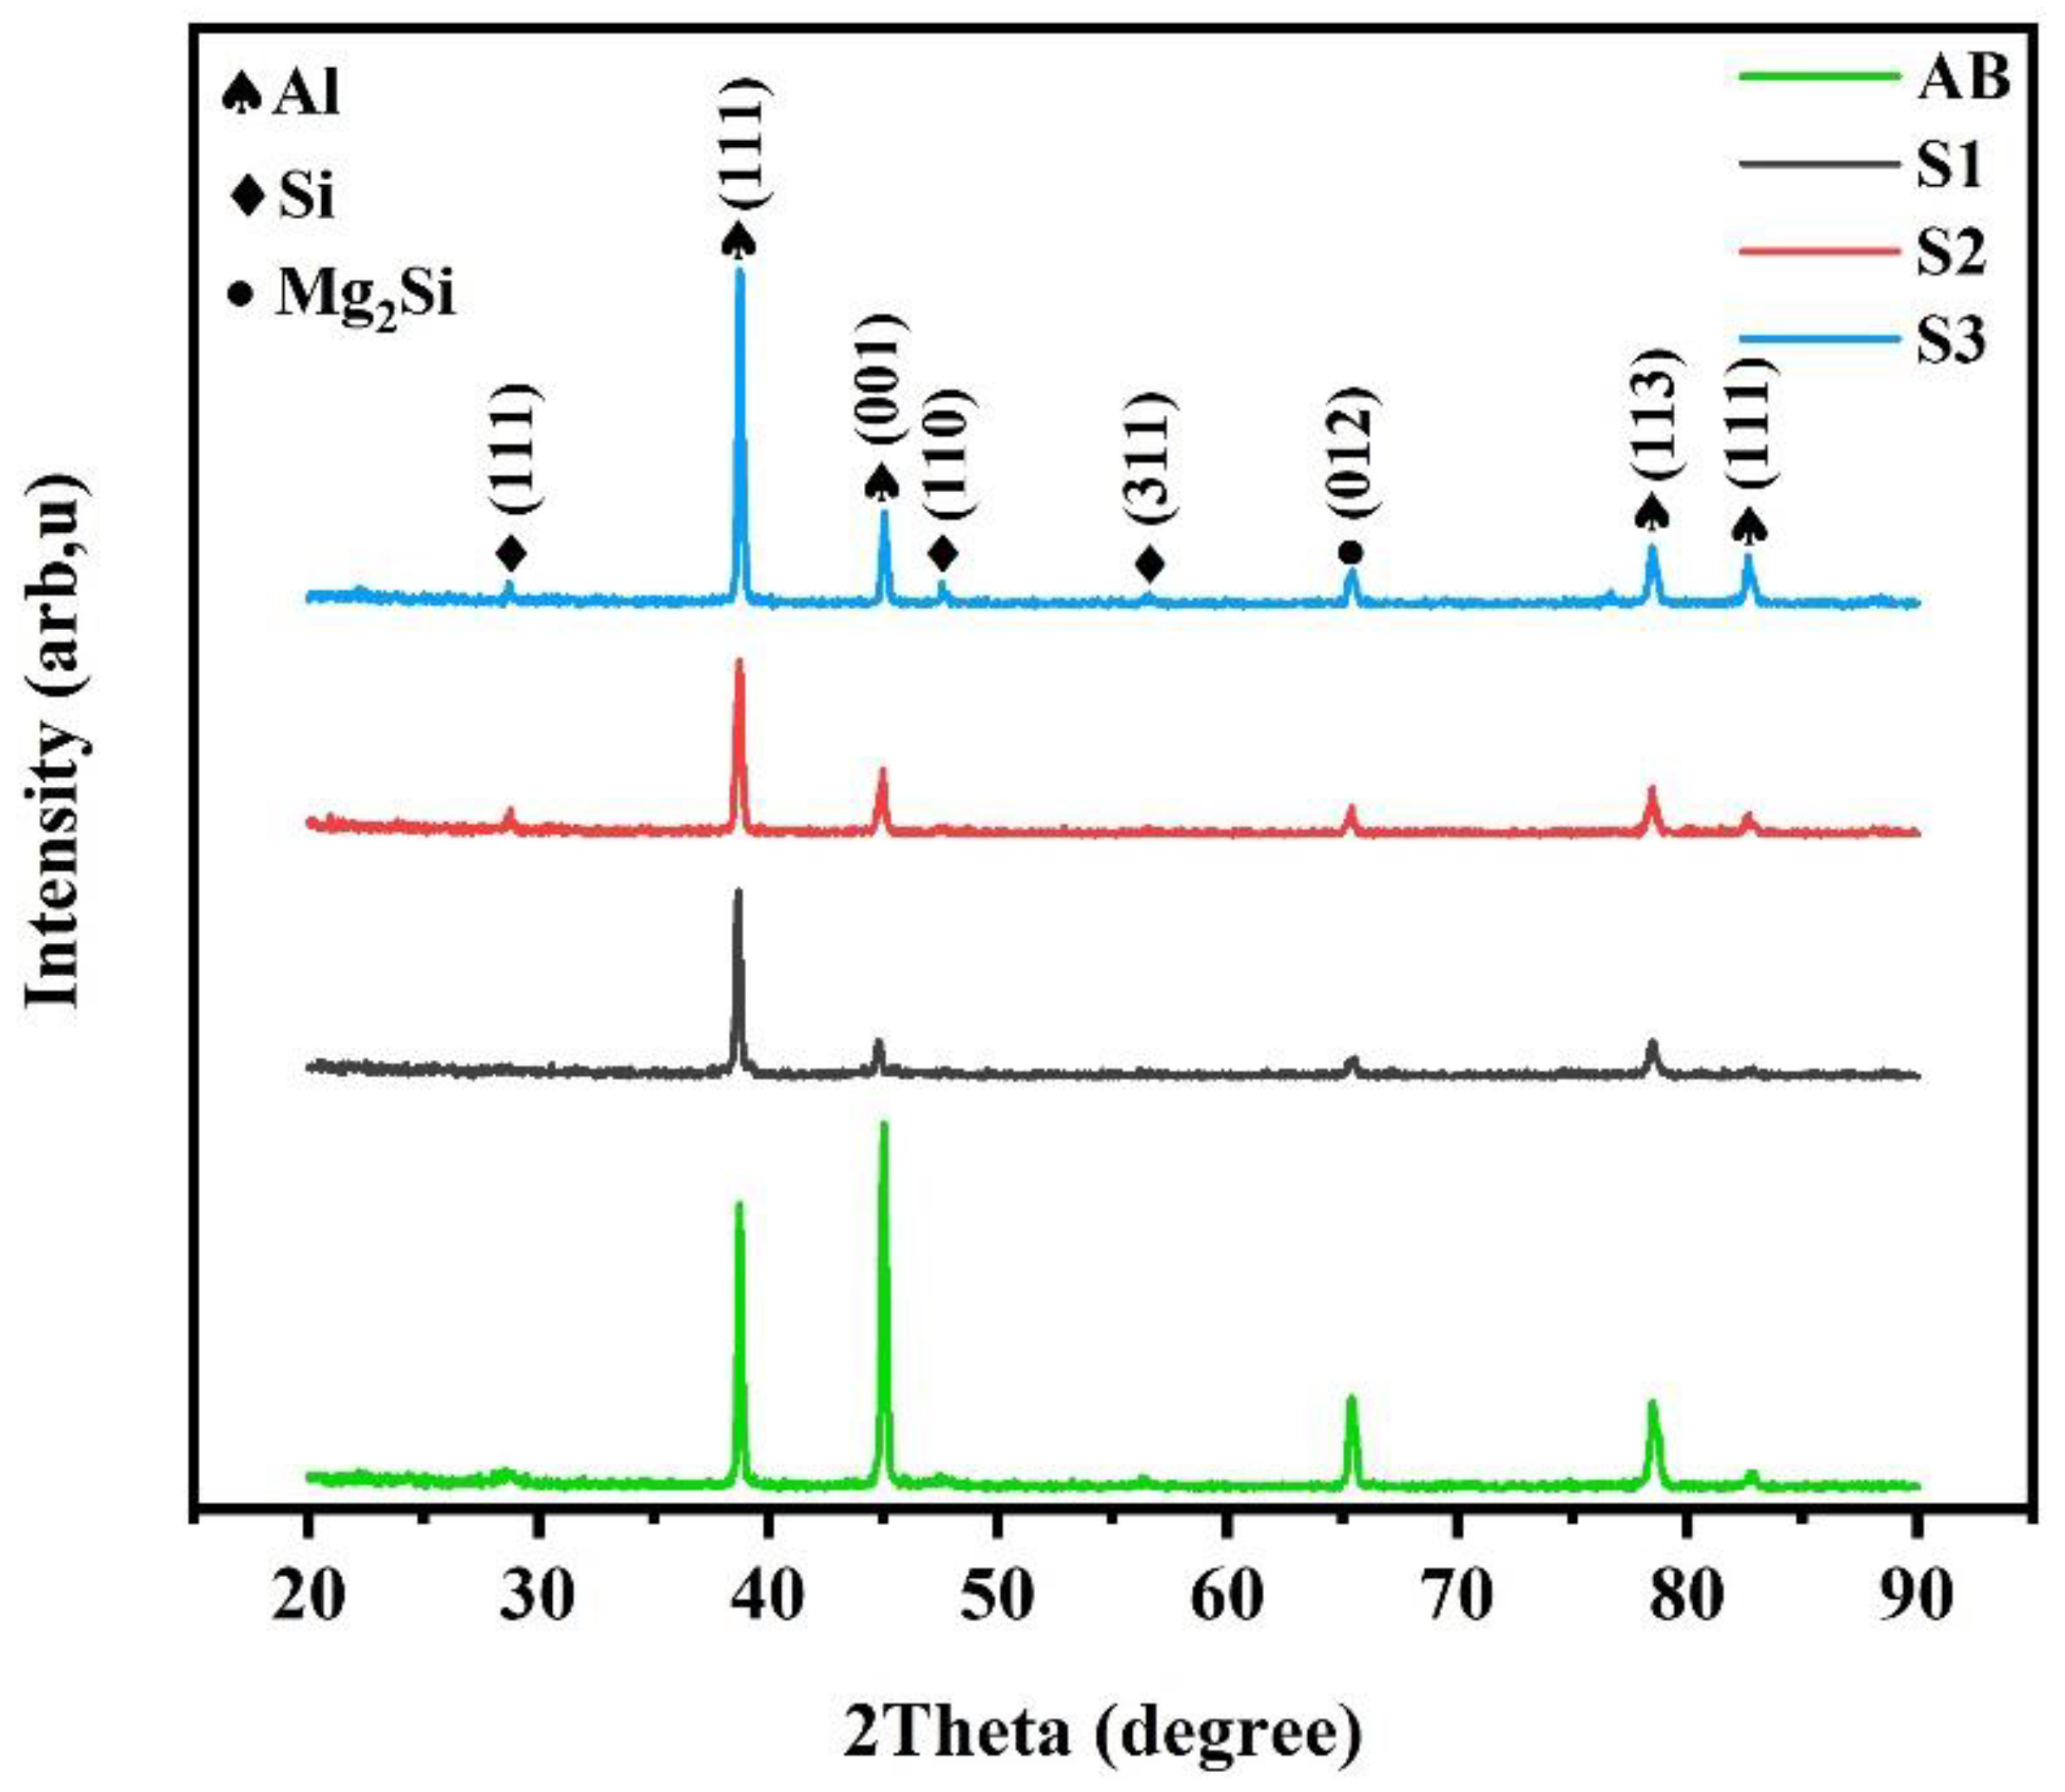
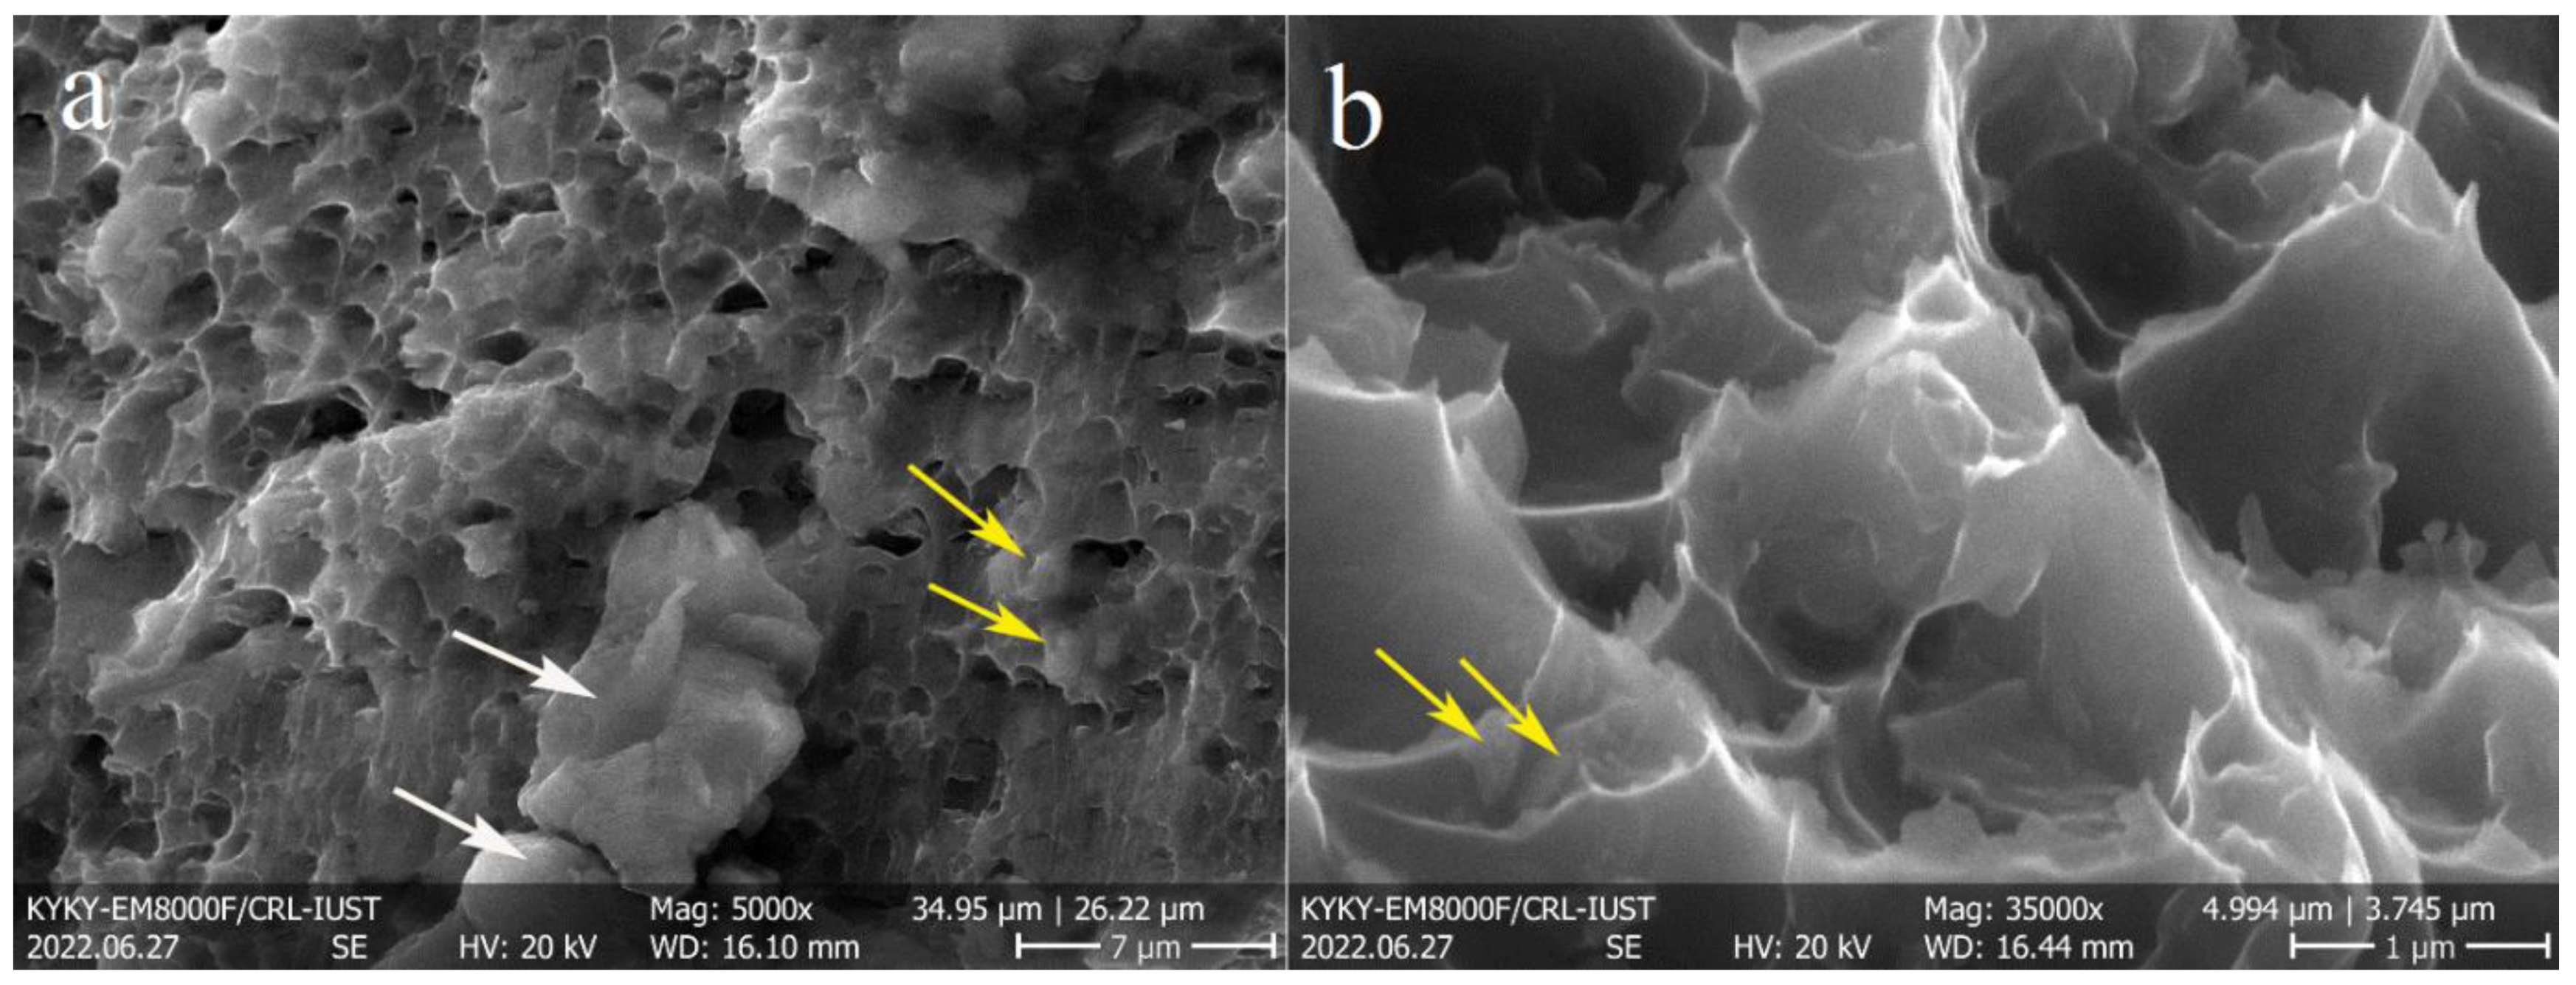
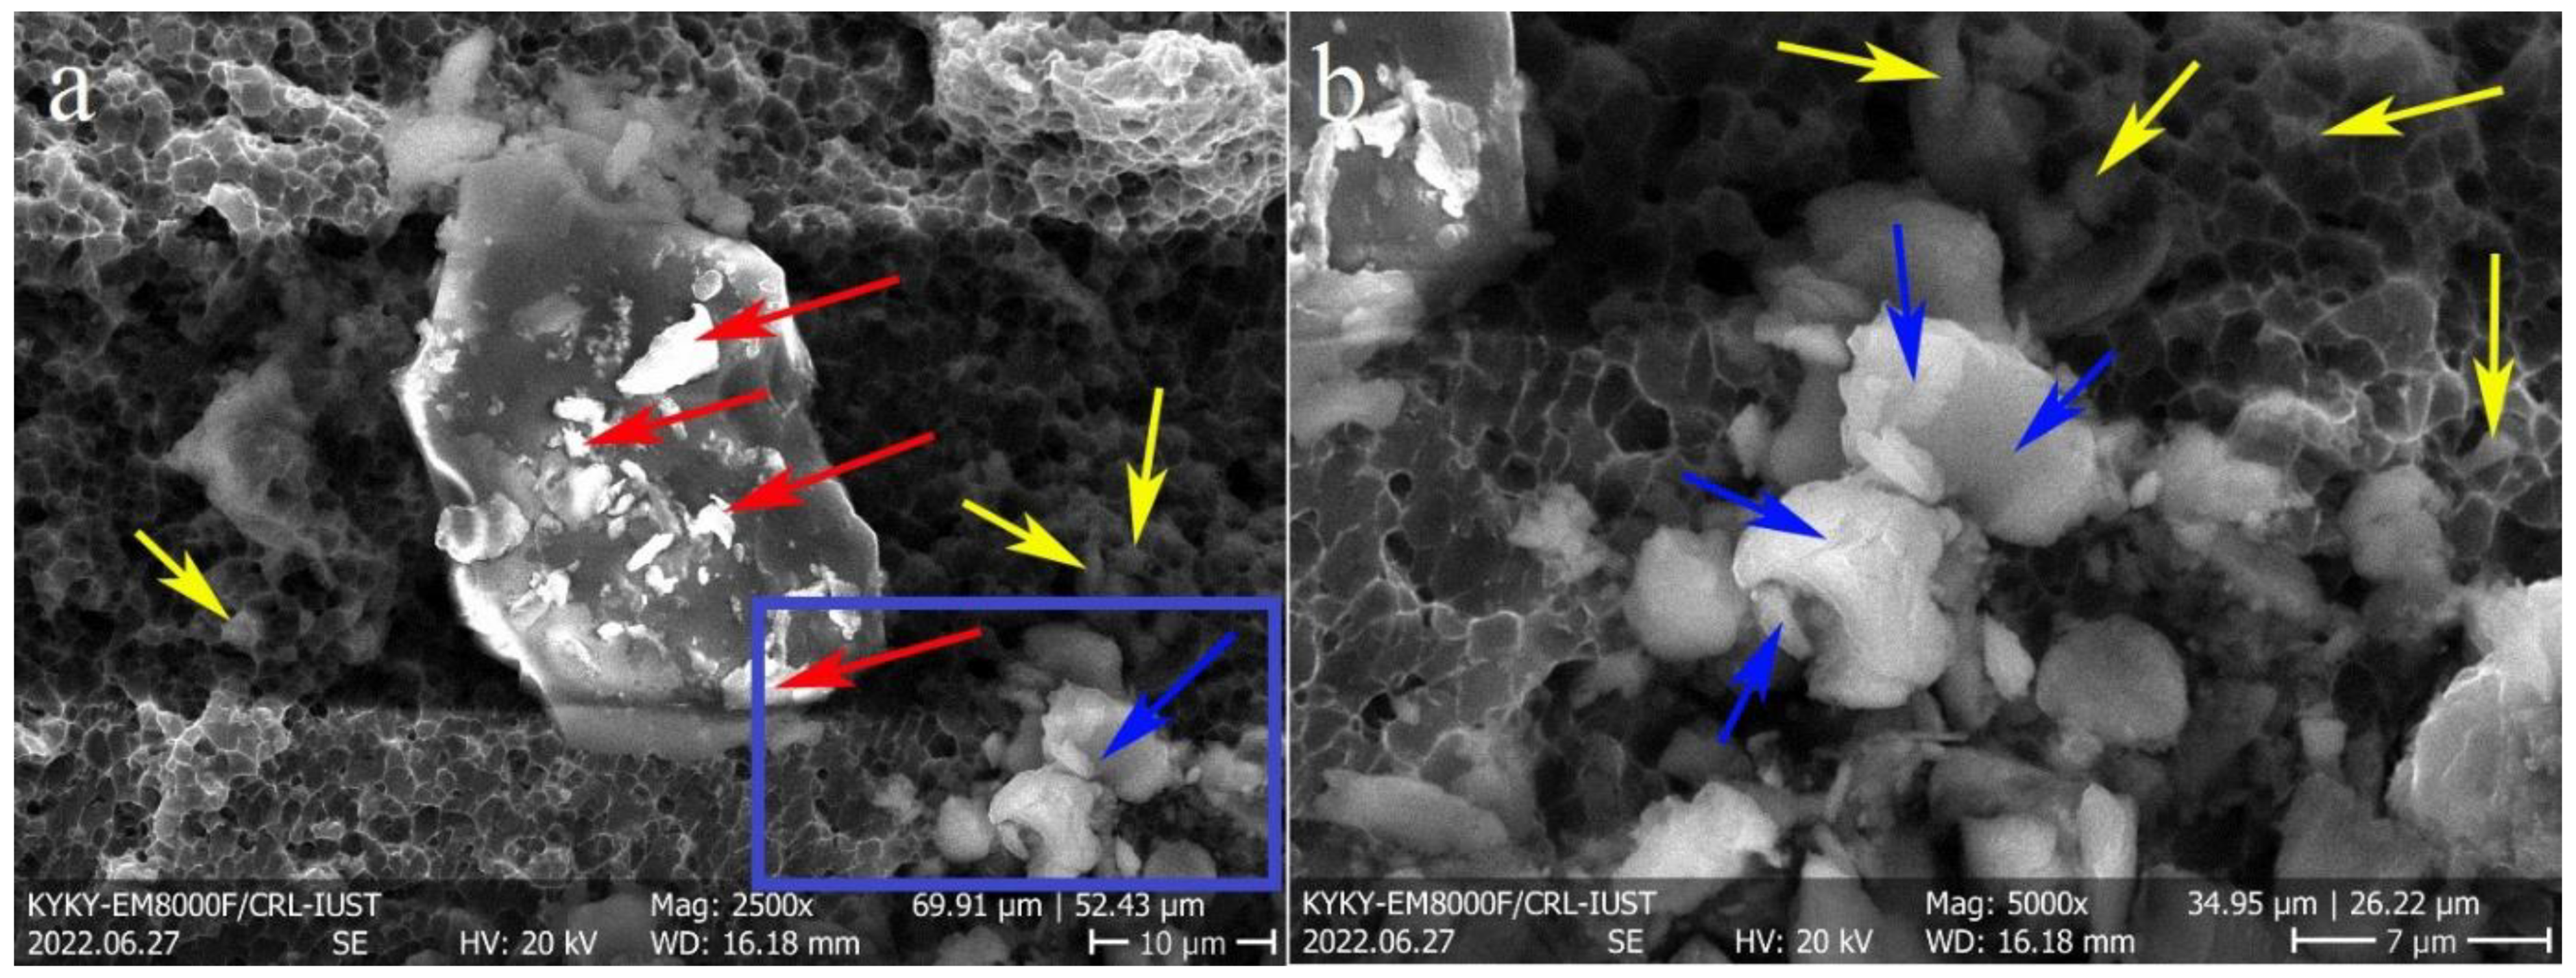
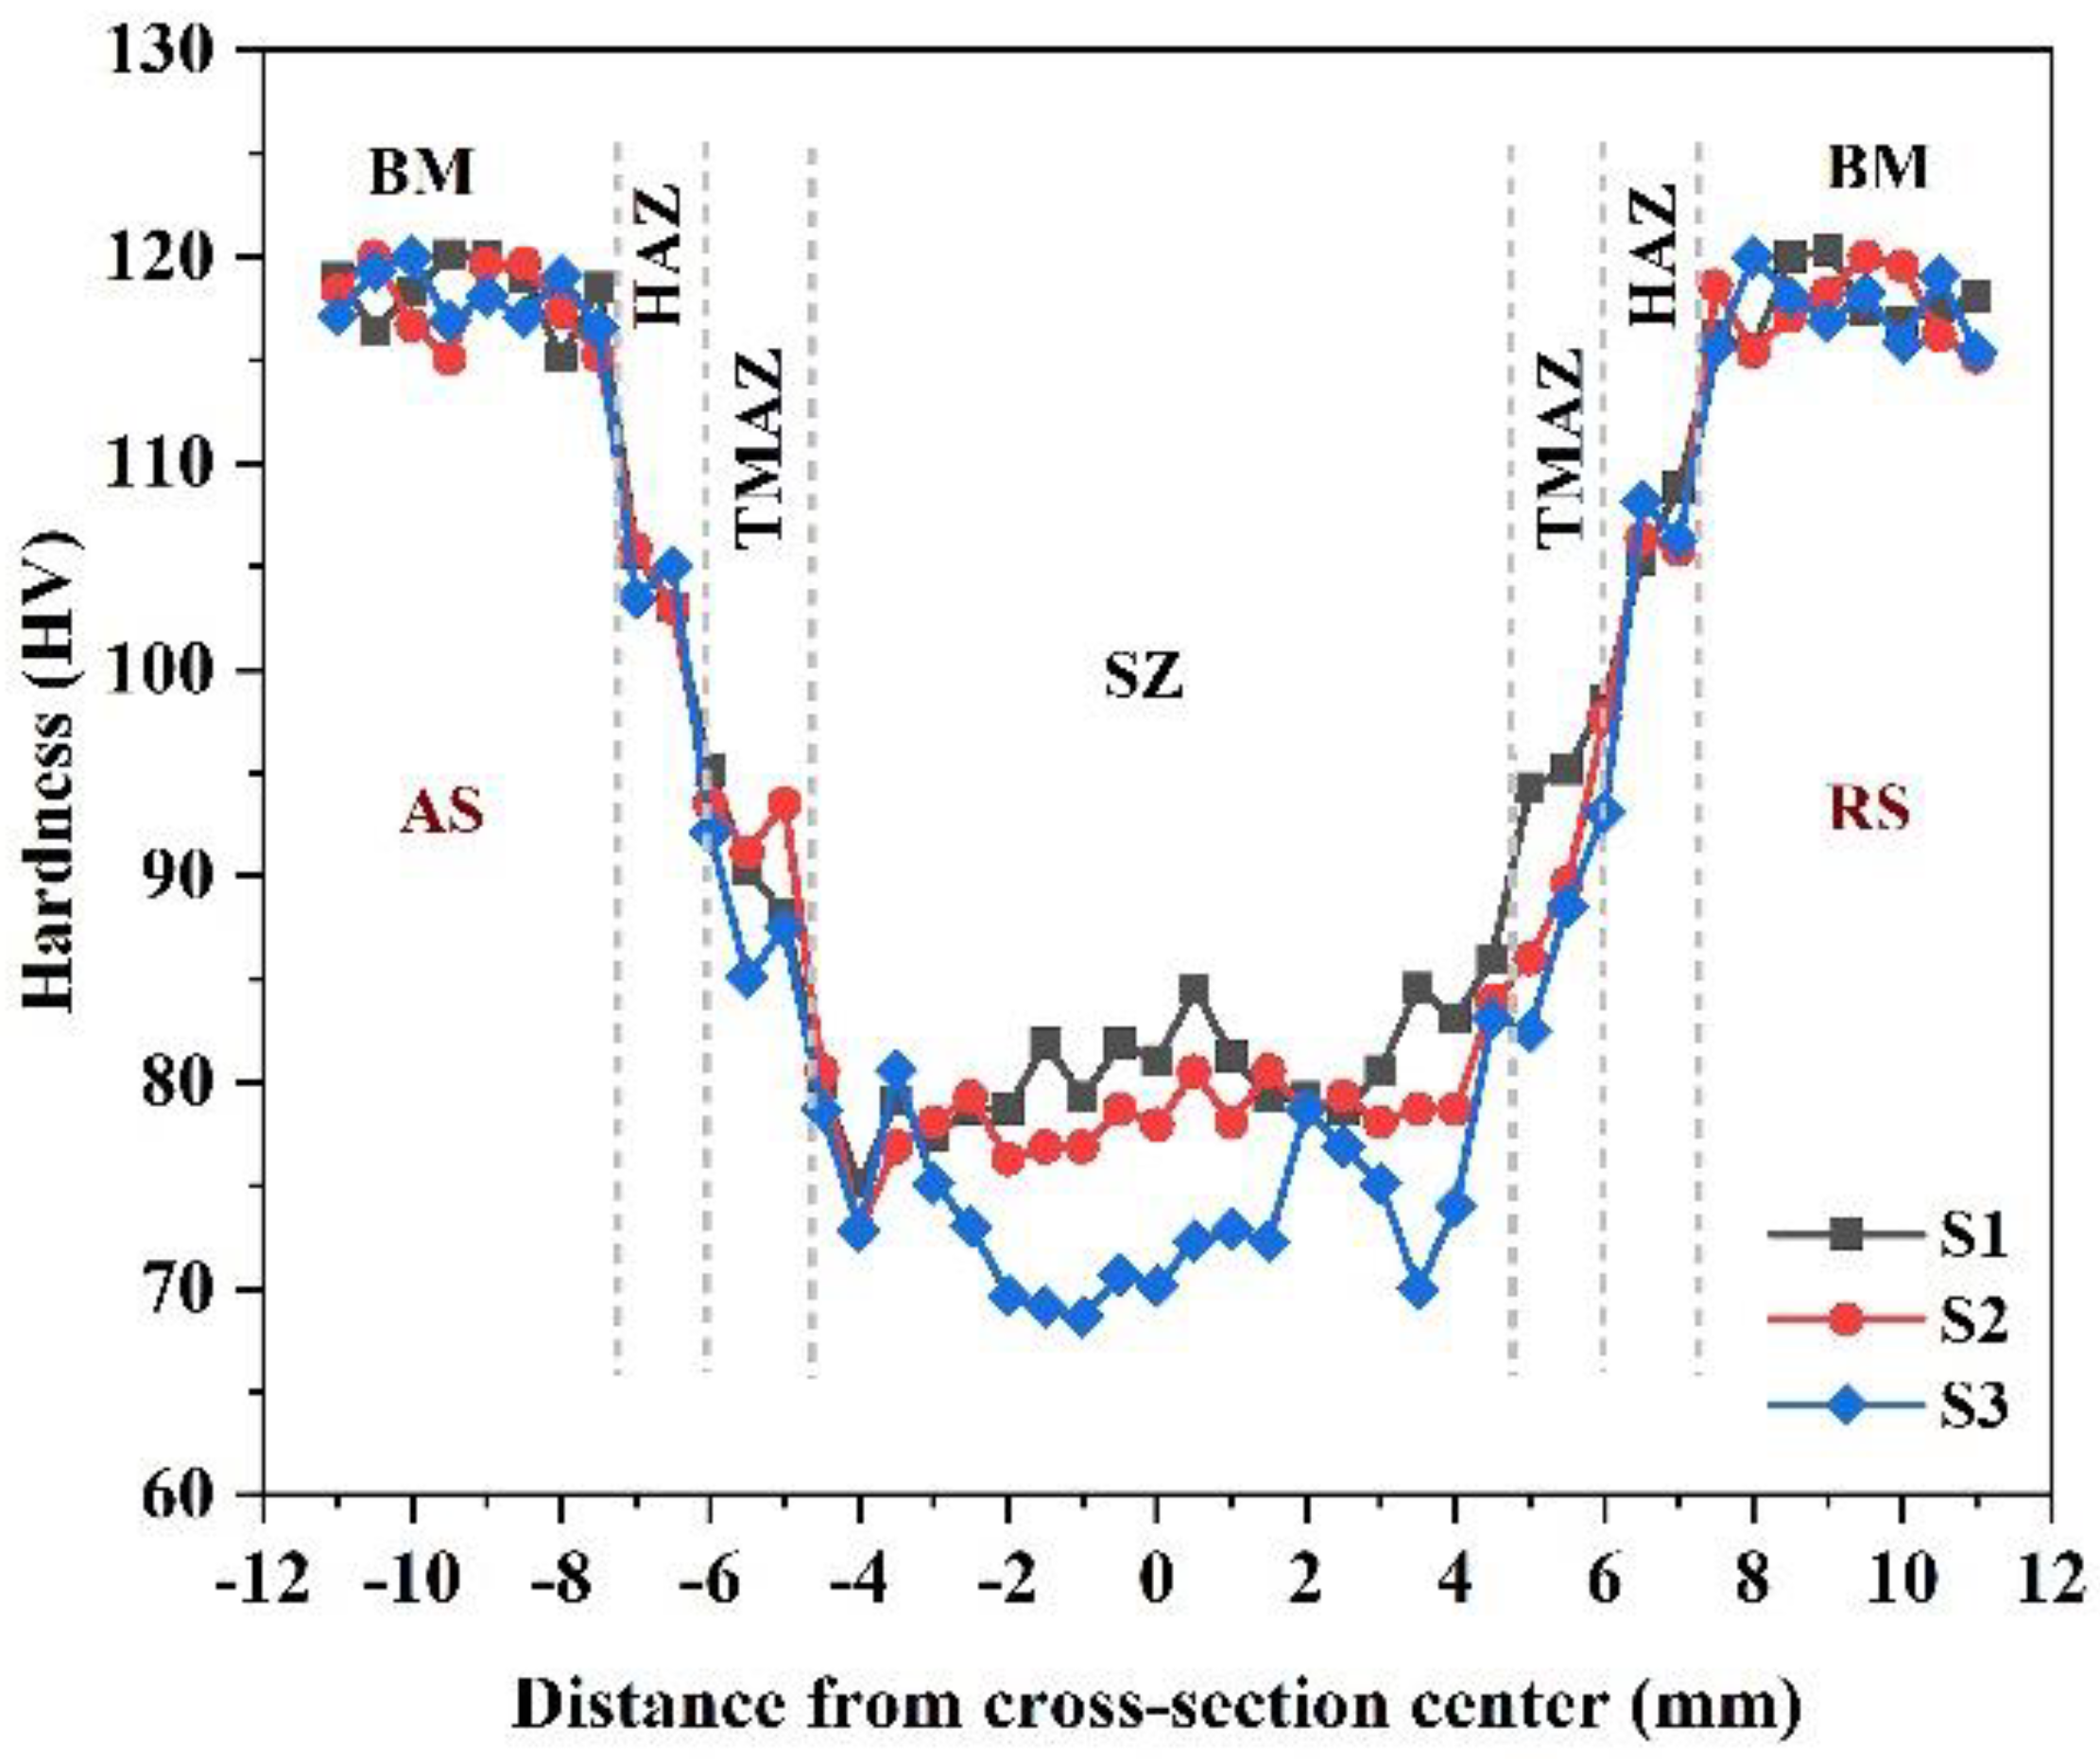
- FSP causes the formation of different microstructural zones, such as the BM, HAZ, TMAZ, and SZ, in various metals and alloys, as reported in literature. However, in the case of L-PBF AlSi10Mg, the SZs comprised two distinct fine and coarse regions in accordance with the size of the Si particles. The amount of coarse SZ in the one- and two-pass FSPed samples was negligible. However, in the three-pass FSPed sample, a significant part of the SZ belonged to the coarse SZ.
- (2)
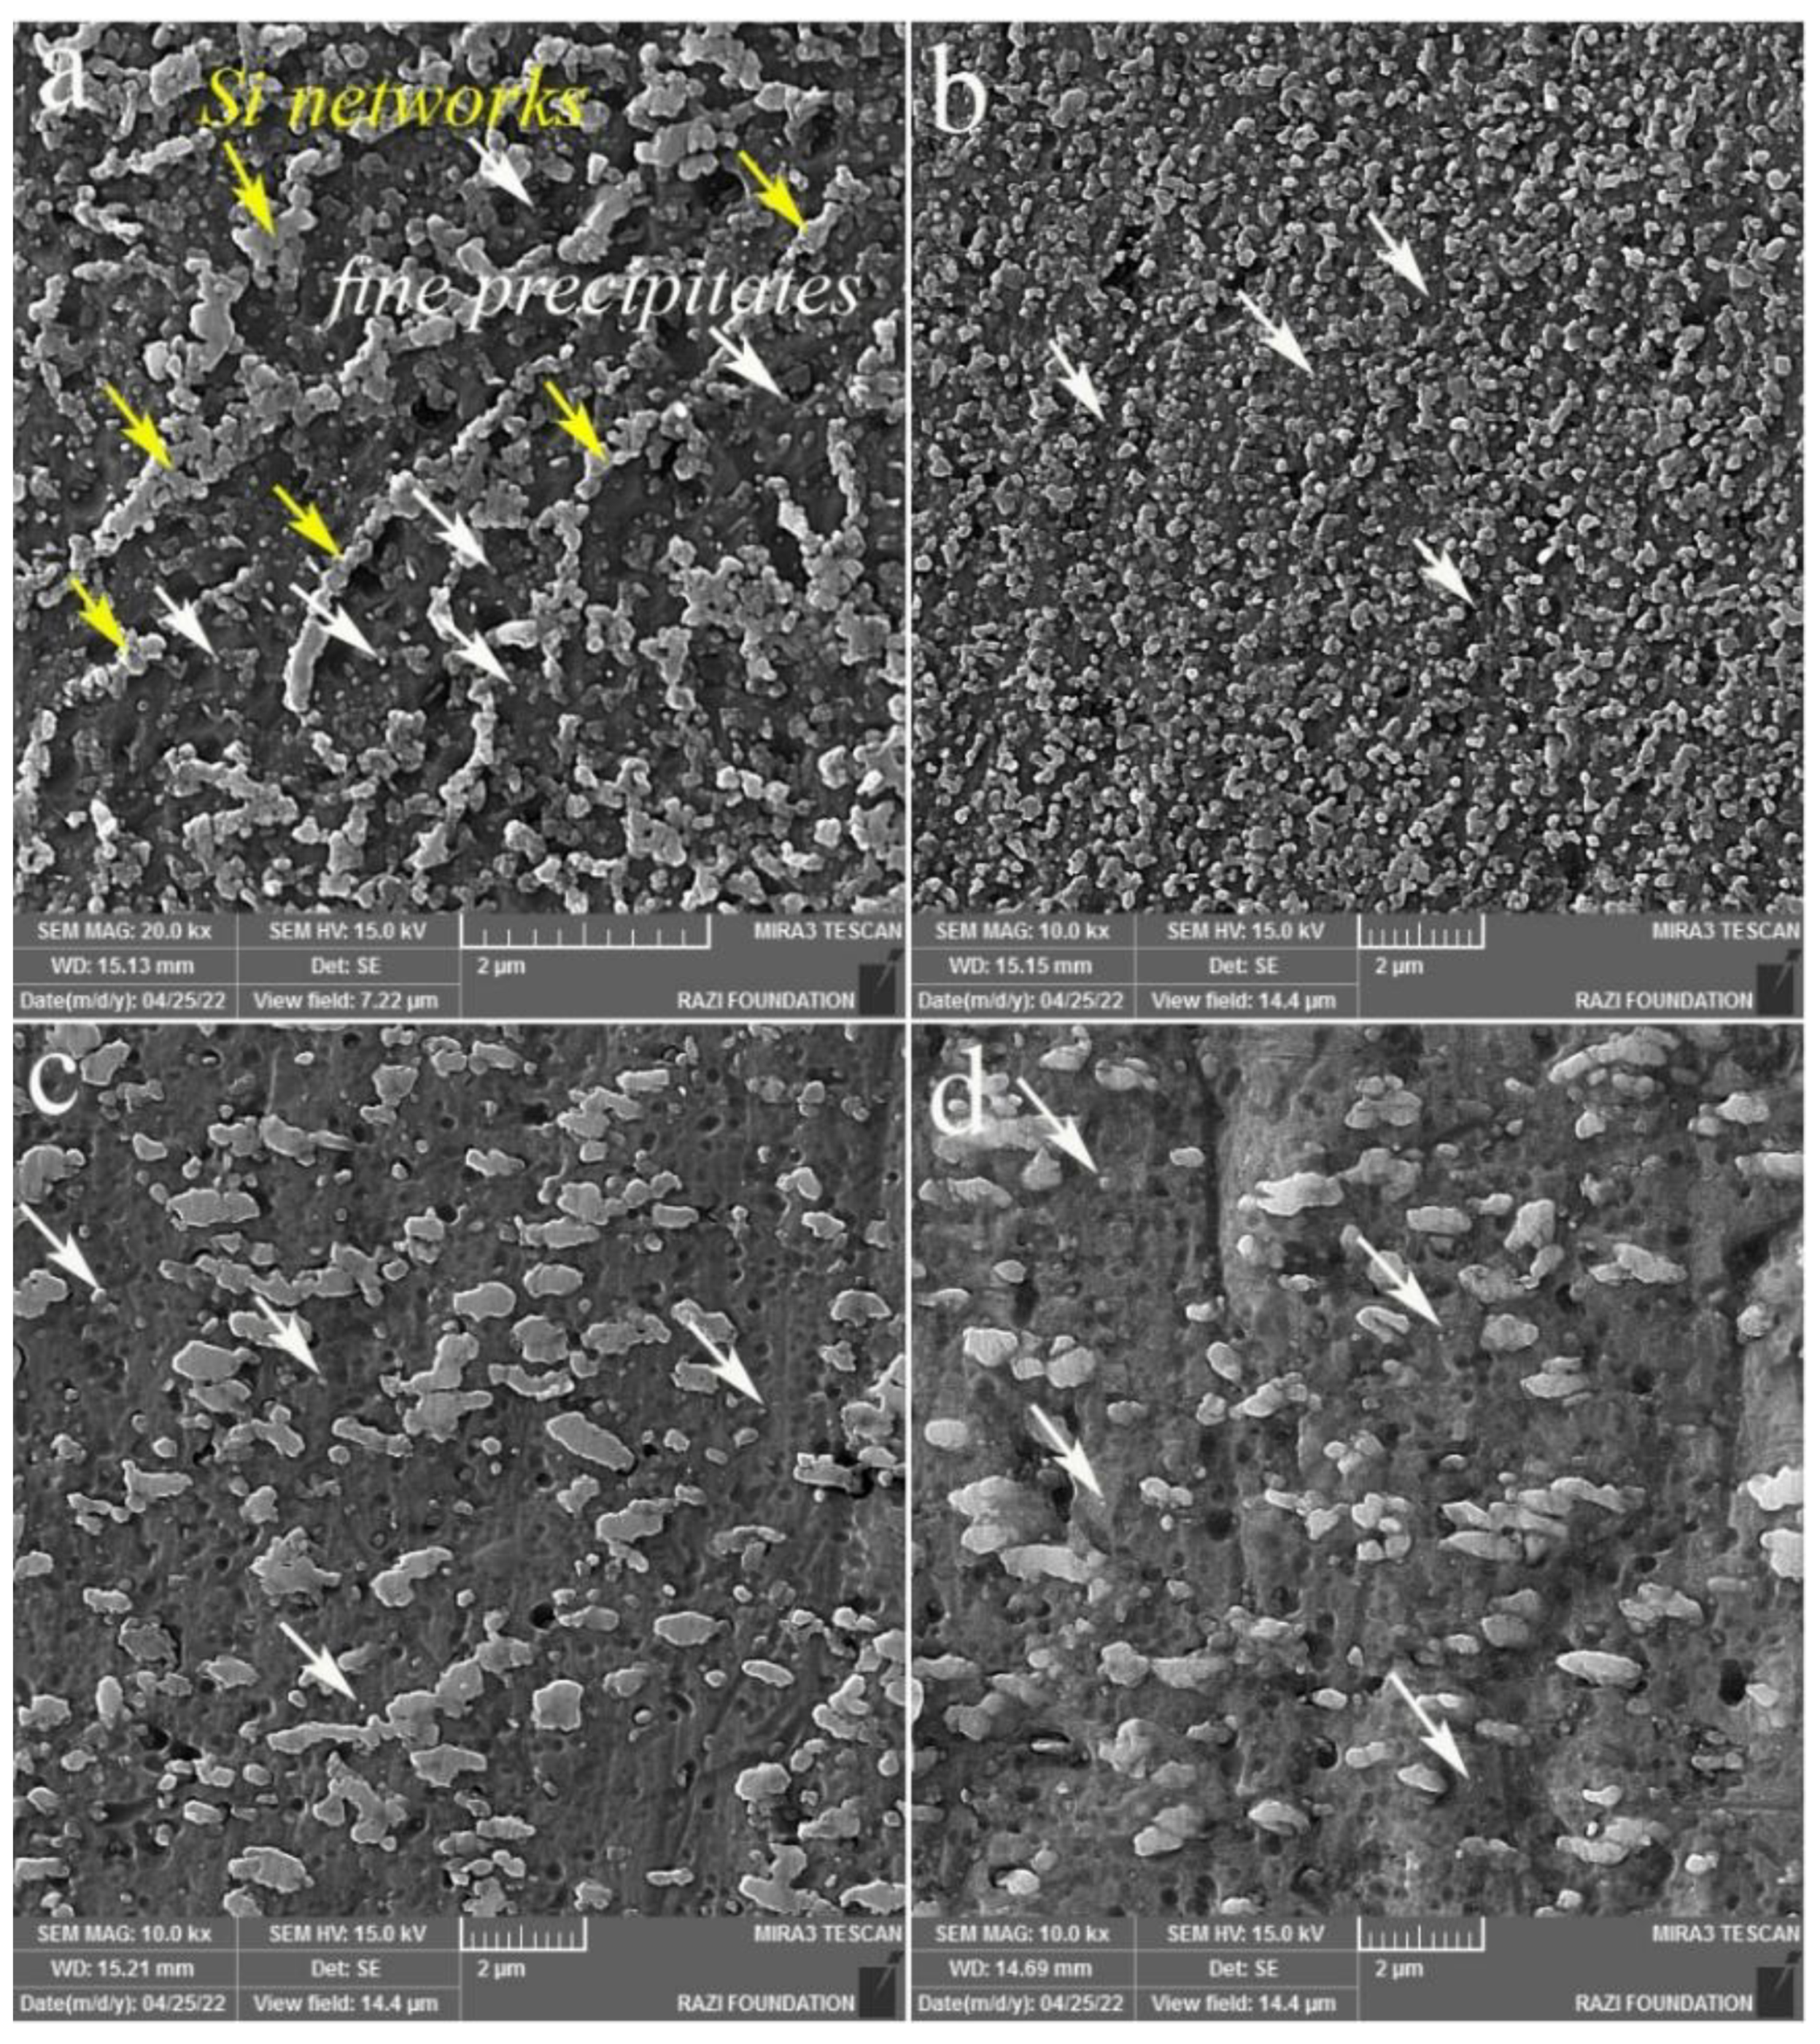
- The elongated grains and BD//[001] texture in the as-built AlSi10Mg disappeared after FSP, and fine equiaxed grains with shear texture components were formed. In addition, the fiber-like Si networks were replaced with Si particles because of their fragmentation during the FSP.
- (3)
- The main reason for the higher strength of the as-built AlSi10Mg compared to those of the FSPed samples is the effect of eutectic Si networks, which act as barriers to dislocation movement, such as the effect of grain boundaries on the strength of metals and alloys based on the Hall–Petch relationship.
- (4)
- The main strengthening mechanisms in the FSPed samples were not related to the Al matrix; however, they were attributed to the Si particles. By repeating the FSP (two and three passes), the Si particles grow by consuming the fine Si particles and Si solute atoms in the Al matrix, resulting in larger and fewer particles. The finer Si particles and higher solute Si atoms in the one-pass FSPed sample led to higher tensile strength compared with the other samples.
- (5)
- Finer grain sizes of SZs and elimination of large L-PBF porosities by FSP are the main reasons for the higher ductility of the FSPed samples compared to that of the as-built AlSi10Mg. The higher ductility of the one-pass FSPed sample can be attributed to the lower and uniform distribution of KAM values and lower GAM values. Notably, in the case of three-pass FSP, the existence of a severely coarse SZ in the macrostructure is the additional origin of lower ductility.
- (6)
- The outcome of this study can be useful for the material science community, particularly for studies investigating the post-treatment of L-PBF AlSi10Mg.
Author Contributions
Funding
Institutional Review Board Statement
Informed Consent Statement
Data Availability Statement
Conflicts of Interest
References
- Ngo, T.D.; Kashani, A.; Imbalzano, G.; Nguyen, K.T.Q.; Hui, D. Additive manufacturing (3D printing): A review of materials, methods, applications and challenges. Compos. Part B Eng. 2018, 143, 172–196. [Google Scholar] [CrossRef]
- Zhang, J.; Song, B.; Wei, Q.; Bourell, D.; Shi, Y. A review of selective laser melting of aluminum alloys: Processing, microstructure, property and developing trends. J. Mater. Sci. Technol. 2019, 35, 270–284. [Google Scholar] [CrossRef]
- Dowling, L.; Kennedy, J.; O’Shaughnessy, S.; Trimble, D. A review of critical repeatability and reproducibility issues in powder bed fusion. Mater. Des. 2020, 186, 108346. [Google Scholar] [CrossRef]
- Zhao, L.; Song, L.; Macías, J.G.S.; Zhu, Y.; Huang, M.; Simar, A.; Li, Z. Review on the correlation between microstructure and mechanical performance for laser powder bed fusion AlSi10Mg. Addit. Manuf. 2022, 56, 102914. [Google Scholar] [CrossRef]
- Blakey-Milner, B.; Gradl, P.; Snedden, G.; Brooks, M.; Pitot, J.; Lopez, E.; Leary, M.; Berto, F.; du Plessis, A. Metal additive manufacturing in aerospace: A review. Mater. Des. 2021, 209, 110008. [Google Scholar] [CrossRef]
- Heidarzadeh, A.; Mironov, S.; Kaibyshev, R.; Çam, G.; Simar, A.; Gerlich, A.; Khodabakhshi, F.; Mostafaei, A.; Field, D.P.; Robson, J.D.; et al. Friction stir welding/processing of metals and alloys: A comprehensive review on microstructural evolution. Prog. Mater. Sci. 2021, 117, 100752. [Google Scholar] [CrossRef]
- Mishra, R.S.; Ma, Z.Y. Friction stir welding and processing. Mater. Sci. Eng. R Rep. 2005, 50, 1–78. [Google Scholar] [CrossRef]
- Meng, X.; Huang, Y.; Cao, J.; Shen, J.; dos Santos, J.F. Recent progress on control strategies for inherent issues in friction stir welding. Prog. Mater. Sci. 2021, 115, 100706. [Google Scholar] [CrossRef]
- Yang, T.; Wang, K.; Wang, W.; Peng, P.; Huang, L.; Qiao, K.; Jin, Y. Effect of friction stir processing on microstructure and mechanical properties of AlSi10Mg aluminum alloy produced by selective laser melting. JOM 2019, 71, 1737–1747. [Google Scholar] [CrossRef]
- Maamoun, A.H.; Veldhuis, S.C.; Elbestawi, M. Friction stir processing of AlSi10Mg parts produced by selective laser melting. J. Mater. Process. Technol. 2019, 263, 308–320. [Google Scholar] [CrossRef]
- Zhao, L.; Macías, J.G.S.; Ding, L.; Idrissi, H.; Simar, A. Damage mechanisms in selective laser melted AlSi10Mg under as built and different post-treatment conditions. Mater. Sci. Eng. A 2019, 764, 138210. [Google Scholar] [CrossRef]
- Zhao, L.; Macías, J.G.S.; Dolimont, A.; Simar, A.; Rivière-Lorphèvre, E. Comparison of residual stresses obtained by the crack compliance method for parts produced by different metal additive manufacturing techniques and after friction stir processing. Addit. Manuf. 2020, 36, 101499. [Google Scholar] [CrossRef]
- Macías, J.G.S.; Elangeswaran, C.; Zhao, L.; van Hooreweder, B.; Adrien, J.; Maire, E.; Buffière, J.-Y.; Ludwig, W.; Jacques, P.J.; Simar, A. Ductilisation and fatigue life enhancement of selective laser melted AlSi10Mg by friction stir processing. Scr. Mater. 2019, 170, 124–128. [Google Scholar] [CrossRef]
- Rafieazad, M.; Mohammadi, M.; Gerlich, A.; Nasiri, A. Enhancing the corrosion properties of additively manufactured AlSi10Mg using friction stir processing. Corros. Sci. 2021, 178, 109073. [Google Scholar] [CrossRef]
- Nouri, Z.; Taghiabadi, R. Tribological properties improvement of conventionally-cast Al-8.5 Fe-1.3 V-1.7 Si alloy by multi-pass friction stir processing. Trans. Nonferrous Met. Soc. China 2021, 31, 1262–1275. [Google Scholar] [CrossRef]
- Nakata, K.; Kim, Y.G.; Fujii, H.; Tsumura, T.; Komazaki, T. Improvement of mechanical properties of aluminum die casting alloy by multi-pass friction stir processing. Mater. Sci. Eng. A 2006, 437, 274–280. [Google Scholar] [CrossRef]
- Moharrami, A.; Razaghian, A.; Paidar, M.; Šlapáková, M.; Ojo, O.O.; Taghiabadi, R. Enhancing the mechanical and tribological properties of Mg2Si-rich aluminum alloys by multi-pass friction stir processing. Mater. Chem. Phys. 2020, 250, 123066. [Google Scholar] [CrossRef]
- Singh, S.K.; Immanuel, R.J.; Babu, S.; Panigrahi, S.K.; Janaki Ram, G.D. Influence of multi-pass friction stir processing on wear behaviour and machinability of an Al-Si hypoeutectic A356 alloy. J. Mater. Process. Technol. 2016, 236, 252–262. [Google Scholar] [CrossRef]
- Aboulkhair, N.T.; Simonelli, M.; Parry, L.; Ashcroft, I.; Tuck, C.; Hague, R. 3D printing of Aluminium alloys: Additive Manufacturing of Aluminium alloys using selective laser melting. Prog. Mater. Sci. 2019, 106, 100578. [Google Scholar] [CrossRef]
- Tian, Y.Z.; Gao, S.; Zhao, L.J.; Lu, S.; Pippan, R.; Zhang, Z.F.; Tsuji, N. Remarkable transitions of yield behavior and Lüders deformation in pure Cu by changing grain sizes. Scr. Mater. 2018, 142, 88–91. [Google Scholar] [CrossRef]
- Starink, M.J.; Wang, S.C. A model for the yield strength of overaged Al–Zn–Mg–Cu alloys. Acta Mater. 2003, 51, 5131–5150. [Google Scholar] [CrossRef]
- Heidarzadeh, A.; Laleh, H.M.; Gerami, H.; Hosseinpour, P.; Shabestari, M.J.; Bahari, R. The origin of different microstructural and strengthening mechanisms of copper and brass in their dissimilar friction stir welded joint. Mater. Sci. Eng. A 2018, 735, 336–342. [Google Scholar] [CrossRef]
- Macías, J.G.S.; Douillard, T.; Zhao, L.; Maire, E.; Pyka, G.; Simar, A. Influence on microstructure, strength and ductility of build platform temperature during laser powder bed fusion of AlSi10Mg. Acta Mater. 2020, 201, 231–243. [Google Scholar] [CrossRef]
- Hadadzadeh, A.; Baxter, C.; Amirkhiz, B.S.; Mohammadi, M. Strengthening mechanisms in direct metal laser sintered AlSi10Mg: Comparison between virgin and recycled powders. Addit. Manuf. 2018, 23, 108–120. [Google Scholar] [CrossRef]
- Fiocchi, J.; Tuissi, A.; Biffi, C.A. Heat treatment of aluminium alloys produced by laser powder bed fusion: A review. Mater. Des. 2021, 204, 109651. [Google Scholar] [CrossRef]
- Rui, S.-S.; Niu, L.-S.; Shi, H.-J.; Wei, S.; Tasan, C.C. Diffraction-based misorientation mapping: A continuum mechanics description. J. Mech. Phys. Solids 2019, 133, 103709. [Google Scholar] [CrossRef]
- Lehto, P. Adaptive domain misorientation approach for the EBSD measurement of deformation induced dislocation sub-structures. Ultramicroscopy 2021, 222, 113203. [Google Scholar] [CrossRef]


| Symbol | Euler Angles (°) | Miller Indices (hkl)<uvw> | ||
|---|---|---|---|---|
| φ1 | Φ | φ2 | ||
| 35.26/215.26 | 45 | 0/90 | ||
| 125.26 | 90 | 45 | ||
| 144.74 | 45 | 0/90 | ||
| 54.74/234.74 | 90 | 45 | ||
| 0 | 35.26 | 45 | ||
| 180 | 35.26 | 45 | ||
| 0/120/240 | 54.74 | 45 | ||
| 60/180 | 54.74 | 45 | ||
| 90/270 | 45 | 0/90 | ||
| 0/180 | 90 | 45 | ||
| Sample | Dav (µm) | HAGBs (%) | LAGBs (%) | GAM Value (°) | Taylor Factor | Texture Components | Texture Intensity |
|---|---|---|---|---|---|---|---|
| BM | 15.8 | 81 | 19 | 0.53 | 2.84 | BD//[001] | 3.0 |
| S1 (1 pass) | 3.0 | 80 | 20 | 0.45 | 2.98 | 7.6 | |
| S2 (2 pass) | 3.1 | 71 | 29 | 0.59 | 3.12 | and | 10.7 |
| S3 (3 pass) | 2.5 | 83 | 17 | 0.54 | 3.18 | 4.9 |
Disclaimer/Publisher’s Note: The statements, opinions and data contained in all publications are solely those of the individual author(s) and contributor(s) and not of MDPI and/or the editor(s). MDPI and/or the editor(s) disclaim responsibility for any injury to people or property resulting from any ideas, methods, instructions or products referred to in the content. |
© 2023 by the authors. Licensee MDPI, Basel, Switzerland. This article is an open access article distributed under the terms and conditions of the Creative Commons Attribution (CC BY) license (https://creativecommons.org/licenses/by/4.0/).
Share and Cite
Heidarzadeh, A.; Khorshidi, M.; Mohammadzadeh, R.; Khajeh, R.; Mofarrehi, M.; Javidani, M.; Chen, X.-G. Multipass Friction Stir Processing of Laser-Powder Bed Fusion AlSi10Mg: Microstructure and Mechanical Properties. Materials 2023, 16, 1559. https://doi.org/10.3390/ma16041559
Heidarzadeh A, Khorshidi M, Mohammadzadeh R, Khajeh R, Mofarrehi M, Javidani M, Chen X-G. Multipass Friction Stir Processing of Laser-Powder Bed Fusion AlSi10Mg: Microstructure and Mechanical Properties. Materials. 2023; 16(4):1559. https://doi.org/10.3390/ma16041559
Chicago/Turabian StyleHeidarzadeh, Akbar, Mahsa Khorshidi, Roghayeh Mohammadzadeh, Rasoul Khajeh, Mohammadreza Mofarrehi, Mousa Javidani, and X.-Grant Chen. 2023. "Multipass Friction Stir Processing of Laser-Powder Bed Fusion AlSi10Mg: Microstructure and Mechanical Properties" Materials 16, no. 4: 1559. https://doi.org/10.3390/ma16041559