
Anisotropy in the Liquefaction Resistance of Fibre Reinforced Sand

Abstract
:1. Introduction
2. Test Materials and Test Program
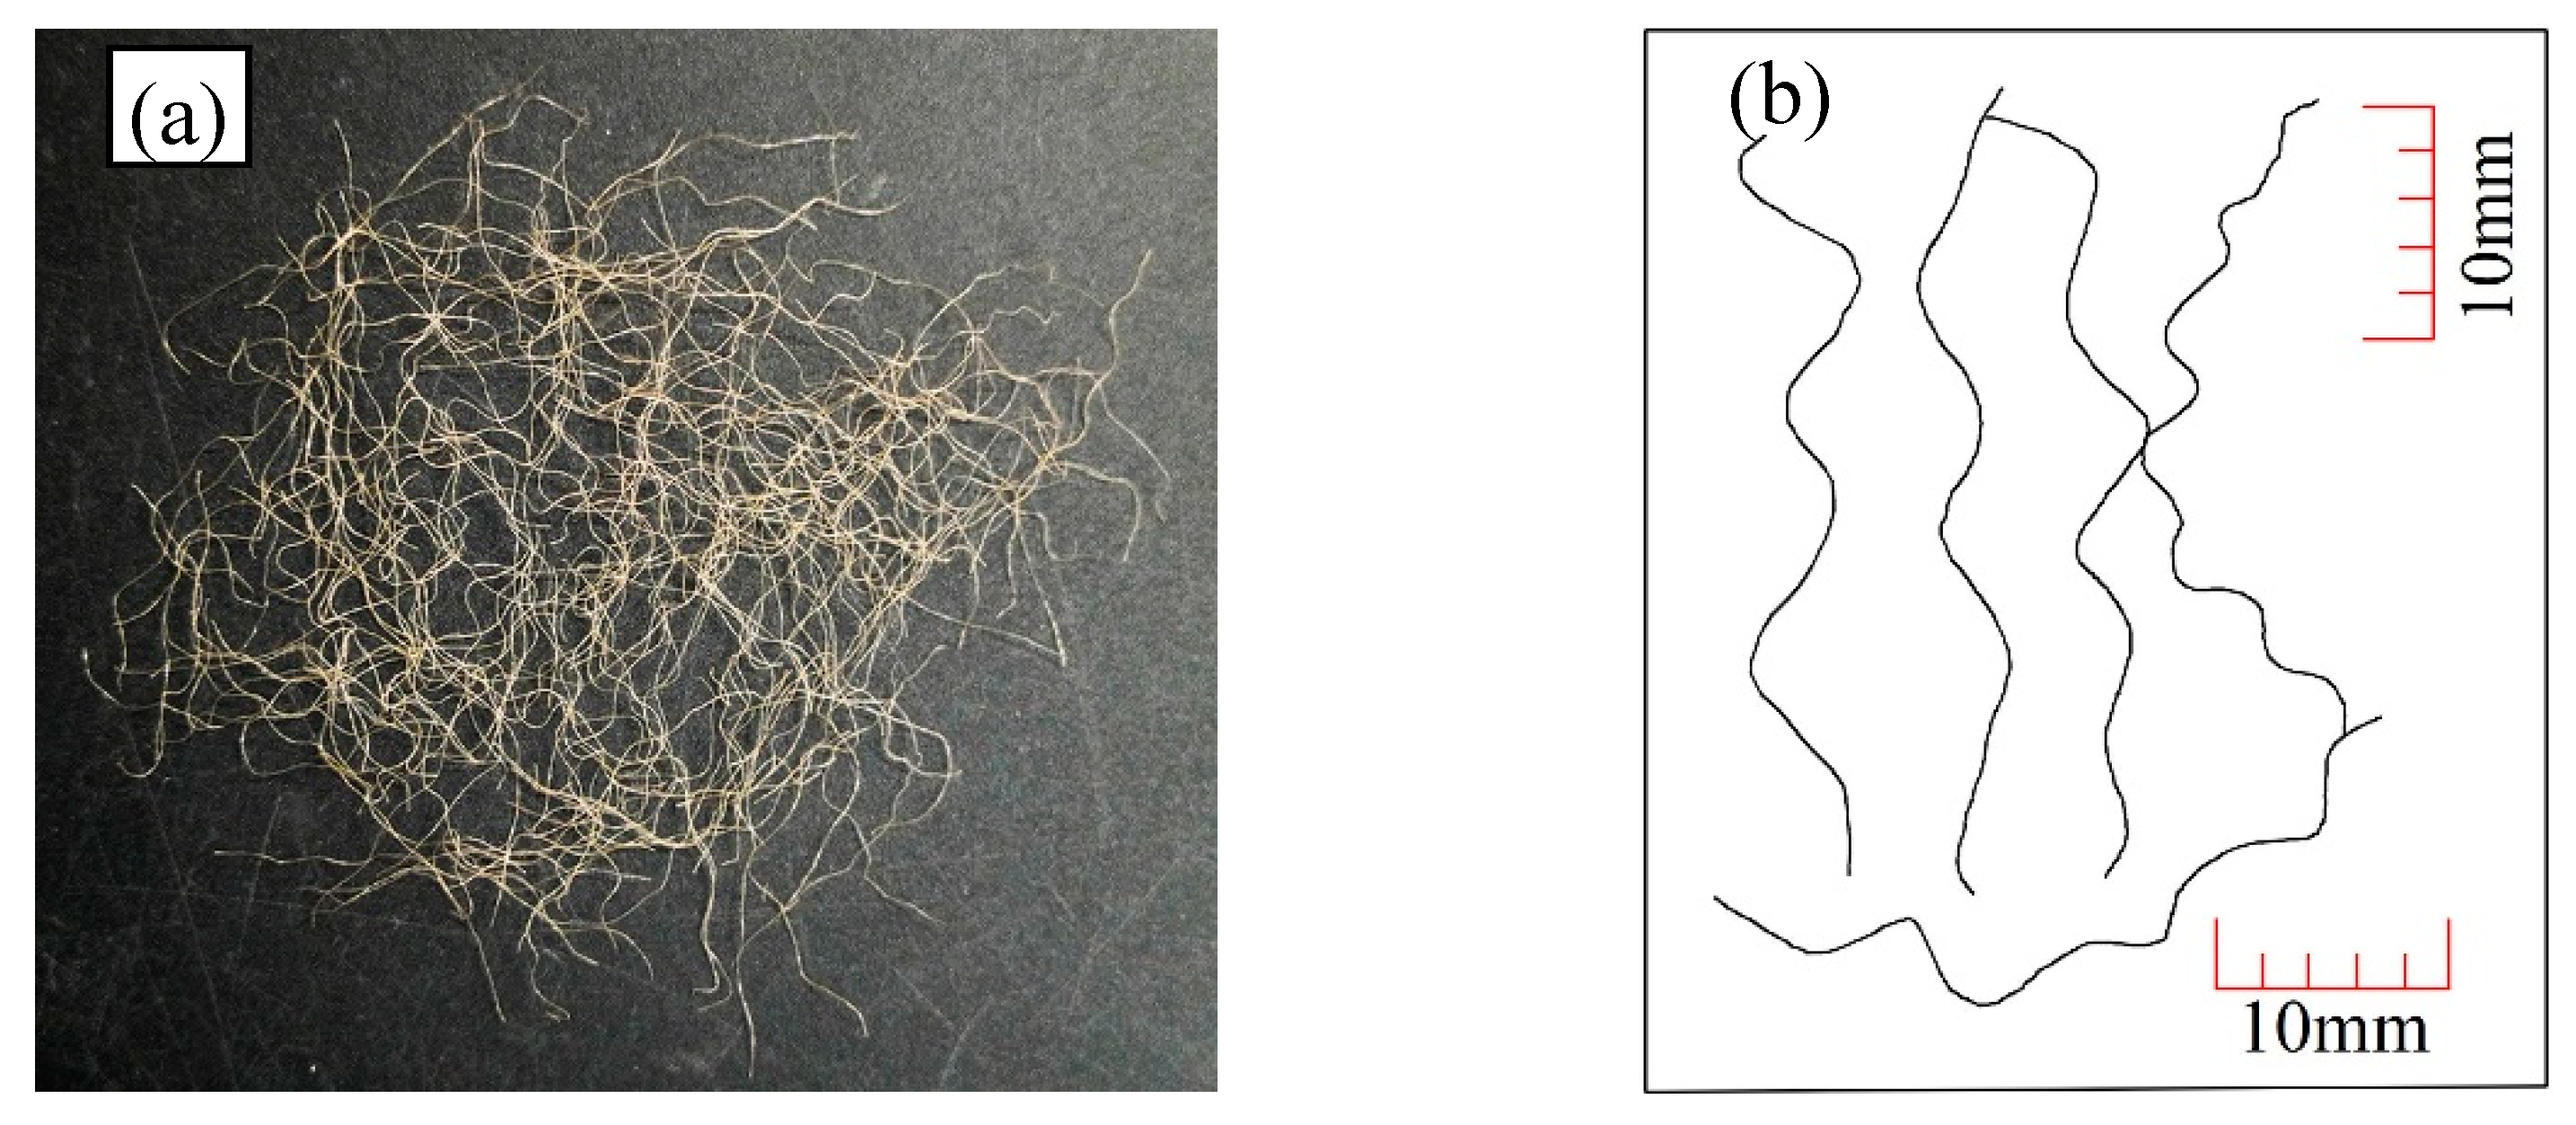
2.1. Test Materials and Sample Preparation
2.2. Test Program
3. Test Results
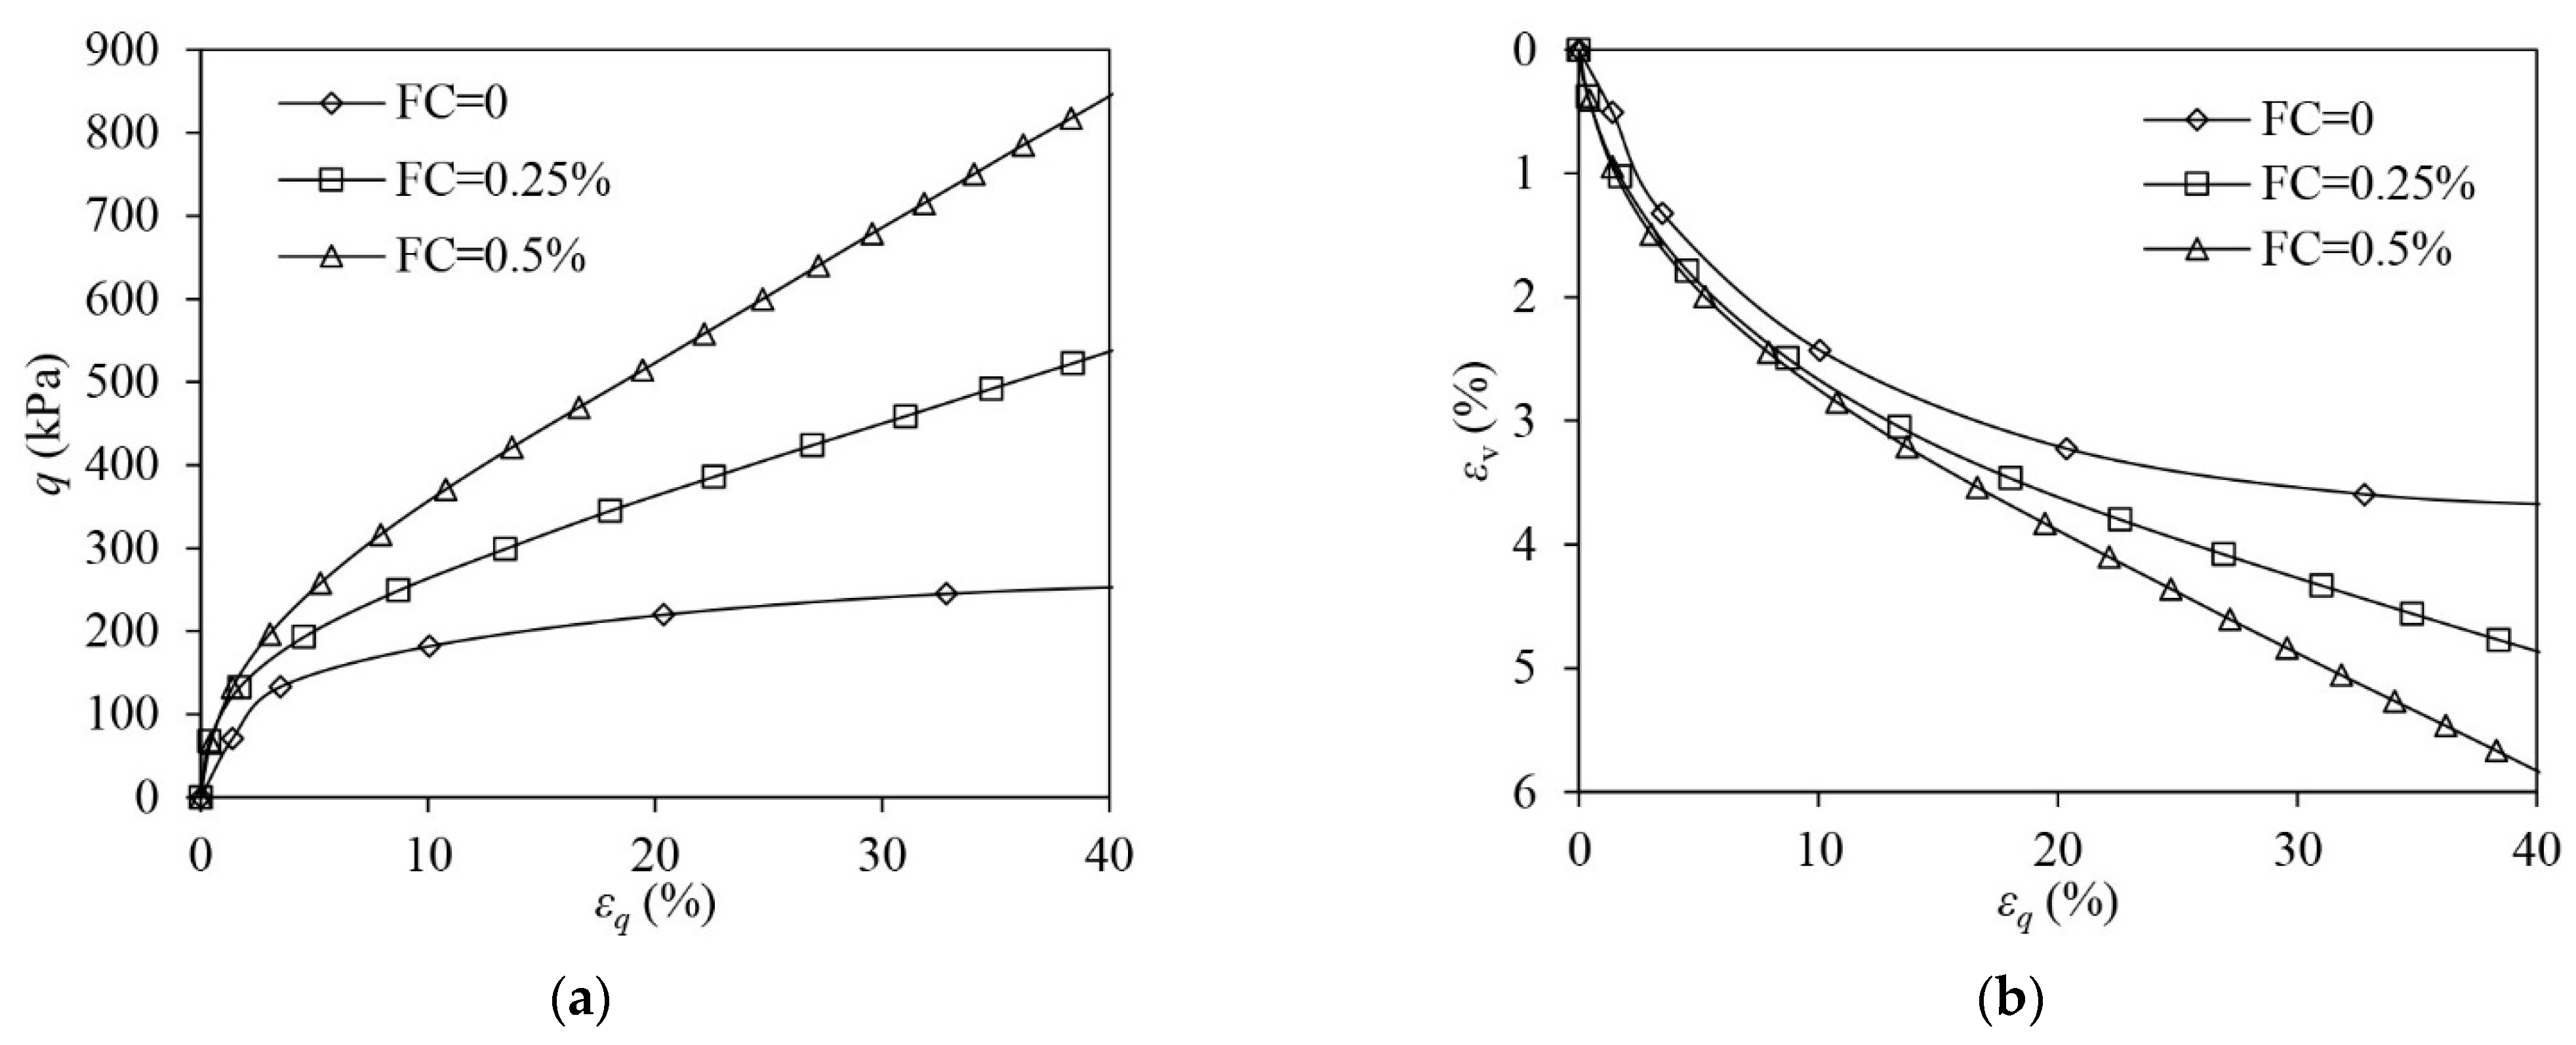
3.1. Drained Tests
3.2. Undrained Tests
3.2.1. VL Samples
3.2.2. L Samples
3.2.3. MD Samples
3.3. Effects Introduced by Fibre Reinforcement to Benefit the Liquefaction Resistance of Sand
3.4. The Characteristic Lines
3.4.1. The Strength Envelope
3.4.2. The ESP Reversal Line
3.4.3. The Mechanism Correlating to the Strength Envelope and ESP Reversal of the Fibre Reinforced Sand
Strength Envelope
ESP Reversal
4. Discussion on the Anisotropy in the Liquefaction Resistance of the Fibre-Reinforced Sand
4.1. The Stress Contribution of Fibres
4.2. The Liquefaction Resistance
4.3. Discussion
5. Conclusions
Author Contributions
Funding
Institutional Review Board Statement
Informed Consent Statement
Data Availability Statement
Acknowledgments
Conflicts of Interest
References
- Ghadr, S.; Samadzadeh, A.; Bahadori, H.; Assadi-Langroudi, A. Liquefaction resistance of fibre-reinforced silty sands under cyclic loading. Geotext. Geomembr. 2020, 48, 812–827. [Google Scholar] [CrossRef]
- Reubens, B.; Poesen, J.; Danjon, F.; Geudens, G.; Muys, B. The role of fine and coarse roots in shallow slope stability and soil erosion control with a focus on root system architecture: A review. Trees 2007, 21, 385–402. [Google Scholar] [CrossRef]
- Zhang, X.; Russell, A.R.; Dong, X. Liquefaction responses of fibre reinforced sand in shaking table tests with a laminated shear stack. Soil Dyn. Earthq. Eng. 2022, 162, 107466. [Google Scholar] [CrossRef]
- Mirzababaei, M.; Mohamed, M.; Miraftab, M. Analysis of strip footings on fiber-reinforced slopes with the aid of particle image velocimetry. J. Mater. Civ. Eng. 2017, 29, 04016243. [Google Scholar] [CrossRef]
- Gray, D.H.; Ohashi, H. Mechanics of fiber reinforcement in sand. J. Geotech. Eng. 1983, 109, 335–353. [Google Scholar] [CrossRef]
- Jewell, R.; Wroth, C. Direct shear tests on reinforced sand. Geotechnique 1987, 37, 53–68. [Google Scholar] [CrossRef]
- Fatani, M.N.; Bauer, G.; Al-Joulani, N. Reinforcing soil with aligned and randomly oriented metallic fibers. Geotech. Test. J. 1991, 14, 78–87. [Google Scholar]
- Falorca, I.; Pinto, M. Effect of short, randomly distributed polypropylene microfibres on shear strength behaviour of soils. Geosynth. Int. 2011, 18, 2–11. [Google Scholar] [CrossRef]
- Muir Wood, D.; Diambra, A.; Ibraim, E. Fibres and soils: A route towards modelling of root-soil systems. Soils Found. 2016, 56, 765–778. [Google Scholar] [CrossRef]
- Gray, D.H.; Al-Refeai, T. Behavior of fabric-versus fiber-reinforced sand. J. Geotech. Eng. 1986, 112, 804–820. [Google Scholar] [CrossRef]
- Maher, M.; Ho, Y. Behavior of fiber-reinforced cemented sand under static and cyclic loads. Geotech. Test. J. 1993, 16, 330–338. [Google Scholar]
- Ranjan, G.; Vasan, R.; Charan, H. Behaviour of plastic-fibre-reinforced sand. Geotext. Geomembr. 1994, 13, 555–565. [Google Scholar] [CrossRef]
- Ranjan, G.; Vasan, R.; Charan, H. Probabilistic analysis of randomly distributed fiber-reinforced soil. J. Geotech. Eng. 1996, 122, 419–426. [Google Scholar] [CrossRef]
- Michalowski, R.L.; Zhao, A. Failure of fiber-reinforced granular soils. J. Geotech. Eng. 1996, 122, 226–234. [Google Scholar] [CrossRef]
- Michalowski, R.L. Limit analysis in stability calculations of reinforced soil structures. Geotext. Geomembr. 1998, 16, 311–331. [Google Scholar] [CrossRef]
- Michalowski, R.L.; Cermak, J. Triaxial compression of sand reinforced with fibers. J. Geotech. Geoenvironmental Eng. 2003, 129, 125–136. [Google Scholar] [CrossRef]
- Michalowski, R.L. Limit analysis with anisotropic fibre-reinforced soil. Géotechnique 2008, 58, 489–501. [Google Scholar] [CrossRef]
- Consoli, N.; Festugato, L.; Heineck, K. Strain-hardening behaviour of fibre-reinforced sand in view of filament geometry. Geosynth. Int. 2009, 16, 109–115. [Google Scholar] [CrossRef]
- Festugato, L.; Menger, E.; Benezra, F.; Kipper, E.A.; Consoli, N.C. Fibre-reinforced cemented soils compressive and tensile strength assessment as a function of filament length. Geotext. Geomembr. 2017, 45, 77–82. [Google Scholar] [CrossRef]
- Diambra, A.; Ibraim, E.; Russell, A.R.; Muir Wood, D. Fibre reinforced sands: From experiments to modelling and beyond. Int. J. Numer. Anal. Methods Geomech. 2013, 37, 2427–2455. [Google Scholar] [CrossRef]
- Noorzad, R.; Zarinkolaei, S.T.G. Comparison of Mechanical Properties of Fiber-Reinforced Sand under Triaxial Compression and Direct Shear. Open Geosci. 2015, 7, 547–558. [Google Scholar] [CrossRef]
- Li, C.; Zornberg, J.G. Shear Strength Behavior of Soils Reinforced with Weak Fibers. J. Geotech. Geoenvironmental Eng. 2019, 145, 06019006. [Google Scholar] [CrossRef]
- Krishnaswamy, N.; Isaac, N.T. Liquefaction potential of reinforced sand. Geotext. Geomembr. 1994, 13, 23–41. [Google Scholar] [CrossRef]
- Krishnaswamy, N.; Isaac, N.T. Liquefaction analysis of saturated reinforced granular soils. J. Geotech. Eng. 1995, 121, 645–651. [Google Scholar] [CrossRef]
- Vercueil, D.; Billet, P.; Cordary, D. Study of the liquefaction resistance of a saturated sand reinforced with geosynthetics. Soil Dyn. Earthq. Eng. 1997, 16, 417–425. [Google Scholar] [CrossRef]
- Noorzad, R.; Amini, P.F. Liquefaction resistance of Babolsar sand reinforced with randomly distributed fibers under cyclic loading. Soil Dyn. Earthq. Eng. 2014, 66, 281–292. [Google Scholar] [CrossRef]
- Fardad Amini, P.; Noorzad, R. Energy-based evaluation of liquefaction of fiber-reinforced sand using cyclic triaxial testing. Soil Dyn. Earthq. Eng. 2018, 104, 45–53. [Google Scholar] [CrossRef]
- Chegenizadeh, A.; Keramatikerman, M.; Nikraz, H. Liquefaction resistance of fibre reinforced low-plasticity silt. Soil Dyn. Earthq. Eng. 2018, 104, 372–377. [Google Scholar] [CrossRef]
- Zhang, X.; Russell, A.R. Liquefaction Potential and Effective Stress of Fiber-Reinforced Sand during Undrained Cyclic Loading. J. Geotech. Geoenvironmental Eng. 2021, 147, 04021042. [Google Scholar] [CrossRef]
- Ibraim, E.; Diambra, A.; Muir Wood, D.; Russell, A.R. Static liquefaction of fibre reinforced sand under monotonic loading. Geotext. Geomembr. 2010, 28, 374–385. [Google Scholar] [CrossRef]
- Zhang, X.; Russell, A.R. Assessing Liquefaction Resistance of Fiber-Reinforced Sand Using a New Pore Pressure Ratio. J. Geotech. Geoenvironmental Eng. 2020, 146, 04019125. [Google Scholar] [CrossRef]
- Muir Wood, D.; Crewe, A.; Taylor, C. Shaking table testing of geotechnical models. Int. J. Phys. Model. Geotech. 2002, 2, 1–13. [Google Scholar]
- Ghorbani, A.; Hasanzadehshooiili, H.; Somti Foumani, M.A.; Medzvieckas, J.; Kliukas, R. Liquefaction Potential of Saturated Sand Reinforced by Cement-Grouted Micropiles: An Evolutionary Approach Based on Shaking Table Tests. Materials 2023, 16, 2194. [Google Scholar] [CrossRef]
- Maheshwari, B.; Singh, H.; Saran, S. Effects of reinforcement on liquefaction resistance of Solani sand. J. Geotech. Geoenvironmental Eng. 2012, 138, 831–840. [Google Scholar] [CrossRef]
- Wang, K.; Brennan, A. Behaviour of saturated fibre-reinforced sand in centrifuge model tests. Soil Dyn. Earthq. Eng. 2019, 125, 105749. [Google Scholar] [CrossRef]
- Michalowski, R.L.; Cermak, J. Strength anisotropy of fiber-reinforced sand. Comput. Geotech. 2002, 29, 279–299. [Google Scholar] [CrossRef]
- Diambra, A.; Russell, A.R.; Ibraim, E.; Muir Wood, D. Determination of fibre orientation distribution in reinforced sands. Géotechnique 2007, 57, 623–628. [Google Scholar] [CrossRef]
- Ibraim, E.; Diambra, A.; Russell, A.R.; Muir Wood, D. Assessment of laboratory sample preparation for fibre reinforced sands. Geotext. Geomembr. 2012, 34, 69–79. [Google Scholar] [CrossRef]
- Diambra, A.; Ibraim, E.; Wood, D.M.; Russell, A. Fibre reinforced sands: Experiments and modelling. Geotext. Geomembr. 2010, 28, 238–250. [Google Scholar] [CrossRef]
- Mandolini, A.; Diambra, A.; Ibraim, E. Strength anisotropy of fibre-reinforced sands under multiaxial loading. Géotechnique 2019, 69, 203–216. [Google Scholar] [CrossRef]
- Ghadr, S.; Bahadori, H. Anisotropic Behavior of Fiber-Reinforced Sands. J. Mater. Civ. Eng. 2019, 31, 04019270. [Google Scholar] [CrossRef]
- Ghadr, S.; Bahadori, H.; Assadi-Langroudi, A. Anisotropy in sand–fibre composites and undrained stress–strain implications. Int. J. Geosynth. Ground Eng. 2019, 5, 23. [Google Scholar] [CrossRef]
- Lo, S.; Wardani, S.P. Strength and dilatancy of a silt stabilized by a cement and fly ash mixture. Can. Geotech. J. 2002, 39, 77–89. [Google Scholar] [CrossRef]
- Lo, S.; Chen, K. Strain responses of granular base materials in stress path cyclic triaxial testing. Transp. Res. Rec. 1999, 1687, 66–74. [Google Scholar] [CrossRef]
- Yamamuro, J.A.; Covert, K.M. Monotonic and cyclic liquefaction of very loose sands with high silt content. J. Geotech. Geoenvironmental Eng. 2001, 127, 314–324. [Google Scholar] [CrossRef]
- Bobei, D.; Lo, S.; Wanatowski, D.; Gnanendran, C.; Rahman, M.M. Modified state parameter for characterizing static liquefaction of sand with fines. Can. Geotech. J. 2009, 46, 281–295. [Google Scholar] [CrossRef]
- Ishihara, K. Liquefaction and flow failure during earthquakes. Geotechnique 1993, 43, 351–451. [Google Scholar] [CrossRef]
- De Larrard, F. Concrete Mixture Proportioning: A Scientific Approach; CRC Press: Boca Raton, FL, USA, 1999. [Google Scholar]
- Soriano, I.; Ibraim, E.; Ando, E.; Diambra, A.; Laurencin, T.; Moro, P.; Viggiani, G. 3D fibre architecture of fibre-reinforced sand. Granul. Matter 2017, 19, 75. [Google Scholar] [CrossRef]
- Ishihara, K.; Tatsuoka, F.; Yasuda, S. Undrained deformation and liquefaction of sand under cyclic stresses. Soils Found. 1975, 15, 29–44. [Google Scholar] [CrossRef]
- Diambra, A.; Ibraim, E. Fibre-reinforced sand: Interaction at the fibre and grain scale. Géotechnique 2015, 65, 296–308. [Google Scholar] [CrossRef]


| Mean Grain Size, D50 (mm) | Coefficient of Uniformity, Cu | Coefficient of Curvature, Cc | Maximum Void Ratio, emax | Minimum Void Ratio, emin | Specific Gravity, Gs |
|---|---|---|---|---|---|
| 0.28 | 1.94 | 0.86 | 0.97 | 0.6 | 2.65 |
| Test | FC (%) | pc (kPa) | Void Ratio after Consolidation | Density State |
|---|---|---|---|---|
| DMC-00-50-VL | 0 | 50 | 1.0446 | Very loose state |
| DMC-25-50-VL | 0.25 | 1.0151 | ||
| DMC-50-50-VL | 0.5 | 1.0094 | ||
| DMC-00-100-VL | 0 | 100 | 1.0339 | |
| DMC-25-100-VL | 0.25 | 1.0124 | ||
| DMC-50-100-VL | 0.5 | 0.9874 | ||
| DMC-00-200-VL | 0 | 200 | 1.0414 | |
| DMC-25-200-VL | 0.25 | 1.0007 | ||
| DMC-50-200-VL | 0.5 | 0.9966 | ||
| DME-00-100-VL | 0 | 100 | 1.0408 | |
| DME-25-100-VL | 0.25 | 1.0212 | ||
| DME-50-100-VL | 0.5 | 1.0000 | ||
| UMC-00-50-VL | 0 | 50 | 1.0480 | |
| UMC-25-50-VL | 0.25 | 1.0337 | ||
| UMC-50-50-VL | 0.5 | 0.9983 | ||
| UMC-00-100-VL | 0 | 100 | 1.0446 | |
| UMC-25-100-VL | 0.25 | 1.0028 | ||
| UMC-50-100-VL | 0.5 | 0.9876 | ||
| UMC-00-200-VL | 0 | 200 | 1.0371 | |
| UMC-25-200-VL | 0.25 | 1.0004 | ||
| UMC-50-200-VL | 0.5 | 0.9870 | ||
| UME-00-100-VL | 0 | 100 | 1.0302 | |
| UME-25-100-VL | 0.25 | 1.0025 | ||
| UME-50-100-VL | 0.5 | 1.0023 | ||
| UMC-00-50-L | 0 | 50 | 0.9214 | Loose state |
| UMC-25-50-L | 0.25 | 0.9130 | ||
| UMC-50-50-L | 0.5 | 0.8953 | ||
| UMC-00-100-L | 0 | 100 | 0.9176 | |
| UMC-25-100-L | 0.25 | 0.8977 | ||
| UMC-50-100-L | 0.5 | 0.8833 | ||
| UMC-00-200-L | 0 | 200 | 0.8966 | |
| UMC-25-200-L | 0.25 | 0.8857 | ||
| UMC-50-200-L | 0.5 | 0.8686 | ||
| UME-00-100-L | 0 | 100 | 0.9204 | |
| UME-25-100-L | 0.25 | 0.8813 | ||
| UME-50-100-L | 0.5 | 0.8621 | ||
| UMC-00-100-MD | 0 | 100 | 0.7790 | Medium dense state |
| UMC-25-100-MD | 0.25 | 0.7653 | ||
| UMC-50-100-MD | 0.5 | 0.7452 | ||
| UME-00-100-MD | 0 | 100 | 0.7832 | |
| UME-25-100-MD | 0.25 | 0.7696 | ||
| UME-50-100-MD | 0.5 | 0.7692 |
Disclaimer/Publisher’s Note: The statements, opinions and data contained in all publications are solely those of the individual author(s) and contributor(s) and not of MDPI and/or the editor(s). MDPI and/or the editor(s) disclaim responsibility for any injury to people or property resulting from any ideas, methods, instructions or products referred to in the content. |
© 2023 by the authors. Licensee MDPI, Basel, Switzerland. This article is an open access article distributed under the terms and conditions of the Creative Commons Attribution (CC BY) license (https://creativecommons.org/licenses/by/4.0/).
Share and Cite
Zhang, X.; Zhuang, Y.; Wang, Z.; Yang, C.; Hu, S. Anisotropy in the Liquefaction Resistance of Fibre Reinforced Sand. Materials 2023, 16, 6959. https://doi.org/10.3390/ma16216959
Zhang X, Zhuang Y, Wang Z, Yang C, Hu S. Anisotropy in the Liquefaction Resistance of Fibre Reinforced Sand. Materials. 2023; 16(21):6959. https://doi.org/10.3390/ma16216959
Chicago/Turabian StyleZhang, Xidong, Yan Zhuang, Zhen’ang Wang, Changxing Yang, and Shunlei Hu. 2023. "Anisotropy in the Liquefaction Resistance of Fibre Reinforced Sand" Materials 16, no. 21: 6959. https://doi.org/10.3390/ma16216959