
Influence of P3HT:PCBM Ratio on Thermal and Transport Properties of Bulk Heterojunction Solar Cells
 , ,
, , 
Abstract
:1. Introduction
2. Materials and Methods
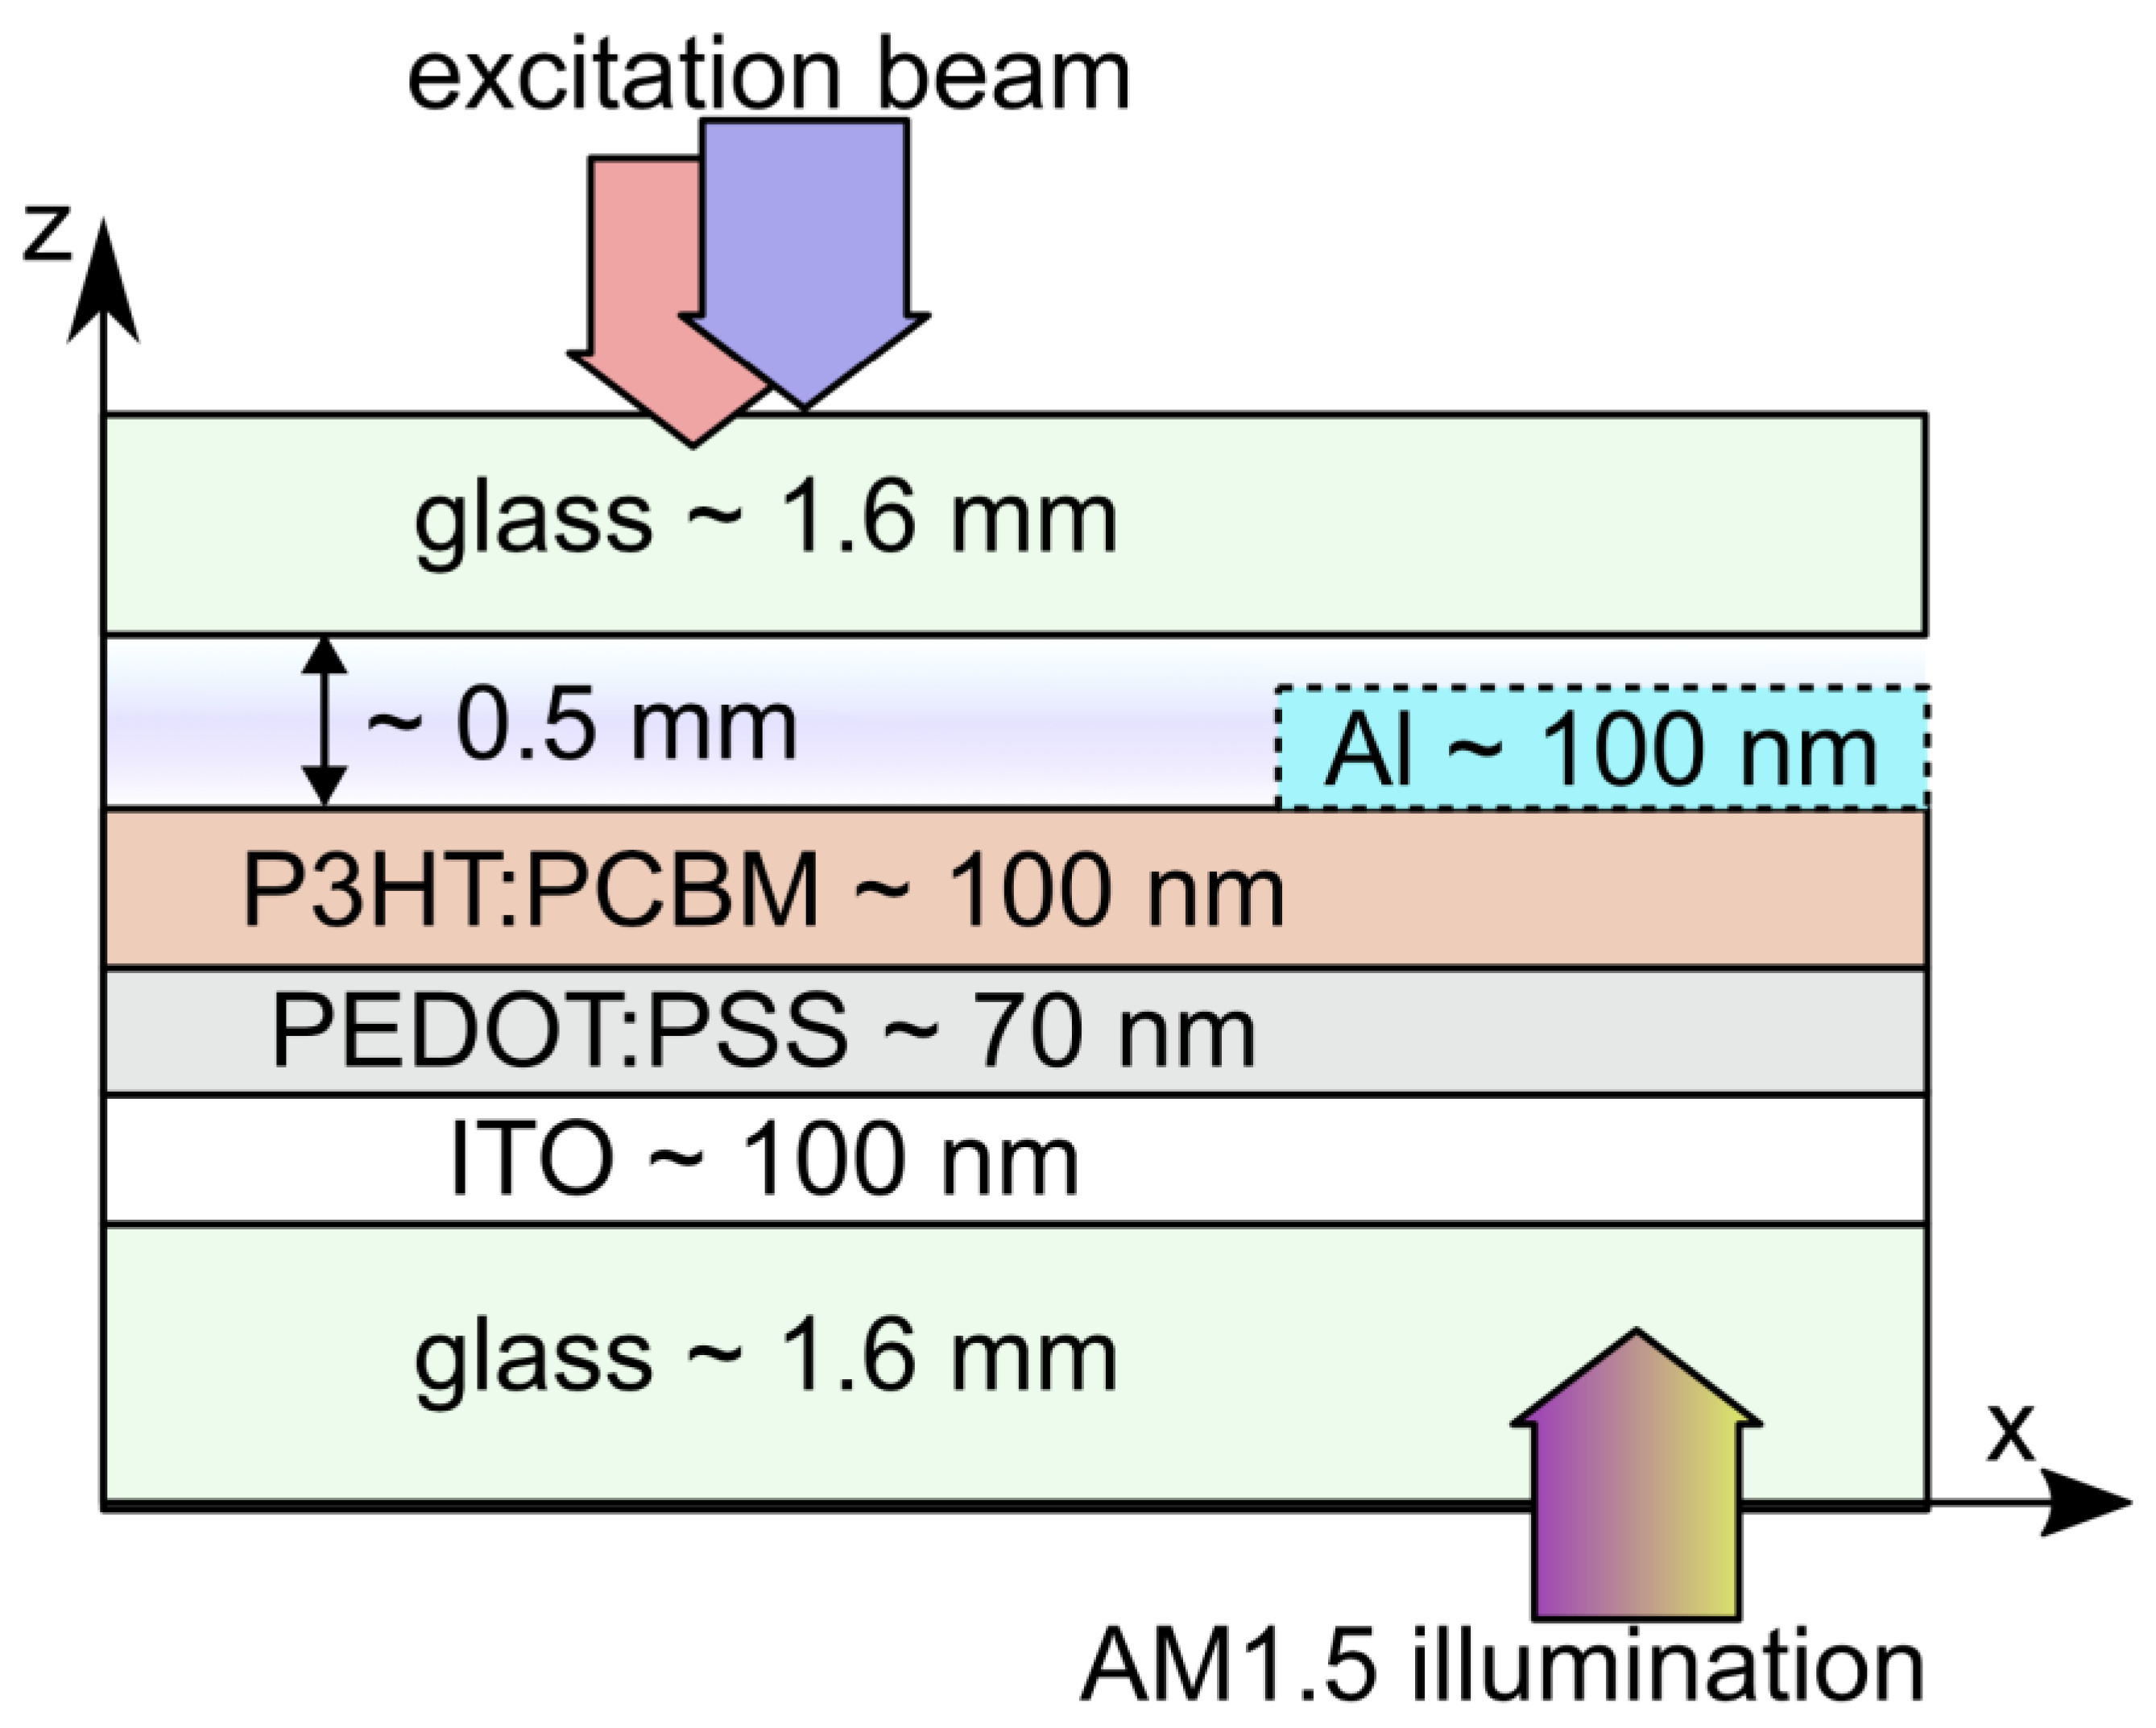
2.1. Preparation of Solar Cells
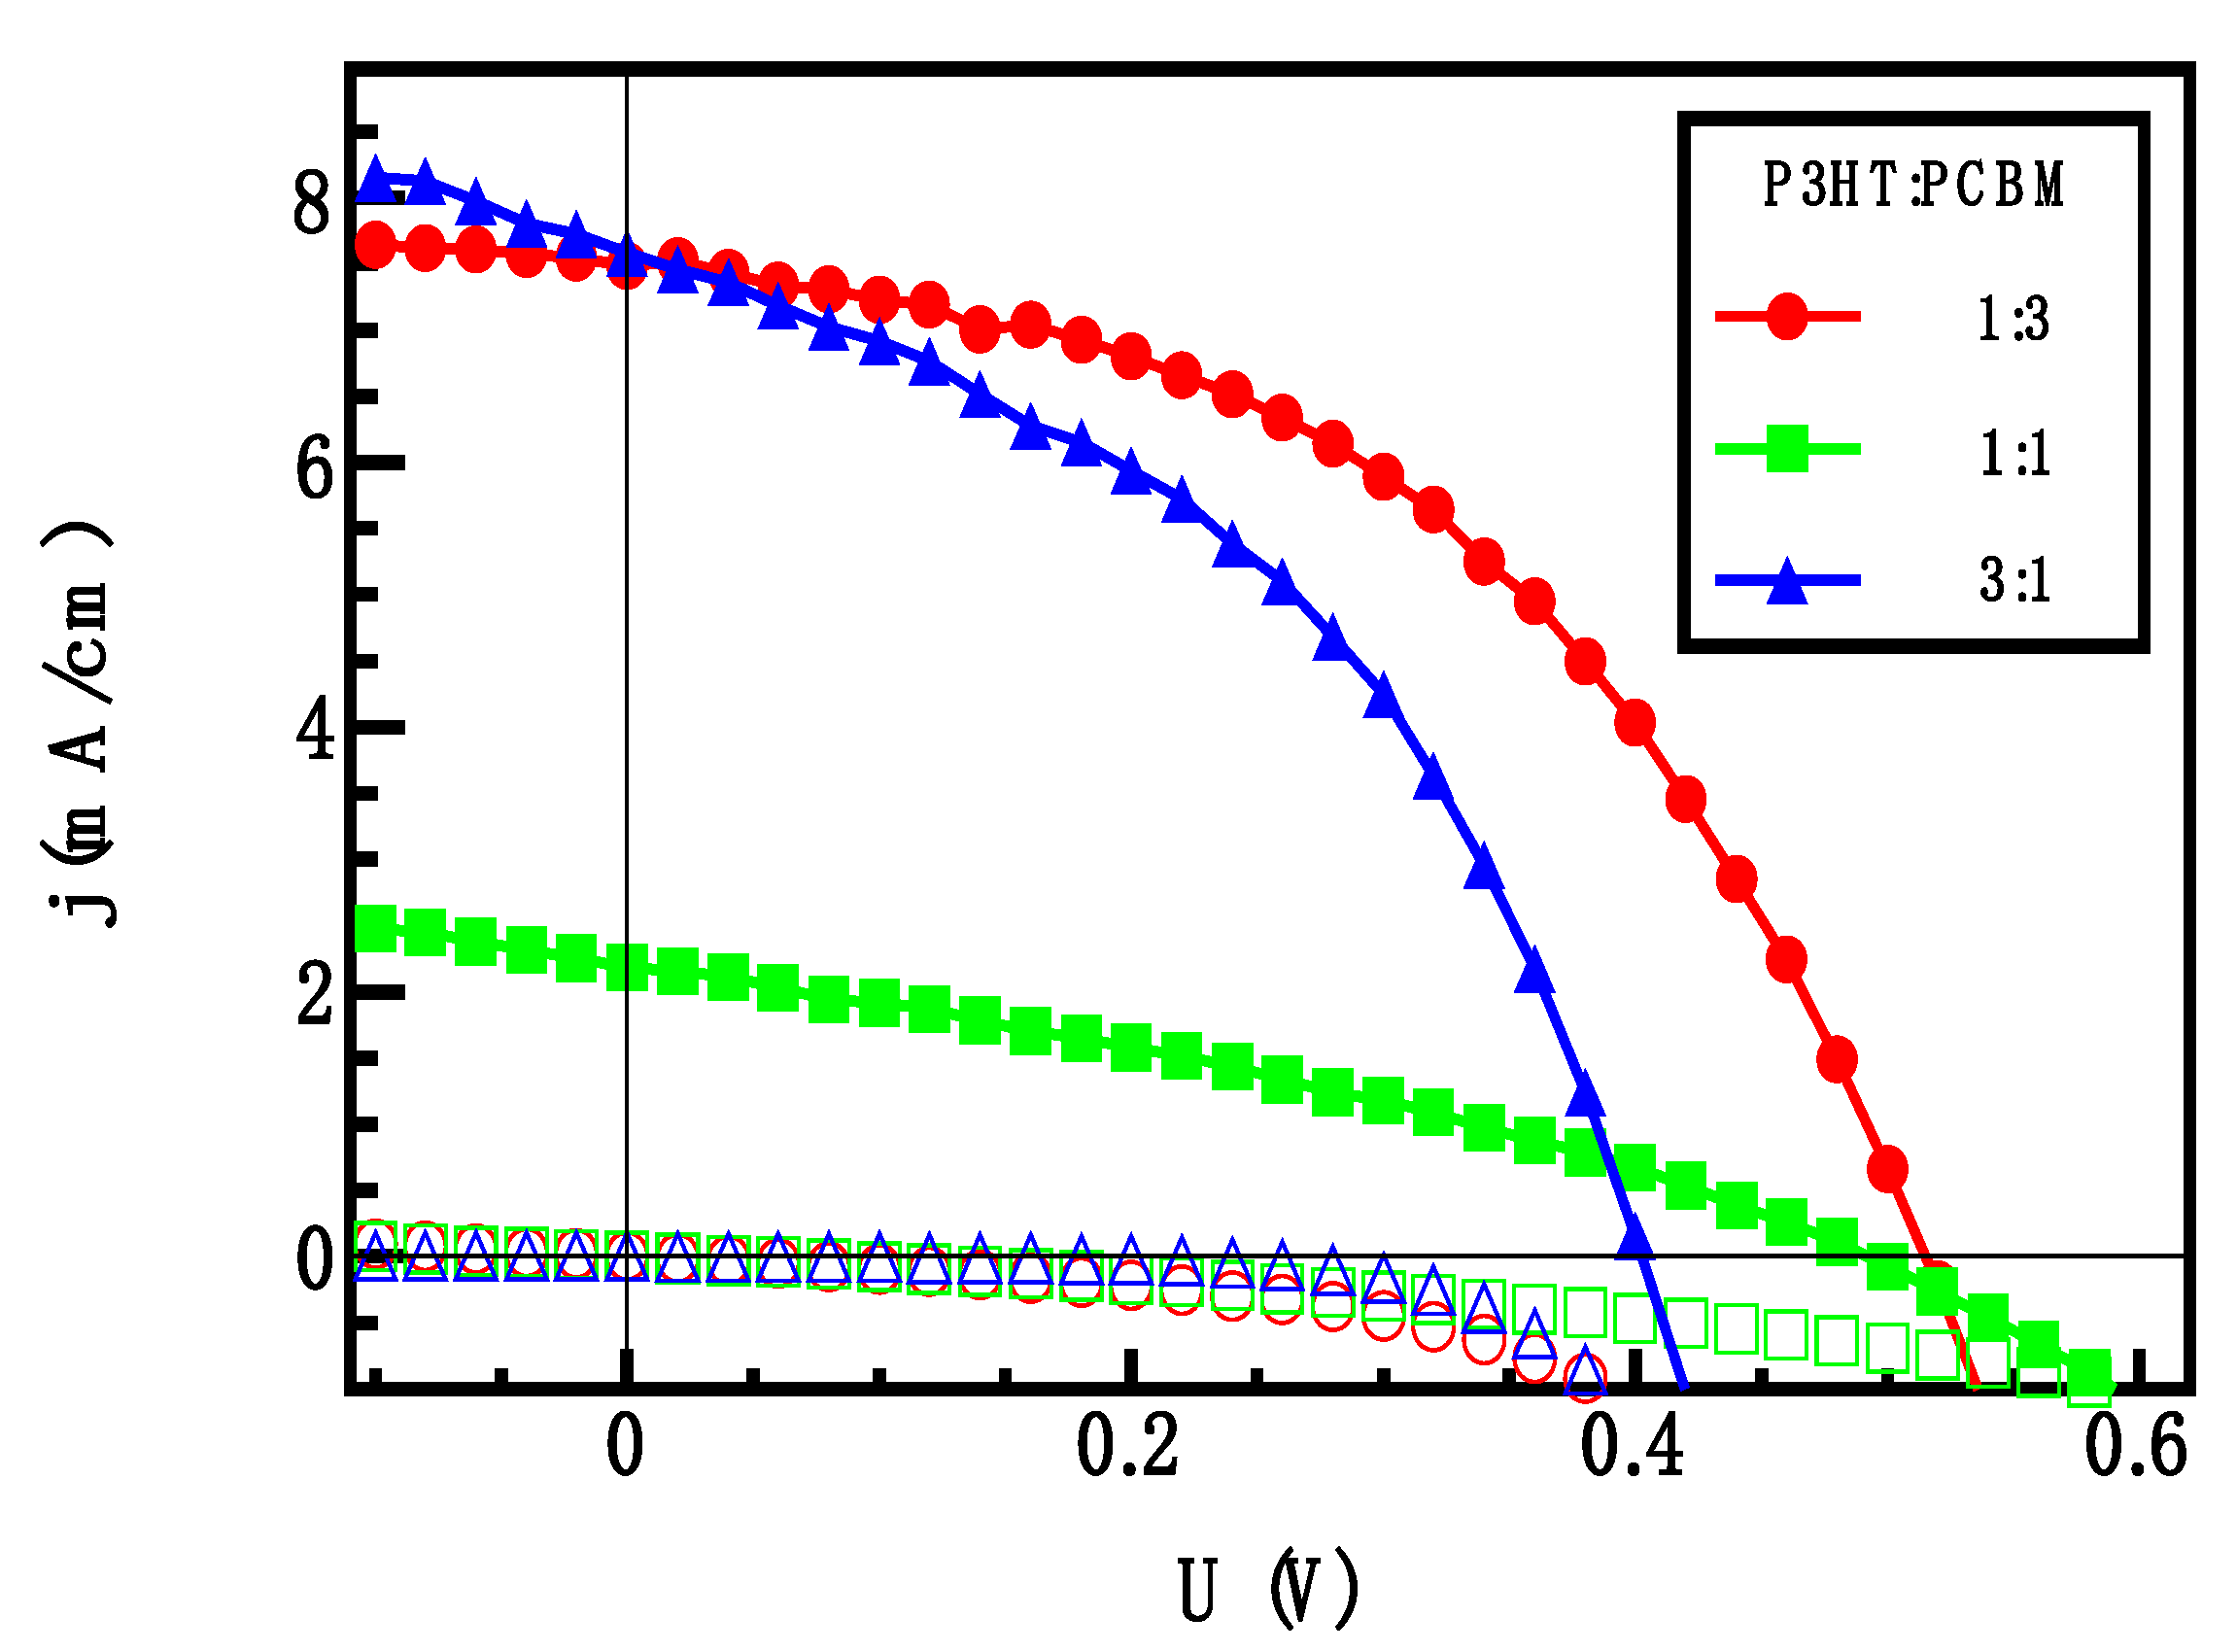
2.2. Current-Voltage Characteristics of Solar Cells
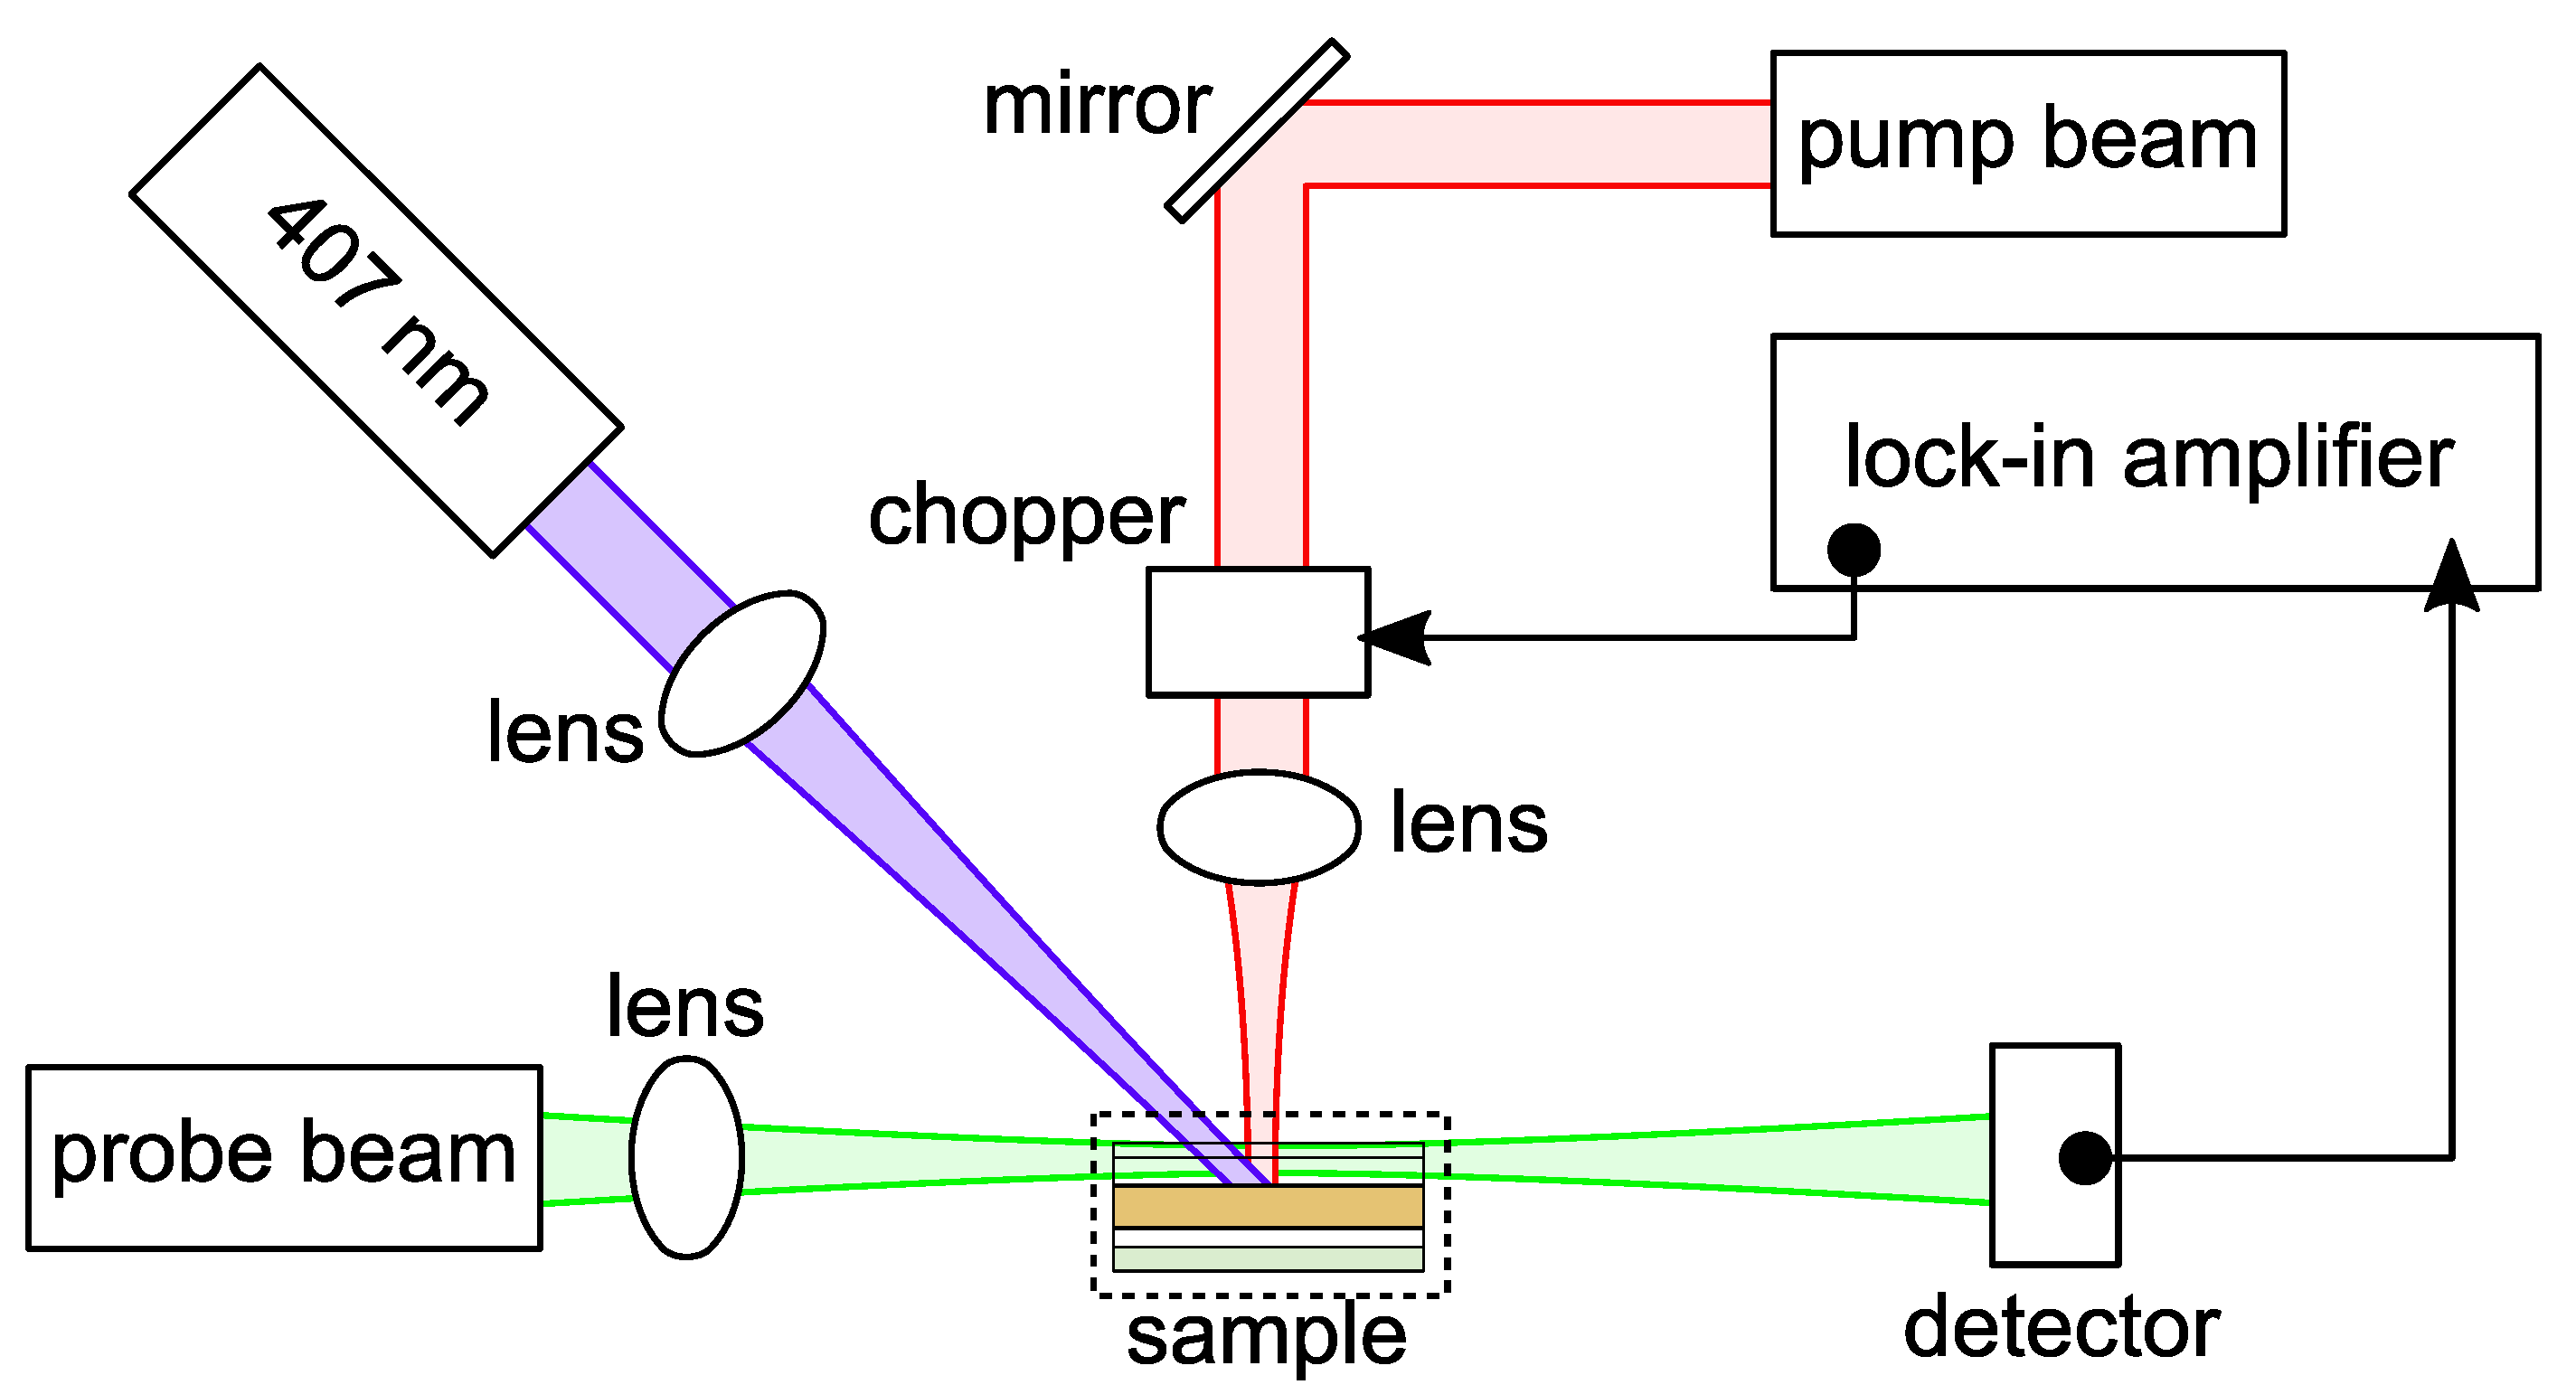
2.3. Photothermal Beam Deflection Spectrometry (BDS)
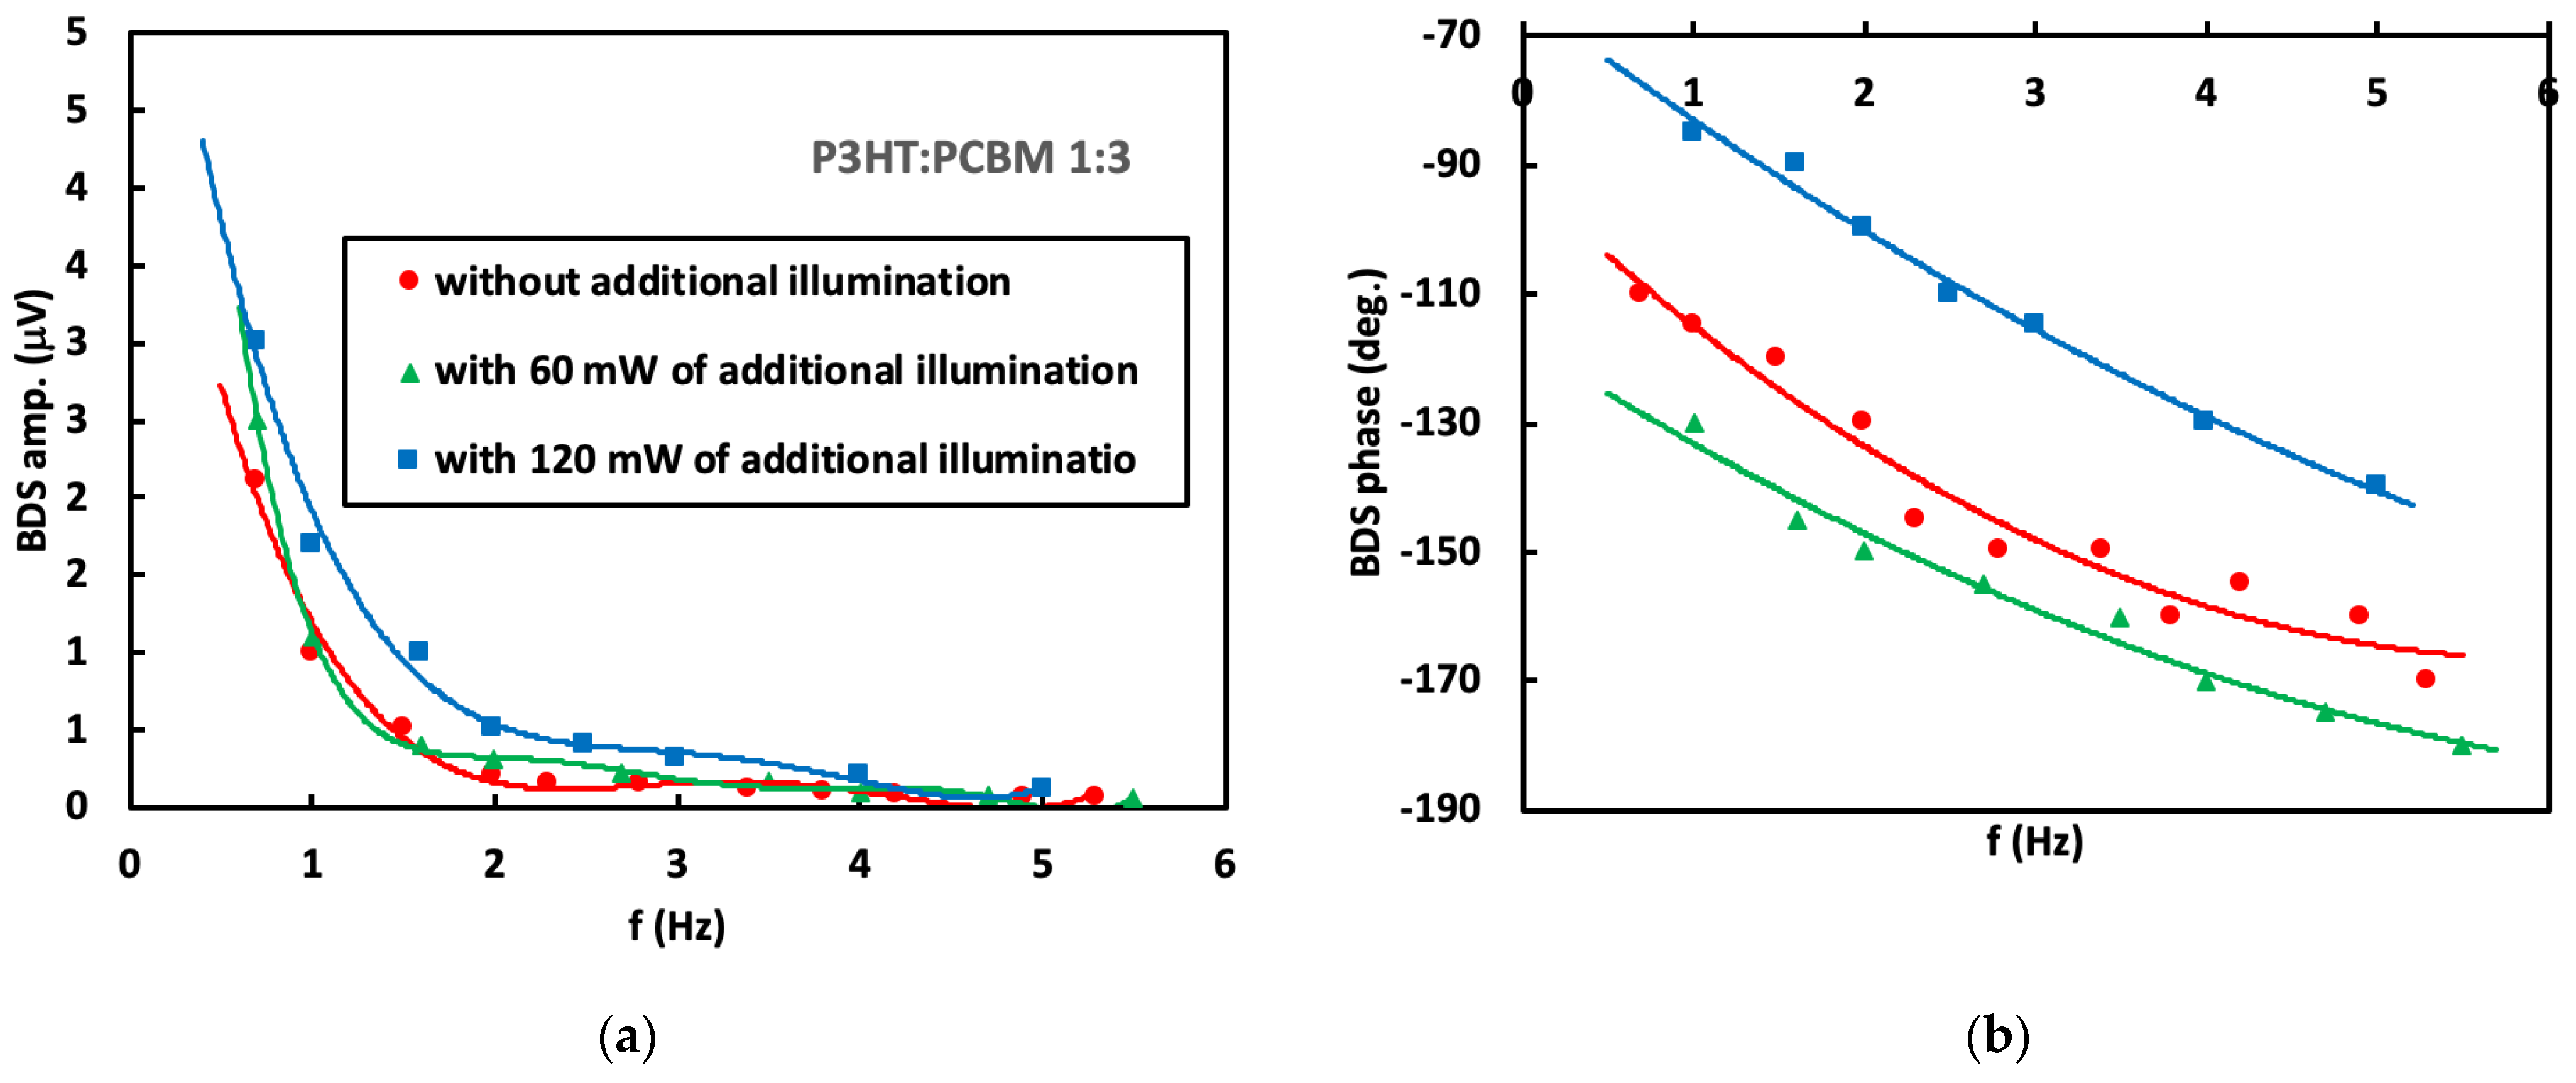
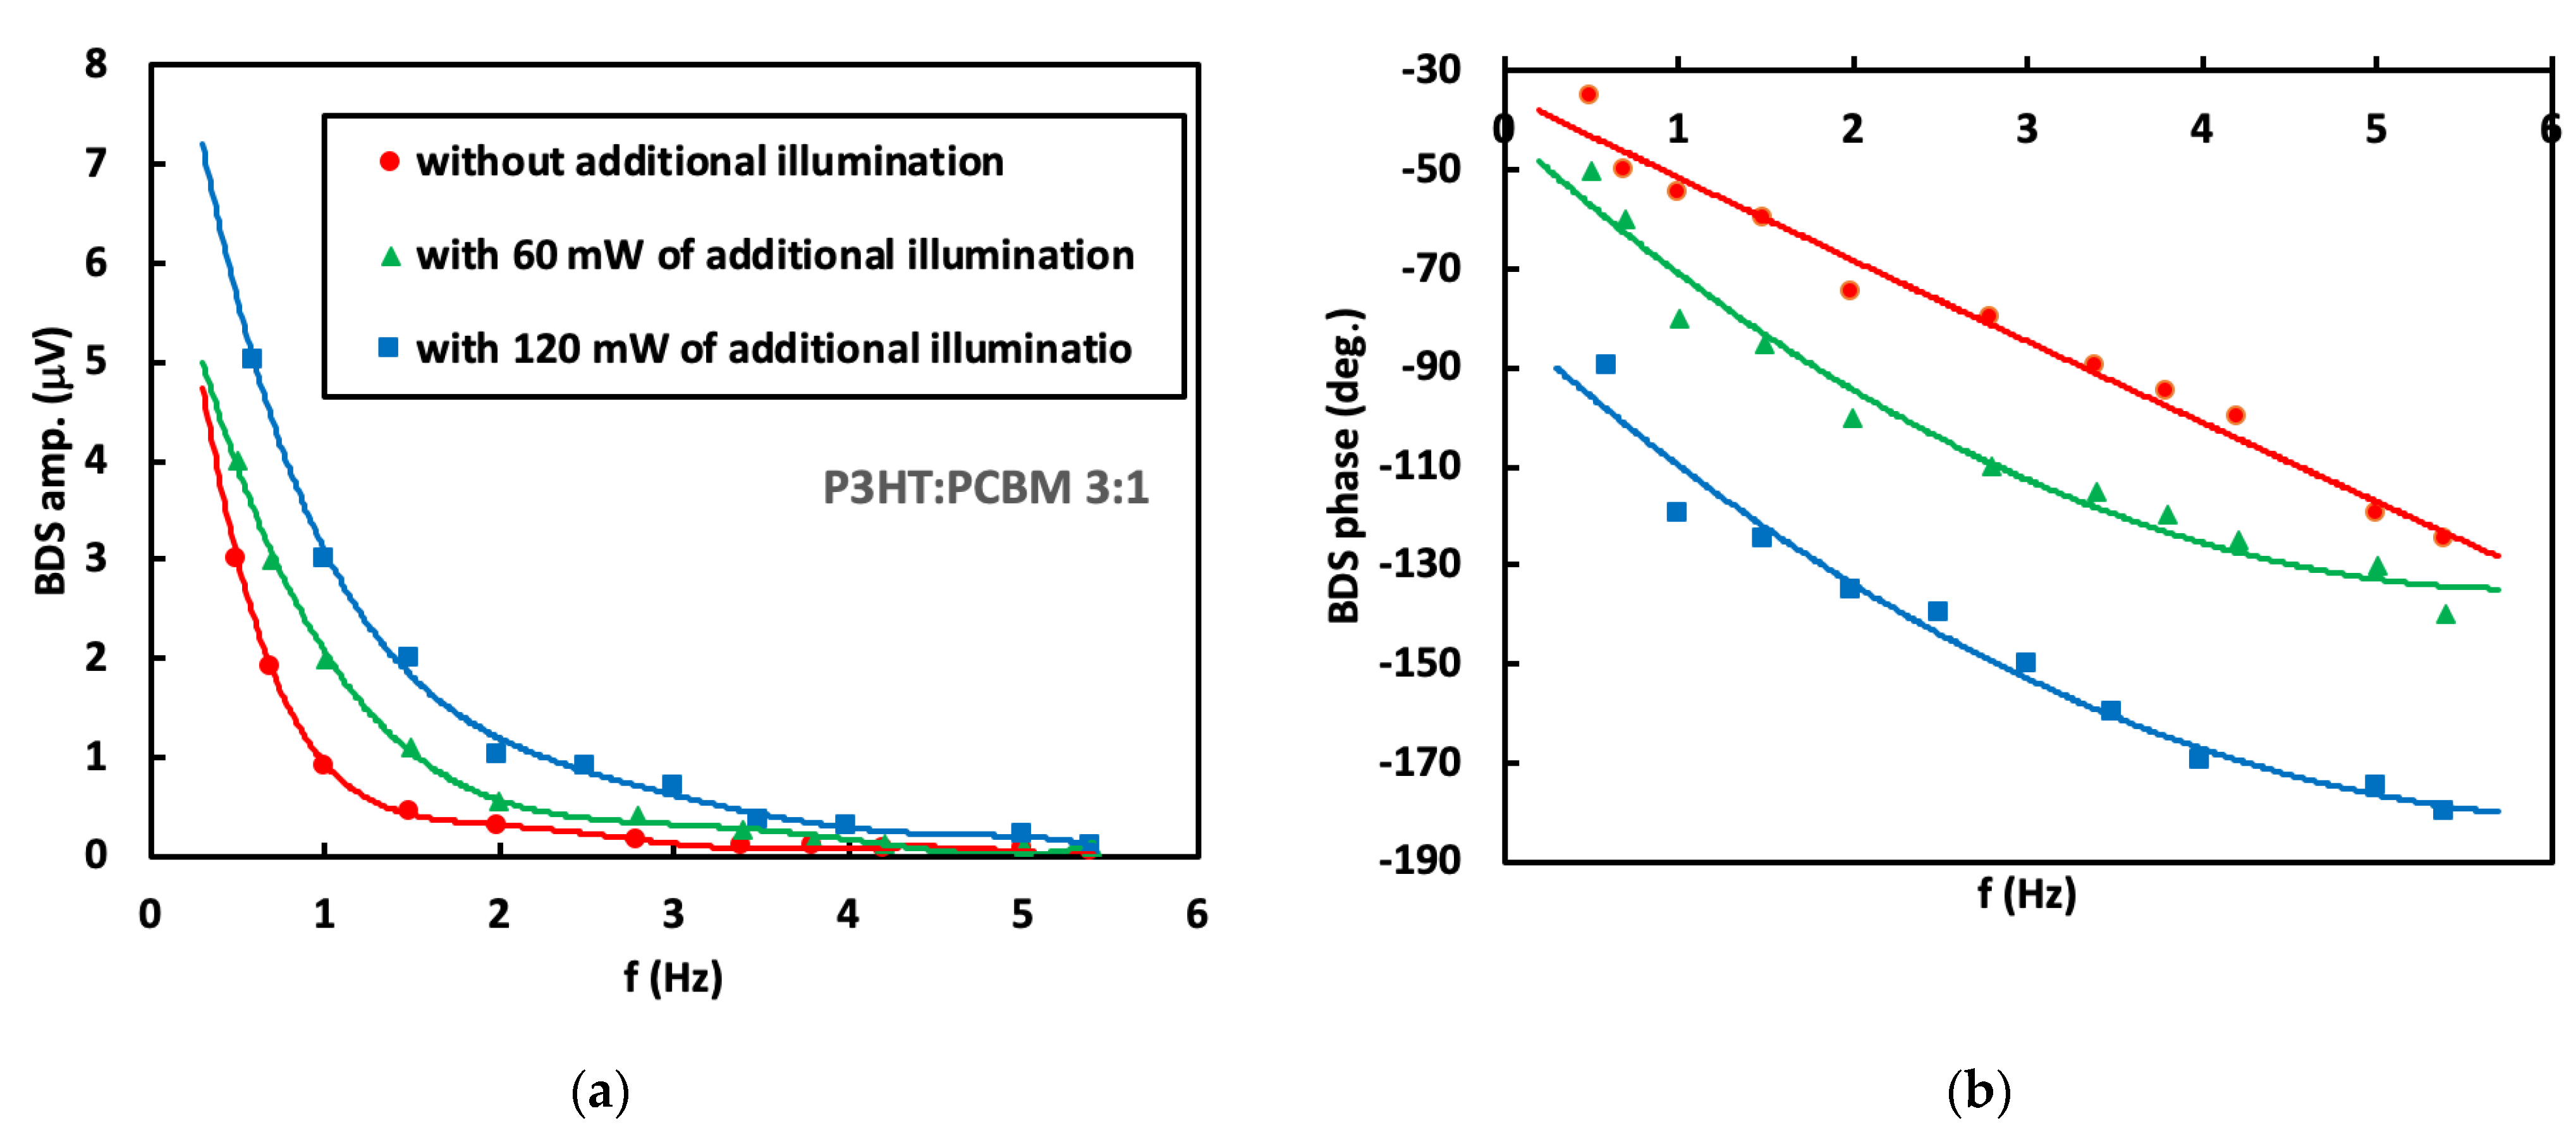
3. Results
4. Conclusions
Supplementary Materials
Author Contributions
Funding
Institutional Review Board Statement
Informed Consent Statement
Data Availability Statement
Acknowledgments
Conflicts of Interest
References
- Cunningham, P.D.; Hayden, L.M. Carrier Dynamics Resulting from Above and Below Gap Excitation of P3HT and P3HT/PCBM Investigated by Optical-Pump Terahertz-Probe Spectroscopy. J. Phys. Chem. C 2008, 112, 7928. [Google Scholar] [CrossRef]
- Derkowska-Zielinska, B.; Gondek, E.; Pokladko-Kowar, M.; Kaczmarek-Kedziera, A.; Kysil, A.; Lakshminarayana, G.; Krupka, O. Photovoltaic Cells with Various Azo Dyes as Components of the Active Layer. Sol. Energy 2020, 203, 19. [Google Scholar] [CrossRef]
- Fan, B.; Mei, X.; Ouyang, J. Significant Conductivity Enhancement of Conductive Poly(3,4-Ethylenedioxythiophene):Poly(Styrenesulfonate) Films by Adding Anionic Surfactants into Polymer Solution. Macromolecules 2008, 41, 5971. [Google Scholar] [CrossRef]
- Kim, Y.; Ballantyne, A.; Nelson, J.; Bradley, D. Effects of Thickness and Thermal Annealing of the PEDOT:PSS Layer on the Performance of Polymer Solar Cells. Org. Electron. 2009, 10, 205. [Google Scholar] [CrossRef]
- Nguyen, T.P.; Le Rendu, P.; Long, P.D.; De Vos, S.A. Chemical and Thermal Treatment of PEDOT:PSS Thin Films for Use in Organic Light Emitting Diodes. Surf. Coat. Technol. 2004, 646, 180–181. [Google Scholar] [CrossRef]
- Pingree, L.S.C.; MacLeod, B.A.; Ginger, D.S. The Changing Face of PEDOT:PSS Films: Substrate, Bias, and Processing Effects on Vertical Charge Transport. J. Phys. Chem. C 2008, 112, 7922. [Google Scholar] [CrossRef]
- Ebenhoch, B.; Thomson, S.A.J.; Genevičius, K.; Juška, G.; Samuel, I.D.W. Charge Carrier Mobility of the Organic Photovoltaic Materials PTB7 and PC71BM and Its Influence on Device Performance. Org. Electron. 2015, 22, 62. [Google Scholar] [CrossRef] [Green Version]
- Mandoc, M.M.; Koster, L.J.A.; Blom, P.W.M. Optimum Charge Carrier Mobility in Organic Solar Cells. Appl. Phys. Lett. 2007, 90, 133504. [Google Scholar] [CrossRef] [Green Version]
- Benduhn, J.; Tvingstedt, K.; Piersimoni, F.; Ullbrich, S.; Fan, Y.; Tropiano, M.; McGarry, K.A.; Zeika, O.; Riede, M.K.; Douglas, C.J.; et al. Intrinsic Non-Radiative Voltage Losses in Fullerene-Based Organic Solar Cells. Nat. Energy 2017, 2, 17053. [Google Scholar] [CrossRef]
- Shieh, J.-T.; Liu, C.-H.; Meng, H.-F.; Tseng, S.-R.; Chao, Y.-C.; Horng, S.-F. The Effect of Carrier Mobility in Organic Solar Cells. J. Appl. Phys. 2010, 107, 084503. [Google Scholar] [CrossRef]
- Bartesaghi, D.; Pérez, I.D.C.; Kniepert, J.; Roland, S.; Turbiez, M.; Neher, D.; Koster, L.J.A. Competition between Recombination and Extraction of Free Charges Determines the Fill Factor of Organic Solar Cells. Nat. Commun. 2015, 6, 7083. [Google Scholar] [CrossRef] [PubMed] [Green Version]
- Wang, X.; Wang, W.; Yang, C.; Han, D.; Fan, H.; Zhang, J. Thermal Transport in Organic Semiconductors. J. Appl. Phys. 2021, 130, 170902. [Google Scholar] [CrossRef]
- Wang, H.; Chu, W.; Chen, G. A Brief Review on Measuring Methods of Thermal Conductivity of Organic and Hybrid Thermoelectric Materials. Adv. Electron. Mater. 2019, 5, 1900167. [Google Scholar] [CrossRef]
- Fahlman, M.; Fabiano, S.; Gueskine, V.; Simon, D.; Berggren, M.; Crispin, X. Interfaces in Organic Electronics. Nat. Rev. Mater. 2019, 4, 627. [Google Scholar]
- Etxebarria, I.; Ajuria, J.; Pacios, R. Solution-Processable Polymeric Solar Cells: A Review on Materials, Strategies and Cell Architectures to Overcome 10%. Org. Electron. 2015, 19, 34. [Google Scholar]
- Zhang, F.; Inganäs, O.; Zhou, Y.; Vandewal, K. Development of Polymer–Fullerene Solar Cells. Natl. Sci. Rev. 2016, 3, 222. [Google Scholar] [CrossRef] [Green Version]
- Hwang, I.-S.; Lee, J.-Y.; Kim, J.; Pak, N.-Y.; Kim, J.; Chung, D.-W. Post-Treatment of Tannic Acid for Thermally Stable PEDOT:PSS Film. Polymers 2022, 14, 4908. [Google Scholar] [CrossRef]
- Korte, D.; Cabrera, H.; Toro, J.; Grima, P.; Leal, C.; Villabona, A.; Franko, M. Optimized frequency dependent photothermal beam deflection spectroscopy. Laser Phys. lett. 2016, 13, 1. [Google Scholar] [CrossRef] [Green Version]
- Trefon-Radziejewska, D.; Bodzenta, J.; Łukasiewicz, T. Thermal-Diffusivity Dependence on Temperature of Gadolinium Calcium Oxoborate Single Crystals. Int. J. Thermophys. 2013, 34, 813. [Google Scholar] [CrossRef] [Green Version]
- Pawlak, M.; Jukam, N.; Kruck, T.; Dziczek, D.; Ludwig, A.; Wieck, A.D. Measurement of Thermal Transport Properties of Selected Superlattice and Thin Films Using Frequency-Domain Photothermal Infrared Radiometry. Measurement 2020, 166, 108226. [Google Scholar] [CrossRef]
- Pawlak, M.; Kruck, T.; Spitzer, N.; Dziczek, D.; Ludwig, A.; Wieck, A.D. Experimental Validation of Formula for Calculation Thermal Diffusivity in Superlattices Performed Using a Combination of Two Frequency-Domain Methods: Photothermal Infrared Radiometry and Thermoreflectance. Appl. Sci. 2021, 11, 6125. [Google Scholar] [CrossRef]
- Trefon-Radziejewska, D.; Bodzenta, J. Investigation of Thermal Diffusivity Dependence on Temperature in a Group of Optical Single Crystals Doped with Rare Earth Ions. Opt. Mater. 2015, 45, 47. [Google Scholar] [CrossRef]
- Gaied, I.; Abroug, S.; Yacoubi, N. Investigation of Thermal Diffusivity of Doped and Undoped GaSb by the Photothermal Deflection Technique. Phys. Procedia 2009, 2, 859. [Google Scholar] [CrossRef] [Green Version]
- Bagienski, W.; Gupta, M.C. Temperature Dependence of Polymer/Fullerene Organic Solar Cells. Sol. Energy Mater. Sol. Cells 2011, 95, 933. [Google Scholar] [CrossRef]
- Treat, N.D.; Mates, T.E.; Hawker, C.J.; Kramer, E.J.; Chabinyc, M.L. Temperature Dependence of the Diffusion Coefficient of PCBM in Poly(3-Hexylthiophene). Macromolecules 2013, 46, 1002. [Google Scholar] [CrossRef]
- Motaung, D.; Malgas, G.; Nkosi, S.; Mhlongo, G.; Mwakikunga, B.; Malwela, T.; Arendse, C.; Muller, T.G.; Cummings, F. Comparative Study: The Effect of Annealing Conditions on the Properties of P3HT:PCBM Blends. J. Mater. Sci. 2013, 48, 1763. [Google Scholar] [CrossRef]
- Tromholt, T.; Madsen, M.V.; Carle, J.E.; Helgesen, M.; Krebs, F.C. Photochemical Stability of Conjugated Polymers, Electron Acceptors and Blends for Polymer Solar Cells Resolved in Terms of Film Thickness and Absorbance. J. Mater. Chem. 2012, 22, 7592. [Google Scholar] [CrossRef]
- Wei, F.; Liu, L.; Liu, L.; Li, G. Multiscale Modeling and Simulation for Optimizing Polymer Bulk Heterojunction Solar Cells. IEEE J. Photovolt. 2013, 3, 300–309. [Google Scholar] [CrossRef]
- Kim, Y.; Choulis, S.A.; Nelson, J.; Bradley, D.; Cook, S.; Durrant, J. Composition and annealing effects in polythiophene/fullerene solar cells. J. Mater. Sci. 2005, 40, 1371–1376. [Google Scholar] [CrossRef]
- Garcia-Belmonte, G.; Boix, P.; Bisquert, J.; Sessolo, M.; Bolink, H. Simultaneous determination of carrier lifetime and electron density-of-states in P3HT:PCBM organic solar cells under illumination by impedance spectroscopy. Sol. Energy Mater. Sol. Cells 2010, 94, 366–375. [Google Scholar] [CrossRef]
- Orgiu, E.; Crivillers, N.; Herder, M.; Grubert, L.; Pätzel, M.; Frisch, J.; Pavlica, E.; Duong, D.T.; Bratina, G.; Salleo, A.; et al. Optically Switchable Transistor via Energy-Level Phototuning in a Bicomponent Organic Semiconductor. Nat. Chem. 2012, 4, 675. [Google Scholar] [CrossRef] [PubMed]
- Chen, Q.; Ye, F.; Lai, J.; Dai, P.; Lu, S.; Ma, C.; Zhao, Y.; Xie, Y.; Chen, L. Energy Band Alignment in Operando Inverted Structure P3HT:PCBM Organic Solar Cells. Nano Energy 2017, 40, 454. [Google Scholar] [CrossRef]
- Hamilton, R.; Shuttle, C.; O’Regan, B.; Hammant, T.; Nelson, J.; Durrant, J. Recombination in Annealed and NonannealedPolythiophene/Fullerene Solar Cells: TransientPhotovoltage Studies versus Numerical Modeling. J. Phys. Chem. Lett. 2010, 1, 1432–1436. [Google Scholar] [CrossRef]
- Hiura, S.; Okada, N.; Wakui, J.; Narita, H.; Kanehashi, S.; Shimomura, T. Thermoelectric Properties of Poly(3-Hexylthiophene) Nanofiber Mat with a Large Void Fraction. Materials 2017, 10, 468. [Google Scholar] [CrossRef] [PubMed] [Green Version]
- Chang, B.K.; Zhou, J.; Lee, N.; Bernardi, M. Intermediate polaronic charge transport in organic crystals from a many-body first-principlesapproach. NpjComput Mater 2022, 8, 63. [Google Scholar]
- Giri, A.; Chou, S.S.; Drury, D.E.; Tomko, K.Q.; Olson, D.; Gaskins, J.T.; Kaehr, B.; Hopkins, P.E. Molecular Tail Chemistry Controls Thermal Transport in Fullerene Films. Phys. Rev. Mater. 2020, 4, 065404. [Google Scholar] [CrossRef]
- Duda, J.C.; Hopkins, P.E.; Shen, Y.; Gupta, M.C. Thermal Transport in Organic Semiconducting Polymers. Appl. Phys. Lett. 2013, 102, 251912. [Google Scholar] [CrossRef] [Green Version]
- Hoppe, H.; Sariciftci, N. Polymer Solar Cells. In Photoresponsive Polymers II 1; Springer: Berlin/Heidelberg, Germany, 2008. [Google Scholar]
- Shaheen, S.E.; White, M.S.; Olson, D.C.; Kopidakis, N.; Ginley, D.S. Inverted Bulk-Heterojunction Plastic Solar Cells. SPIE Newsroom 2007, 24. [Google Scholar] [CrossRef]
- Lu, N.; Li, L.; Gao, N.; Liu, M. A unified description of thermal transport performance in disordered organic semiconductors. Org. Electron. 2017, 41, 294–300. [Google Scholar] [CrossRef]
- DeAngelis, F.; Muraleedharan, M.G.; Moon, J.; Seyf, H.R.; Minnich, A.J.; McGaughey, A.J.H.; Henry, A. Thermal Transport in Disordered Materials. Nanoscale Microscale Thermophys. Eng. 2019, 23, 81. [Google Scholar] [CrossRef]
- Lee, Y.-J.; Jeng, K.-S.; Chen, J.-T.; Sun, K.W. Exceptionally Low Thermal Conductivity of Poly(3-Hexylthiophene) Single Nanowires. RSC Adv. 2015, 5, 90847. [Google Scholar] [CrossRef]
- Lu, N.; Li, L.; Gao, N.; Liu, M. Understanding Electrical-Thermal Transport Characteristics of Organic Semiconductors: Violation of Wiedemann-Franz Law. J. Appl. Phys. 2016, 120, 195108. [Google Scholar] [CrossRef]
- Nawrocki, R.A.; Pavlica, E.; Ćelić, N.; Orlov, D.; Valant, M.; Mihailović, D.; Bratina, G. Fabrication of Poly(3-Hexylthiophene) Nanowires for High-Mobility Transistors. Org. Electron. 2016, 30, 92. [Google Scholar] [CrossRef]
- Huang, J.; Li, G.; Yang, Y. Influence of Composition and Heat-Treatment on the Charge Transport Properties of Poly(3-Hexylthiophene) and [14,14]-Phenyl C61-Butyric Acid Methyl Ester Blends. Appl. Phys. Lett. 2005, 87, 112105. [Google Scholar] [CrossRef] [Green Version]
- Hendry, E.; Koeberg, M.; Schins, J.M.; Nienhuys, H.K.; Sundström, V.; Siebbeles, L.D.A.; Bonn, M. Interchain Effects in the Ultrafast Photophysics of a Semiconducting Polymer: THz Time-Domain Spectroscopy of Thin Films and Isolated Chains in Solution. Phys. Rev. B 2005, 71, 125201. [Google Scholar] [CrossRef] [Green Version]
- Wilken, S.; Scheunemann, D.; Dahlström, S.; Nyman, M.; Parisi, J.; Österbacka, R. How to Reduce Charge Recombination in Organic Solar Cells: There Are Still Lessons to Learn from P3HT:PCBM. Adv. Electron. Mater. 2021, 7, 2001056. [Google Scholar] [CrossRef]
- Kniepert, J.; Schubert, M.; Blakesley, J.; Neher, D. Photogeneration and Recombination in P3HT/PCBM Solar CellsProbed by Time-Delayed Collection Field Experiments. J. Phys. Chem. Lett. 2011, 2, 700–705. [Google Scholar] [CrossRef]
- Hwang, I.; McNeill, C.R.; Greenham, N.C. Drift-Diffusion Modeling of Photocurrent Transients in Bulk Heterojunction Solar Cells. J. Appl. Phys. 2009, 106, 094506. [Google Scholar] [CrossRef]
- Würfel, U.; Neher, D.; Spies, A.; Albrecht, S. Impact of Charge Transport on Current–Voltage Characteristics and Power-Conversion Efficiency of Organic Solar Cells. Nat. Commun. 2015, 6, 6951. [Google Scholar] [CrossRef] [PubMed] [Green Version]
- Magherusan, L.; Skraba, P.; Besleaga, C.; Iftimie, S.; Dina, N.; Bulgariu, M.; Bostan, C.G.; Tazlaoanu, C.; Radu, A.; Ion, L.; et al. Electrical and Photoelectrical Properties of Organic Photovoltaic Cells Based on Polymer Blends ITO/PEDOT/P3HT:PCBM (1:1). J. Optoelectron. Adv. Mater. 2010, 12, 212. [Google Scholar]
- Kurpiers, J.; Neher, D. Dispersive Non-Geminate Recombination in an Amorphous Polymer:Fullerene Blend. Sci. Rep. 2016, 6, 26832. [Google Scholar] [CrossRef] [PubMed] [Green Version]


| λ [nm] | P [mW] | D [m2s−1] | Eg [eV] | τ [μs] | Thickness [nm] | n [m−3] |
|---|---|---|---|---|---|---|
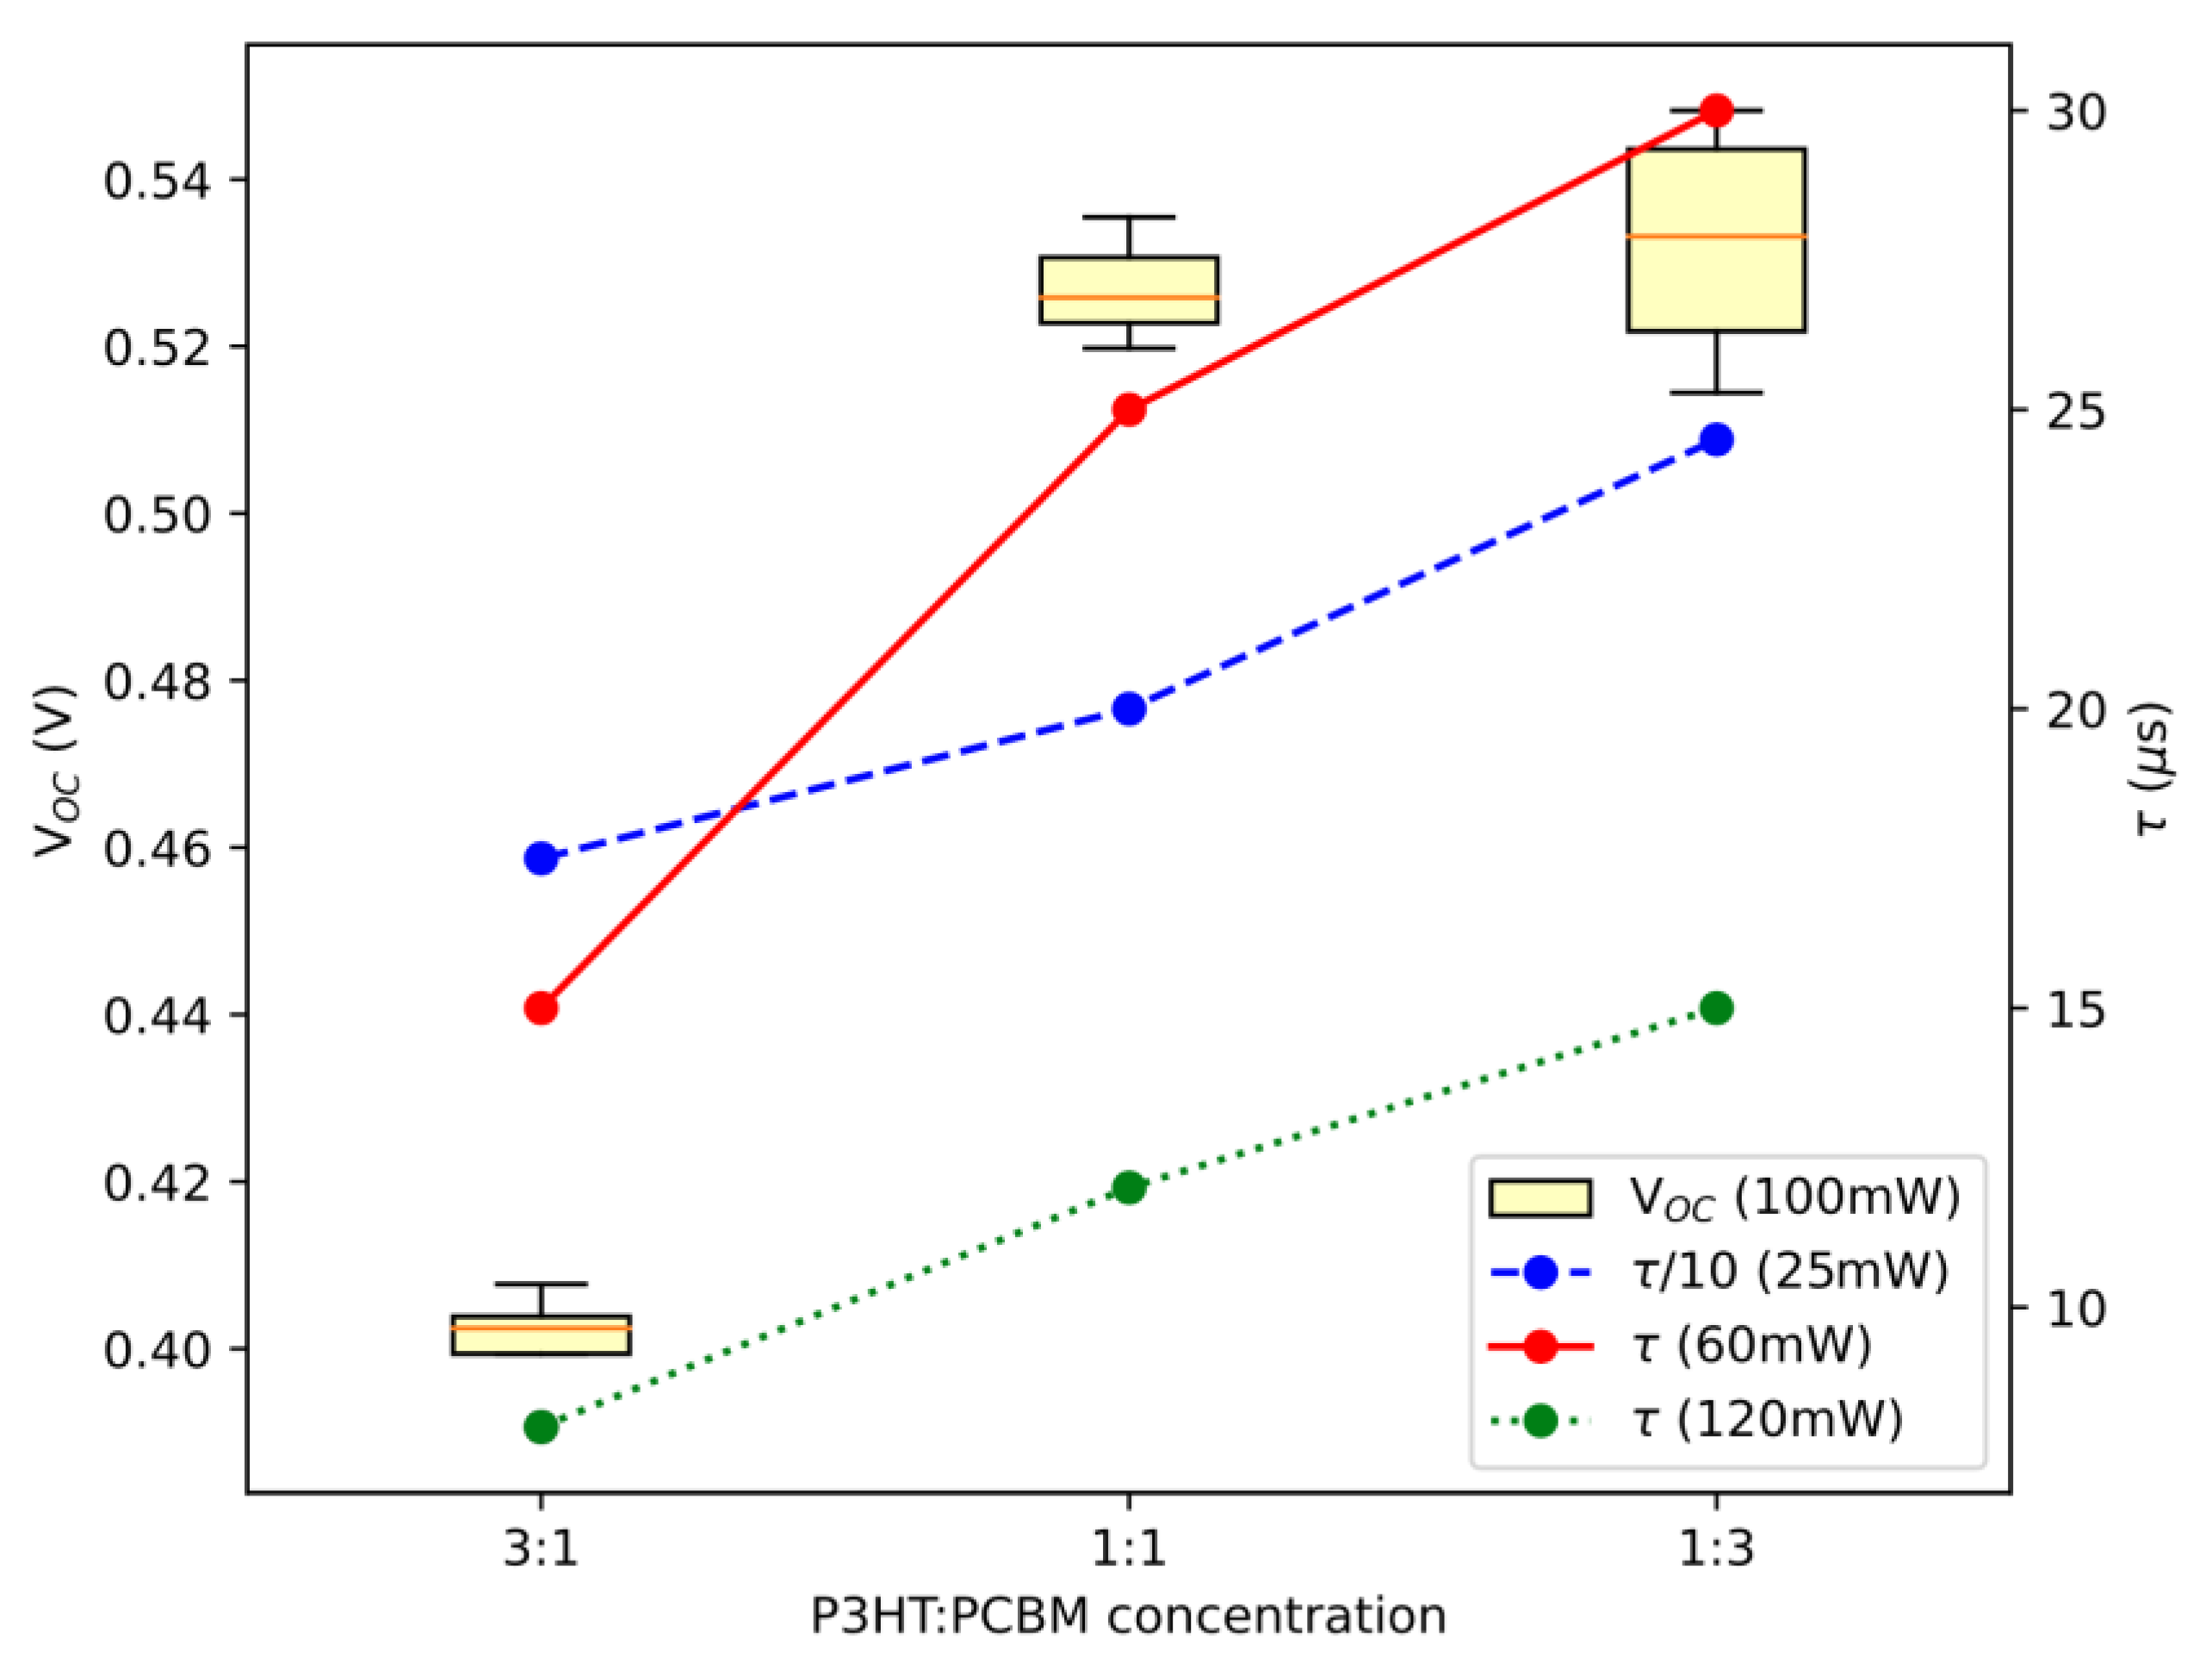
| 630 | 35 | (0.158 ± 0.012)·10−6 | 2.10 ± 0.10 | 200 ± 15 | 175 ± 20 | (2.50 ± 0.19)·1022 |
| 400 | 60 | (0.202 ± 0.014)·10−6 | 25 ± 2 | (2.00 ± 0.16)·1023 | ||
| 400 | 120 | (0.268 ± 0.018)·10−6 | 12 ± 1 | (4.17 ± 0.35)·1023 |
| λ [nm] | P [mW] | D [m2s−1] | Eg [eV] | τ [μs] | Thickness [nm] | n [m−3] |
|---|---|---|---|---|---|---|
| 630 | 35 | (0.075 ± 0.005)·10−6 | 2.25 ± 0.10 | 245 ± 15 | 175 ± 20 | (2.04 ± 0.13)·1022 |
| 400 | 60 | (0.112 ± 0.009)·10−6 | 30 ± 5 | (1.67 ± 0.28)·1023 | ||
| 400 | 120 | (0.148 ± 0.011)·10−6 | 15 ± 1 | (3.33 ± 0.22)·1023 |
| λ [nm] | P [mW] | D [m2s−1] | Eg [eV] | τ [μs] | Thickness [nm] | n [m−3] |
|---|---|---|---|---|---|---|
| 630 | 35 | (0.183 ± 0.11)·10−6 | 1.75 ± 0.10 | 175 ± 15 | 175 ± 20 | (2.86 ± 0.25)·1022 |
| 400 | 60 | (0.241 ± 0.018)·10−6 | 15 ± 2 | (3.33 ± 0.44)·1023 | ||
| 400 | 120 | (0.325 ± 0.023)·10−6 | 8 ± 1 | (6.25 ± 0.78)·1023 |
| Photovoltaic Cell | JSC [mA/cm2] | VOC [V] | FF | η [%] |
|---|---|---|---|---|
| P3HT:PCBM (3:1) | 7.55 | 0.41 | 0.42 | 1.30 |
| P3HT:PCBM (1:1) | 2.20 | 0.50 | 0.31 | 0.34 |
| P3HT:PCBM (1:3) | 7.47 | 0.52 | 0.46 | 1.78 |
Disclaimer/Publisher’s Note: The statements, opinions and data contained in all publications are solely those of the individual author(s) and contributor(s) and not of MDPI and/or the editor(s). MDPI and/or the editor(s) disclaim responsibility for any injury to people or property resulting from any ideas, methods, instructions or products referred to in the content. |
© 2023 by the authors. Licensee MDPI, Basel, Switzerland. This article is an open access article distributed under the terms and conditions of the Creative Commons Attribution (CC BY) license (https://creativecommons.org/licenses/by/4.0/).
Share and Cite
Korte, D.; Pavlica, E.; Klančar, D.; Bratina, G.; Pawlak, M.; Gondek, E.; Song, P.; Liu, J.; Derkowska-Zielinska, B. Influence of P3HT:PCBM Ratio on Thermal and Transport Properties of Bulk Heterojunction Solar Cells. Materials 2023, 16, 617. https://doi.org/10.3390/ma16020617
Korte D, Pavlica E, Klančar D, Bratina G, Pawlak M, Gondek E, Song P, Liu J, Derkowska-Zielinska B. Influence of P3HT:PCBM Ratio on Thermal and Transport Properties of Bulk Heterojunction Solar Cells. Materials. 2023; 16(2):617. https://doi.org/10.3390/ma16020617
Chicago/Turabian StyleKorte, Dorota, Egon Pavlica, Domen Klančar, Gvido Bratina, Michal Pawlak, Ewa Gondek, Peng Song, Junyan Liu, and Beata Derkowska-Zielinska. 2023. "Influence of P3HT:PCBM Ratio on Thermal and Transport Properties of Bulk Heterojunction Solar Cells" Materials 16, no. 2: 617. https://doi.org/10.3390/ma16020617