

A Simplified Model for Shear Behavior of Mortar Using Biomimetic Carbonate Precipitation

Abstract
:1. Introduction
2. Methodology
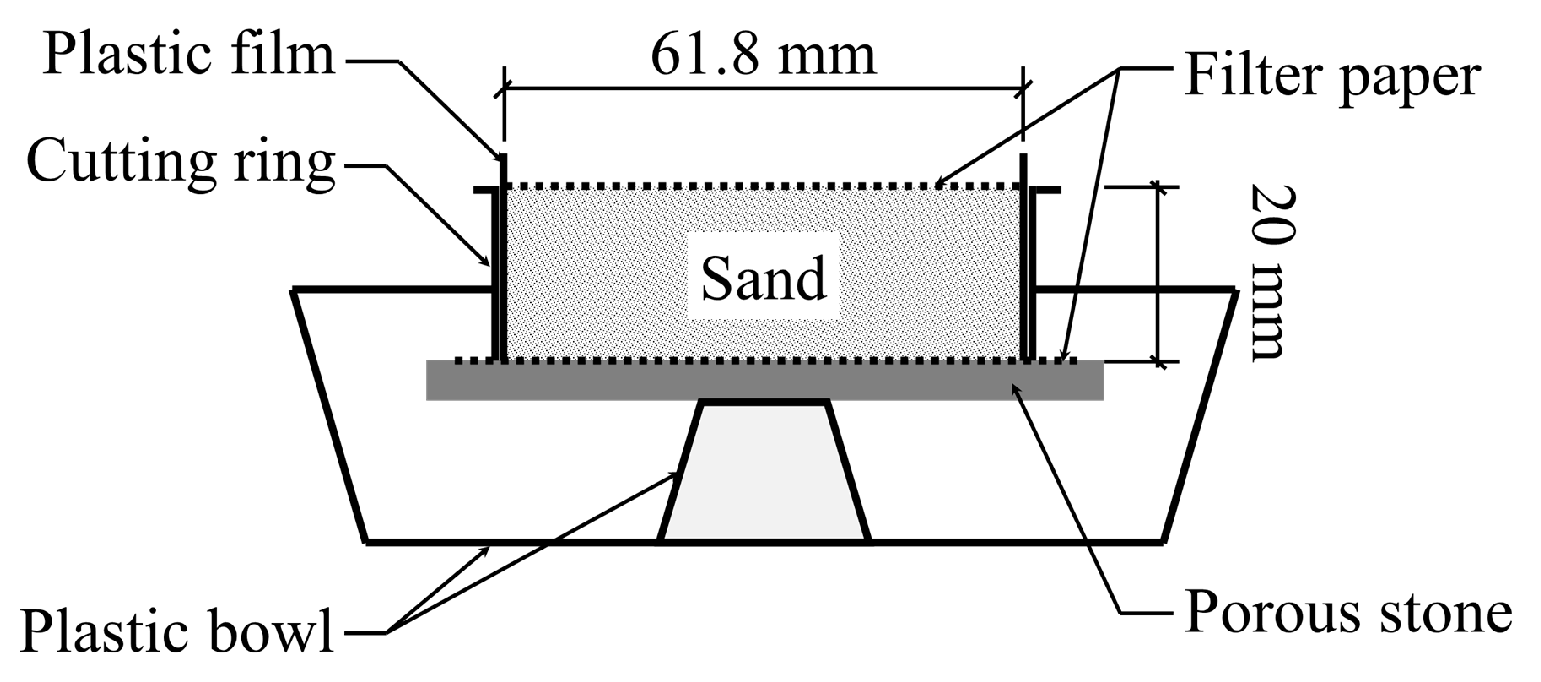
2.1. Specimen Preparation
- (1)
- By air pluviation, 85 g of completely dried sand was filled into the cutting ring.
- (2)
- A piece of filter paper was placed on the top to prevent the deformation of specimen and make the fluid permeate evenly through the sand during the spray of cementation solutions. There was also a piece of filter paper at the bottom of the specimen in case the sand adhered to the porous stone.
- (3)
- Deionized water was then sprayed on the filter paper covered on the specimen to get the sand saturated. After that, C1 (5 mL) was first applied from the top surface, and then C2 (also 5 mL) was applied, making one spray cycle.
- (4)
- After a certain number of spray cycles, the cemented specimen was put into an oven of 105 °C for 24 h until the weight got constant.
- (1)
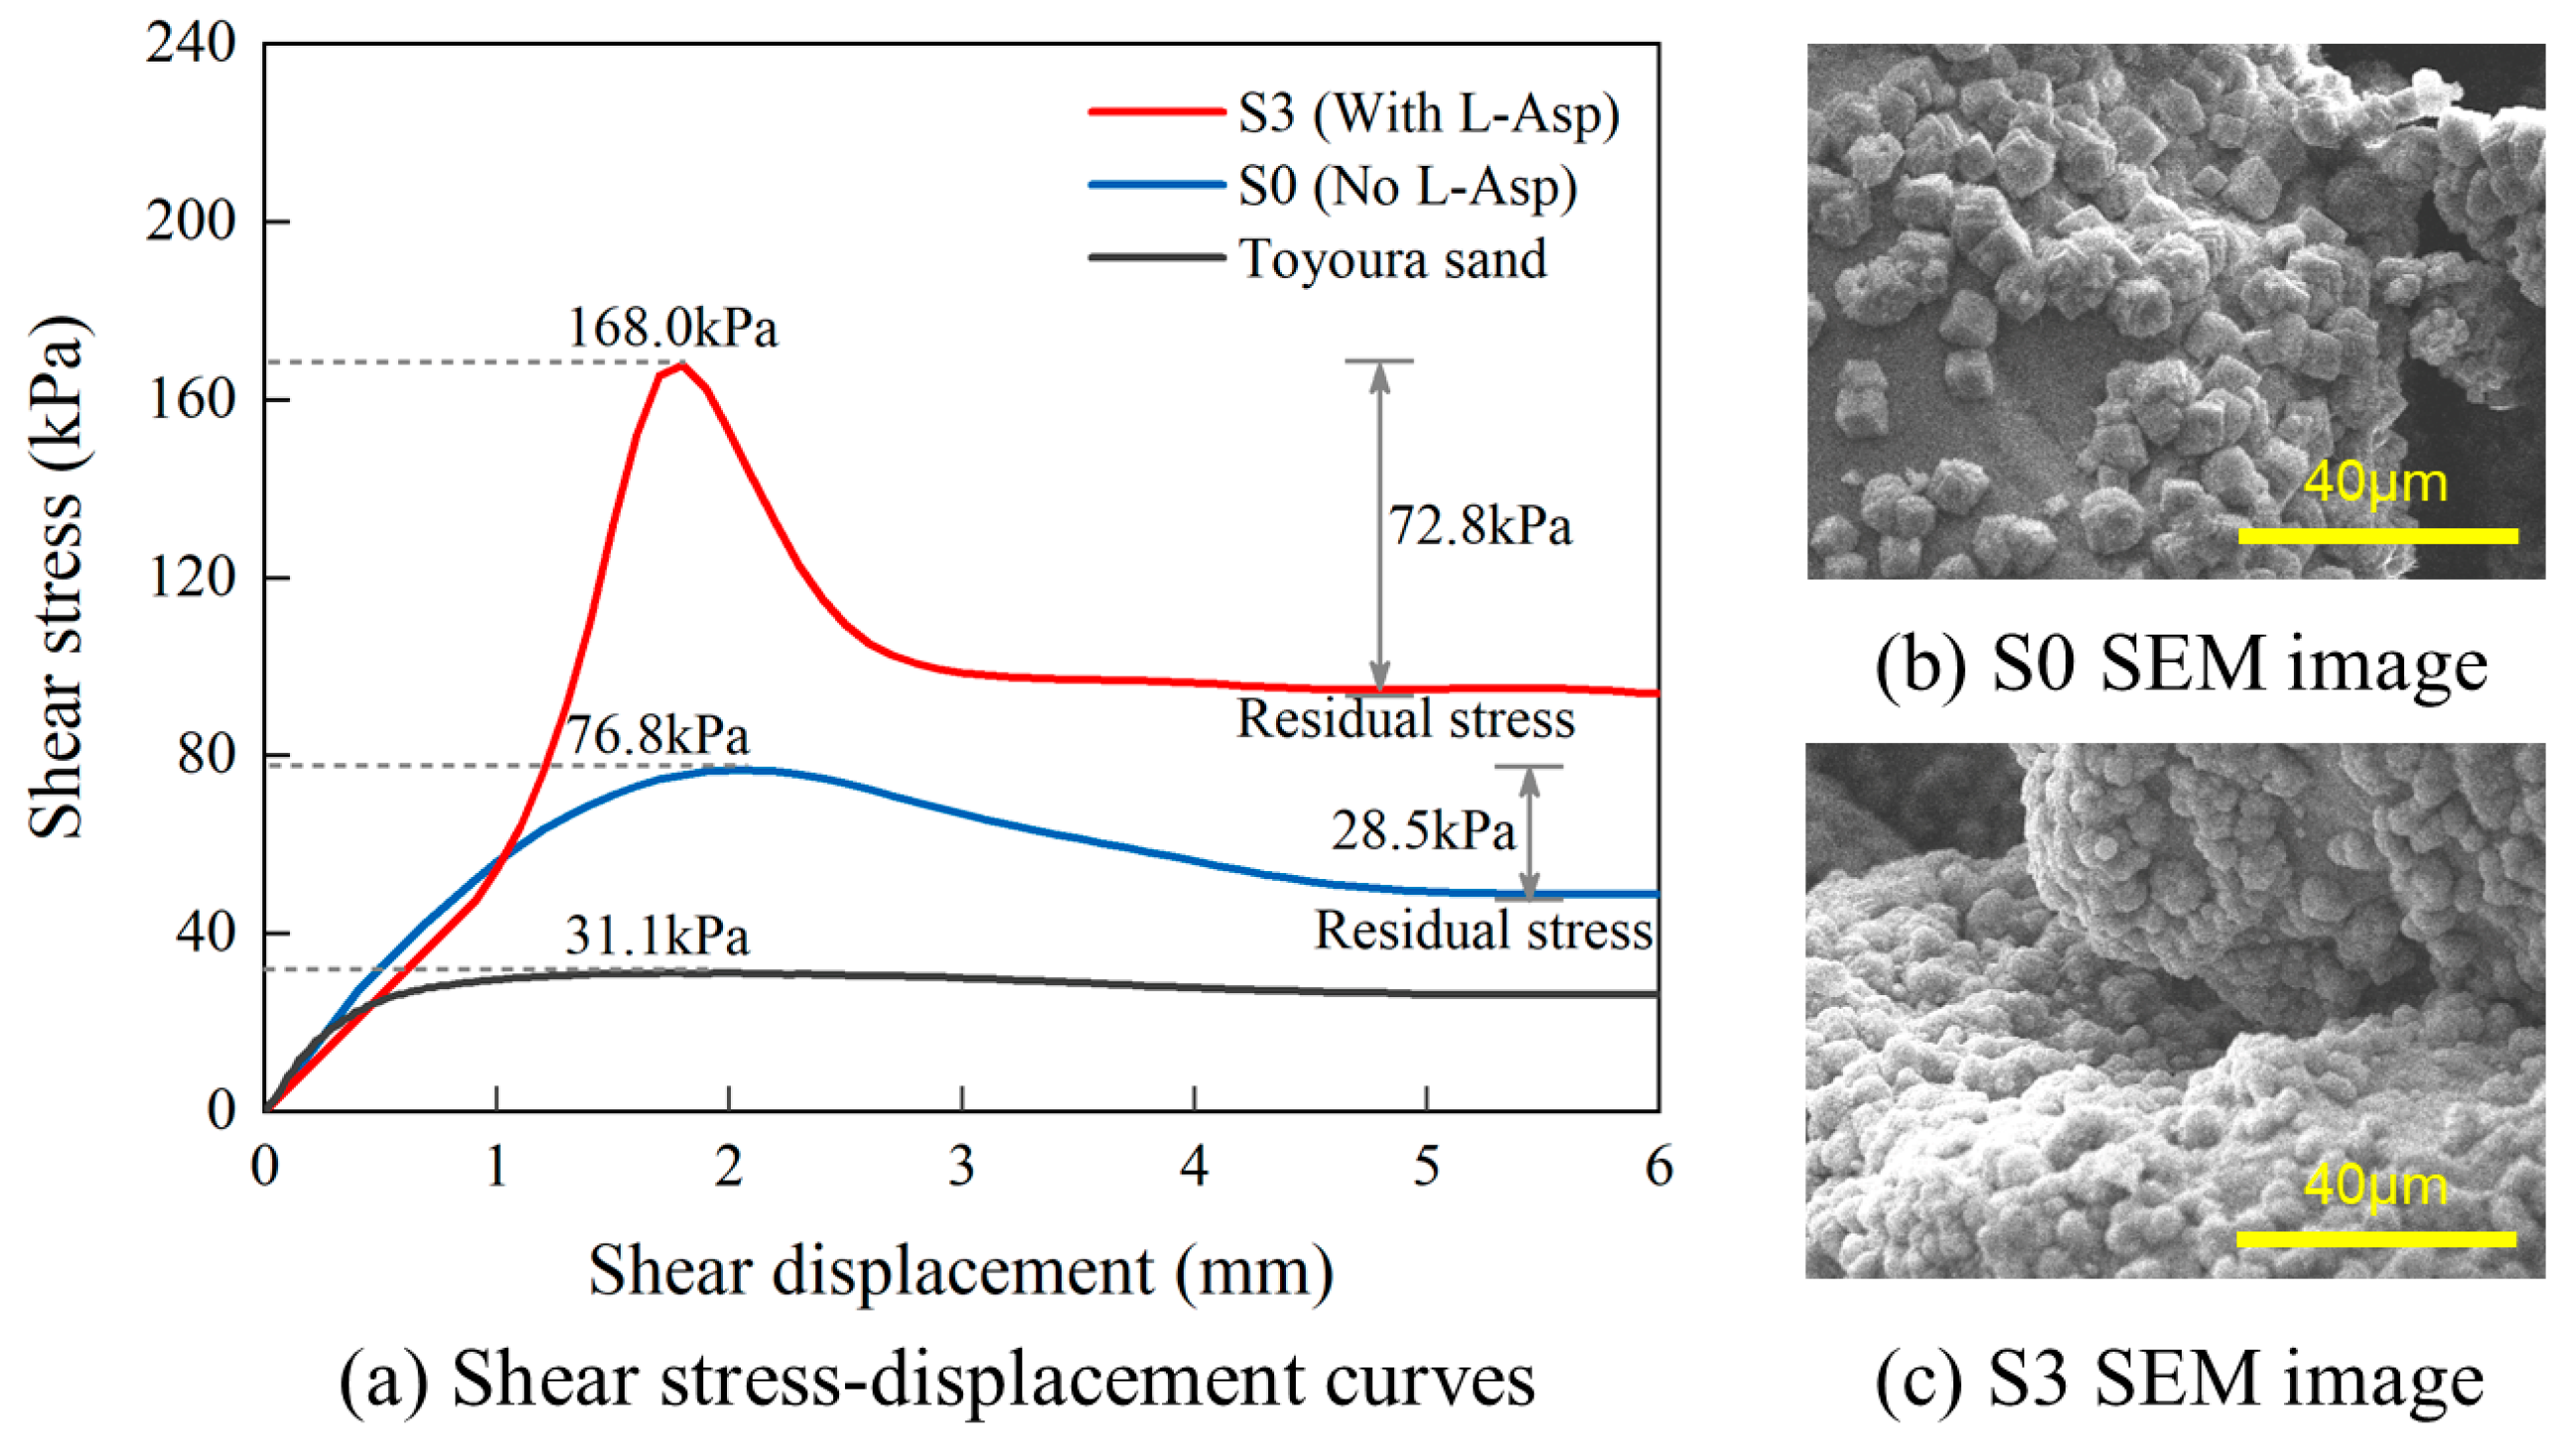
- CaCO3 precipitates and forms a coating on sand particles, which increases the friction between sand particles in the specimen.
- (2)
- As more CaCO3 precipitates, the calcium coating gets thicker, and that on two adjacent sand particles finally gets in contact with each other to form a calcium bonding. That means all sand particles in the specimen have been bonded together by CaCO3 to form a continuous skeleton.
- (3)
- The subsequent precipitation of CaCO3 starts to fill the pores in the skeleton to make the specimen denser.
2.2. Direct Shear Test
3. Results and Discussion
3.1. Effects of L-Asp Modifier
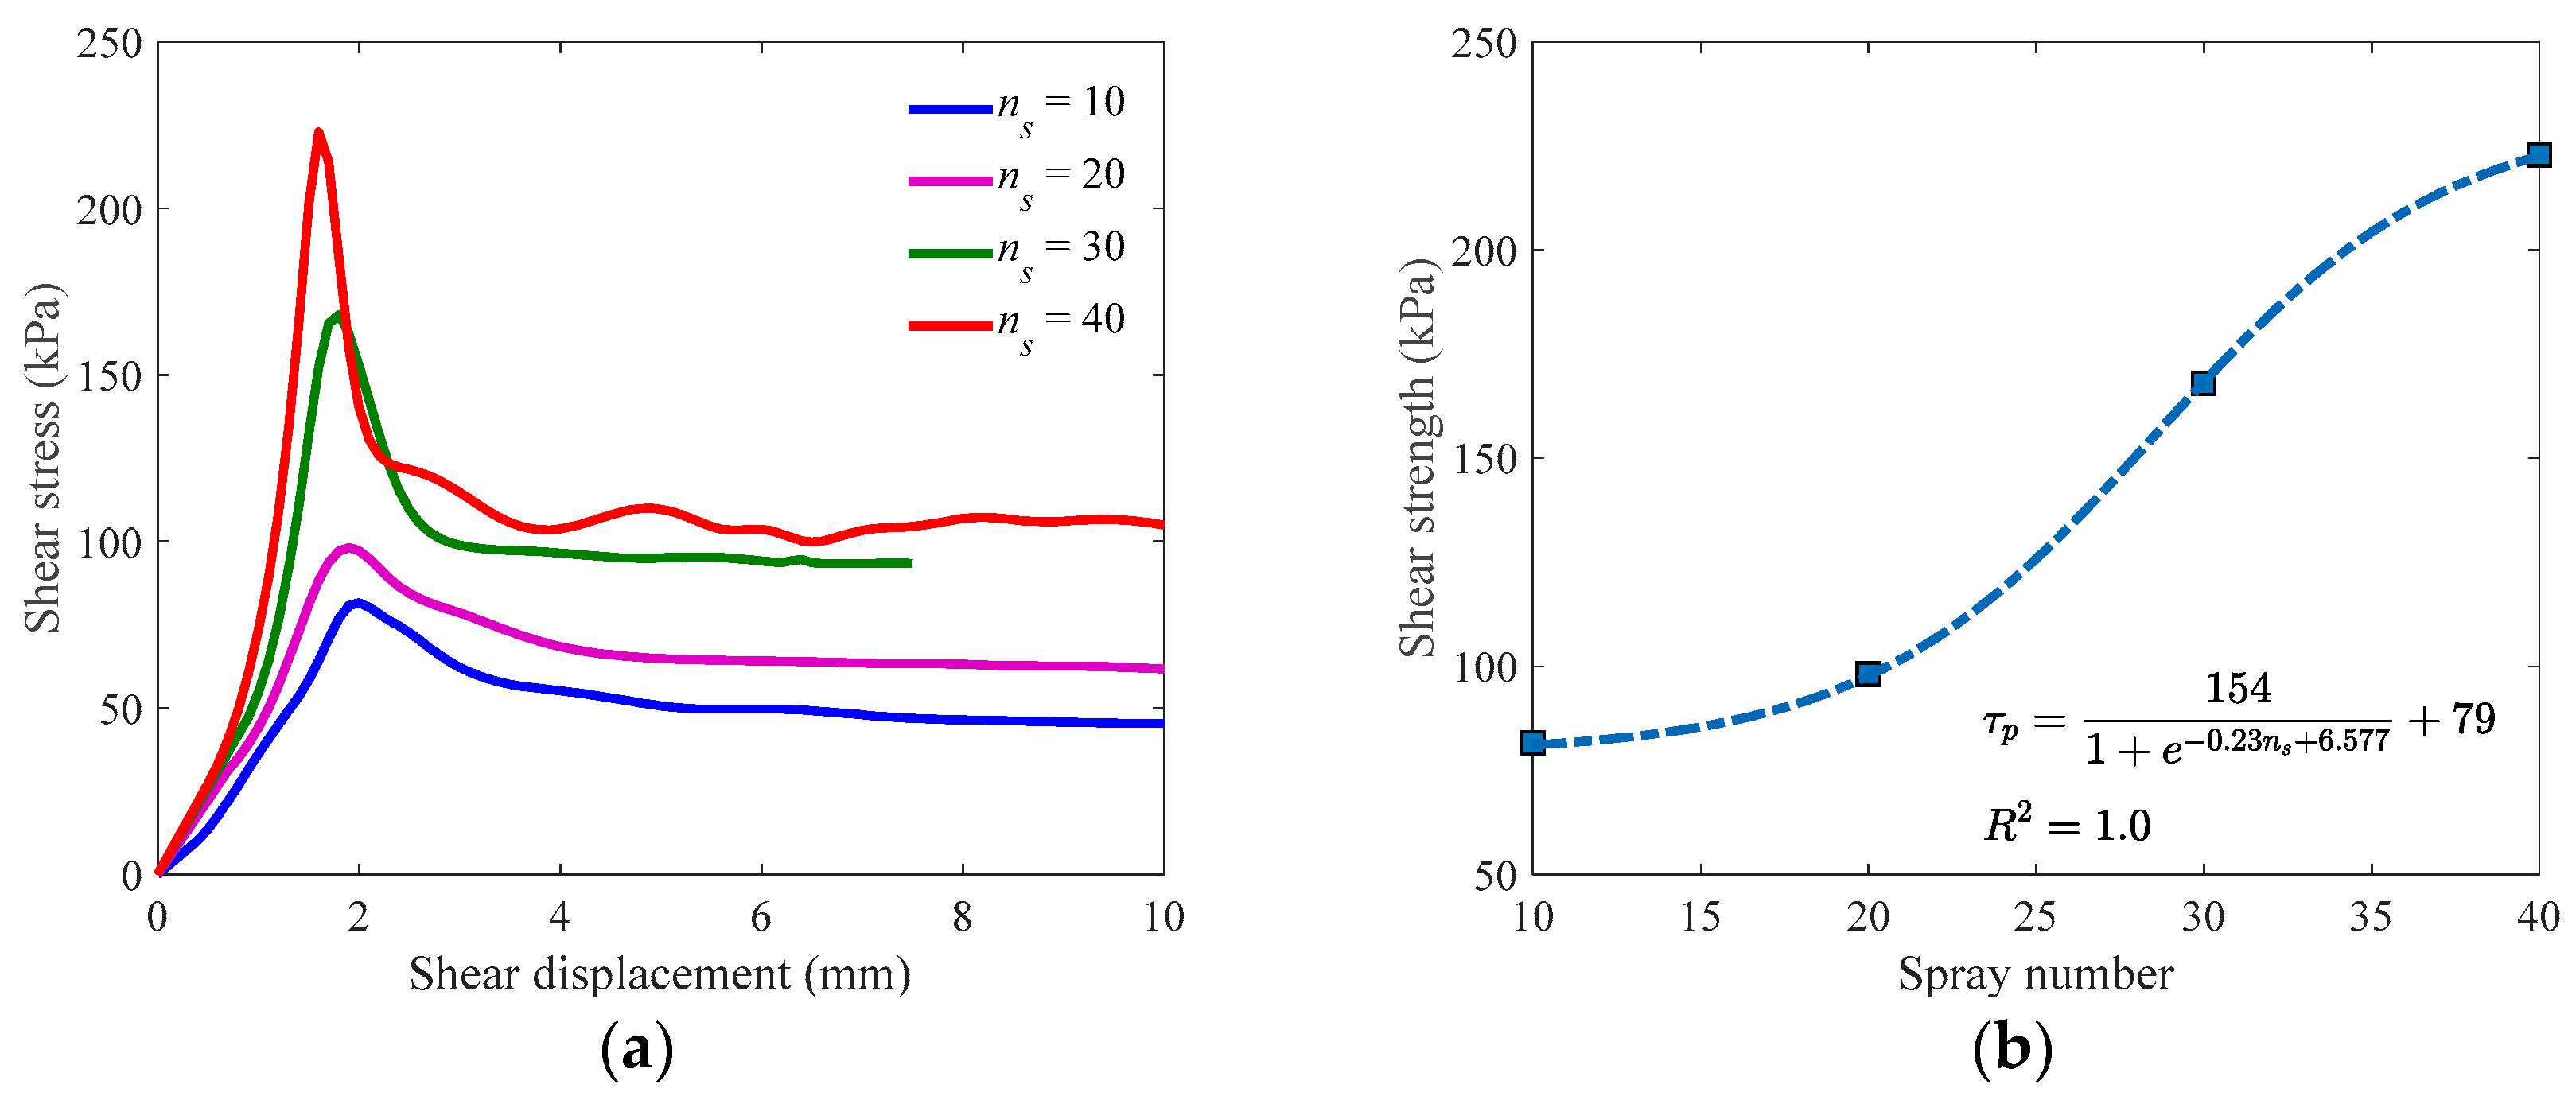
3.2. Effects of Spray Numbers
4. Simplified Model
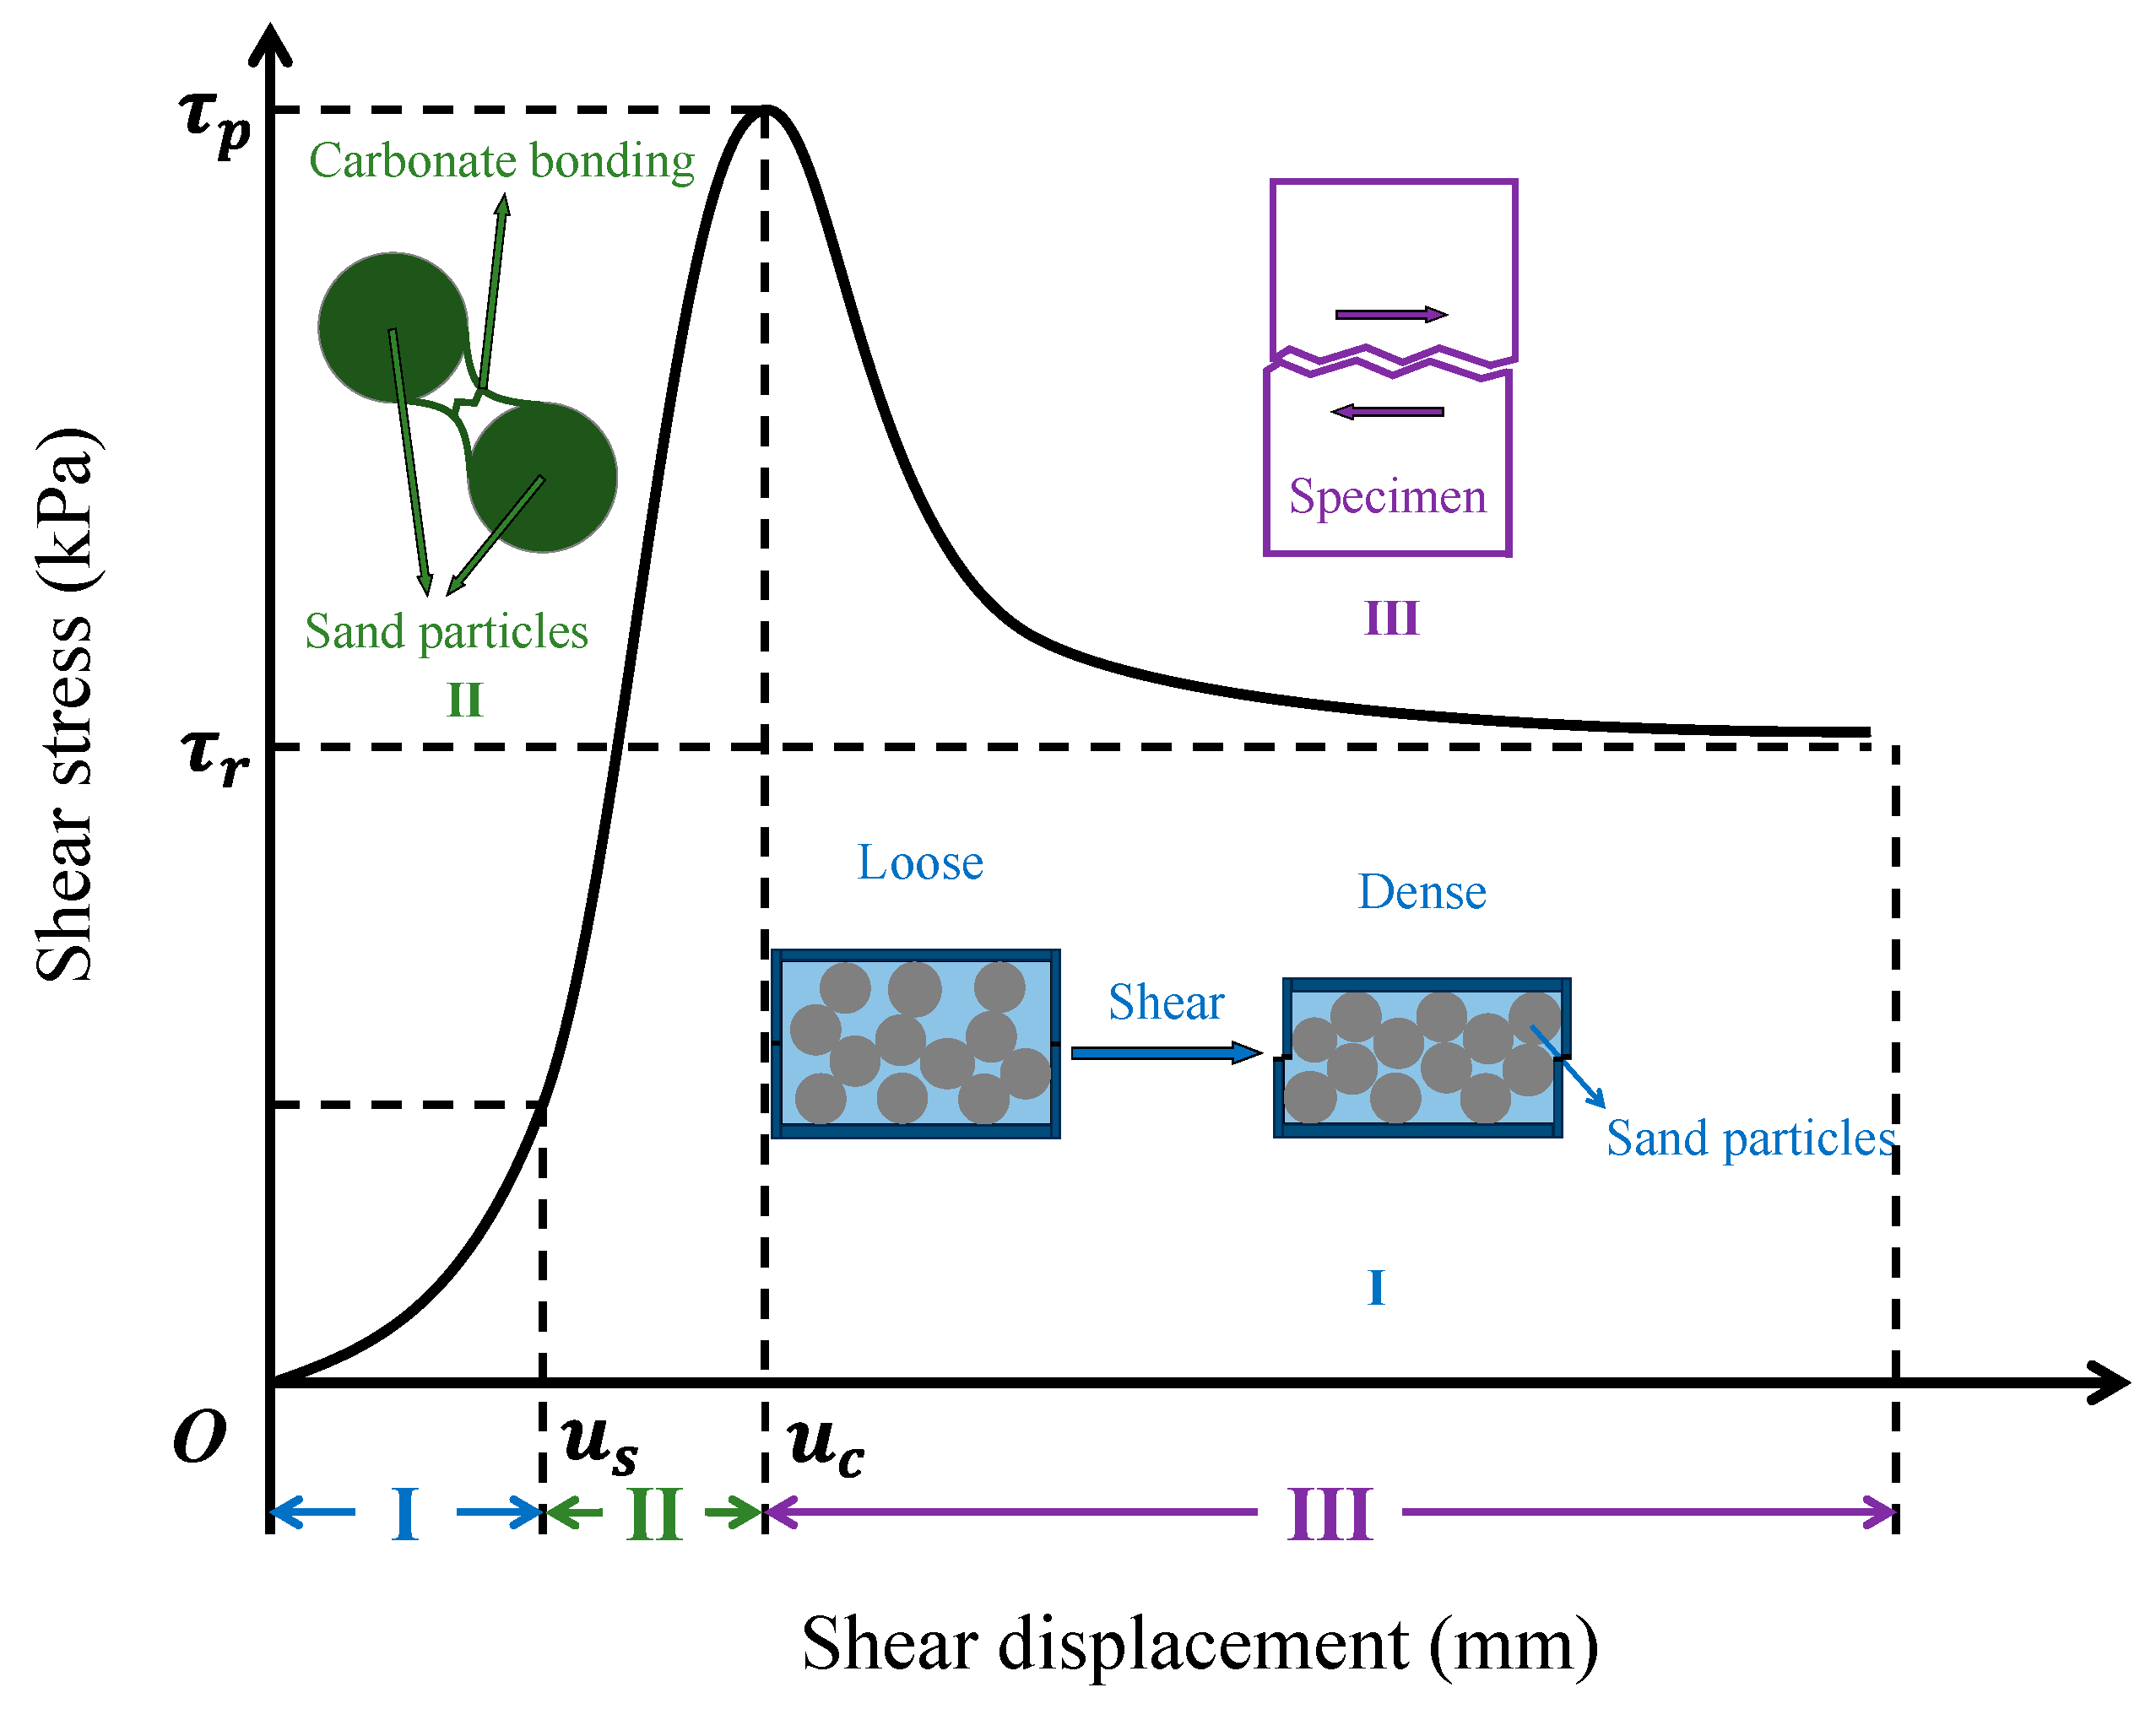
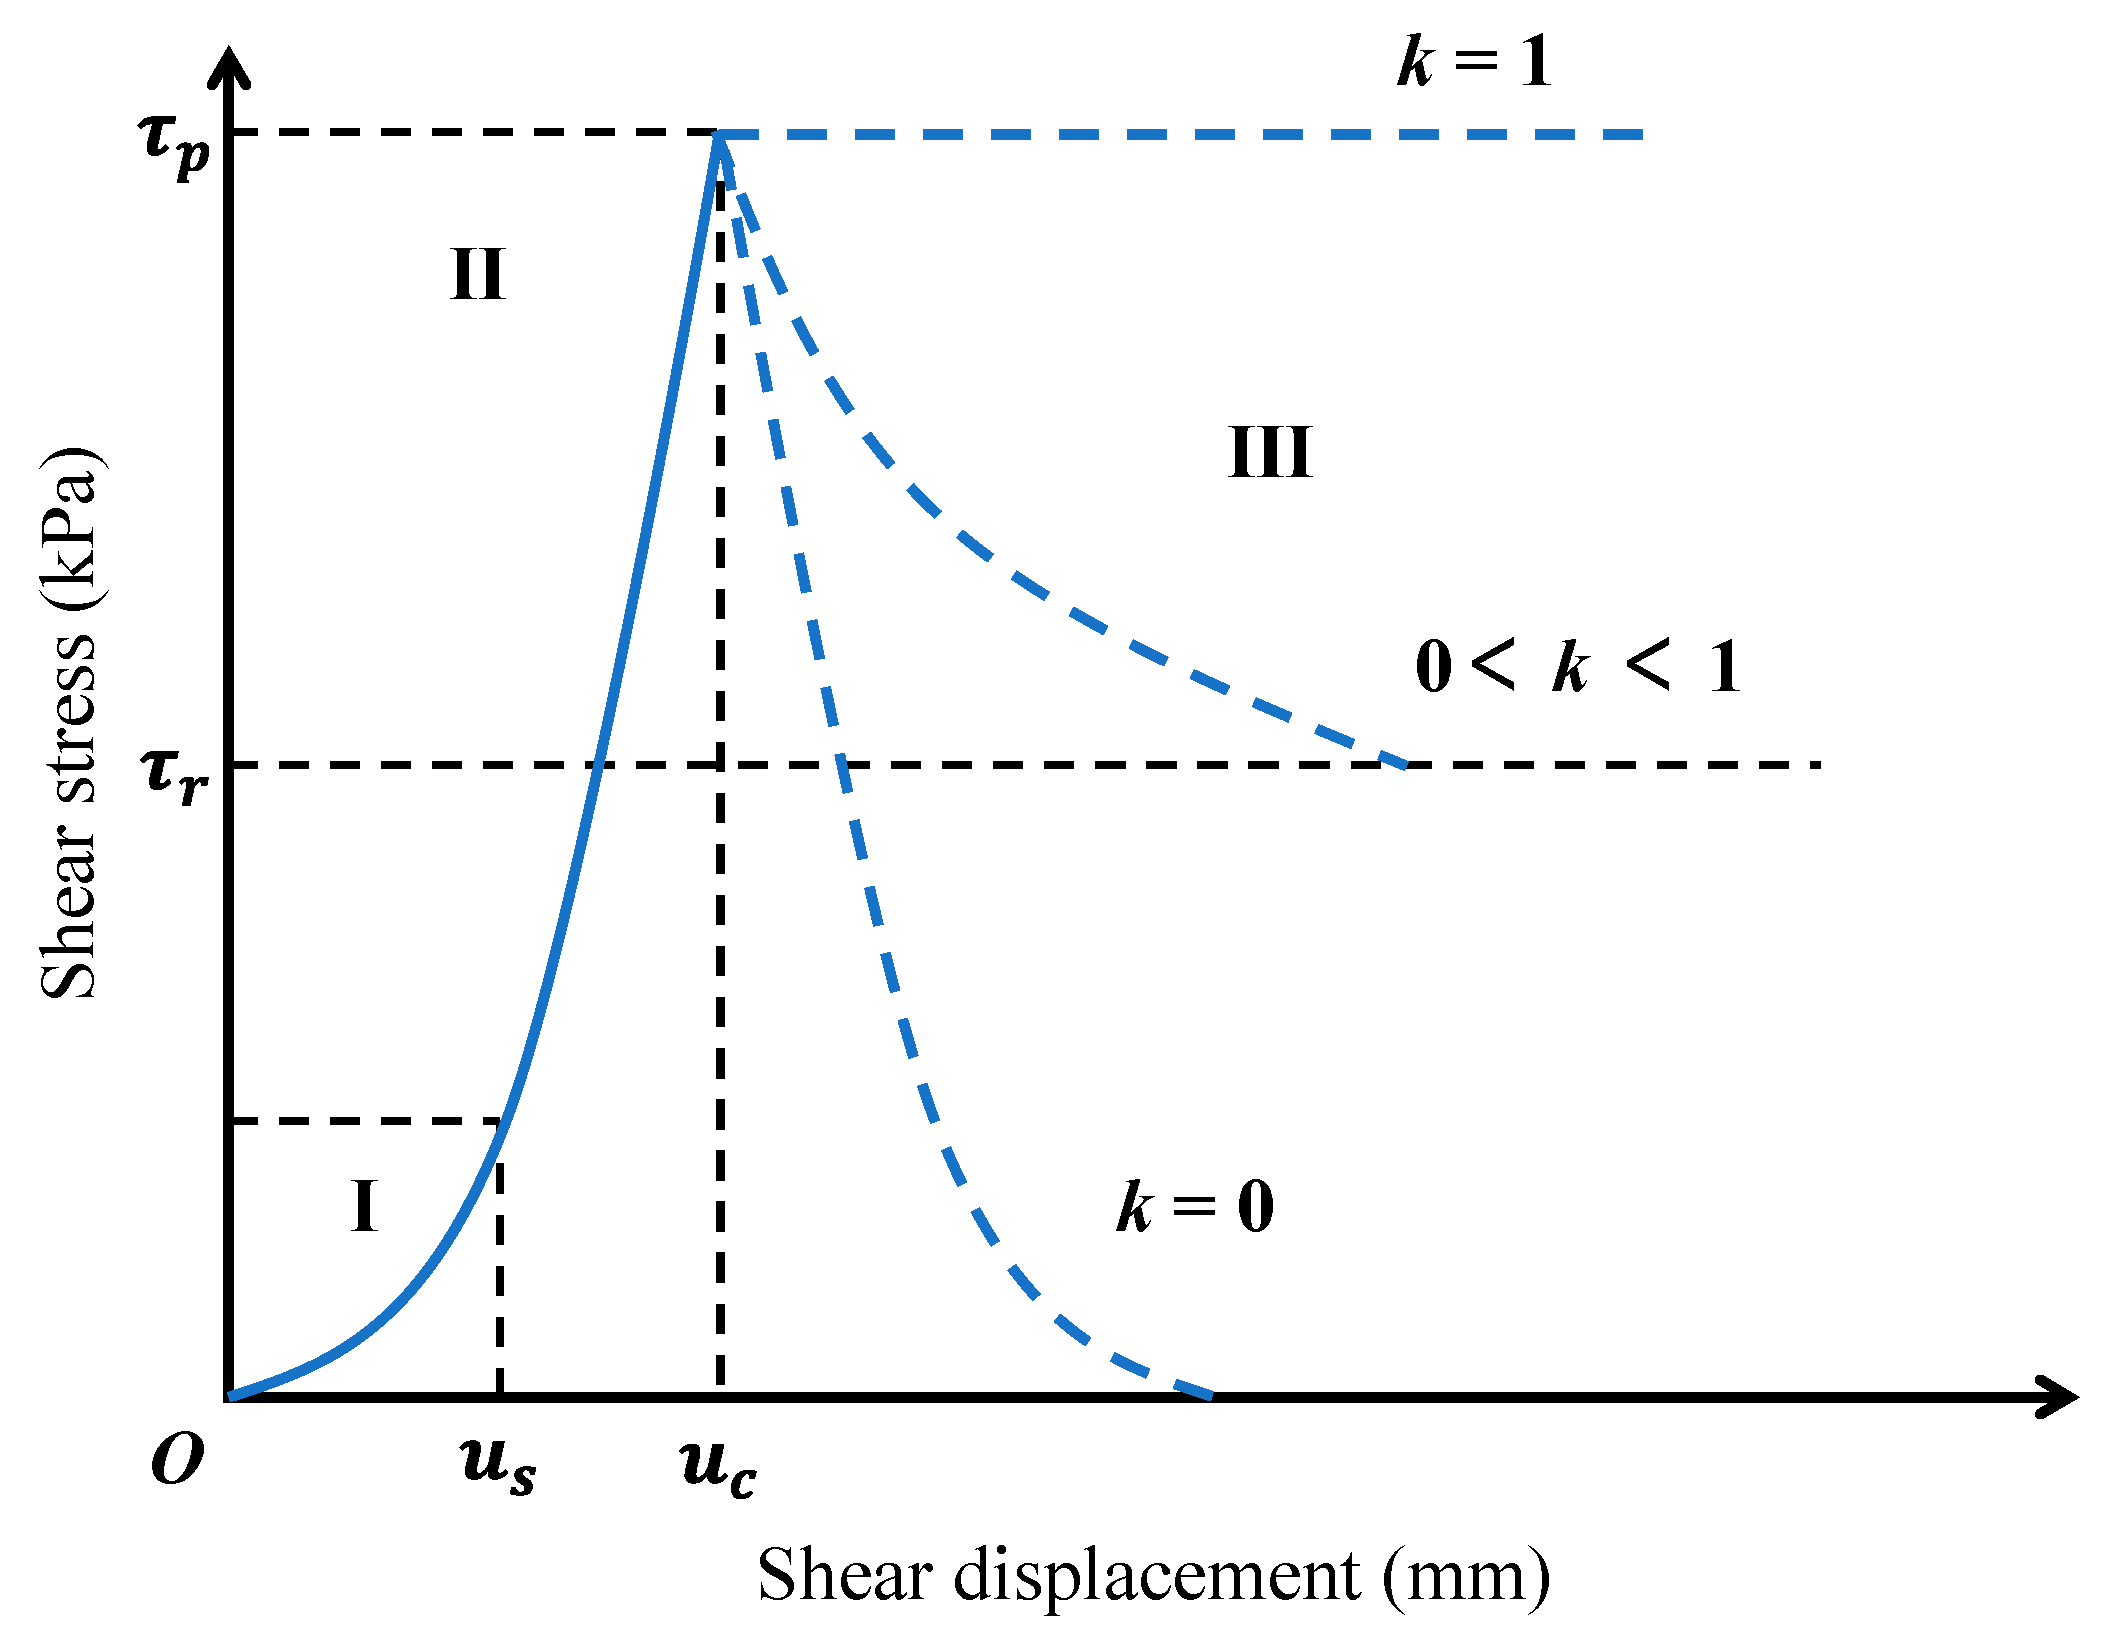
4.1. Mechanics and Model Mathematics
- (1)
- Stage I ()
- (2)
- Stage II ()
- (3)
- Stage III ()
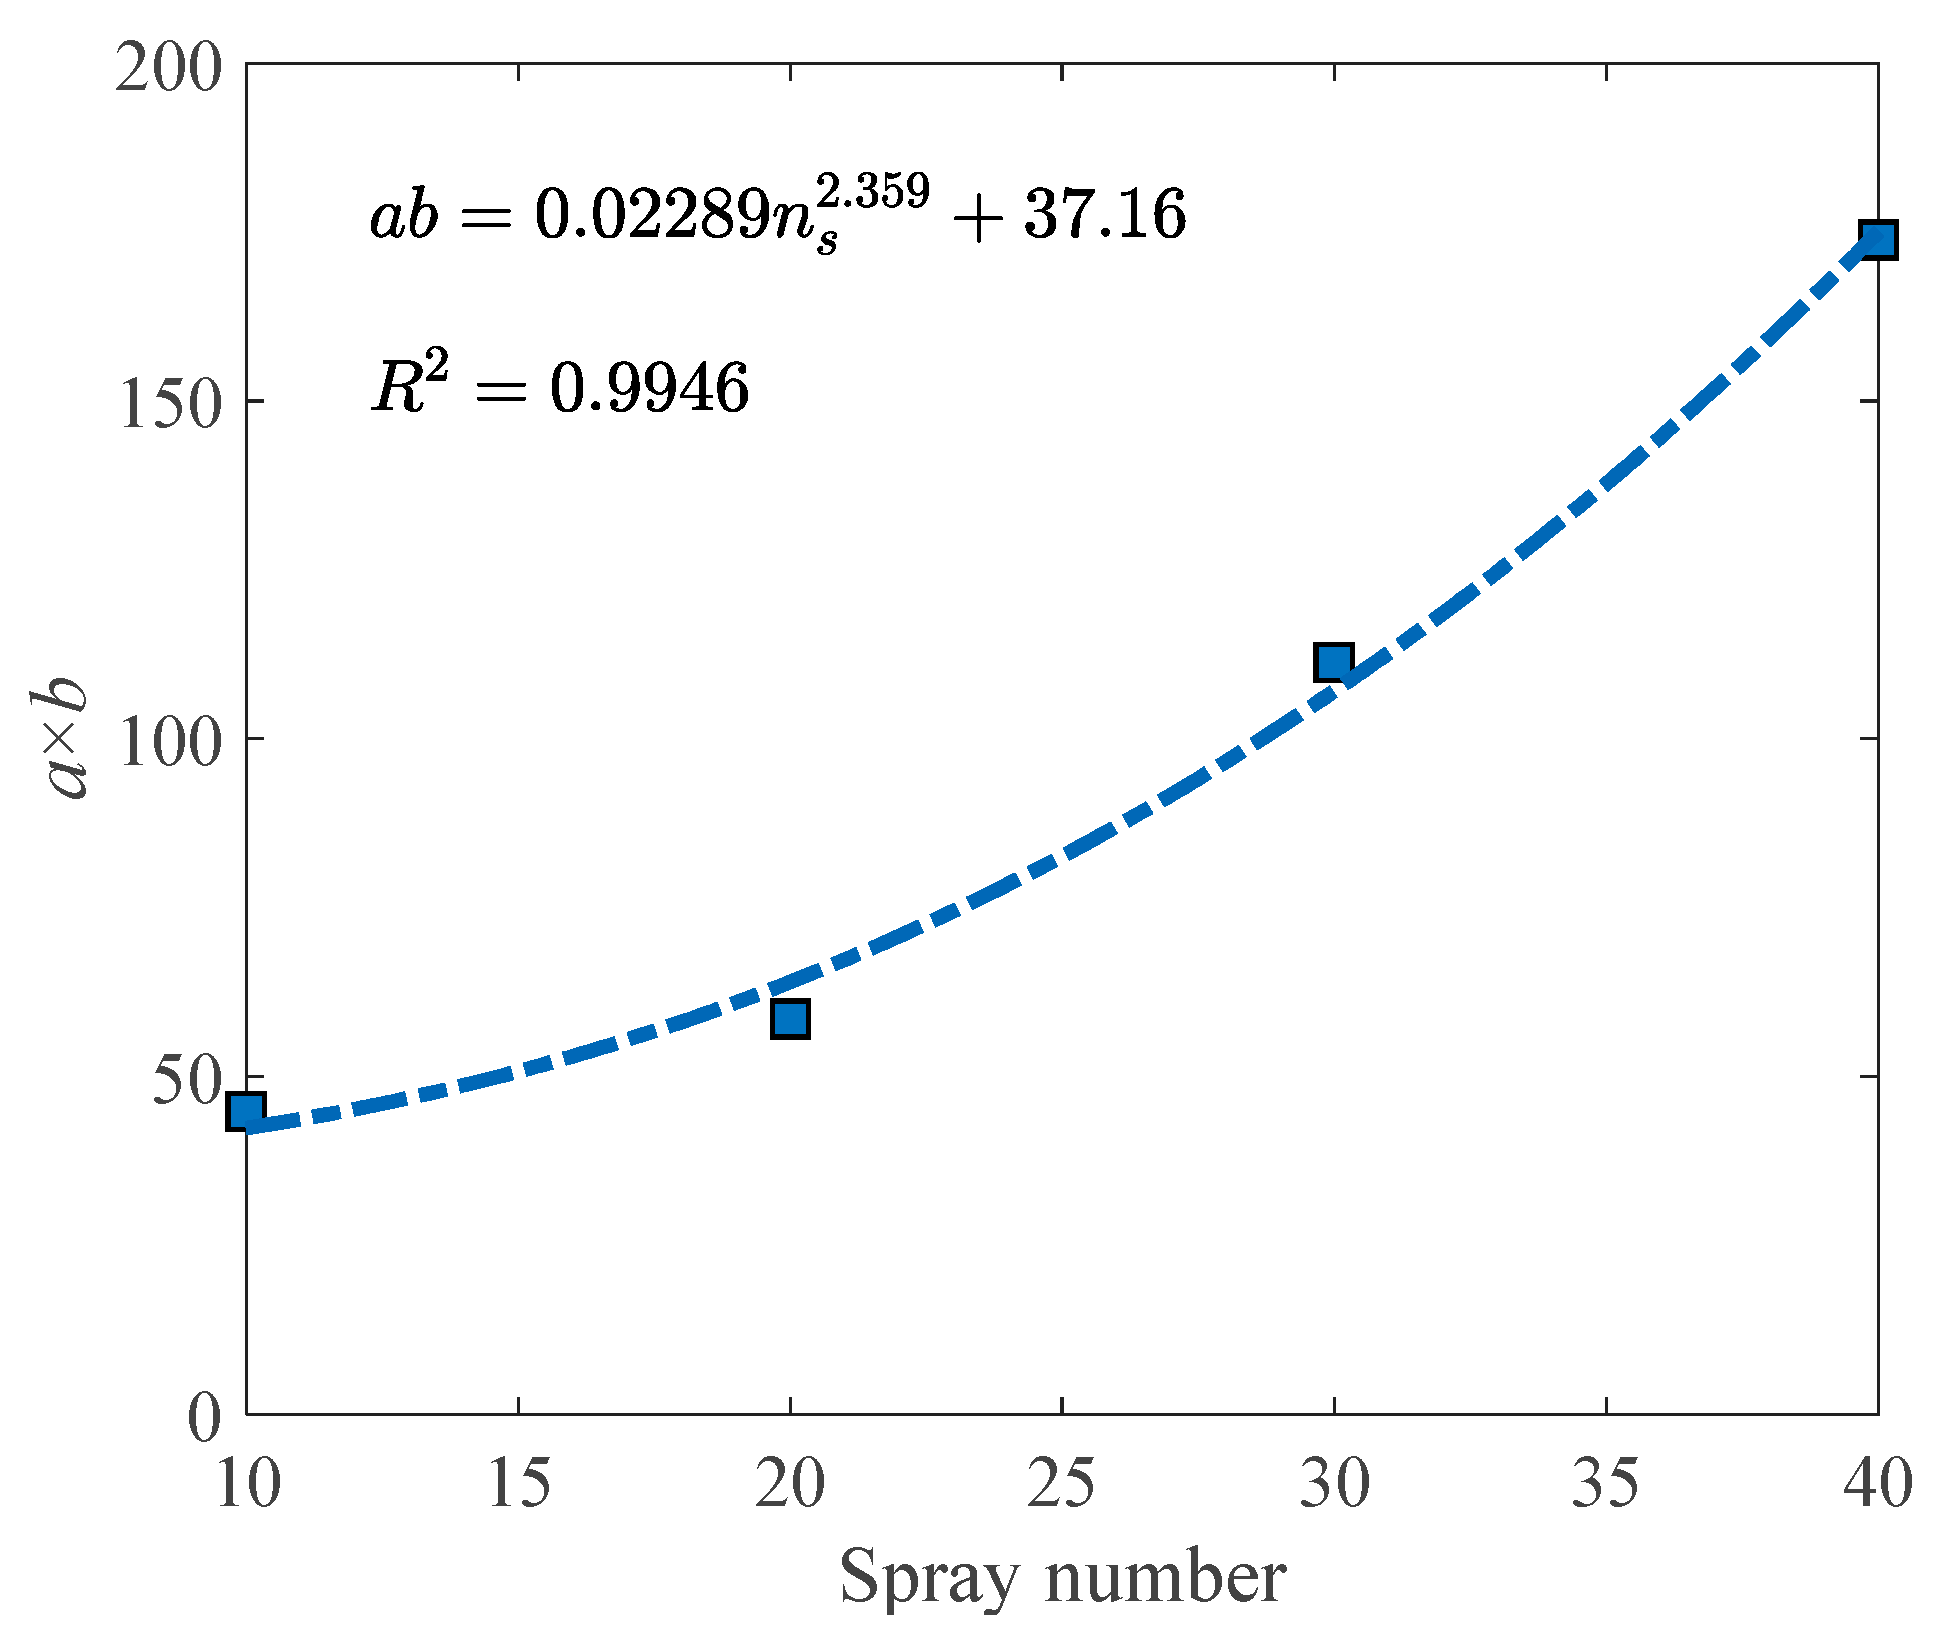
4.2. Calibration
4.3. Application
- (1)
- Calculate , , and with Equations (2), (3), and (4), respectively.
- (2)
- With the obtained value of and , there is Equation (8). Then, constants and can be solved from Equation (8) together with Equation (7).
- (3)
- Set as 0.5, and the model is worked out.
5. Conclusions
- (1)
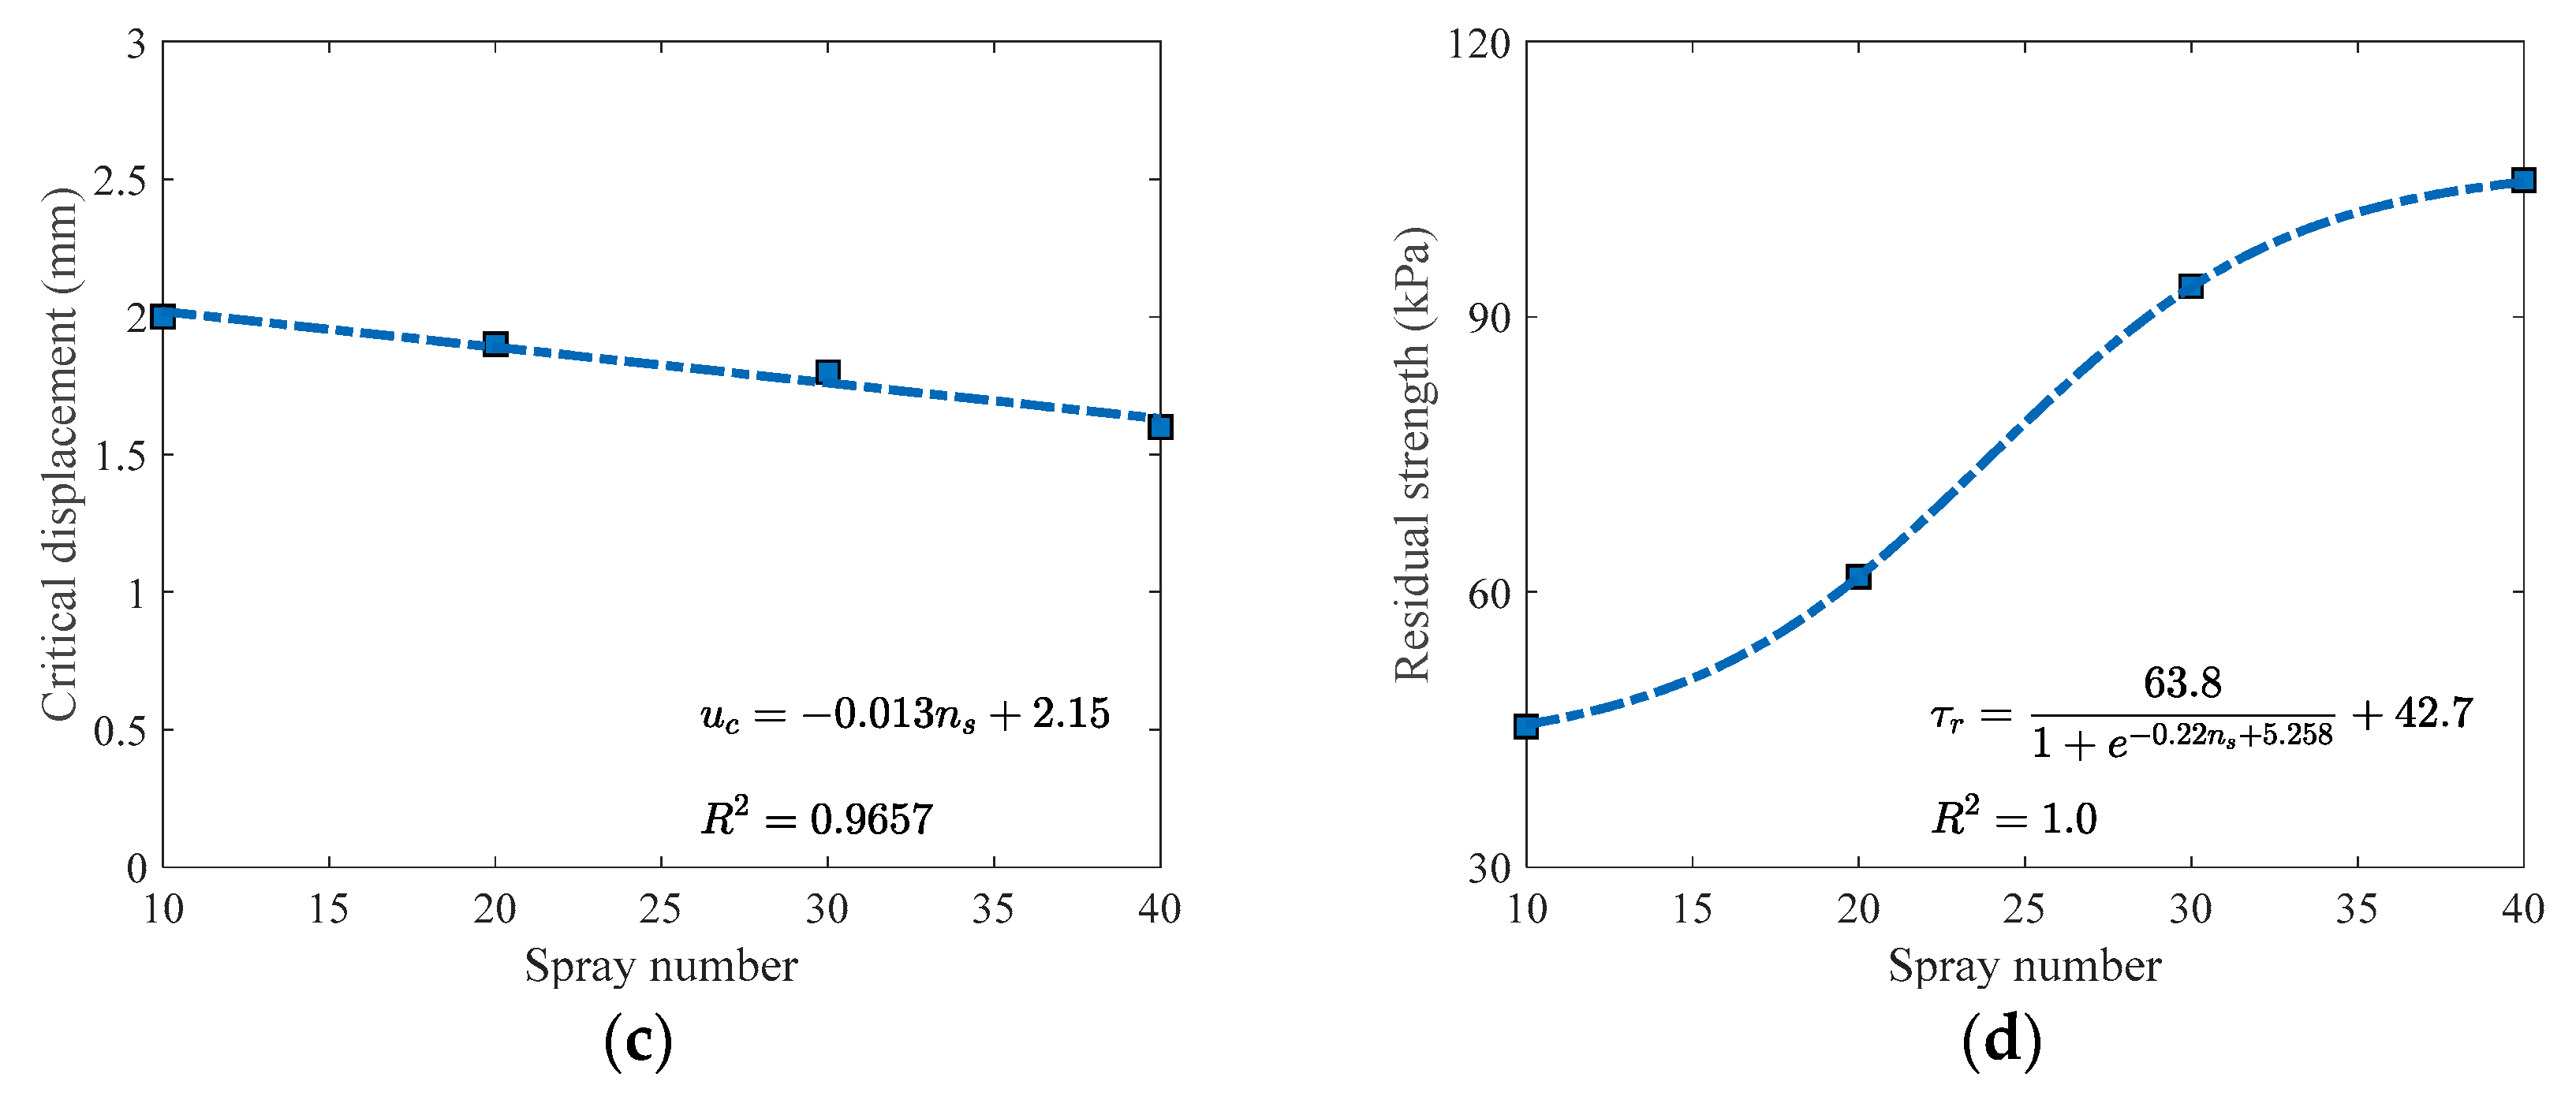
- BCP can significantly improve the shear strength of a sand specimen. As the number of spray cycles increases, the shear strength also increases, but the increasing rate at a moderate spray number is much higher than that at a lower or higher one. A similar variation was also observed for residual strength. The effects of spray number on shear strength and residual strength can both be described with sigmoid models, and a spray number of 30 is suggested for engineering applications.
- (2)
- A BCP spray would increase both the brittleness and modulus of the specimen. As the spray number increases, critical displacement decreases, and the variation is roughly linear. Meanwhile, spray number seems to have no obvious influence on the softening behavior of the BCP-treated mortar.
- (3)
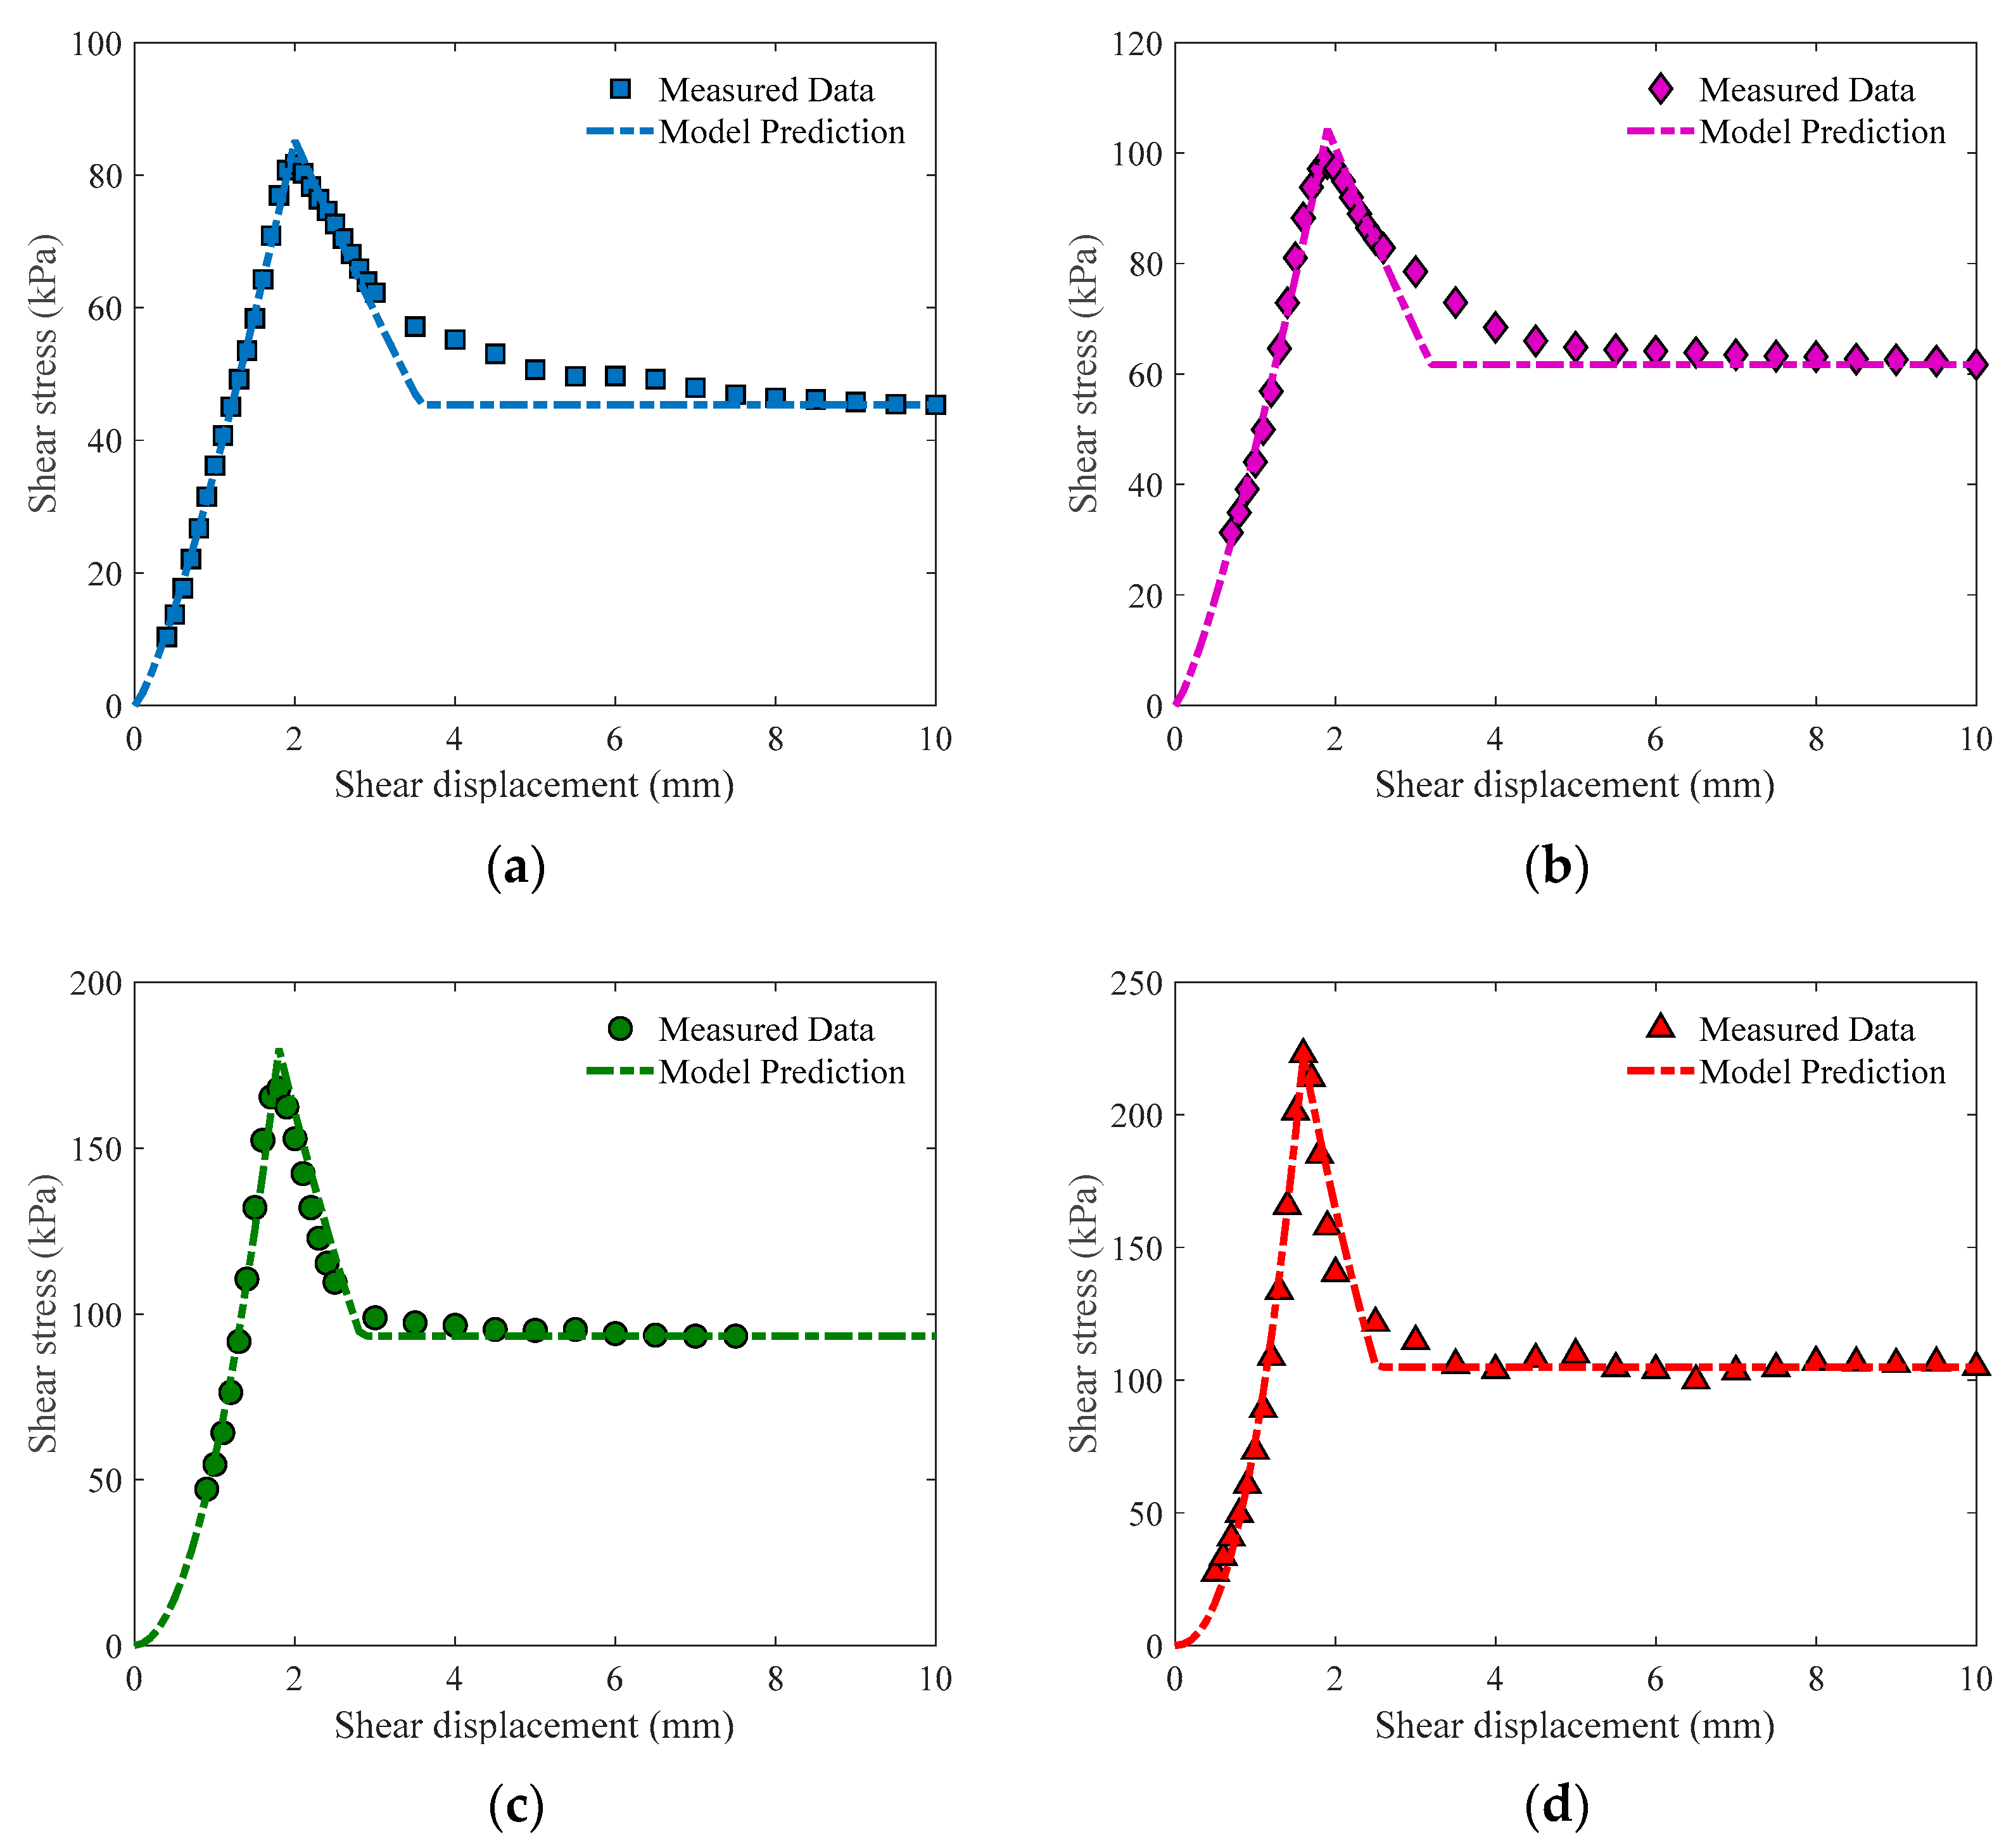
- The simplified power model is well fitted to the three stages of direct shear loading and can give accurate predictions in most cases, especially at higher spray numbers. For post-peak stress, the estimate of the model is generally conservative. The softening coefficient k in the model is suggested to be 0.5, which is enough for the model to perform well.
Author Contributions
Funding
Institutional Review Board Statement
Informed Consent Statement
Data Availability Statement
Conflicts of Interest
References
- Choi, S.-G.; Chang, I.; Lee, M.; Lee, J.-H.; Han, J.-T.; Kwon, T.-H. Review on geotechnical engineering properties of sands treated by microbially induced calcium carbonate precipitation (MICP) and biopolymers. Constr. Build. Mater. 2020, 246, 118415. [Google Scholar] [CrossRef]
- Chen, W.; Hong, J.; Xu, C. Pollutants generated by cement production in China, their impacts, and the potential for environmental improvement. J. Clean. Prod. 2015, 103, 61–69. [Google Scholar] [CrossRef]
- Xi, F.; Davis, S.J.; Ciais, P.; Crawford-Brown, D.; Guan, D.; Pade, C.; Shi, T.; Syddall, M.; Lv, J.; Ji, L.; et al. Substantial global carbon uptake by cement carbonation. Nat. Geosci. 2016, 9, 880–883. [Google Scholar] [CrossRef] [Green Version]
- Cantaert, B.; Kim, Y.Y.; Ludwig, H.; Nudelman, F.; Sommerdijk, N.A.; Meldrum, F.C. Think positive: Phase separation enables a positively charged additive to induce dramatic changes in calcium carbonate morphology. Adv. Funct. Mater. 2012, 22, 907–915. [Google Scholar] [CrossRef]
- Yao, H.B.; Ge, J.; Mao, L.B.; Yan, Y.X.; Yu, S.H. 25th anniversary article: Artificial carbonate nanocrystals and layered structural nanocomposites inspired by nacre: Synthesis, fabrication and applications. Adv. Mater. 2014, 26, 163–188. [Google Scholar] [CrossRef] [PubMed]
- Du, H.; Amstad, E. Water: How does it influence the CaCO3 formation? Angew. Chem. Int. Ed. 2020, 59, 1798–1816. [Google Scholar] [CrossRef]
- Maruyama, K.; Yoshino, T.; Kagi, H. Synthesizing a composite material of amorphous calcium carbonate and aspartic acid. Mater. Lett. 2011, 65, 179–181. [Google Scholar] [CrossRef]
- Kim, Y.-Y.; Carloni, J.D.; Demarchi, B.; Sparks, D.; Reid, D.G.; Kunitake, M.E.; Tang, C.C.; Duer, M.J.; Freeman, C.L.; Pokroy, B.; et al. Tuning hardness in calcite by incorporation of amino acids. Nat. Mater. 2016, 15, 903–910. [Google Scholar] [CrossRef] [Green Version]
- Kellock, C.; Castillo Alvarez, M.C.; Finch, A.; Penkman, K.; Kröger, R.; Clog, M.; Allison, N. Optimising a method for aragonite precipitation in simulated biogenic calcification media. PLoS ONE 2022, 17, e0278627. [Google Scholar] [CrossRef] [PubMed]
- Kellock, C.; Cole, C.; Penkman, K.; Evans, D.; Kröger, R.; Hintz, C.; Hintz, K.; Finch, A.; Allison, N. The role of aspartic acid in reducing coral calcification under ocean acidification conditions. Sci. Rep. 2020, 10, 12797. [Google Scholar] [CrossRef]
- Ho, K.I.; Jin-Ho, K. CaCO3 crystallization in the presence of aspartic acid (Asp). J. Biosci. Bioeng. 2009, 108, S27. [Google Scholar]
- Luo, J.; Kong, F.; Ma, X. Role of aspartic acid in the synthesis of spherical vaterite by the Ca(OH)2–CO2 reaction. Cryst. Growth Des. 2016, 16, 728–736. [Google Scholar] [CrossRef]
- Teng, H.H.; Dove, P.M.; Orme, C.A.; De Yoreo, J.J. Thermodynamics of calcite growth: Baseline for understanding biomineral formation. Science 1998, 282, 724–727. [Google Scholar] [CrossRef] [PubMed]
- Malkaj, P.; Dalas, E. Calcium carbonate crystallization in the presence of aspartic acid. Cryst. Growth Des. 2004, 4, 721–723. [Google Scholar] [CrossRef]
- Gong, Y.; Zhu, X.; Yang, Z.; Zhang, X.; Li, C. Indirect aqueous carbonation of CaSO 4· 2H 2 O with aspartic acid as a recyclable additive. RSC Adv. 2022, 12, 26556–26564. [Google Scholar] [CrossRef] [PubMed]
- Saharay, M.; Kirkpatrick, R.J. Ab initio and metadynamics studies on the role of essential functional groups in biomineralization of calcium carbonate and environmental situations. Phys. Chem. Chem. Phys. 2014, 16, 26843–26854. [Google Scholar] [CrossRef]
- Nada, H. Difference in the conformation and dynamics of aspartic acid on the flat regions, step edges, and kinks of a calcite surface: A molecular dynamics study. J. Phys. Chem. C 2014, 118, 14335–14345. [Google Scholar] [CrossRef]
- Štajner, L.; Kontrec, J.; Džakula, B.N.; Maltar-Strmečki, N.; Plodinec, M.; Lyons, D.M.; Kralj, D. The effect of different amino acids on spontaneous precipitation of calcium carbonate polymorphs. J. Cryst. Growth 2018, 486, 71–81. [Google Scholar] [CrossRef] [Green Version]
- Hood, M.A.; Landfester, K.; Munoz-Espi, R. The role of residue acidity on the stabilization of vaterite by amino acids and oligopeptides. Cryst. Growth Des. 2014, 14, 1077–1085. [Google Scholar] [CrossRef]
- Nada, H. Importance of water in the control of calcite crystal growth by organic molecules. Polym. J. 2015, 47, 84–88. [Google Scholar] [CrossRef]
- Wan, P.; Tong, H.; Zhu, Z.; Shen, X.; Yan, J.; Hu, J. A novel approach to study the dynamic process of calcium carbonate crystal growth by microcalorimetric method. Mater. Sci. Eng. A 2007, 458, 244–248. [Google Scholar] [CrossRef]
- Xie, A.-J.; Shen, Y.-H.; Zhang, C.-Y.; Yuan, Z.-W.; Zhu, X.-M.; Yang, Y.-M. Crystal growth of calcium carbonate with various morphologies in different amino acid systems. J. Cryst. Growth 2005, 285, 436–443. [Google Scholar] [CrossRef]
- Ben Shir, I.; Kababya, S.; Zax, D.B.; Schmidt, A. Resilient intracrystalline occlusions: A solid-state NMR view of local structure as it tunes bulk lattice properties. J. Am. Chem. Soc. 2020, 142, 13743–13755. [Google Scholar] [CrossRef] [PubMed]
- Tong, H.; Ma, W.; Wang, L.; Wan, P.; Hu, J.; Cao, L. Control over the crystal phase, shape, size and aggregation of calcium carbonate via a L-aspartic acid inducing process. Biomaterials 2004, 25, 3923–3929. [Google Scholar] [CrossRef] [PubMed]
- Ramnarain, V.; Georges, T.; Ortiz Peña, N.; Ihiawakrim, D.; Longuinho, M.; Bulou, H.; Gervais, C.; Sanchez, C.; Azaïs, T.; Ersen, O. Monitoring of CaCO3 Nanoscale Structuration through Real-Time Liquid Phase Transmission Electron Microscopy and Hyperpolarized NMR. J. Am. Chem. Soc. 2022, 144, 15236–15251. [Google Scholar] [CrossRef]
- Yoshino, T.; Kagi, H. Effects of L-Aspartic acid on the step retreat kinetics of calcite. J. Cryst. Growth 2012, 338, 244–250. [Google Scholar] [CrossRef]
- Yoshino, T.; Kagi, H.; Kamiya, N.; Kokawa, R. Relation between etch-pit morphology and step retreat velocity on a calcite surface in aspartic acid solution. J. Cryst. Growth 2010, 312, 1590–1598. [Google Scholar] [CrossRef]
- Longuinho, M.M.; Ramnarain, V.; Peña, N.O.; Ihiawakrim, D.; Soria-Martínez, R.; Farina, M.; Ersen, O.; Rossi, A.L. The influence of L-aspartic acid on calcium carbonate nucleation and growth revealed by in situ liquid phase TEM. CrystEngComm 2022, 24, 2602–2614. [Google Scholar] [CrossRef]
- Shen, Y.; Xie, A.; Chen, Z.; Xu, W.; Yao, H.; Li, S.; Huang, L.; Wu, Z.; Kong, X. Controlled synthesis of calcium carbonate nanocrystals with multi-morphologies in different bicontinuous microemulsions. Mater. Sci. Eng. A 2007, 443, 95–100. [Google Scholar] [CrossRef]
- Hazen, R.M.; Filley, T.R.; Goodfriend, G.A. Selective adsorption of L- and D-amino acids on calcite: Implications for biochemical homochirality. Proc. Natl. Acad. Sci. USA 2001, 98, 5487–5490. [Google Scholar] [CrossRef]
- Guo, Z.; Wang, J.; Qin, F.; Shen, W. Facile synthesis of chiral (right-handed) calcium carbonate with exceptional enantioseparation performance of dibenzoyltartaric acid. J. Colloid Interface Sci. 2019, 543, 130–137. [Google Scholar] [CrossRef] [PubMed]
- Jiang, W.; Pacella, M.S.; Athanasiadou, D.; Nelea, V.; Vali, H.; Hazen, R.M.; Gray, J.J.; McKee, M.D. Chiral acidic amino acids induce chiral hierarchical structure in calcium carbonate. Nat. Commun. 2017, 8, 15066. [Google Scholar] [CrossRef] [PubMed]
- Diao, Y.; Bai, J.; Huang, J.; Li, P.; Yang, C. Strength characteristics of biomimetic carbonate precipitation (BCP) treated mortar under cyclic loading. J. Build. Eng. 2023, 75, 107013. [Google Scholar] [CrossRef]
- Diao, Y.; Bai, J.; Huang, J.; Yang, C. A High-Performance Model for Direct Shear Behavior of Biomimetic Carbonate Precipitation Treated Mortar. Mater. Lett. 2023, 349, 134739. [Google Scholar] [CrossRef]
- Bai, J.; Diao, Y.; Jia, C.; Liu, C.; Zhang, M.; Wang, C. A review of advances in triaxial tests: Instruments, test techniques and prospects. KSCE J. Civ. Eng. 2022, 26, 3325–3341. [Google Scholar] [CrossRef]
- Bai, J.; Zhang, S.; Liang, J.; Zhao, Y.; Li, W.; Diao, Y.; Shang, D. A systematic design method for green buildings based on the combined system of flexible solar cells and reactors on buildings. Build. Environ. 2022, 209, 108657. [Google Scholar] [CrossRef]
- Xu, J.; Chang, F.; Bai, J.; Liu, C. Statistical analysis on the fracture behavior of rubberized steel fiber reinforced recycled aggregate concrete based on acoustic emission. J. Mater. Res. Technol. 2023, 24, 8997–9014. [Google Scholar] [CrossRef]
- Diao, Y.; Yang, C.; Huang, J.; Liu, S.; Guo, X.; Pan, W. Preparation and solidification mechanism of biomimetic mineralized cement using L-Asp as crystal modifier. J. Mater. Res. Technol. 2023, 24, 7756–7770. [Google Scholar] [CrossRef]
- Elfwing, S.; Uchibe, E.; Doya, K. Sigmoid-weighted linear units for neural network function approximation in reinforcement learning. Neural Netw. 2018, 107, 3–11. [Google Scholar] [CrossRef]
- Liu, W.; Wang, Z.; Yuan, Y.; Zeng, N.; Hone, K.; Liu, X. A novel sigmoid-function-based adaptive weighted particle swarm optimizer. IEEE Trans. Cybern. 2019, 51, 1085–1093. [Google Scholar] [CrossRef]
- Anastasopoulos, I.; Gazetas, G.; Bransby, M.; Davies, M.; El Nahas, A. Fault rupture propagation through sand: Finite-element analysis and validation through centrifuge experiments. J. Geotech. Geoenvironment. Eng. 2007, 133, 943–958. [Google Scholar] [CrossRef]
- Huang, D.; Cen, D.; Song, Y. Comparative investigation on the compression–shear and tension–shear behaviour of sandstone at different shearing rates. Rock Mech. Rock Eng. 2020, 53, 3111–3131. [Google Scholar] [CrossRef]
- Lian, S.; Li, J.; Gan, F.; Bi, J.; Wang, C.; Zheng, K. Investigation of the Shear Mechanical Behavior of Sandstone with Unloading Normal Stress after Freezing–Thawing Cycles. Machines 2021, 9, 339. [Google Scholar] [CrossRef]
- Roscoe, K.H.; Schofield, A.; Wroth, A.P. On the yielding of soils. Geotechnique 1958, 8, 22–53. [Google Scholar] [CrossRef]
- Behzadipour, H.; Sadrekarimi, A. Biochar-assisted bio-cementation of a sand using native bacteria. Bull. Eng. Geol. Environ. 2021, 80, 4967–4984. [Google Scholar] [CrossRef]
- Wang, Y.-J.; Jiang, N.-J.; Han, X.-L.; Doygun, O.; Du, Y.-J. Shear behavior of bio-cemented calcareous sand treated through bio-stimulation under the direct shear condition. Bull. Eng. Geol. Environ. 2022, 81, 413. [Google Scholar] [CrossRef]
- Wang, Y.-J.; Jiang, N.-J.; Han, X.-L.; Du, Y.-J. Shear behavior of biochar-amended biocemented calcareous sand treated by biostimulation. Int. J. Geomech. 2023, 23, 04022260. [Google Scholar] [CrossRef]


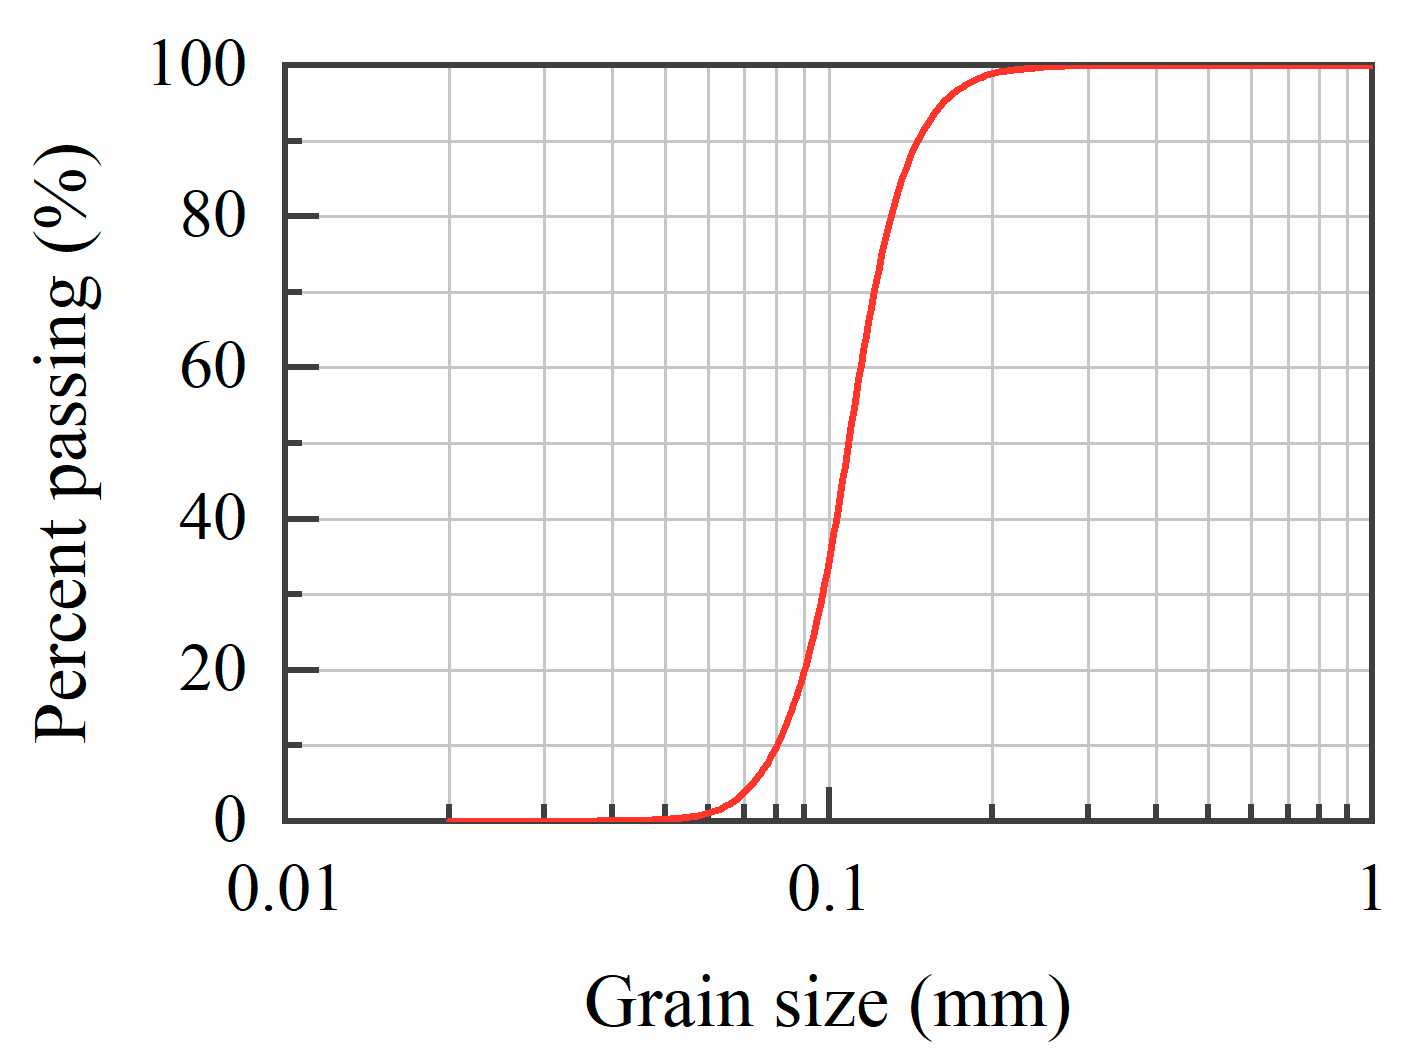
| Apparent Density (g/cm3) | Packing Density (g/cm3) | Maximum Dry Density (g/cm3) | Minimum Dry Density (g/cm3) | Friction Angle (°) | D50 (mm) |
|---|---|---|---|---|---|
| 2.654 | 1.430 | 1.603 | 1.386 | 31.39 | 0.13 |
| Labels | Compositions of Cementation Solutions (mol/L) | Spray Numbers | ||
|---|---|---|---|---|
| CaCl2 | L-Asp | Na2CO3 | ||
| S0 | 0.5 | 0.0 | 0.5 | 30 |
| S1 | 0.5 | 0.5 | 0.5 | 10 |
| S2 | 0.5 | 0.5 | 0.5 | 20 |
| S3 | 0.5 | 0.5 | 0.5 | 30 |
| S4 | 0.5 | 0.5 | 0.5 | 40 |
Disclaimer/Publisher’s Note: The statements, opinions and data contained in all publications are solely those of the individual author(s) and contributor(s) and not of MDPI and/or the editor(s). MDPI and/or the editor(s) disclaim responsibility for any injury to people or property resulting from any ideas, methods, instructions or products referred to in the content. |
© 2023 by the authors. Licensee MDPI, Basel, Switzerland. This article is an open access article distributed under the terms and conditions of the Creative Commons Attribution (CC BY) license (https://creativecommons.org/licenses/by/4.0/).
Share and Cite
Diao, Y.; Bai, J.; Sun, C.; Huang, J.; Yang, C.; Hu, Q. A Simplified Model for Shear Behavior of Mortar Using Biomimetic Carbonate Precipitation. Materials 2023, 16, 5613. https://doi.org/10.3390/ma16165613
Diao Y, Bai J, Sun C, Huang J, Yang C, Hu Q. A Simplified Model for Shear Behavior of Mortar Using Biomimetic Carbonate Precipitation. Materials. 2023; 16(16):5613. https://doi.org/10.3390/ma16165613
Chicago/Turabian StyleDiao, Yu, Jitao Bai, Changyou Sun, Jianyou Huang, Chao Yang, and Qingsong Hu. 2023. "A Simplified Model for Shear Behavior of Mortar Using Biomimetic Carbonate Precipitation" Materials 16, no. 16: 5613. https://doi.org/10.3390/ma16165613