
Lightweight SCC Development in a Low-Carbon Cementitious System for Structural Applications

 , ,
, ,
Abstract
:
1. Introduction
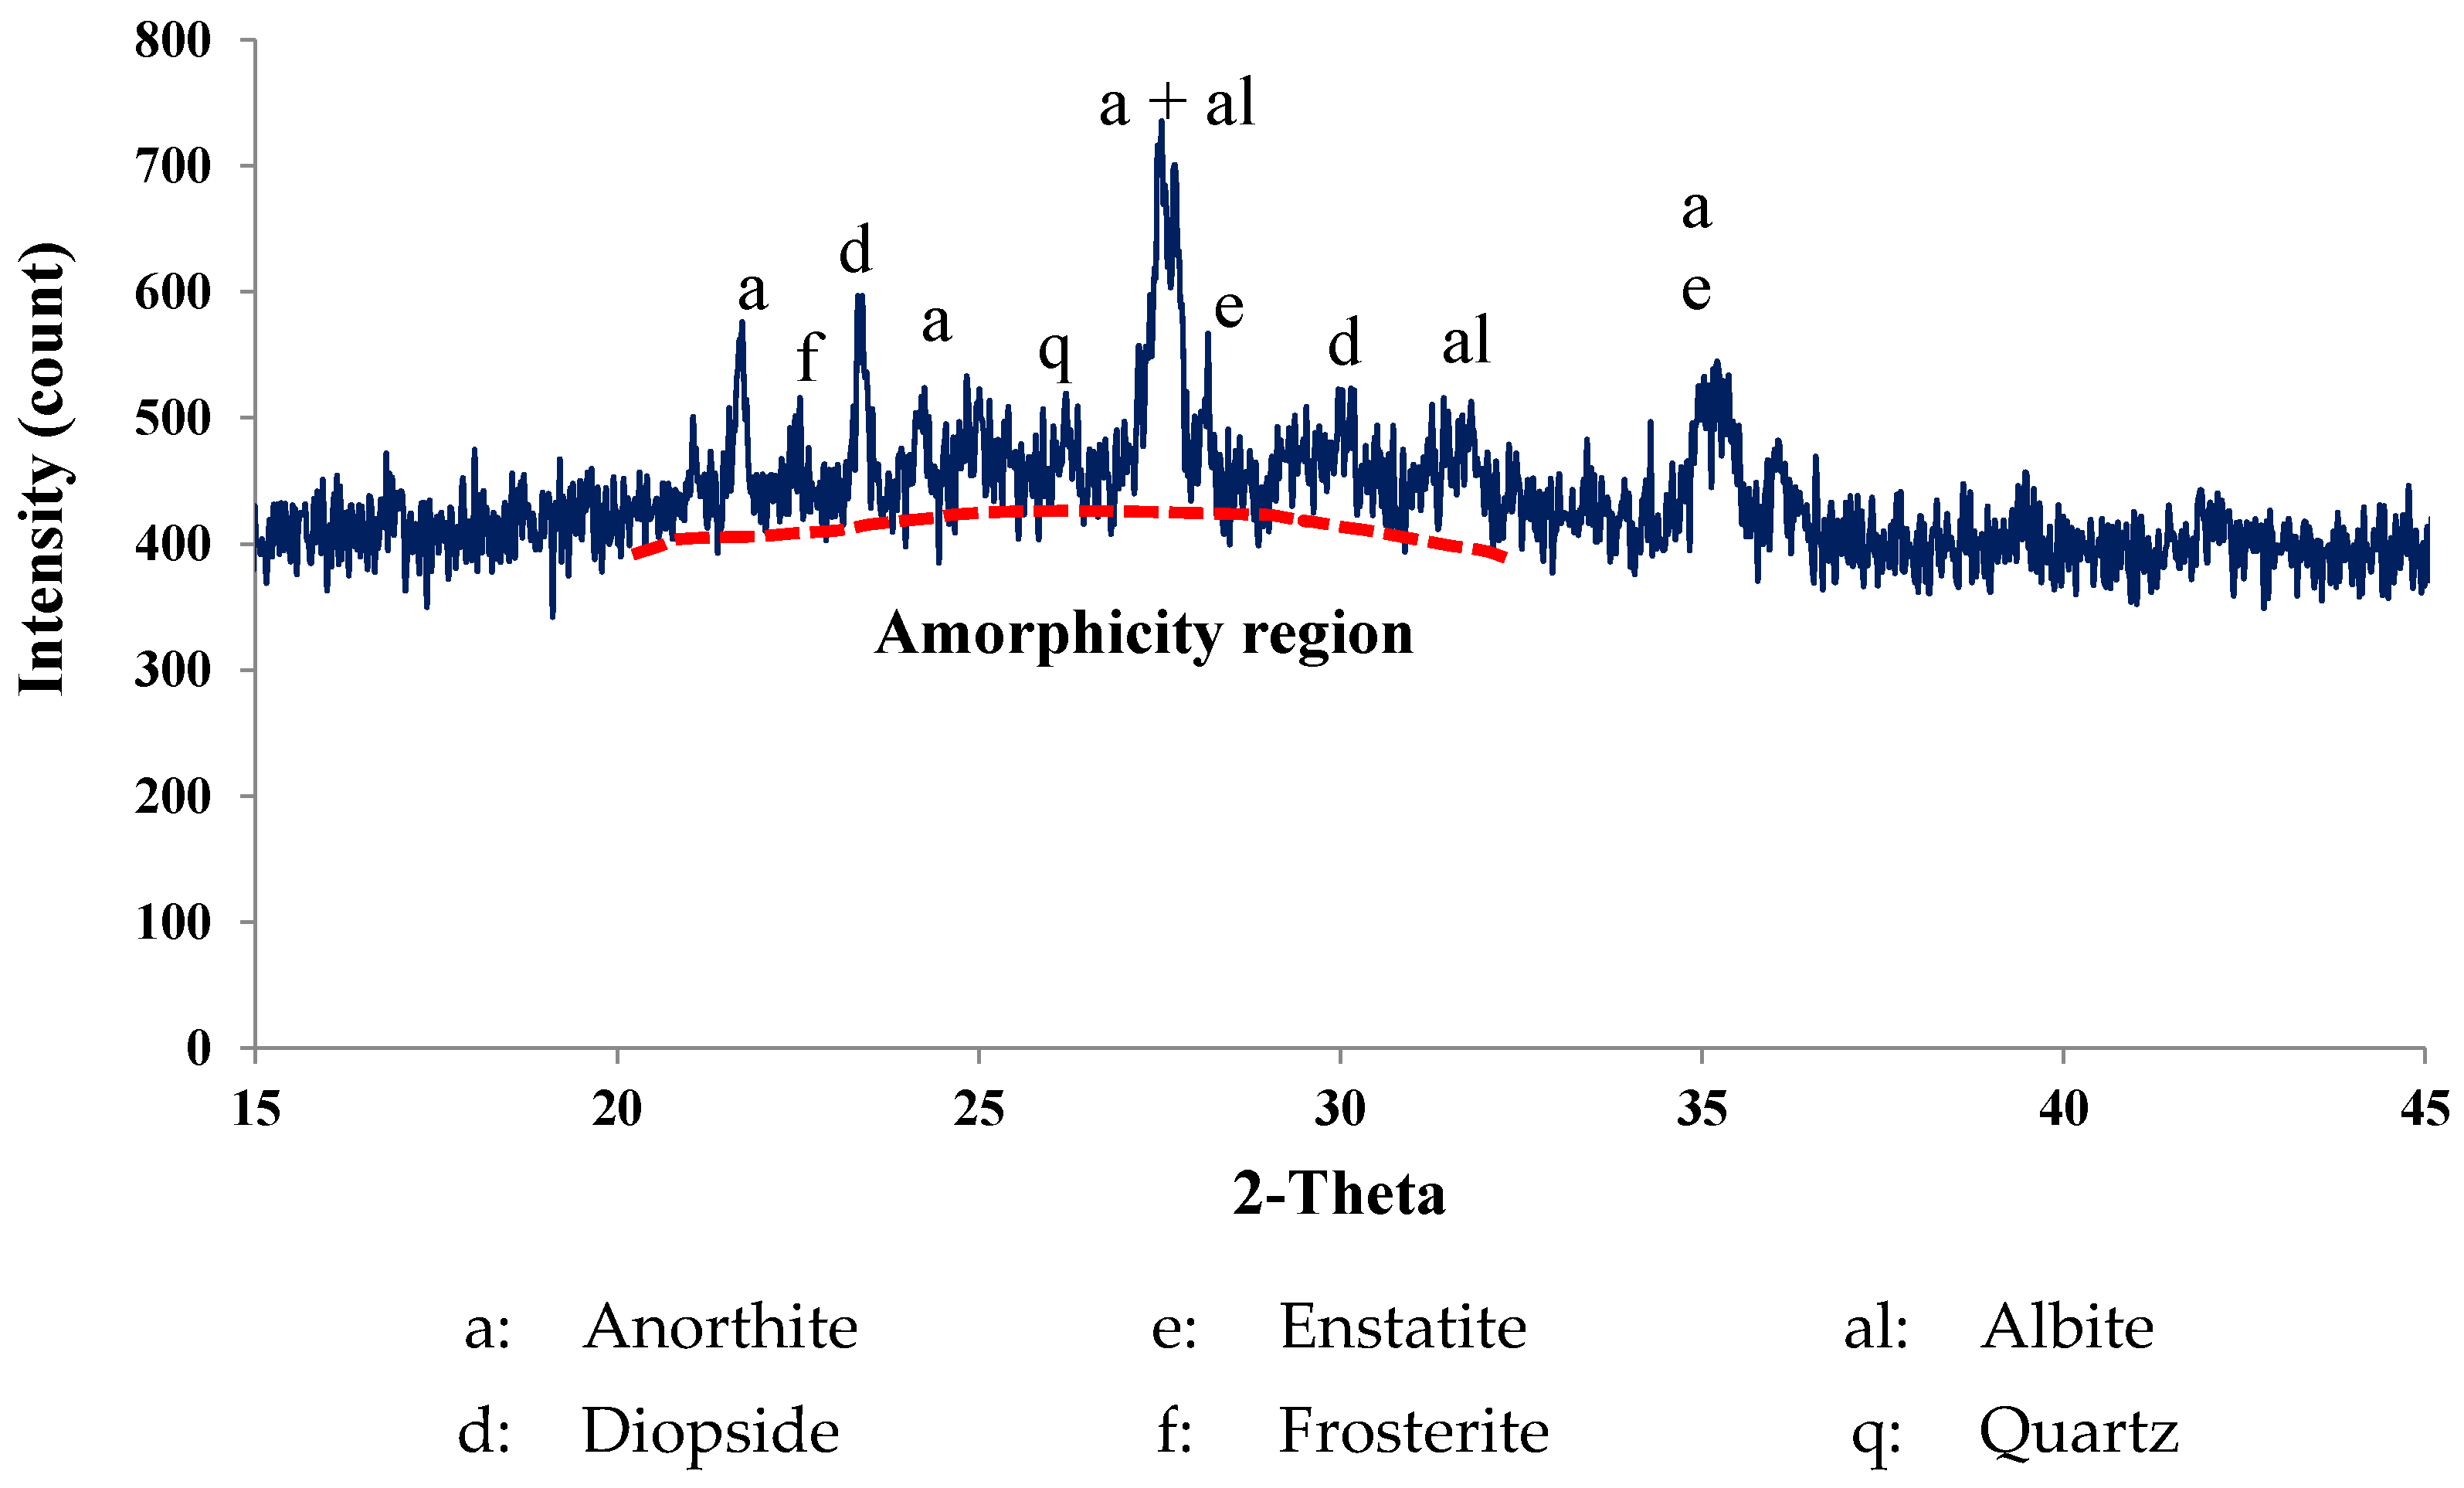
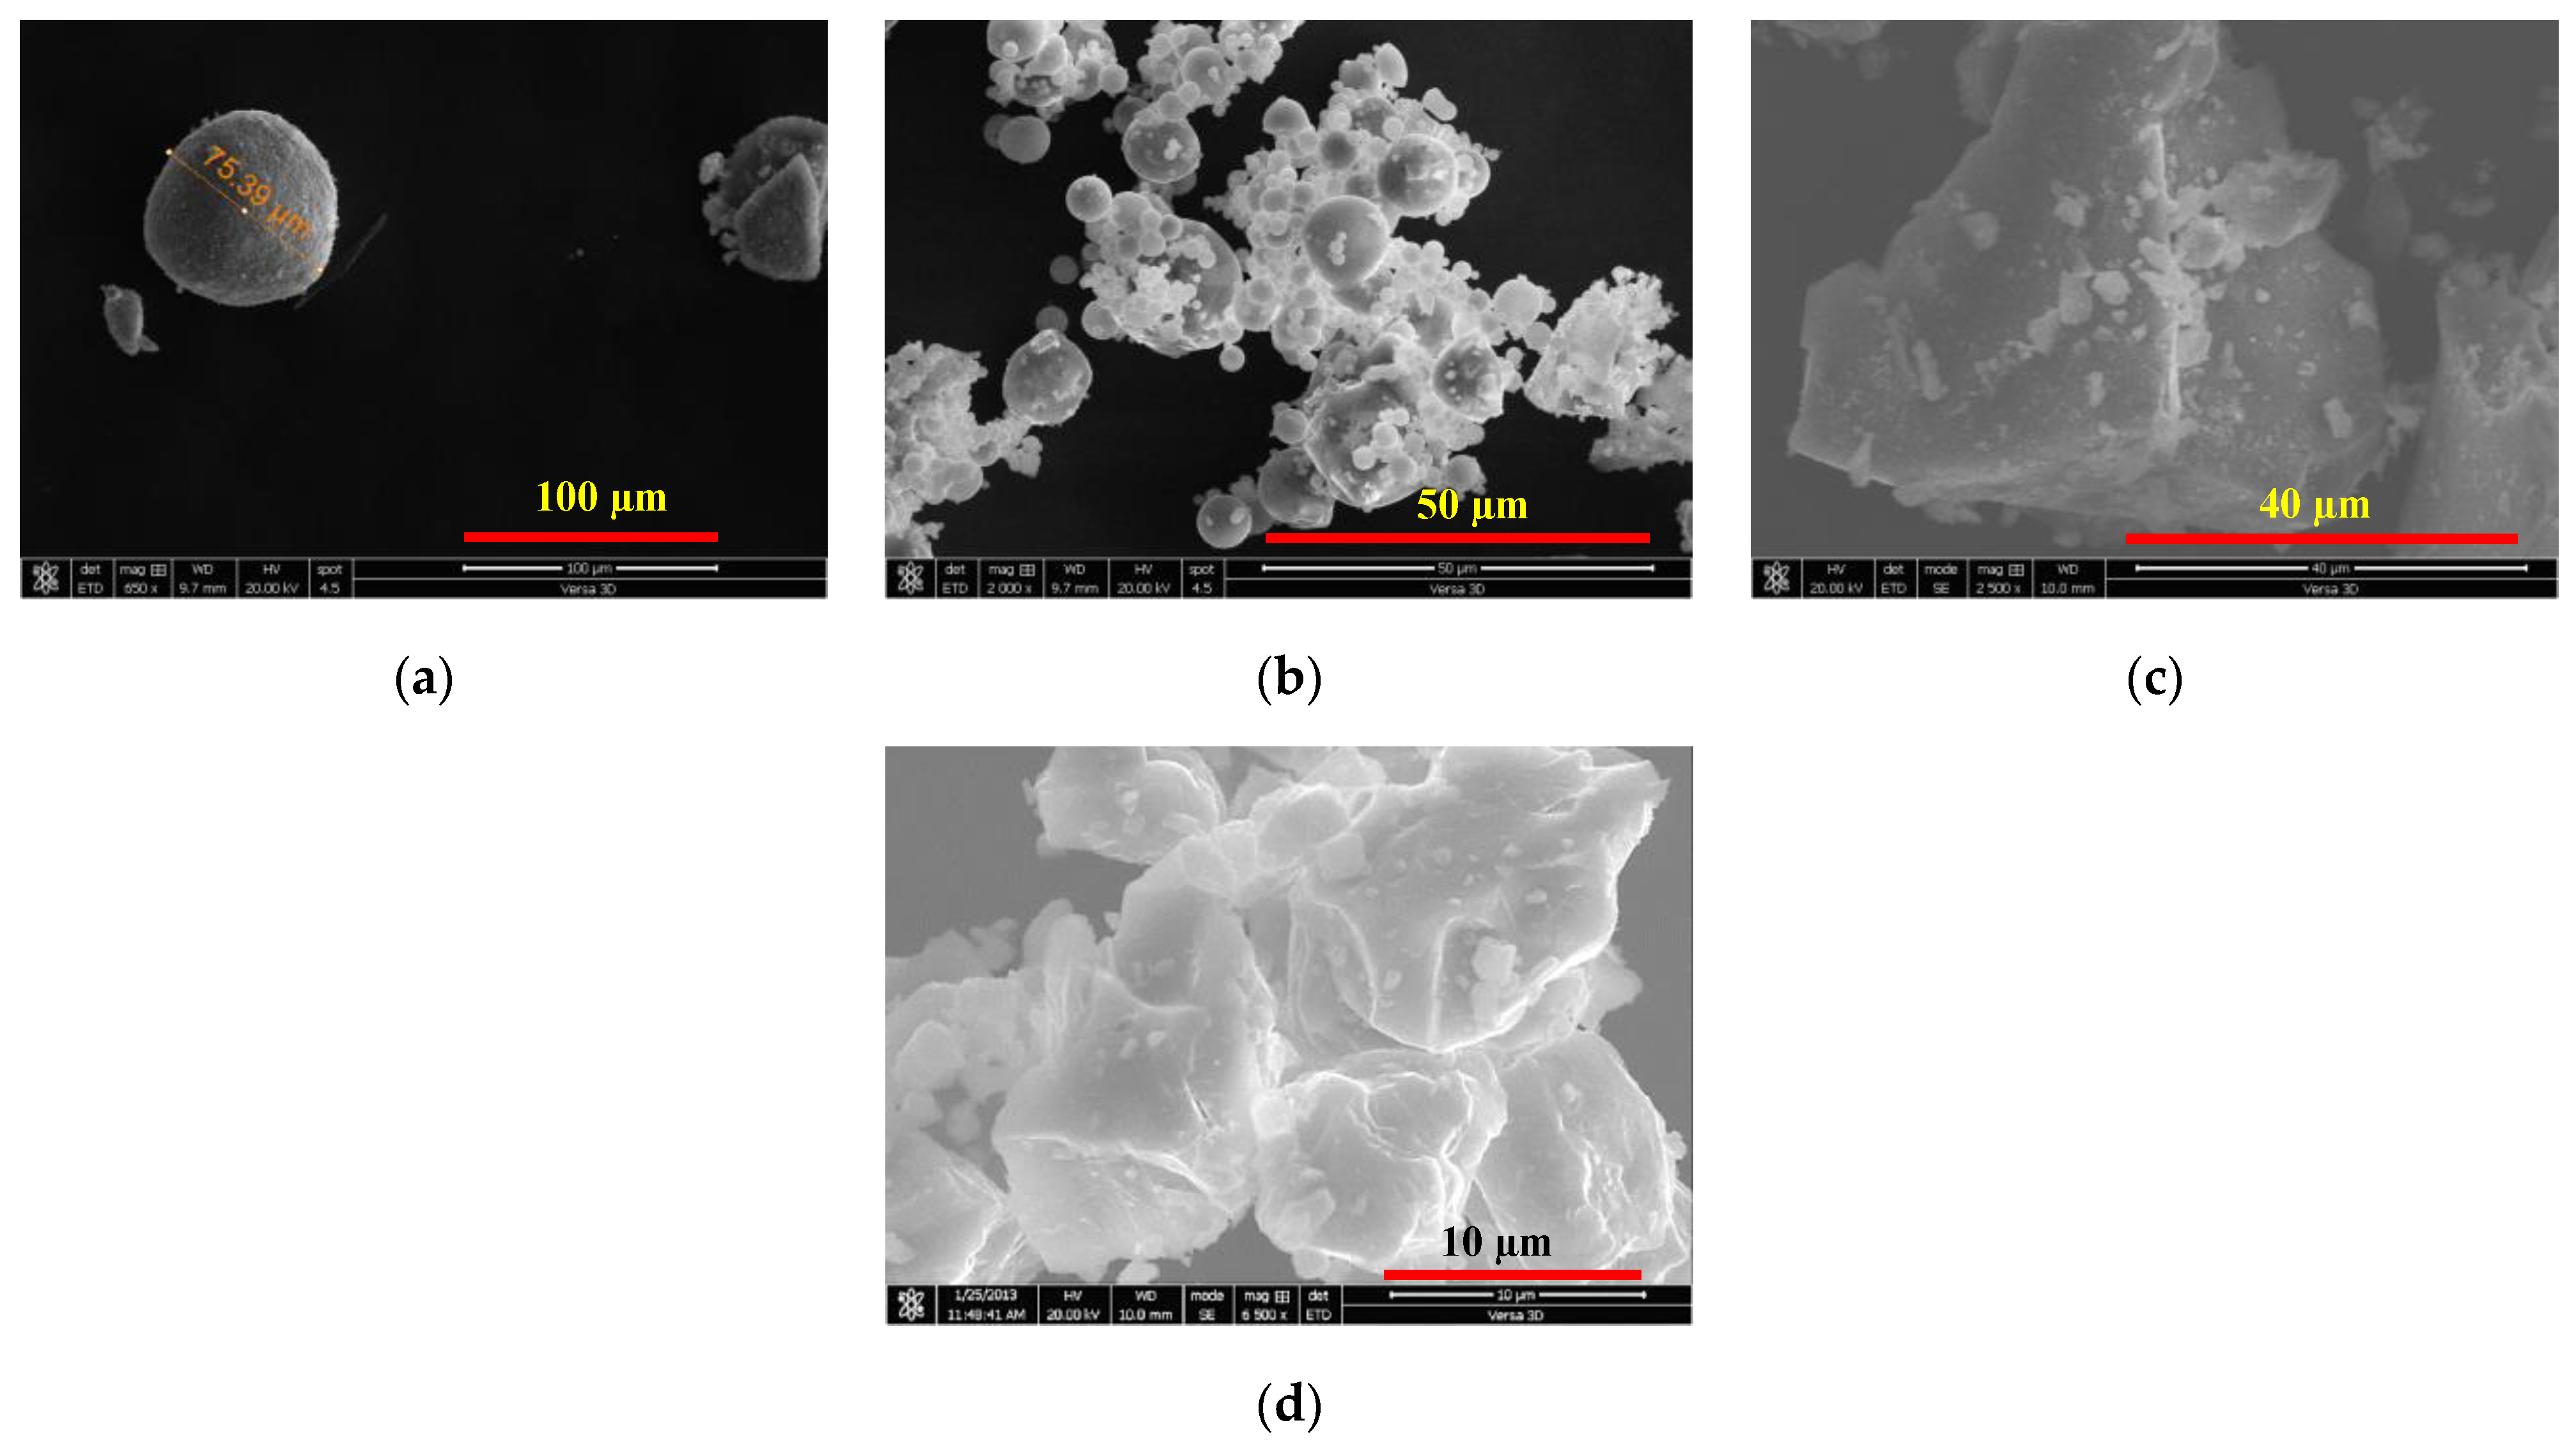
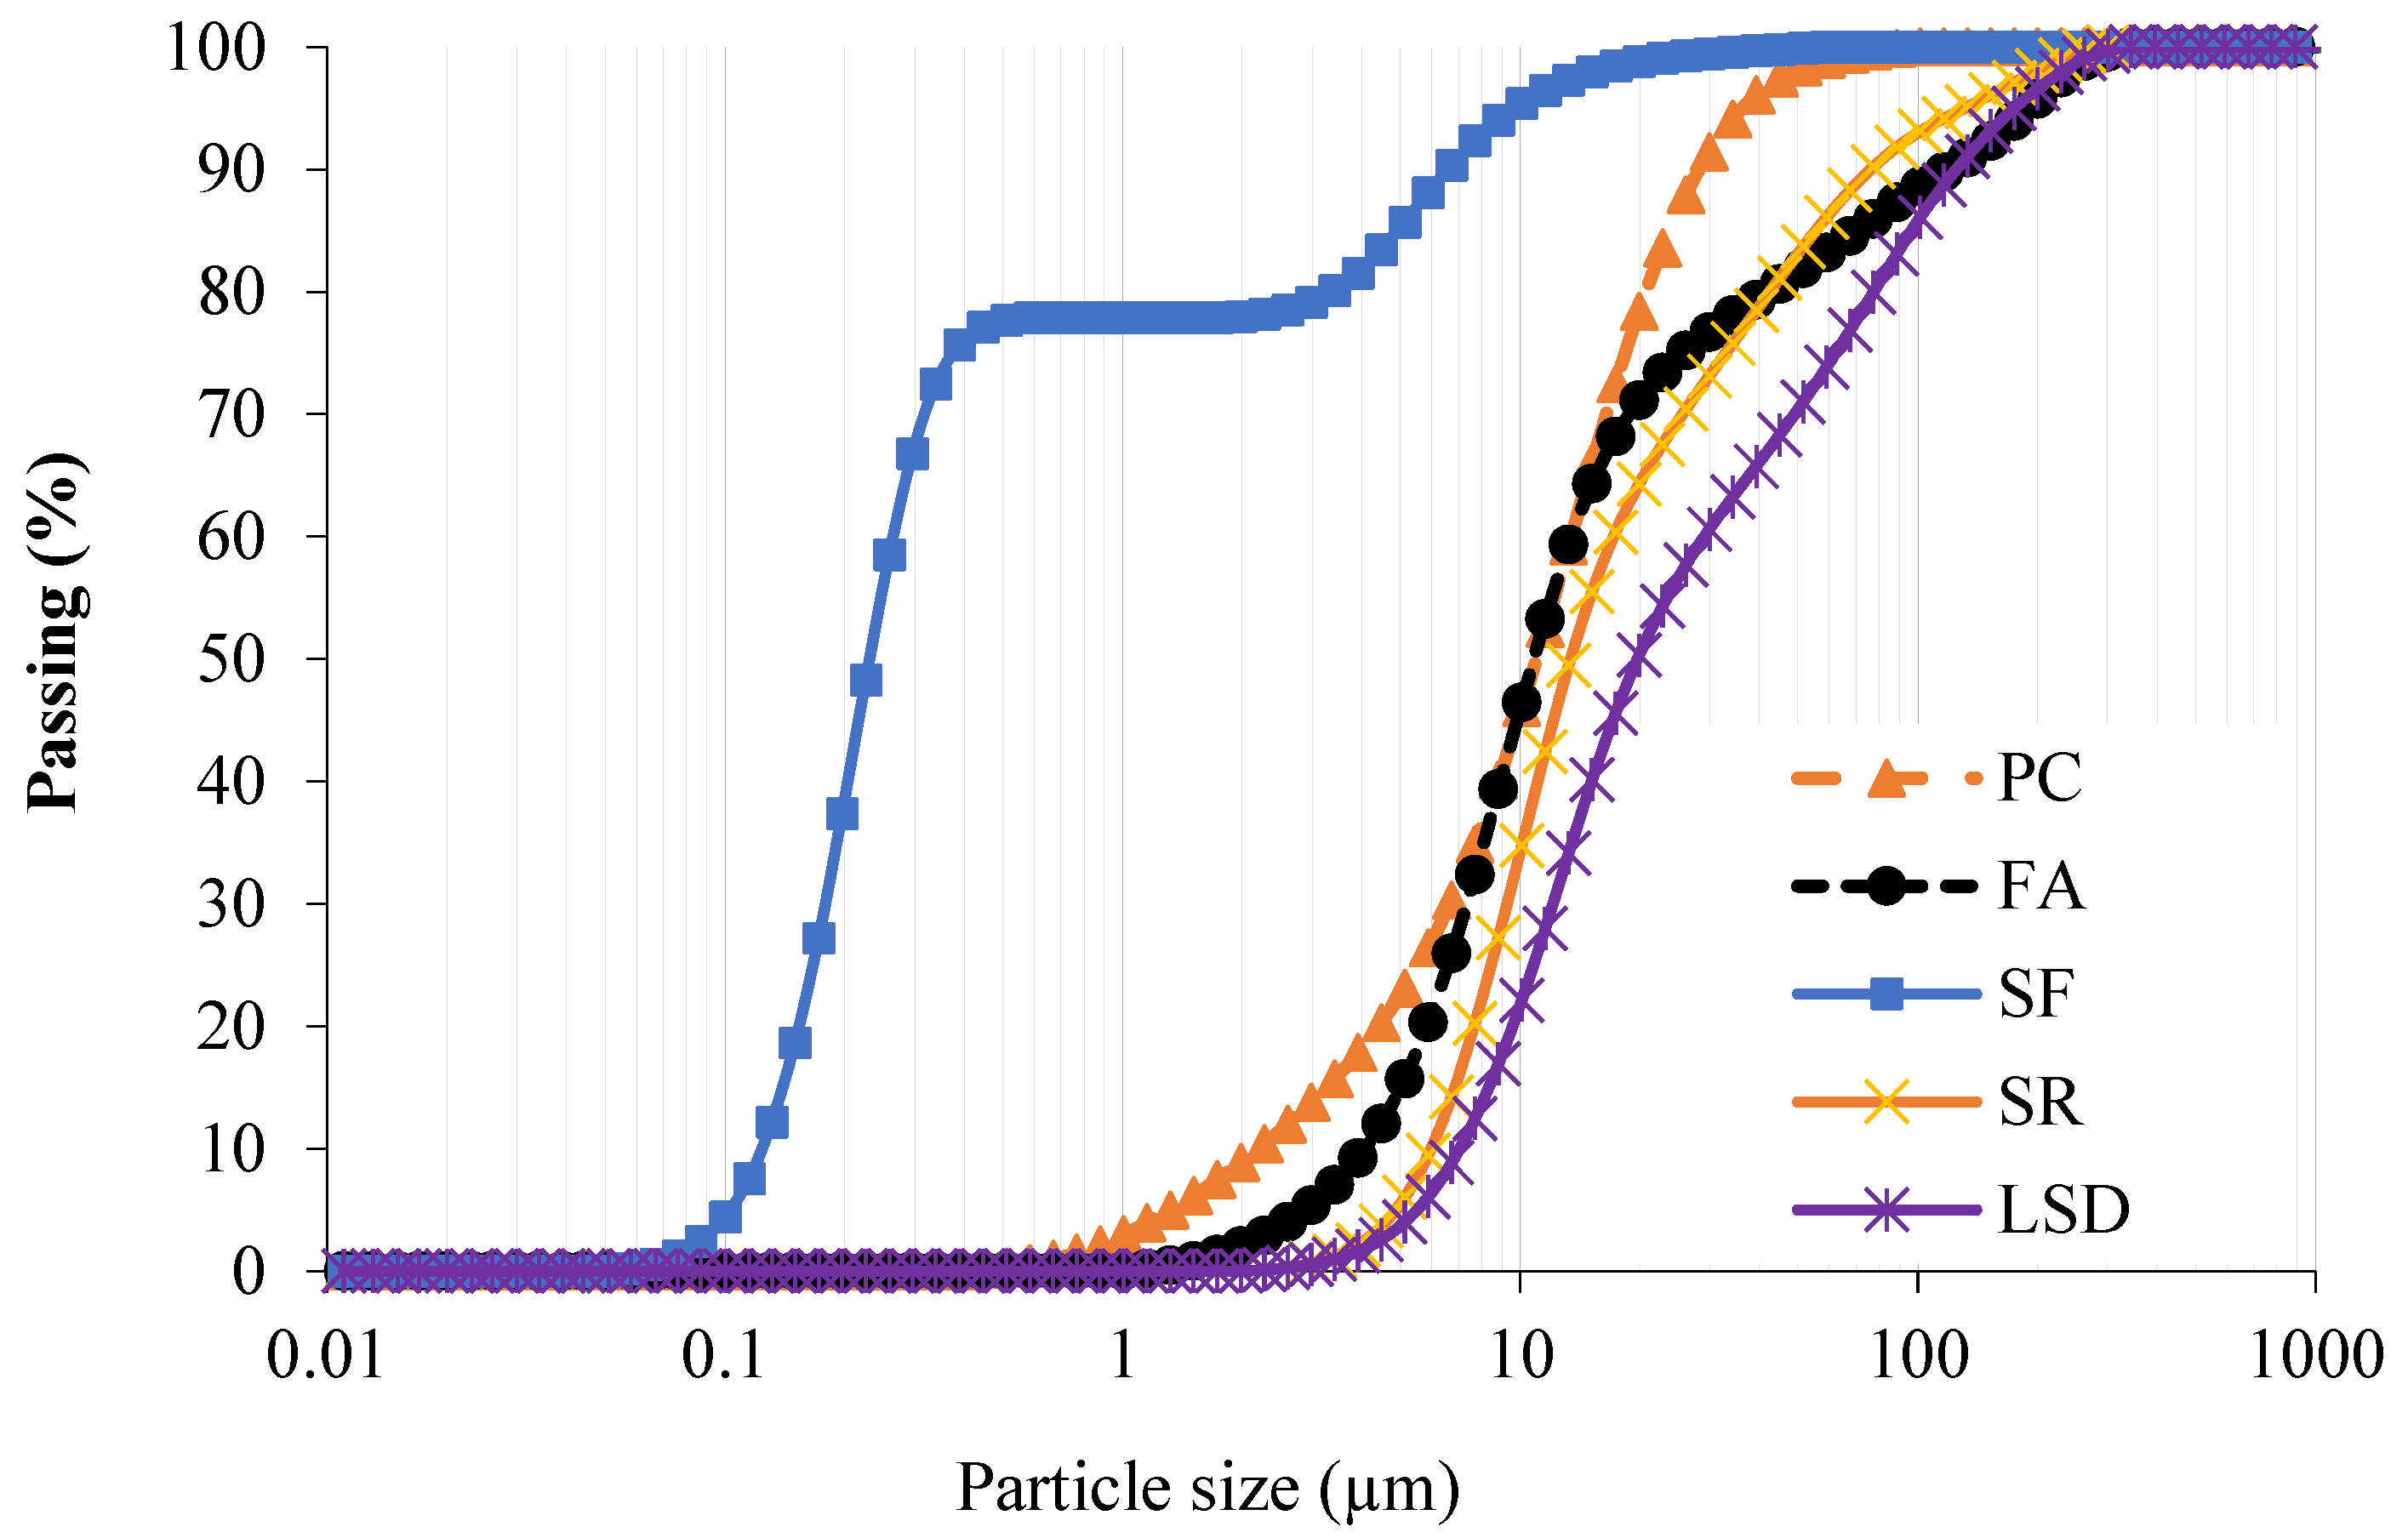
2. Materials, Characterization and Testing Scheme
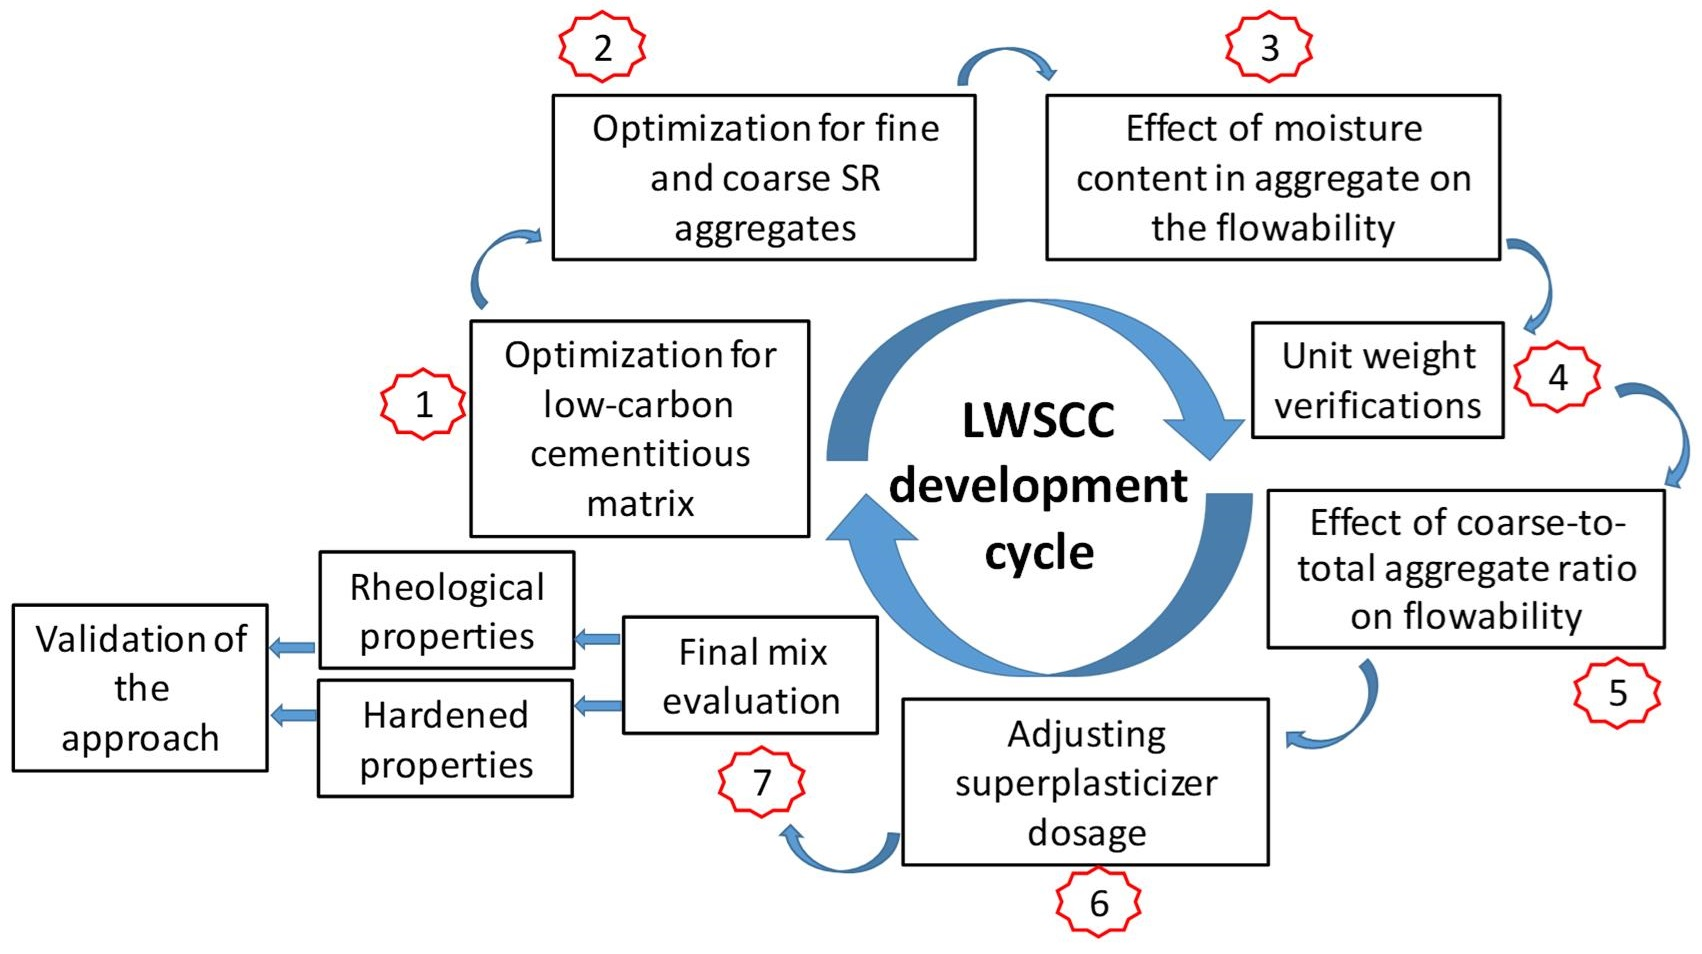
2.1. Testing Scheme
2.1.1. Effect of Aggregate Water Content
Unit Weight Approach
2.1.2. Effect of Coarse-to-Total Aggregate Ratio on Flowability
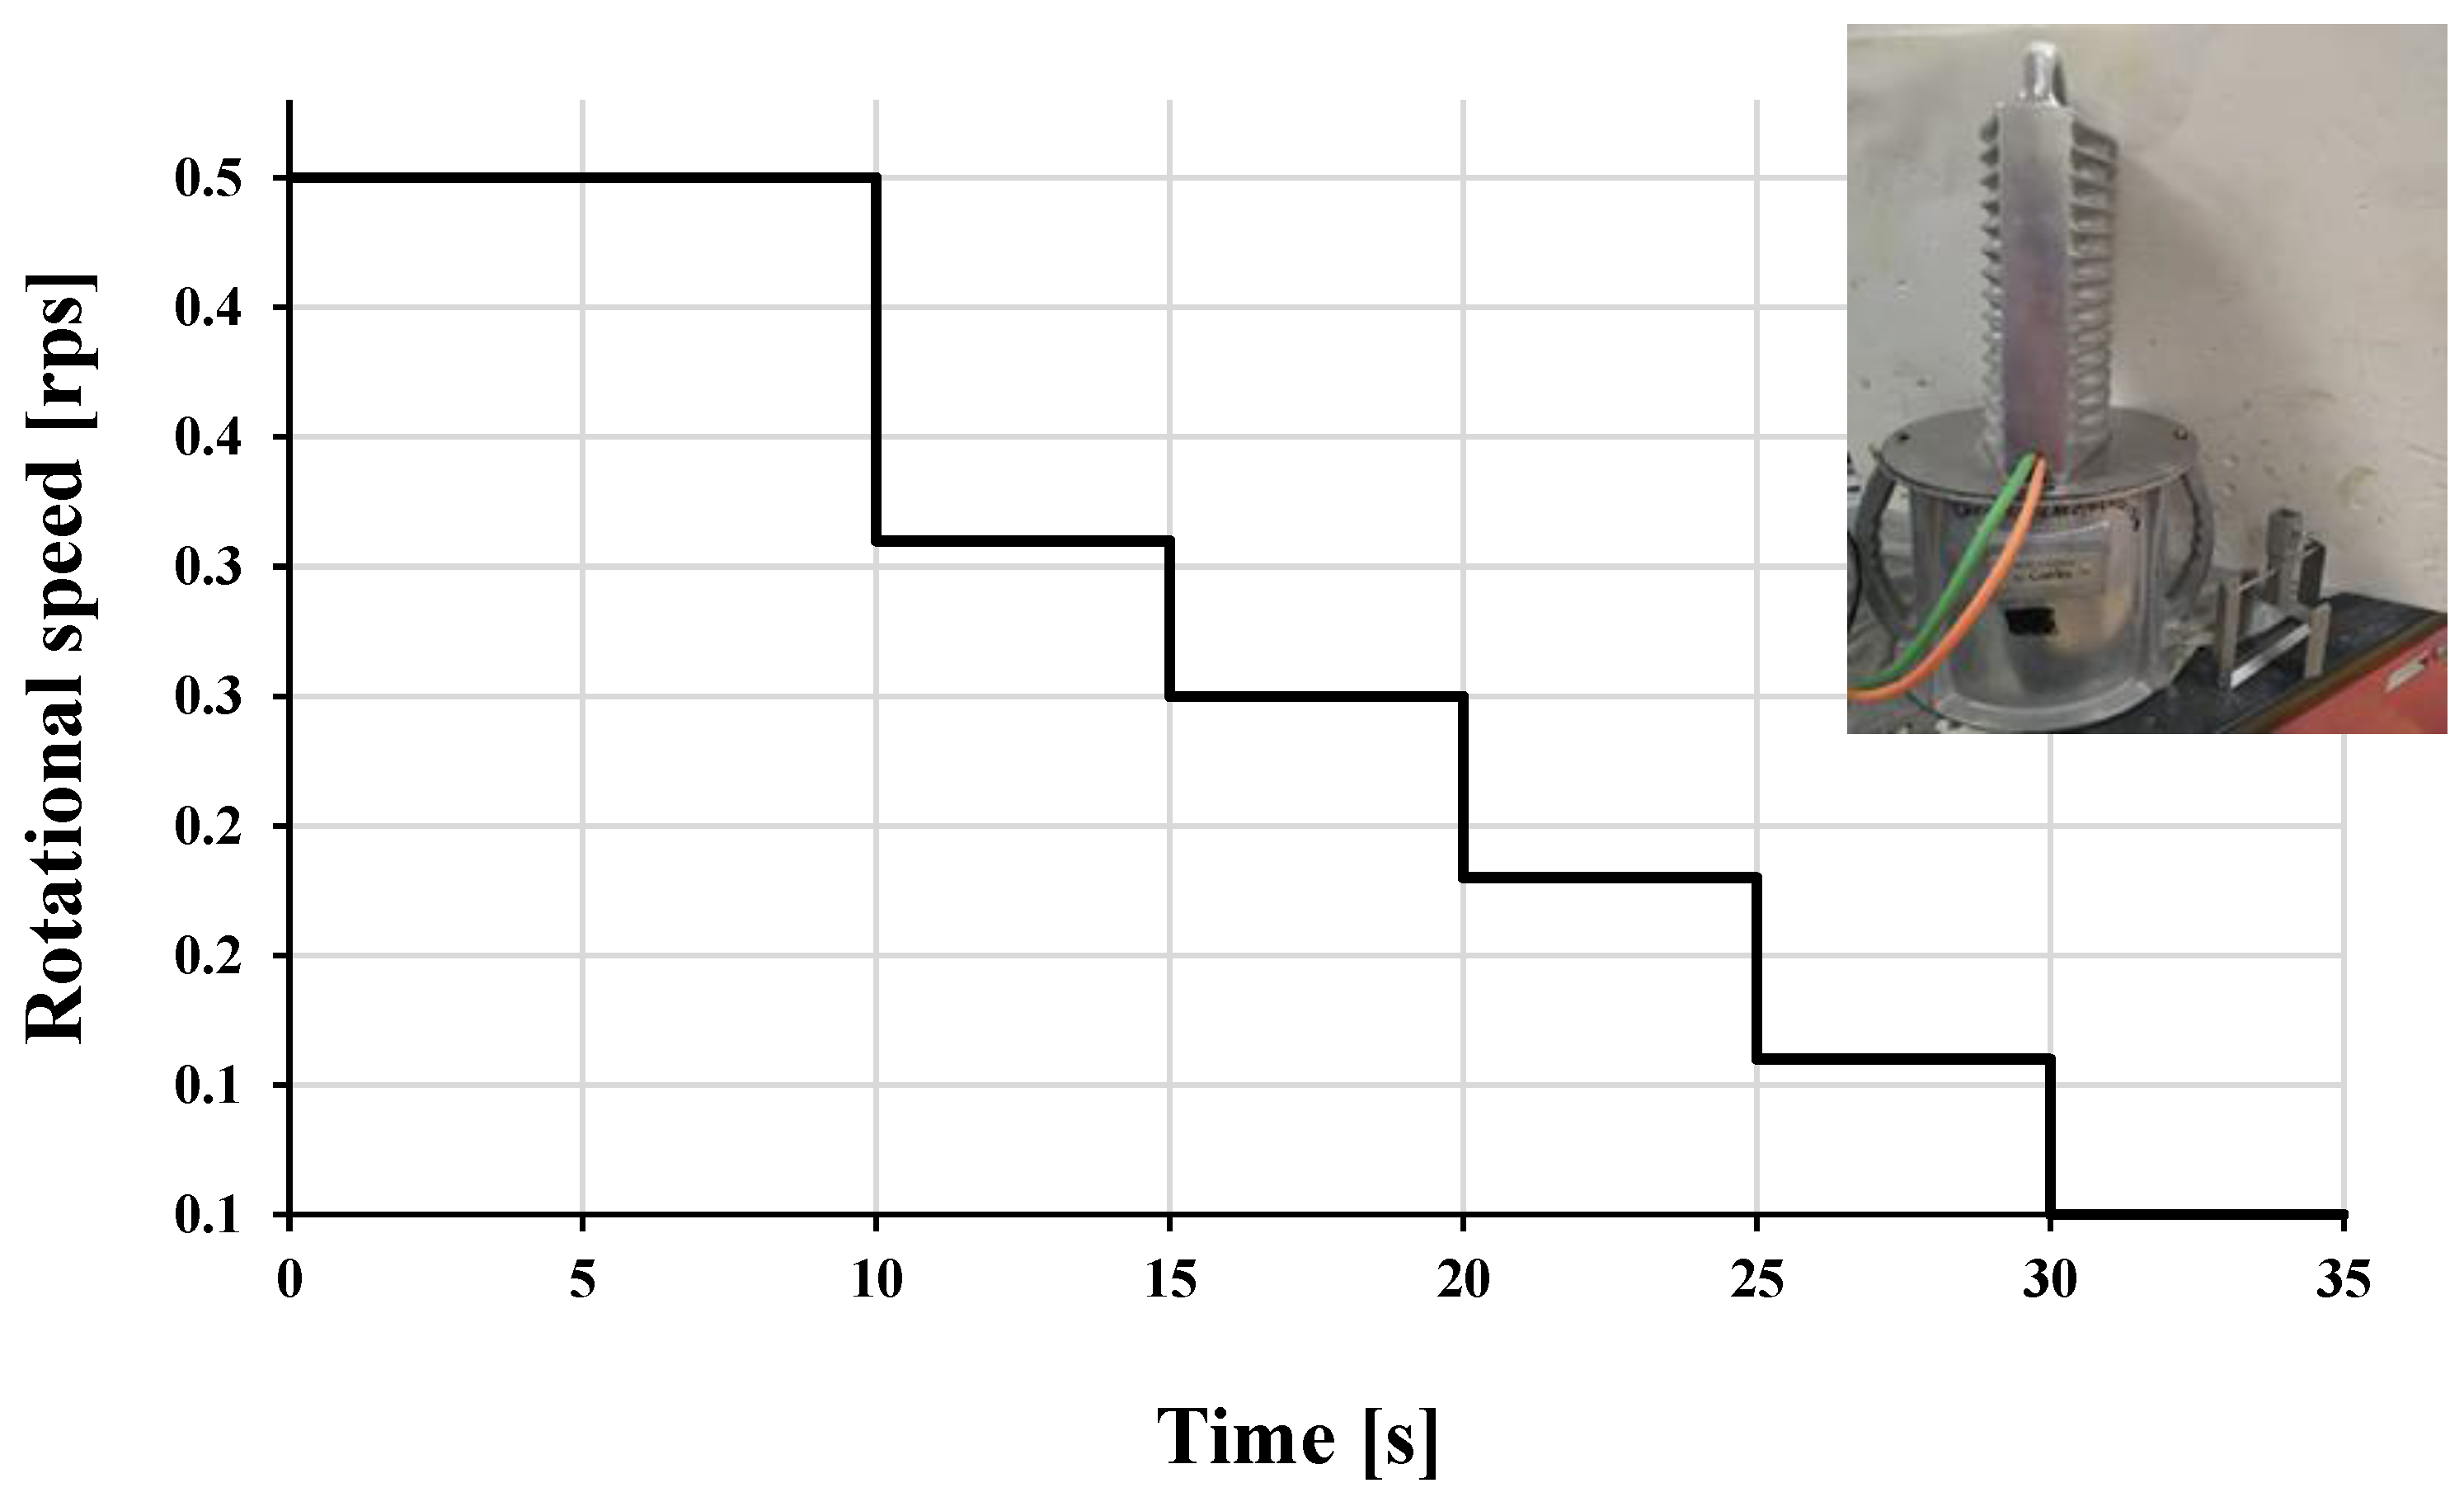
2.1.3. Adjusting Superplasticizer Dosage
2.2. Final Mix
2.2.1. Paste Mixes
2.2.2. Concrete Mixes
- -
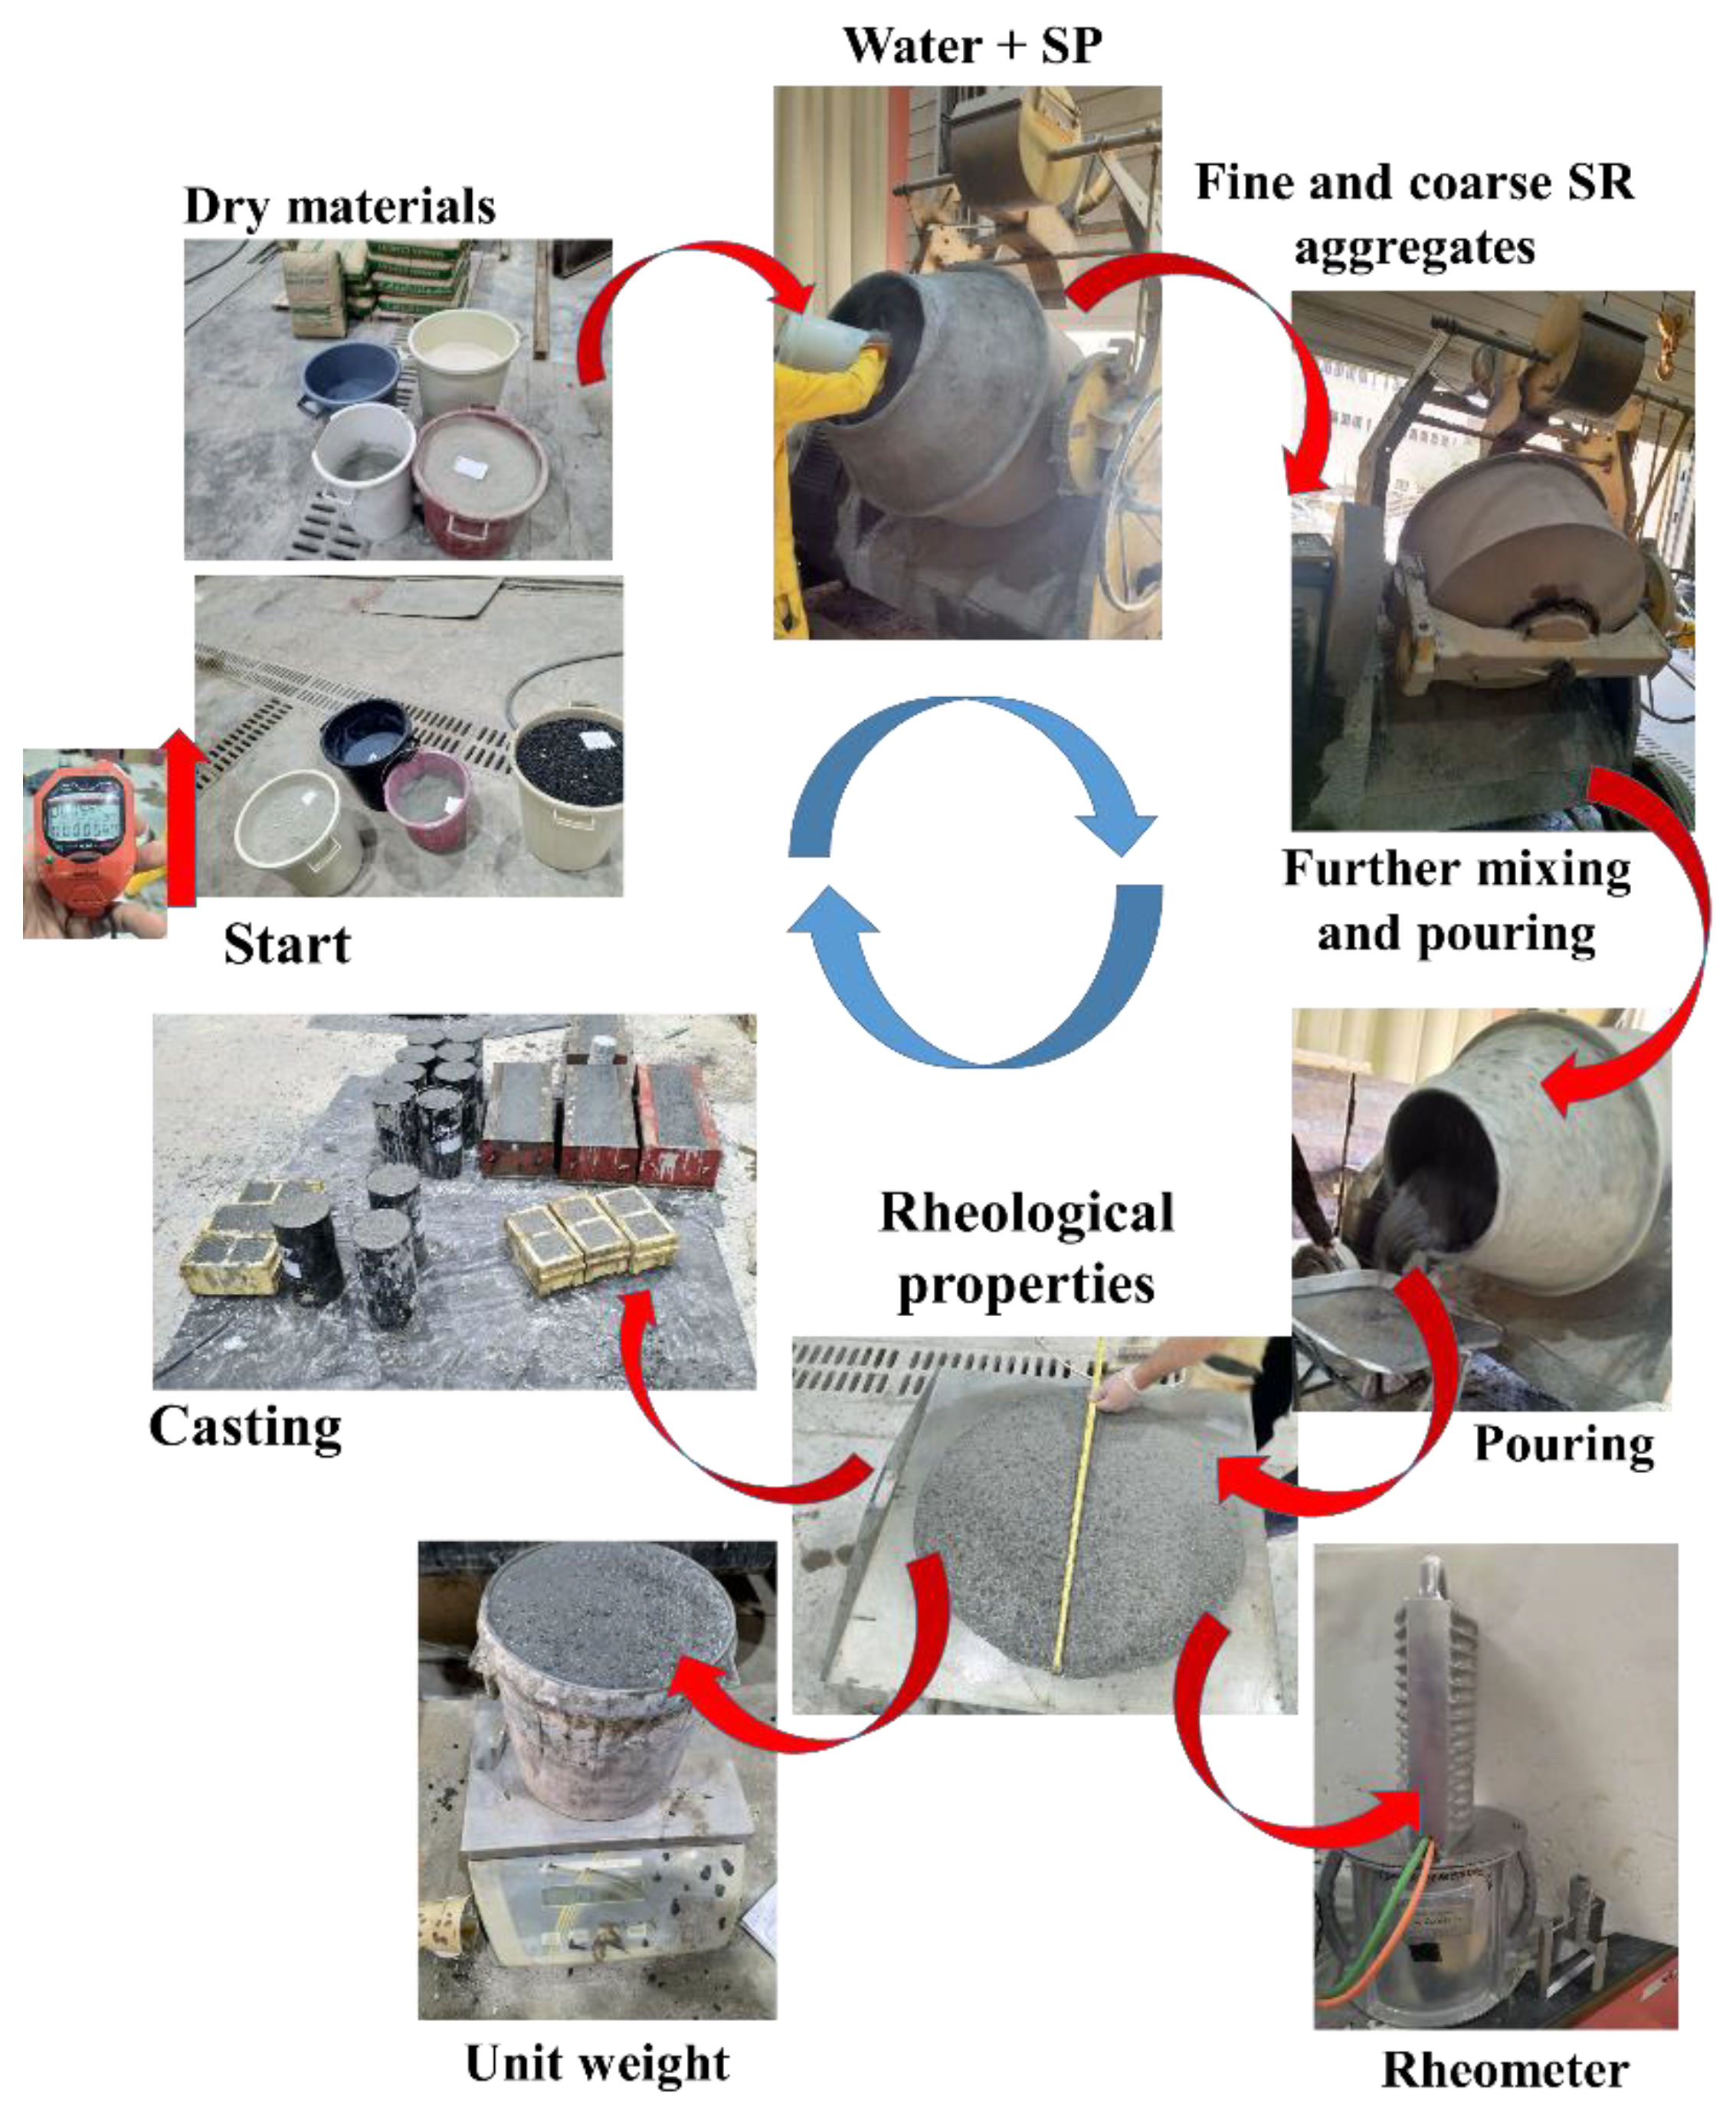
- Homogenize the cementitious binder (cement followed by fly ash, silica fume, and limestone dust) for 5 min of dry mixing;
- -
- Add water with chemical admixture and mix for 6 min;
- -
- Add fine aggregates and mix for another 4 min until flowable, followed by a 1-min pause to add coarse aggregate and mix for another 6 min or more, will guarantee the desired apparent flowability characteristic of the SCC mix.
3. Results and Discussion
3.1. Effect of Aggregate Water Content
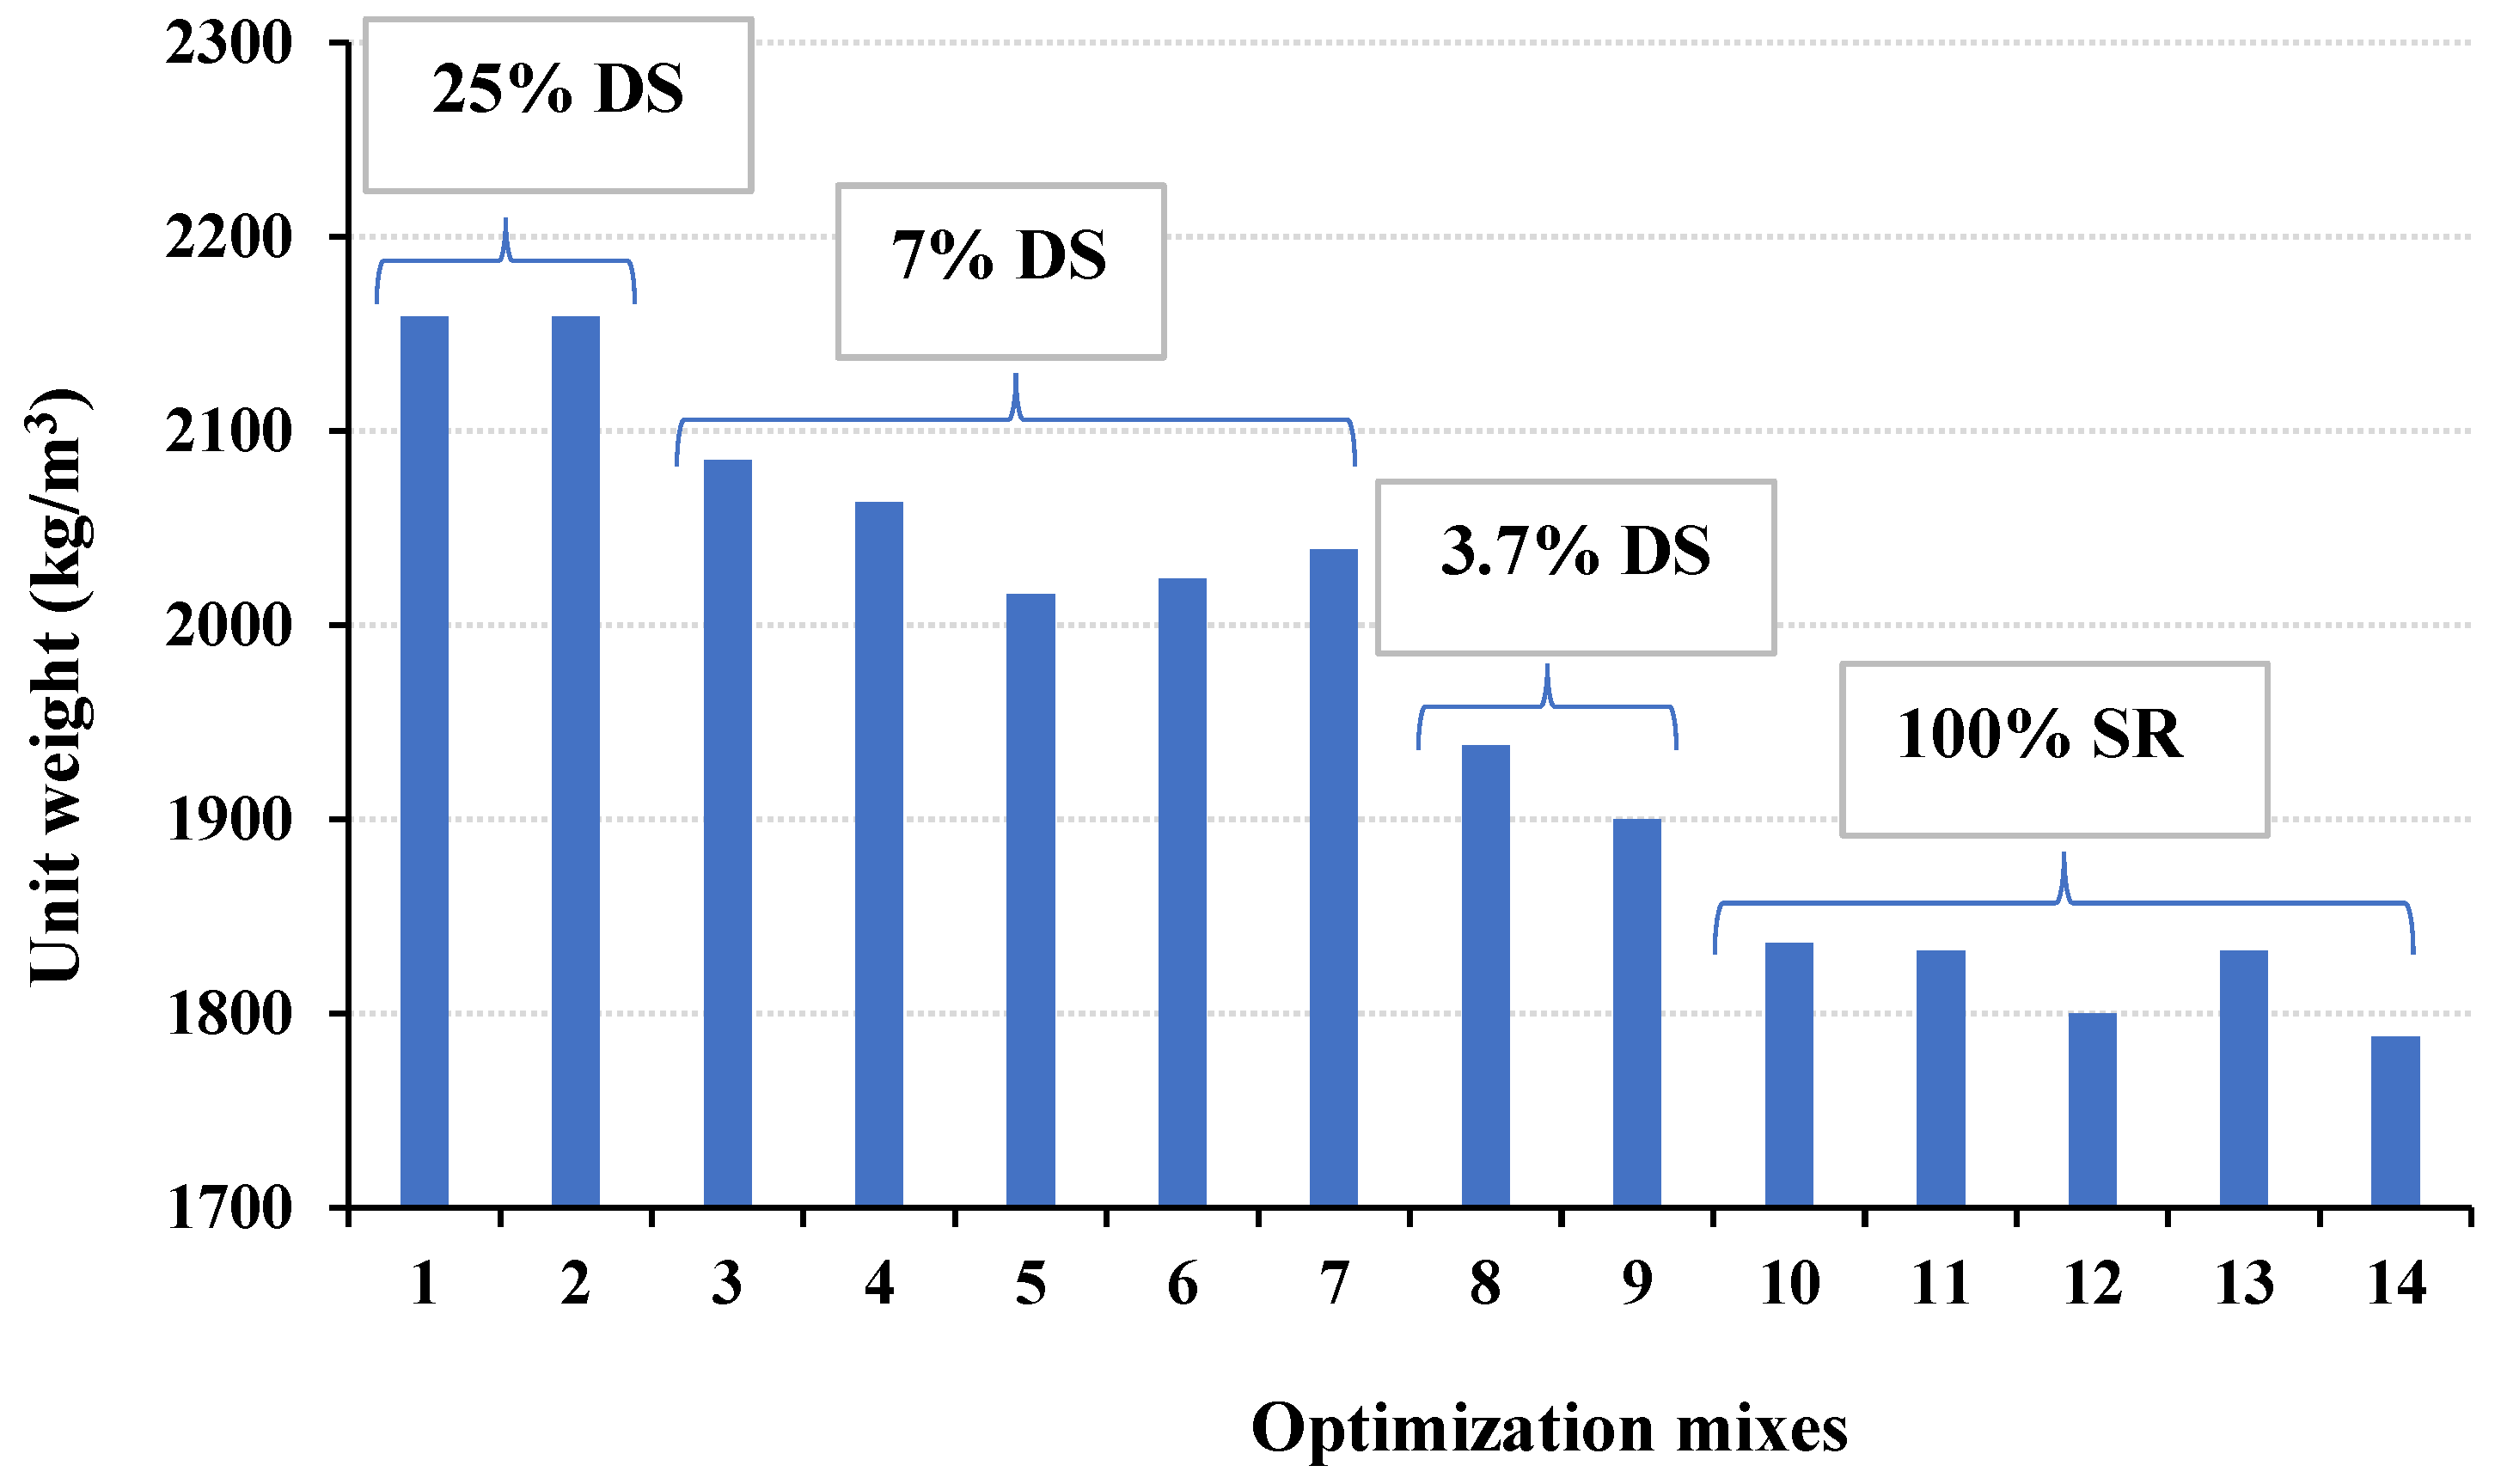
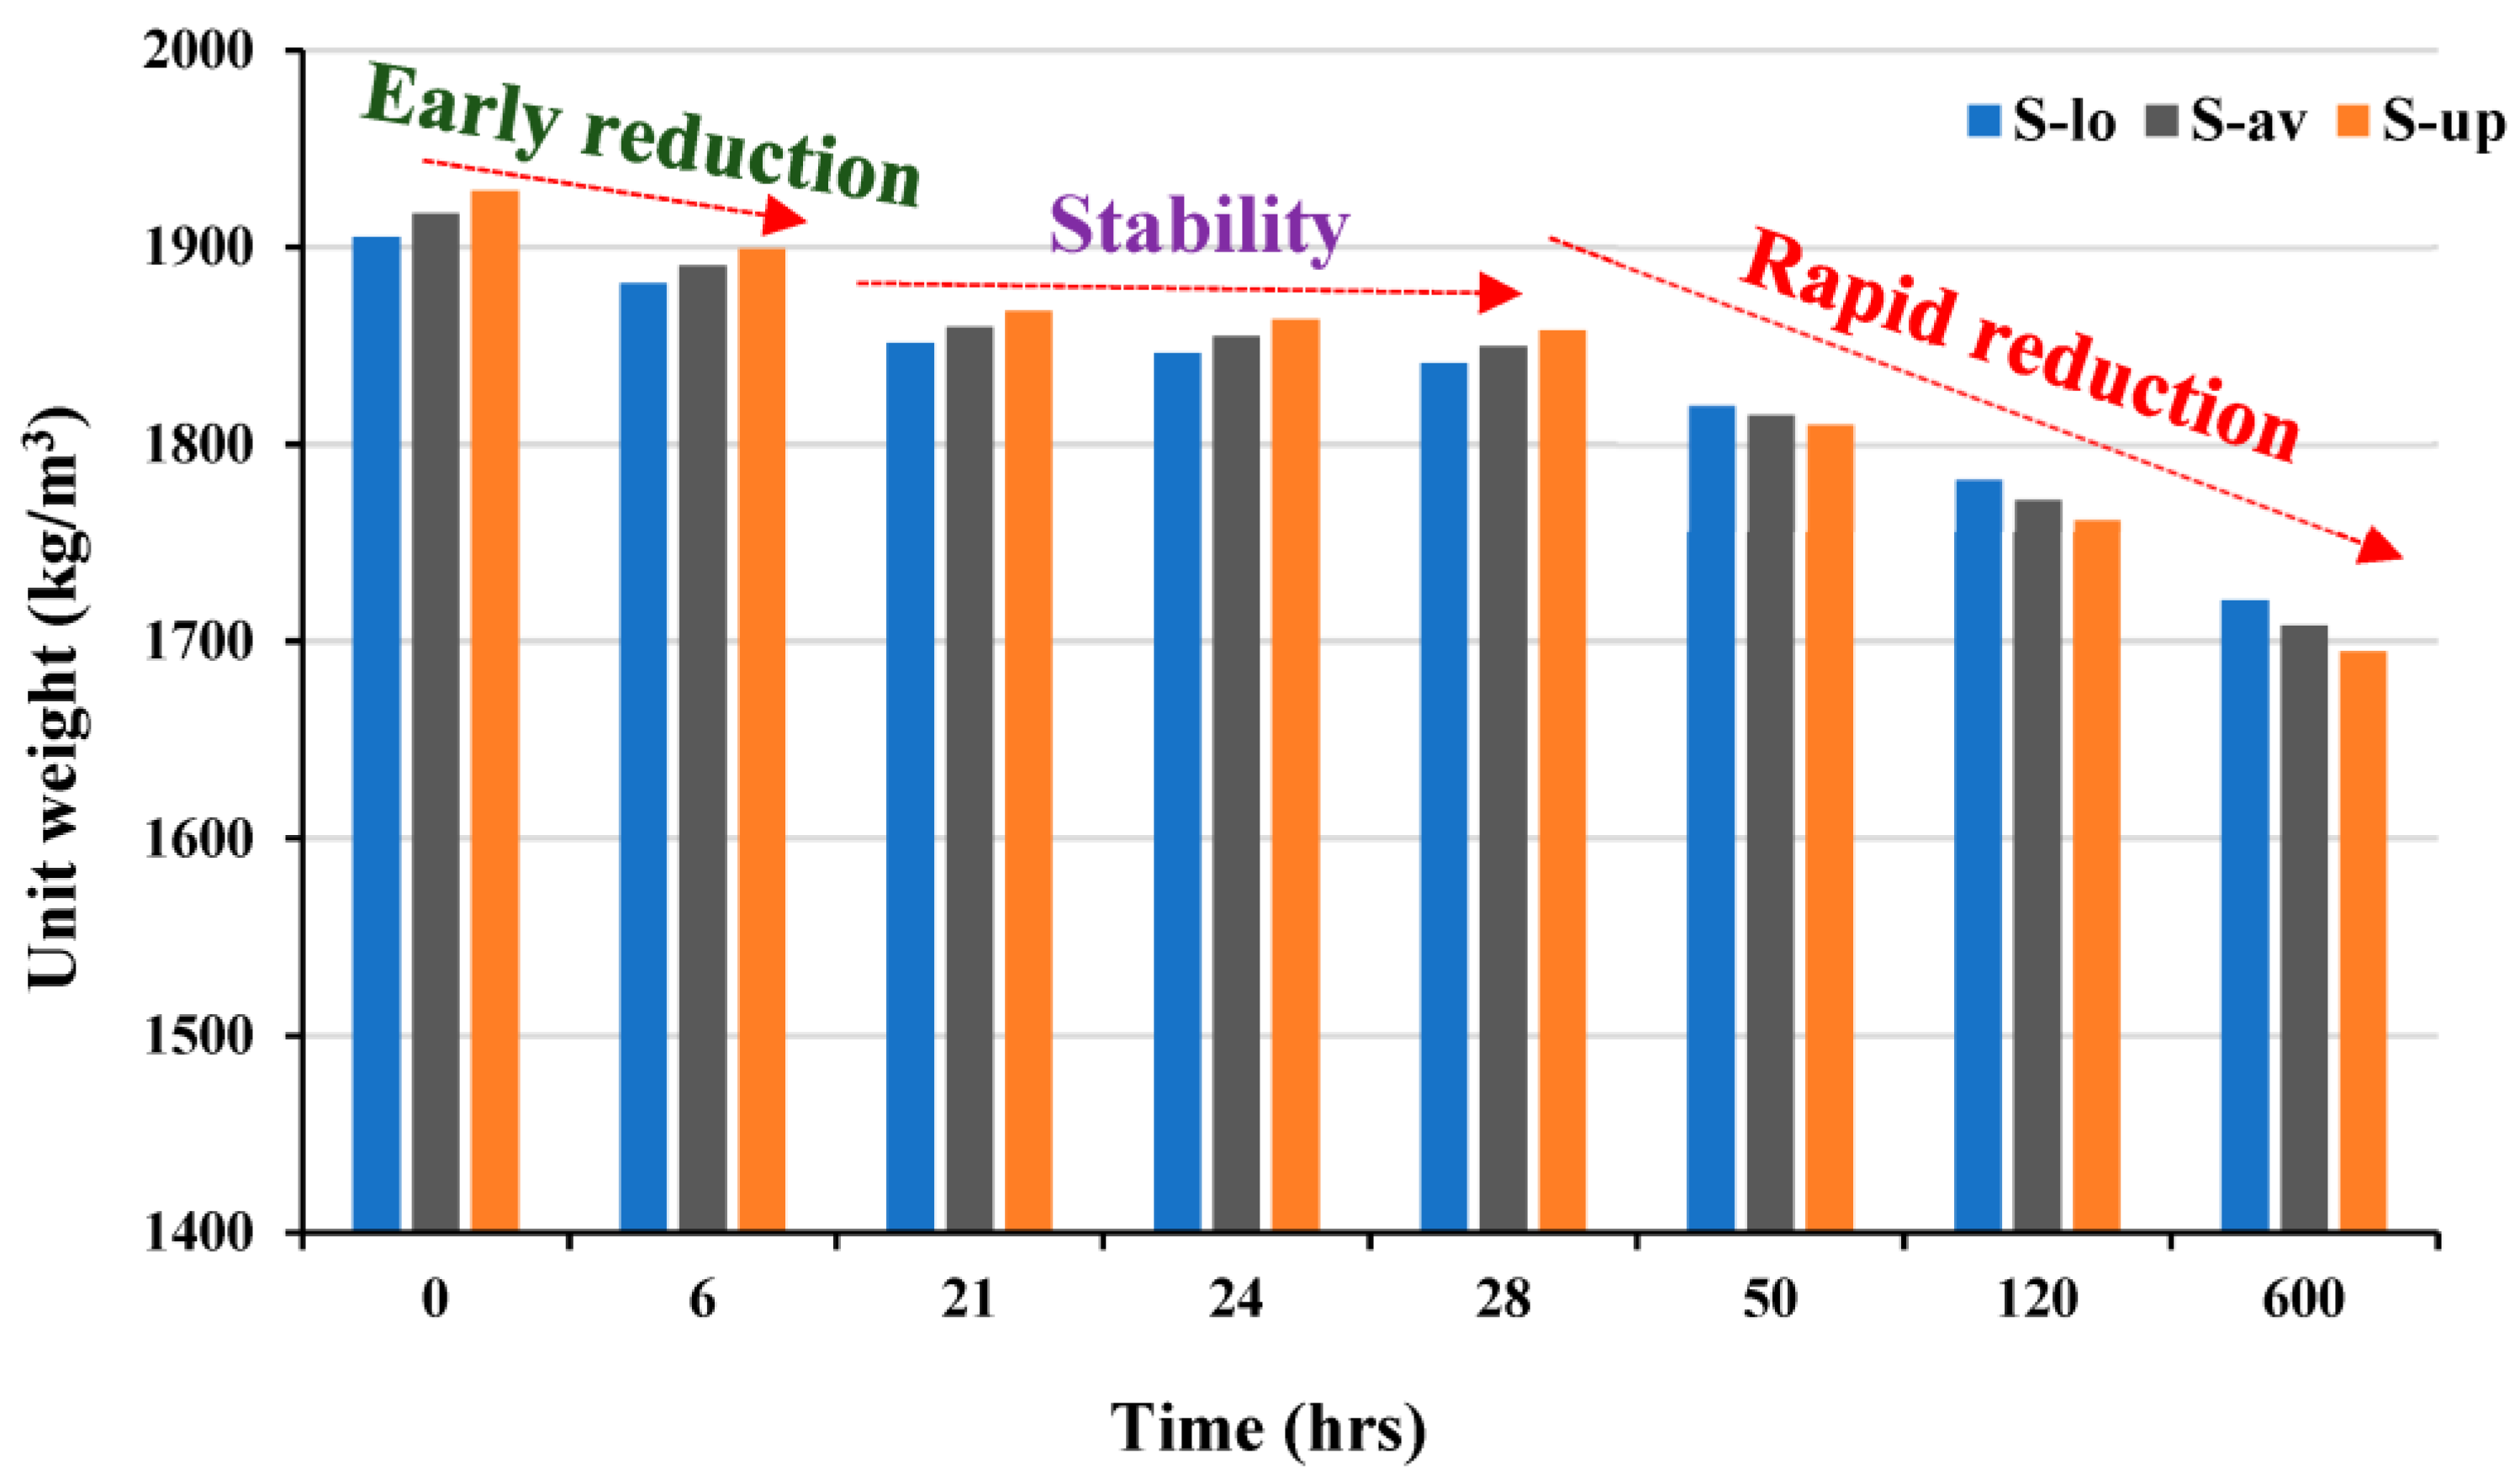
3.2. Unit Weight Approach
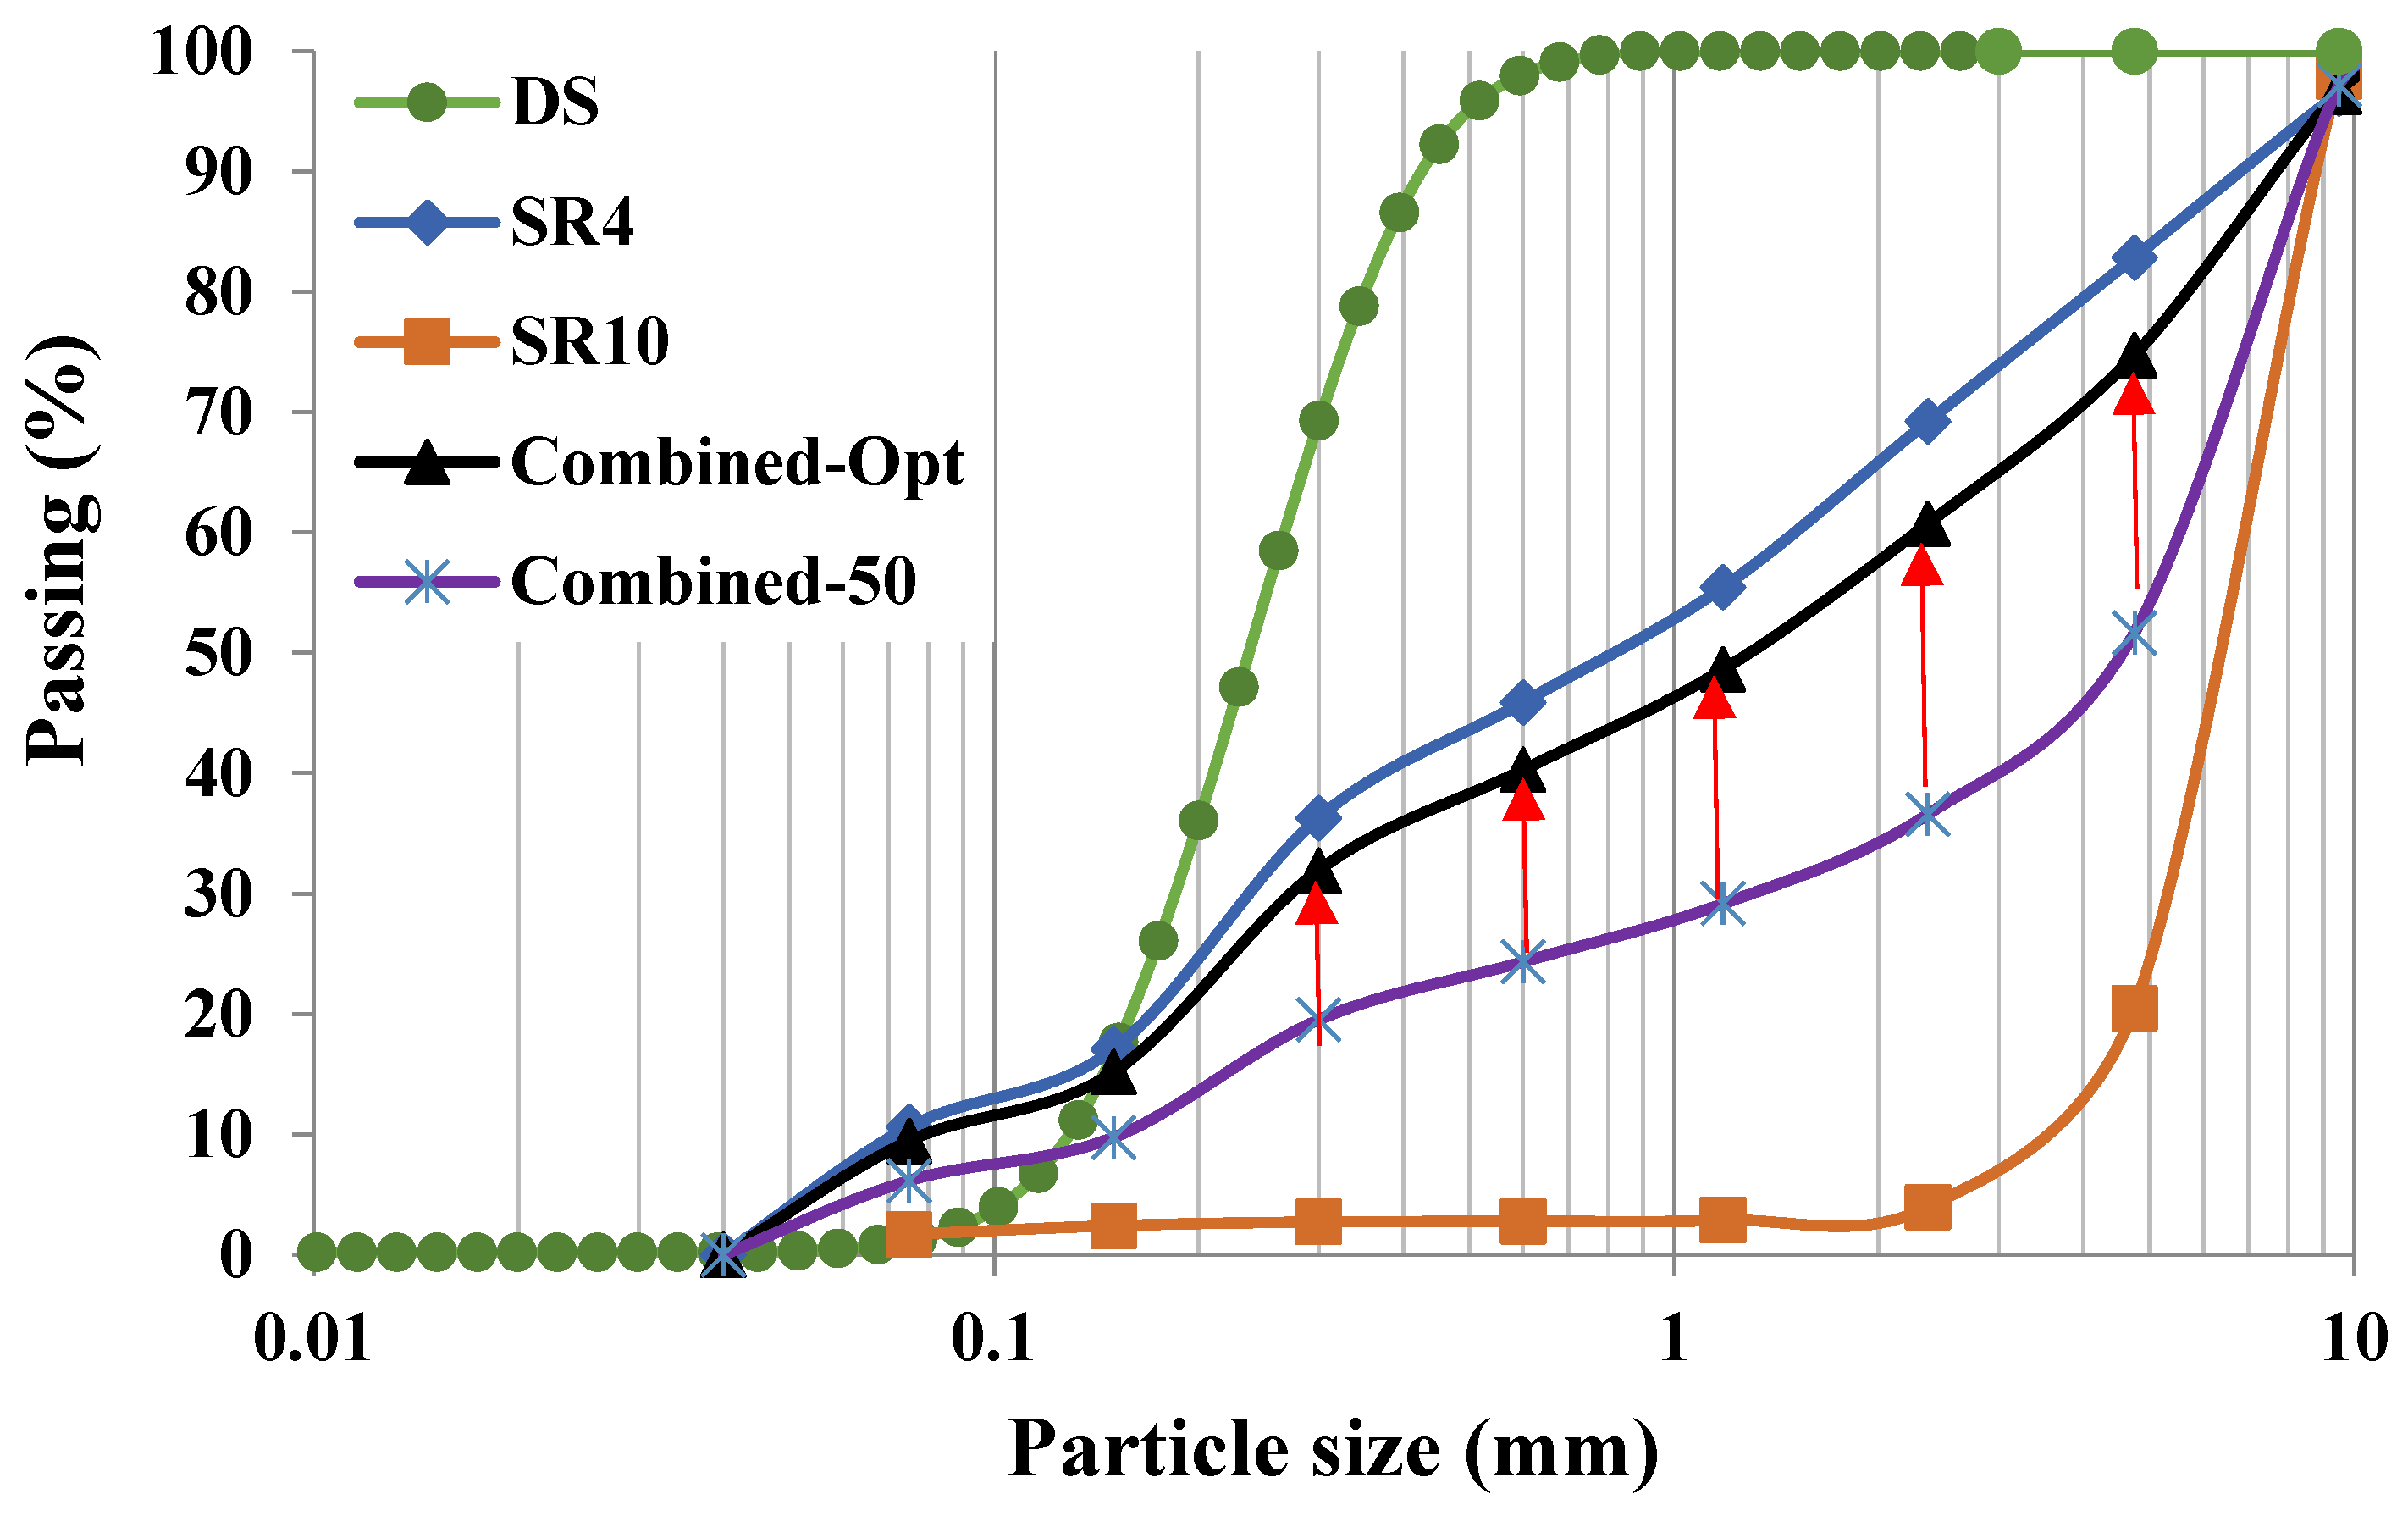
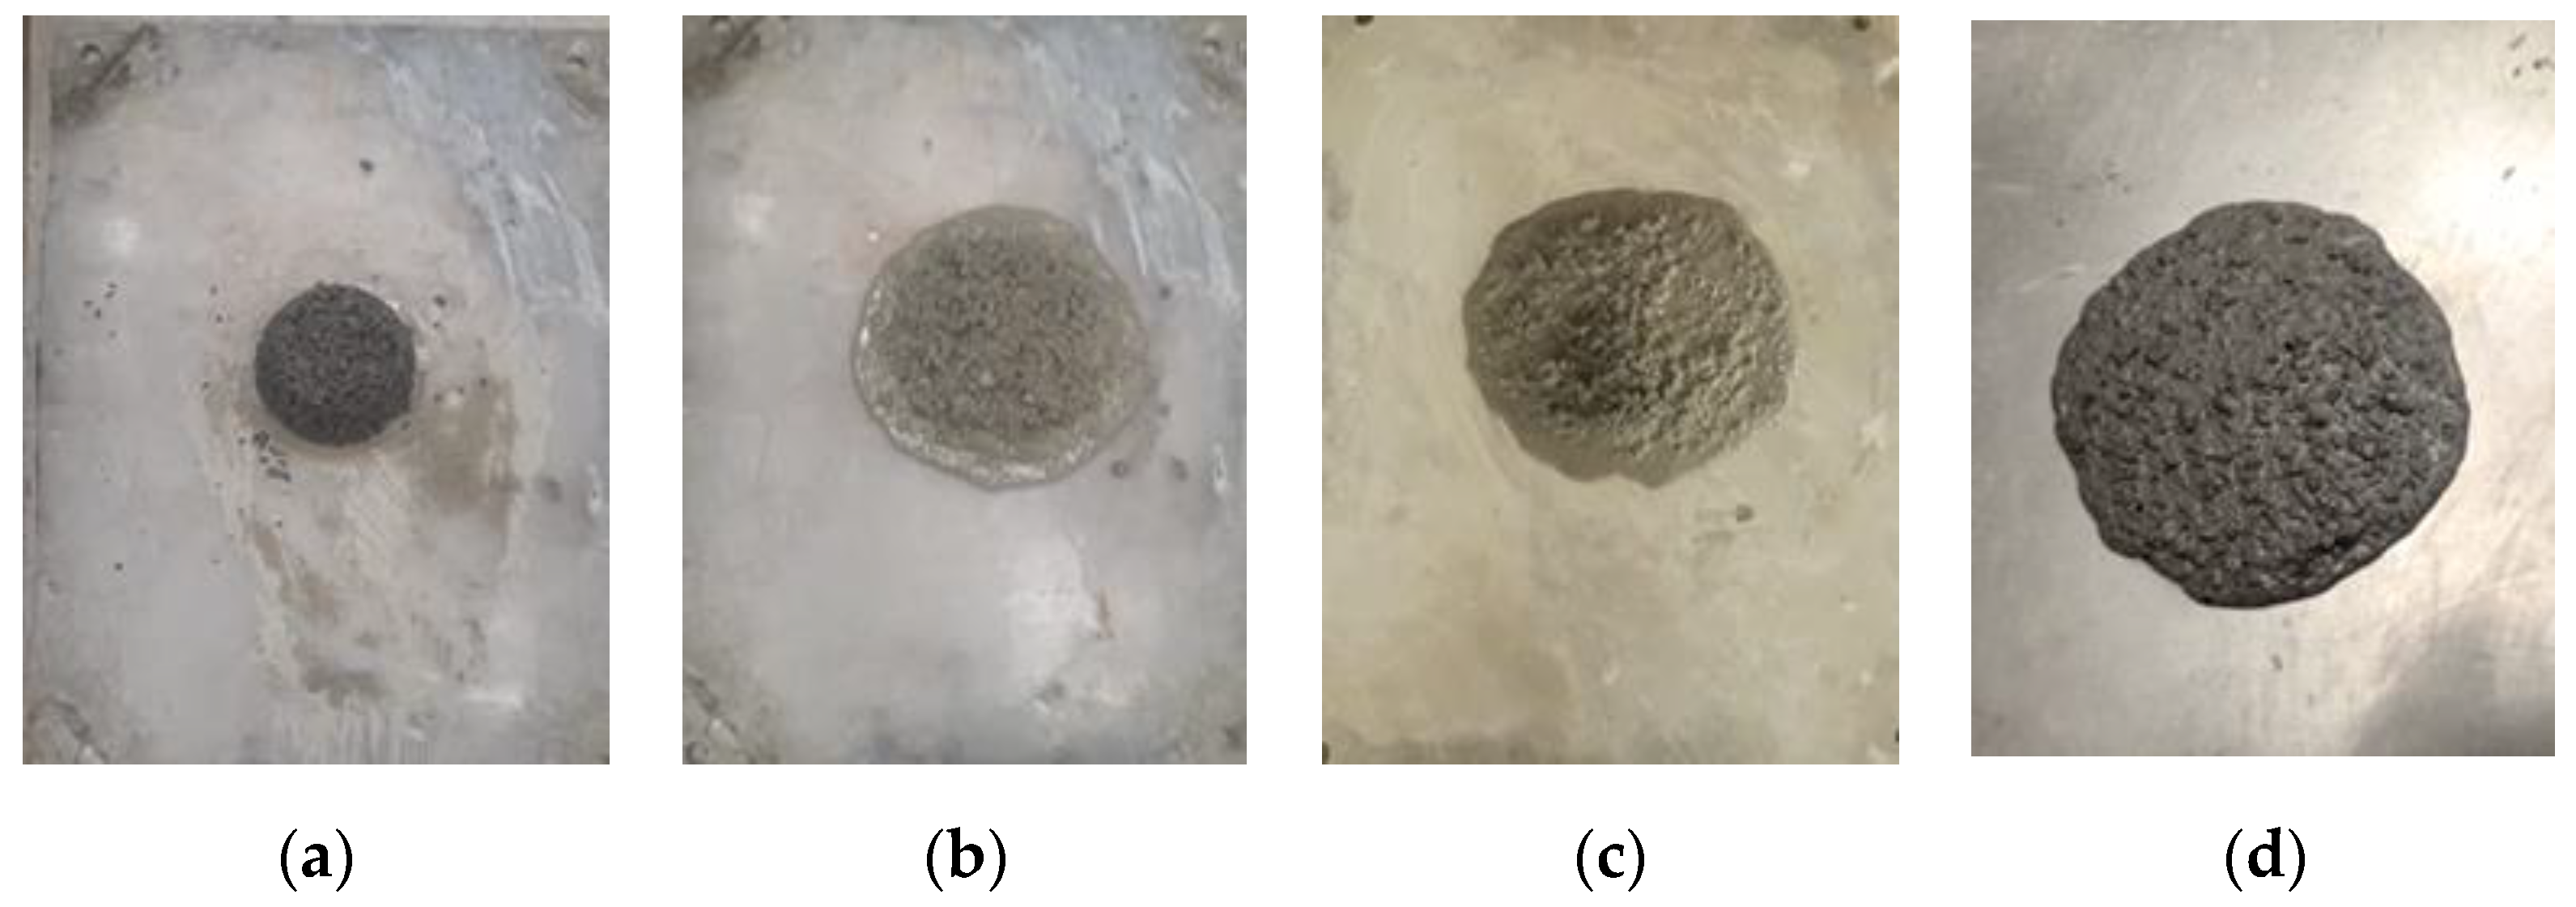
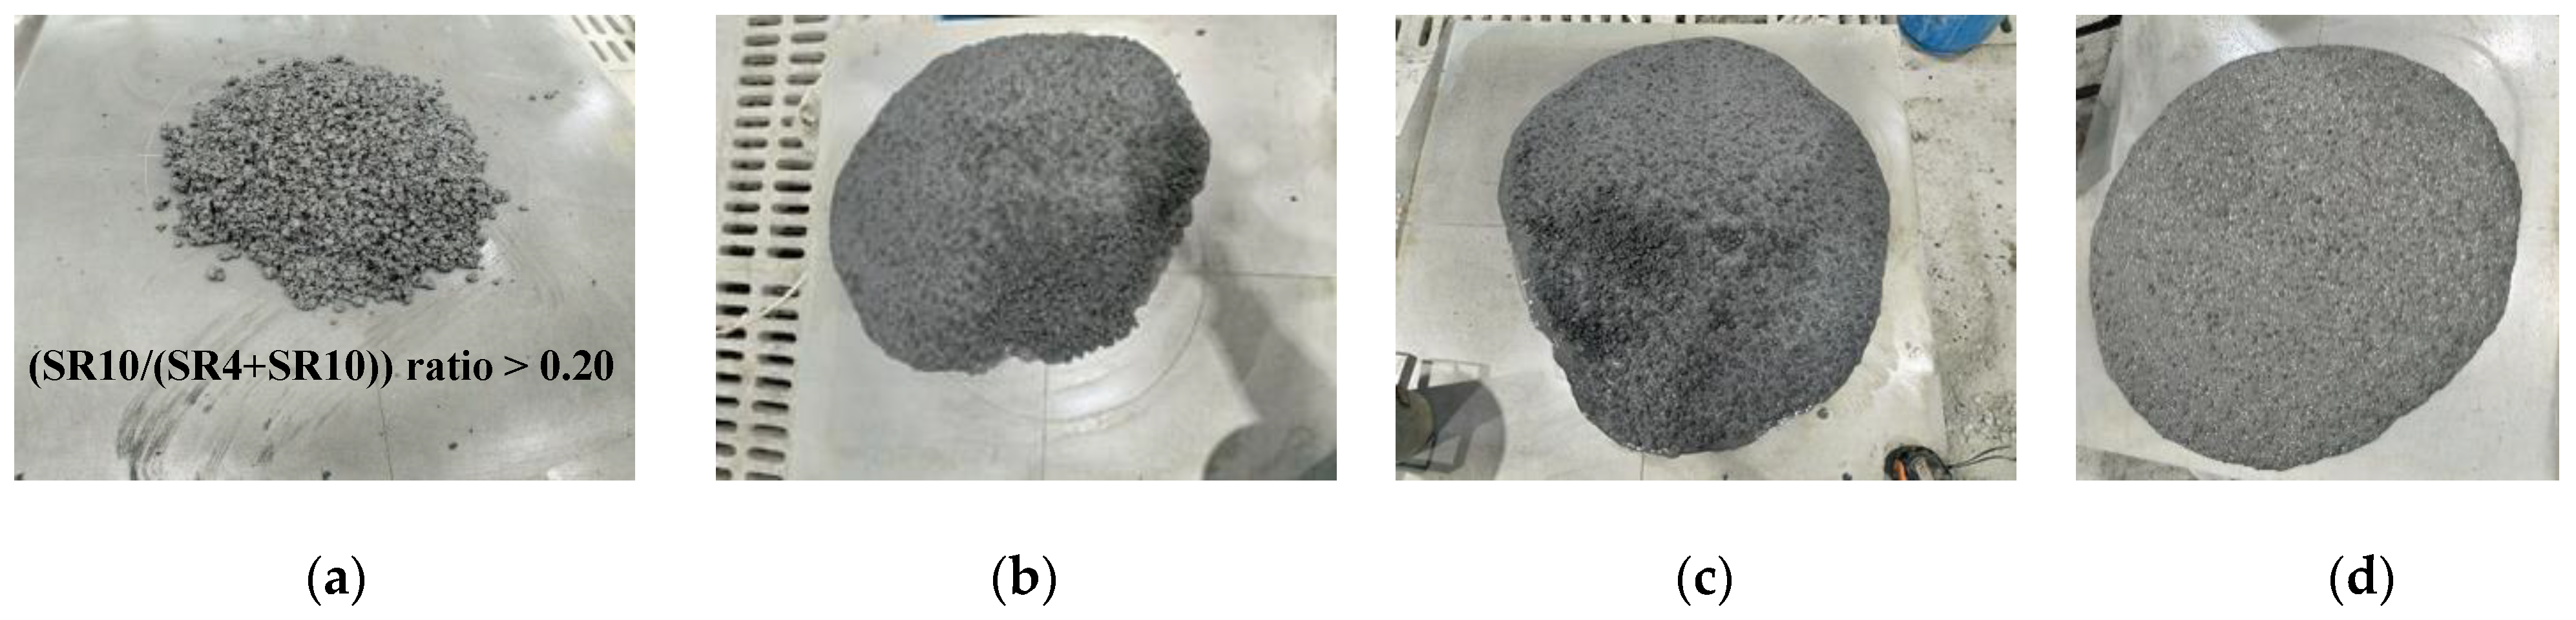
3.3. Effect Coarse-to-Total Aggregate Ratio on Flowability
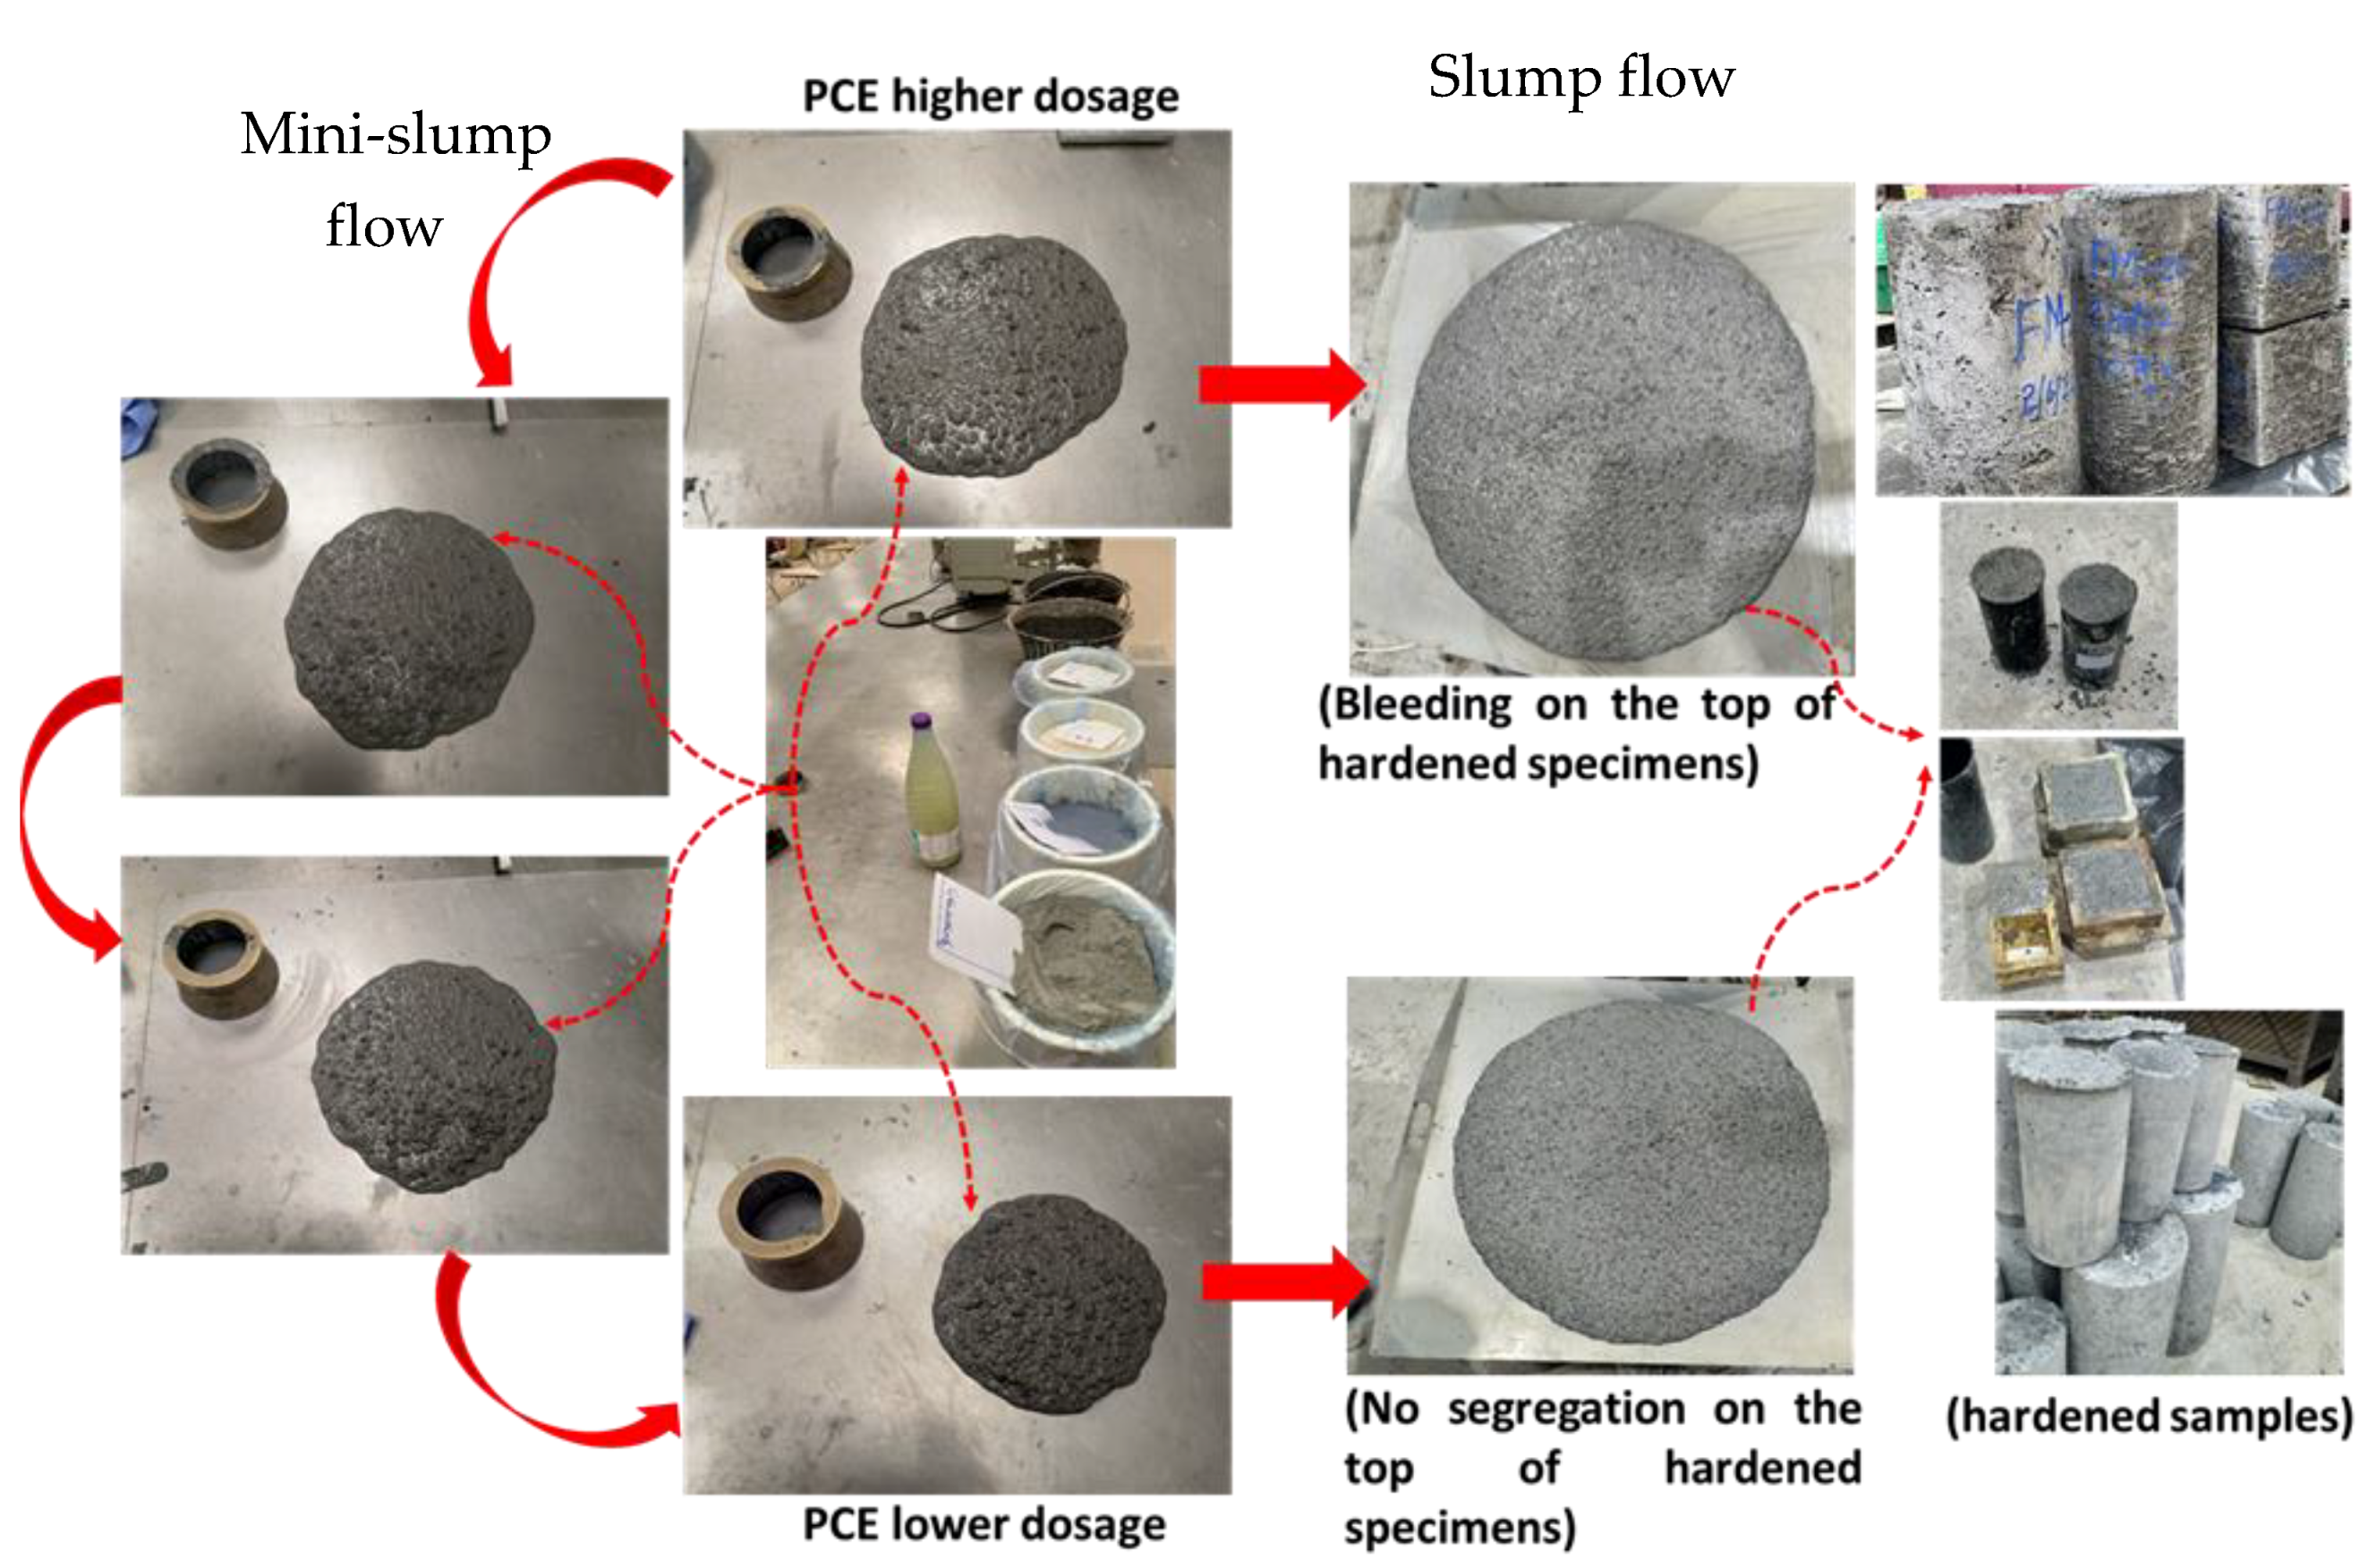
3.4. Adjusting Superplasticizer Dosage
3.5. Final Mix
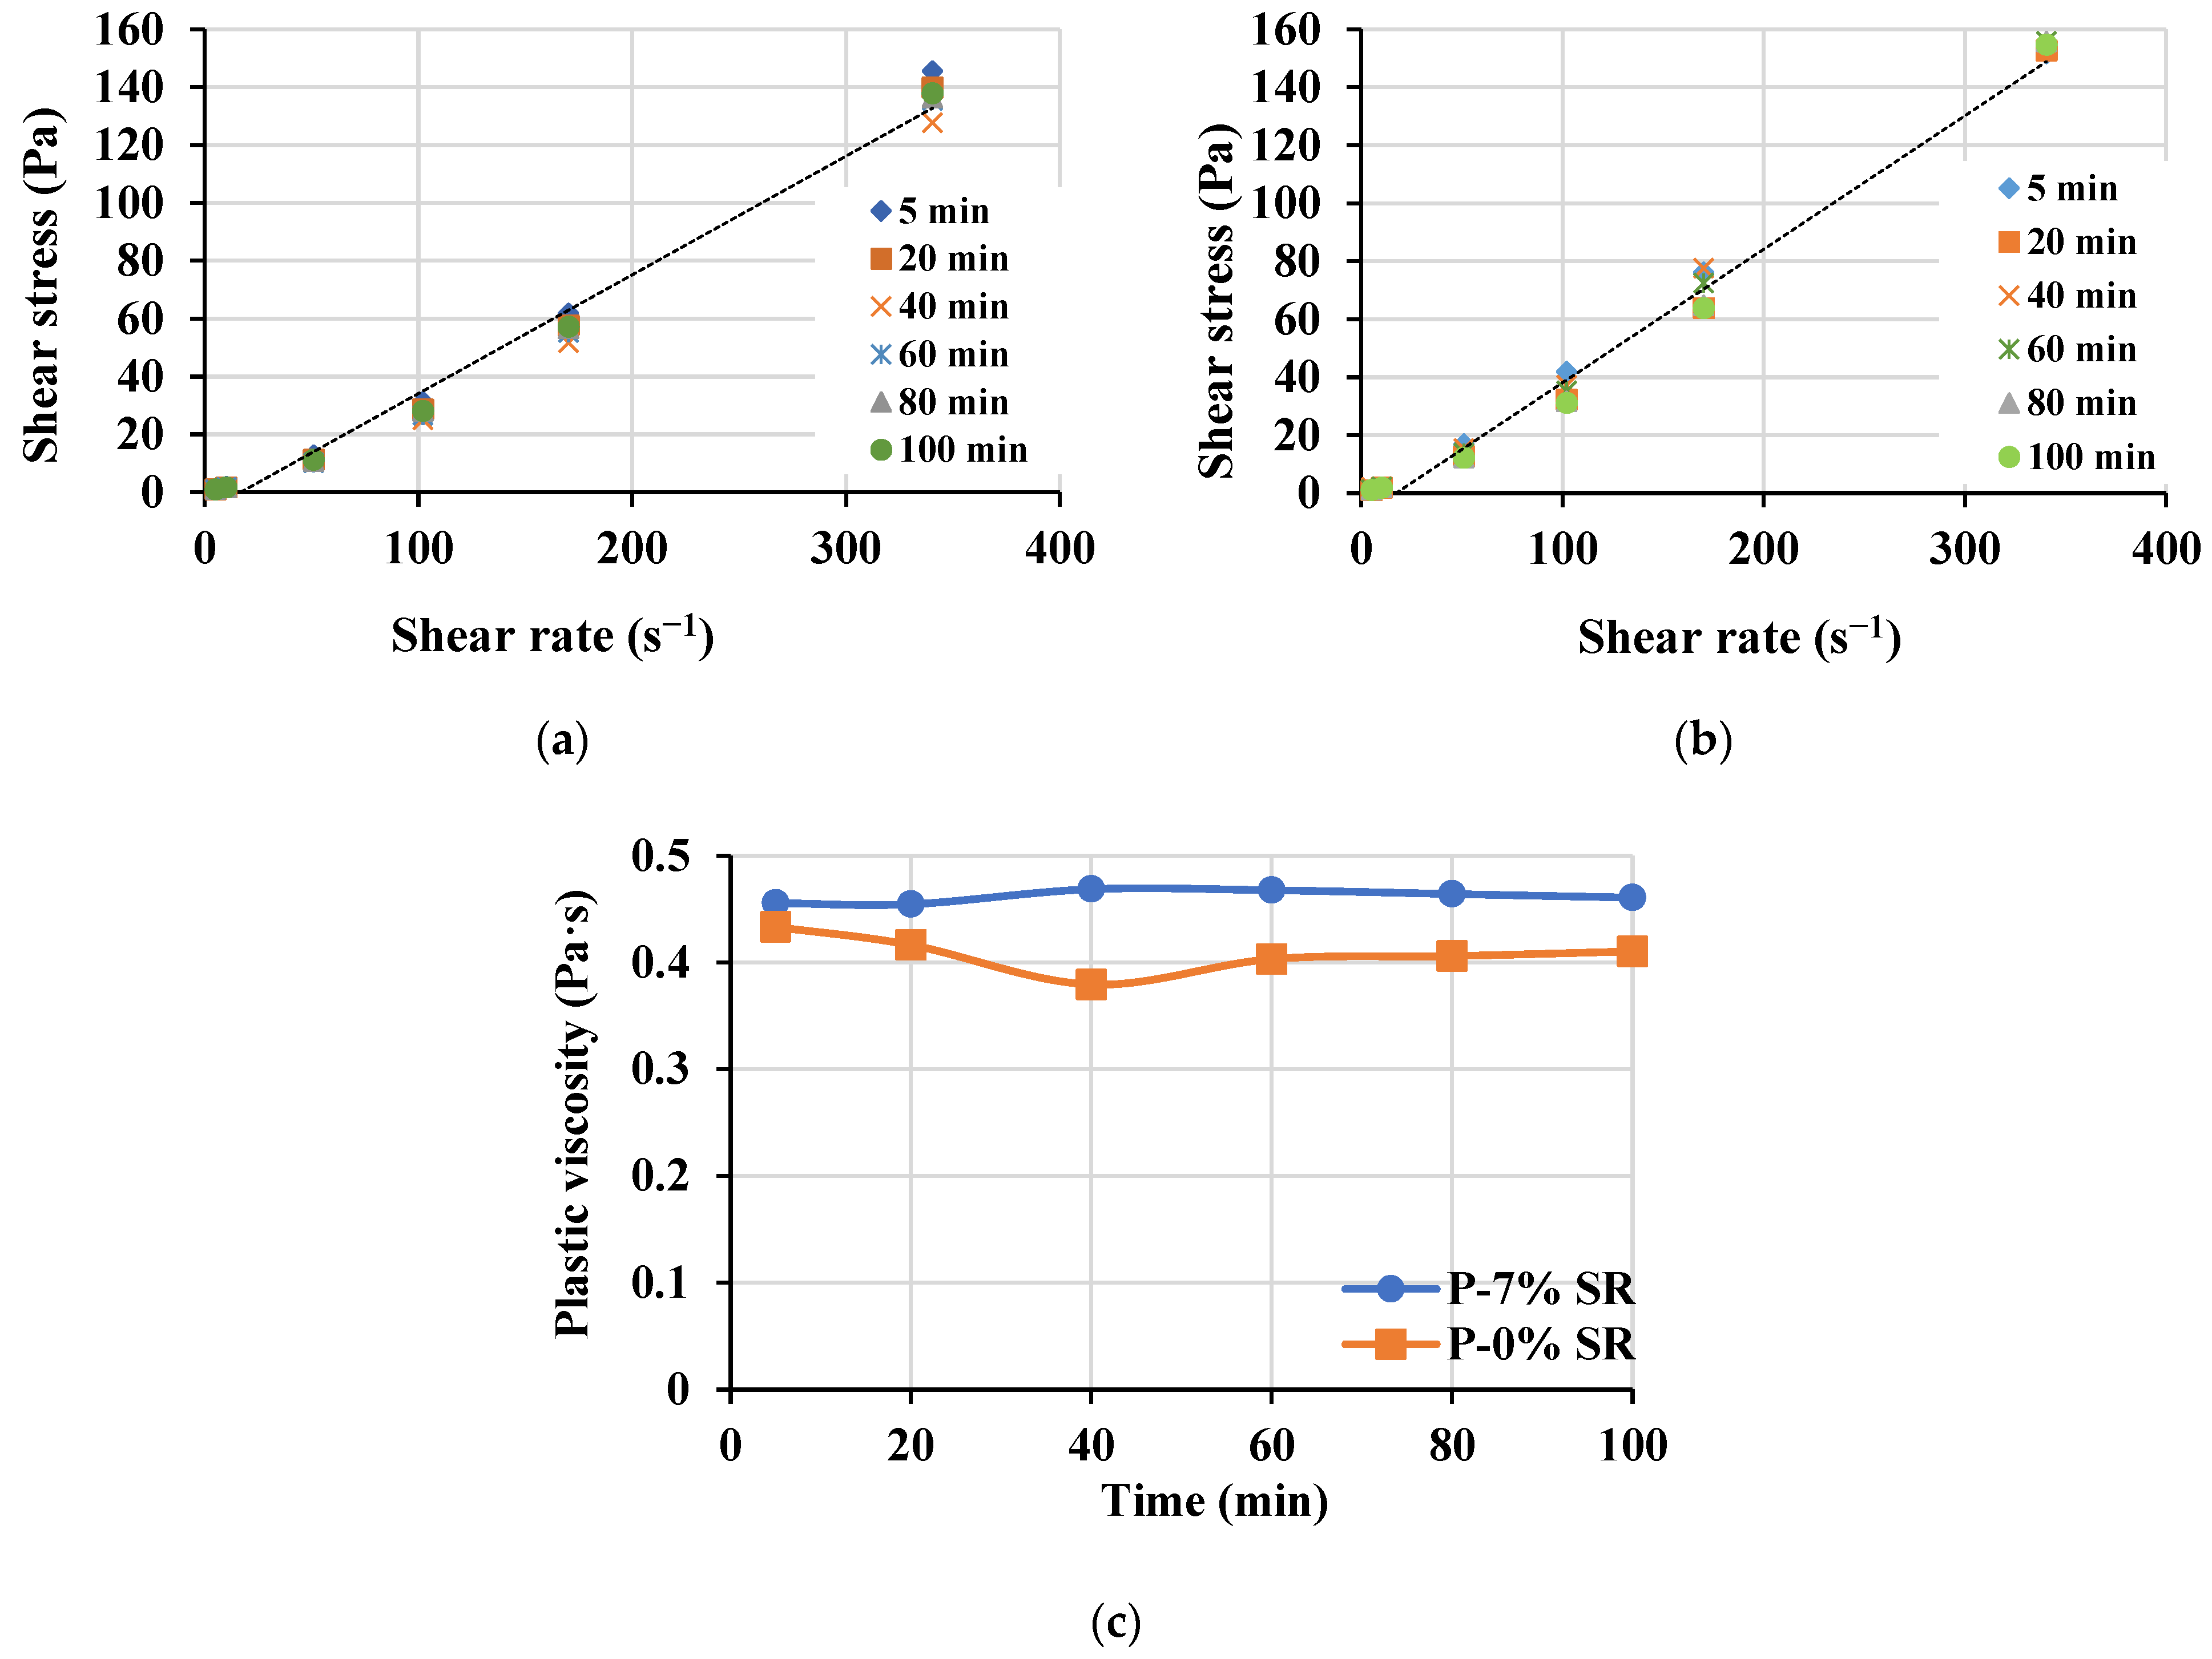
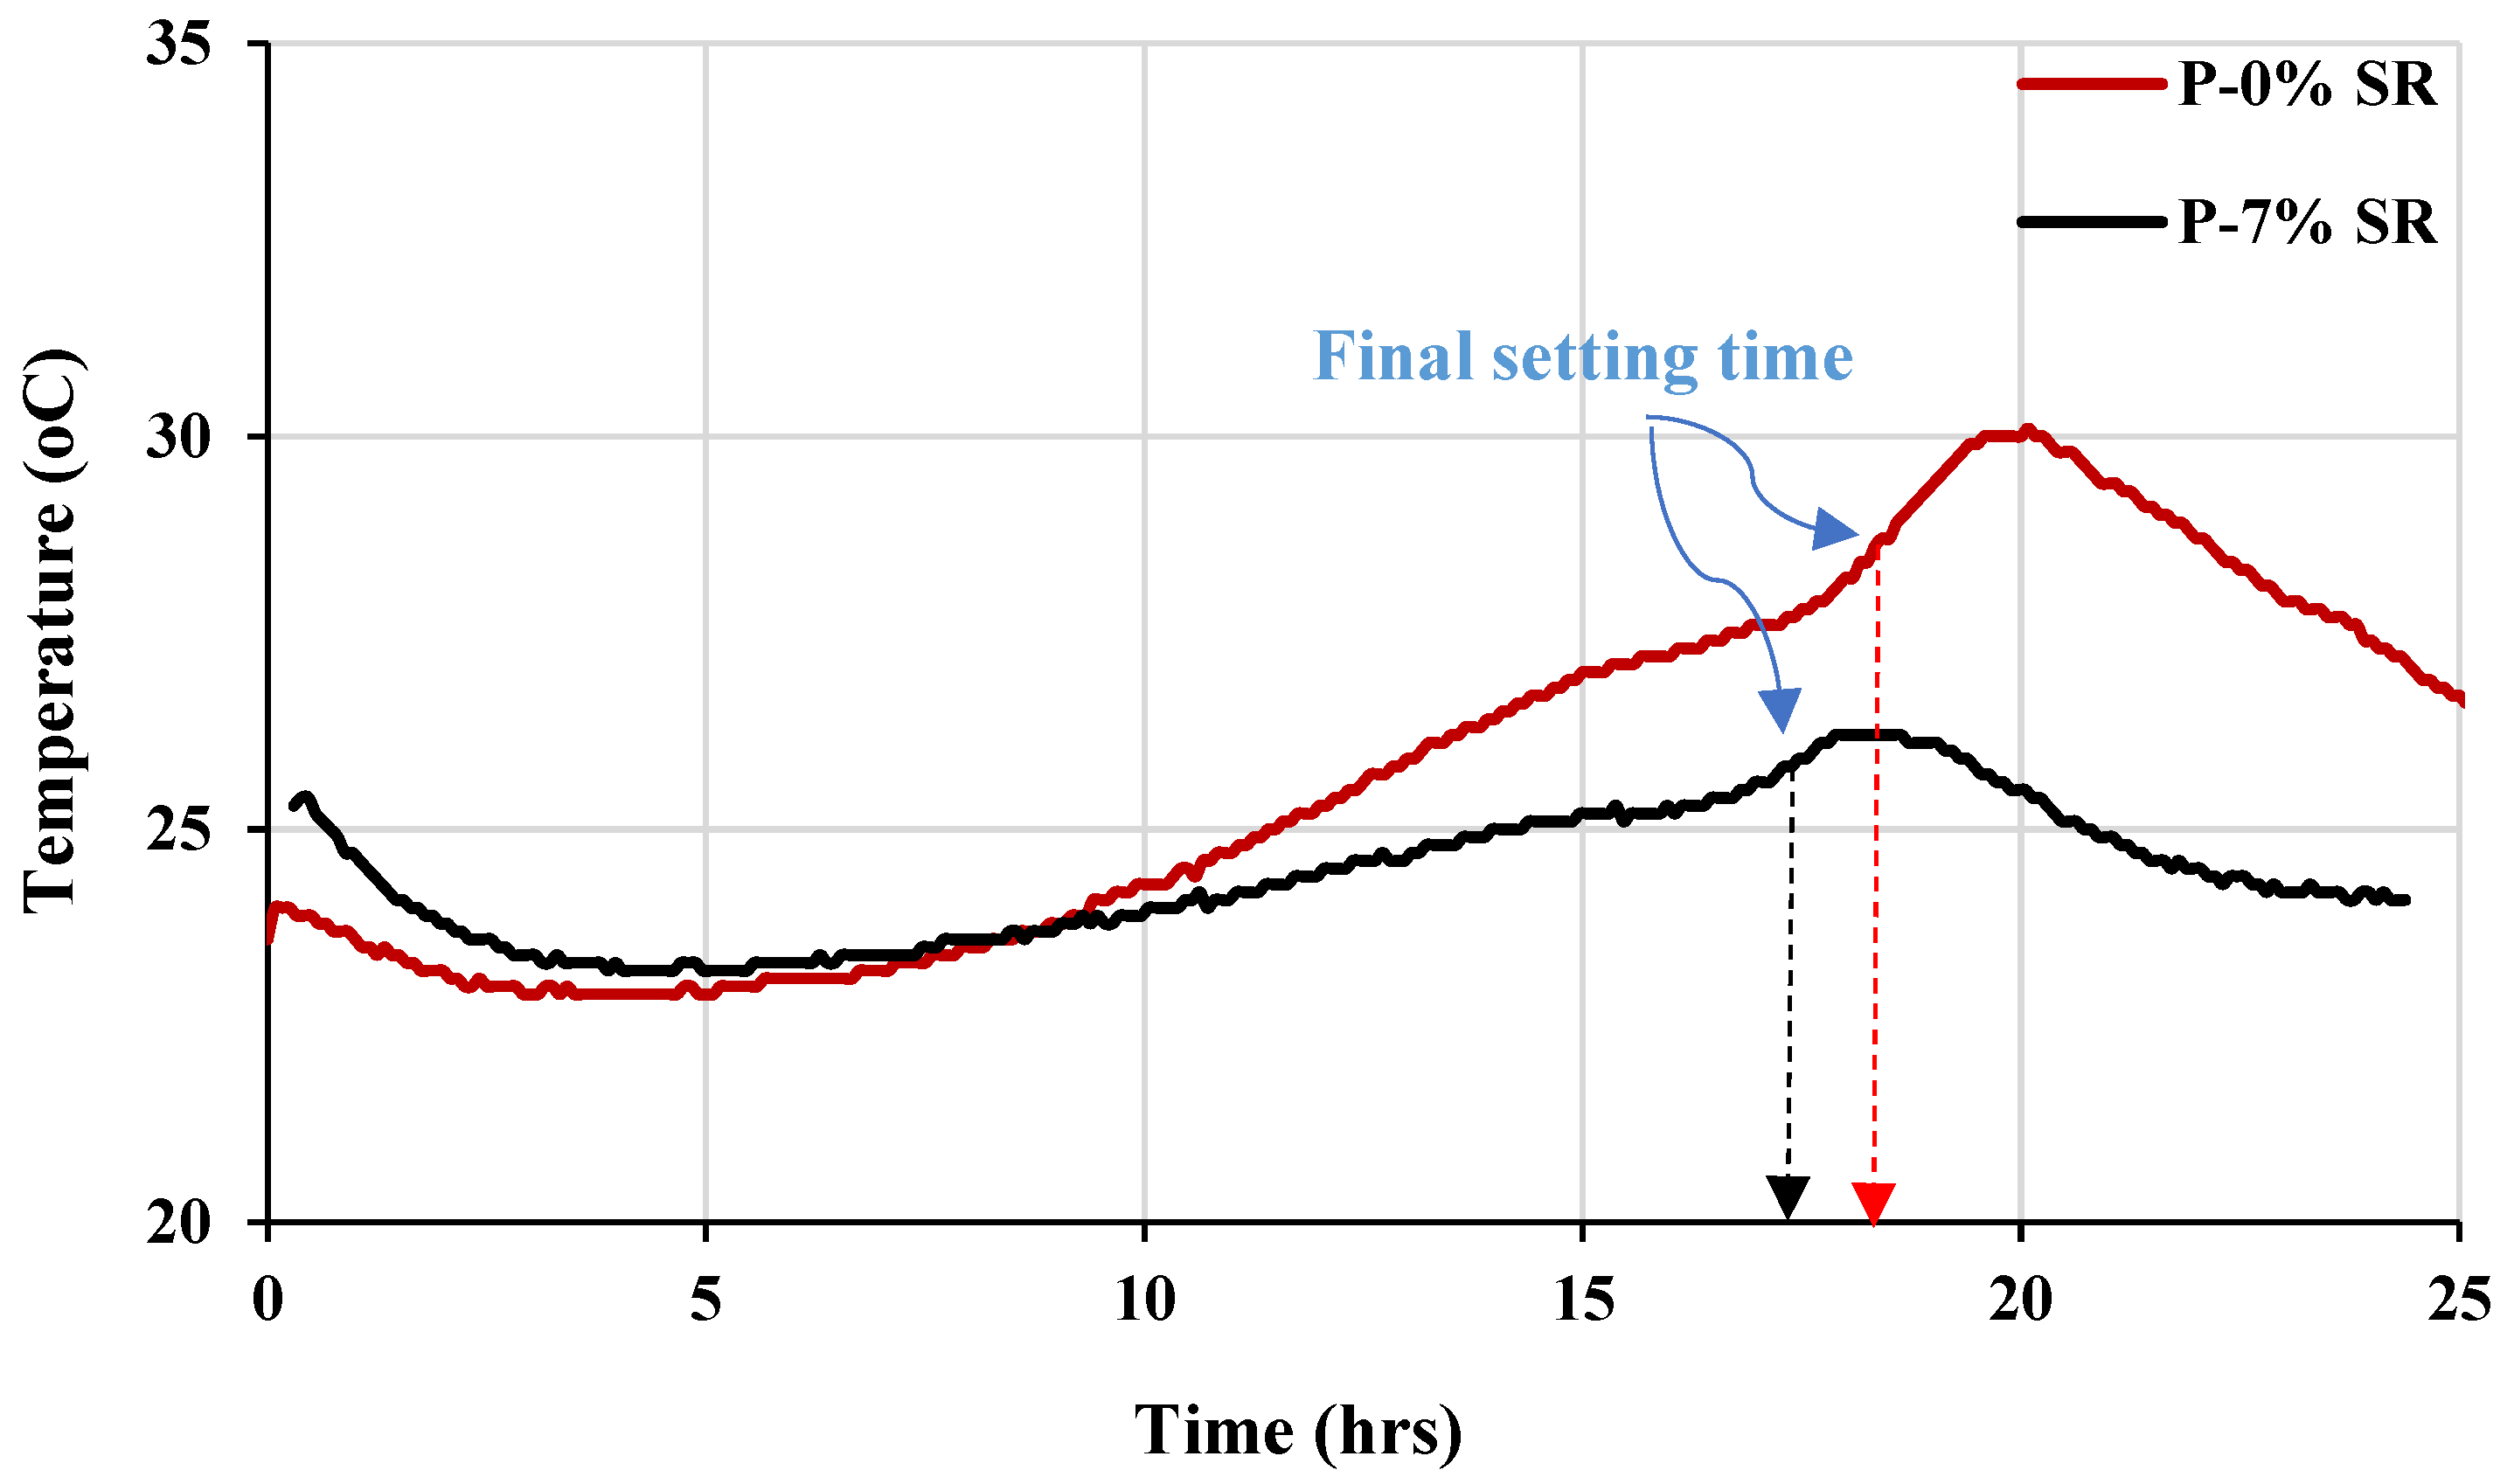
3.5.1. Paste Composing LWSCC Mix
3.5.2. Final Concrete Mix
Fresh Properties
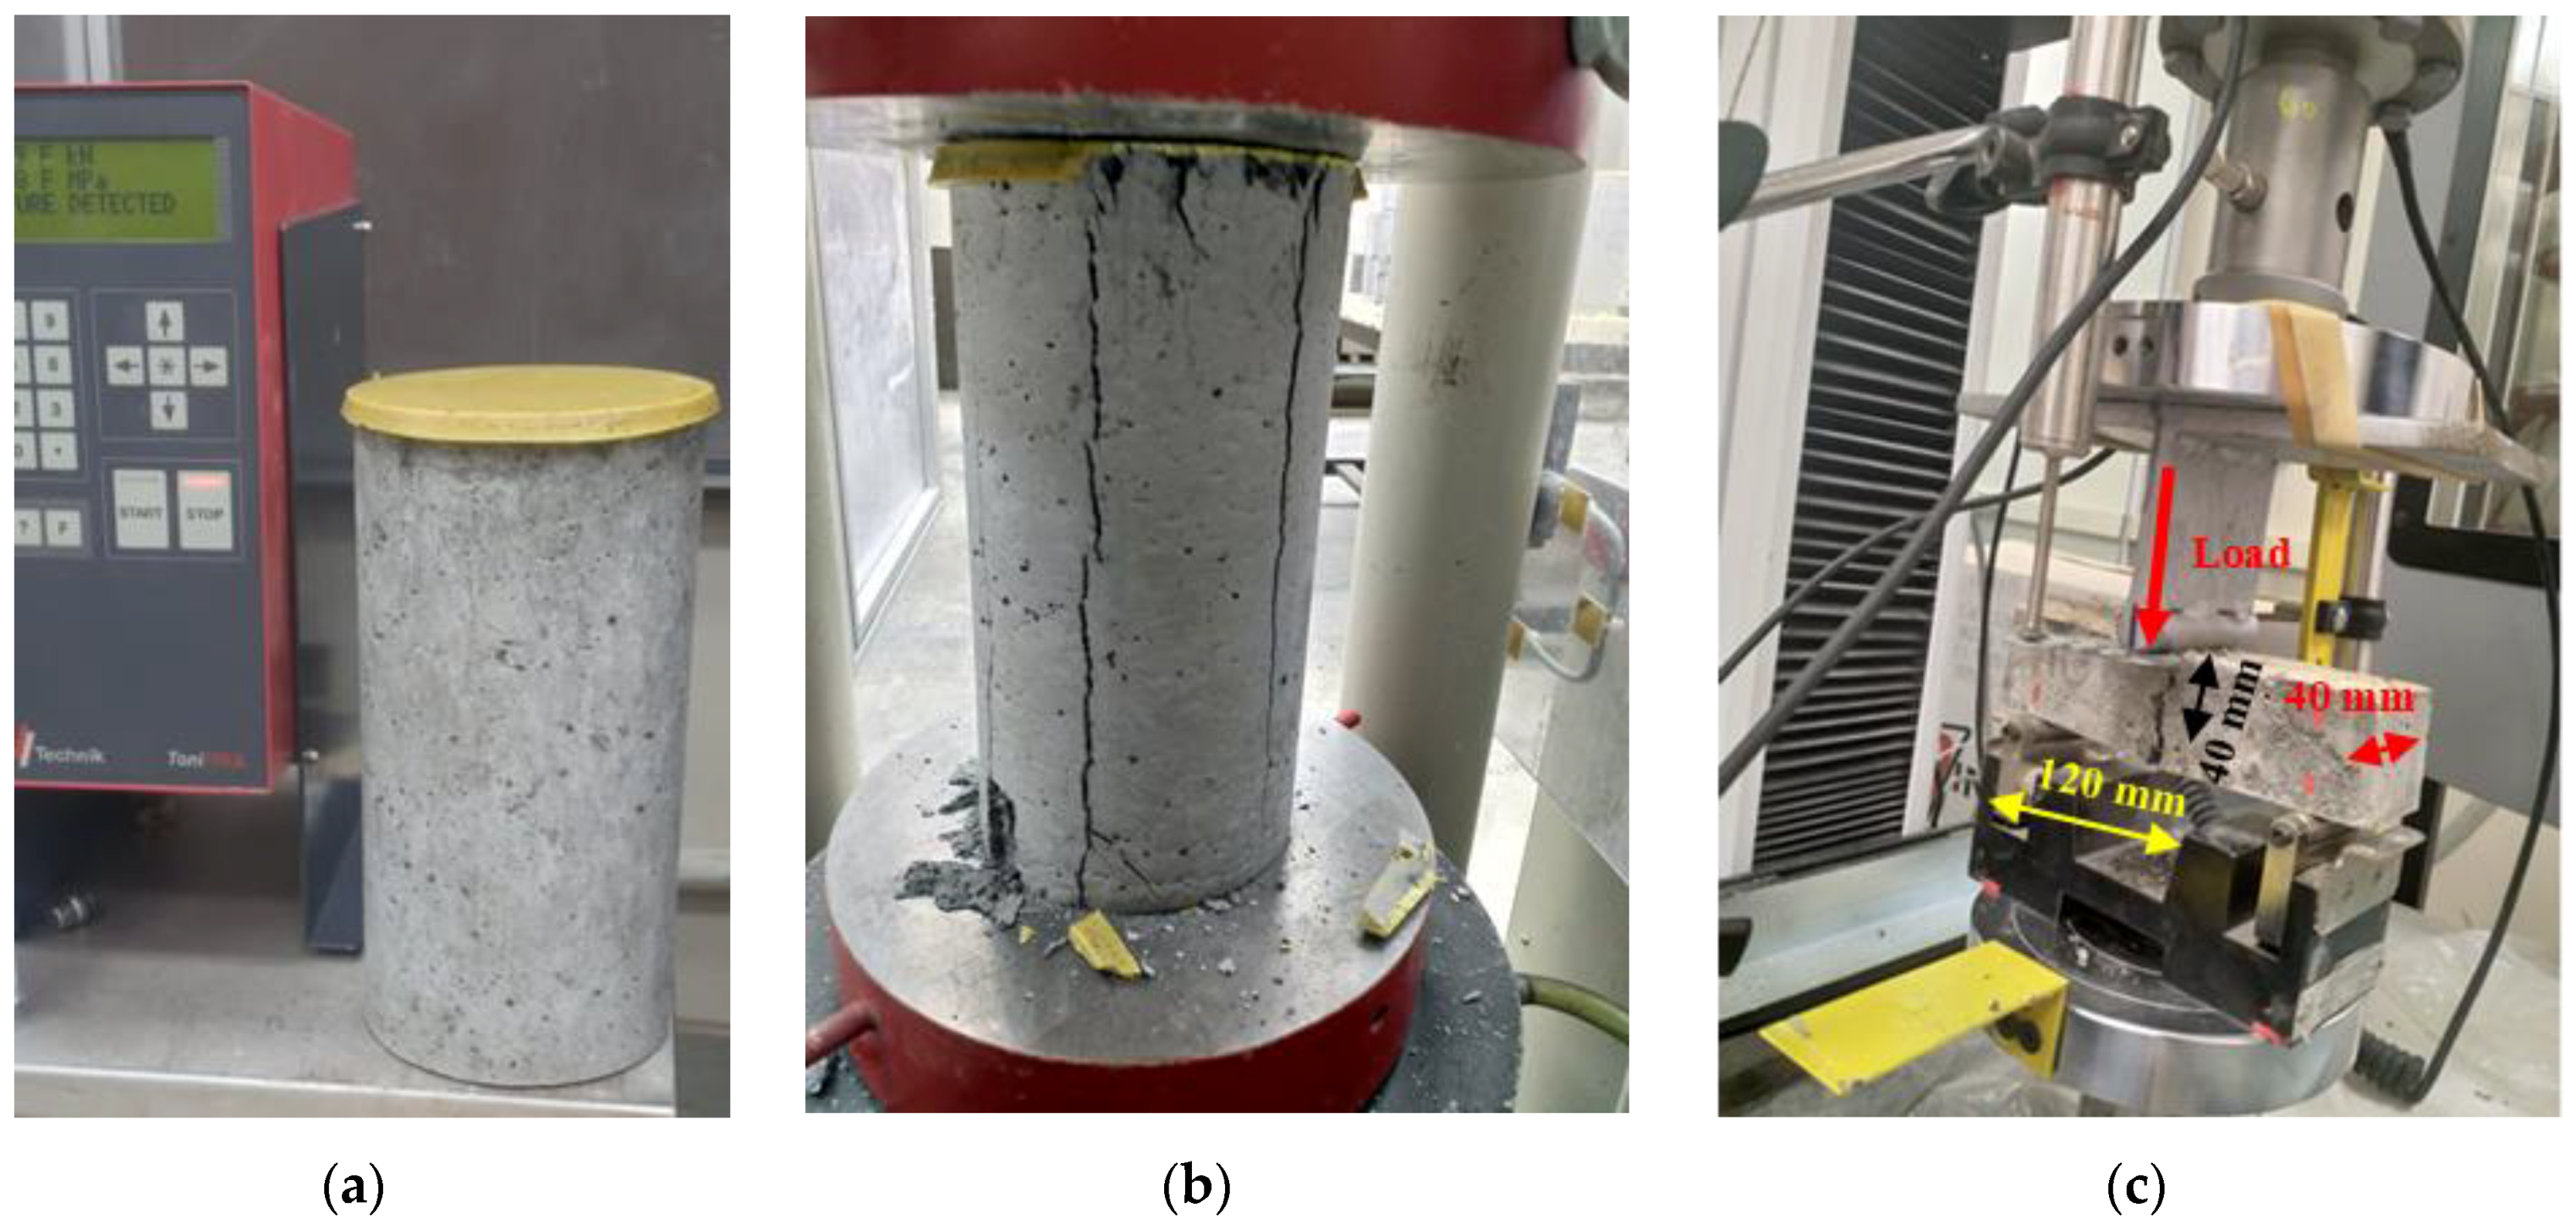
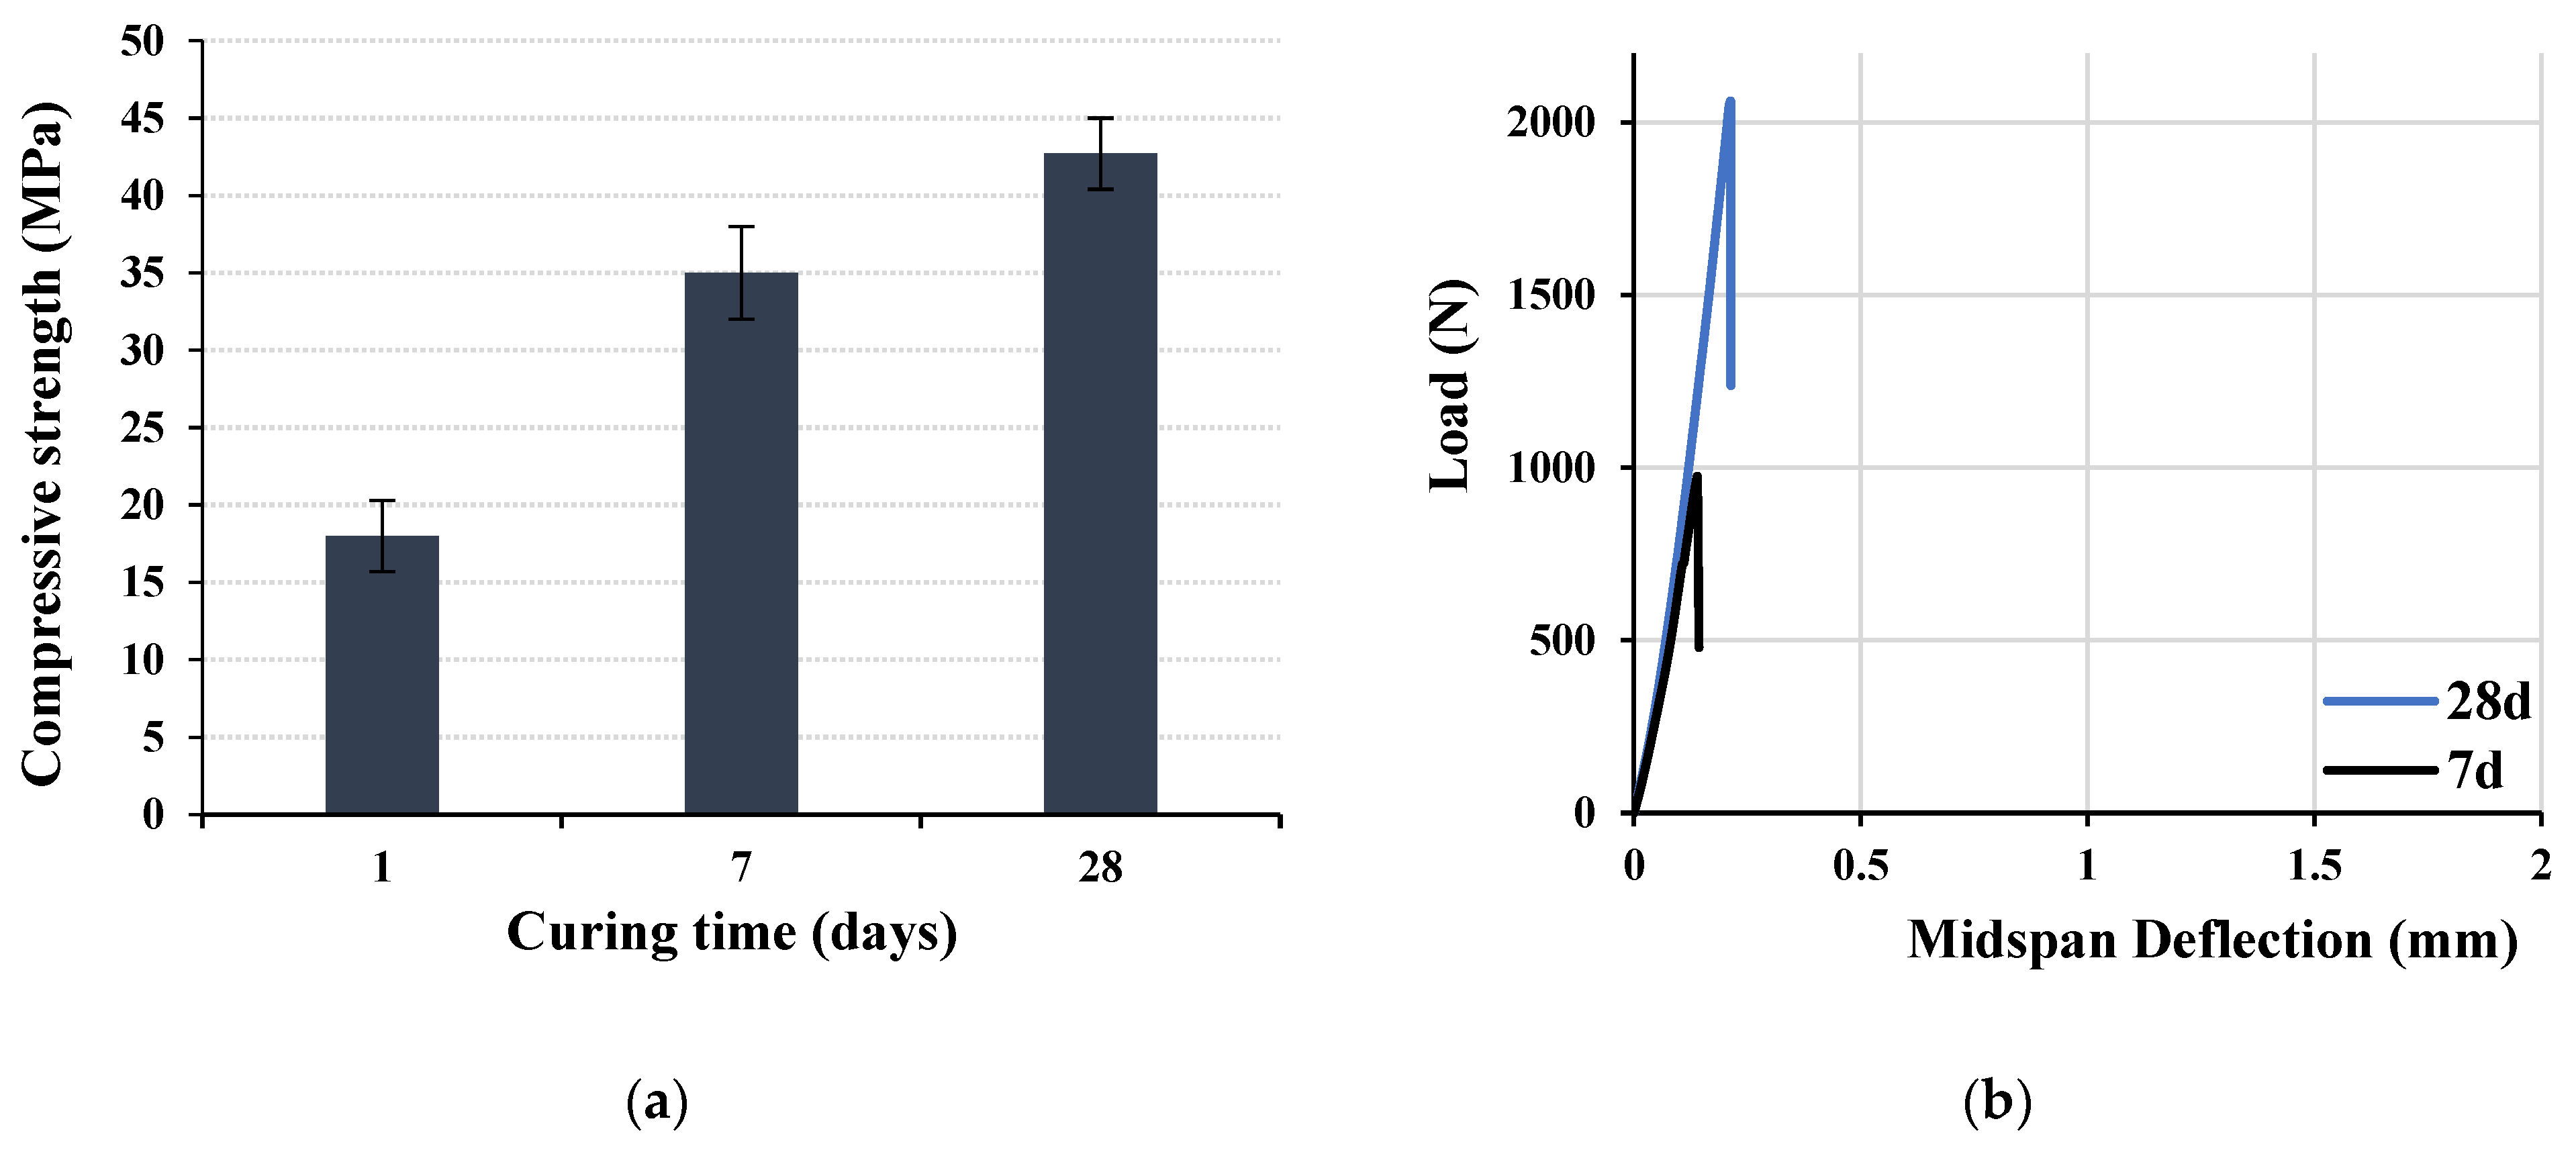
Hardened Properties
- Oven-dry unit weight
- b
- Compressive and flexural properties.
4. Conclusions
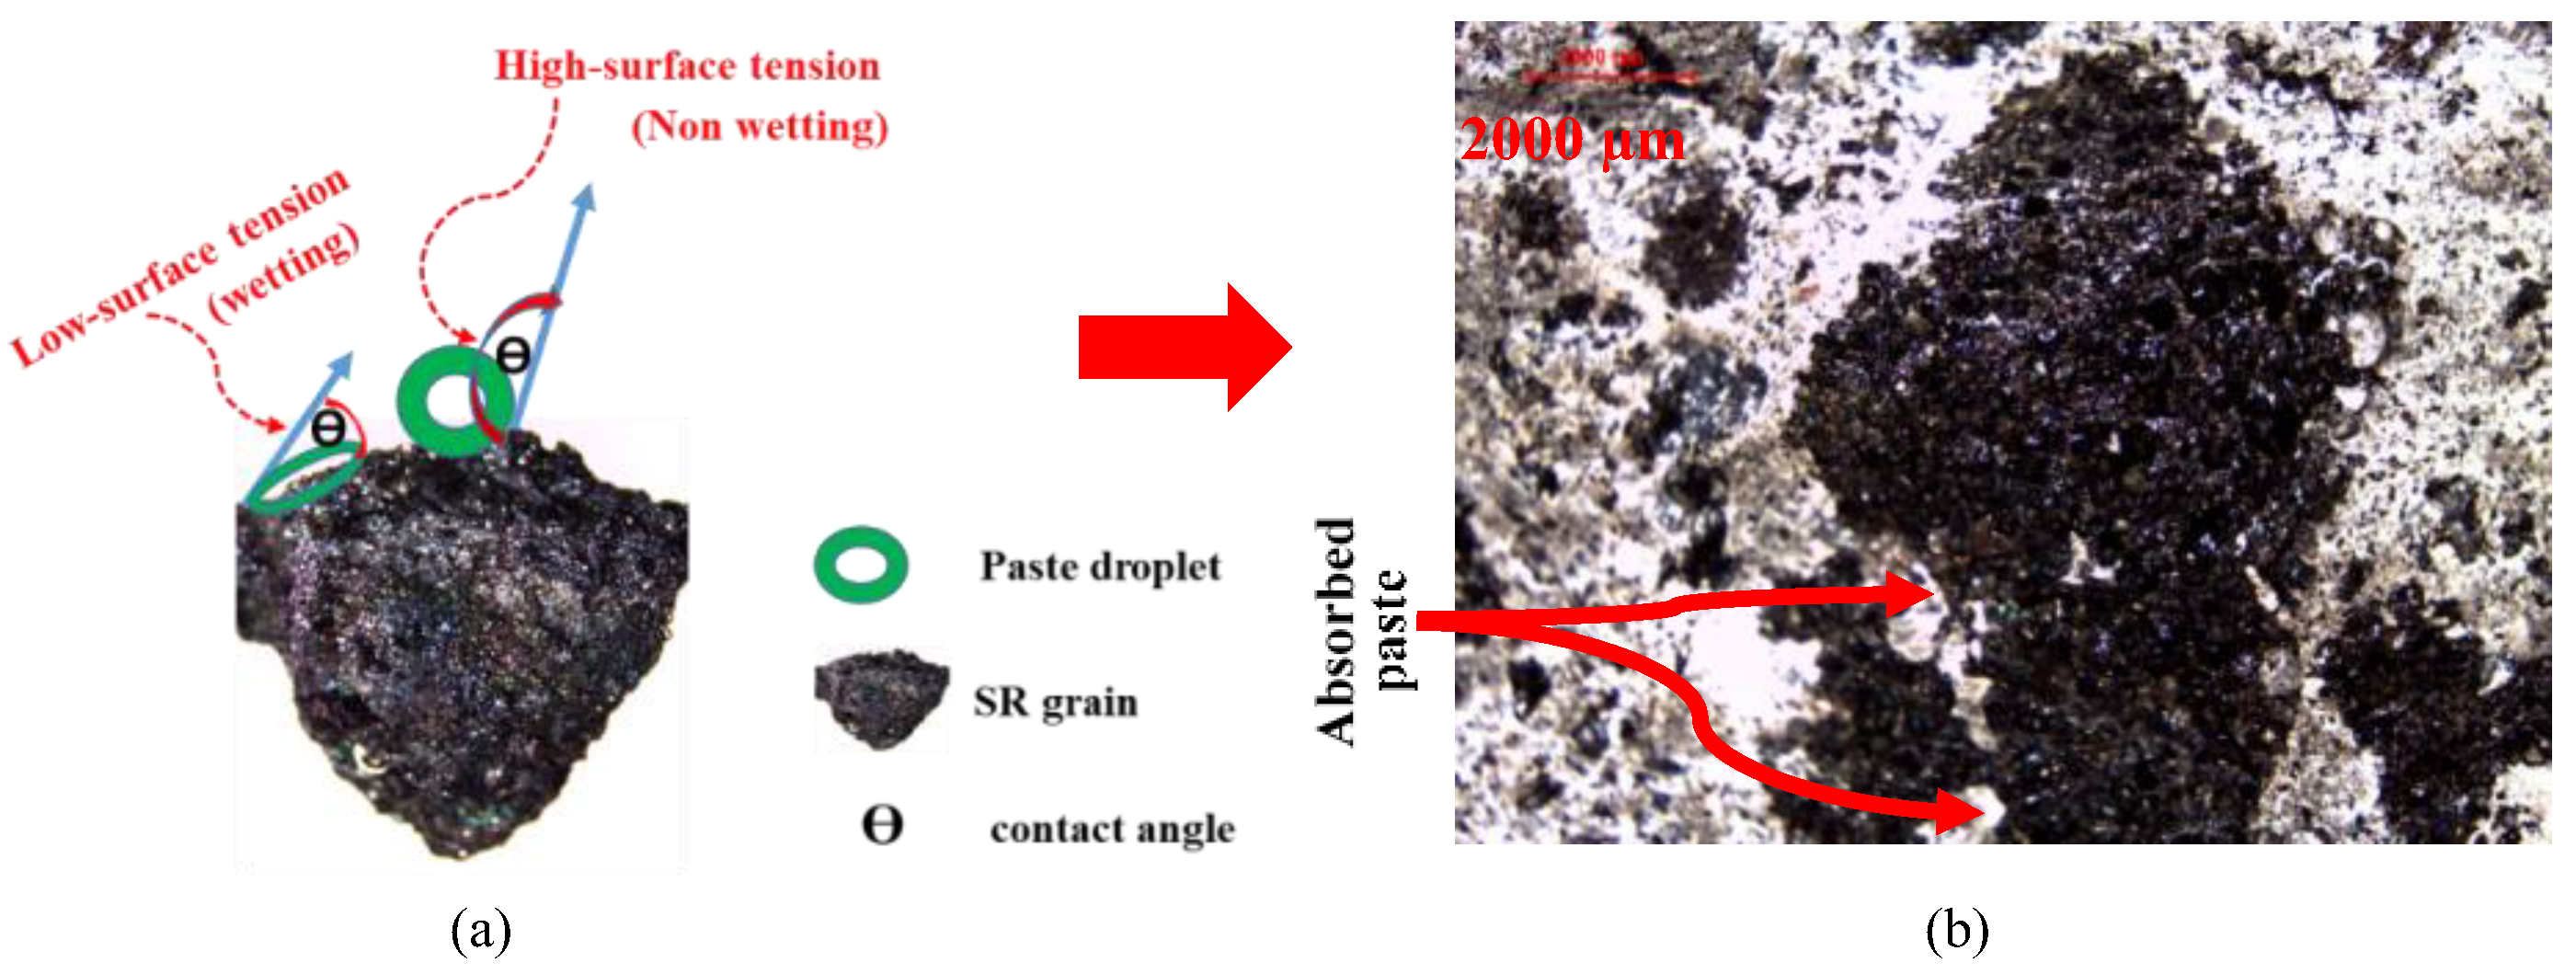
- The effect of the degree of absorptivity of lightweight aggregates on mixing water becomes critical in the case of using 100% scoria aggregates. For this reason, a special mixing sequence of adding lightweight aggregates to already-prepared cement paste to increase viscosity and prevent water absorption from the mix was initiated and investigated.
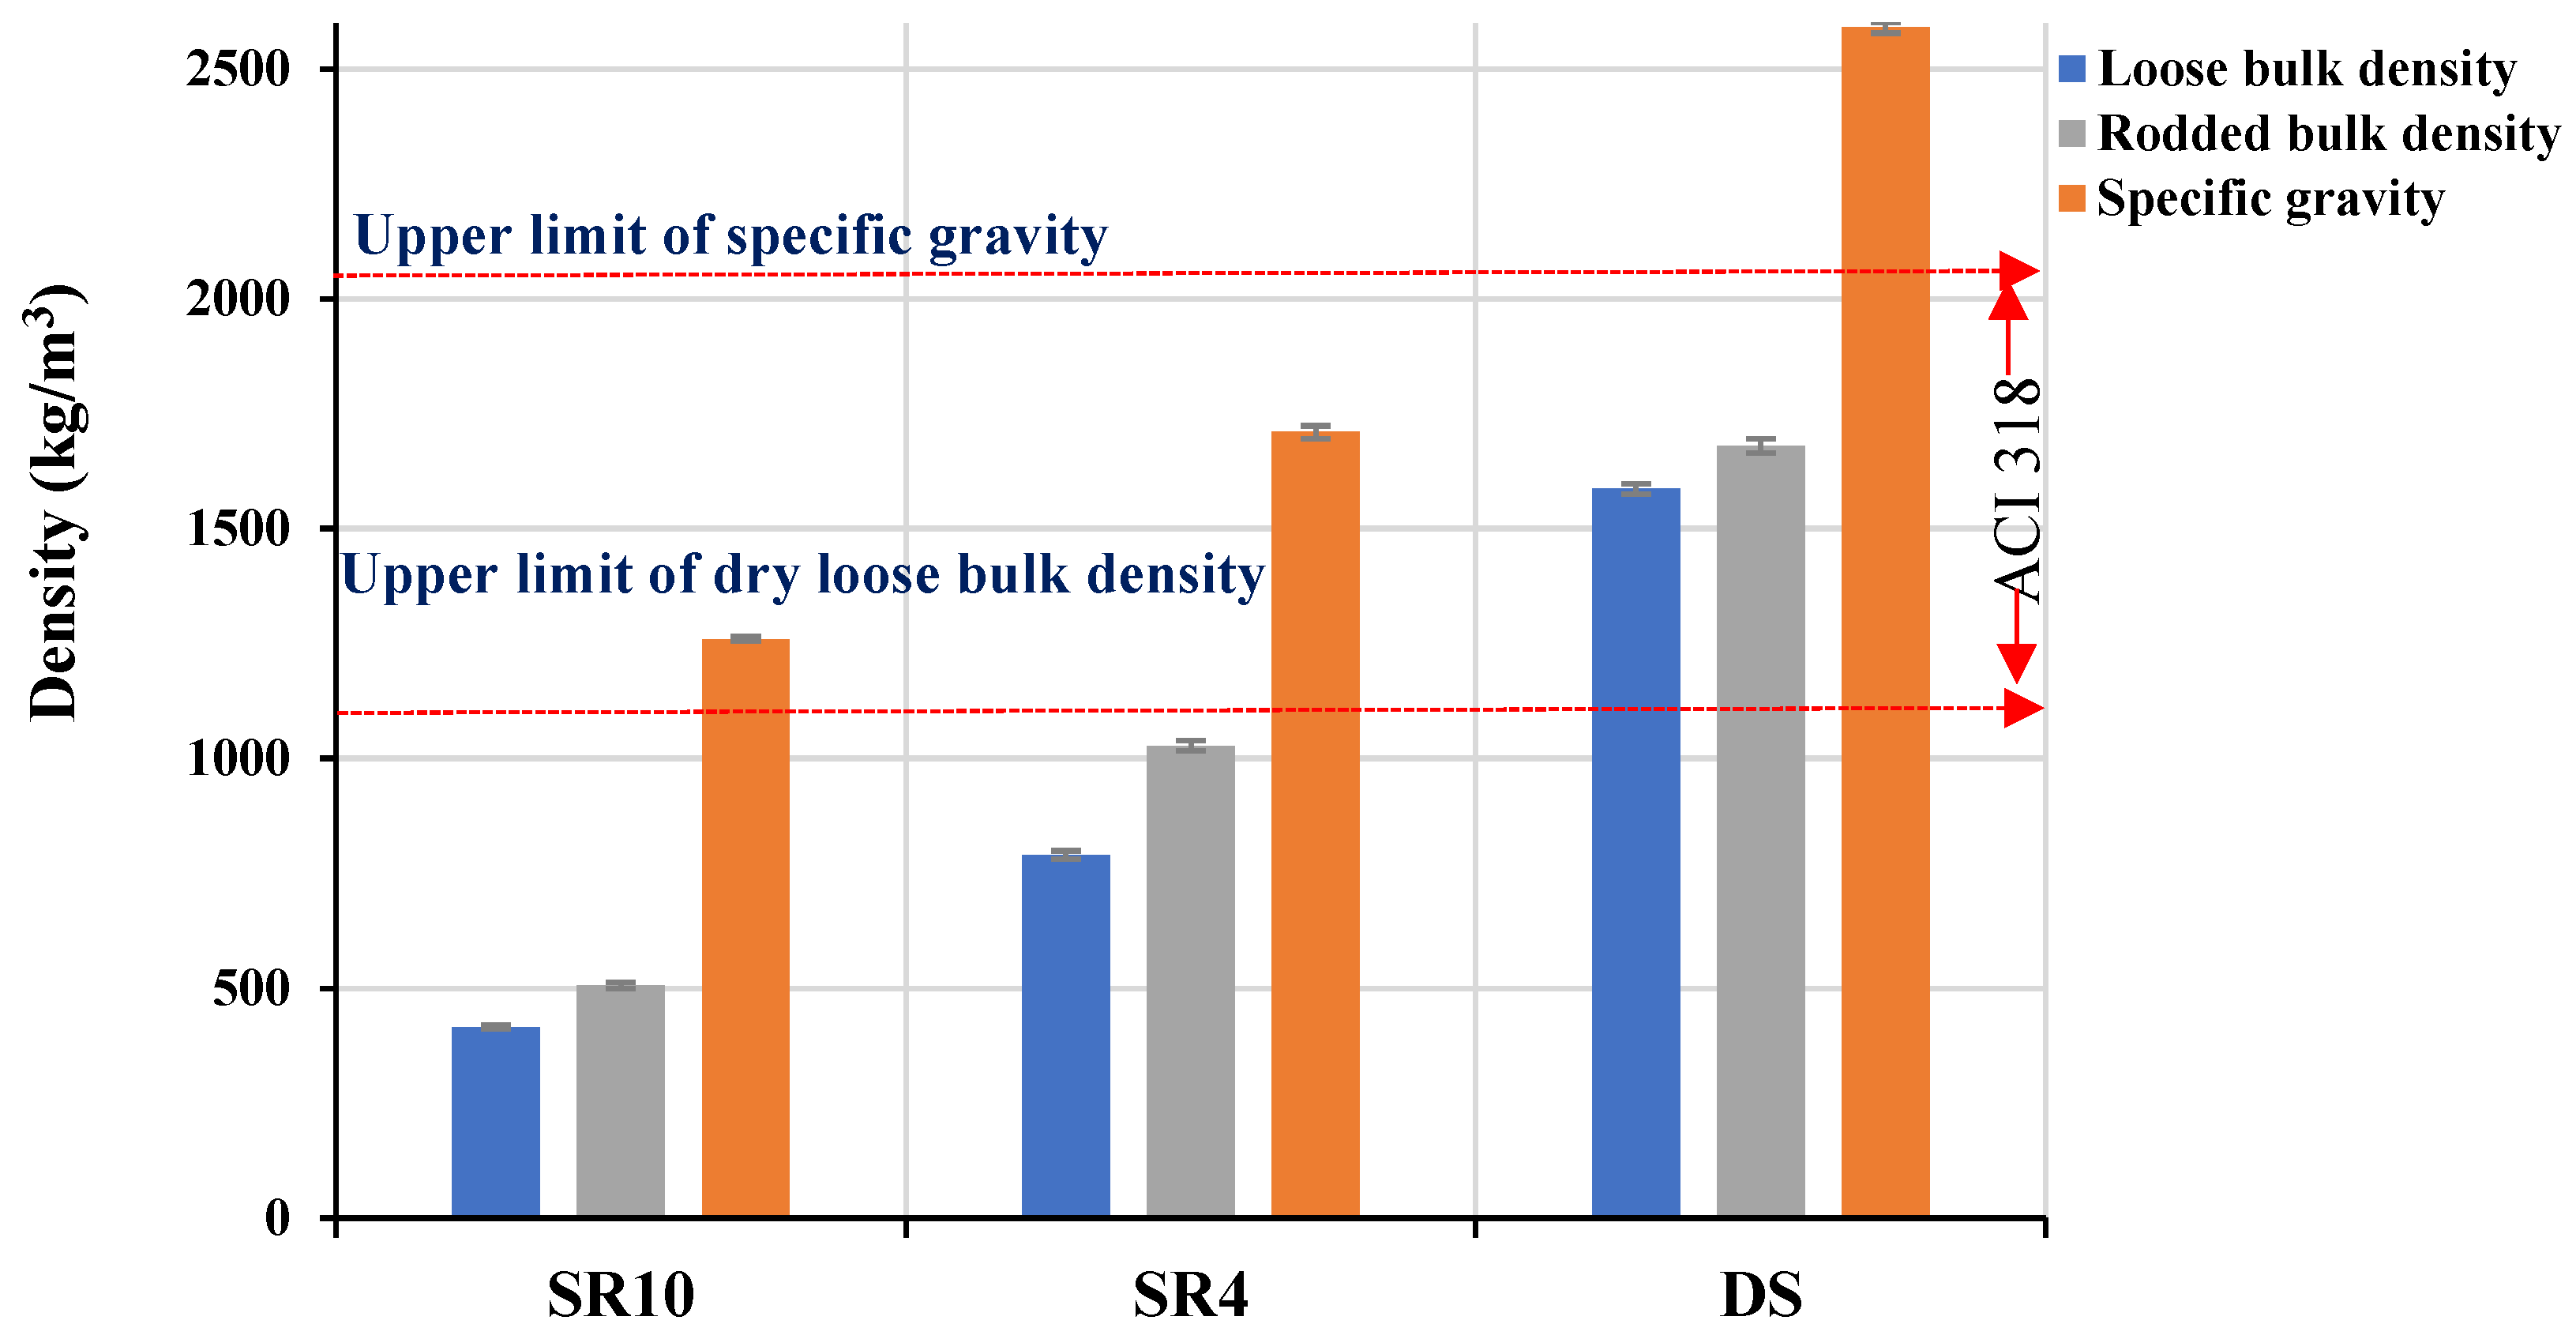
- The presence of DS increases the compactness of the mix due to the spherical nature of its grains and consequently increases the unit weight to pass over 1900 kg/m3.
- The effect of different coarse aggregate-to-total aggregate ratios (R = SR10/(SR4 + SR10)) was shown to be critical, with an optimum ratio of 0.125 that delivered a successful LWSCC mix.
- The final LWSCC mix could be categorized as low-cement concrete with acceptable fresh, rheological, and hardened properties both in the paste and concrete phases.
- The modulus of rupture of 6.2 MPa encourages proceeding with investigating and testing the developed LWSCC for structural applications.
- Finally, structural LWSCC can be obtained using 100% scoria aggregates.
5. Recommendations
Author Contributions
Funding
Institutional Review Board Statement
Informed Consent Statement
Data Availability Statement
Acknowledgments
Conflicts of Interest
References
- Guide for Structural Lightweight Aggregate Concrete; ACI 213R; ACI: Farmington Hills, MI, USA, 2003; Available online: https://www.concrete.org/store/productdetail.aspx?ItemID=21314&Language=English&Units=US_AND_METRIC (accessed on 3 May 2023).
- Holm, T.A.; Ries, J.P. Chapter 46: Lightweight Concrete and Aggregates; ASTM International: West Conshohocken, PA, USA, 2006; Available online: https://www.astm.org/stp37764s.html (accessed on 3 May 2023).
- Dolatabad, Y.A.; Kamgar, R.; Tazangi, M.A.J. Effects of Perlite, Leca, and Scoria as Lightweight Aggregates on Properties of Fresh and Hard Self-Compacting Concretes. J. Adv. Concr. Technol. 2020, 18, 633–647. [Google Scholar] [CrossRef]
- Yasar, E.; Atis, C.D.; Kilic, A.; Gulsen, H. Strength properties of lightweight concrete made with basaltic pumice and fly ash. Mater. Lett. 2003, 57, 2267–2270. [Google Scholar] [CrossRef]
- Maghsoudi, A.; Mohamadpour, S.; Maghsoudi, M. Mix design and mechanical properties of self-compacting light weight concrete. Int. J. Civ. Eng. 2011, 9, 230–236. [Google Scholar]
- Andic-Cakır, O.; Hızal, S. Influence of elevated temperatures on the mechanical properties and microstructure of self-consolidating lightweight aggregate concrete. Constr. Build. Mater. 2012, 34, 575–583. [Google Scholar] [CrossRef]
- Ayati, B.; Ferrándiz-Mas, V.; Newport, D.; Cheeseman, C. Use of clay in the manufacture of lightweight aggregate. Constr. Build. Mater. 2018, 162, 124–131. [Google Scholar] [CrossRef]
- Ibrahim, M.A.; Atmaca, N.; Abdullah, A.A.; Atmaca, A. Mechanical properties of concrete produced by light cement-based aggregates. Sustainability 2022, 14, 15991. [Google Scholar] [CrossRef]
- Thienel, K.-C.; Haller, T.; Beuntner, N. Lightweight Concrete-from basics to innovations. Materials 2020, 13, 1120. [Google Scholar] [CrossRef] [Green Version]
- Sajedi, F.; Shafigh, P. High-strength lightweight concrete using leca, silica fume, and limestone. Arab. J. Sci. Eng. 2012, 37, 1885–1893. [Google Scholar] [CrossRef]
- Zhang, M.H.; Gjvorv, O.E. Mechanical properties of high-strength light-weight concrete. ACI Mater. 1991, 88, 240–247. [Google Scholar]
- Malhotra, V.M. Properties of High-Strength, Light-Weight Concrete Incorporating Fly Ash and Silica Fume; ACI SP 121-31; ACI: Boston, MA, USA, 1990. [Google Scholar]
- Agrawal, Y.; Gupta, T.; Sharma, R.; Panwar, N.L.; Siddique, S. A Comprehensive review on the performance of structural lightweight aggregate concrete for sustainable construction. Constr. Mater. 2021, 1, 39–62. [Google Scholar] [CrossRef]
- Kim, H.K.; Jeon, J.H.; Lee, H.K. Workability, and mechanical, acoustic and thermal properties of lightweight aggregate concrete with a high volume of entrained air. Constr. Build. Mater. 2012, 29, 193–200. [Google Scholar] [CrossRef]
- Pasupathy, K.; Ramakrishnan, S.; Sanjayan, J. Enhancing the properties of foam concrete 3D printing using porous aggregates. Cem. Concr. Compos. 2022, 133, 104687. [Google Scholar] [CrossRef]
- Corinaldesi, V.; Moriconi, G. Use of synthetic fibers in self-compacting lightweight aggregate concretes. J. Build. Eng. 2015, 4, 247–254. [Google Scholar] [CrossRef]
- Costa, H.; Júlio, E.; Lourenço, J. New approach for shrinkage prediction of high-strength lightweight aggregate concrete. Constr. Build. Mater. 2012, 35, 84–91. [Google Scholar] [CrossRef]
- Hwang, H.-L.; Hung, M.-F. Durability design and performance of self-consolidating lightweight concrete. Constr. Build. Mater. 2005, 19, 619–626. [Google Scholar] [CrossRef]
- Choi, Y.W.; Kim, Y.J.; Shin, H.C.; Moon, H.Y. An experimental research on the fluidity and mechanical properties of high-strength lightweight self-compacting concrete. Cem. Concr. Res. 2006, 36, 1595–1602. [Google Scholar] [CrossRef]
- Adhikary, S.K.; Ashish, D.K.; Sharma, H.; Patel, J.; Rudžionis, Ž.; Al-Ajamee, M.; Thomas, B.S.; Khatib, J.M. Lightweight self-compacting concrete: A review. Resour. Conserv. Recycl. Adv. 2022, 15, 200107. [Google Scholar] [CrossRef]
- Khan, M.I.; Alhozaimy, A.M. Properties of natural pozzolan and its potential utilization in environmental friendly concrete. Can. J. Civ. Eng. 2011, 38, 71–78. [Google Scholar] [CrossRef]
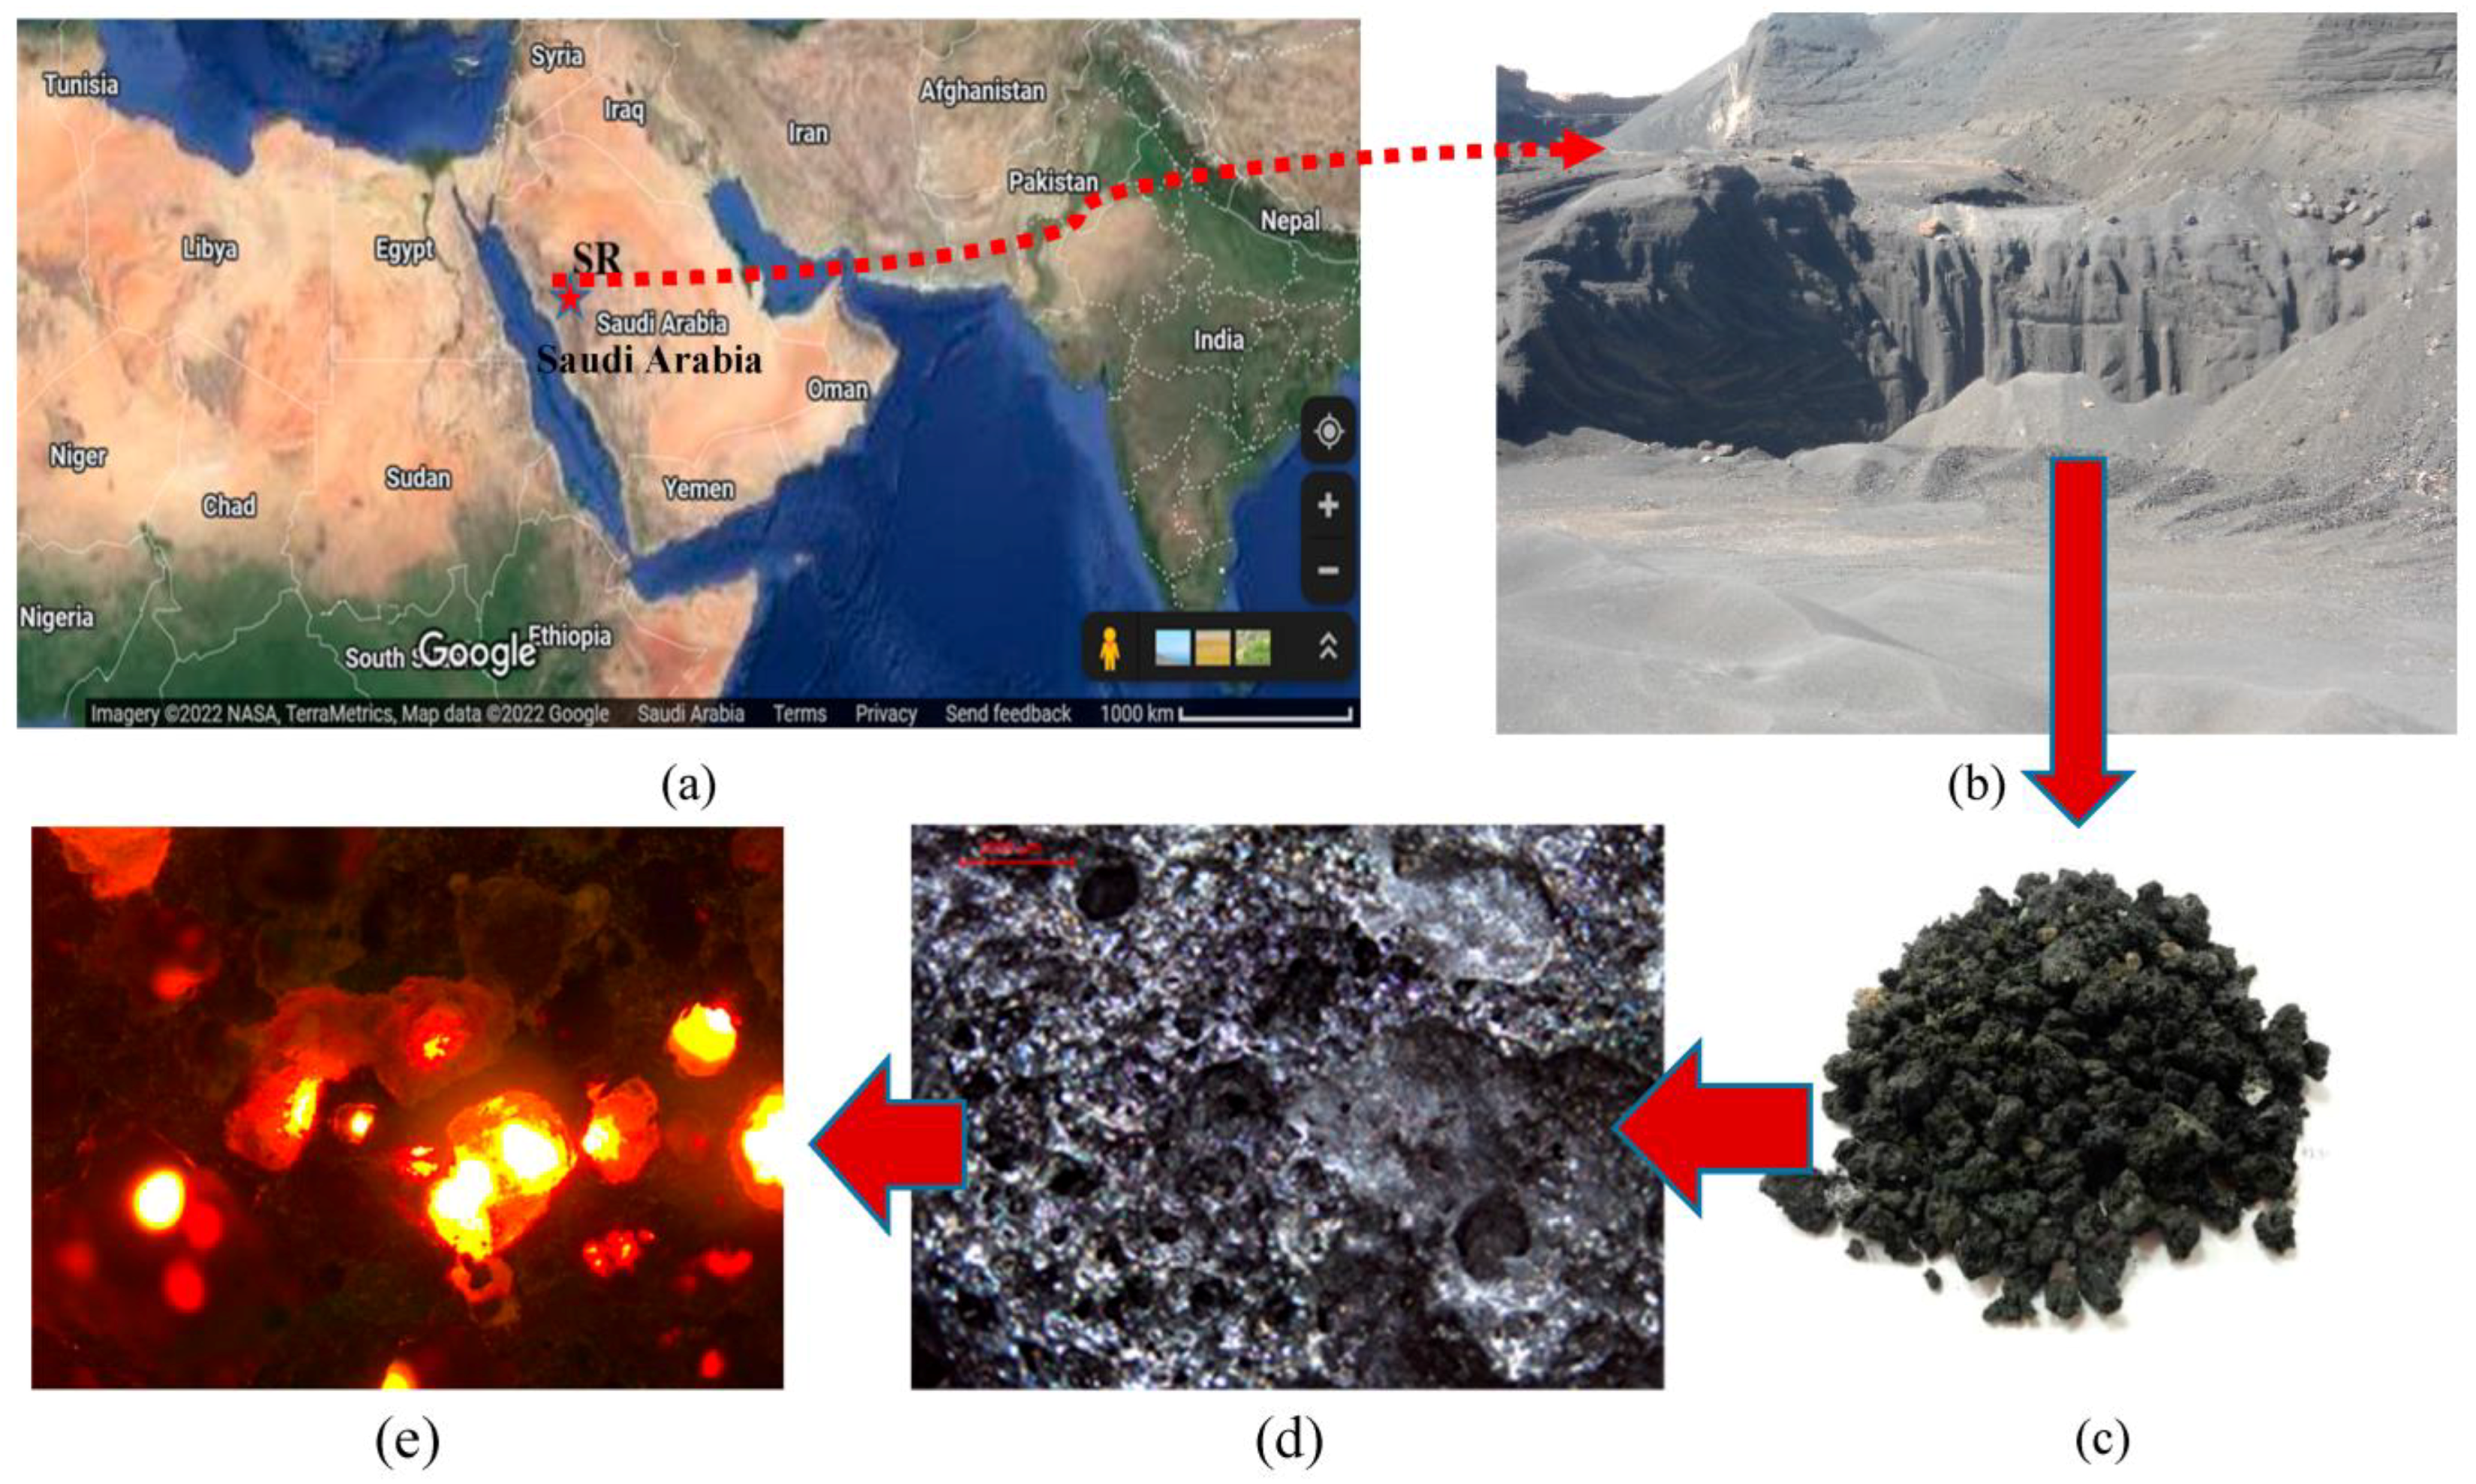
- Fares, G.; Alhozaimy, A.; Al-Negheimish, A.; Alawad, O.A. Characterization of scoria rock from Arabian lava fields as natural pozzolan for use in concrete. Eur. J. Environ. Civ. Eng. 2019, 26, 39–57. [Google Scholar] [CrossRef]
- Fares, G.; Alhozaimy, A.; Alawad, O.A.; Al-Negheimish, A. Evaluation of Powdered Scoria Rocks from Various Volcanic Lava Fields as Cementitious Material. J. Mater. Civ. Eng. 2016, 28, 04015139. [Google Scholar] [CrossRef]
- Fares, G.; Alhozaimy, A. Assessment of Pozzolanic Activity of Ground Scoria Rocks under Low- and High-Pressure (Autoclave) Steam Curing. Materials 2022, 15, 4666. [Google Scholar] [CrossRef] [PubMed]
- Sabtan, A.; William, S. Evaluation of engineering properties of scoria in central Harrat Rahat, Saudi Arabia. Bull. Eng. Geol. Environ. 2000, 59, 219–225. [Google Scholar] [CrossRef]
- Alaettin, K.; Cengiz, A.; Ergul, Y.; Fatih, Ö. High-strength lightweight concrete made with scoria aggregate containing mineral admixtures. Cem. Concr. Res. 2003, 33, 1595–1599. [Google Scholar] [CrossRef]
- ASTM C150-07; Standard Specification for Portland Cement. ASTM International: West Conshohocken, PA, USA, 2012. [CrossRef]
- ASTM C1240-20; Standard Specification for Silica Fume Used in Cementitious Mixtures. ASTM International: West Conshohocken, PA, USA, 2020. [CrossRef]
- ASTM C618-23e1; Standard Specification for Coal Ash and Raw or Calcined Natural Pozzolan for Use in Concrete. ASTM International: West Conshohocken, PA, USA, 2023. [CrossRef]
- ACI Committee 318. Building Code Requirements for Structural Concrete (ACI 318-19) and Commentary (ACI 318R-19); American Concrete Institute: Farmington Hills, MI, USA, 2019. [Google Scholar]
- ASTM C33; Standard Specification for Concrete Aggregates. ASTM International: West Conshohocken, PA, USA, 2007.
- ASTM C1611/C1611M-21; Standard Test Method for Slump Flow of Self-Consolidating Concrete. ASTM International: West Conshohocken, PA, USA, 2021. [CrossRef]
- ASTM C109/C109M-21; Test Method for Compressive Strength of Hydraulic Cement Mortars (Using 2-in. or [50-mm] Cube Specimens. ASTM International: West Conshohocken, PA, USA, 2021. [CrossRef]
- ASTM C39/C39M-21; Standard Test Method for Compressive Strength of Cylindrical Concrete Specimens. ASTM International: West Conshohocken, PA, USA, 2021. [CrossRef]
- ASTM C348-21; Standard Test Method for Flexural Strength of Hydraulic-Cement Mortars. ASTM International: West Conshohocken, PA, USA, 2021. [CrossRef]
- Domagała, L. The effect of lightweight aggregate water absorption on the reduction of water-cement ratio in fresh concrete. Procedia Eng. 2015, 108, 206–213. [Google Scholar] [CrossRef] [Green Version]
- Jiang, S.; Shan, B.; Ouyang, J.; Zhang, W.; Yu, X.; Li, P.; Han, B. Rheological properties of cementitious composites with nano/fiber fillers. Constr. Build. Mater. 2018, 158, 786–800. [Google Scholar] [CrossRef]
- Khan, M.I.; Fares, G.; Mourad, S.; Abbass, W. Optimized fresh and hardened properties of SHCC: Effect of sand size and workability. J. Mater. Civ. Eng. 2016, 28, 04016152. [Google Scholar] [CrossRef]
- Chung, S.-Y.; Sikora, P.; Kim, D.J.; El Madawy, M.E.; Abd Elrahman, M. Effect of different expanded aggregates on durability-related characteristics of lightweight aggregate concrete. Mater. Charact. 2021, 173, 110907. [Google Scholar] [CrossRef]
- Lim, S.K.; Tan, C.S.; Zhao, X.; Ling, T.C. Strength and toughness of lightweight foamed concrete with different sand grading. KSCE J. Civ. Eng. 2015, 19, 2191–2197. [Google Scholar] [CrossRef] [Green Version]
- EFNARC. Guidelines for Self-Compacting Concrete; EFNARC: Farnham, UK, 2002. [Google Scholar]
- ASTM C78/C78M-18; Standard Test Method for Flexural Strength of Concrete (Using Simple Beam with Third-Point Loading). ASTM International: West Conshohocken, PA, USA, 2021. [CrossRef]


| Oxides (%) | PC | SF | FA | LSD | SR |
|---|---|---|---|---|---|
| SiO2 | 20.41 | 91.3 | 53.2 | 1.80 | 43.31 |
| Al2O3 | 5.32 | 0.35 | 27.3 | 0.45 | 15.41 |
| Fe2O3 | 4.1 | 0.05 | 4.03 | 0.66 | 12.48 |
| CaO | 64.14 | 0.15 | 0.90 | 54.41 | 9.26 |
| MgO | 0.71 | 0.75 | 0.60 | 0.45 | 10.1 |
| SO3 | 2.44 | 0.86 | 0.20 | 0.46 | 0.06 |
| P2O5 | 0.04 | 0.06 | 0.40 | 0.01 | 0.4 |
| TiO2 | 0.3 | - | 1.52 | 0.04 | 2.19 |
| MnO | 0.07 | 0.03 | 0.03 | - | 0.19 |
| Na2O | 0.10 | 0.40 | 0.22 | 0.06 | 2.95 |
| K2O | 0.17 | 0.80 | 1.22 | 0.03 | 0.75 |
| Cl | 0.01 | 0.10 | 0.05 | 0.03 | 0.03 |
| L.O.I | 2.18 | 5.1 | 10.02 | 41.6 | 0.95 |
| D50 | 10 | 0.23 | 10 | 19 | 13 |
| Sp. Gr. | 3.15 | 2.2 | 2.6 | 2.7 | 2.8 |
| Sample | GPS Coordinates | |
|---|---|---|
| Latitude (N) | Longitude (E) | |
| Scoria rock | 23° 11.9103 | 39° 56.9014 |
| PC | FA | SF | LSD | W |
|---|---|---|---|---|
| 442 | 149 | 57 | 158 | 253 |
| PC | FA | SF | LSD | SR4 | SR10 | W |
|---|---|---|---|---|---|---|
| 442 | 149 | 57 | 158 | 644 | 94 | 253 |
| Tested Values | EFNARC Accepted Range; 2002 [39] | |
|---|---|---|
| Slump flow (mm) | 790–800 | 650–800 |
| T50 (sec) | 3.78–5.67 | 2–5 * 3–7 ** |
| J-ring height (mm) | 8–11 | 6–12 |
| J-ring flow (mm) | 750–780 | - |
| V-funnel flow time (sec) | 9.17 | 6–12 |
Disclaimer/Publisher’s Note: The statements, opinions and data contained in all publications are solely those of the individual author(s) and contributor(s) and not of MDPI and/or the editor(s). MDPI and/or the editor(s) disclaim responsibility for any injury to people or property resulting from any ideas, methods, instructions or products referred to in the content. |
© 2023 by the authors. Licensee MDPI, Basel, Switzerland. This article is an open access article distributed under the terms and conditions of the Creative Commons Attribution (CC BY) license (https://creativecommons.org/licenses/by/4.0/).
Share and Cite
Fares, G.; El-Sayed, A.K.; Alhozaimy, A.M.; Al-Negheimish, A.I.; Albidah, A.S. Lightweight SCC Development in a Low-Carbon Cementitious System for Structural Applications. Materials 2023, 16, 4395. https://doi.org/10.3390/ma16124395
Fares G, El-Sayed AK, Alhozaimy AM, Al-Negheimish AI, Albidah AS. Lightweight SCC Development in a Low-Carbon Cementitious System for Structural Applications. Materials. 2023; 16(12):4395. https://doi.org/10.3390/ma16124395
Chicago/Turabian StyleFares, Galal, Ahmed K. El-Sayed, Abdulrahman M. Alhozaimy, Abdulaziz I. Al-Negheimish, and Abdulrahman S. Albidah. 2023. "Lightweight SCC Development in a Low-Carbon Cementitious System for Structural Applications" Materials 16, no. 12: 4395. https://doi.org/10.3390/ma16124395