Article

Microstructure and Mechanical Properties of Dual Scaled NbC/Ti2AlC Reinforced Titanium–Aluminum Composite

1
School of Materials Science and Engineering, Shijiazhuang Tiedao University, Shijiazhuang 050043, China
2
School of Materials Science and Engineering, Hebei University of Technology, Tianjin 300401, China
*
Author to whom correspondence should be addressed.
Materials 2023, 16(13), 4661; https://doi.org/10.3390/ma16134661
Submission received: 24 May 2023 / Revised: 15 June 2023 / Accepted: 23 June 2023 / Published: 28 June 2023

Abstract

:
A TiAl composite containing hybrid particles and whisker reinforcements is fabricated by vacuum melting. The results of this study show that the comprehensive mechanical properties and refining effect of the material are best when the content of reinforcement is 1 wt.%, and then the mechanical properties begin to deteriorate as the content increases further. Finely dispersed NbC particles and uniformly dispersed Ti2AlC whiskers are the ideal second phases. The synergistic strengthening effect of NbC particles and in situ Ti2AlC whiskers are key to the improvement of mechanical properties. Compared with the TiAlNb matrix, the fracture stress/strain of the composite at 1073 K is improved from 612 MPa/19.4% to 836 MPa/26.6%; the fracture toughness at room temperature is improved from 18.8 MPa/m2 to 27.4 MPa/m2.

1. Introduction

Titanium–Aluminum (TiAl) has attracted the attention of scholars due to its high specific strength and good high-temperature performance [1,2,3,4]. The urgent problem to be solved for the TiAl alloy is to improve its brittleness at room temperature and enhance the high-temperature strength. By adding β stabilizing elements such as Nb, Mo and Cr, the phase composition can be adjusted and the degree of segregation of TiAl alloy can be reduced, which has been a widely used method [5,6,7]. On this basis, a composite method is an efficient way to further improve the mechanical performance of cast TiAl alloys. By introducing ceramic phases into the alloy matrix, the comprehensive mechanical properties of metal matrix composites (MMCs) could be significantly improved when comparing with the matrix [8,9]. This is due to the intrinsic mechanical properties of these ceramic reinforcements and their refining effects on the microstructure of the alloy matrix. In the past few decades, different scaled ceramic phases, such as particles [10] and whiskers [11], have both been extensively studied as reinforcements in MMCs. In terms of the strengthening mechanisms, the emphases of particles and whiskers are different. Particle reinforcements have a relatively small size. Therefore, particles with the same volume fraction can provide more heterogeneous nucleation cores than whiskers, and thus have a better refining effect. Moreover, small particles have a greater tendency to distribute inside the grains, which can play a better role in Orowan strengthening in the process of deformation. Whiskers are relatively large in size and can bear the load effectively. Hence, whiskers can play a larger role in the load transferring mechanism. Meanwhile, the bridging effect of whiskers between multiple grains can also delay the fracture of the alloy and improve the comprehensive mechanical properties.
Based on the above background, both particle reinforcements and whisker reinforcements have specific advantages. It is of great research value to study TiAl matrix composites containing the hybrid particle and whisker reinforcements.
NbC possesses high strength and a high melting point, and is widely used in alloys to enhance their high temperature strength and abrasion performance [12,13]. Hence, NbC can be the particle reinforcement in TiAl alloys. In the casting process, NbC particles can act as the heterogeneous nucleation cores to refine and strengthen TiAl matrix. MAX phase is a kind of reinforcement with excellent high temperature mechanical properties [14,15,16]. Meanwhile, the generation and growth of Ti2AlC/Ti2AlN in TiAl alloys have already been proven [17,18,19,20]. MAX phases such as Ti2AlC and Ti2AlN have good mechanical properties at the service temperature of TiAl alloys, including their high temperature strength and high temperature ductility. Hence, they are ideal whisker reinforcements in TiAl alloys.
This work prepares a TiAl composite containing hybrid particle&whisker reinforcements by casting strategy. NbC is the ex situ particle reinforcement and graphene is used as the reaction source of the Ti2AlC phase, which can form in the TiAl melt and grow into whiskers. By controlling the content of NbC and graphene, the second phases of ideal morphology can generate in the TiAl composite, and the synergistic effect of multiplying strengthening mechanisms brought by the hybrid reinforcements helps to improve the mechanical properties of TiAl matrix.

2. Materials and Methods

2.1. Preparation of TiAl Composite

Ti-48Al-6Nb (TiAlNb alloy) is used as the matrix of the TiAl composite, which is fabricated by a vacuum melting furnace. Titanium (99.9%) bulks, Aluminum (99.9%) bulks and commercial Aluminum–Niobium (Al-70 wt.%Nb) intermediate alloy are used as the raw materials, which are prepared by vacuum melting. NbC particles and graphene (mass ratio 6:1) mixed powders are used as the raw materials of reinforcements. NbC particles are about 2 μm in size; flake-like graphene is about 10 μm in width. The mixed powders are ball-milled for 20 h by a GN-2 high energy ball-milling machine; the milled powders are less than 1 μm in size. Then, the mixed powders and TiAlNb alloy are used to prepare the TiAl composite by the vacuum melting furnace. TiAlNb alloy (cuboid, about 100 g in weight) is placed in the crucible and the mixed powders are hung above the crucible. The mixed powders are placed into the TiAl melt after the TiAlNb is fully melted. A high purity Mo stirrer is used to stir the melt containing the mixed powder. The melt is then poured into a copper mold to obtain the final NbC/Ti2AlC reinforced TiAl composite (NTTC, φ20 in size, about 100 g in weight, as shown in Supplementary Materials Figure S1).

2.2. Structural Characterization

A Zeiss metalloscope (AxioCam ICc5, Jena, Germany) is used for the observation of the metallographic structure of the TiAlNb matrix and TiAl composite. The microstructure of the different specimens is observed by a scanning electron microscope (SEM, S-4800, Hitachi Ltd., Tokyo, Japan) with EDAX energy-dispersive spectrometry (EDS). Ion beam thinning is used for the preparation of the electron transparent foils of the TiAl composite. High-resolution transmission electron microscopy (HRTEM) images and the selected area electron diffraction (SAED) patterns of the specimens are obtained by JEM-2100 transmission electron microscopy (TEM).

2.3. Mechanical Properties Test
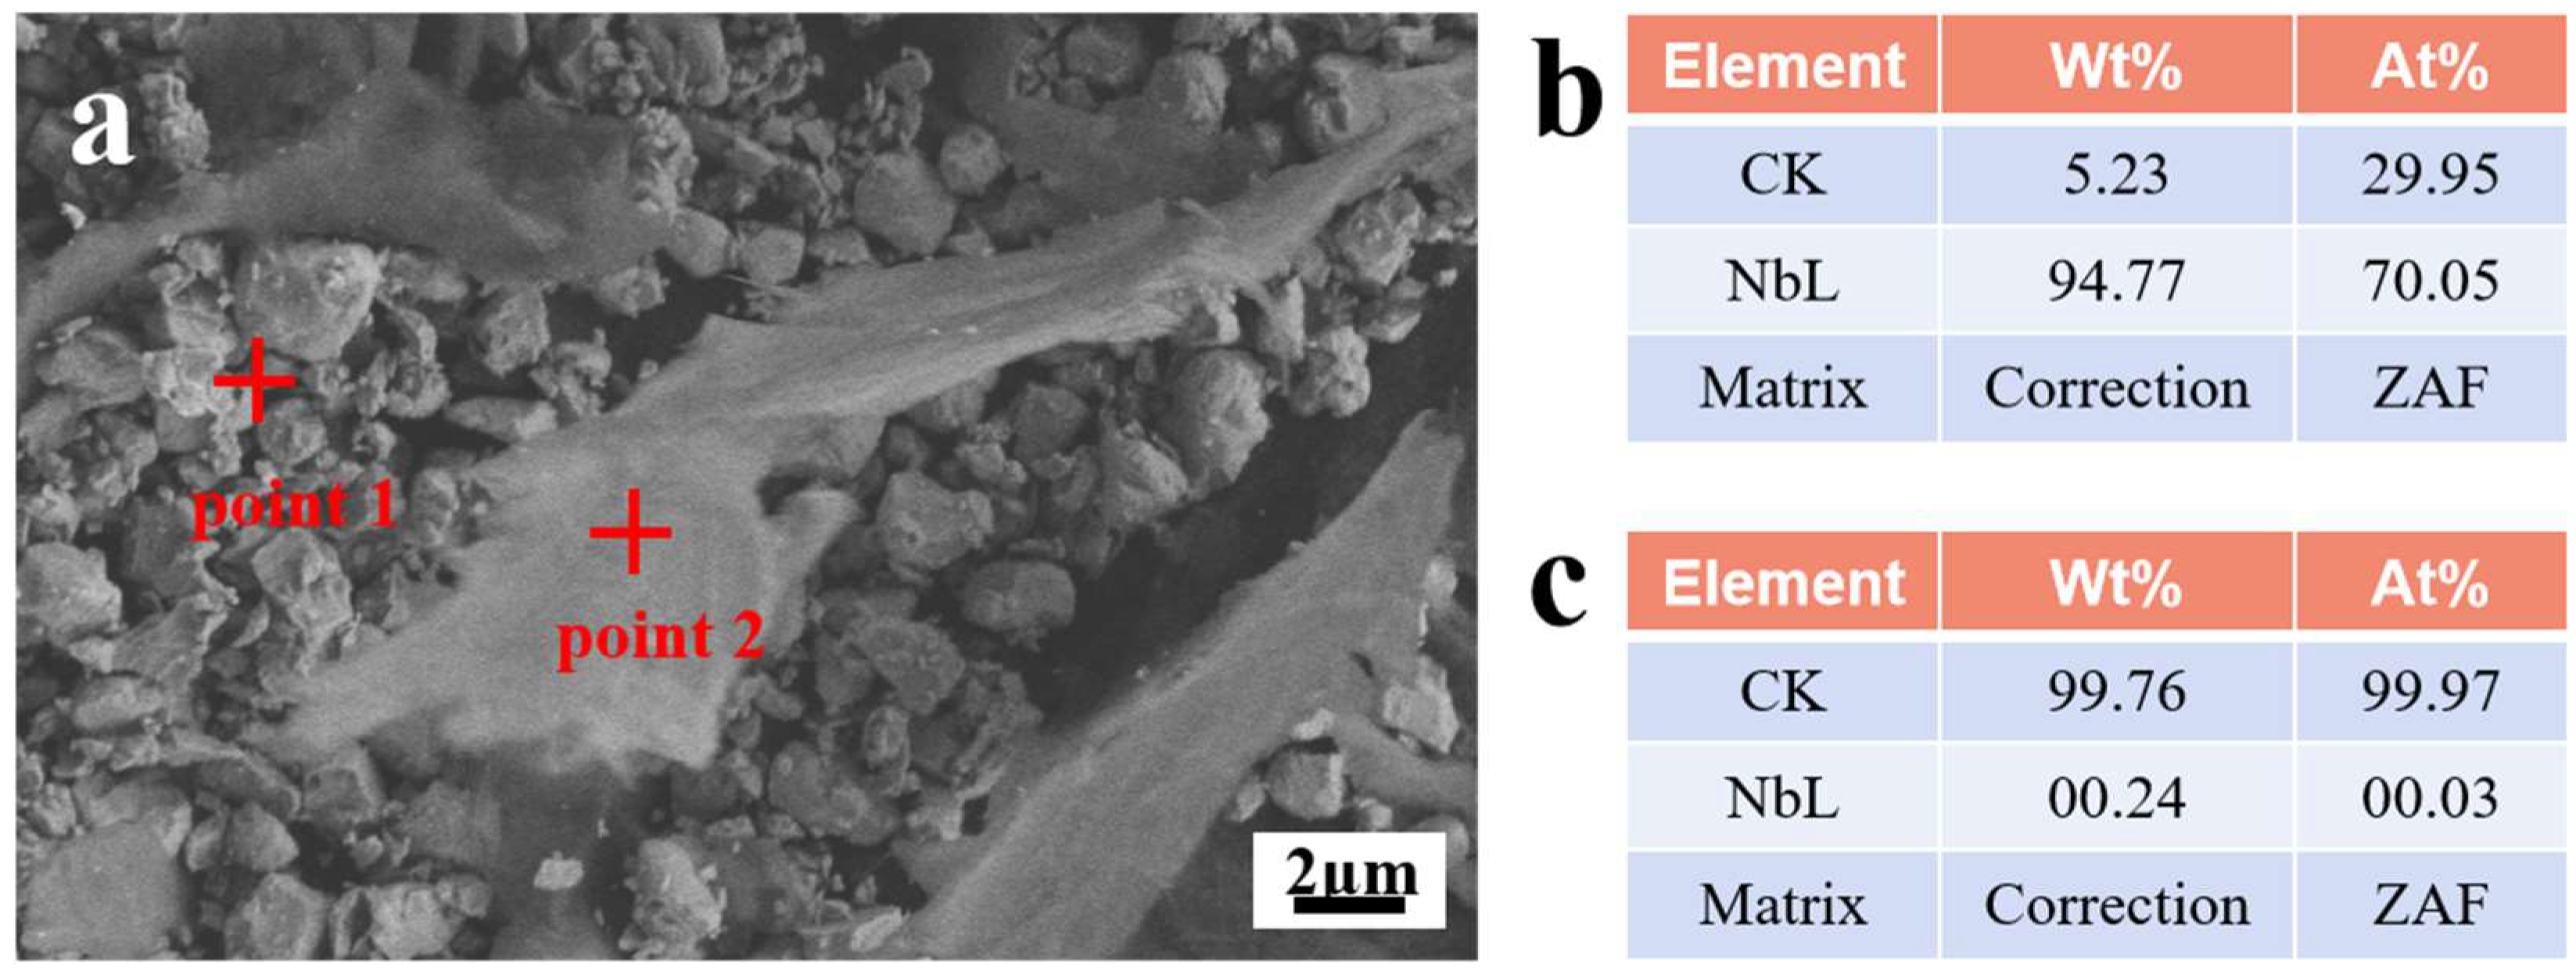
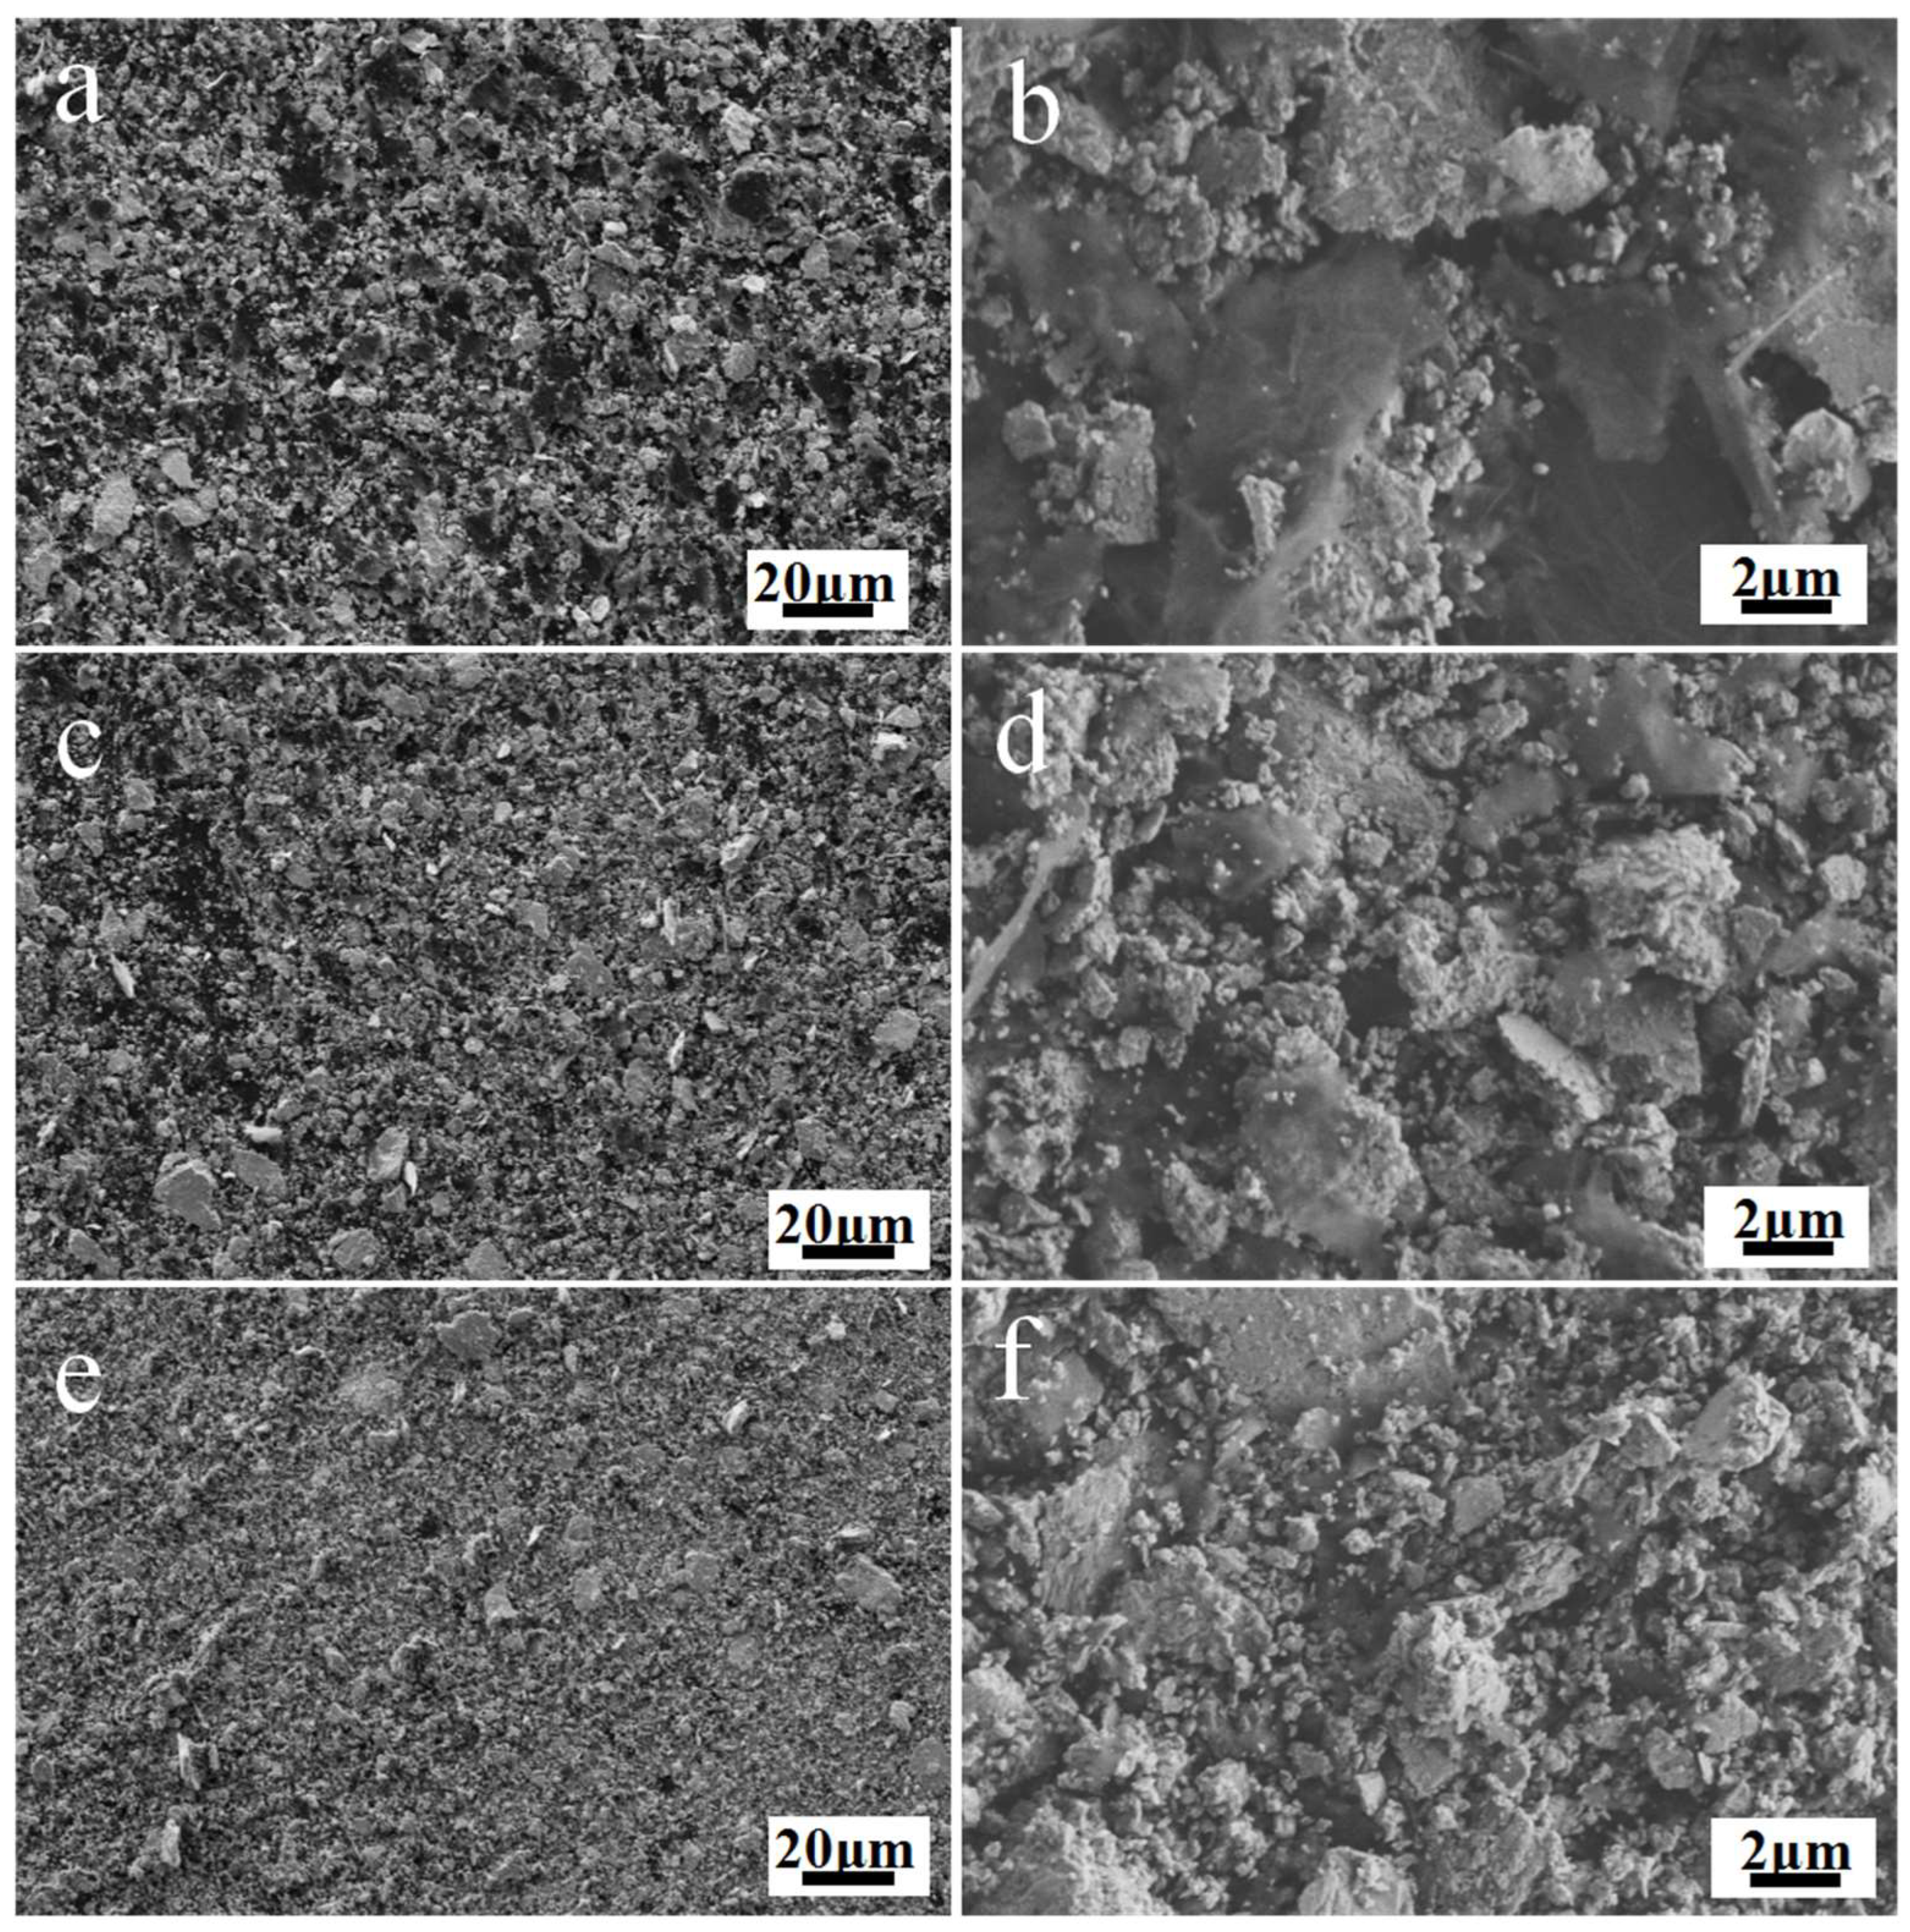
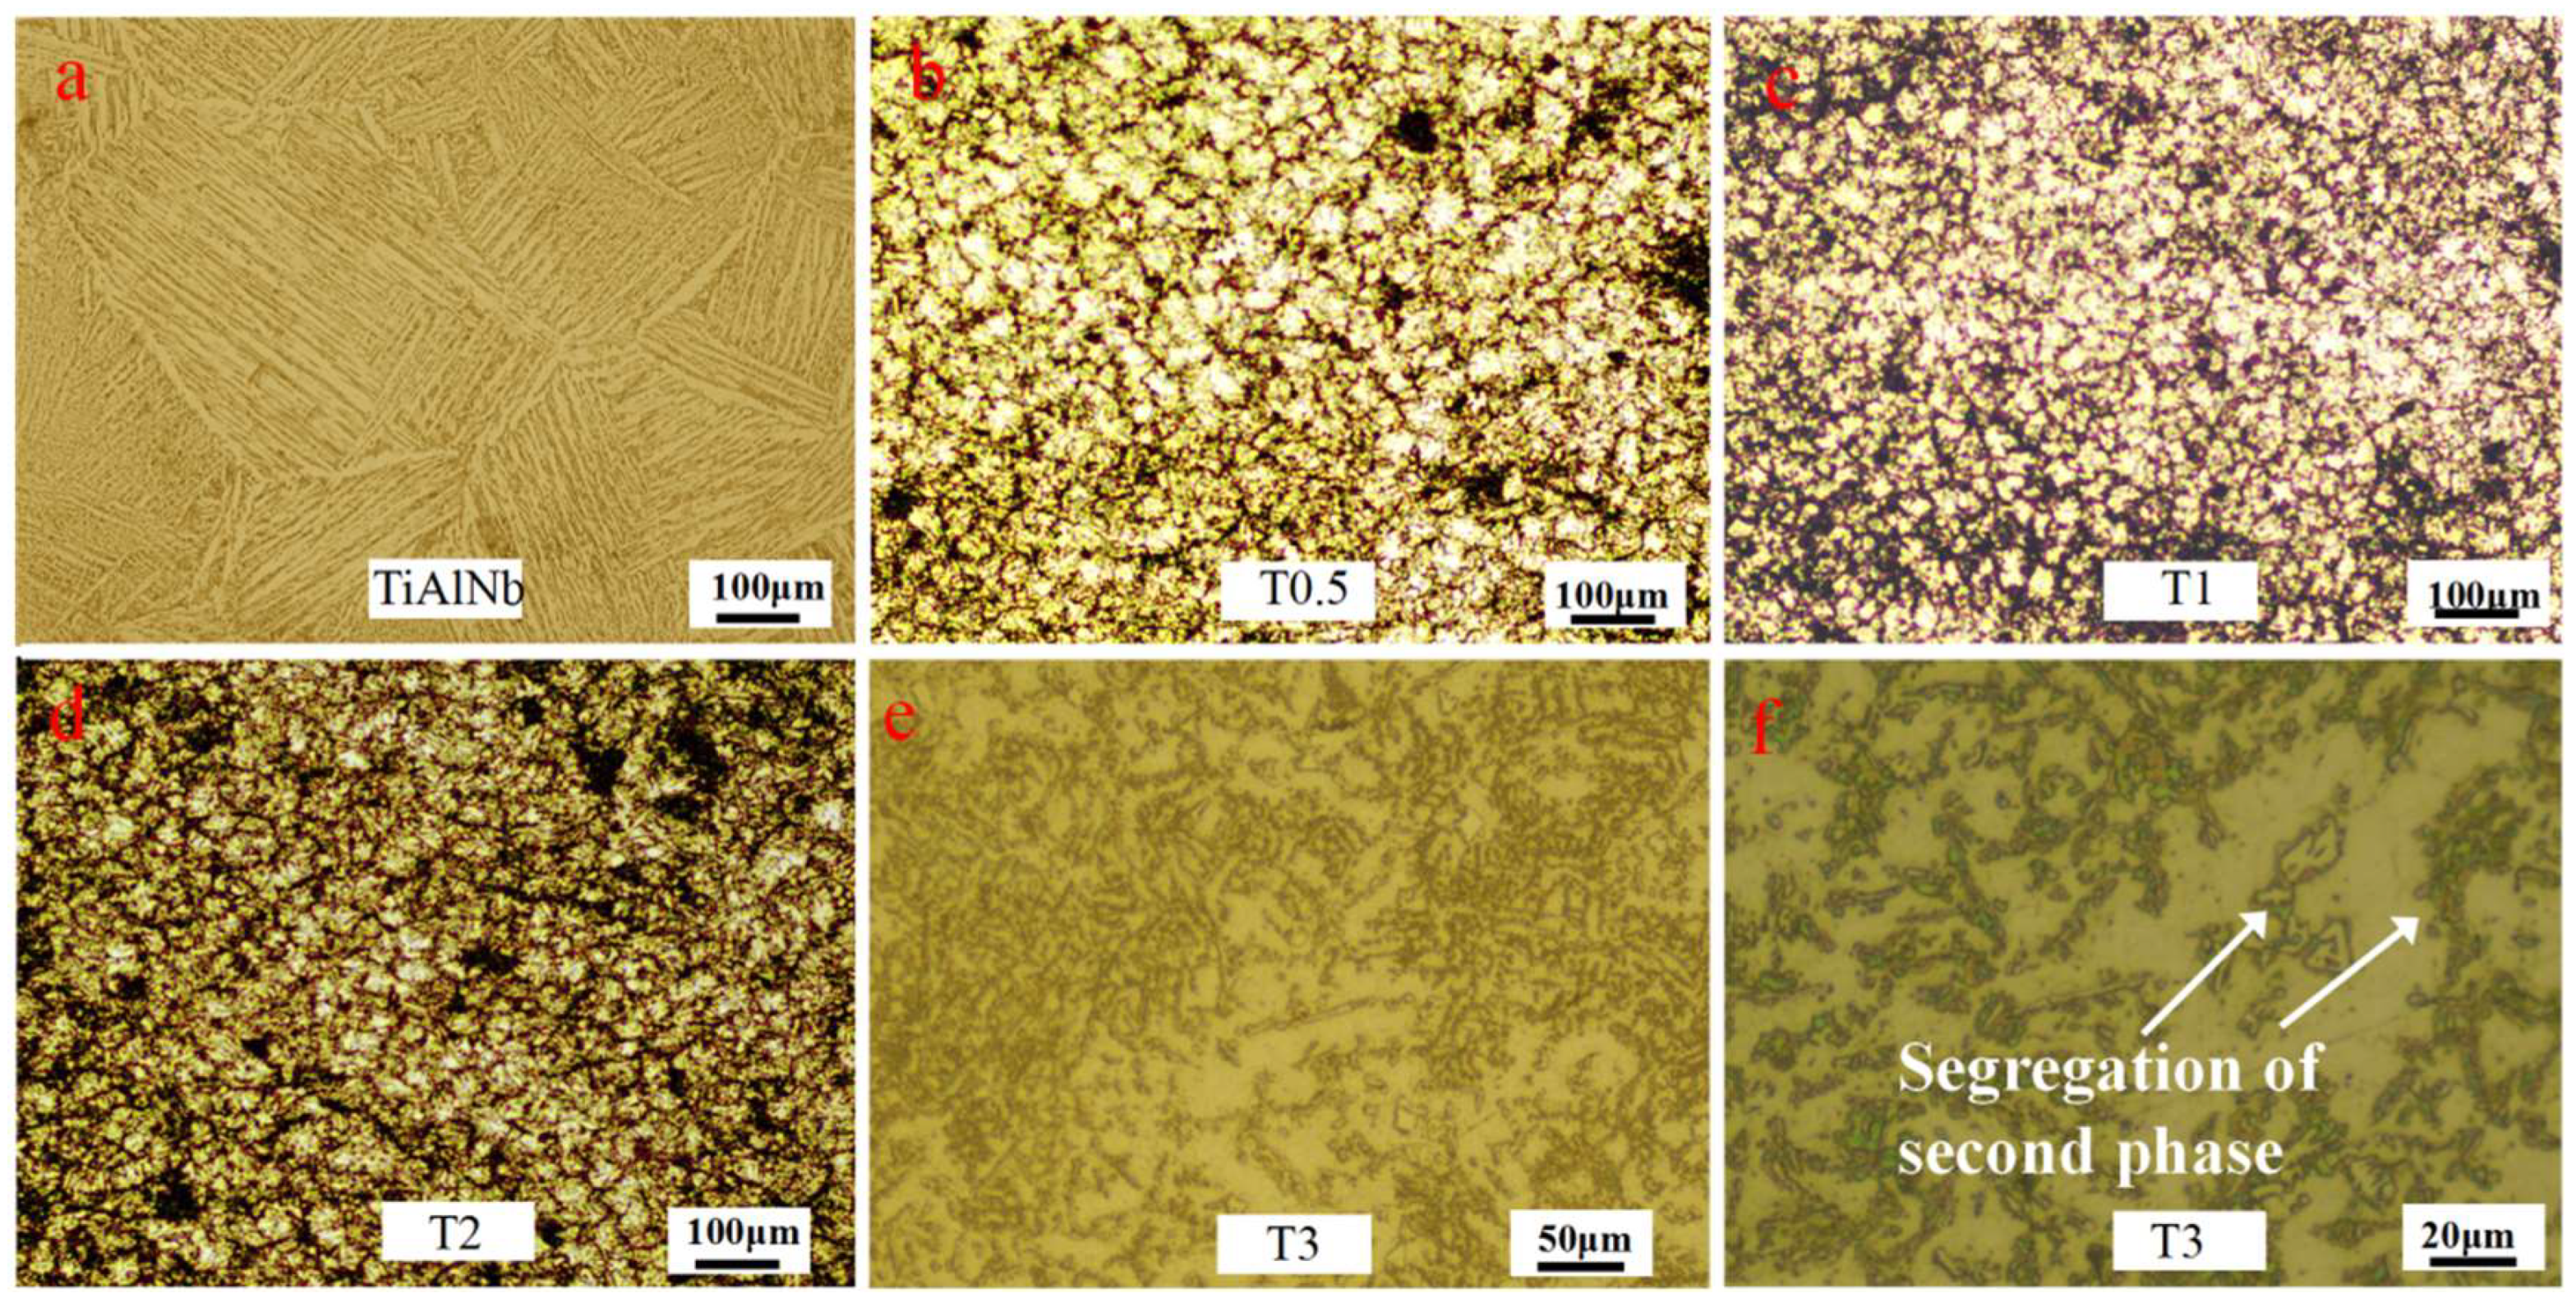
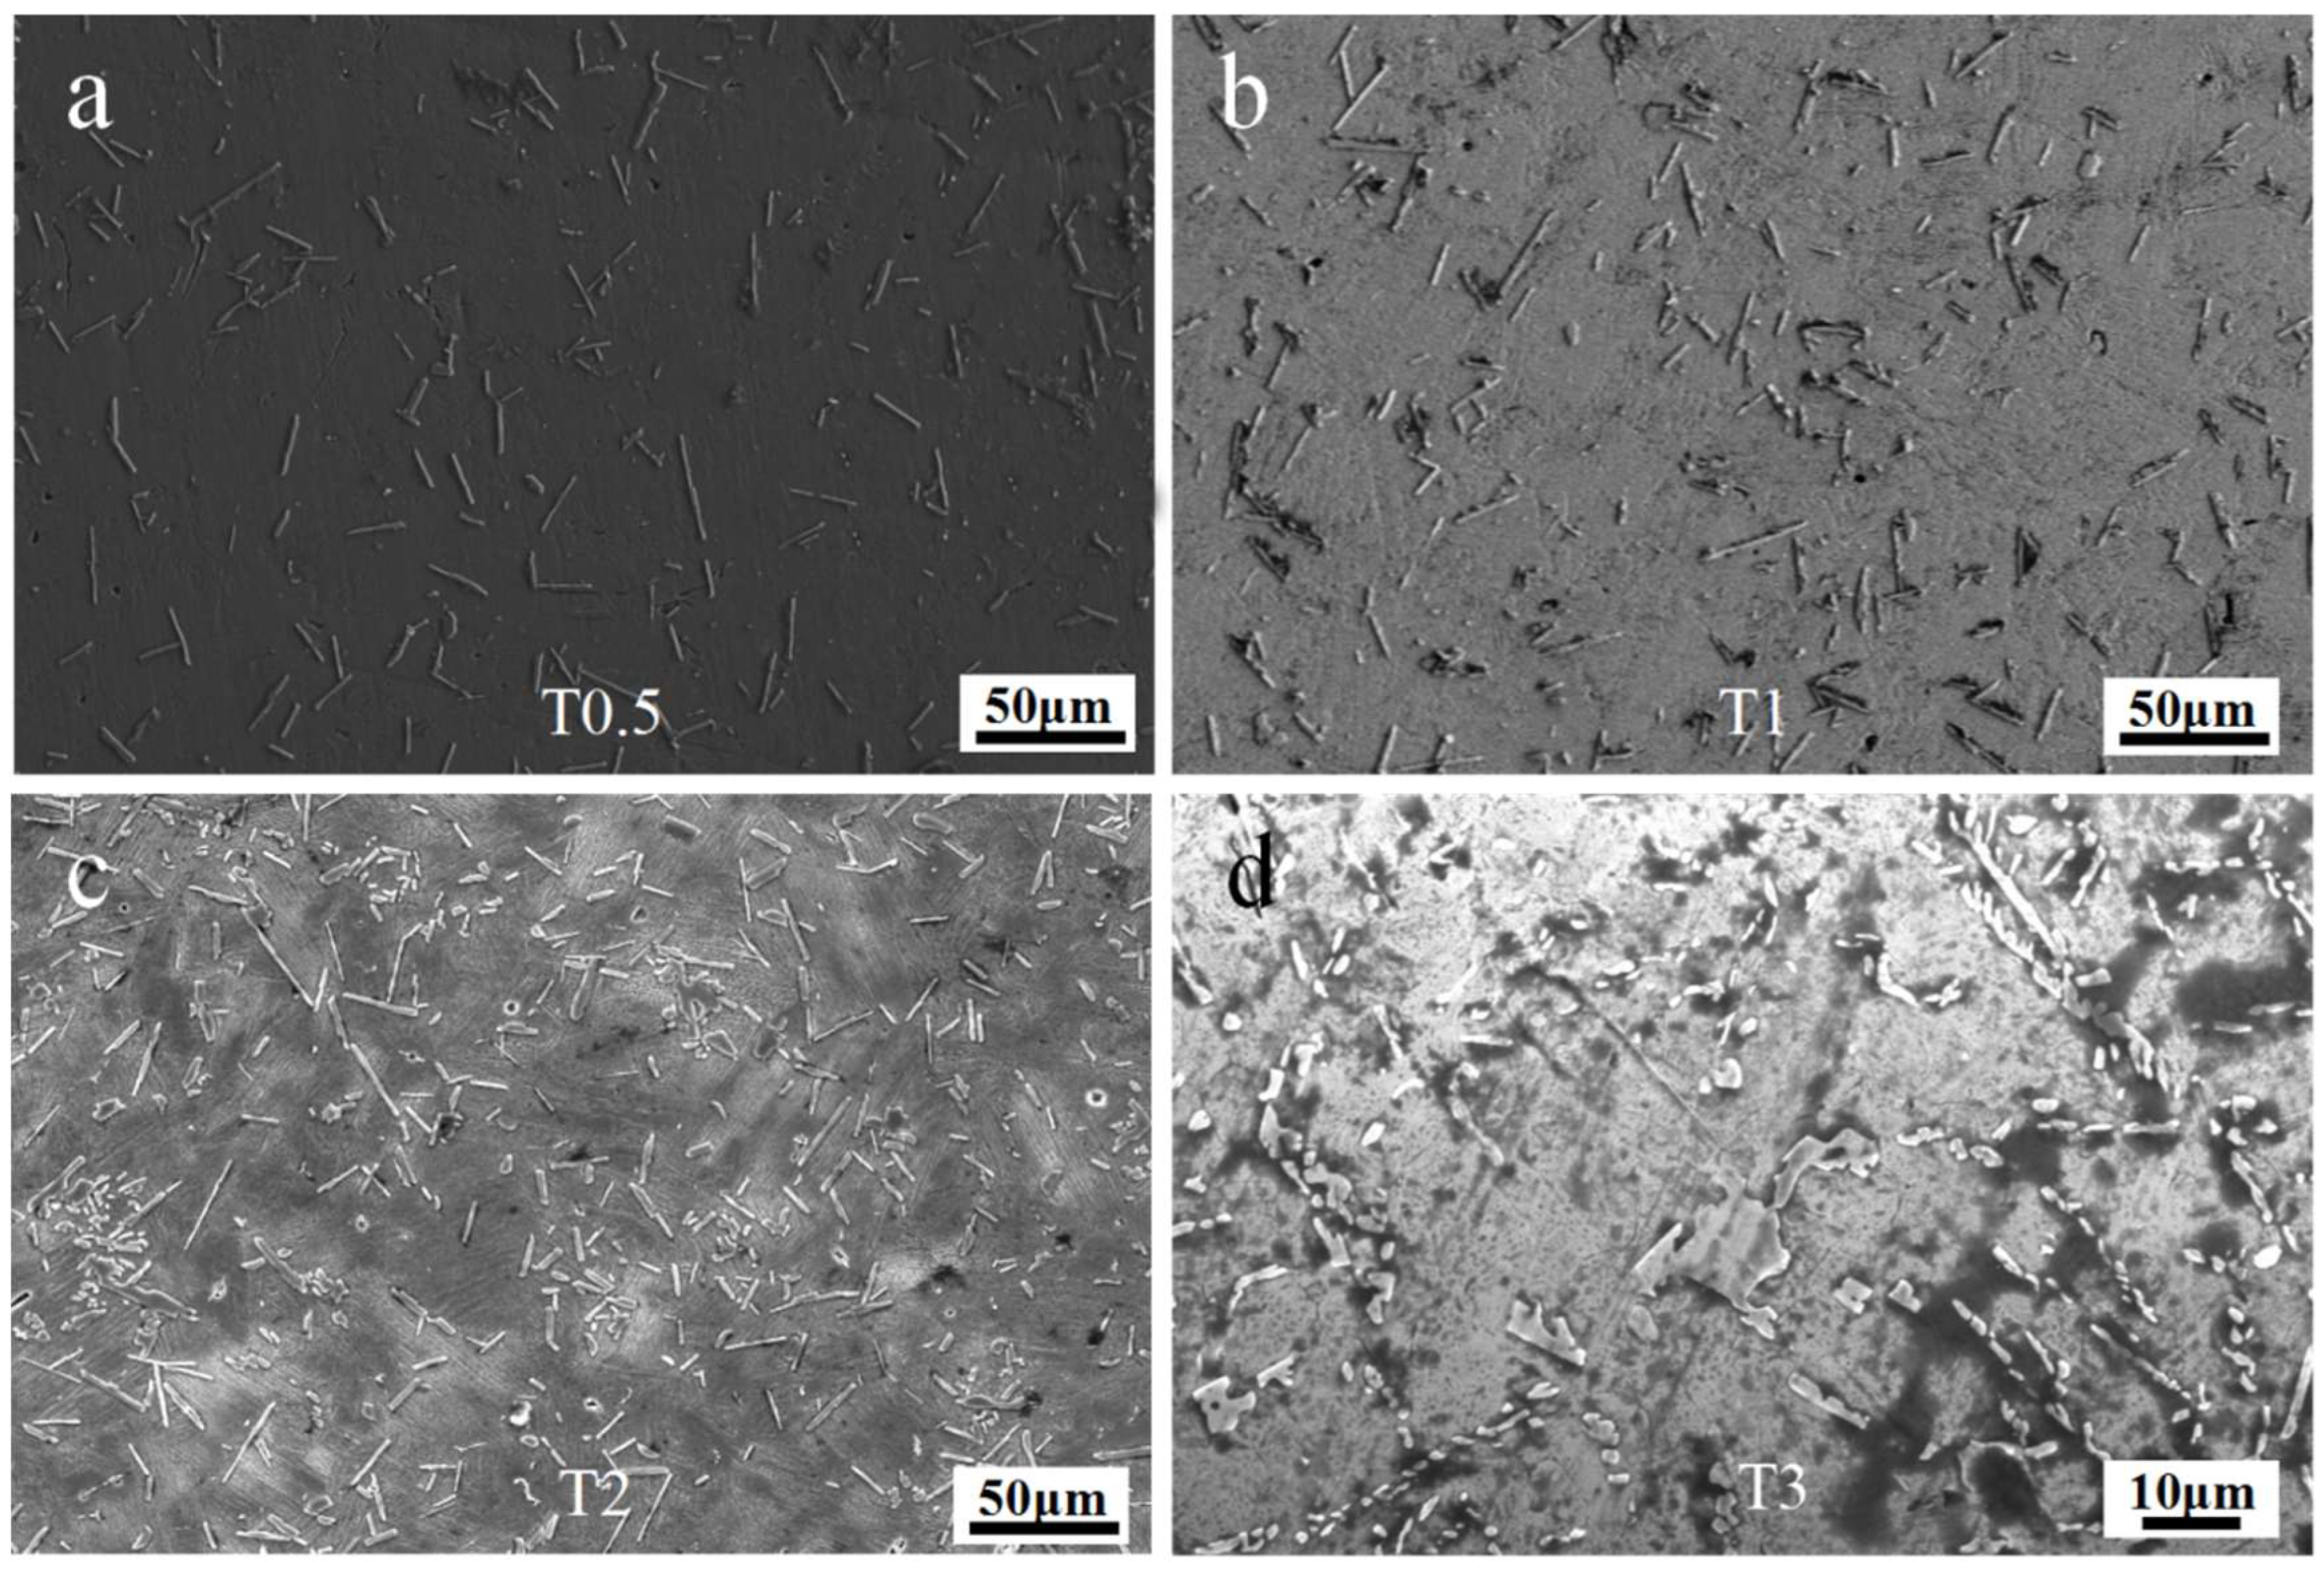
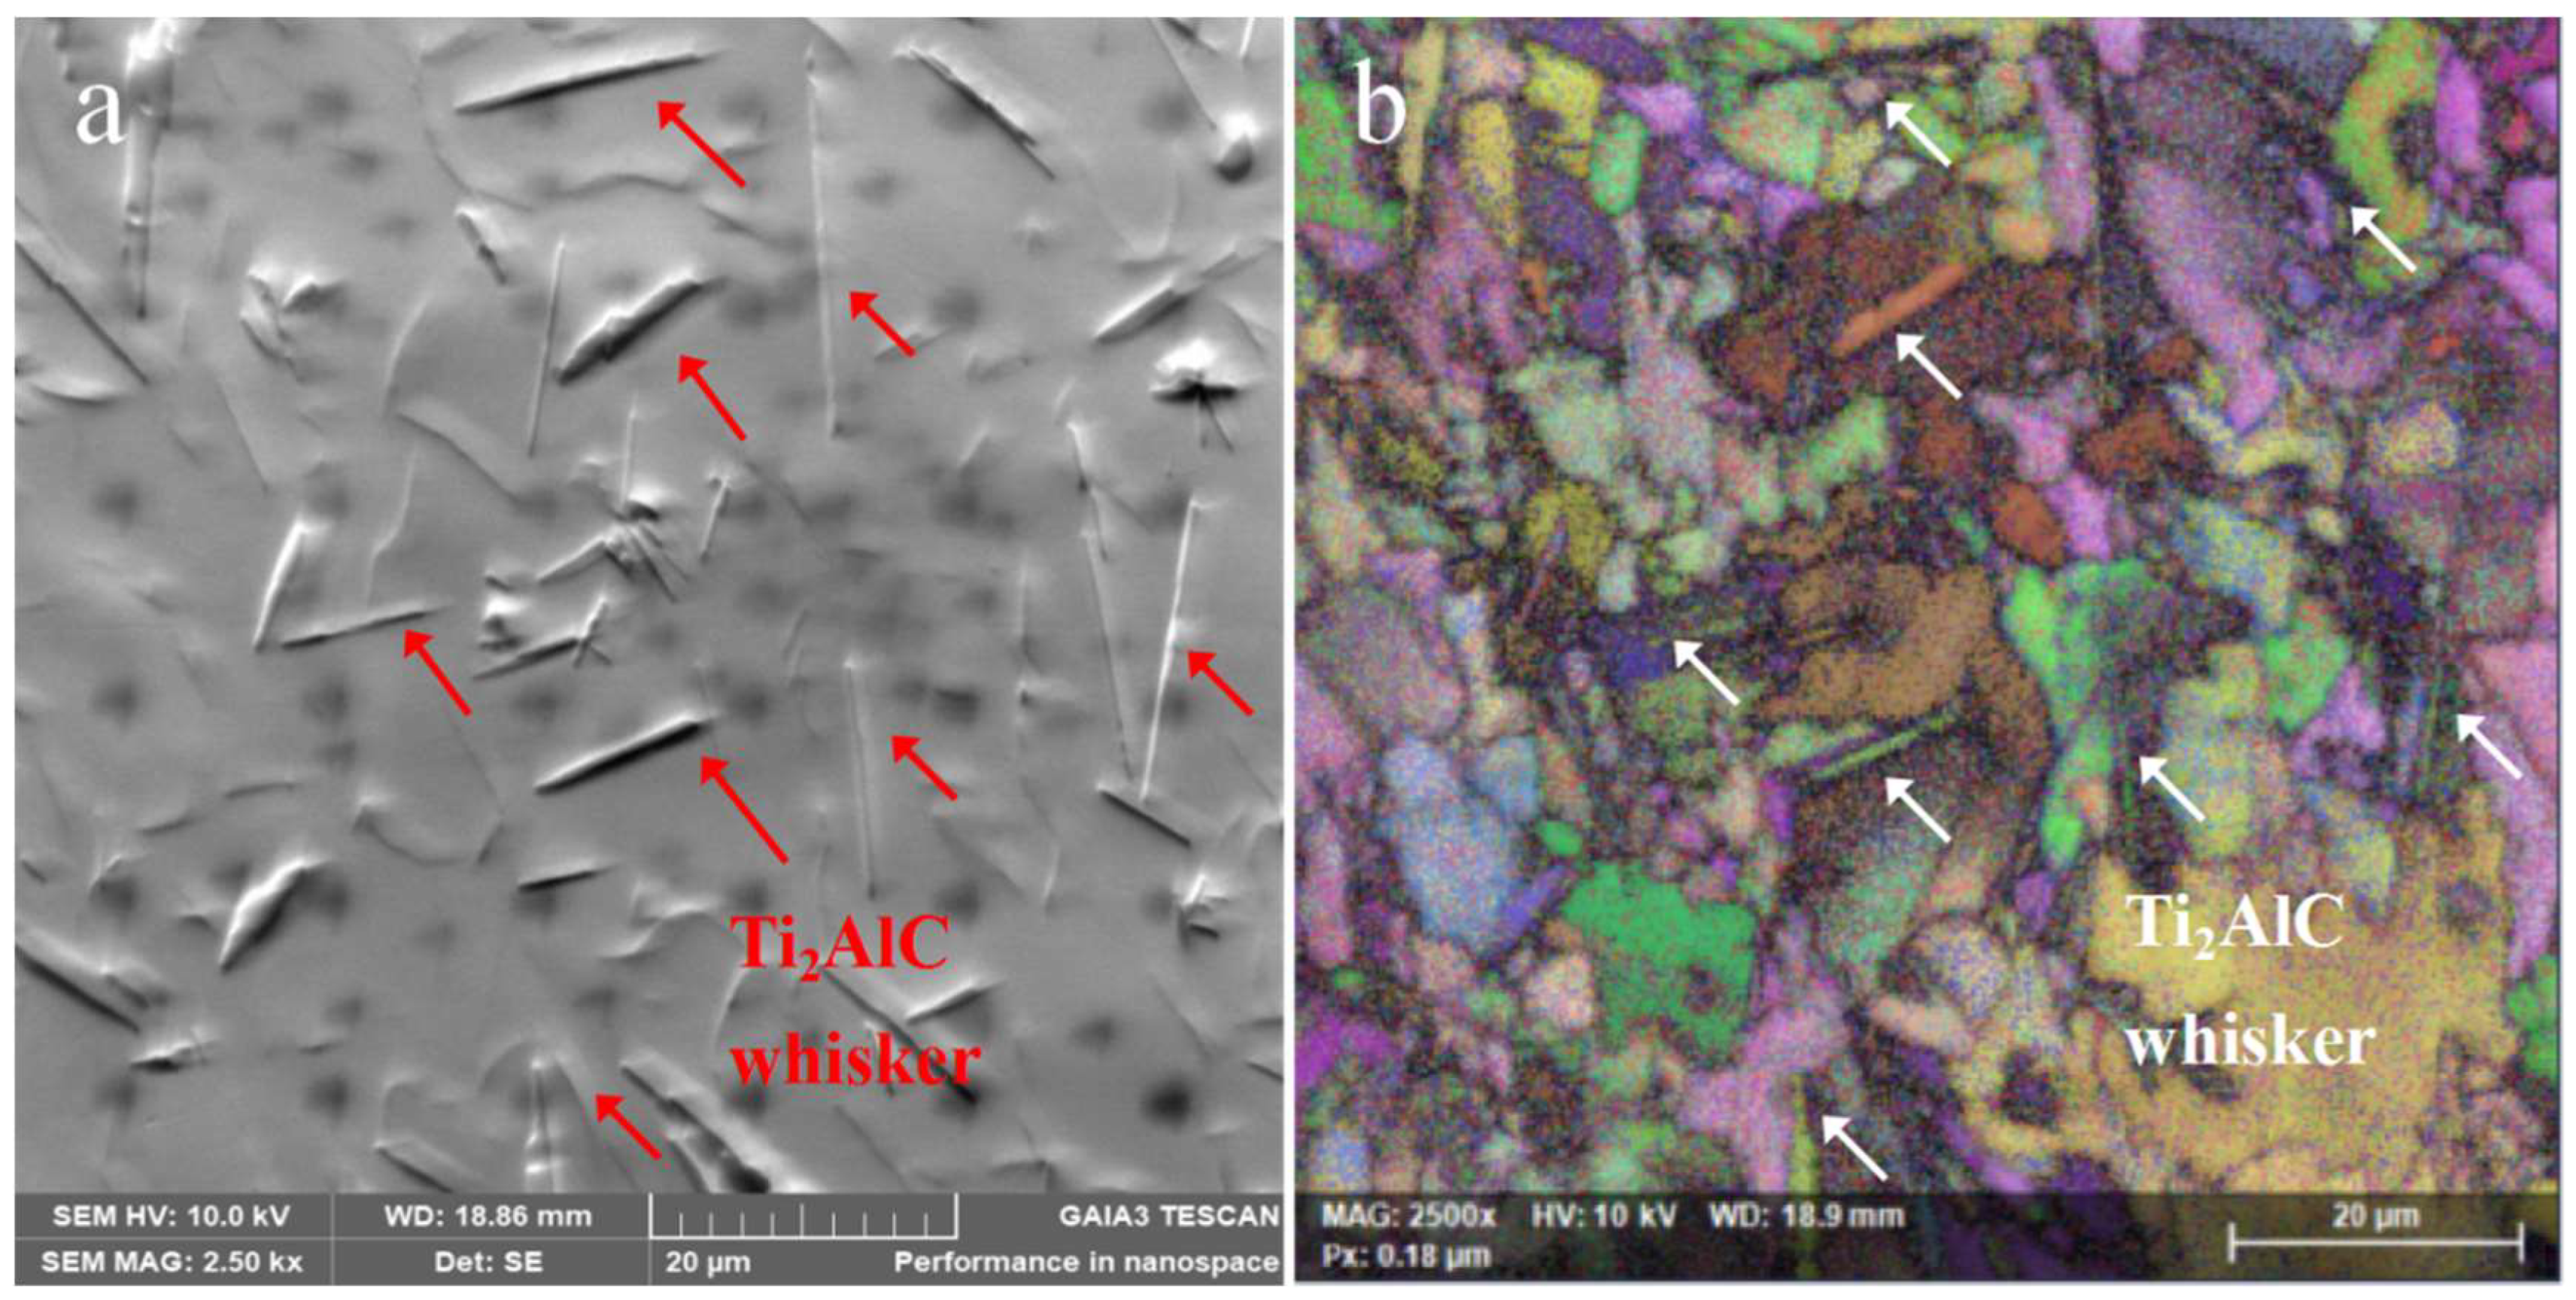
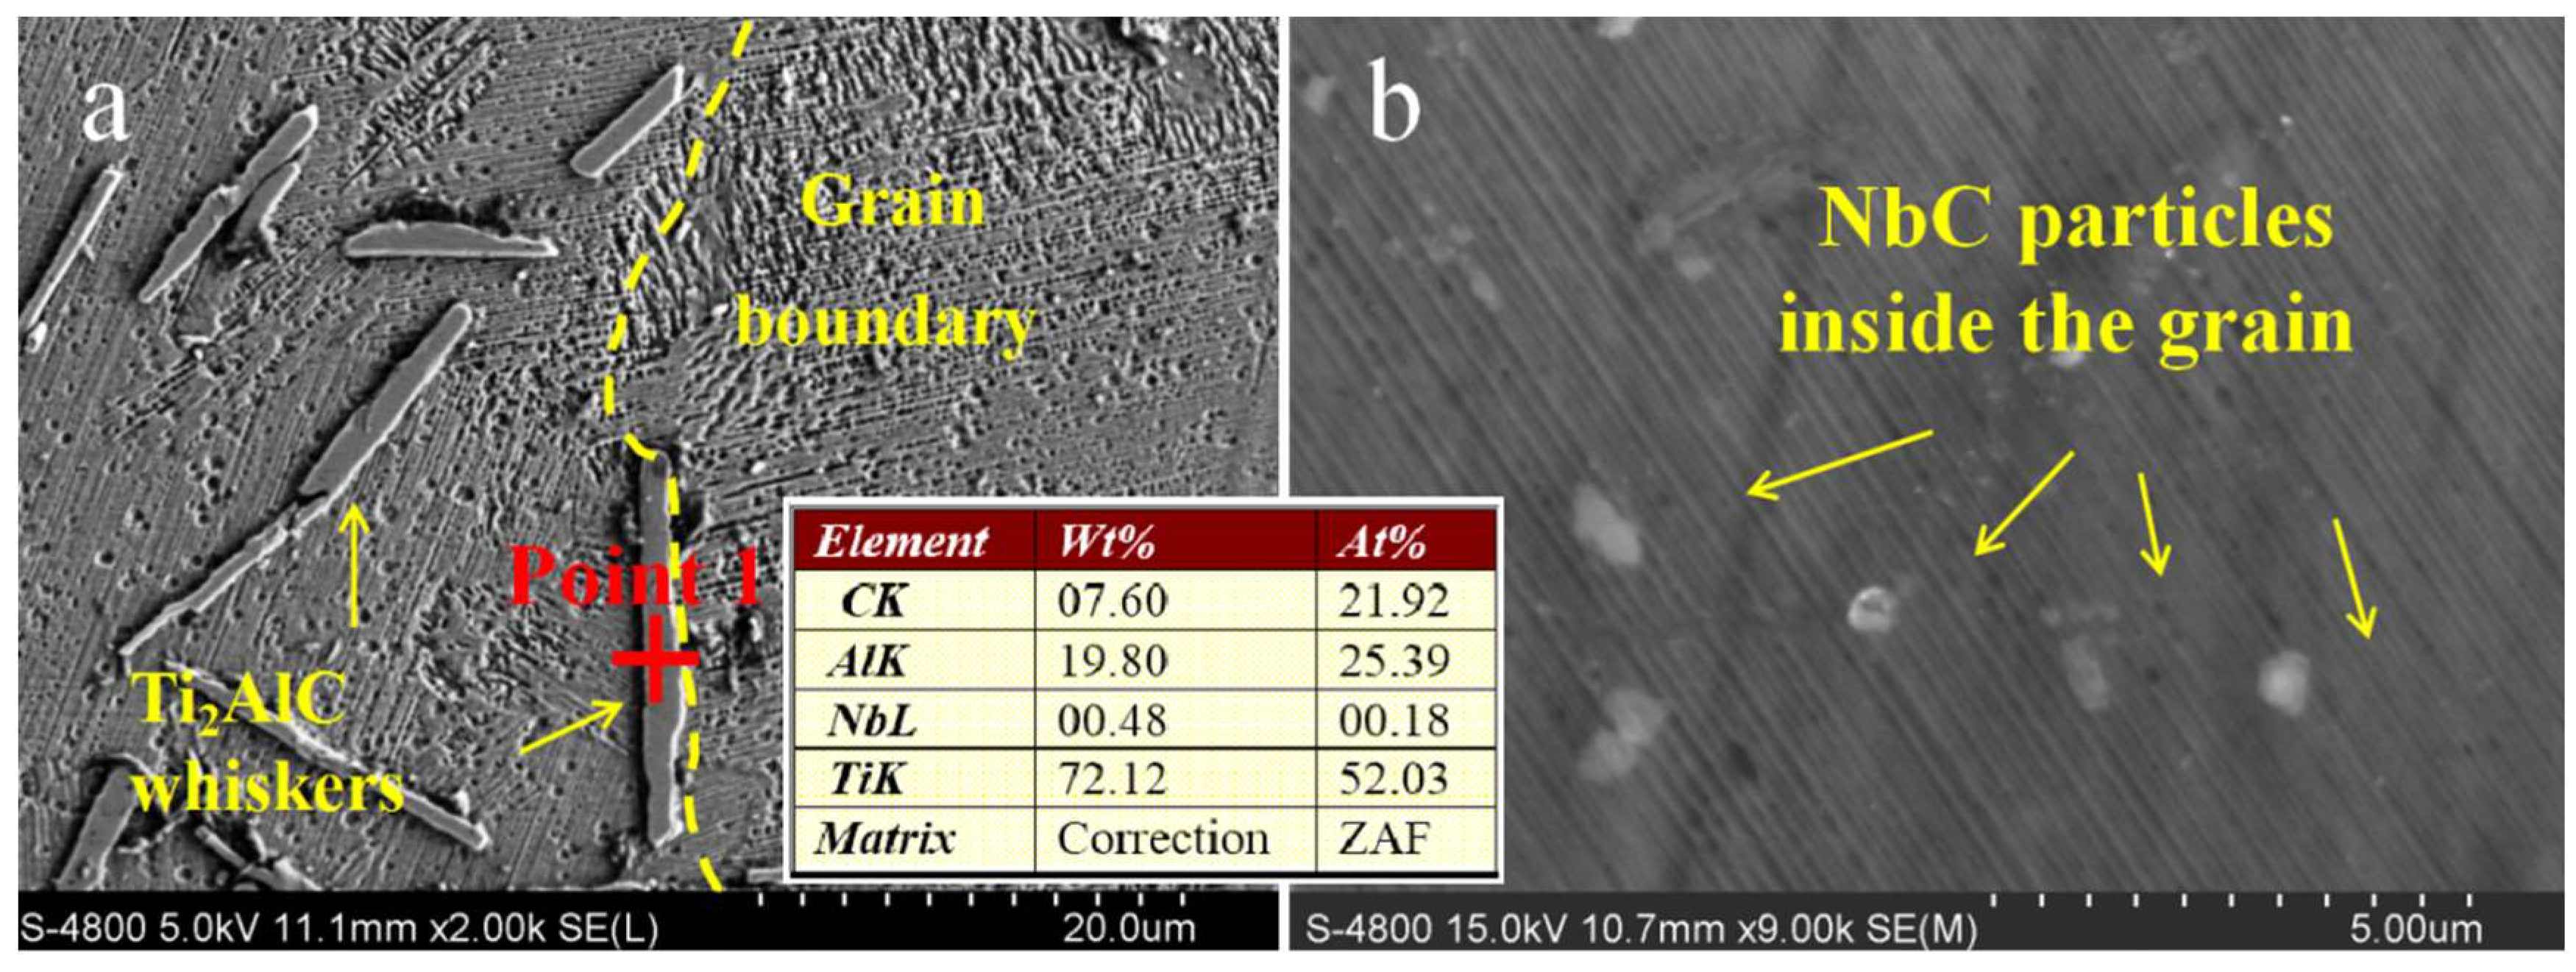
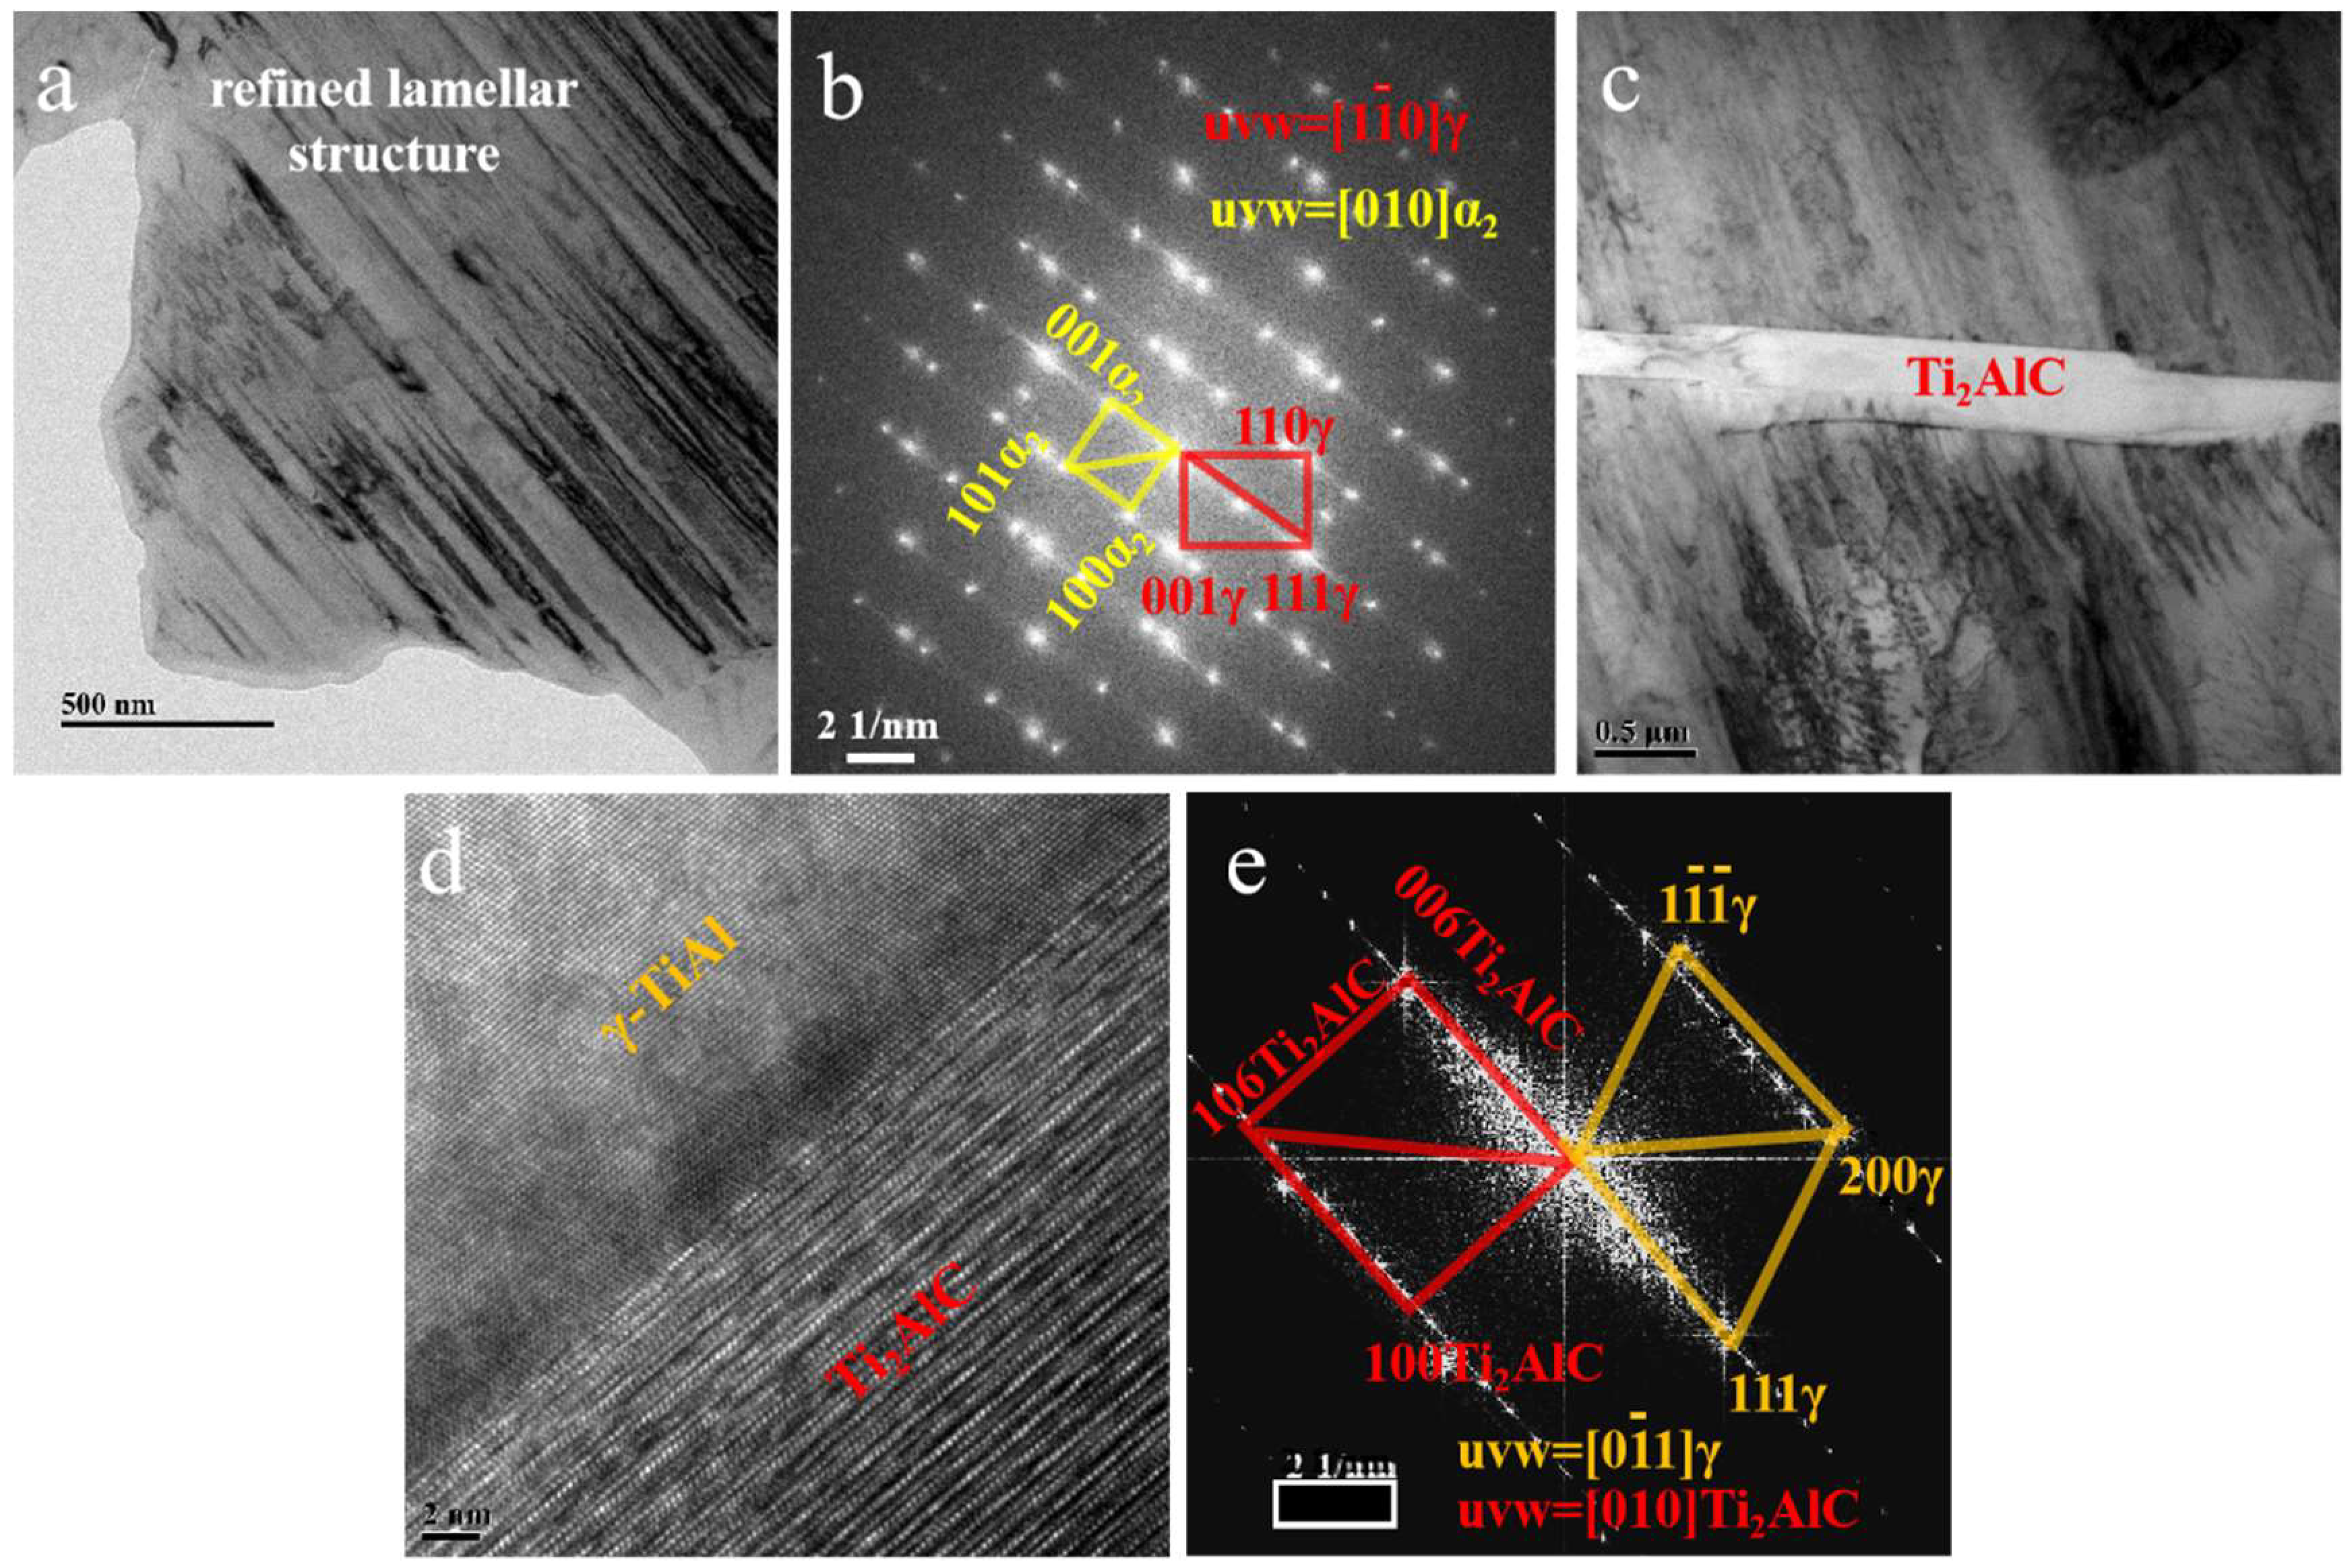
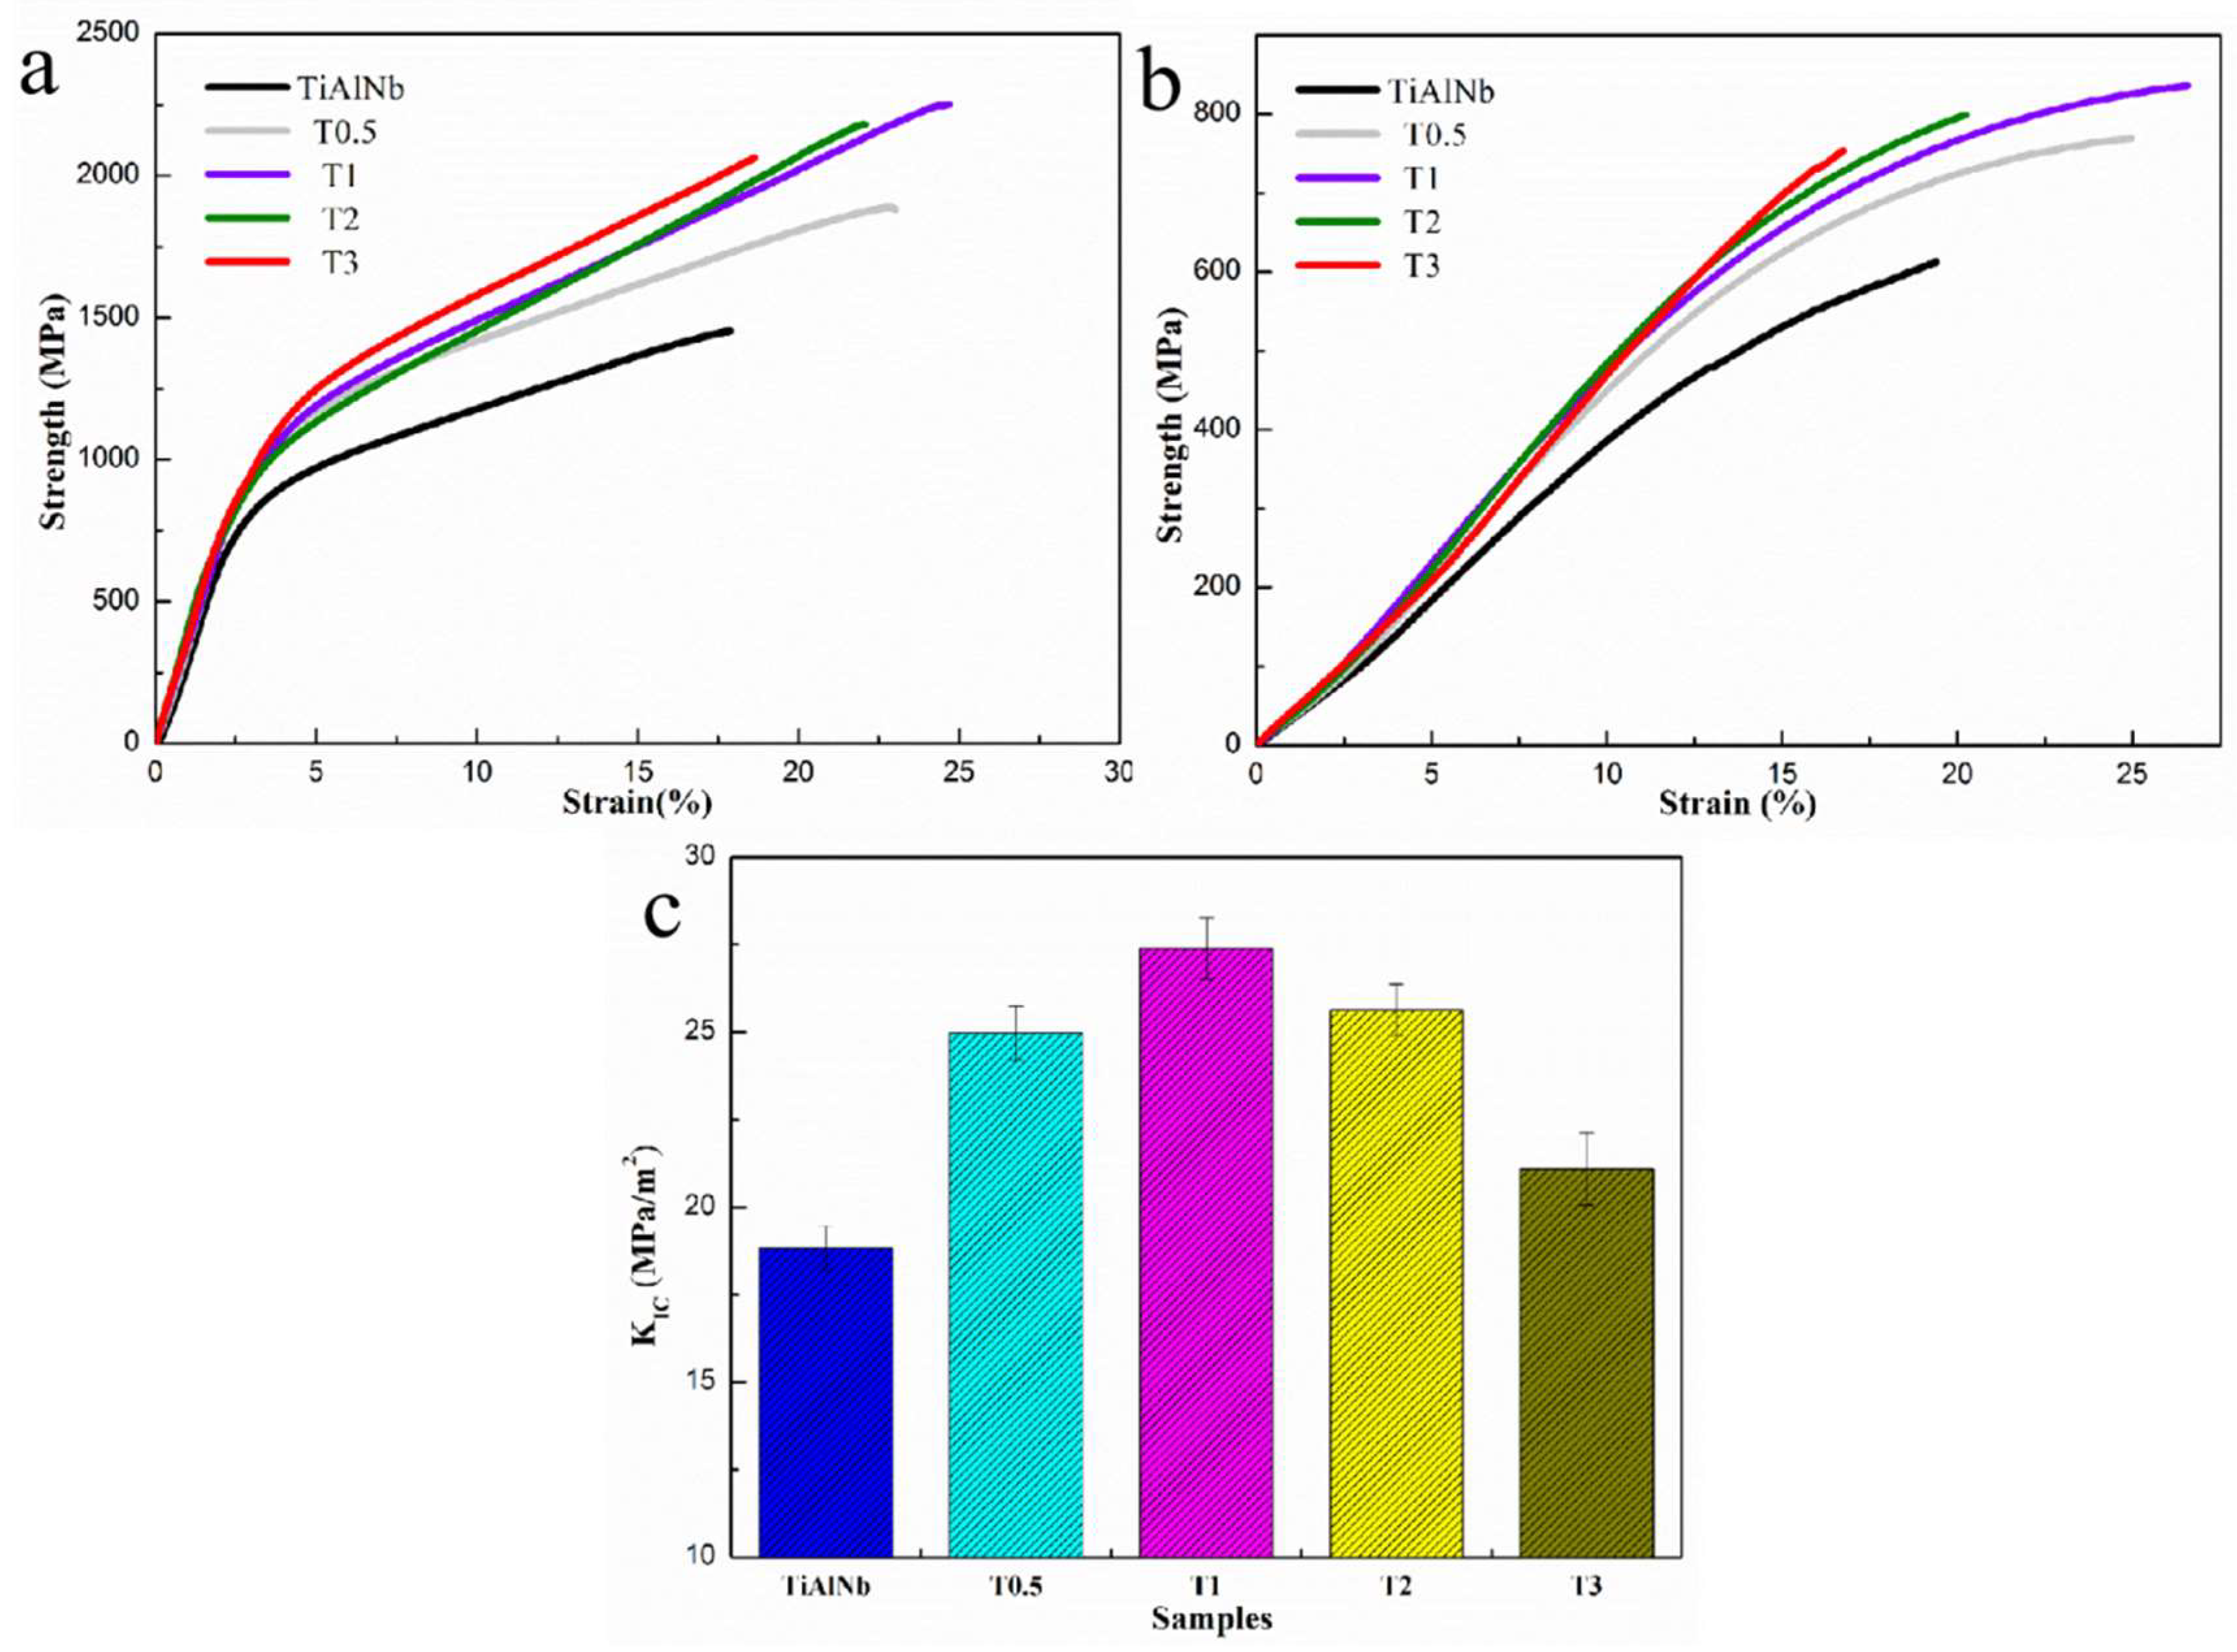
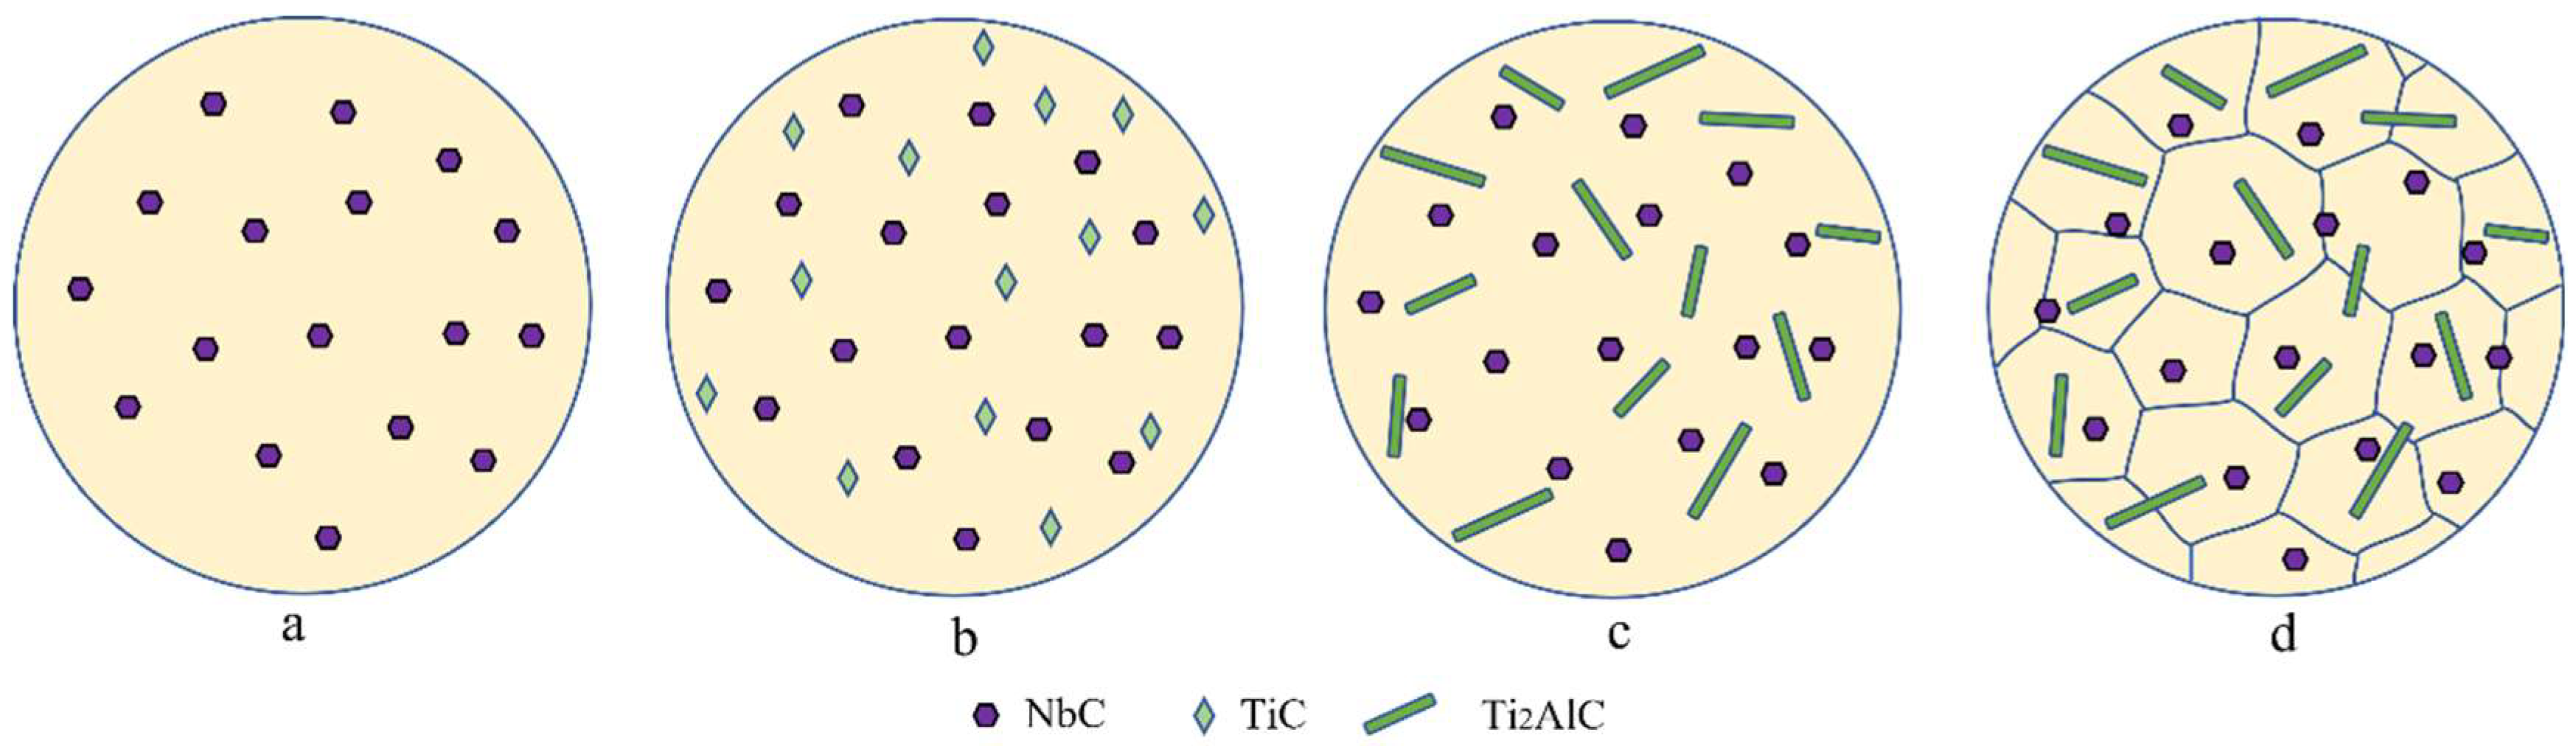
Room-temperature (RT) compression tests are carried out by an SHT5305 universal tester (MTS Ltd, Shanghai, China) with electronic extensometer. The strain rate of compression is ε′= 2.5 × 10⁻⁴ s−1. High-temperature (HT) compression tests are carried out by a Gleeble 3180 (DSi Ltd., Minneapolis, MN, USA) thermal mechanical simulator at 1073 K (a typical service temperature of TiAl alloy) with a strain rate of 0.01 s−1. The specimens of RT compression and HT compression tests are φ2 × 4 mm in size and φ8 × 12 mm in size, respectively. A microhardness test was carried out by an HMV-2T microhardness tester (SHIMADZU Ltd., Kyoto, Japan) with a diamond indenter under 980 mN load for 10 s. Each specimen was tested 10 times and the average values were regarded as the results. All the specimens are obtained by wire-electrode cutting followed by mechanical polish. Three-point bending tests are carried out by the SHT5305 universal tester at room temperature. The specimens are 2 × 4 × 20 mm in size with a span length of 16 mm and are all cut by electrical discharge machining followed by mechanical polishing. The bending samples are processed with a slit notch (2 mm in depth and 0.3 mm in width) to calculate the fracture toughness. The fracture toughness is calculated by the following equation [21]:
KIC = 3PL(10a)1/2/(200bh2)[1.93 − 3.07(a/h) + 14.53(a/h)2 − 25.07(a/h)3 + 25.80(a/h)4]
where KIC is the fracture toughness and a is the depth of the slit notch (mm). P is the maximum load (N), L is the span length (mm) and b and h refer to the width (mm) and thickness of the specimens (mm), respectively. The compression speed of cross head is 0.1 mm/min.

3. Results

The morphology and size of NbC/graphene mixed powders are determined by SEM. As shown in Figure 1, it is easy to distinguish the graphene flake and the NbC particles in the mixed powders in Figure 1a. Figure 1b,c show the EDS results of NbC and graphene, respectively. The flakes of graphene are about 10 μm in width. The spherical particles of NbC are about 2 μm in size. The flake-like graphene has a large size and floats on top of the NbC particles. Hence, this mixed powder needs to be processed by ball-milling to refine the size and reduce the segregation of the graphene.
Figure 2 shows the morphology of the mixed powders after ball-milling. Figure 2a,c,e show the 500× micrographs of powders after 6 h, 12 h and 20 h of ball-milling. Figure 2b,d,e show the corresponding images of the microstructure at 5000×, respectively. The evolution of powder morphology at 500× shows that the size of the graphene flakes decreases gradually. Meanwhile, the 5000× micrographs show that the dispersion degree increases as the ball-milling time increases. The morphology evolution from Figure 2b,d,f shows that the uniformity of the mixed powders is improved significantly; meanwhile, the size of the powders is decreased significantly.
The metallographic microstructures of the TiAlNb alloy and NTTC are exhibited in Figure 3. The grain size of the TiAlNb alloy is about 400 μm, as shown in Figure 3a. Moreover, micrometer-scale lamellas can be observed inside the grains. NTTC samples with different mass fraction (0.5%, 1%, 2%, 3%) are named as T0.5, T1, T2 and T3, respectively. The grain size of the TiAlNb matrix is about 400μm. With the addition of NbC and graphene, T0.5 in Figure 3b shows a much-refined grain size of nearly 100 μm. As the powder amount increases to 1%, the grain size of the T1 sample (Figure 3c) is slightly decreased compared with T0.5. However, as the mass fraction of NbC–graphene powders increases further, the grain size of the T2 sample in Figure 3d shows no significant difference with T1. Figure 3e shows the microstructure of the T3 sample, which differs greatly from those of the other samples. The content of the second phase increases significantly, and its grain size cannot be determined. In the high magnification image in Figure 3e, the segregation of the second phase could be observed.
The SEM images of NTTC are shown in Figure 4. The microstructure of T0.5, T1, T2 and T3 is displayed in Figure 4a–d, respectively. The rod-like phases in T0.5 and T1 show uniform distribution. As the mass fraction reaches 2%, the content of the second phases in T2 increases obviously; meanwhile, some particles tend to gather, which denotes that the segregation in the T2 sample has already begun. After this, the segregation of the second phase becomes more obvious in the T3 samples, as shown in Figure 3f; the second phase loses its rod-like appearance and irregular bulk appears.
For qualitative analysis of the rod-like second phase, the T1 samples were selected for further SEM and EBSD analysis, as shown in Figure 5. Figure 5a shows the SEM images showing the distribution of the rod-like second phases. The relative EBSD image of Figure 5a is shown in Figure 5b. The EBSD result shows that each rod has a single crystallographic orientation, which denotes that the rod-like second phases are in situ whiskers.
To further determine the phase formation of the whiskers and observe the distribution of ex situ NbC particles, the microstructure of the T1 sample inside the grains is analyzed, as shown in Figure 6. Figure 6a exhibits that the whiskers can be located both inside the grain and in the grain boundary. The insert is the EDS result of Point 1 in Figure 6a. According to this result, the atomic ratio of element Ti, Al and N is nearly 2:1:1; hence, the whiskers can be identified as Ti2AlC phase. Figure 6b shows the NbC particles which distribute in the lamellas inside the grain. Meanwhile, the refined lamellas can be observed in Figure 6, which shows roughly dozens of nanometers.
Figure 7 shows the TEM images of the T1 sample. Figure 7a shows the α2/γ lamellas in T1, which are less than 100 nm. Compared with the micrometer scale lamellas in the TiAlNb matrix, the lamellas in T1 have been significantly refined. Figure 7b shows the SAED patterns of the diaphasic lamellas in Figure 7a; the calibrate results show the typical Blackburn orientation relationship, which is the parallel relation between (111)γ and (0001)α2. Figure 7c shows a Ti2AlC whisker located in the lamellas. The HRTEM image of the interface between this whisker and the TiAl matrix is shown in Figure 7d, in which the parallel relationship between the two phases can be observed. The FFT patterns of Figure 7d are exhibited in Figure 7e. According to the calibration results, the specific orientation relationship between the two phases can be determined, which is (111)γ//(0006)Ti2AlC.
In order to analyze the mechanical properties of the NTTC and TiAlNb matrix, different tests are carried out, as shown in Figure 8. Figure 8a shows the room-temperature compression curves of the different samples. The fracture stress and strain of TiAlNb, T0.5, T1, T2 and T3 are 1453 MPa/17.8%, 1887 MPa/22.8%, 2247 MPa/24.4%, 2183 MPa/22.0% and 2063 MPa/18.6%, respectively. Figure 8b shows the compression curves of the different samples at 1073 K, the fracture stress and strain of TiAlNb, T0.5, T1, T2 and T3 are 612 MPa/19.4%, 769 MPa/24.9%, 836 MPa/26.6%, 798 MPa/20.2% and 753 MPa/16.7%, respectively. The fracture toughness of TiAlNb, T0.5, T1, T2 and T3 are 18.8 MPa/m2, 25.0 MPa/m2, 27.4 MPa/m2, 25.6 MPa/m2 and 21.1 MPa/m2, respectively, which are exhibited in Figure 8c. All the values are also presented in Table 1. (The Parallel test results of room temperature compression tests are shown in Supplementary Materials Tables S1 and S2) The mechanical properties of samples show that, with the addition of reinforcements, the mechanical properties of the TiAl alloy firstly improve and then deteriorate. T1 shows the best comprehensive mechanical properties. The microhardness of the different samples is shown in Table 2. The microhardness increases as the amount of reinforcements increases.

4. Discussion

4.1. The Refining Effects of Dual Reinforcements

Compared with the TiAlNb matrix, the grain size of the T1 sample was refined from 400 μm to less than 100 μm, and the lamellar spacing was refined from a few microns to less than 100 nm. The refining is attributed to the second phases, which act as the heterogeneous nuclei. The schematic diagrams are shown in Figure 9, which exhibits the evolution process of the second phases. Ex situ NbC has a melting point of 3500 °C, which can distribute stably in TiAlNb melt (Figure 9a). After that, as graphene reacts with Ti, TiC begins to generate in the melt (Figure 9b). Then, during the cooling process, TiC tends to react to transform into Ti2AlC, which it does according to the transformation pathway L + TiC → L + Ti2AlC [22]. Meanwhile, the Ti2AlC can spontaneously grow into whiskers in the melt, as shown in Figure 9c. During the subsequent cooling process, NbC particles and Ti2AlC whiskers will act as nucleation substrates and TiAlNb nucleates grow on the two second phases (Figure 9d). Abundant NbC particles, along with the Ti2AlC whiskers, provide plenty of nucleation sites for the nucleation of the TiAl melt, which refines the grain size and lamellar width significantly. Due to the different sizes of the two reinforcements, the number of NbC particles is much more than that of Ti2AlC whiskers. Therefore, NbC particles play a leading role in the refining effect of TiAlNb.

4.2. The Synergistic Strengthening Mechanisms

The increase in the strength of NTTC is attributed to the synergistic strengthening mechanisms brought by the hybrid NbC particles and Ti2AlC whiskers, including fine grain strengthening, Orowan strengthening, Load Transferring (LT) strengthening and Coefficient of thermal expansion (CTE) mismatch strengthening.
The mechanical properties of the TiAl alloy are significantly influenced by the grain size and lamellar width. As the lamellar width is refined, the mechanical properties of TiAl are improved, such as the yield strength, ductility, fracture toughness and creep resistance. According to the Hall–Petch equation, yield strength σy of the alloy can be described as [23]:
σ y = σ 0 + K y d
where σ0 is the lattice frictional resistance due to single dislocation movement, Ky is a material constant and d is the average grain size. As the grain size and lamellar width are both refined, the number of grain boundaries [24] and lamellar interfaces increases. As a result, the resistance to dislocation motion is greatly enhanced, thus increasing the strength of the TiAlNb alloy. According to the analysis of the refining effect, in the two reinforcements, NbC plays the main role in the fine grain strengthening mechanism.
When the dislocation moves near the second phase, due to the high strength of the second phase, the dislocation is unable to pass through the particle but bypasses them, leaving a dislocation loop around the particle, which is called the pinning effect on dislocation [25,26]. These bending dislocation lines will increase the lattice distortion energy in the affected region of dislocation and increase the resistance of the dislocation movement, thus resulting in an increase in material strength. The effect of the Orowan strengthening mechanism can be described by the following equation [27]:
σ Orowan = MGb d P ( 6 V R π ) 1 / 3
where M denotes the Taylor factor, G is the shearing modulus of TiAlNb matrix, b is the burger vector, dp is the diameter of the second phase particles and VR is the volume fraction of the second phases. It is easy to notice that for the second phase with a given volume fraction, the smaller the diameter, the stronger the effect of Orowan strengthening.
Ti2AlC whiskers have a much larger scale than the NbC particles; hence, the Ti2AlC/TiAl interfacial stability has a much greater influence on the mechanical properties of the composite, which should be analyzed. According to the HRTEM image and FFT patterns in Figure 7d,e, the parallel relationship between (0006)Ti2AlC and (111)γ−TiAl has already been described. The planar mismatch value δ of (0006)Ti2AlC/(111)γ−TiAl is calculated to be 2.59% (d(0006)Ti2AlC = 0.226 nm, d(111)γ−TiAl = 0.232 nm), which is smaller than 5%. Hence, the bonding mode of this interface belongs to the coherent interface. The coherent interface can effectively promote the transfer of load between the matrix and whisker. Thus, the excellent mechanical properties of whisker reinforcement can be fully utilized. In the service process, whiskers can effectively share the external load through the coherent interface so as to improve the comprehensive mechanical properties of materials and delay the fracture and failure of the materials.
Due to the difference in thermal expansion coefficient α between the matrix and the reinforcements (αTiAl = 10.4~11.1 × 10⁻⁶ K−1, αNbC = 6.65 × 10⁻⁶ K−1, αTi2AlC = 8.2 × 10⁻⁶ K−1), the microscopic deformation of the matrix and reinforcements is different in the process of solidification, resulting in the arising of geometrically necessary dislocations and leading to the enhancement of material strength, which is named as the coefficient of thermal expansion (CTE) strengthening [28,29]. The contribution of CTE mismatch to the strength can be determined by [30]:
σ CTE = 3 β G ρ CTE
ρ CTE = 12 V R Δ α Δ T 1 V R bd R
where β is the dislocation strengthening coefficient and ρCTE is the dislocation density, which is caused by the difference in thermal expansion coefficient between the matrix and the reinforcements. dR is the particle size of the reinforcement. Δα is the CTE difference between the matrix and the nanoparticles and ΔT is the temperature change. Due to the existence of the mismatch of CTE, both NbC and Ti2AlC contribute to the CTE strengthening.
The toughening of NTTC is mainly attributed to the grain refining effect and the effect of whiskers. By bearing the load which is transferred from the matrix, the fracture of the composite can be delayed. Meanwhile, when cracks start to extend, whiskers can cause the deflection of these cracks, thus increasing the distance of crack propagation and delaying the fracture.
In accordance with the microstructure and mechanical properties shown in Figure 3, Figure 4 and Figure 8, the amount of reinforcements influences the morphology and mechanical properties of MMCs. Especially when the content of reinforcements reaches a certain value, the ceramic phases will aggregate and deteriorate the properties. The aggregated bulk easily causes stress concentration, which causes the material to fracture under a small strain. Therefore, the total energy absorbed by the material from deformation to fracture is also reduced, which is reflected in the reduction of fracture toughness of the T3 sample compared with the T2 sample. This is a common phenomenon in MMCs containing particle reinforcement. Under the condition of the same volume fraction, whisker second phase has obvious excellent advantages compared with the agglomeration particles’ second phase. Therefore, the dual scaled reinforcements in this study have the advantage of adjusting the morphology of second phases.

5. Conclusions

NbC particles and in situ Ti2AlC whiskers are introduced into a TiAl alloy by a casting method; the mechanical properties of this composite are influenced by the content of the reinforcements. The key to this method is to control the morphology and distribution of the reinforcements. NTTC with 1 wt.% NbC/graphene powders exhibits the best mechanical properties, in which the second phases have ideal morphology and distribution. Particle reinforcements alone with the in situ Ti2AlC whiskers can improve the comprehensive mechanical properties of the TiAl matrix by the synergistic strengthening mechanisms. The future development direction of TiAl composites in this work is mainly to reduce its casting defects by hot isostatic pressing (HIP) treatment to obtain high-temperature structural materials with low cost and high performance.

Supplementary Materials

The following supporting information can be downloaded at: https://www.mdpi.com/article/10.3390/ma16134661/s1, Table S1: Parallel test data of room temperature compression tests (group 1); Table S2: Parallel test data of room temperature compression tests (group 2); Figure S1: Macro photo of the sample T1.

Author Contributions

Conceptualization, S.C.; Methodology, S.C.; Software, S.C.; Supervision, C.C. and X.W.; Writing—original draft, S.C. All authors have read and agreed to the published version of the manuscript.

Funding

This work is supported by the National Natural Science Foundation of China, grant number 51871087. Natural Science Foundation of Hebei Province, China (No. E2021202140). Innovation Fund for Outstanding Youth (EERI_OY2022009), “S&T Program of Hebei” (225676163GH).

Institutional Review Board Statement

Not applicable.

Informed Consent Statement

Not applicable.

Data Availability Statement

All data included in this study are available upon request by contact with the corresponding author.

Conflicts of Interest

The authors declare that they have no known competing financial interest or personal relationships that could have appeared to influence the work reported in this paper.

References

  1. Xu, R.R.; Li, M.Q.; Zhao, Y.H. A review of microstructure control and mechanical performance optimization of γ-TiAl alloys. J. Alloys Compd. 2023, 932, 167611. [Google Scholar] [CrossRef]
  2. Avdeeva, V.; Bazhina, A.; Antipov, M. Relationship between Structure and Properties of Intermetallic Materials Based on γ-TiAl Hardened In Situ with Ti3Al. Metals 2023, 6, 1002. [Google Scholar] [CrossRef]
  3. Song, L.; Appel, F.; Wang, L. New insights into high-temperature deformation and phase transformation mechanisms of lamellar structures in high Nb-containing TiAl alloys. Acta Mater. 2020, 186, 575–586. [Google Scholar] [CrossRef]
  4. Liu, Y.; Li, J.S.; Tang, B. The microstructure evolution and phase transformation behavior of a β-solidifying γ-TiAl alloy during creep. Prog. Nat. Sci. Mater. Int. 2023, 33, 193–202. [Google Scholar] [CrossRef]
  5. Xu, W.C.; Shan, D.B.; Zhang, H. Effects of extrusion deformation on microstructure, mechanical properties and hot workability of β containing TiAl alloy. Mater. Sci. Eng. A 2013, 571, 199–206. [Google Scholar] [CrossRef]
  6. Baradeswaran, A.; Elaya Perumal, A. Study on mechanical and wear properties of Al. 7075/Al2O3/graphite hybrid composites. Compos. B Eng. 2014, 56, 464–471. [Google Scholar] [CrossRef]
  7. Sun, T.L.; Guo, Z.C.; Cao, J. Isothermal oxidation behavior of high-Nb-containing TiAl alloys doped with W, B, Y, and C/Si. Corros. Sci. 2023, 213, 110980. [Google Scholar] [CrossRef]
  8. Sougavabar, M.A.; Niknam, S.A.; Davoodi, B. Experimental characterization of tool wear morphology in milling of Al520-MMC reinforced with SiC particles and additive elements Bi and Sn. J. Mater. Res. Technol. 2023, 23, 571–585. [Google Scholar] [CrossRef]
  9. Wang, Y.M.; Zhu, M.; Dong, L.L. In-situ synthesized TiC/Ti-6Al-4V composites by elemental powder mixing and spark plasma sintering: Microstructural evolution and mechanical properties. J. Alloys Compd. 2023, 947, 169557. [Google Scholar] [CrossRef]
  10. Li, J.; Zhao, K.; Ren, L. Microstructure evolution, mechanical properties, and strengthening mechanisms of heat-resistant Al-based composite reinforced by a combination of AlN and TiN particles. J. Mater. Res. Technol. 2023, 24, 5628–5641. [Google Scholar] [CrossRef]
  11. Wang, F.C.; Zhang, J.F.; Sun, K.X. Synergistic reinforcement effect of Fe and in-situ synthesized MgAlB4 whiskers in Al matrix composites. Compos. B Eng. 2022, 246, 110267. [Google Scholar] [CrossRef]
  12. Pourasiabi, H.; Gates, J.D. Effects of chromium carbide volume fraction on high-stress abrasion performance of NbC-bearing high chromium white cast irons. Wear 2022, 498–499, 204312. [Google Scholar] [CrossRef]
  13. Wang, Z.J.; Zhou, M.J.; Jiang, Y.H. Effects of in situ NbC on the microstructure and high-temperature friction wear properties of 4Cr5MoSiV1 steel. J. Mater. Res. Technol. 2023, 24, 6159–6173. [Google Scholar] [CrossRef]
  14. Yang, A.C.; Duan, Y.H.; Bao, L.K. Elastic properties, tensile strength, damage tolerance, electronic and thermal properties of TM3AlC2 (TM = Ti, Zr and Hf) MAX phases: A first-principles study. Vacuum 2022, 206, 111497. [Google Scholar] [CrossRef]
  15. Chen, W.T.; Yu, W.B.; Ma, C.S. A review of novel ternary nano-layered MAX phases reinforced AZ91D magnesium composite. J. Magnes. Alloy. 2022, 10, 1457–1475. [Google Scholar] [CrossRef]
  16. Salvo, C.; Chicardi, E.; Hernández-Saz, J. Microstructure, electrical and mechanical properties of Ti2AlN MAX phase reinforced copper matrix composites processed by hot pressing. Mater. Charact. 2021, 171, 110812. [Google Scholar] [CrossRef]
  17. Pei, X.; Yuan, M.N.; Wang, H.L. Revealing the interface properties of the Ti2AlC/TiAl composite from a first principles investigation. Appl. Surf. Sci. 2023, 617, 156491. [Google Scholar] [CrossRef]
  18. Guo, Y.C.; Liang, Y.F.; Lin, J.P. In situ synthesis of nano/micron Ti2AlC reinforced high-Nb TiAl composites: Microstructure and mechanical properties. Intermetallics 2023, 159, 107937. [Google Scholar] [CrossRef]
  19. Chen, S.Y.; Tan, Y.M.; Wang, X. Comparing the role of Zr and Hf atoms on microstructure and mechanical properties optimization of Ti2AlN reinforced Ti48Al0.5W composites. J. Alloys Compd. 2023, 935, 168159. [Google Scholar] [CrossRef]
  20. Li, J.G.; Hu, R.; Zhou, M. High temperature micromechanical behavior of Ti2AlN particle reinforced TiAl based composites investigated by in-situ high-energy X-ray diffraction. Mater. Des. 2021, 212, 110225. [Google Scholar] [CrossRef]
  21. Cui, X.P.; Ding, H.; Zhang, Y.Y. Fabrication, microstructure characterization and fracture behavior of a unique micro-laminated TiB-TiAl composites. J. Alloys Compd. 2019, 775, 1057–1067. [Google Scholar] [CrossRef]
  22. Lapin, J.; Kamyshnykova, K. Processing, microstructure and mechanical properties of in-situ Ti3Al+TiAl matrix composite reinforced with Ti2AlC particles prepared by centrifugal casting. Intermetallics 2018, 98, 34–44. [Google Scholar] [CrossRef]
  23. Hall, E.O. The deformation and ageing of mild steel: III discussion of results. Proc. Phys. Soc. Sect. B 1951, 64, 747–752. [Google Scholar] [CrossRef]
  24. Hu, P.H.; Song, H.W.; Chen, Y. Mechanisms for refining precipitation and improving strengthening of annealed Cu-2Ag alloy via La modification. J. Alloys Compd. 2021, 883, 160912. [Google Scholar] [CrossRef]
  25. Lv, Y.T.; Zhang, Z.; Zhang, Q. Cracking inhibition behavior and the strengthening effect of TiC particles on the CM247LC superalloy prepared by selective laser melting. Mater. Sci. Eng. A 2022, 858, 144119. [Google Scholar] [CrossRef]
  26. Wang, H.Y.; Lu, H.; Ren, Y.P. Strengthening mechanisms and tensile properties of 20Cr2Mn2Mo processed by laser shock peening and vacuum carbonitriding. Surf. Coat. Technol. 2022, 439, 128462. [Google Scholar]
  27. Liu, G.; Zhang, G.; Jiang, F. Nanostructured high-strength molybdenum alloys with unprecedented tensile ductility. Nat. Mater. 2013, 12, 344–350. [Google Scholar] [CrossRef]
  28. Mallmann, C.; Hannard, F.; Ferrié, E. Unveiling the impact of the effective particles distribution on strengthening mechanisms: A multiscale characterization of Mg+Y2O3 nanocomposites. Mater. Sci. Eng. A 2019, 764, 138170. [Google Scholar] [CrossRef] [Green Version]
  29. Wu, Y.H.; Liu, B.X.; Kang, H.J. Ultrasound-assisted dispersion of TiB2 nanoparticles in 7075 matrix hybrid composites. Mater. Sci. Eng. A 2022, 840, 142958. [Google Scholar] [CrossRef]
  30. Goh, C.S.; Wei, J.; Lee, L.C. Properties and deformation behaviour of Mg-Y2O3 nanocomposites. Acta Mater. 2007, 55, 5115–5121. [Google Scholar] [CrossRef]
Figure 1. SEM image and EDS patterns of mixed powders. (a) SEM image showing the morphology of NbC and graphene. (b) and (c) are the EDS results of point 1 and point 2 in Figure 1a, respectively.
Materials 16 04661 g001
Figure 2. SEM images showing the NbC–graphene mixed powders after different ball-milling times. (a,c,e) are the microstructure of NbC–graphene after 6 h, 12 h and 20 h ball-milling at 500×, respectively. (b,d,f) are the micrographs at 5000× of powders in Figure 2a,c,e, respectively.
Materials 16 04661 g002
Figure 3. Microstructure of TiAlNb and NTTC. (a) Coarse TiAlNb grains. (b,c,d,e) are the microstructure of NTTC with 0.5 wt.%, 1 wt.%, 2 wt.% and 3 wt.% NbC–graphene powders (named as T0.5, T1, T2 and T3, respectively). (f) refers to the high magnification images of the T3 sample.
Materials 16 04661 g003
Figure 4. SEM images showing the microstructure of NTTC. (a) T0.5. (b) T1. (c) T2. (d) T3.
Materials 16 04661 g004
Figure 5. SEM image and the relative EBSD results of T1 sample. (a) Microstructure with abundant rod-like second phase. (b) EBSD image of (a).
Materials 16 04661 g005
Figure 6. Microstructure of T1 samples. (a) Ti2AlC whiskers inside the grain and in the grain boundary. (b) NbC particles in the lamellas.
Materials 16 04661 g006
Figure 7. TEM image of T1 sample. (a) Refined α2/γ lamellar structure in T1 sample. (b) SAED patterns of α2/γ in (a). (c) TEM image showing the location of Ti2AlC whisker in the lamellas. (d) HRTEM image showing the interface between Ti2AlC and γ-TiAl. (e) FFT patterns of (d).
Materials 16 04661 g007
Figure 8. Comparison of mechanical properties between TiAlNb, T0.5, T1, T2 and T3. (a) Room-temperature compression curves. (b) High-temperature (1073 K) compression curves. (c) Fracture toughness results of different samples.
Materials 16 04661 g008
Figure 9. Schematic diagrams showing the formation of Ti2AlC whiskers in TiAlNb. (a) NbC in TiAlNb melt. (b) TiC generates first in TiAlNb. (c) Ti2AlC generates in TiAlNb. (d) TiAlNb nucleates and solidifies.
Materials 16 04661 g009
Table 1. Mechanical properties of different samples.
SamplesTiAlNbT0.5T1T2T3
Properties
Room TemperatureCompression
Strain (%)
17.822.824.422.018.6
Compression
Stress (MPa)
14531887224721832063
Fracture toughness (MPa/m2)18.825.027.425.621.1
High Temperature
(1073 K)
Compression
Strain (%)
19.424.926.620.216.7
Compression
Stress (MPa)
612769836798753
Table 2. Microhardness of different samples.
SamplesTiAlNbT0.5T1T2T3
Microhardness
(HV)
489521531558567
Disclaimer/Publisher’s Note: The statements, opinions and data contained in all publications are solely those of the individual author(s) and contributor(s) and not of MDPI and/or the editor(s). MDPI and/or the editor(s) disclaim responsibility for any injury to people or property resulting from any ideas, methods, instructions or products referred to in the content.

