
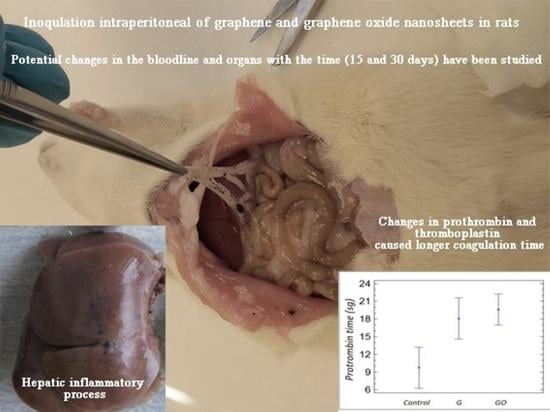
Biological Responses in the Blood and Organs of Rats to Intraperitoneal Inoculation of Graphene and Graphene Oxide

 and
and
Abstract
:
1. Introduction
2. Materials and Methods
2.1. Graphene Derivative
2.2. Animals
2.3. Surgical Procedure
2.4. Histological Examination
2.5. Hematological Examination
2.6. Data Analysis
3. Results
3.1. Macroscopic Observation
3.2. Histological Examination
3.3. Hematological Results
4. Discussion
5. Conclusions
Author Contributions
Funding
Institutional Review Board Statement
Informed Consent Statement
Data Availability Statement
Acknowledgments
Conflicts of Interest
References
- Novoselov, K.S.; Geim, A.K.; Morozov, S.V.; Jiang, D.; Zhang, Y.; Dubonos, S.V.; Grigorieva, I.V.; Firsov, A.A. Electric field effect in atomically thin carbon films. Science 2004, 306, 666–669. [Google Scholar] [CrossRef] [PubMed] [Green Version]
- Jeong, H.K.; Lee, Y.P.; Lahaye, R.J.; Park, M.H.; An, K.H.; Kim, I.J.; Yang, C.-W.; Park, C.Y.; Ruoff, A.R.S.; Lee, Y.H. Evidence of graphitic AB stacking order of graphite oxides. J. Am. Chem. Soc. 2008, 130, 1362–1366. [Google Scholar] [CrossRef] [PubMed]
- Barinov, A.; Malcioglu, B.; Fabris, S.; Sun, T.; Gregoratti, L.; Dalmiglio, M.; Kiskinova, M. Initial stages of oxidation on graphitic surfaces: Photoemission study and density functional theory calculations. J. Phys. Chem. C 2009, 113, 9009–9013. [Google Scholar] [CrossRef]
- Perrozzi, F.; Prezioso, S.; Ottaviano, L. Graphene oxide: From fundamentals to applications. J. Phys. Condens. Matter 2015, 27, 013002. [Google Scholar] [CrossRef] [Green Version]
- Wang, K.; Ruan, J.; Song, H.; Zhang, J.; Wo, Y.; Guo, S.; Cui, D. Biocompatibility of Graphene Oxide. Nanoscale Res. Lett. 2011, 6, 8. Available online: http://www.nanoscalereslett.com/content/6/1/8 (accessed on 5 September 2021). [CrossRef] [Green Version]
- Hong, B.J.; Compton, O.C.; An, Z.; Eryazici, I.; Nguyen, S. Successful stabilization of graphene oxide in electrolyte solutions: Enhancement of biofunctionalization and cellular uptake. ACS Nano 2011, 6, 63–73. [Google Scholar] [CrossRef] [Green Version]
- Akhavan, O.; Ghaderi, E.; Emamy, H.; Akhavan, F. Genotoxicity of graphene nanoribbons in human mesenchymal stem cells. Carbon 2013, 54, 419–431. [Google Scholar] [CrossRef]
- De Marzi, L.; Ottaviano, L.; Perrozzi, F.; Nardone, M.; Santucci, S.; De Lapuente, J.; Borras, M.; Treossi, E.; Palermo, V.; Poma, A. Flake size-dependent cyto and genotoxic evaluation of graphene oxide on in vitro A549, CaCo2 and vero cell lines. J. Biol. Regul. Homeost. Agents 2014, 28, 281–289. [Google Scholar]
- Zhang, X.Y.; Yin, J.L.; Peng, C.; Hu, W.Q.; Zhu, Z.Y.; Li, W.X.; Fan, C.; Huang, Q. Distribution and biocompatibility studies of graphene oxide in mice after intravenous administration. Carbon 2011, 49, 986–995. [Google Scholar] [CrossRef]
- Yang, K.; Gong, H.; Shi, X.; Wan, J.; Zhang, Y.; Liu, Z. In vivo biodistribution and toxicology of functionalized nano-graphene oxide in mice after oral and intraperitoneal administration. Biomaterials 2013, 34, 2787–2795. [Google Scholar] [CrossRef]
- Yang, K.; Wan, J.; Zhang, S.; Zhang, Y.; Lee, S.T.; Liu, Z. In vivo pharmacokinetics, long-term biodistribution and toxicology of PEGylated graphene in mice. ACS Nano 2010, 5, 516–522. [Google Scholar] [CrossRef] [PubMed]
- Yingbo, L.; Yan, W.; Liu, T.; Di, C.; Zhi, L.; Dengyuan, L.; Miao, Z.; Feng, G.; Qing, L.; Wang, S. Sub-Acute Toxicity Study of Graphene Oxide in the Sprague-Dawley Rat. Int. J. Environ. Res. Public Health 2016, 13, 1149. [Google Scholar] [CrossRef] [Green Version]
- Liu, Y.; Luo, Y.; Wu, J.; Wang, Y.; Yang, X.; Yang, R.; Wang, B.; Yang, J.; Zhang, N. Graphene oxide can induce in vitro and in vivo mutagenesis. Sci. Rep. 2013, 3, 3469. [Google Scholar] [CrossRef] [PubMed] [Green Version]
- Bianco, A. Graphene: Safe or toxic? The two faces of the medal. Angew. Chem. Int. Ed. 2013, 52, 4986–4997. [Google Scholar] [CrossRef] [PubMed]
- Ma, Y.; Shen, H.; Tu, X.; Zhang, Z. Assessing in vivo toxicity of graphene materials: Current methods and future outlook. Nanomedicine 2014, 9, 1565–1580. [Google Scholar] [CrossRef]
- Dobrovolskaia, M.A.; Clogston, J.D.; Neun, B.W.; Hall, J.B.; Patri, A.K.; McNeil, S.E. Method for Analysis of Nanoparticle Hemolytic Properties in vitro. Nano Lett. 2008, 8, 2180–2187. [Google Scholar] [CrossRef]
- Mendonça, M.C.P.; Soares, E.S.; Bispo de Jesus, M.; Ceragioli, H.J.; Irazusta, S.P.; Batista, A.G.; Vinolo, M.A.R.; Júnior, M.R.M.; Da Cruz-Höfling, M.A. Reduced graphene oxide: Nanotoxicological profile in rats. J. Nanobiotechnol. 2016, 14, 53–66. [Google Scholar] [CrossRef] [Green Version]
- Willi, P.; Sharma, C.P. Blood Compatibility and Biomedical Applications of Graphene. Trends Biomater. Artif. Organs 2011, 25, 91–94. Available online: http://www.sbaoi.org (accessed on 12 December 2021).
- Yang, Y.; Asiri, A.M.; Tang, Z.; Du, D.; Lin, Y. Graphene based materials for biomedical applications. Mater Today 2013, 16, 365–373. [Google Scholar] [CrossRef]
- Miao, W.; Shim, G.; Kang, C.M.; Lee, S.; Choe, Y.S.; Choi, H.G.; Oh, Y.K. Cholesteryl hyaluronic acid-coated, reduced graphene oxide nanosheets for anticancer drug delivery. Biomaterials 2013, 34, 9638–9647. [Google Scholar] [CrossRef]
- Liu, J.H.; Yang, S.T.; Wang, H.; Chang, Y.; Cao, A.; Liu, Y. Effect of size and dose on the biodistribution of graphene oxide in mice. Nanomedicine 2012, 7, 1801–1812. [Google Scholar] [CrossRef] [PubMed]
- Strojny, B.; Kurantowicz, N.; Sawosz, E.; Grodzik, M.; Jaworski, S.; Kutwin, M.; Wierzbicki, M.; Hotowy, A.; Lipińska, L.; Chwalibog, A. Long-Term Influence of Carbon Nanoparticles on Health and Liver Status in Rats. PLoS ONE 2015, 10, e0144821. [Google Scholar] [CrossRef] [PubMed] [Green Version]
- Kurantowicz, N.; Strojny, B.; Sawosz, E.; Jaworski, S.; Kutwin, M.; Grodzik, M.; Wierzbicki, M.; Lipińska, L.; Mitura, K.; Chwalibog, A. Biodistribution of a high dose of diamond, graphite, and graphene oxide nanoparticles after multiple intraperitoneal injections in rats. Nanoscale Res. Lett. 2015, 10, 398–412. [Google Scholar] [CrossRef] [PubMed] [Green Version]
- Chen, L.; Li, J.; Chen, Z.; Gu, Z.; Yan, L.; Zhao, F.; Zhang, A. Toxicological Evaluation of Graphene-Family Nanomaterials. J. Nanosci. Nanotechnol. 2020, 20, 1993–2006. [Google Scholar] [CrossRef]
- Patrick, C.W.; Uthamanthil, R.; Beahm, E.; Frye, C. Animal Models for Adipose Tissue Engineering. Tissue Eng. Part B Rev. 2008, 14, 167–178. [Google Scholar] [CrossRef] [Green Version]
- Nirmal, N.K.; Awasthi, K.K.; John, P.J. Hepatotoxicity of Graphene oxide in Wistar rats. Environ. Sci. Pollut. Res. Int. 2021, 28, 46367–46376. [Google Scholar] [CrossRef]
- Han, S.G.; Kim, J.K.; Shin, J.H.; Hwang, J.H.; Lee, J.S.; Kim, T.G.; Lee, J.H.; Lee, G.H.; Kim, K.S.; Lee, H.S.; et al. Pulmonary Responses of Sprague-Dawley Rats in Single Inhalation Exposure to Graphene Oxide Nanomaterials. Biomed Res. Int. 2015, 2015, 376756. [Google Scholar] [CrossRef] [Green Version]
- Kanakia, S.; Toussaint, J.D.; Mullick, S.C.; Tembulkar, T.; Lee, S.; Jiang, Y.P.; Lin, R.Z.; Shroyer, K.R.; Moore, W.; Sitharaman, B. Dose ranging, expanded acute toxicity and safety pharmacology studies for intravenously administered functionalized gra- phene nanoparticle formulations. Biomaterials 2014, 35, 7022–7031. [Google Scholar] [CrossRef] [Green Version]
- Guo, X.; Mei, N. Assessment of the toxic potential of graphene family nanomaterials. J. Food Drug Anal. 2014, 22, 105–115. [Google Scholar] [CrossRef] [Green Version]
- McCallion, C.; Burthem, J.; Rees-Unwin, K.; Golovanov, A.; Pluen, A. Graphene in therapeutics delivery: Problems, solutions and future opportunities. Eur. J. Pharm. Biopharm. 2016, 104, 235–250. [Google Scholar] [CrossRef]
- Feng, R.; Yu, Y.; Shen, C.; Jiao, Y.; Zhou, C. Impact of graphene oxide on the structure and function of important multiple blood components by a dose-dependent pattern. J. Biomed. Mater. Res. A 2015, 103, 2006–2014. [Google Scholar] [CrossRef] [PubMed]
- Dong, Z.; Zheng, J. Anticoagulation after coronary stenting: A systemic review. Br. Med. Bull. 2017, 123, 79–89. [Google Scholar] [CrossRef] [PubMed]
- Singh, S.K.; Singh, M.K.; Nayak, M.K.; Kumari, S.; Shrivastava, S.; Grácio, J.J.; Dash, D. Thrombus Inducing Property of Atomically Thin Graphene Oxide Sheets. ACS Nano 2011, 5, 4987–4996. [Google Scholar] [CrossRef] [PubMed]
- Escudero, M.L.; Llorente, I.; Pérez-Maceda, B.T.; San José-Pinilla, S.; Sánchez-López, L.; Lozano, R.M.; Aguado-Henche, S.; de Arriba, C.C.; Alobera-Gracia, M.; García-Alonso, M. Electrochemically reduced graphene oxide on CoCr biomedical alloy: Characterization, macrophage biocompatibility and hemocompatibility in rats with graphene and graphene oxide. Mater. Sci. Eng. C 2020, 109, 110522. [Google Scholar] [CrossRef] [PubMed]


| Animal Groups | |||
|---|---|---|---|
| Days | Group 1 (Control) | Group 2 (G) | Group 3 (GO) |
| 15 | 5 | 5 | - |
| 30 | 5 | 5 | 5 |
| Parameters | Control (Group 1) | 15 Days with G (Group 2) | 30 Days with G (Group 2) | 30 Days with GO (Group 3) |
|---|---|---|---|---|
| Leukocytes (103/mm3) | 4.668 ± 1.22 | 6.75 ± 2.18 | 5.72 ± 0.81 | 3.64 ± 1.43 |
| Basophils (%) | 0.30 ± 0.08 | 0.42 ± 0.13 | 0.14 ± 0.09 | 0.07 ± 0.067 |
| Basophils (103/mm3) | 0.02 ± 0.006 | 0.03 ± 0.017 | 0.01 ± 0.015 | 0.004 ± 0.005 |
| Platelets (103/µL) | 660.50 ± 213.48 | 861.20 ± 305.63 | 464.00 ± 271.70 | 668.20 ± 281.62 |
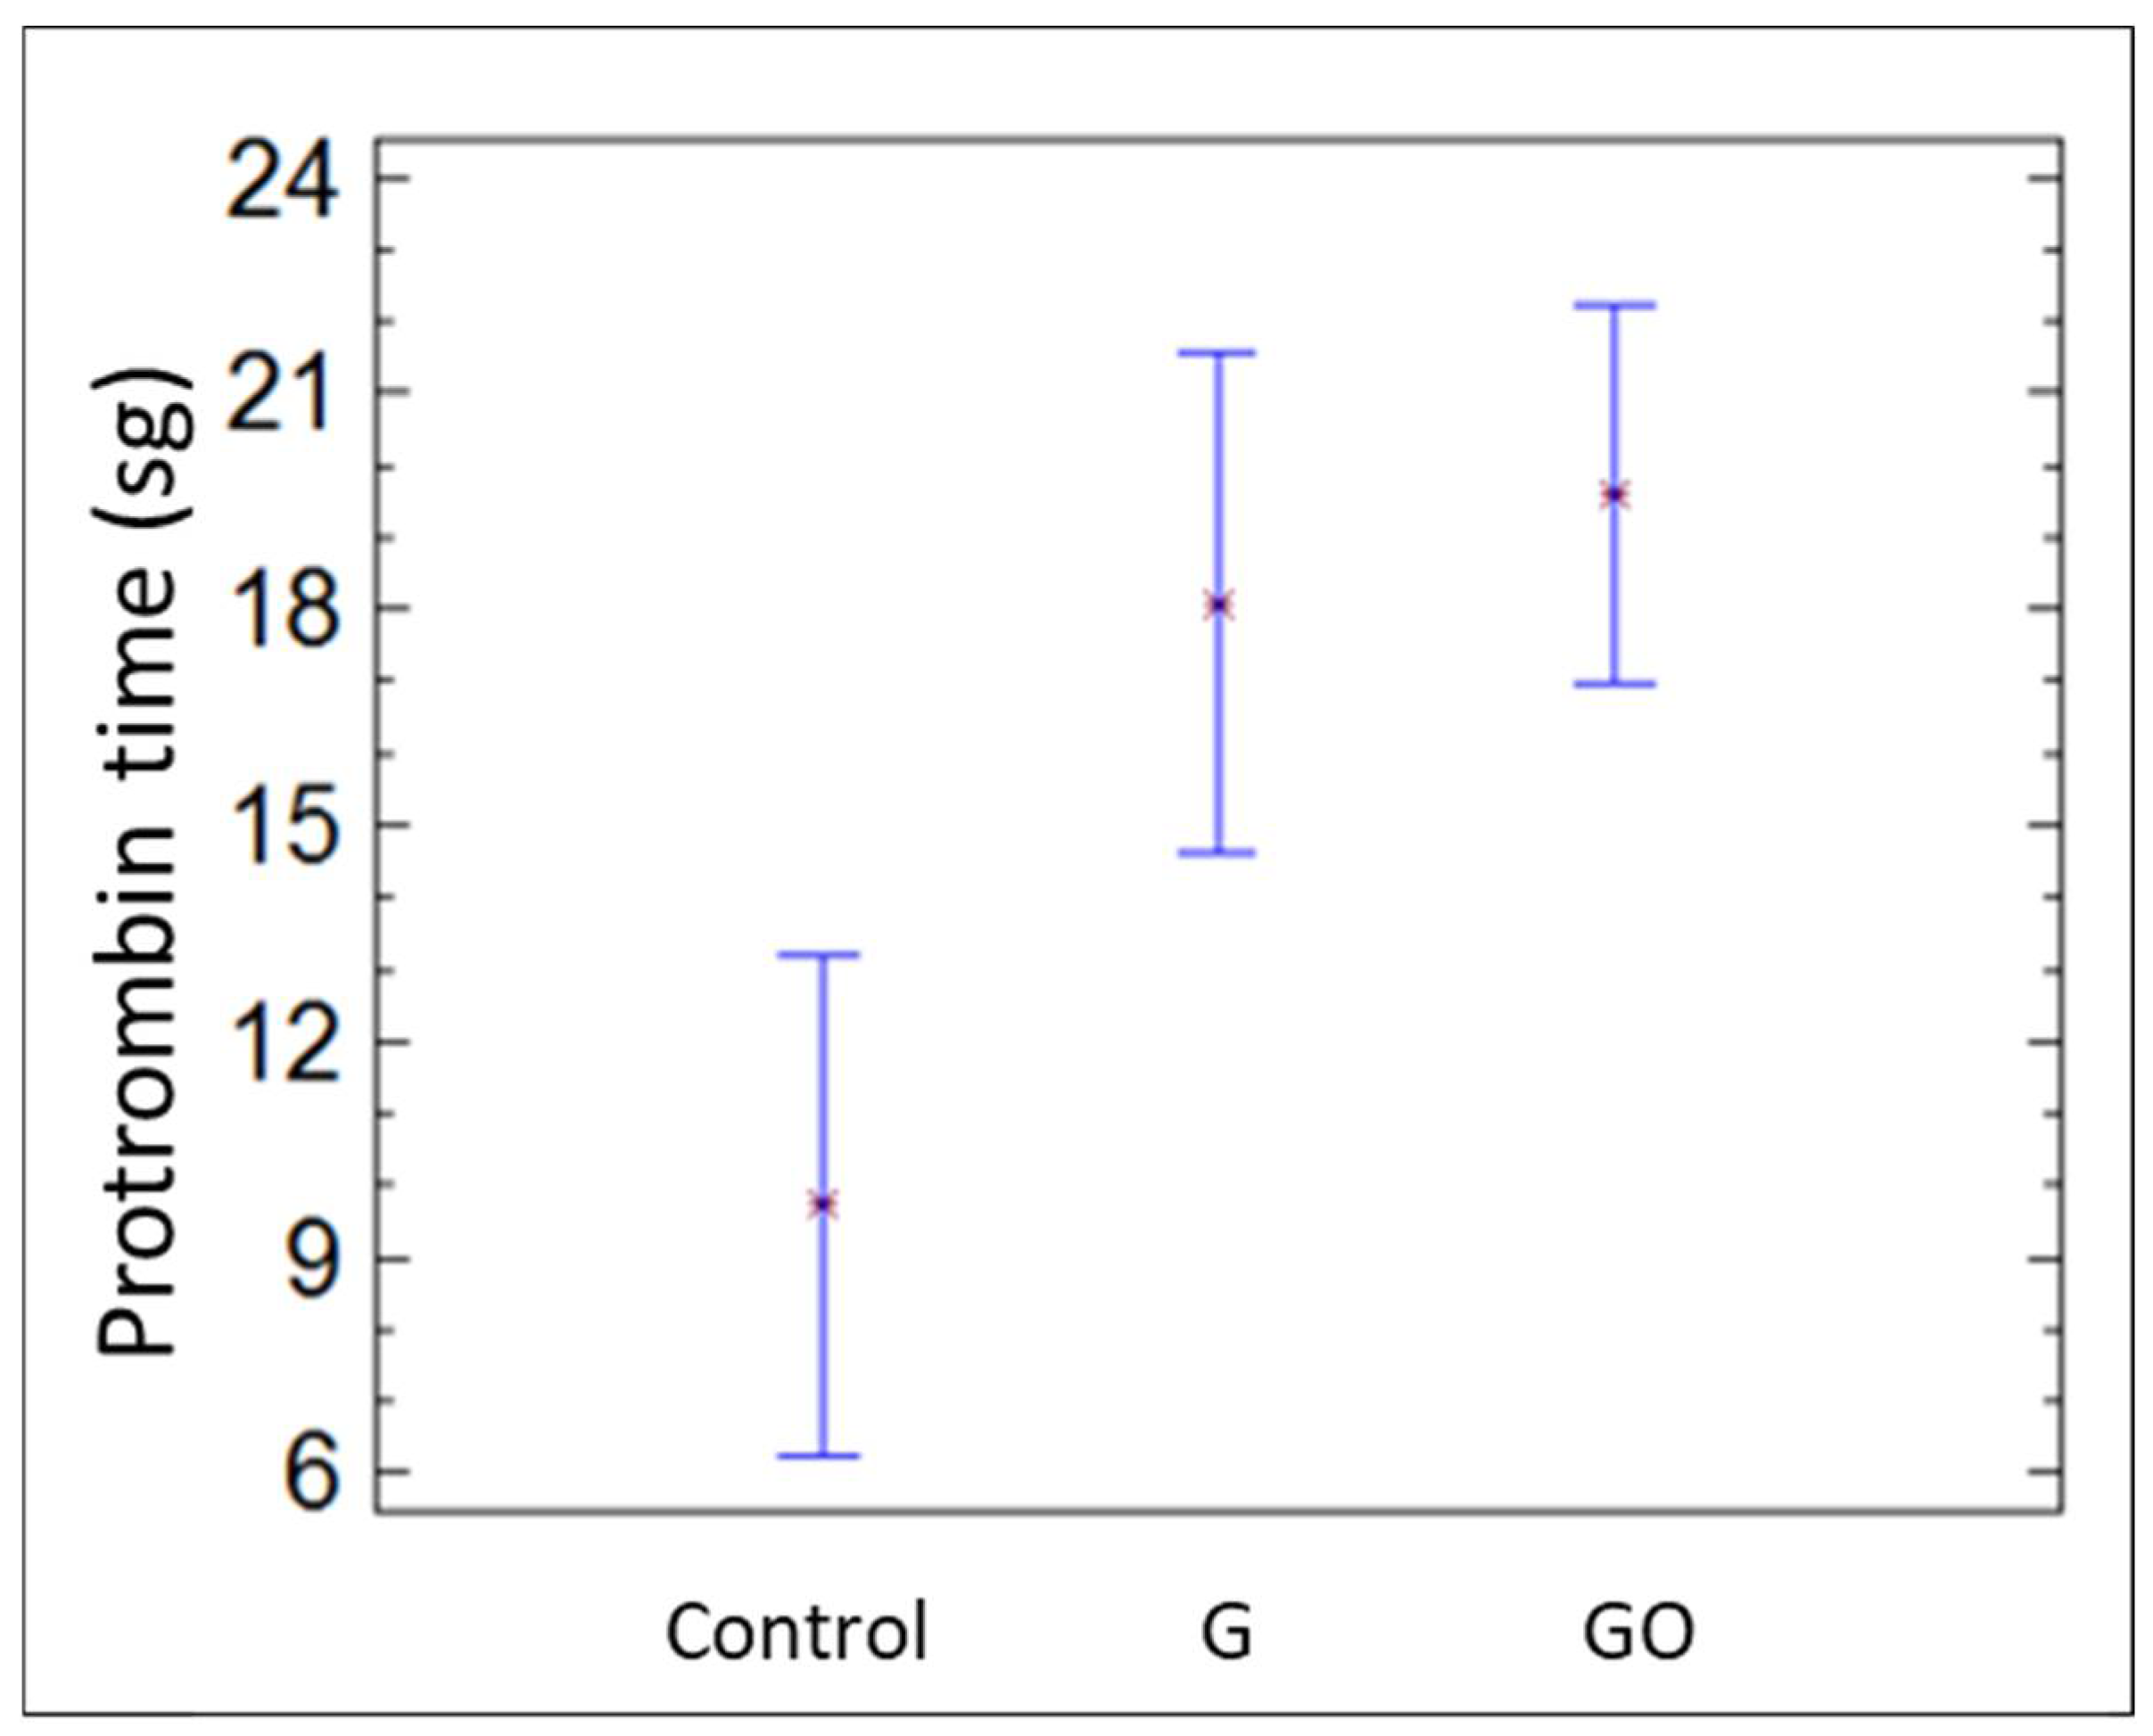
| Protrombin time (s) | 9.725 ± 0.33 | 9.88 ± 0.31 | 18.08 ± 2.22 * | 19.62 ± 6.39 * |
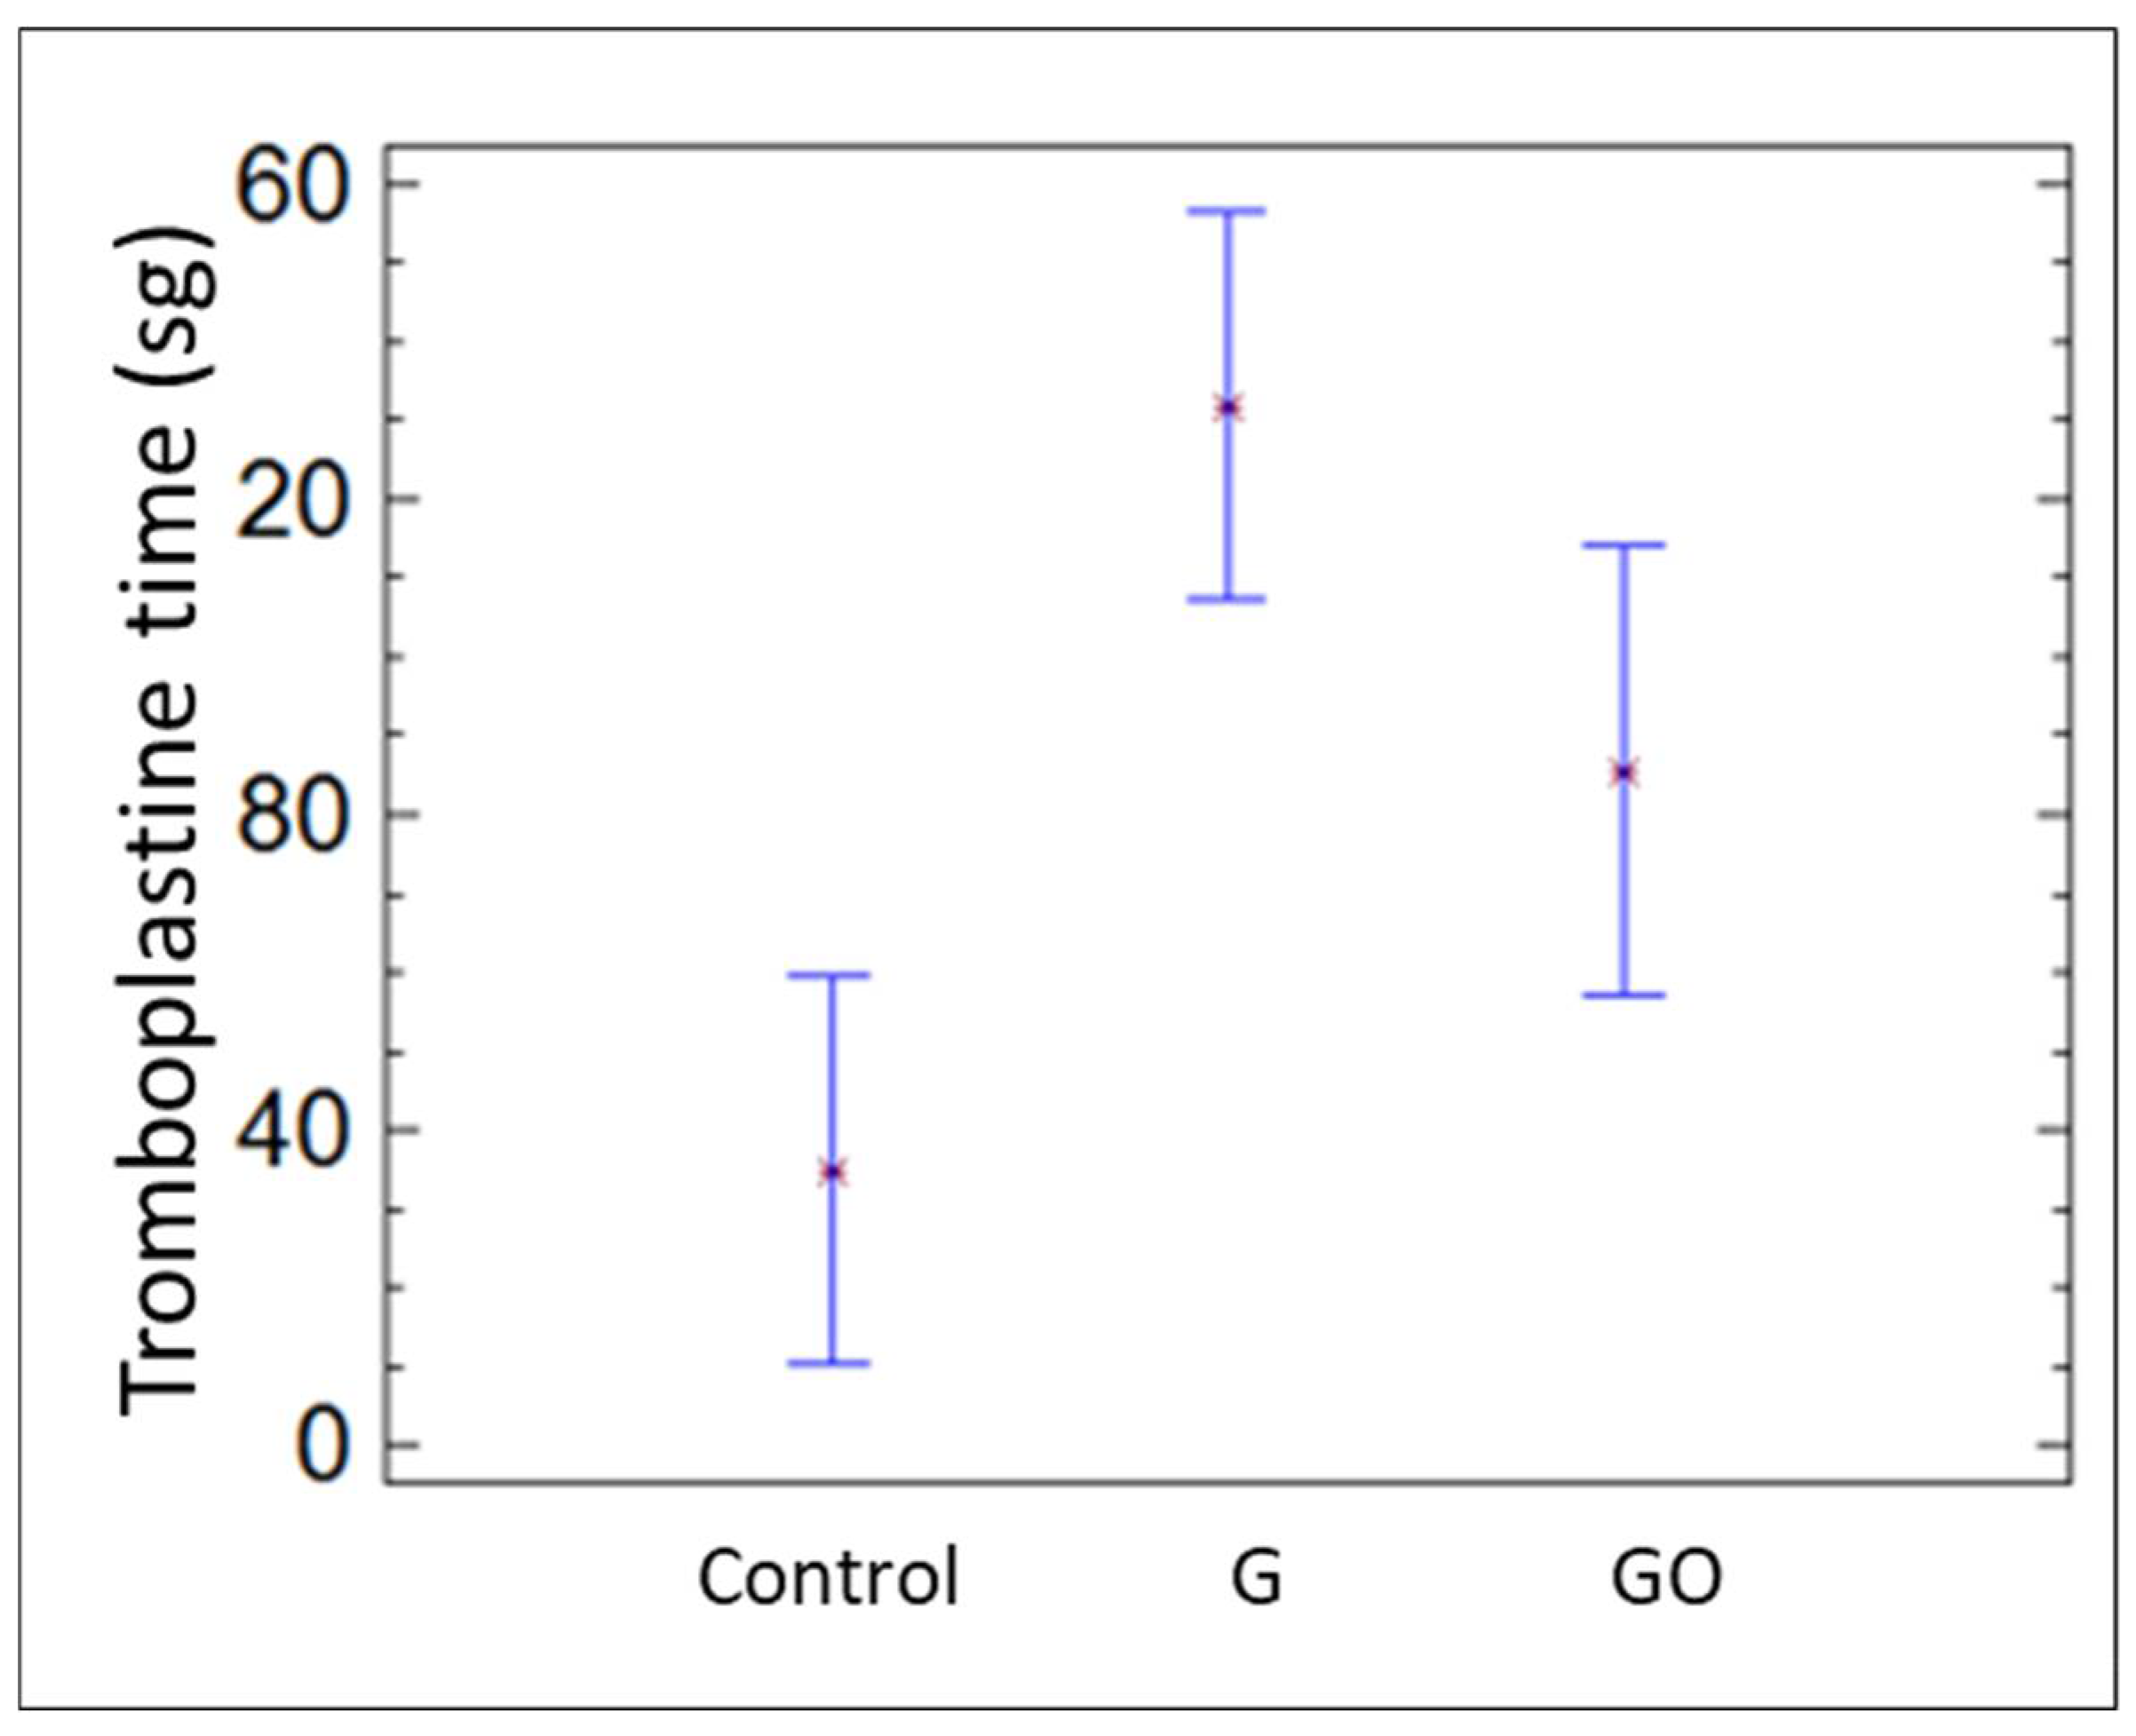
| Tromboplastin time (s) | 34.975 ± 4.55 | 32.68 ± 5.14 | 131.75 ± 34.27 *** | 85.53 ± 35.38 ** |
| Fibrinogen (mg/dL) | 201.90 ± 6.20 | 191.10 ± 13.15 | 175.78 ± 113.85 | 120.01 ± 52.49 |
| Creatinine (mg/dL) | 0.30 ± 0.04 | 0.36 ± 0.09 | 1.04 ± 0.26 | 0.28 ± 0.06 |
| Total Proteins (g/dL) | 6.40 ± 0.53 | 6.60 ± 0.10 | 6.48 ± 0.44 | 6.26 ± 1.46 |
| AST (U/L) | 89.75 ± 18.25 | 91.20 ± 8.76 | 99.20 ± 31.12 | 118.11 ± 122.41 |
| ALT (U/L) | 30.30 ± 2.99 | 34.60 ± 4.22 | 35.80 ± 6.14 ** | 18.45 ± 5.42 |
| LDH (U/L) | 402.00 ± 98.11 | 537.80 ± 77.93 | 3883.50 ± 1471.50 *** | 777.67 ± 552.59 ** |
| Total Cholesterol (mg/dL) | 90.50 ± 16.22 | 97.00 ± 4.00 | 94.00 ± 28.01 | 84.82 ± 18.94 |
| Triglycerides (mg/dL) | 186.00 ± 68.59 | 271.60 ± 28.08 | 179.00 ± 85.42 | 134.58 ± 65.18 * |
| Beta globulins (%) | 18.40 ± 2.24 | 20.28 ± 0.67 | 22.68 ± 8.24 | 15.03 ± 3.50 |
| Albumin (%) | 50.10 ± 1.84 | 30.29 ± 0.16 | 41.88 ± 12.93 | 55.41 ± 1.23 * |
| Gamma Globulin (%) | 0.975 ± 0.013 | 0.86 ± 0.23 | 0.55 ± 0.25 | 1.58 ± 0.36 ** |
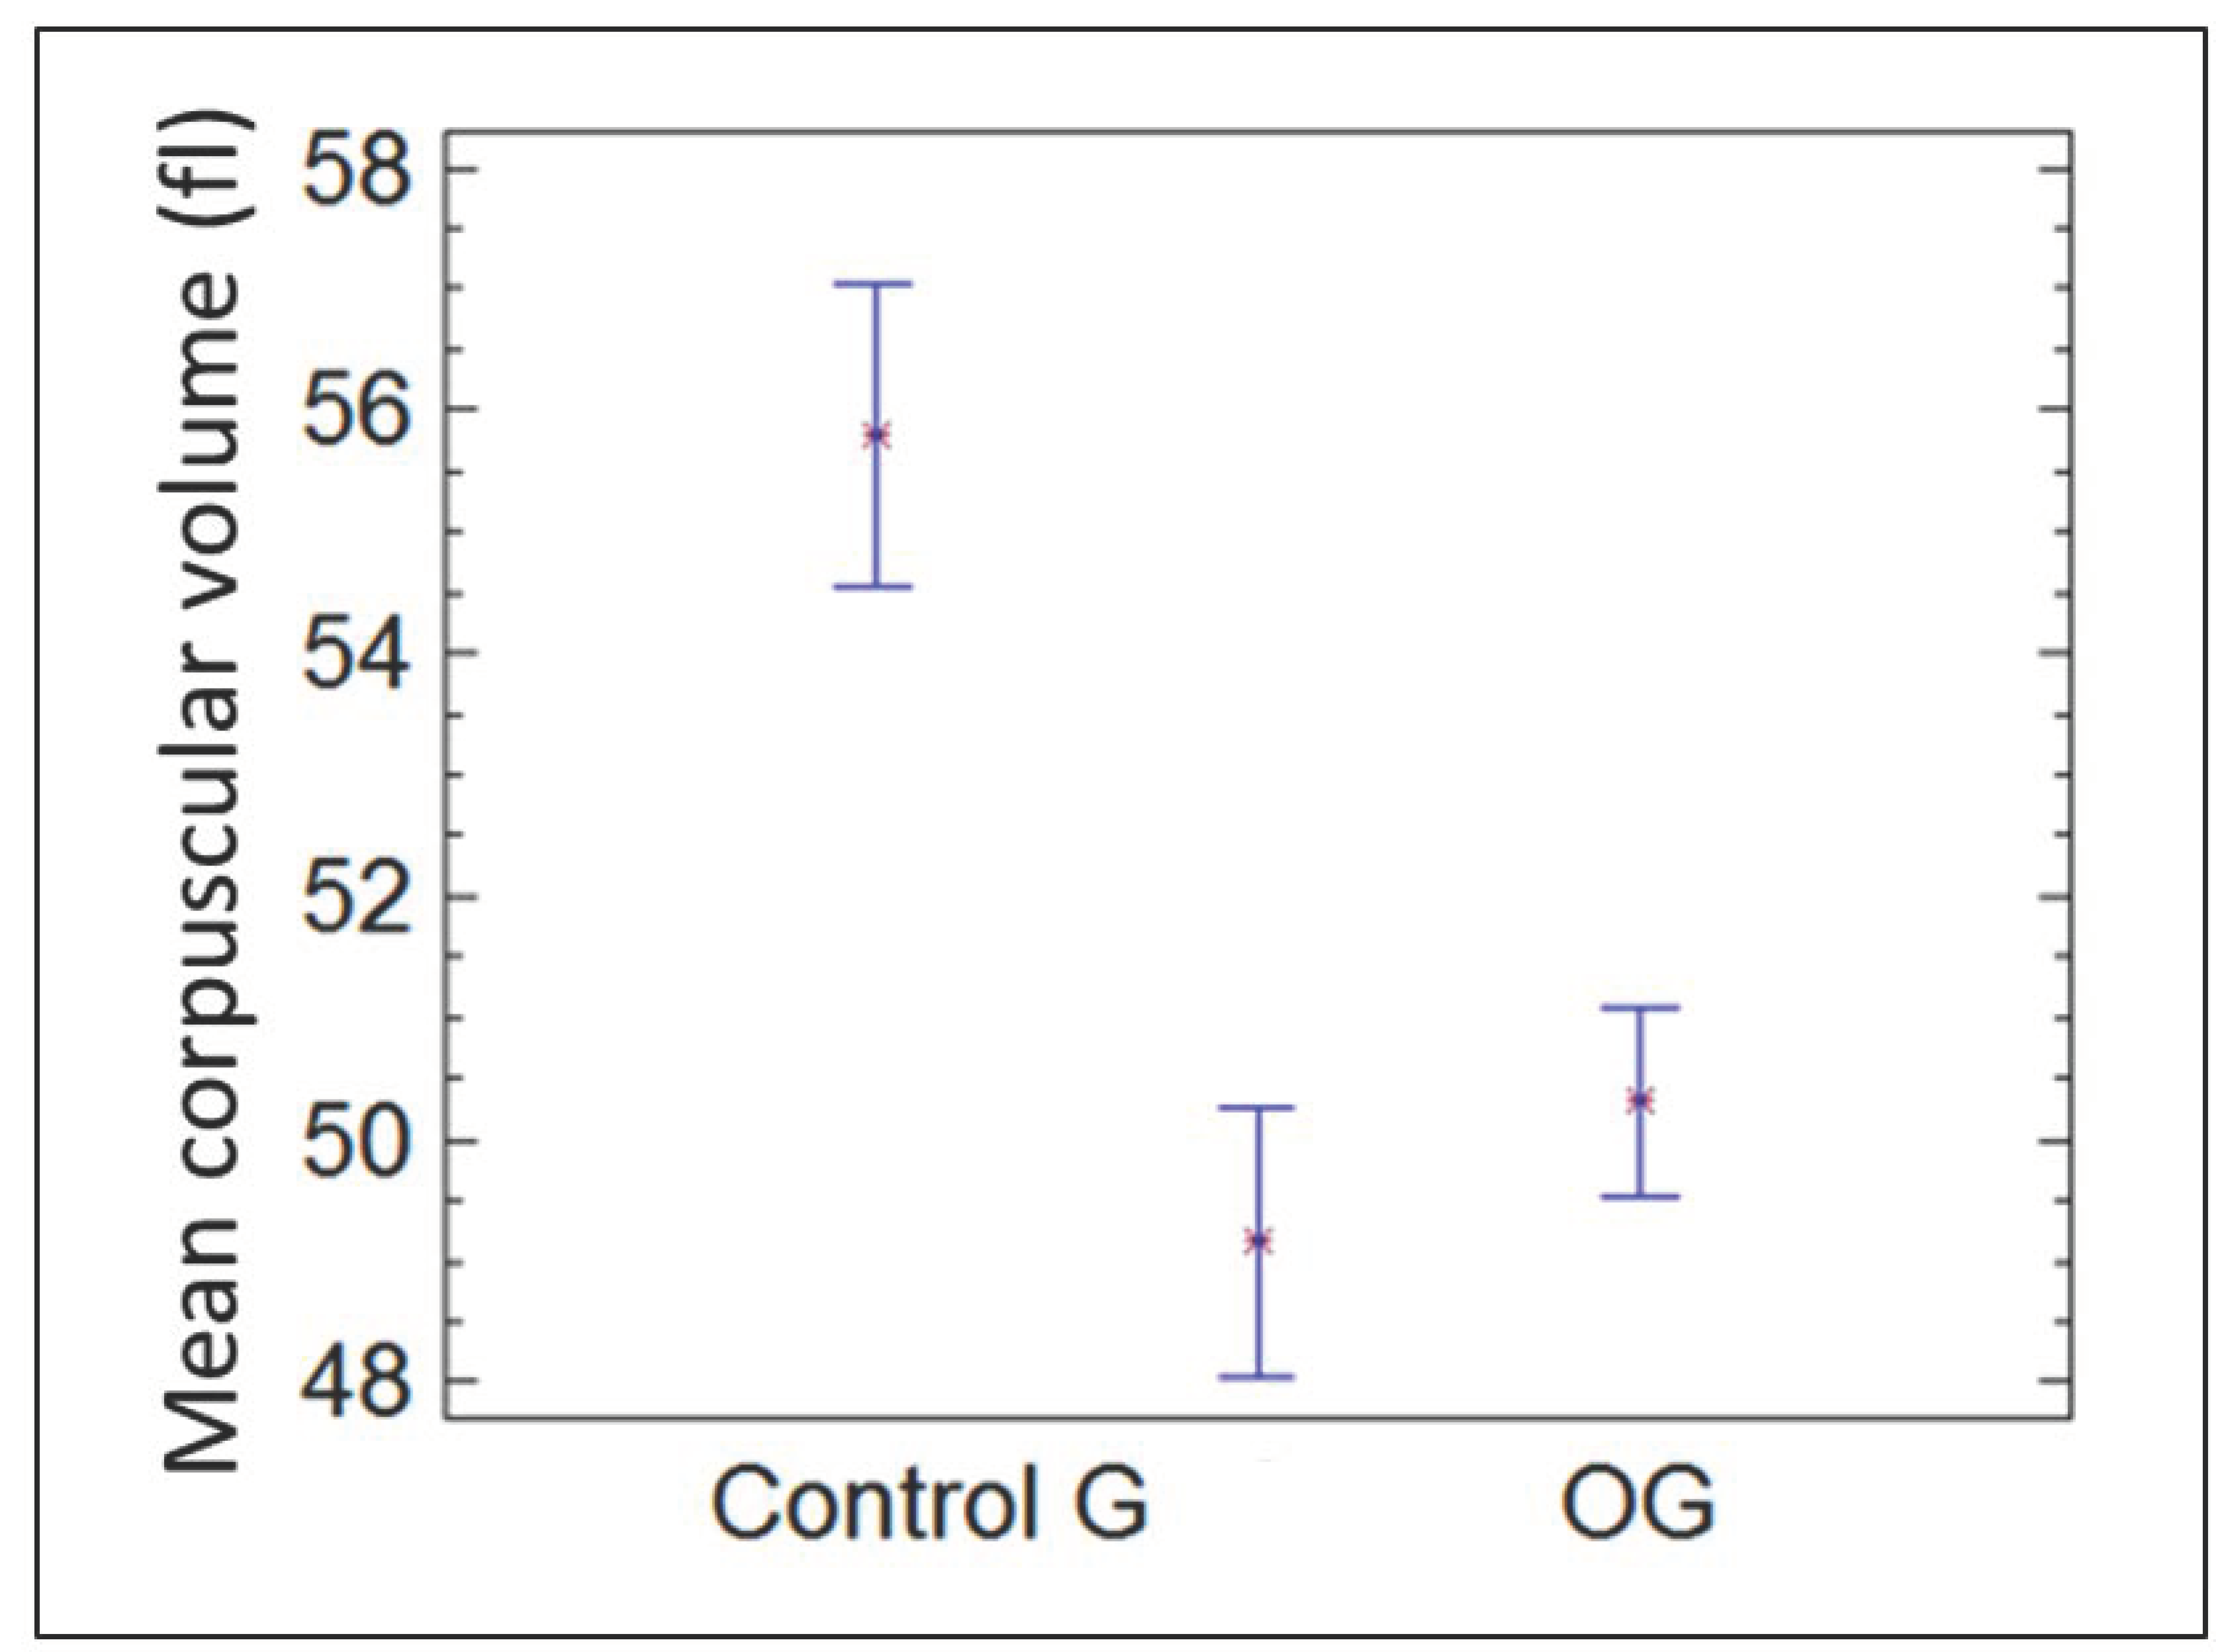
| Groups | RBC (106/µL) | Hgb (g/dL) | Hct (%) | MCV (fL) | MCHC (g/dL) |
|---|---|---|---|---|---|
| Control | 7.88 ± 0.30 | 14.75 ± 0.53 | 44.00 ± 2.04 | 55.80 ± 0.35 | 33.60 ± 0.41 |
| G | 8.43 ± 0.38 | 14.82 ± 0.50 | 41.38 ± 1.15 | 49.16 ± 2.54 *** | 36.54 ± 0.26 *** |
| GO | 7.84 ± 2.01 | 14.41 ± 3.59 | 39.43 ± 2.87 * | 50.31 ± 1.09 *** | 36.94 ± 0.44 *** |
Publisher’s Note: MDPI stays neutral with regard to jurisdictional claims in published maps and institutional affiliations. |
© 2022 by the authors. Licensee MDPI, Basel, Switzerland. This article is an open access article distributed under the terms and conditions of the Creative Commons Attribution (CC BY) license (https://creativecommons.org/licenses/by/4.0/).
Share and Cite
Aguado-Henche, S.; Escudero, M.L.; García-Alonso, M.C.; Lozano-Puerto, R.M.; Clemente de Arriba, C. Biological Responses in the Blood and Organs of Rats to Intraperitoneal Inoculation of Graphene and Graphene Oxide. Materials 2022, 15, 2898. https://doi.org/10.3390/ma15082898
Aguado-Henche S, Escudero ML, García-Alonso MC, Lozano-Puerto RM, Clemente de Arriba C. Biological Responses in the Blood and Organs of Rats to Intraperitoneal Inoculation of Graphene and Graphene Oxide. Materials. 2022; 15(8):2898. https://doi.org/10.3390/ma15082898
Chicago/Turabian StyleAguado-Henche, Soledad, María Lorenza Escudero, María Cristina García-Alonso, Rosa María Lozano-Puerto, and Celia Clemente de Arriba. 2022. "Biological Responses in the Blood and Organs of Rats to Intraperitoneal Inoculation of Graphene and Graphene Oxide" Materials 15, no. 8: 2898. https://doi.org/10.3390/ma15082898