

Assessment of Mineralogical Characteristics of Clays and the Effect of Waste Materials on Their Index Properties for the Production of Bricks
 , ,
, ,
Abstract
:1. Introduction
2. Materials and methods
2.1. Materials
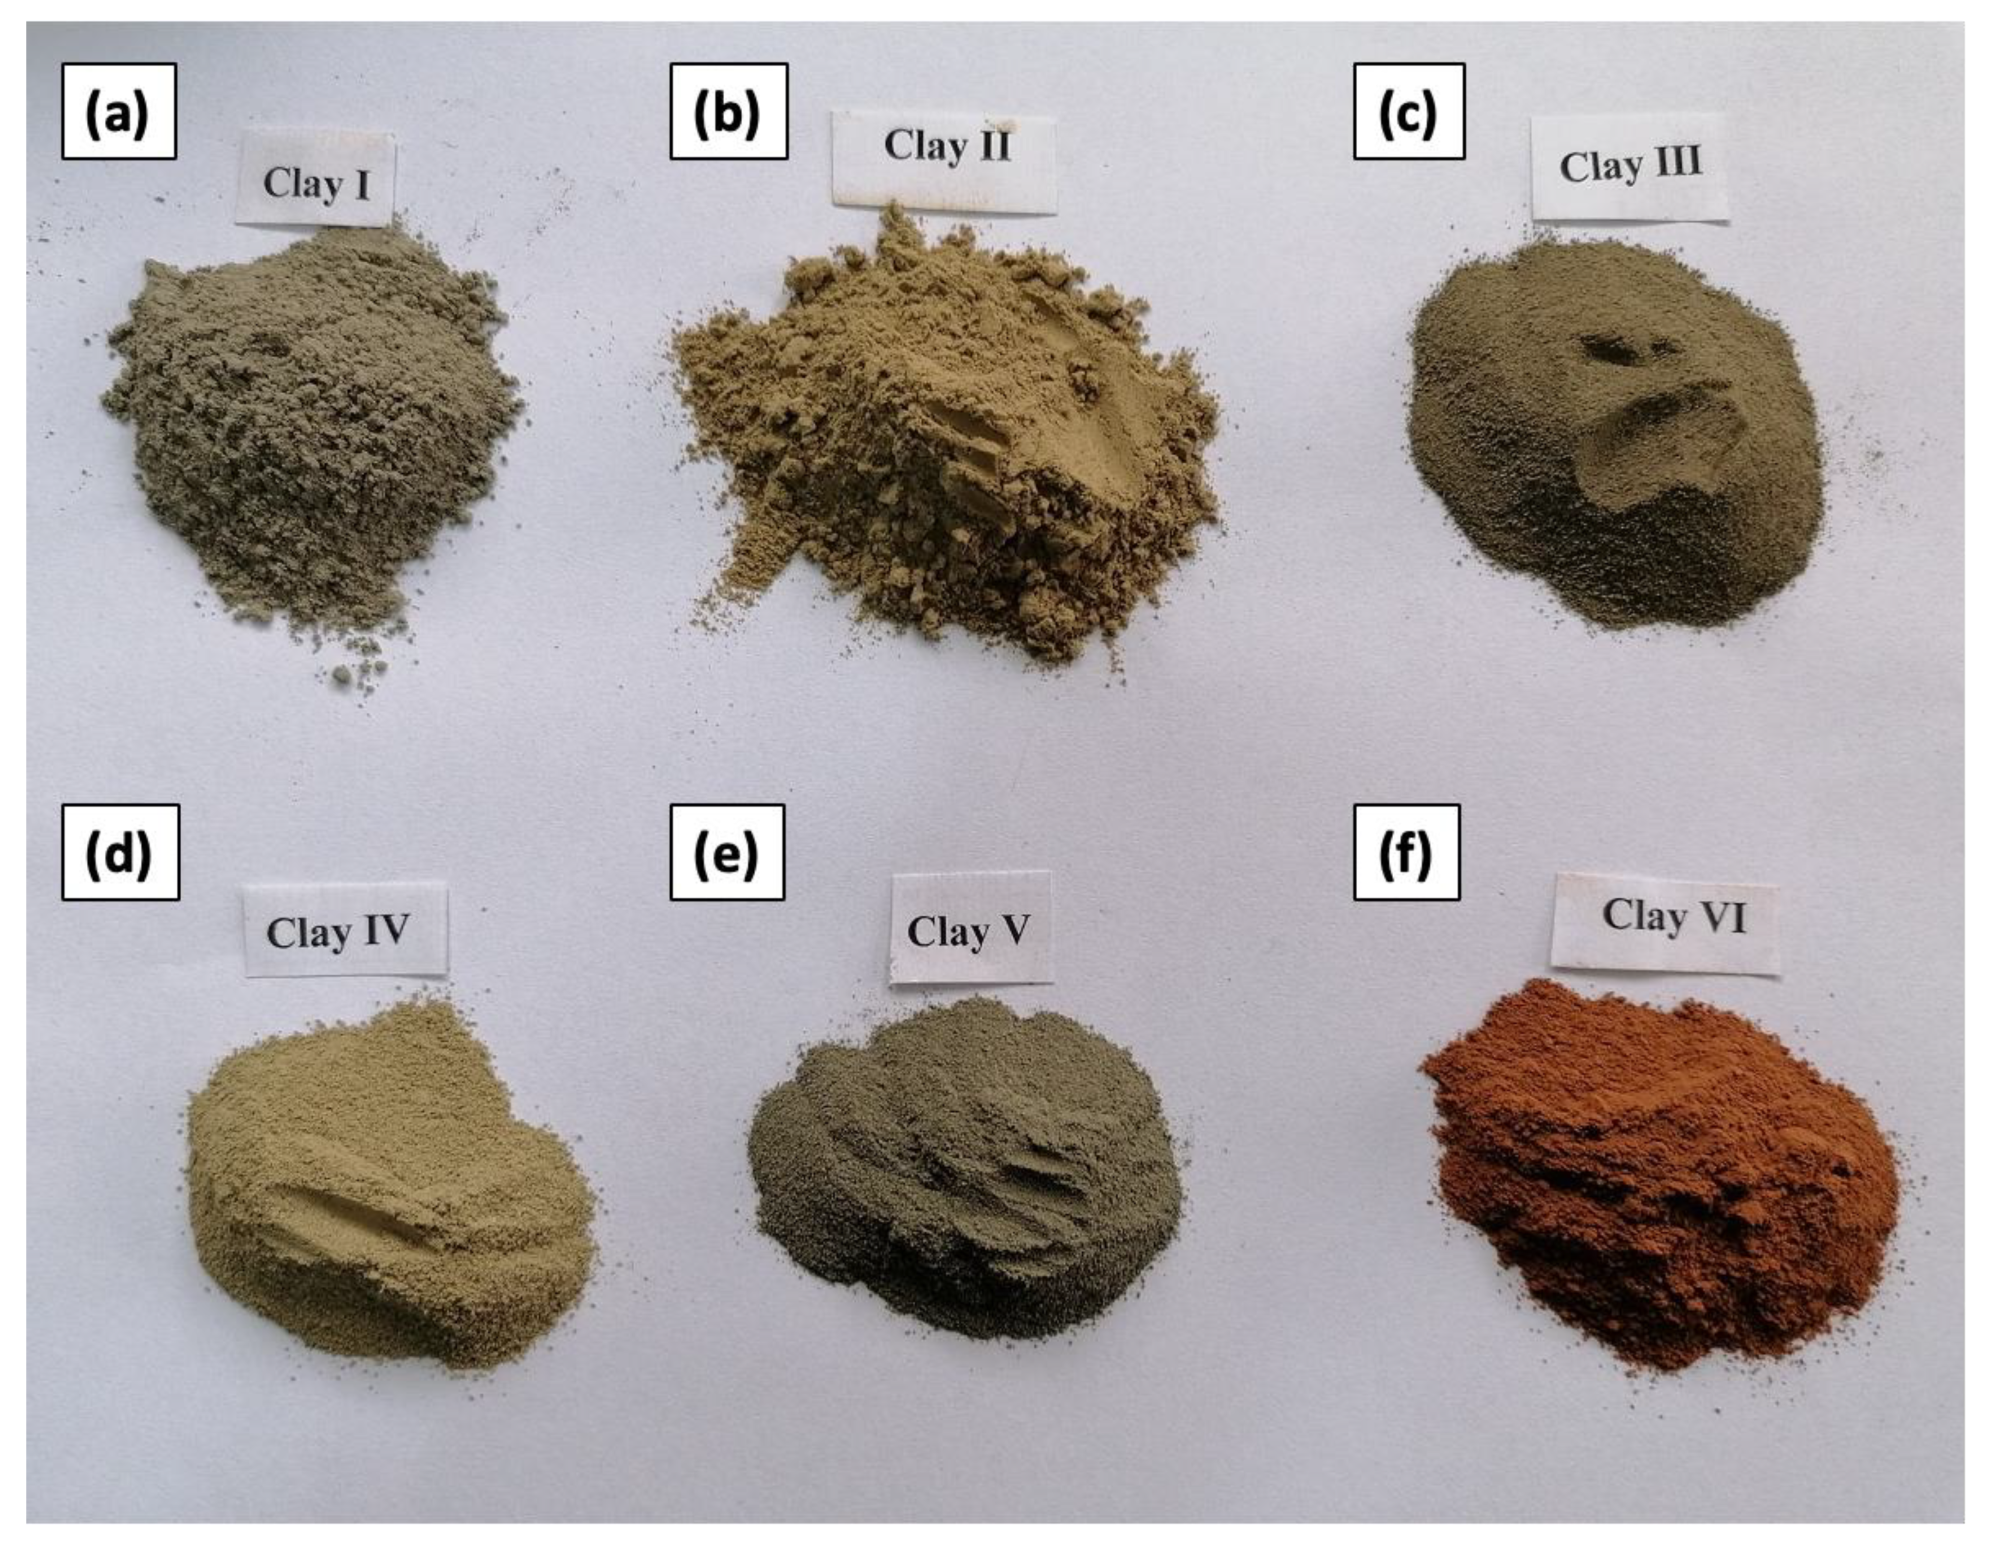
2.1.1. Clay
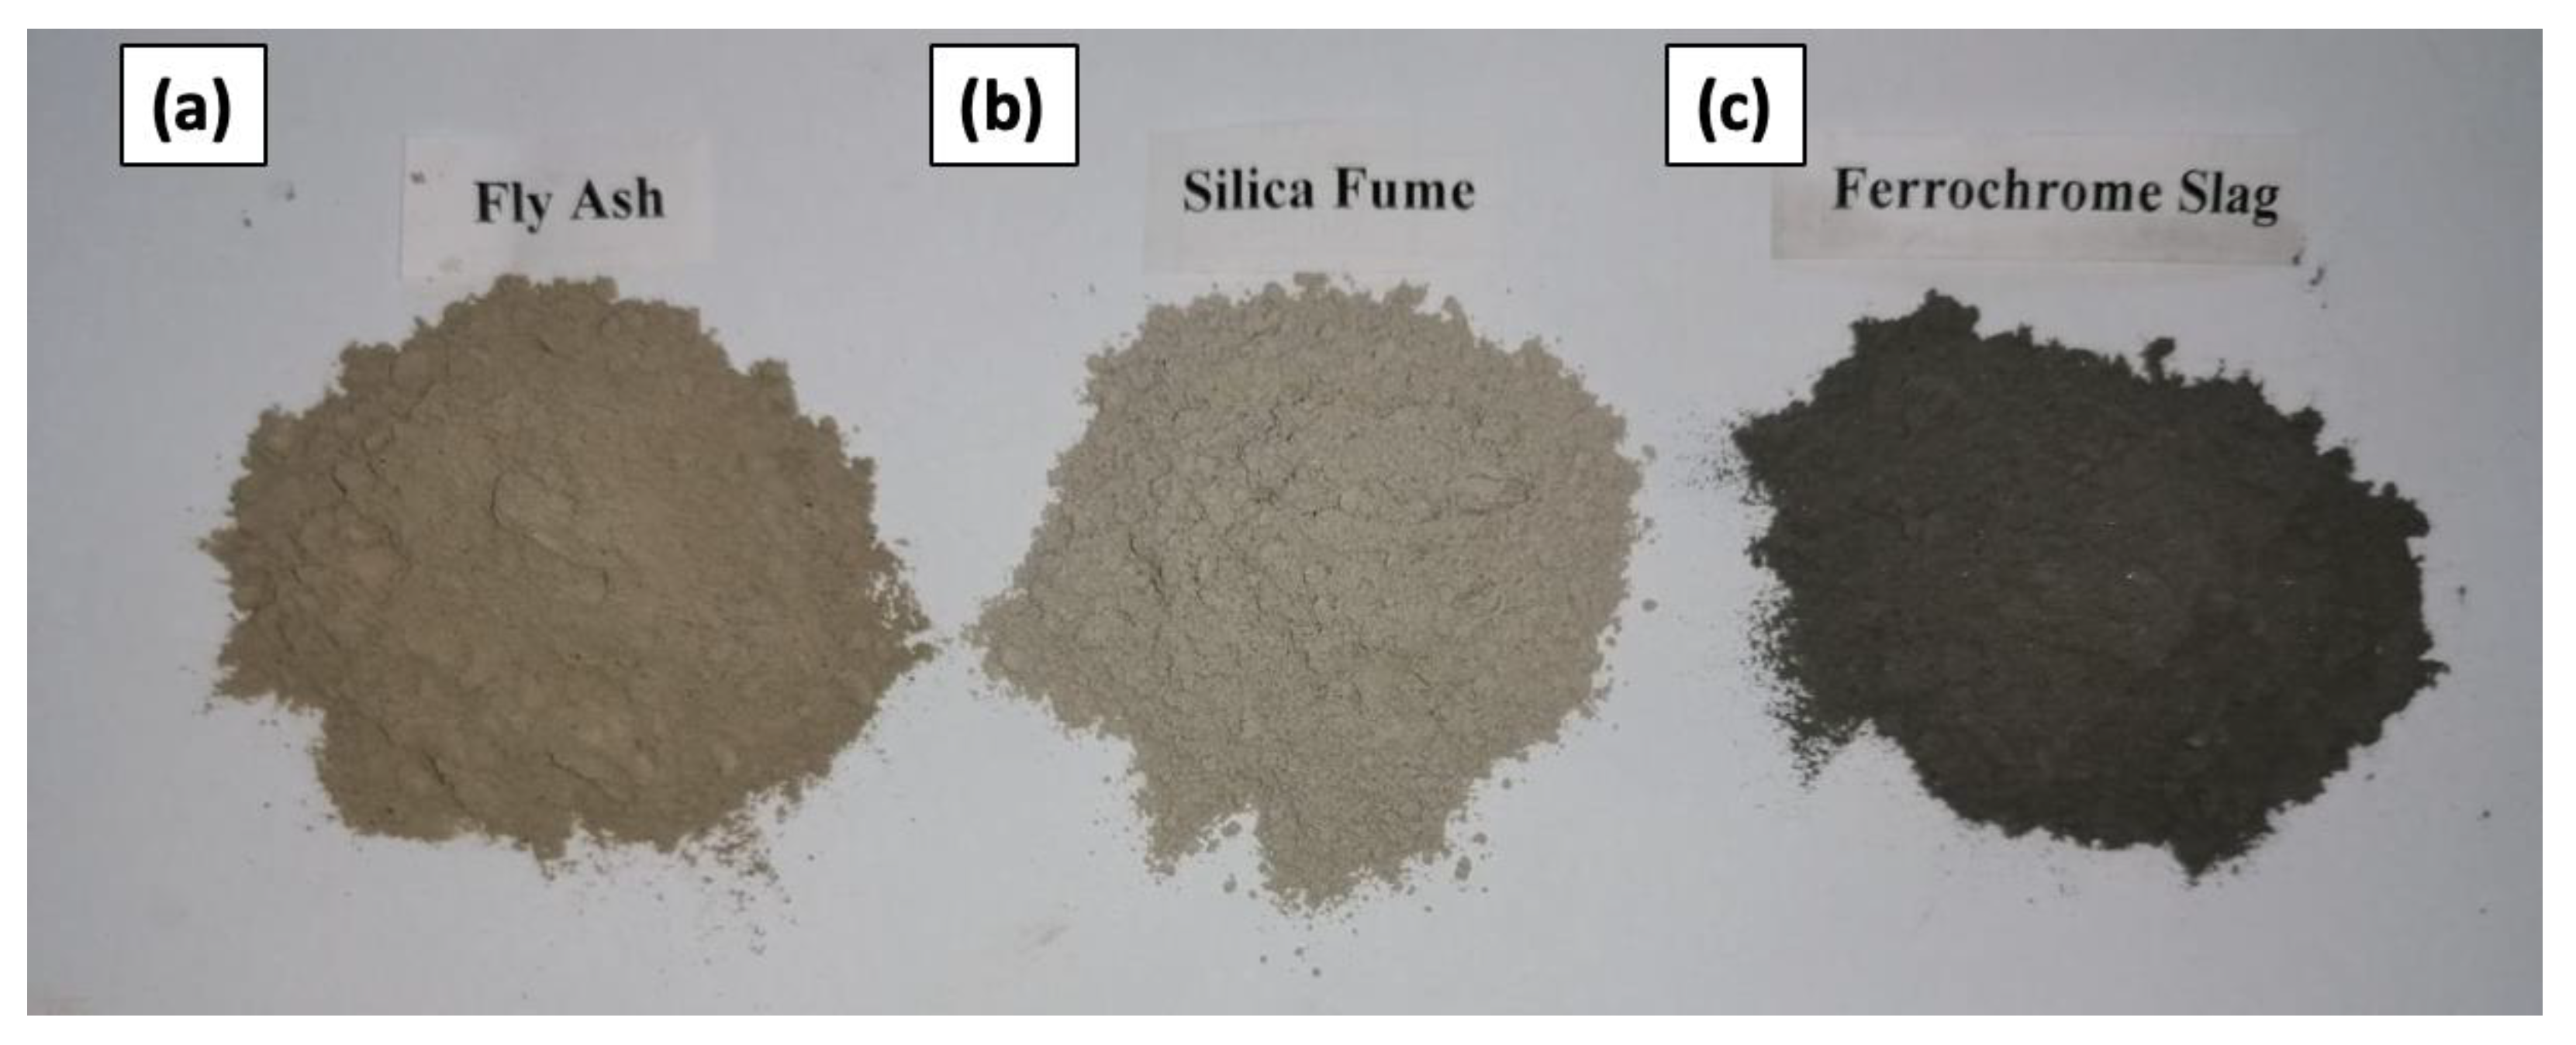
2.1.2. Industrial Waste
2.2. Testing Methods
2.2.1. X-ray Fluorescence (XRF)
2.2.2. X-ray Diffraction (XRD)
2.2.3. Thermogravimetric Analysis (TGA)
2.2.4. Particle Size Distribution (PSD)
2.2.5. Atterberg Limits
2.3. Specimen Preparation
3. Results and Discussion
3.1. Mineralogical Properties
3.1.1. X-ray Fluorescence
3.1.2. X-ray Diffraction
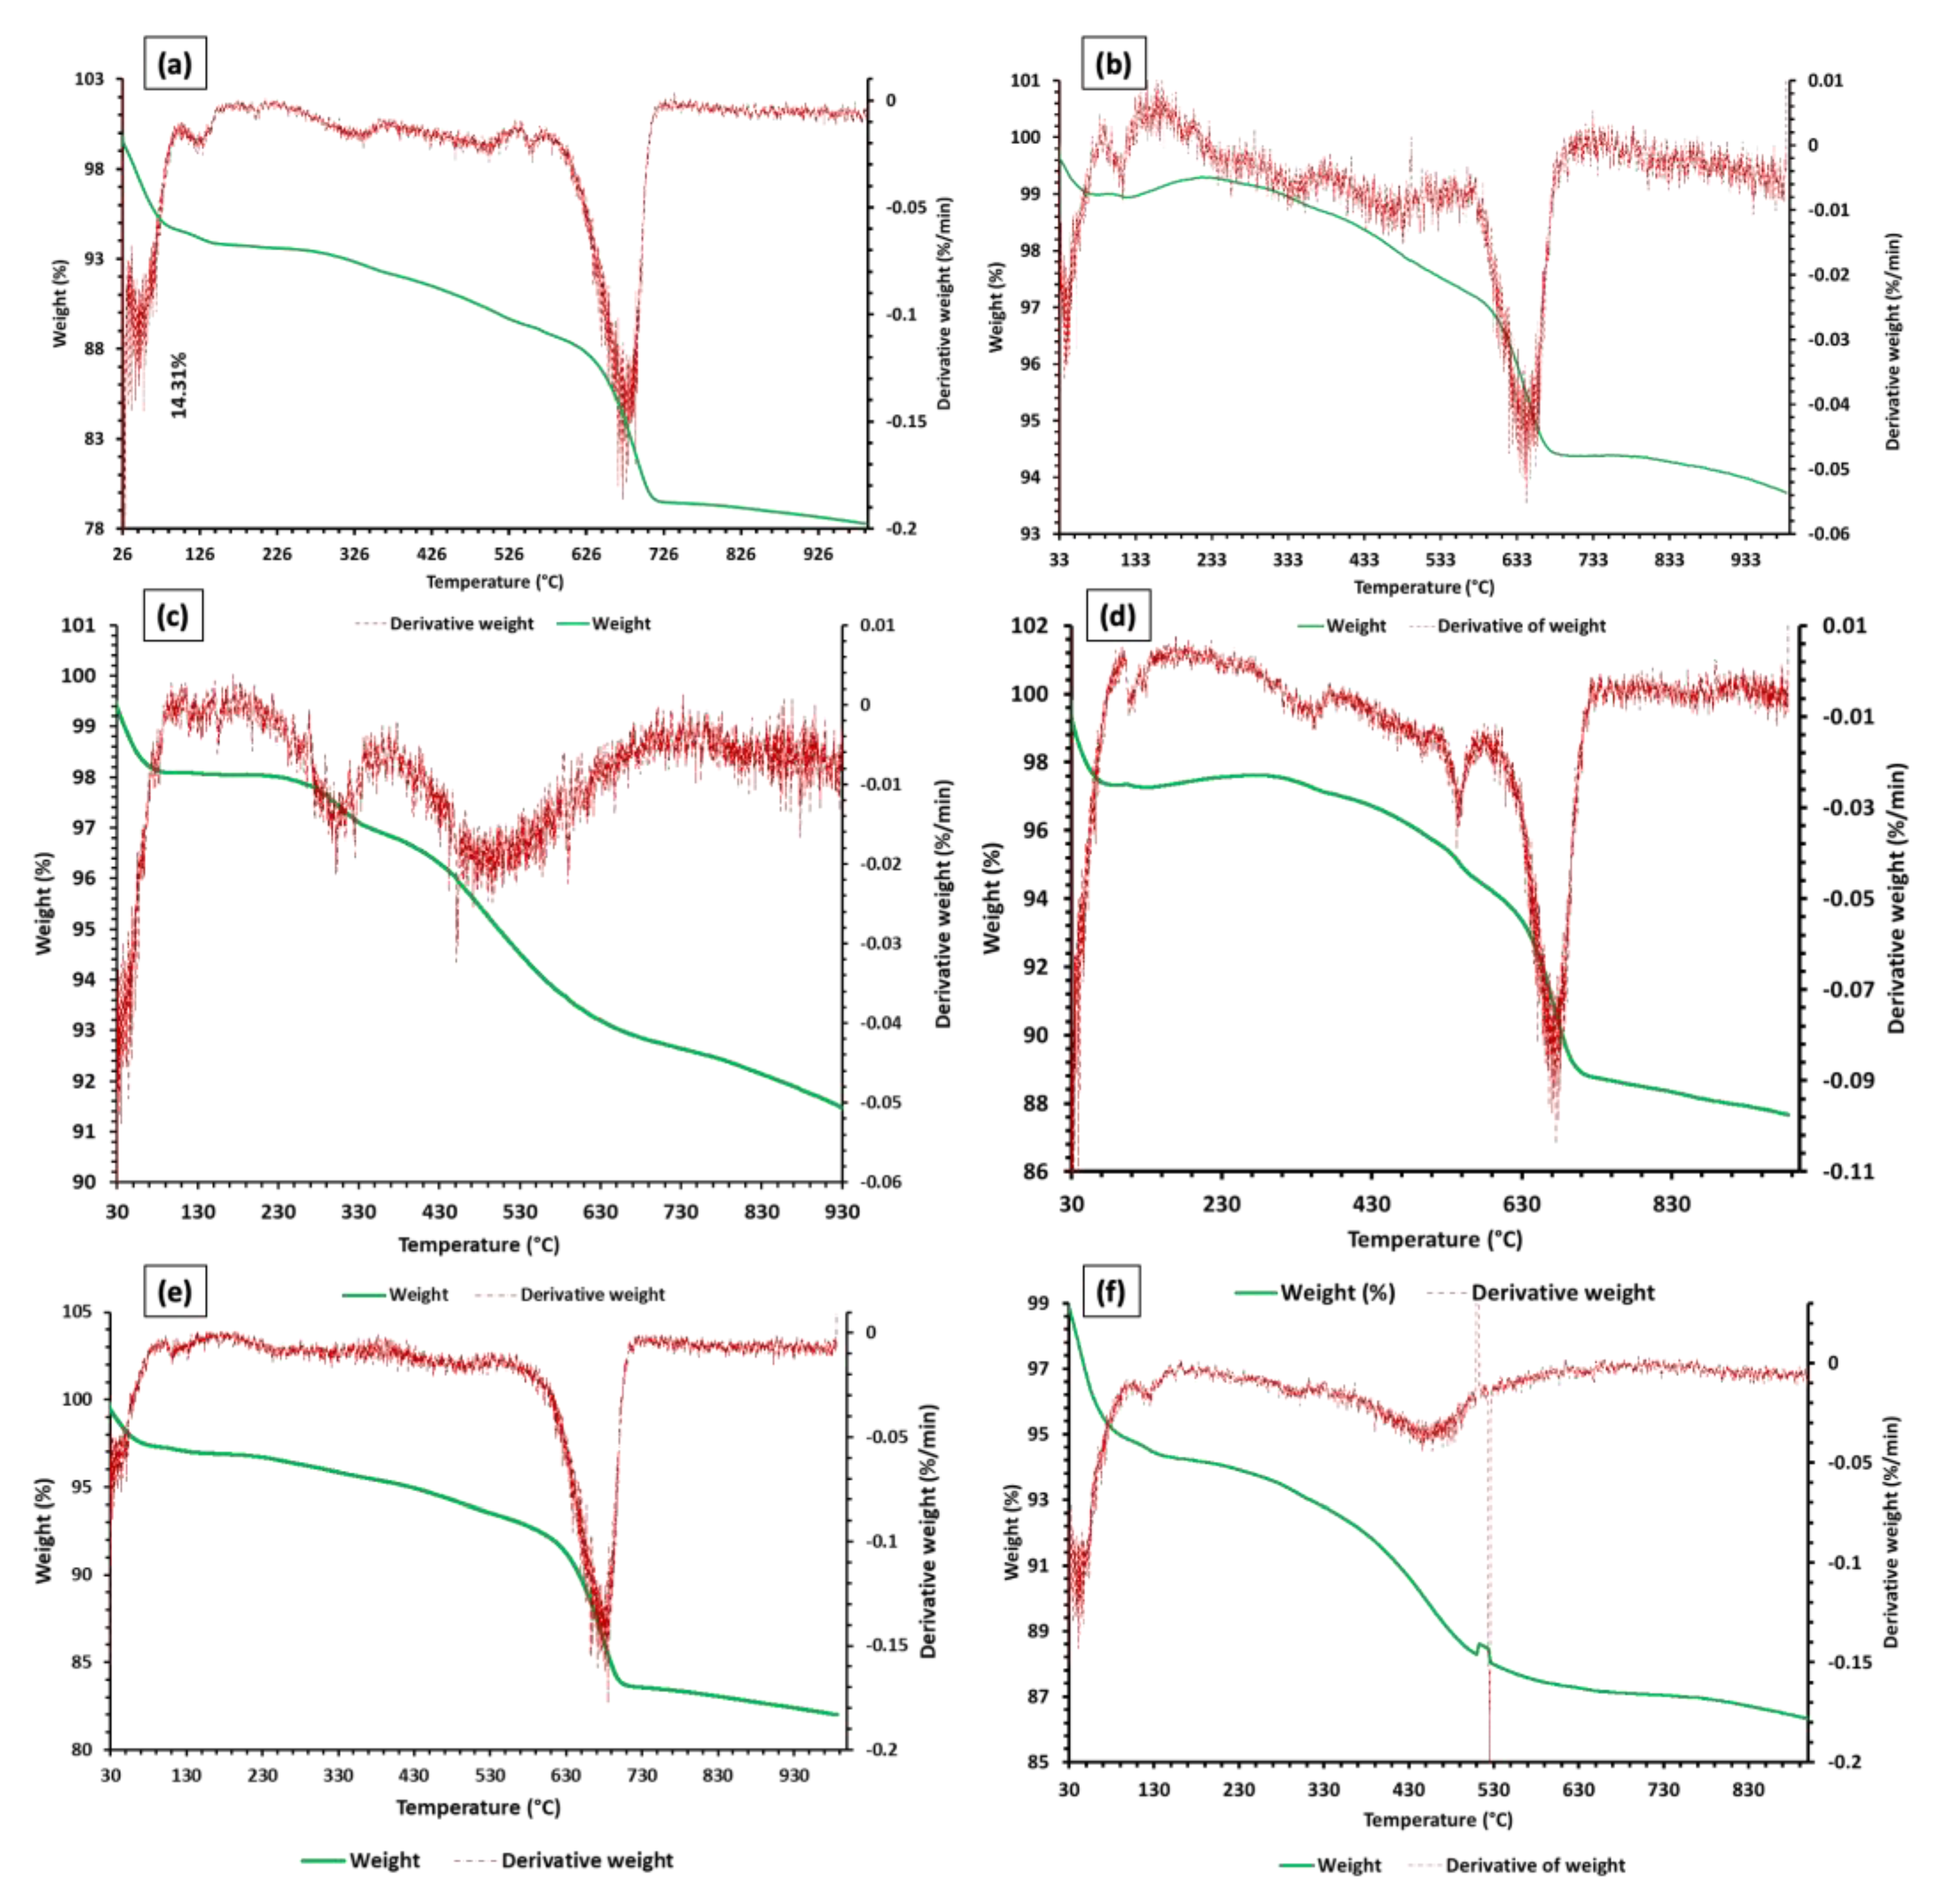
3.1.3. Thermogravimetric Analysis (TGA)
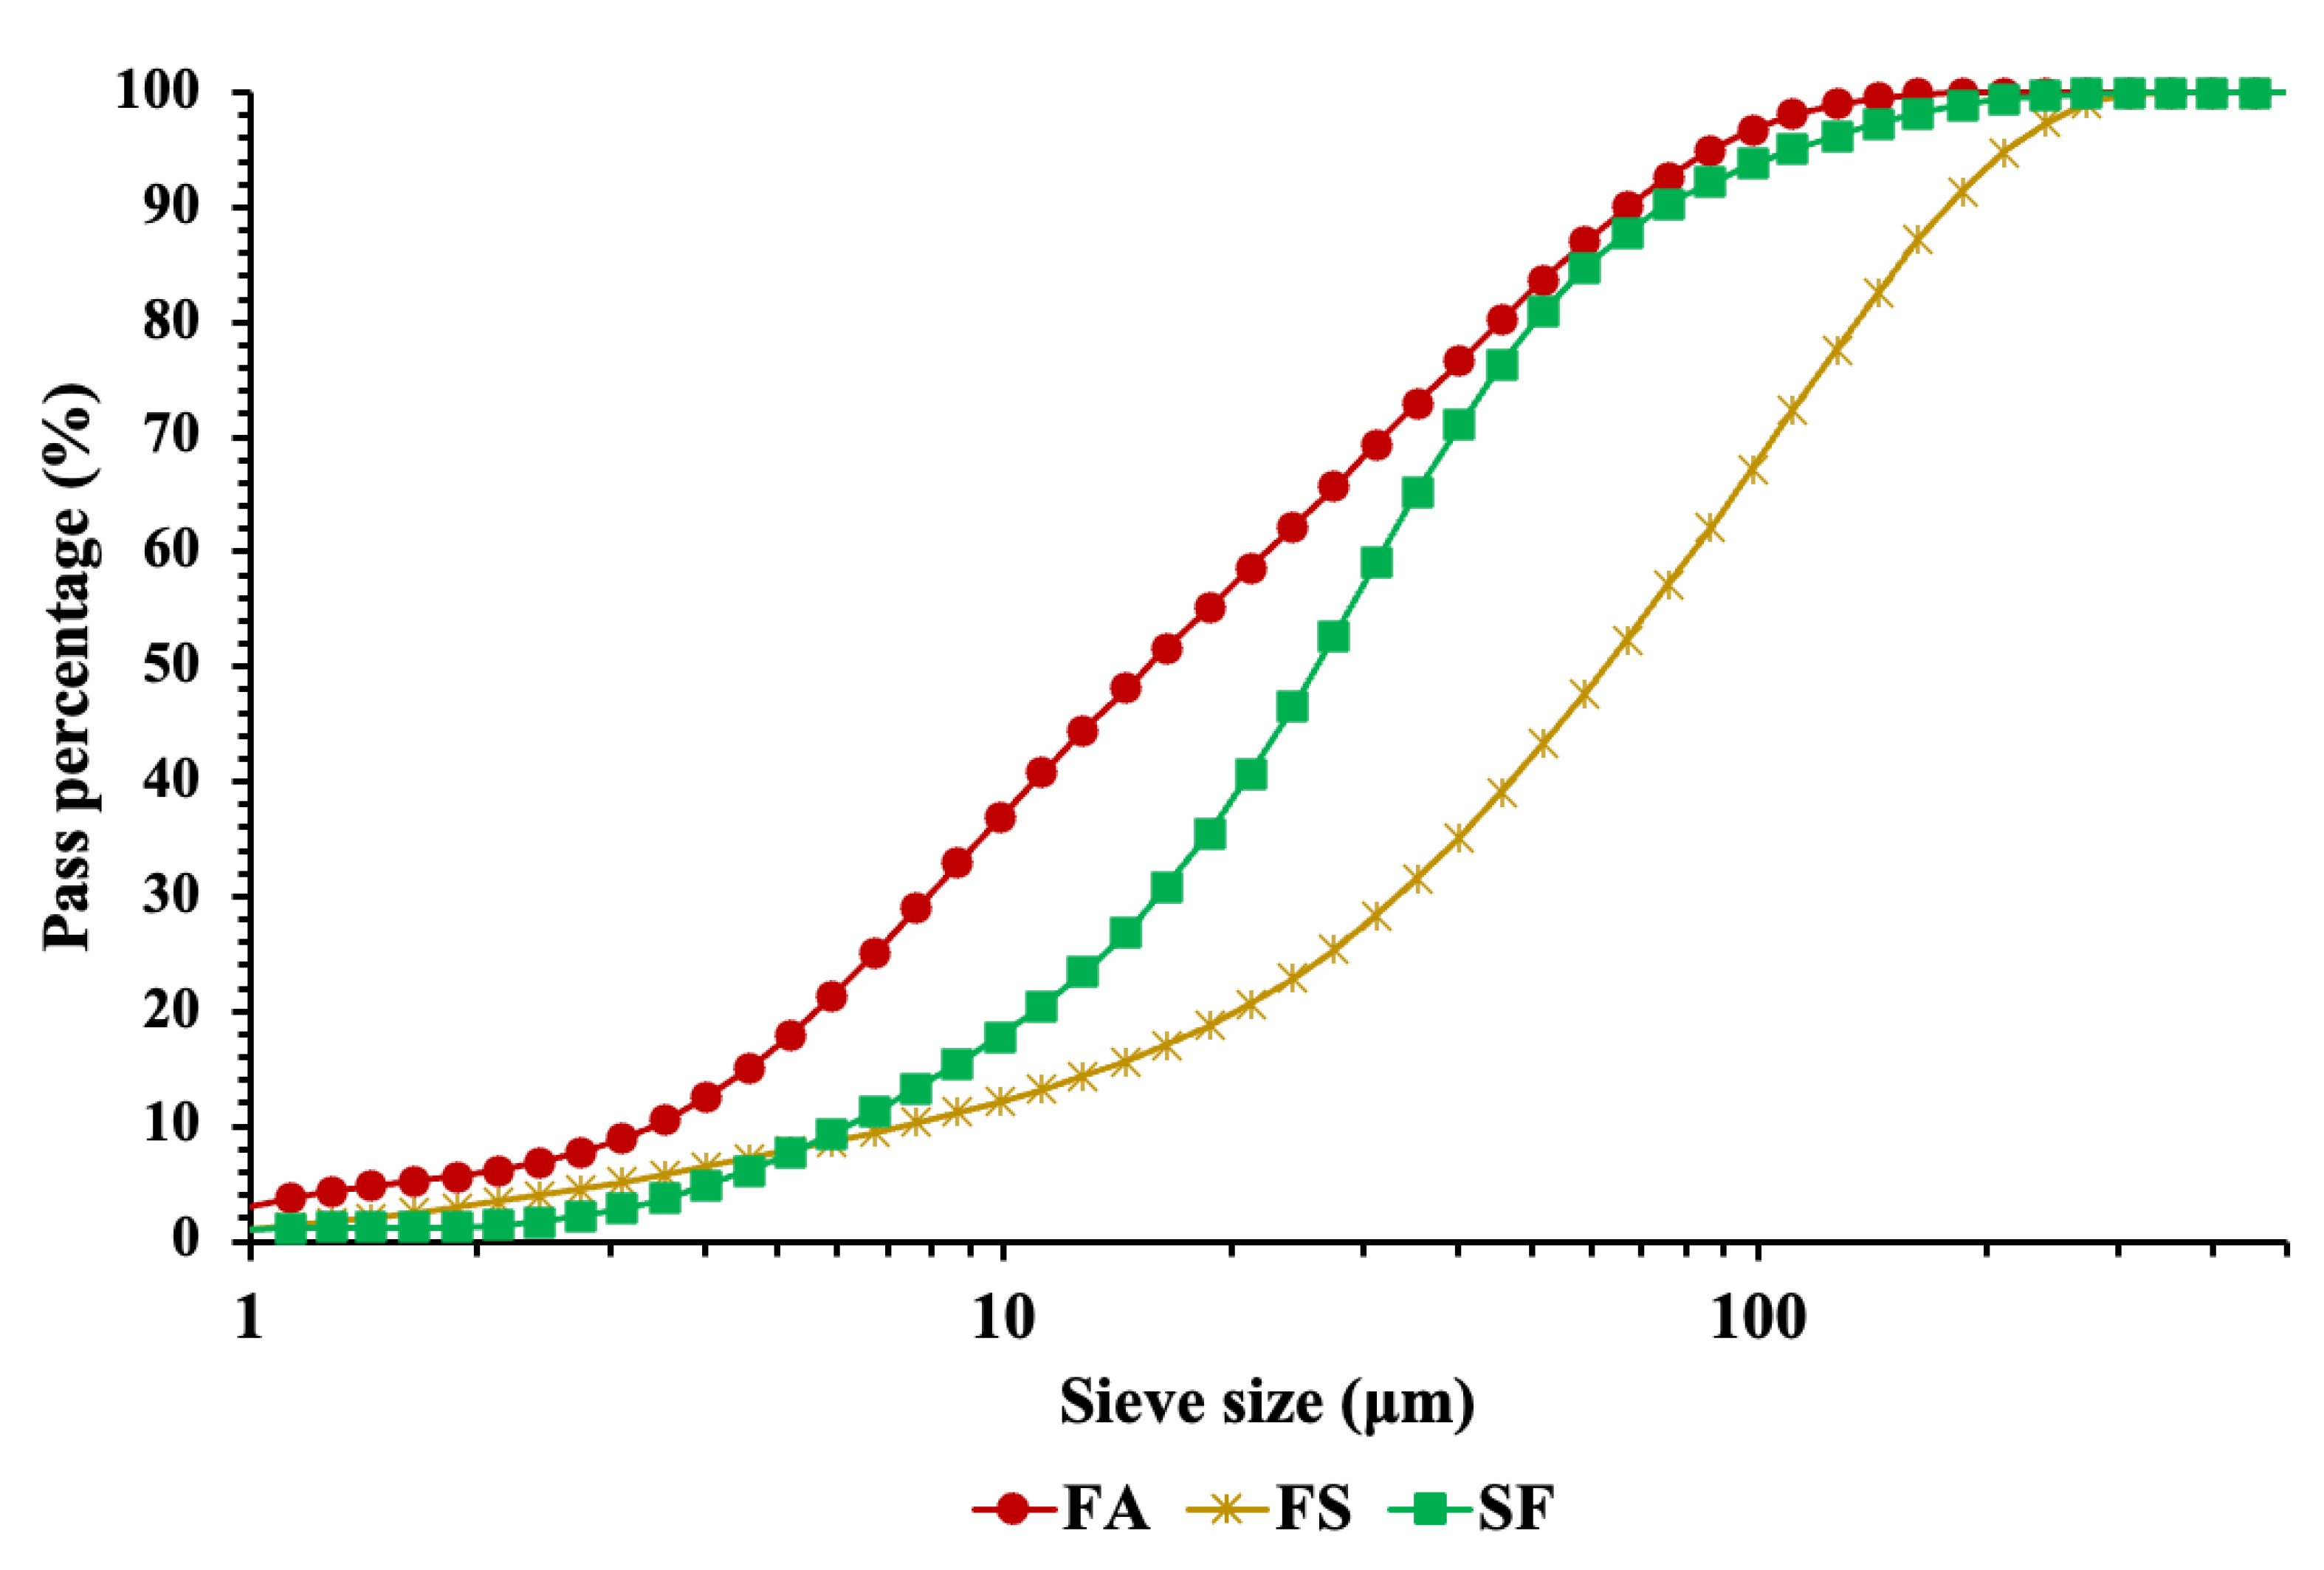
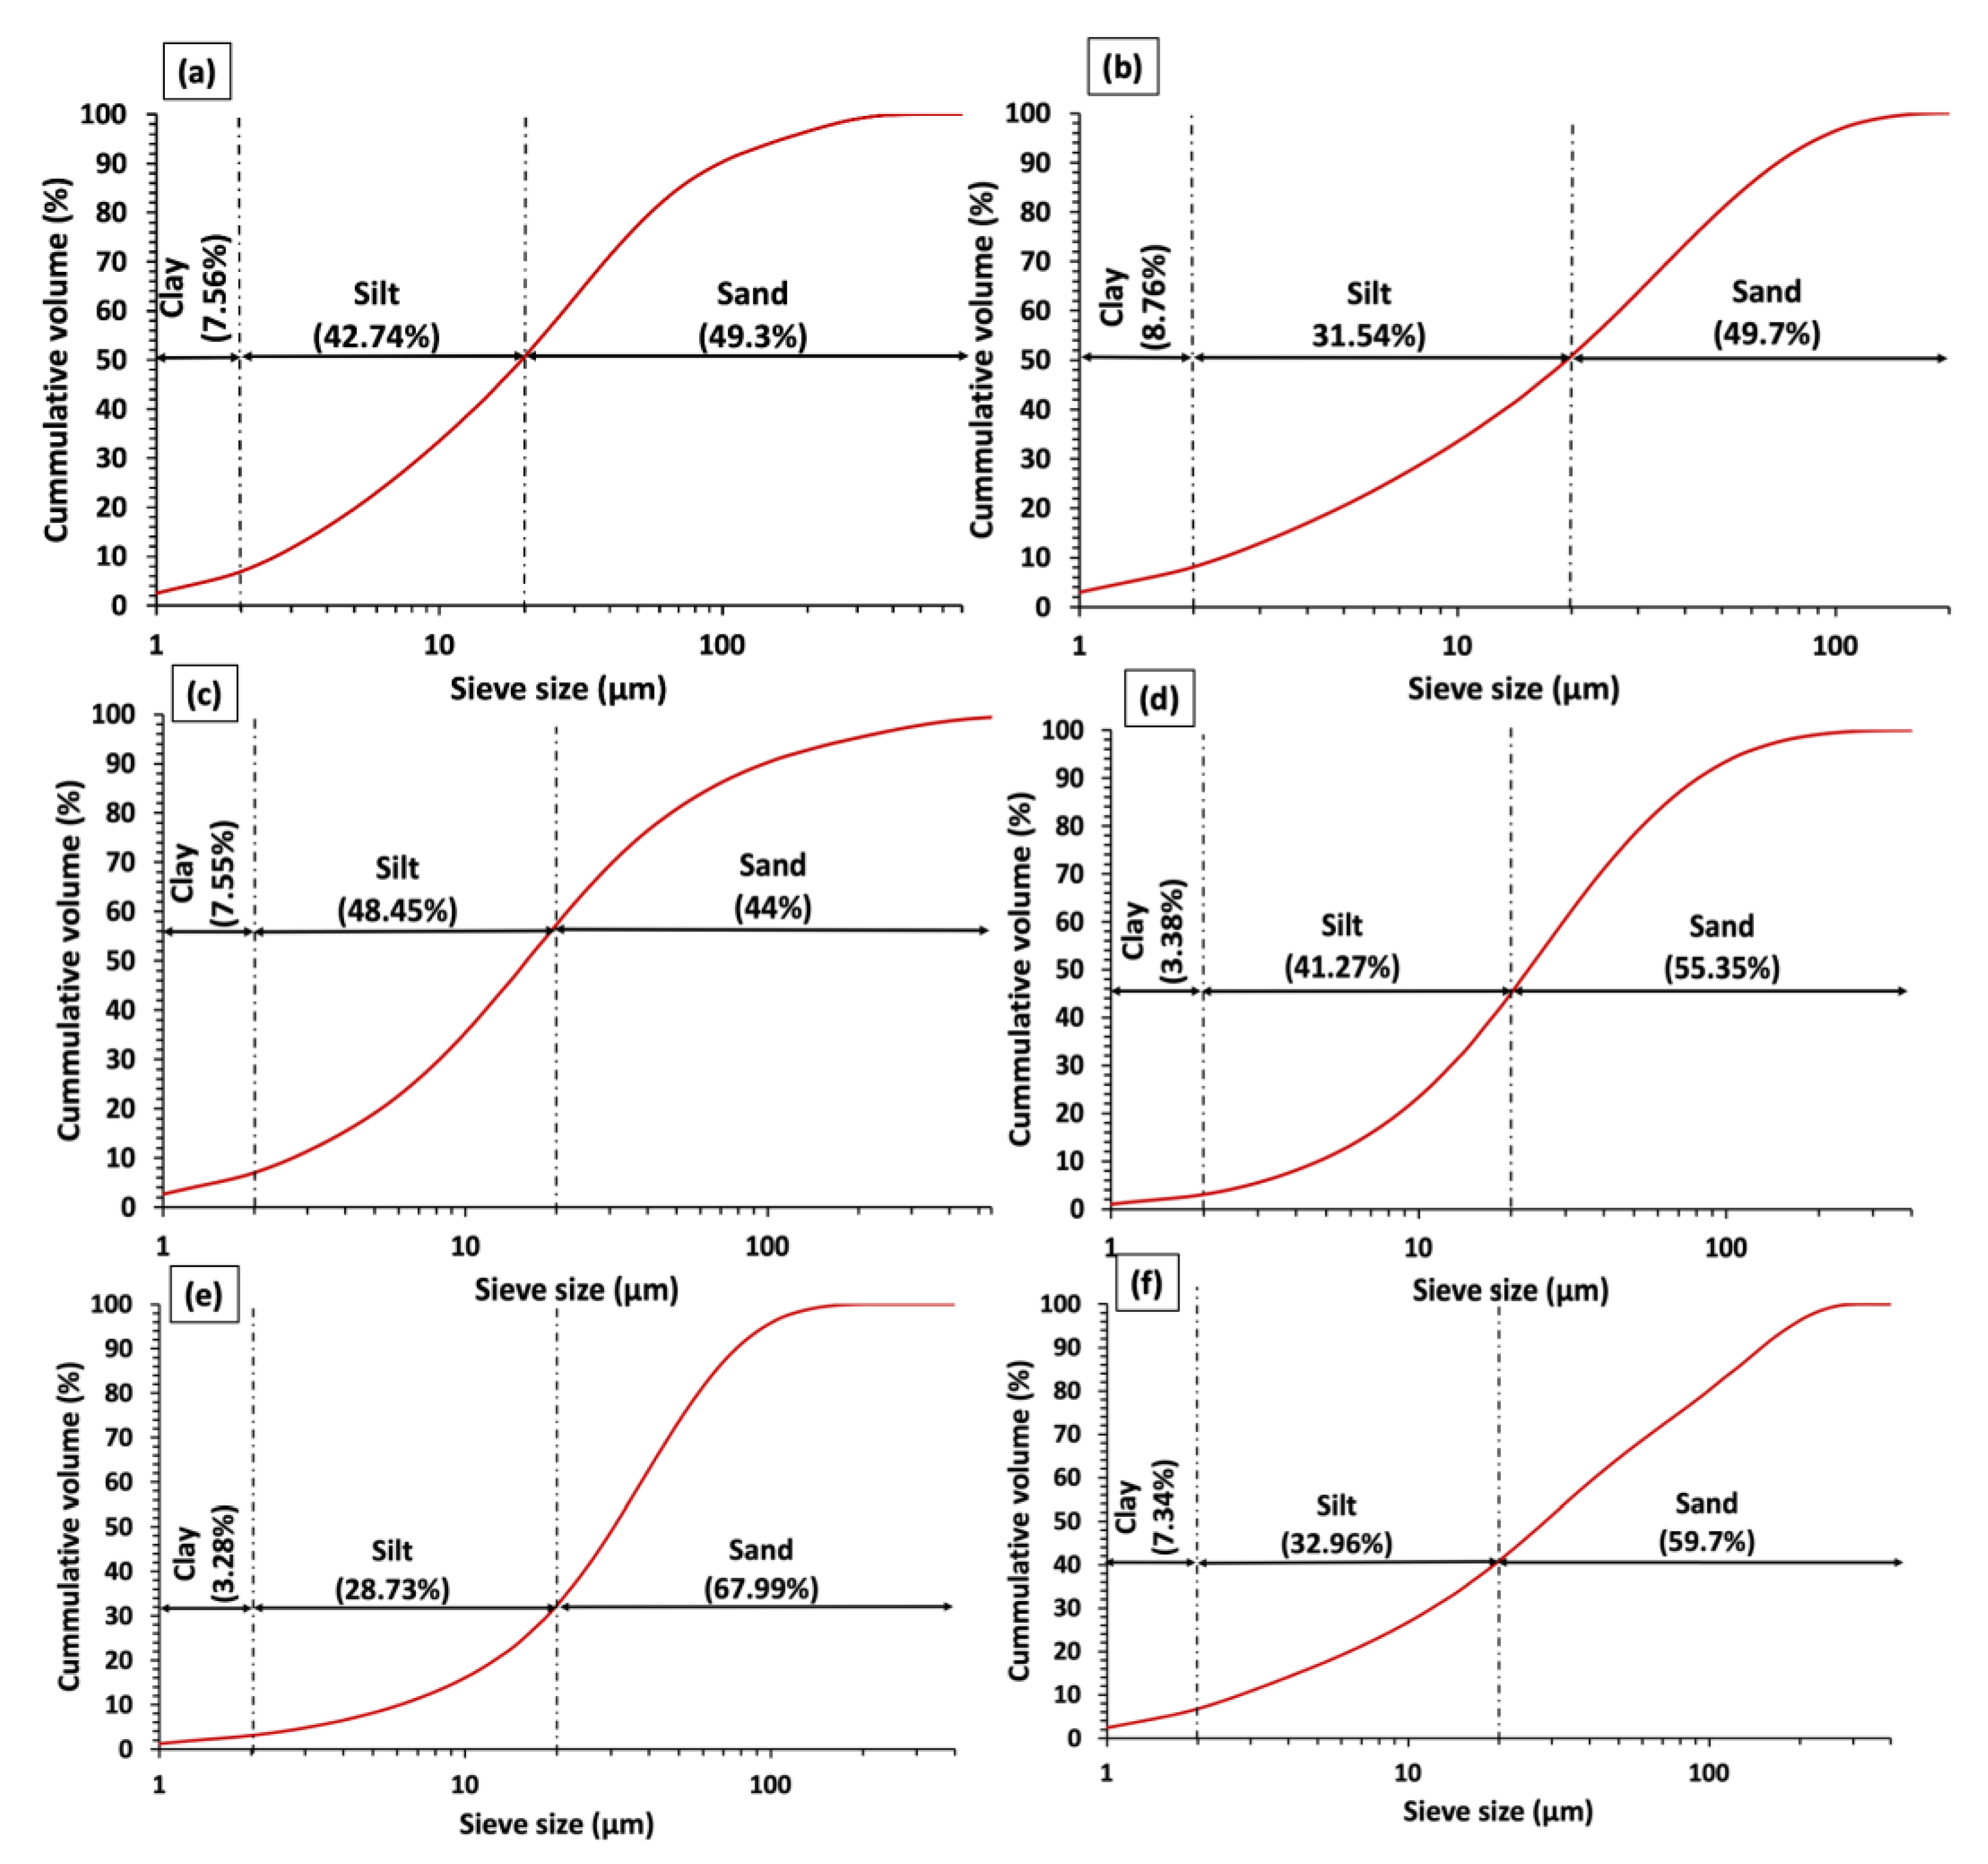
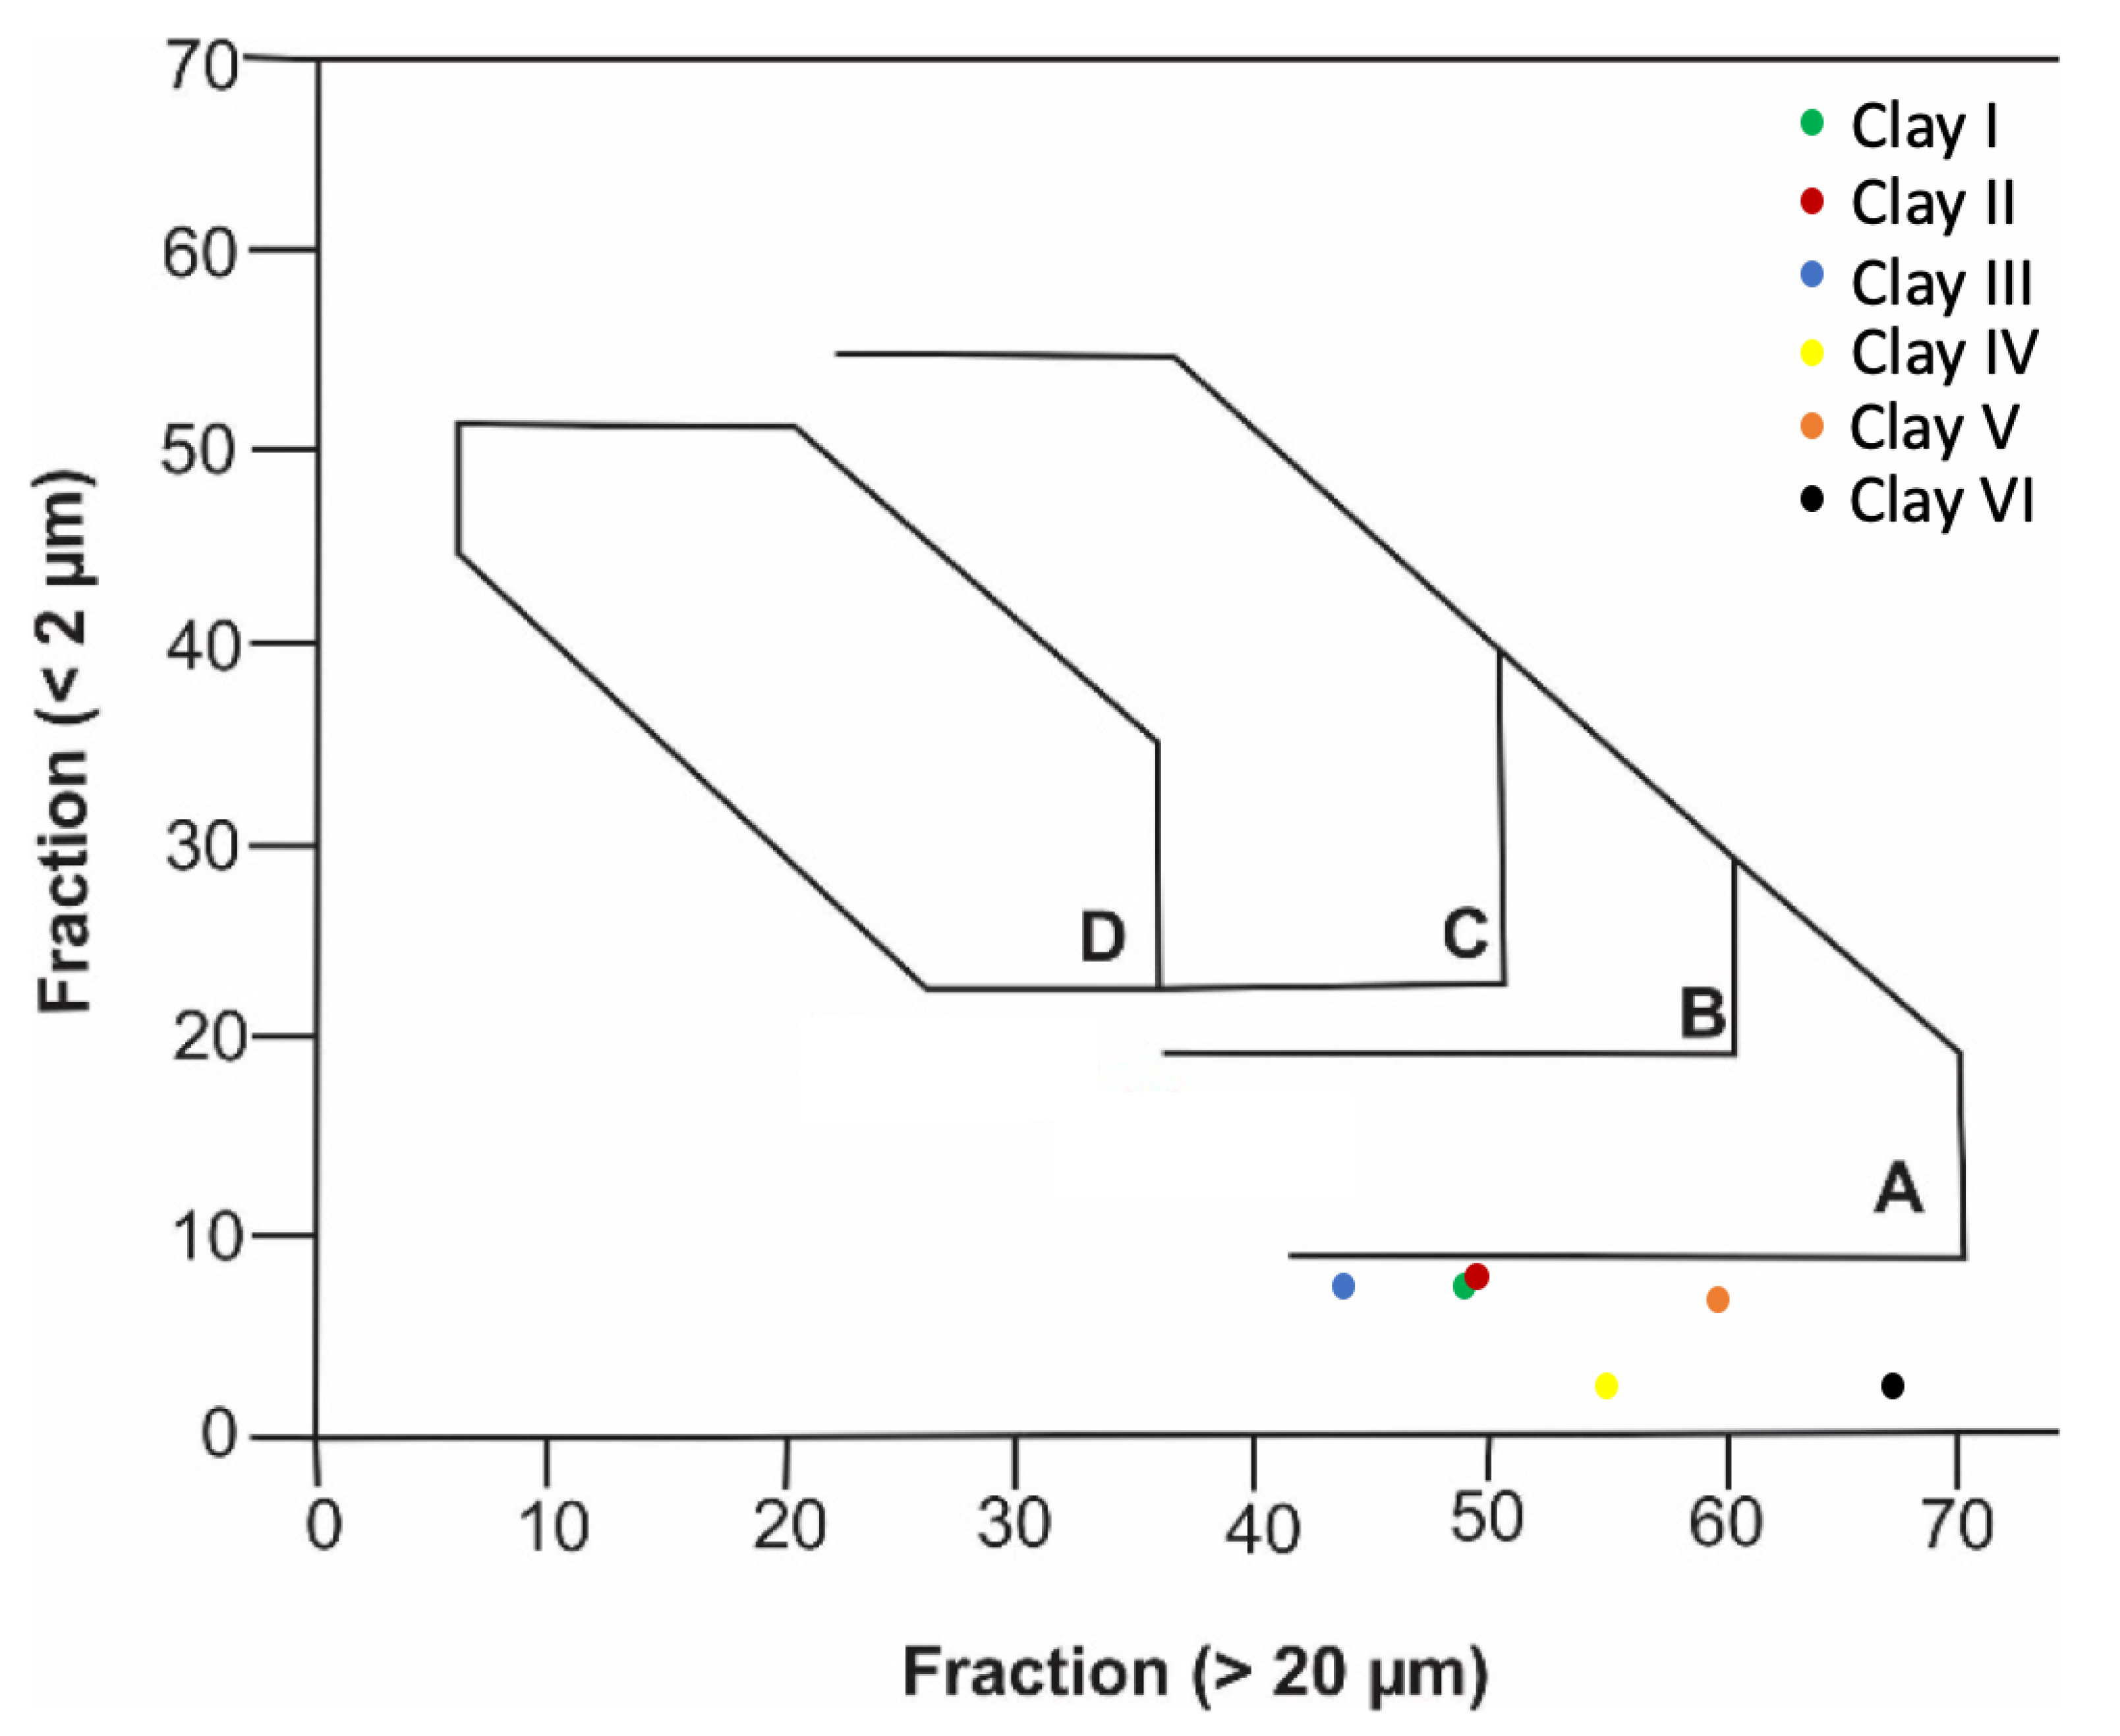
3.1.4. Particle Size Distribution
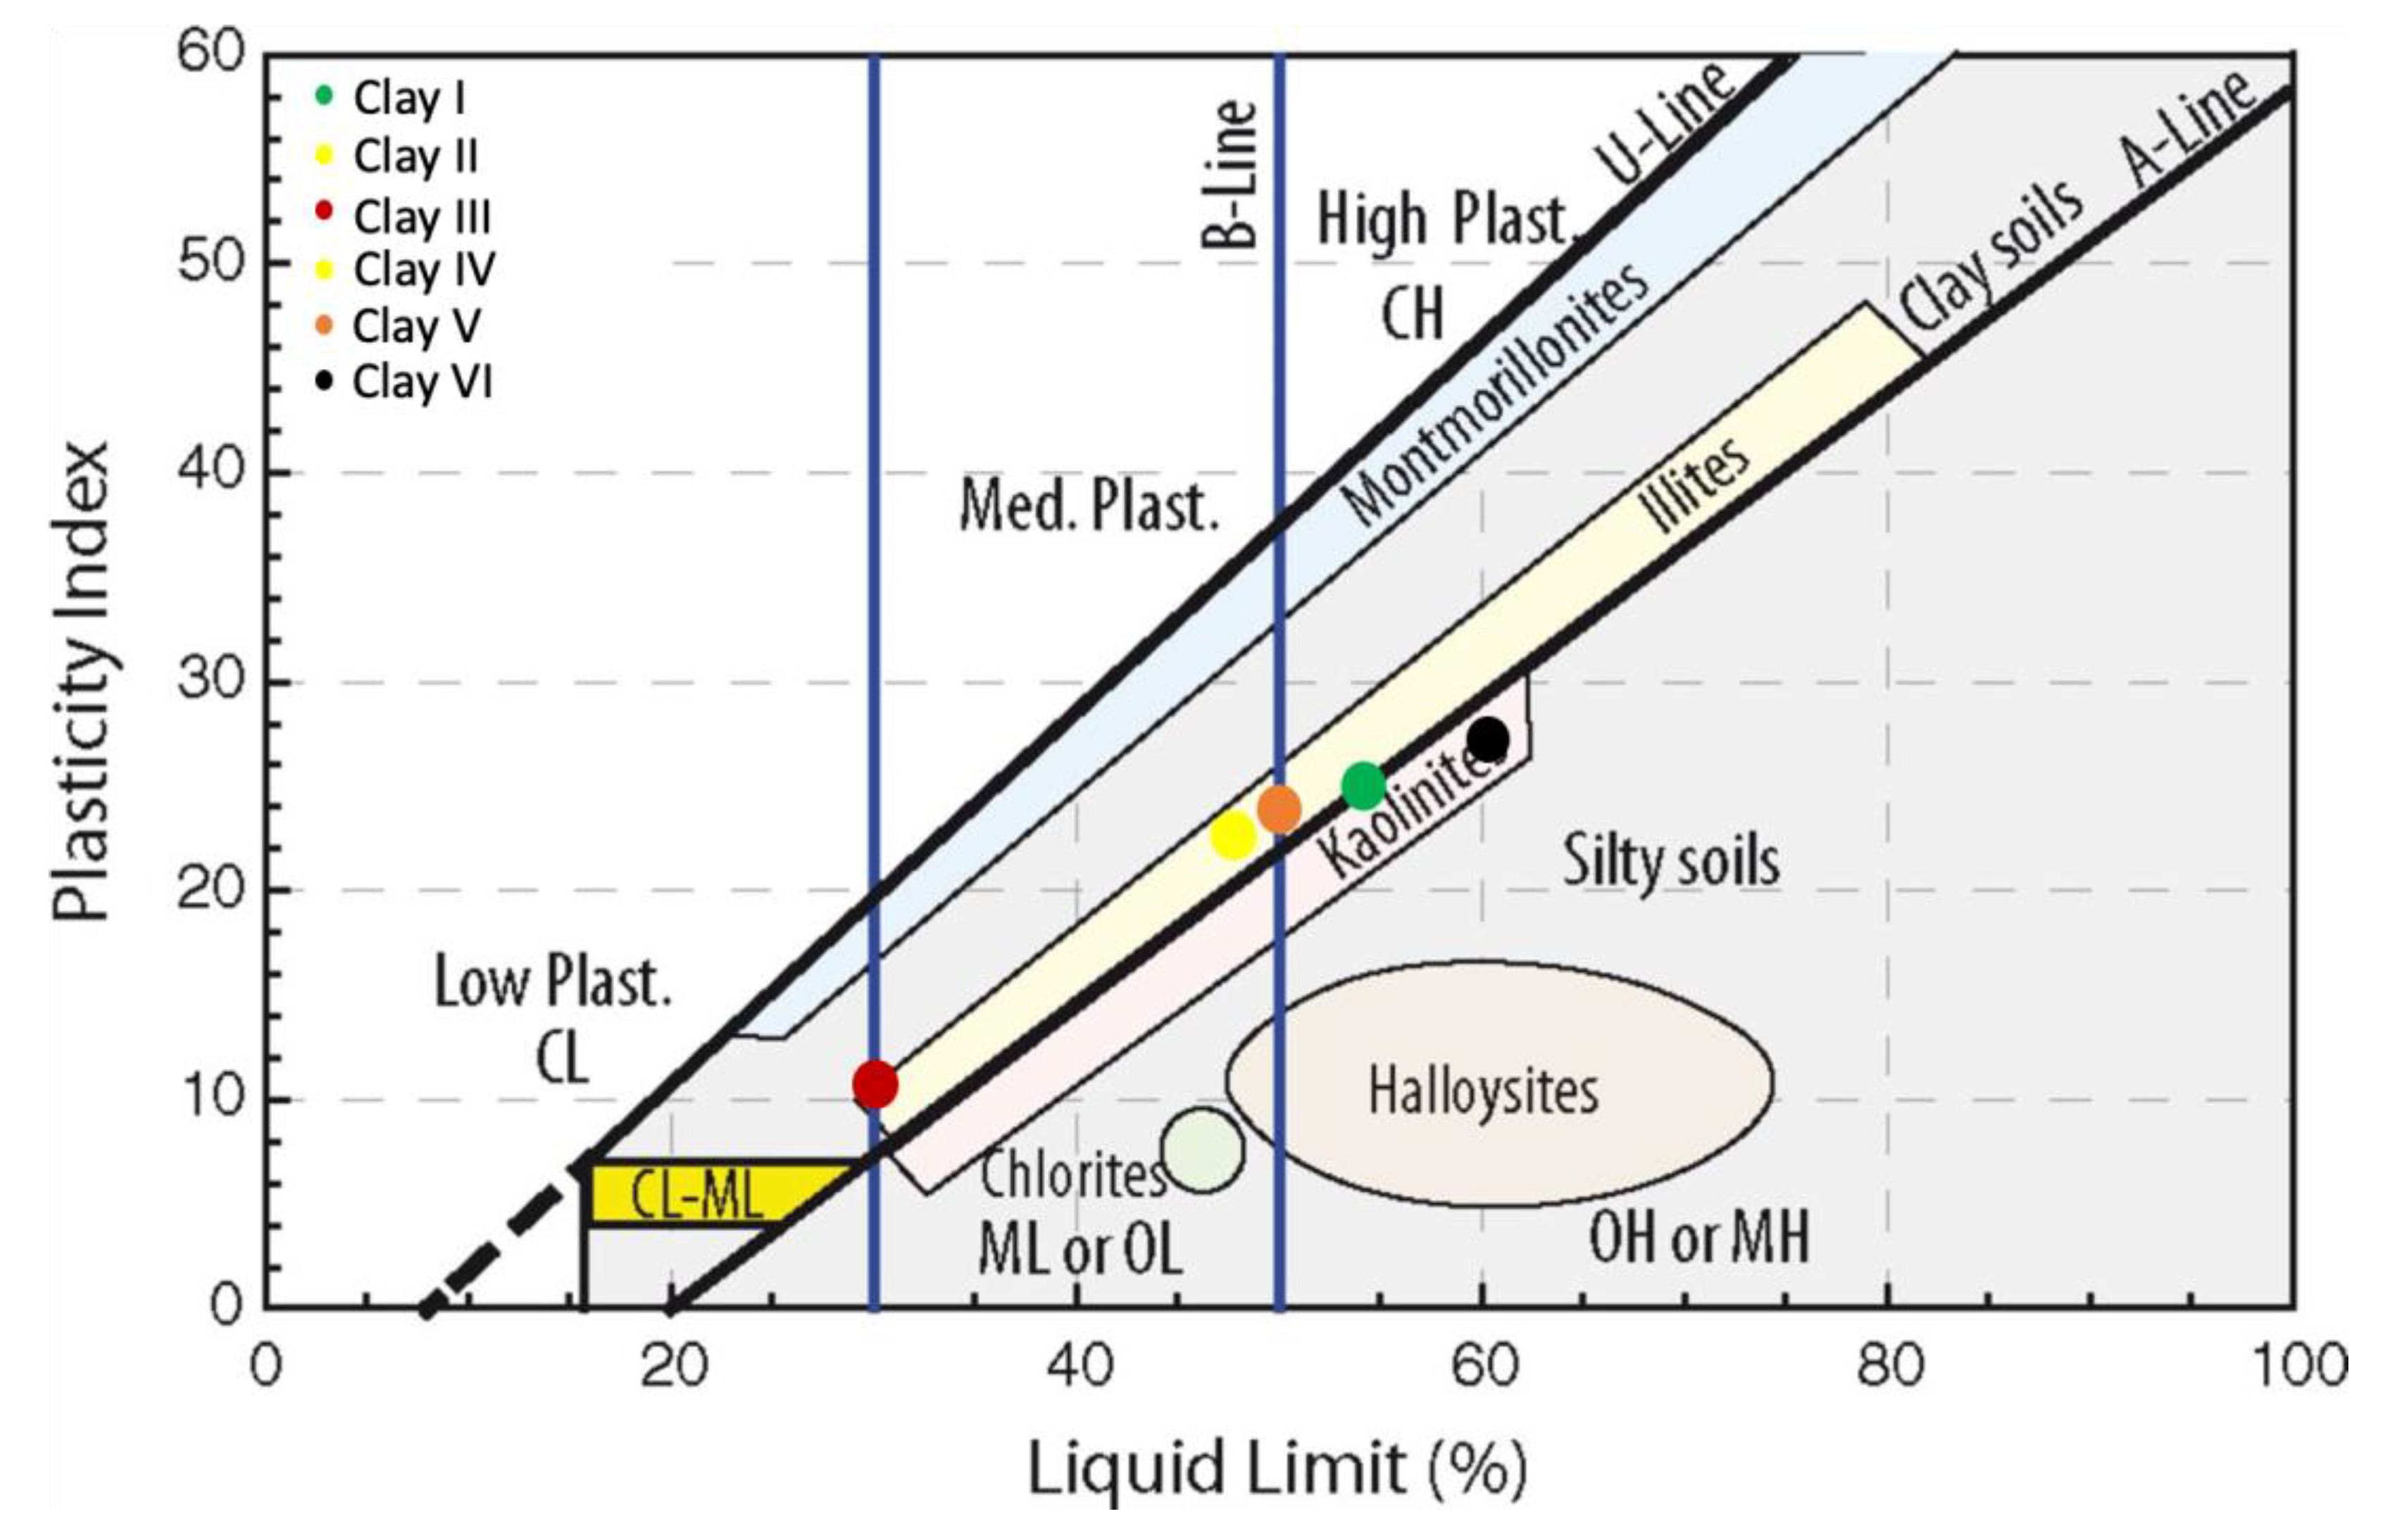
3.2. Index Properties
4. Conclusions
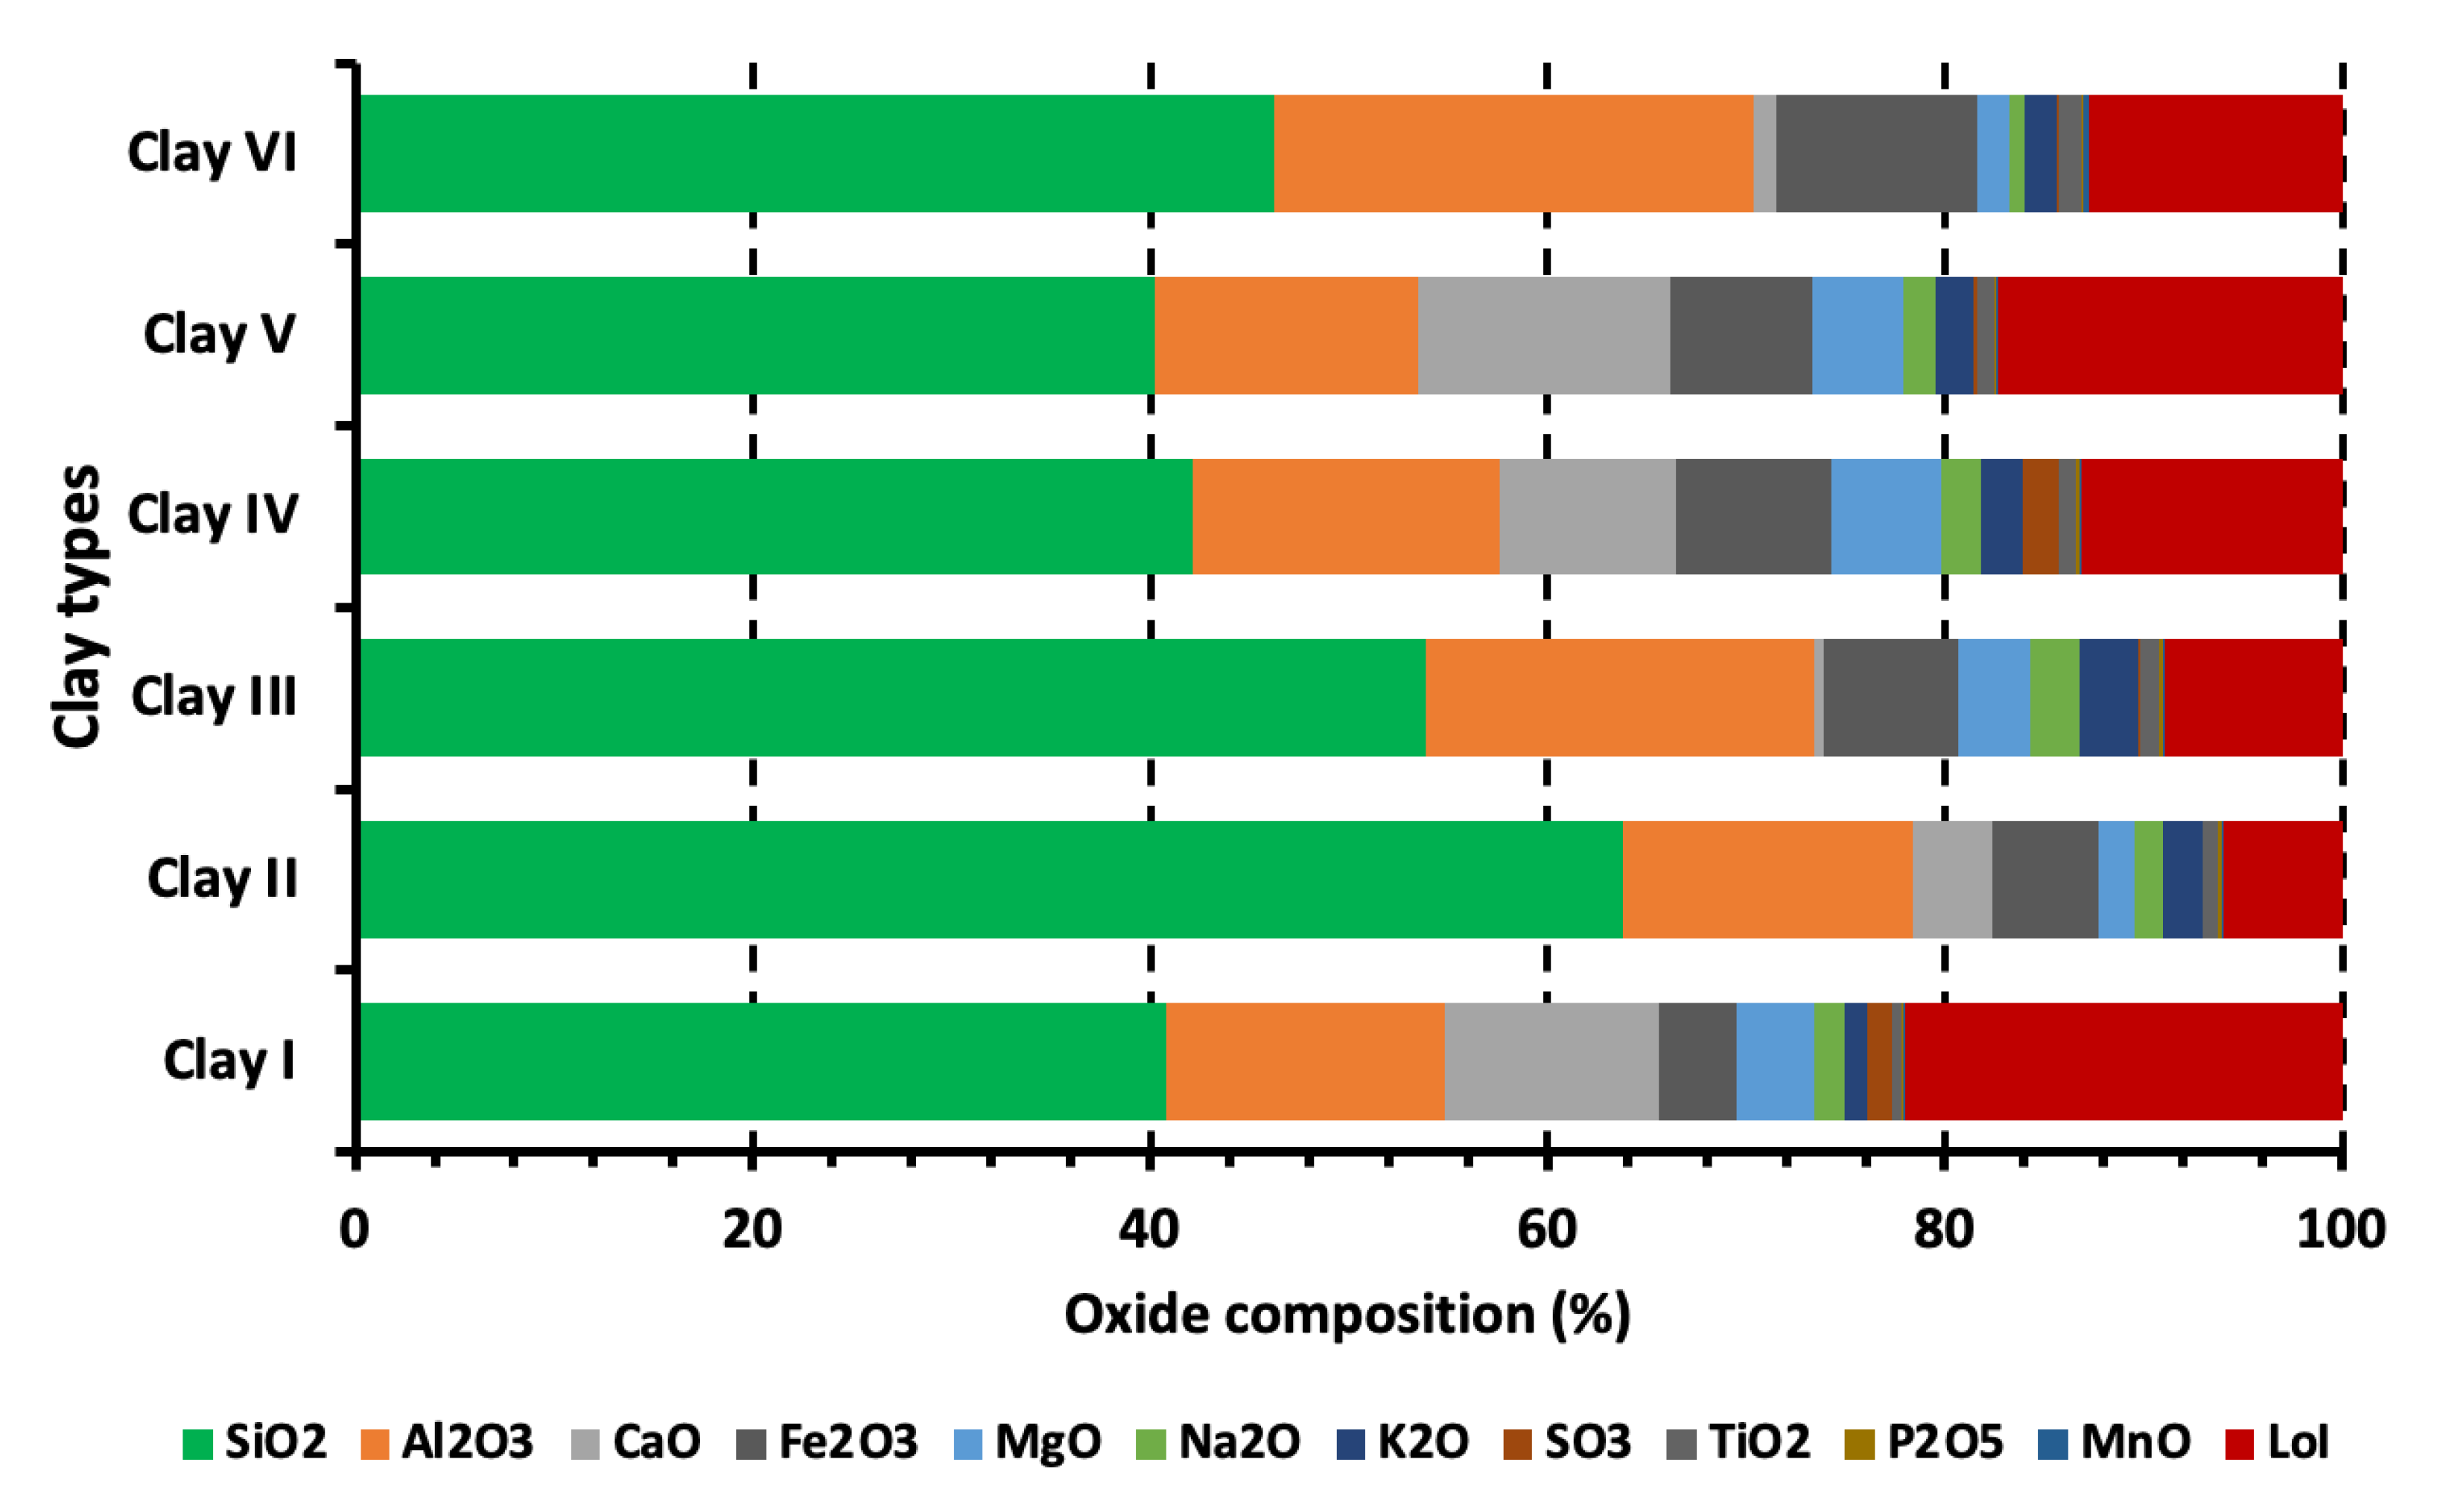
- Clay I, Clay IV, and Clay V have a lower amount of Al2O3 and considerable alkaline earth oxides (CaO and MgO) and alkali oxides (Na2O and K2O), which lead to the formation of the vitreous phase and reduce the melting point of clays required for the production of bricks.
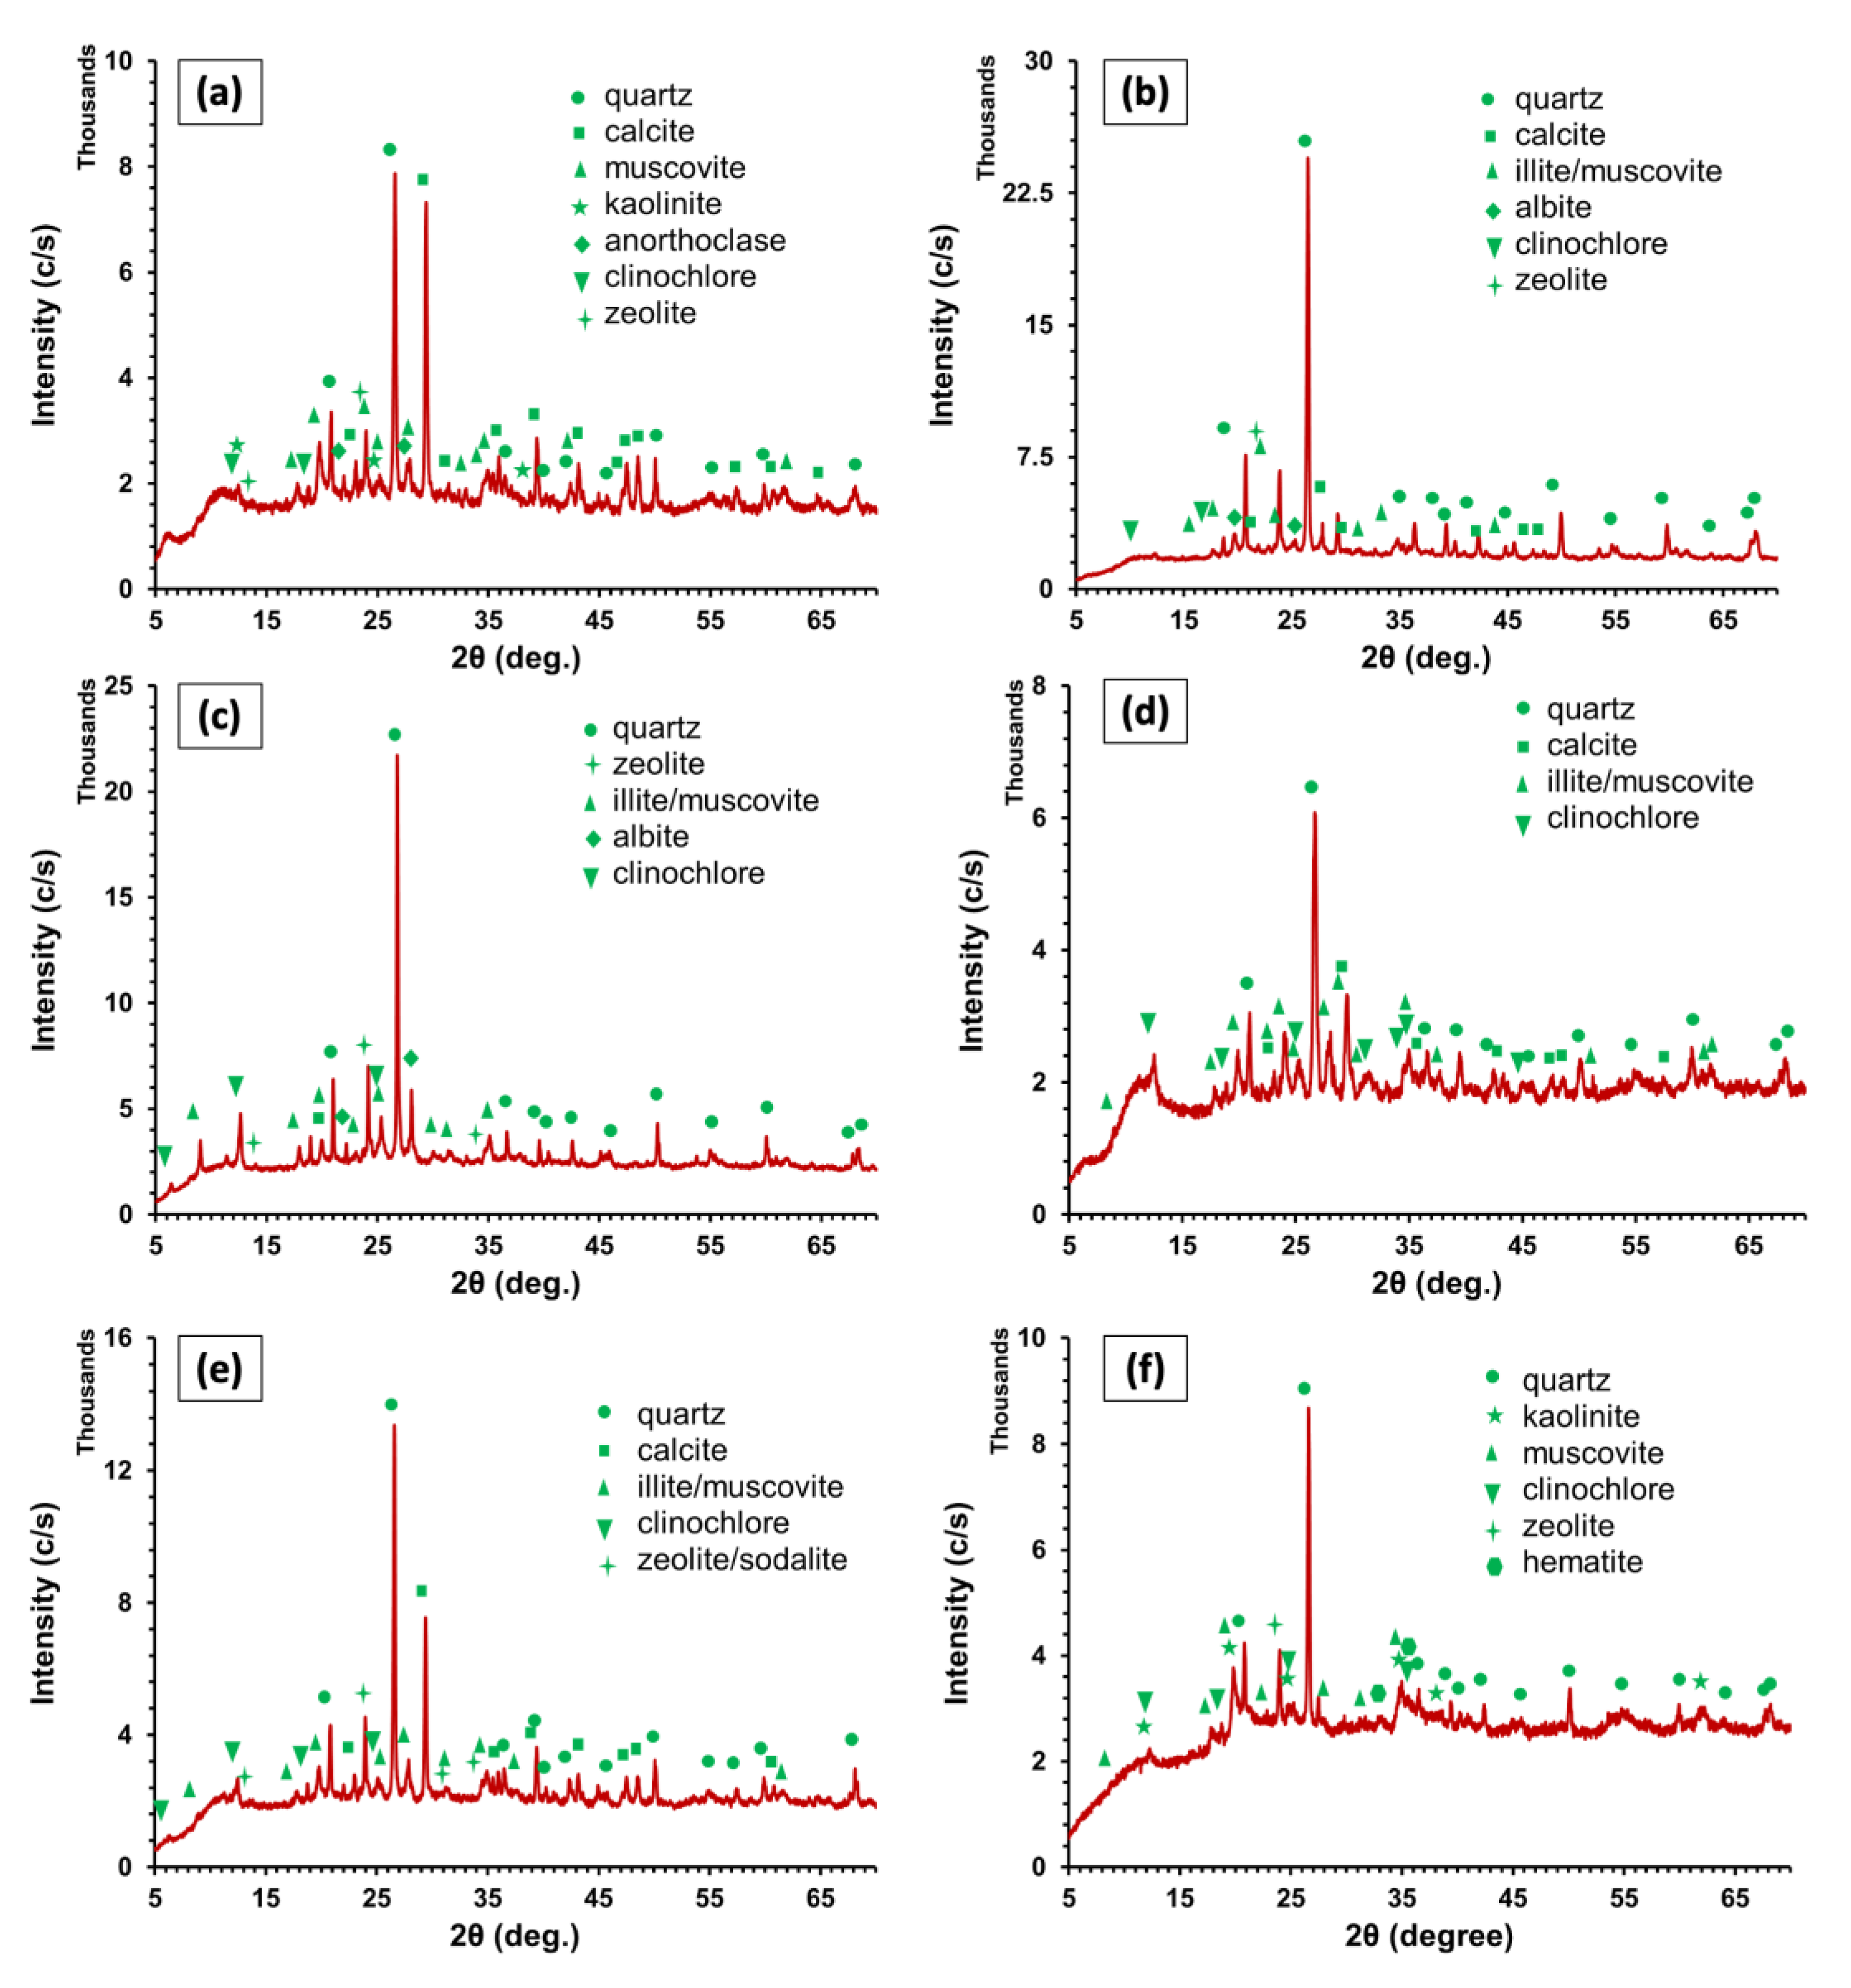
- All clay types studied have quartz, clinochlore, and illite/muscovite as mutual accessory minerals. Some clay types have variable minerals such as Clay I/VI has kaolinite, Clay I/II/III/VI has zeolite, Clay III has albite, and Clay VI has hematite. However, the mentioned clay minerals are in negligible amounts, which will not appreciably impact the properties of clay-based products.
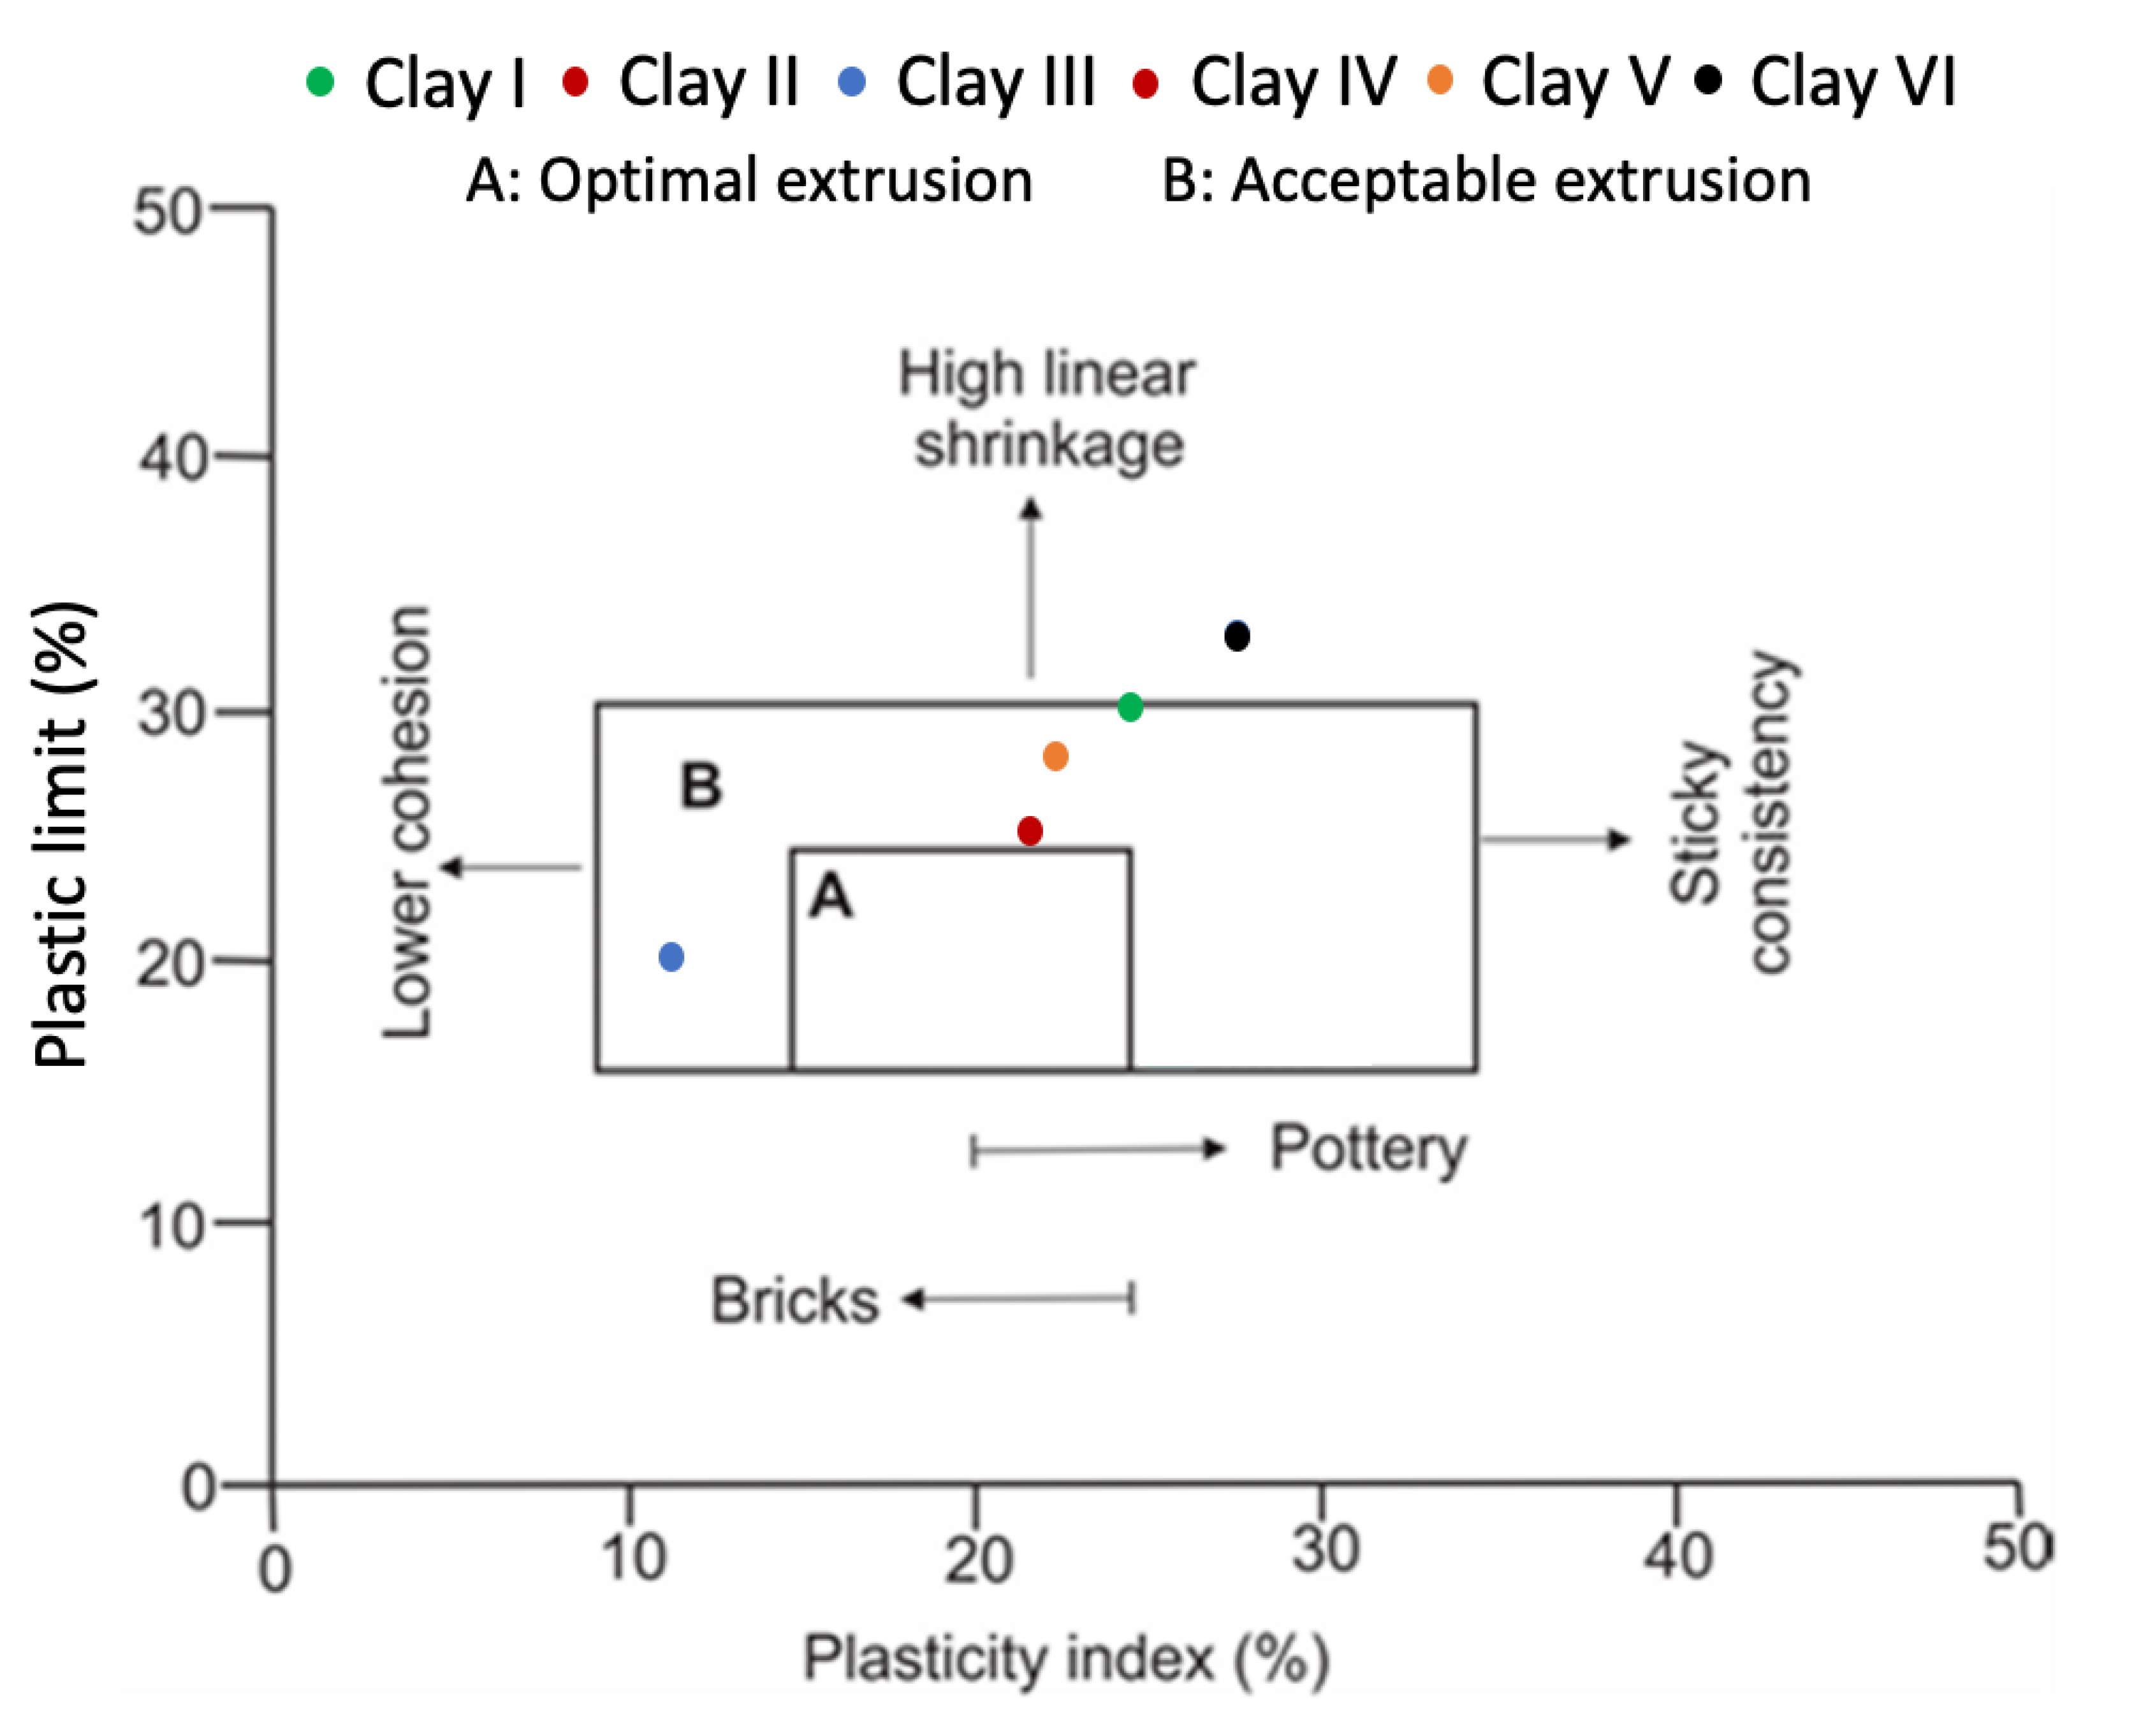
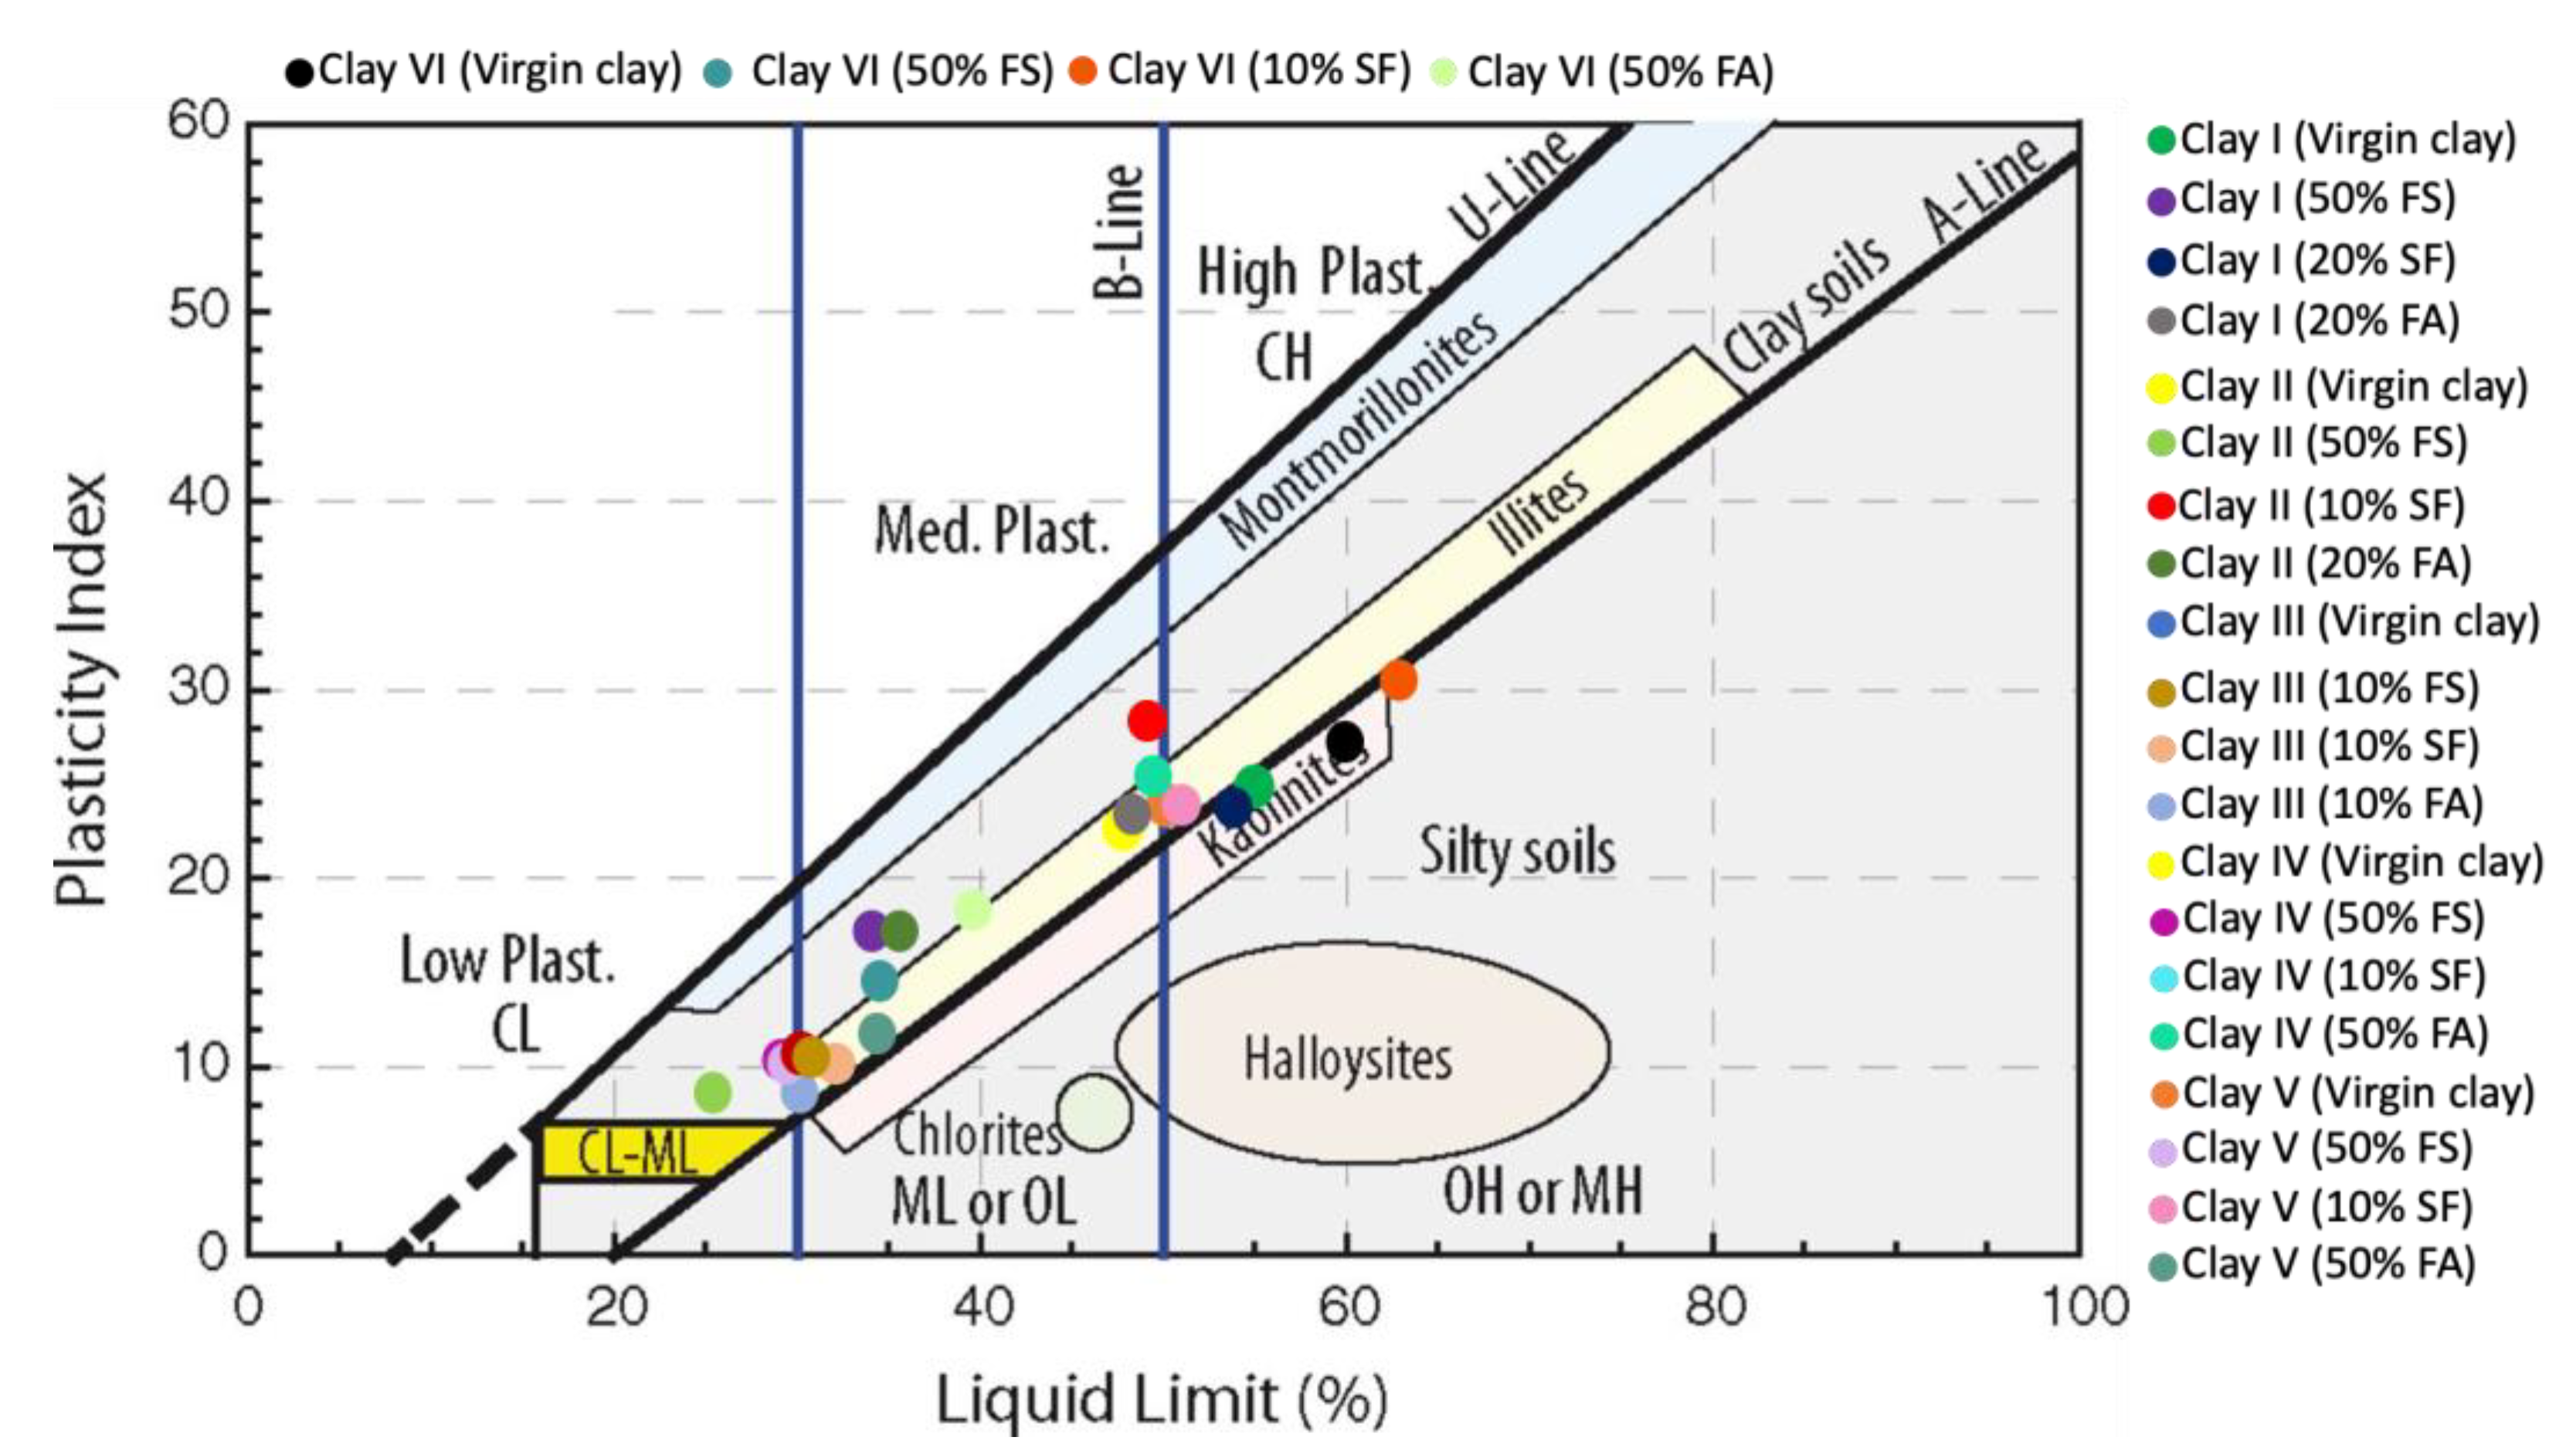
- Clay II, Clay IV, and Clay V are medium plastic clays while Clay I, Clay III, and Clay VI are high plastic clays, which are fine to be used in medium quality and low-quality clay-based products, respectively. However, the incorporation of 10–30% FS/FA in clay specimens reduces the index properties, which can be used to produce high-quality clay products. On the other hand, SF does not have a positive impact on the index properties of clays except Clay I.
- The addition of 10–30% FA/FS can also improve the workability of clays by placing them in the optimal extrusion region of the workability chart, which is beneficial in processing clays for different clay-based products.
Author Contributions
Funding
Data Availability Statement
Conflicts of Interest
Appendix A

| Sr. No. | Raw Materials | Phases (ICDD Reference) |
|---|---|---|
| 1 | Clay I | Quartz (01-078-1252) Calcite (01-086-2334) Muscovite (01-084-1302) Kaolinite (00-029-1488) Anorthoclase (01-075-1634) Clinochlore (00-045-1321) Zeolite (00-045-0510) Sodalite (00-052-0145) Albite (00-001-0739) Illite (00-043-0685) Hematite (00-039-0238) |
| 2 | Clay II | |
| 3 | Clay III | |
| 4 | Clay IV | |
| 5 | Clay V | |
| 6 | Clay VI | |
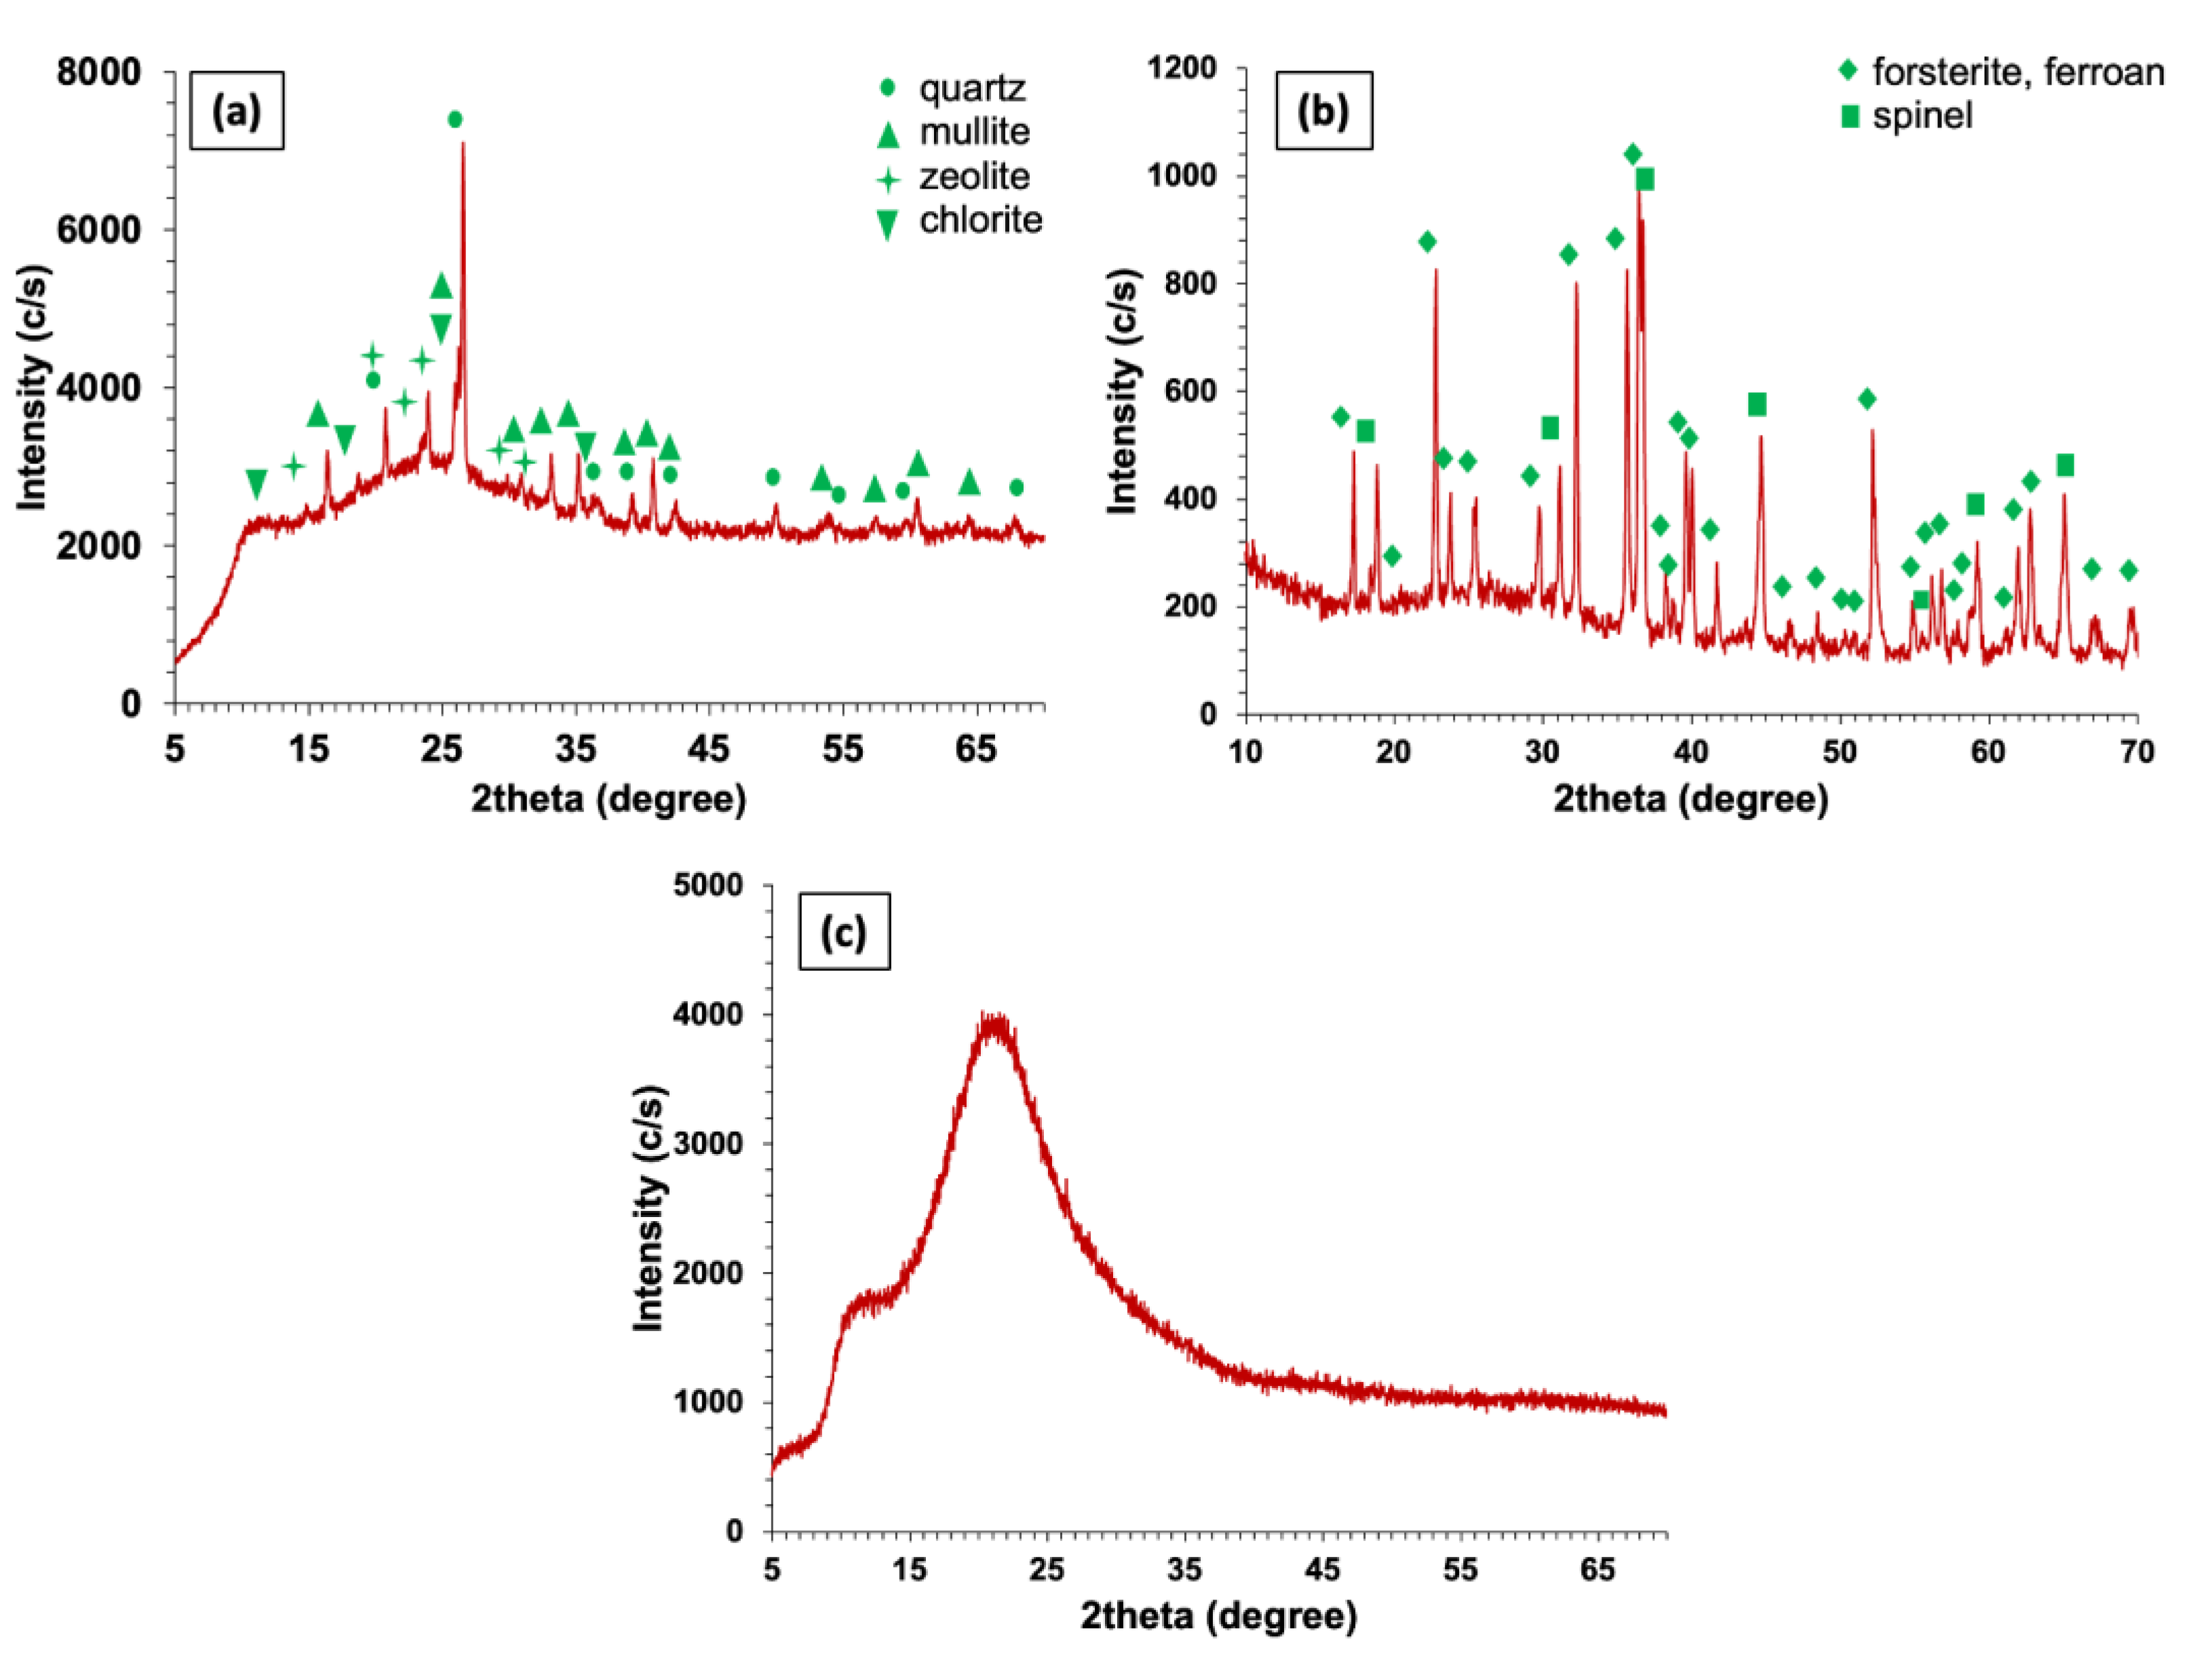
| 1 | SF | Amorphous structure |
| 2 | FC | Forsterite (01-083-1535) Spinel (01-075-1798) Amorphous structure |
| 3 | FA | Quartz (01-089-8936) Mullite (01-079-1275) Zeolite (00-035-0060) Chlorite (00-042-0584) Amorphous structure |
| Clays | Waste Materials | Percentage Replacement (%) | LL | PL | PI = LL − PL | SL |
|---|---|---|---|---|---|---|
| CLAY I | FS | 0 | 55 | 30 | 25 | 20 |
| 10 | 52 | 25 | 26 | 22 | ||
| 20 | 46 | 21 | 25 | 21 | ||
| 30 | 45 | 20 | 24 | 21 | ||
| 40 | 38 | 18 | 20 | 21 | ||
| 50 | 34 | 17 | 17 | 19 | ||
| SF | 0 | 55 | 30 | 25 | 20 | |
| 10 | 55 | 29 | 26 | 24 | ||
| 20 | 54 | 31 | 23 | 26 | ||
| 30 | 58 | 34 | 24 | 31 | ||
| 40 | 61 | 37 | 24 | 34 | ||
| 50 | 68 | 40 | 28 | 39 | ||
| FA | 0 | 55 | 30 | 25 | 20 | |
| 10 | 53 | 25 | 28 | 24 | ||
| 20 | 48 | 26 | 23 | 23 | ||
| 30 | 47 | 23 | 24 | 23 | ||
| 40 | 42 | 21 | 21 | 23 | ||
| 50 | 37 | 20 | 17 | 23 | ||
| CLAY II | FS | 0 | 48 | 26 | 22 | 23 |
| 10 | 37 | 19 | 18 | 19 | ||
| 20 | 34 | 18 | 15 | 18 | ||
| 30 | 30 | 17 | 13 | 18 | ||
| 40 | 28 | 16 | 11 | 19 | ||
| 50 | 25 | 16 | 9 | 17 | ||
| SF | 0 | 48 | 26 | 22 | 23 | |
| 10 | 49 | 21 | 28 | 21 | ||
| 20 | 53 | 26 | 27 | 25 | ||
| 30 | 57 | 29 | 28 | 30 | ||
| 40 | 60 | 32 | 28 | 31 | ||
| 50 | 68 | 36 | 32 | 40 | ||
| FA | 0 | 48 | 26 | 22 | 23 | |
| 10 | 38 | 19 | 18 | 19 | ||
| 20 | 36 | 20 | 17 | 20 | ||
| 30 | 34 | 19 | 14 | 20 | ||
| 40 | 33 | 18 | 14 | 20 | ||
| 50 | 28 | 18 | 10 | 20 | ||
| CLAY III | FS | 0 | 31 | 20 | 11 | 20 |
| 10 | 29 | 20 | 9 | 20 | ||
| 20 | 28 | 19 | 9 | 19 | ||
| 30 | 25 | 18 | 7 | 19 | ||
| 40 | 23 | 17 | 6 | 18 | ||
| 50 | 21 | 16 | 5 | 18 | ||
| SF | 0 | 31 | 20 | 11 | 20 | |
| 10 | 32 | 22 | 10 | 21 | ||
| 20 | 38 | 25 | 13 | 25 | ||
| 30 | 38 | 26 | 11 | 27 | ||
| 40 | 45 | 31 | 14 | 33 | ||
| 50 | 49 | 35 | 14 | 36 | ||
| FA | 0 | 31 | 20 | 11 | 20 | |
| 10 | 30 | 21 | 9 | 22 | ||
| 20 | 30 | 22 | 8 | 19 | ||
| 30 | 27 | 21 | 6 | 23 | ||
| 40 | 26 | 20 | 6 | 23 | ||
| 50 | 25 | 21 | 5 | 23 | ||
| CLAY IV | FS | 0 | 48 | 26 | 22 | 23 |
| 10 | 43 | 23 | 20 | 26 | ||
| 20 | 40 | 22 | 19 | 23 | ||
| 30 | 37 | 20 | 16 | 23 | ||
| 40 | 33 | 21 | 11 | 23 | ||
| 50 | 29 | 18 | 11 | 21 | ||
| SF | 0 | 48 | 26 | 22 | 23 | |
| 10 | 49 | 25 | 24 | 25 | ||
| 20 | 53 | 27 | 25 | 26 | ||
| 30 | 54 | 28 | 26 | 34 | ||
| 40 | 61 | 33 | 28 | 35 | ||
| 50 | 62 | 34 | 28 | 41 | ||
| FA | 0 | 48 | 26 | 22 | 23 | |
| 10 | 46 | 26 | 20 | 26 | ||
| 20 | 43 | 24 | 19 | 25 | ||
| 30 | 40 | 24 | 16 | 26 | ||
| 40 | 38 | 22 | 16 | 25 | ||
| 50 | 35 | 22 | 13 | 26 | ||
| CLAY V | FS | 0 | 50 | 27 | 23 | 24 |
| 10 | 44 | 24 | 20 | 23 | ||
| 20 | 41 | 24 | 17 | 22 | ||
| 30 | 37 | 20 | 17 | 22 | ||
| 40 | 33 | 20 | 13 | 20 | ||
| 50 | 29 | 19 | 10 | 19 | ||
| SF | 0 | 50 | 27 | 23 | 24 | |
| 10 | 51 | 27 | 23 | 24 | ||
| 20 | 54 | 29 | 25 | 29 | ||
| 30 | 57 | 36 | 22 | 34 | ||
| 40 | 61 | 37 | 25 | 37 | ||
| 50 | 66 | 43 | 23 | 42 | ||
| FA | 0 | 50 | 27 | 23 | 24 | |
| 10 | 46 | 24 | 22 | 24 | ||
| 20 | 43 | 23 | 20 | 22 | ||
| 30 | 42 | 22 | 19 | 24 | ||
| 40 | 37 | 23 | 14 | 23 | ||
| 50 | 34 | 22 | 12 | 23 | ||
| Clay VI | FS | 0 | 60 | 33 | 27 | 17 |
| 10 | 58 | 28 | 30 | 19 | ||
| 20 | 50 | 26 | 24 | 18 | ||
| 30 | 44 | 22 | 21 | 18 | ||
| 40 | 40 | 20 | 21 | 18 | ||
| 50 | 34 | 18 | 15 | 19 | ||
| SF | 0 | 60 | 33 | 27 | 17 | |
| 10 | 63 | 32 | 31 | 23 | ||
| 20 | 65 | 32 | 33 | 41 | ||
| 30 | 66 | 35 | 31 | 34 | ||
| 40 | 71 | 37 | 34 | 38 | ||
| 50 | 71 | 37 | 34 | 40 | ||
| FA | 0 | 60 | 33 | 27 | 17 | |
| 10 | 58 | 28 | 30 | 19 | ||
| 20 | 52 | 27 | 23 | 19 | ||
| 30 | 48 | 24 | 25 | 18 | ||
| 40 | 44 | 21 | 23 | 19 | ||
| 50 | 39 | 21 | 18 | 19 |
References
- Carretero, M.I. Clay minerals and their beneficial effects upon human health. A review. Appl. Clay Sci. 2002, 21, 155–163. [Google Scholar] [CrossRef]
- Pentráková, L.; Su, K.; Pentrák, M.; Stucki, J. A review of microbial redox interactions with structural Fe in clay minerals. Clay Miner. 2013, 48, 543–560. [Google Scholar] [CrossRef]
- Yu, W.H.; Li, N.; Tong, D.S.; Zhou, C.H.; Lin, C.X.C.; Xu, C.Y. Adsorption of proteins and nucleic acids on clay minerals and their interactions: A review. Appl. Clay Sci. 2013, 80, 443–452. [Google Scholar] [CrossRef]
- Singer, A. The paleoclimatic interpretation of clay minerals in sediments—A review. Earth-Sci. Rev. 1984, 21, 251–293. [Google Scholar] [CrossRef]
- Środoń, J. Use of clay minerals in reconstructing geological processes: Recent advances and some perspectives. Clay Miner. 1999, 34, 27–37. [Google Scholar] [CrossRef]
- Sabir, B.; Wild, S.; Bai, J. Metakaolin and calcined clays as pozzolans for concrete: A review. Cem. Concr. Compos. 2001, 23, 441–454. [Google Scholar] [CrossRef]
- Calvino, M.M.; Lisuzzo, L.; Cavallaro, G.; Lazzara, G.; Milioto, S. Halloysite based geopolymers filled with wax microparticles as sustainable building materials with enhanced thermo-mechanical performances. J. Environ. Chem. Eng. 2022, 10, 108594. [Google Scholar] [CrossRef]
- Calvino, M.M.; Lisuzzo, L.; Cavallaro, G.; Lazzara, G.; Pipitone, C.; Giannici, F. Beeswax/halloysite microparticles embedded within a geopolymeric layer for the protective coating of steel. Mater. Lett. 2023, 330, 133257. [Google Scholar] [CrossRef]
- Kaya, M.; Köksal, F.; Nodehi, M.; Bayram, M.; Gencel, O.; Ozbakkaloglu, T. The Effect of Sodium and Magnesium Sulfate on Physico-Mechanical and Microstructural Properties of Kaolin and Ceramic Powder-Based Geopolymer Mortar. Sustainability 2022, 14, 13496. [Google Scholar] [CrossRef]
- Dondi, M.; Raimondo, M.; Zanelli, C. Clays and bodies for ceramic tiles: Reappraisal and technological classification. Appl. Clay Sci. 2014, 96, 91–109. [Google Scholar] [CrossRef]
- Penner, E.; Burn, K. Review of engineering behaviour of marine clays in Eastern Canada. Can. Geotech. J. 1978, 15, 269–282. [Google Scholar] [CrossRef]
- da Silva Favero, J.; Parisotto-Peterle, J.; Weiss-Angeli, V.; Brandalise, R.N.; Gomes, L.B.; Bergmann, C.P.; dos Santos, V. Physical and chemical characterization and method for the decontamination of clays for application in cosmetics. Appl. Clay Sci. 2016, 124, 252–259. [Google Scholar] [CrossRef]
- Zumsteg, R.; Plötze, M.; Puzrin, A. Reduction of the clogging potential of clays: New chemical applications and novel quantification approaches. In Proceedings of the Bio-and Chemo-Mechanical Processes in Geotechnical Engineering; Institution of Civil Engineers: London, UK, 2013; pp. 44–54. [Google Scholar]
- Sellin, P.; Leupin, O.X. The use of clay as an engineered barrier in radioactive-waste management—A review. Clays Clay Miner. 2013, 61, 477–498. [Google Scholar] [CrossRef]
- Veniale, F. Applicazioni e utilizzazioni medico-sanitarie di materiali argillosi (naturali e modificati). In Argille e Minerali Delle Argille. GUIDA Alla Definizione di Caratteristiche e Propietà per gli Usi Industriali; Morandi, N., Dondi, M., Eds.; Corso di Formazione, Gruppo Italiano AIPEA: Rimini, Italy, 1997; pp. 205–239. [Google Scholar]
- Semiz, B. Characteristics of clay-rich raw materials for ceramic applications in Denizli region (Western Anatolia). Appl. Clay Sci. 2017, 137, 83–93. [Google Scholar] [CrossRef]
- Guggenheim, S.; Martin, R. Definition of clay and clay mineral: Joint report of the AIPEA nomenclature and CMS nomenclature committees. Clays Clay Miner. 1995, 43, 255–256. [Google Scholar] [CrossRef]
- Ferro, V.; Mirabile, S. Comparing particle size distribution analysis by sedimentation and laser diffraction method. J. Agric. Eng. 2009, 40, 35–43. [Google Scholar] [CrossRef] [Green Version]
- Murray, H. Applied clay mineralogy today and tomorrow. Clay Miner. 1999, 34, 39–49. [Google Scholar] [CrossRef]
- Koroneos, C.; Dompros, A. Environmental assessment of brick production in Greece. Build. Environ. 2007, 42, 2114–2123. [Google Scholar] [CrossRef]
- Gencel, O. Characteristics of fired clay bricks with pumice additive. Energy Build. 2015, 102, 217–224. [Google Scholar] [CrossRef]
- Vasić, M.; Pezo, L.; Zdravković, J.; Bačkalić, Z.; Radojević, Z. The study of thermal behavior of montmorillonite and hydromica brick clays in predicting tunnel kiln firing curve. Constr. Build. Mater. 2017, 150, 872–879. [Google Scholar] [CrossRef]
- Lynch, G. Bricks: Properties and classifications. Struct. Surv. 1994, 12, 15–20. [Google Scholar] [CrossRef]
- Sutcu, M.; Alptekin, H.; Erdogmus, E.; Er, Y.; Gencel, O. Characteristics of fired clay bricks with waste marble powder addition as building materials. Constr. Build. Mater. 2015, 82, 1–8. [Google Scholar] [CrossRef]
- Weyant, C.; Athalye, V.; Ragavan, S.; Rajarathnam, U.; Lalchandani, D.; Maithel, S.; Baum, E.; Bond, T.C. Emissions from South Asian brick production. Environ. Sci. Technol. 2014, 48, 6477–6483. [Google Scholar] [CrossRef] [PubMed]
- Sabapathy, A.; AS, S.; Murthy, V.; Maithel, S.; Lalchandani, D. Strategies for Cleaner Walling Material in India. 2011. Available online: https://www.ef.org (accessed on 4 November 2022).
- Zhang, L. Production of bricks from waste materials–A review. Constr. Build. Mater. 2013, 47, 643–655. [Google Scholar] [CrossRef]
- Munir, M.J.; Kazmi, S.M.S.; Wu, Y.-F.; Hanif, A.; Khan, M.U.A. Thermally efficient fired clay bricks incorporating waste marble sludge: An industrial-scale study. J. Clean. Prod. 2018, 174, 1122–1135. [Google Scholar] [CrossRef]
- Sangiorgio, V.; Parisi, F.; Fieni, F.; Parisi, N. The New Boundaries of 3D-Printed Clay Bricks Design: Printability of Complex Internal Geometries. Sustainability 2022, 14, 598. [Google Scholar] [CrossRef]
- Cruz, P.J.; Camões, A.; Figueiredo, B.; Ribeiro, M.J.; Renault, J. Additive manufacturing effect on the mechanical behaviour of architectural stoneware bricks. Constr. Build. Mater. 2020, 238, 117690. [Google Scholar] [CrossRef]
- PN, M.L.; Peter, C.; Mohan, K.; Greens, S.; George, S. Energy efficient production of clay bricks using industrial waste. Heliyon 2018, 4, e00891. [Google Scholar] [CrossRef] [Green Version]
- Priyadarshini, M.; Giri, J.P.; Patnaik, M. Variability in the compressive strength of non-conventional bricks containing agro and industrial waste. Case Stud. Constr. Mater. 2021, 14, e00506. [Google Scholar] [CrossRef]
- Chin, W.Q.; Lee, Y.H.; Amran, M.; Fediuk, R.; Vatin, N.; Kueh, A.B.H.; Lee, Y.Y. A Sustainable reuse of agro-industrial wastes into green cement bricks. Materials 2022, 15, 1713. [Google Scholar] [CrossRef]
- Misra, V.; Pandey, S. Hazardous waste, impact on health and environment for development of better waste management strategies in future in India. Environ. Int. 2005, 31, 417–431. [Google Scholar] [CrossRef] [PubMed]
- Gollakota, A.R.; Volli, V.; Shu, C.-M. Progressive utilisation prospects of coal fly ash: A review. Sci. Total. Environ. 2019, 672, 951–989. [Google Scholar] [CrossRef] [PubMed]
- Danish, A.; Mosaberpanah, M.A. Formation mechanism and applications of cenospheres: A review. J. Mater. Sci. 2020, 55, 4539–4557. [Google Scholar] [CrossRef]
- Acharya, P.K.; Patro, S.K. Utilization of ferrochrome wastes such as ferrochrome ash and ferrochrome slag in concrete manufacturing. Waste Manag. Res. 2016, 34, 764–774. [Google Scholar] [CrossRef] [PubMed]
- Siddique, R.; Chahal, N. Use of silicon and ferrosilicon industry by-products (silica fume) in cement paste and mortar. Resour. Conserv. Recycl. 2011, 55, 739–744. [Google Scholar] [CrossRef]
- Türköz, M.; Umu, S.U.; Öztürk, O. Effect of Silica Fume as a Waste Material for Sustainable Environment on the Stabilization and Dynamic Behavior of Dispersive Soil. Sustainability 2021, 13, 4321. [Google Scholar] [CrossRef]
- Abdelkader, H.A.; Hussein, M.; Ye, H. Influence of Waste Marble Dust on the Improvement of Expansive Clay Soils. Adv. Civ. Eng. 2021, 2021, 1–13. [Google Scholar] [CrossRef]
- Bergaya, F.; Lagaly, G. Handbook of Clay Science; Elsevier: Newnes, Australia, 2013. [Google Scholar]
- Shalabi, F.I.; Asi, I.M.; Qasrawi, H.Y. Effect of by-product steel slag on the engineering properties of clay soils. J. King Saud Univ.-Eng. Sci. 2017, 29, 394–399. [Google Scholar] [CrossRef] [Green Version]
- Abdalqadir, Z.K.; Salih, N.B.; Salih, S.J. The improvement of the geotechnical properties of low-plasticity clay (CL) using steel slag in Sulaimani City/Iraq. Géoméch. Geoengin. 2021, 17, 834–841. [Google Scholar] [CrossRef]
- Mollamahmutoglu, M.; Avcı, E. Engineering properties of slag-based superfine cement-stabilized clayey soil. ACI Mater. J. 2018, 115, 541–548. [Google Scholar] [CrossRef]
- Amu, O.; Fajobi, A.; Oke, B. Effect of eggshell powder on the stabilizing potential of lime on an expansive clay soil. Res. J. Agric. Biol. Sci. 2005, 1, 80–84. [Google Scholar] [CrossRef] [Green Version]
- Mir, B. Some studies on the effect of fly ash and lime on physical and mechanical properties of expansive clay. Int. J. Civil Eng. 2015, 13, 203–212. [Google Scholar]
- Bhardwaj, A.; Sharma, R.K. Effect of industrial wastes and lime on strength characteristics of clayey soil. J. Eng. Des. Technol. 2020, 18, 1749–1772. [Google Scholar] [CrossRef]
- Onyelowe, K.C.; Onyia, M.E.; Nguyen-Thi, D.; Bui Van, D.; Onukwugha, E.; Baykara, H.; Obianyo, I.; Dao-Phuc, L.; Ugwu, H.U. Swelling potential of clayey soil modified with rice husk ash activated by calcination for pavement underlay by Plasticity Index Method (PIM). Adv. Mater. Sci. Eng. 2021, 2021, 1–10. [Google Scholar] [CrossRef]
- Widomski, M.K.; Stępniewski, W.; Musz-Pomorska, A. Clays of different plasticity as materials for landfill liners in rural systems of sustainable waste management. Sustainability 2018, 10, 2489. [Google Scholar] [CrossRef] [Green Version]
- Thalmaier, G.; Cobȋrzan, N.; Balog, A.-A.; Constantinescu, H.; Ceclan, A.; Voinea, M.; Marinca, T.F. Assessment of limestone waste addition for fired clay bricks. Materials 2022, 15, 4263. [Google Scholar] [CrossRef]
- Kontoni, D.-P.N.; Onyelowe, K.C.; Ebid, A.M.; Jahangir, H.; Rezazadeh Eidgahee, D.; Soleymani, A.; Ikpa, C. Gene Expression Programming (GEP) Modelling of Sustainable Building Materials including Mineral Admixtures for Novel Solutions. Mining 2022, 2, 629–653. [Google Scholar] [CrossRef]
- Phanikumar, B.; Nagaraju, T. Effect of fly ash and rice husk ash on index and engineering properties of expansive clays. Geotech. Geol. Eng. 2018, 36, 3425–3436. [Google Scholar] [CrossRef]
- Fattah, M.Y.; Rahil, F.H.; Al-Soudany, K.Y. Improvement of clayey soil characteristics using rice husk ash. J. Civil Eng. Urban. 2013, 3, 12–18. [Google Scholar]
- Kalkan, E. Impact of wetting–drying cycles on swelling behavior of clayey soils modified by silica fume. Appl. Clay Sci. 2011, 52, 345–352. [Google Scholar] [CrossRef]
- Soil, A.C.D.-O. Rock. Standard Test Methods for Liquid Limit, Plastic Limit, and Plasticity Index of Soils; ASTM international: West Conshohocken, PA, USA, 2010. [Google Scholar]
- Jain, A.K.; Jha, A.K. Geotechnical behaviour and micro-analyses of expansive soil amended with marble dust. Soils Found. 2020, 60, 737–751. [Google Scholar] [CrossRef]
- Diko-Makia, L.; Ligege, R. Composition and Technological Properties of Clays for Structural Ceramics in Limpopo (South Africa). Minerals 2020, 10, 700. [Google Scholar] [CrossRef]
- Ngun, B.K.; Mohamad, H.; Sulaiman, S.K.; Okada, K.; Ahmad, Z.A. Some ceramic properties of clays from central Cambodia. Appl. Clay Sci. 2011, 53, 33–41. [Google Scholar] [CrossRef]
- Liew, A.G.; Idris, A.; Wong, C.H.; Samad, A.A.; Noor, M.J.M.; Baki, A.M. Incorporation of sewage sludge in clay brick and its characterization. Waste Manag. Res. 2004, 22, 226–233. [Google Scholar] [CrossRef] [PubMed]
- Monteiro, S.; Vieira, C. Influence of firing temperature on the ceramic properties of clays from Campos dos Goytacazes, Brazil. Appl. Clay Sci. 2004, 27, 229–234. [Google Scholar] [CrossRef]
- Pardo, F.; Jordan, M.; Montero, M. Ceramic behaviour of clays in Central Chile. Appl. Clay Sci. 2018, 157, 158–164. [Google Scholar] [CrossRef]
- Abajo, M. Manual sobre Fabricación de Baldosas. Tejas y Ladrillos; Beralmar, S.A., Ed.; Lugar de Publicación: Terrassa, Spain, 2000. [Google Scholar]
- Domínguez, E.; Dondi, M.; Etcheverry, R.; Recio, C.; Iglesias, C. Genesis and mining potential of kaolin deposits in Patagonia (Argentina). Appl. Clay Sci. 2016, 131, 44–47. [Google Scholar] [CrossRef]
- Mohsen, Q.; El-Maghraby, A. Characterization and assessment of Saudi clays raw material at different area. Arab. J. Chem. 2010, 3, 271–277. [Google Scholar] [CrossRef] [Green Version]
- Kreimeyer, R. Some notes on the firing colour of clay bricks. Appl. Clay Sci. 1987, 2, 175–183. [Google Scholar] [CrossRef]
- Fischer, P. Some comments on the color of fired clays. ZI Ziegelind. Int. 1984, 37, 475–483. [Google Scholar]
- Astm C373-88; Standard test method for water absorption, bulk density, apparent porosity, and apparent specific gravity of fired whiteware products. ASTM international: West Conshohocken, PA, USA, 2006.
- de Oliveira, H.A.; dos Santos, C.P. Limestone Clays for Ceramic Industry. In Clay Science and Technology; IntechOpen: London, UK, 2020. [Google Scholar]
- Celik, H. Technological characterization and industrial application of two Turkish clays for the ceramic industry. Appl. Clay Sci. 2010, 50, 245–254. [Google Scholar] [CrossRef]
- Arsenović, M.; Pezo, L.; Mančić, L.; Radojević, Z. Thermal and mineralogical characterization of loess heavy clays for potential use in brick industry. Thermochim. Acta 2014, 580, 38–45. [Google Scholar] [CrossRef]
- Al-Bared, M.M.; Marto, A. A review on the geotechnical and engineering characteristics of marine clay and the modern methods of improvements. Malays. J. Fundam. Appl. Sci. 2017, 13, 825–831. [Google Scholar] [CrossRef]
- Vieira, C.; Sánchez, R.; Monteiro, S. Characteristics of clays and properties of building ceramics in the state of Rio de Janeiro, Brazil. Constr. Build. Mater. 2008, 22, 781–787. [Google Scholar] [CrossRef]
- Terefe, T.; Mariscal-Sancho, I.; Peregrina, F.; Espejo, R. Influence of heating on various properties of six Mediterranean soils. A laboratory study. Geoderma 2008, 143, 273–280. [Google Scholar] [CrossRef]
- Sutcu, M.; Akkurt, S. The use of recycled paper processing residues in making porous brick with reduced thermal conductivity. Ceram. Int. 2009, 35, 2625–2631. [Google Scholar] [CrossRef] [Green Version]
- Gomes, C.d.S.F. Argilas: O Que São e Para Que Servem; Fundação Galouste Gulbenian: Lisboa, Portugal, 1988. [Google Scholar]
- Boussen, S.; Sghaier, D.; Chaabani, F.; Jamoussi, B.; Bennour, A. Characteristics and industrial application of the Lower Cretaceous clay deposits (Bouhedma Formation), Southeast Tunisia: Potential use for the manufacturing of ceramic tiles and bricks. Appl. Clay Sci. 2016, 123, 210–221. [Google Scholar] [CrossRef]
- Diko, M.; Ekosse, G.; Ayonghe, S.; Ntasin, E. Physical characterization of clayey materials from tertiary volcanic cones in Limbe (Cameroon) for ceramic applications. Appl. Clay Sci. 2011, 51, 380–384. [Google Scholar] [CrossRef]
- Lahcen, D.; Hicham, E.E.; Latifa, S.; Abderrahmane, A.; Jamal, B.; Mohamed, W.; Meriam, E.; Nathalie, F. Characteristics and ceramic properties of clayey materials from Amezmiz region (Western High Atlas, Morocco). Appl. Clay Sci. 2014, 102, 139–147. [Google Scholar] [CrossRef]
- Temga, J.P.; Mache, J.R.; Madi, A.B.; Nguetnkam, J.P.; Bitom, D.L. Ceramics applications of clay in lake Chad basin, central Africa. Appl. Clay Sci. 2019, 171, 118–132. [Google Scholar] [CrossRef]
- de Oliveira Modesto, C.; Bernardin, A.M. Determination of clay plasticity: Indentation method versus Pfefferkorn method. Appl. Clay Sci. 2008, 40, 15–19. [Google Scholar] [CrossRef]
- Fernandez, M.T.; Orlandi, S.; Codevilla, M.; Piqué, T.M.; Manzanal, D. Performance of calcium lignosulfonate as a stabiliser of highly expansive clay. Transp. Geotech. 2021, 27, 100469. [Google Scholar] [CrossRef]
- Vieira, C.; Monteiro, S. Effect of grog addition on the properties and microstructure of a red ceramic body for brick production. Constr. Build. Mater. 2007, 21, 1754–1759. [Google Scholar] [CrossRef]
- Al-Soudany, K. Remediation of clayey soil using silica fume. MATEC Web Conf. 2018, 162, 01017. [Google Scholar] [CrossRef] [Green Version]
- Phanikumar, B.; e, R.R. Silica fume stabilization of an expansive clay subgrade and the effect of silica fume-stabilised soil cushion on its CBR. Géoméch. Geoengin. 2020, 15, 64–77. [Google Scholar] [CrossRef]


| Property | Designation of Clay Specimens | |||||
|---|---|---|---|---|---|---|
| Clay I | Clay II | Clay III | Clay IV | Clay V | Clay VI | |
| Location | Bartin University | Üçyildiz | Işıklar | Boyabat | Boyabat | Sjenica Serbia |
| Gravel size (%) | 0 | 0 | 0 | 0 | 0 | 0 |
| Sand size (4.75–0.075 mm) (%) | 49.3 | 49.7 | 44 | 55.35 | 67.99 | 59.7 |
| Silt size (0.075–0.005 mm) (%) | 42.74 | 31.54 | 48.45 | 41.27 | 28.73 | 32.96 |
| Clay size (<0.005 mm) (%) | 7.56 | 8.76 | 7.55 | 3.38 | 3.28 | 7.34 |
| USCS classification | MH | CL | CL | CL | CL | MH |
| Specific gravity | 2.663 | 2.685 | 2.706 | 2.793 | 2.750 | 2.716 |
| Moisture content (%) | 6.1 | 2.0 | 2.5 | 3.5 | 4.3 | 6.9 |
| Surface area (m2/g) | 29.563 | 23.03 | 20.39 | 22.73 | 30.49 | 64.49 |
| Property | Material | ||
|---|---|---|---|
| FA | FS | SF | |
| Specific gravity | 2.026 | 3.327 | 2.172 |
| Moisture content (%) | 0.3 | 0.1 | 0.3 |
| Surface area (m2/g) | 0.18 | 0.55 | 0.13 |
Publisher’s Note: MDPI stays neutral with regard to jurisdictional claims in published maps and institutional affiliations. |
© 2022 by the authors. Licensee MDPI, Basel, Switzerland. This article is an open access article distributed under the terms and conditions of the Creative Commons Attribution (CC BY) license (https://creativecommons.org/licenses/by/4.0/).
Share and Cite
Danish, A.; Totiç, E.; Bayram, M.; Sütçü, M.; Gencel, O.; Erdoğmuş, E.; Ozbakkaloglu, T. Assessment of Mineralogical Characteristics of Clays and the Effect of Waste Materials on Their Index Properties for the Production of Bricks. Materials 2022, 15, 8908. https://doi.org/10.3390/ma15248908
Danish A, Totiç E, Bayram M, Sütçü M, Gencel O, Erdoğmuş E, Ozbakkaloglu T. Assessment of Mineralogical Characteristics of Clays and the Effect of Waste Materials on Their Index Properties for the Production of Bricks. Materials. 2022; 15(24):8908. https://doi.org/10.3390/ma15248908
Chicago/Turabian StyleDanish, Aamar, Ermedin Totiç, Muhammed Bayram, Mücahit Sütçü, Osman Gencel, Ertuğrul Erdoğmuş, and Togay Ozbakkaloglu. 2022. "Assessment of Mineralogical Characteristics of Clays and the Effect of Waste Materials on Their Index Properties for the Production of Bricks" Materials 15, no. 24: 8908. https://doi.org/10.3390/ma15248908