
Optimization of CO2 Sorption onto Spent Shale with Diethylenetriamine (DETA) and Ethylenediamine (EDA)

 , , ,
, , ,
Abstract
:1. Introduction
2. Materials
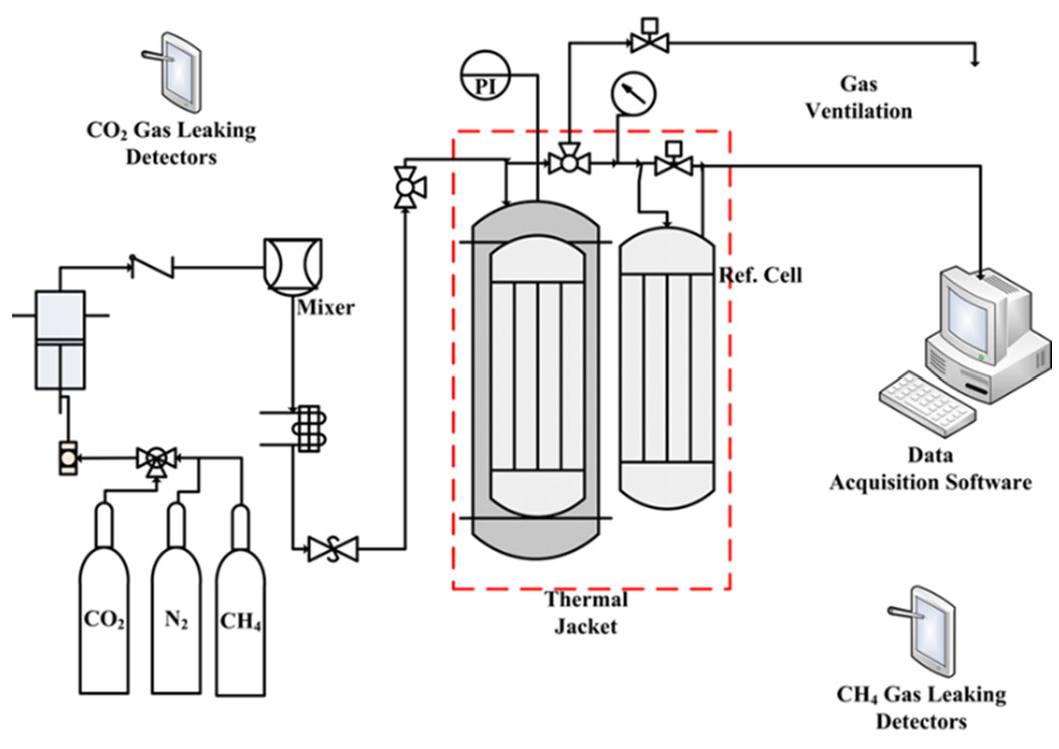
3. Experimentation
4. Results and Discussion
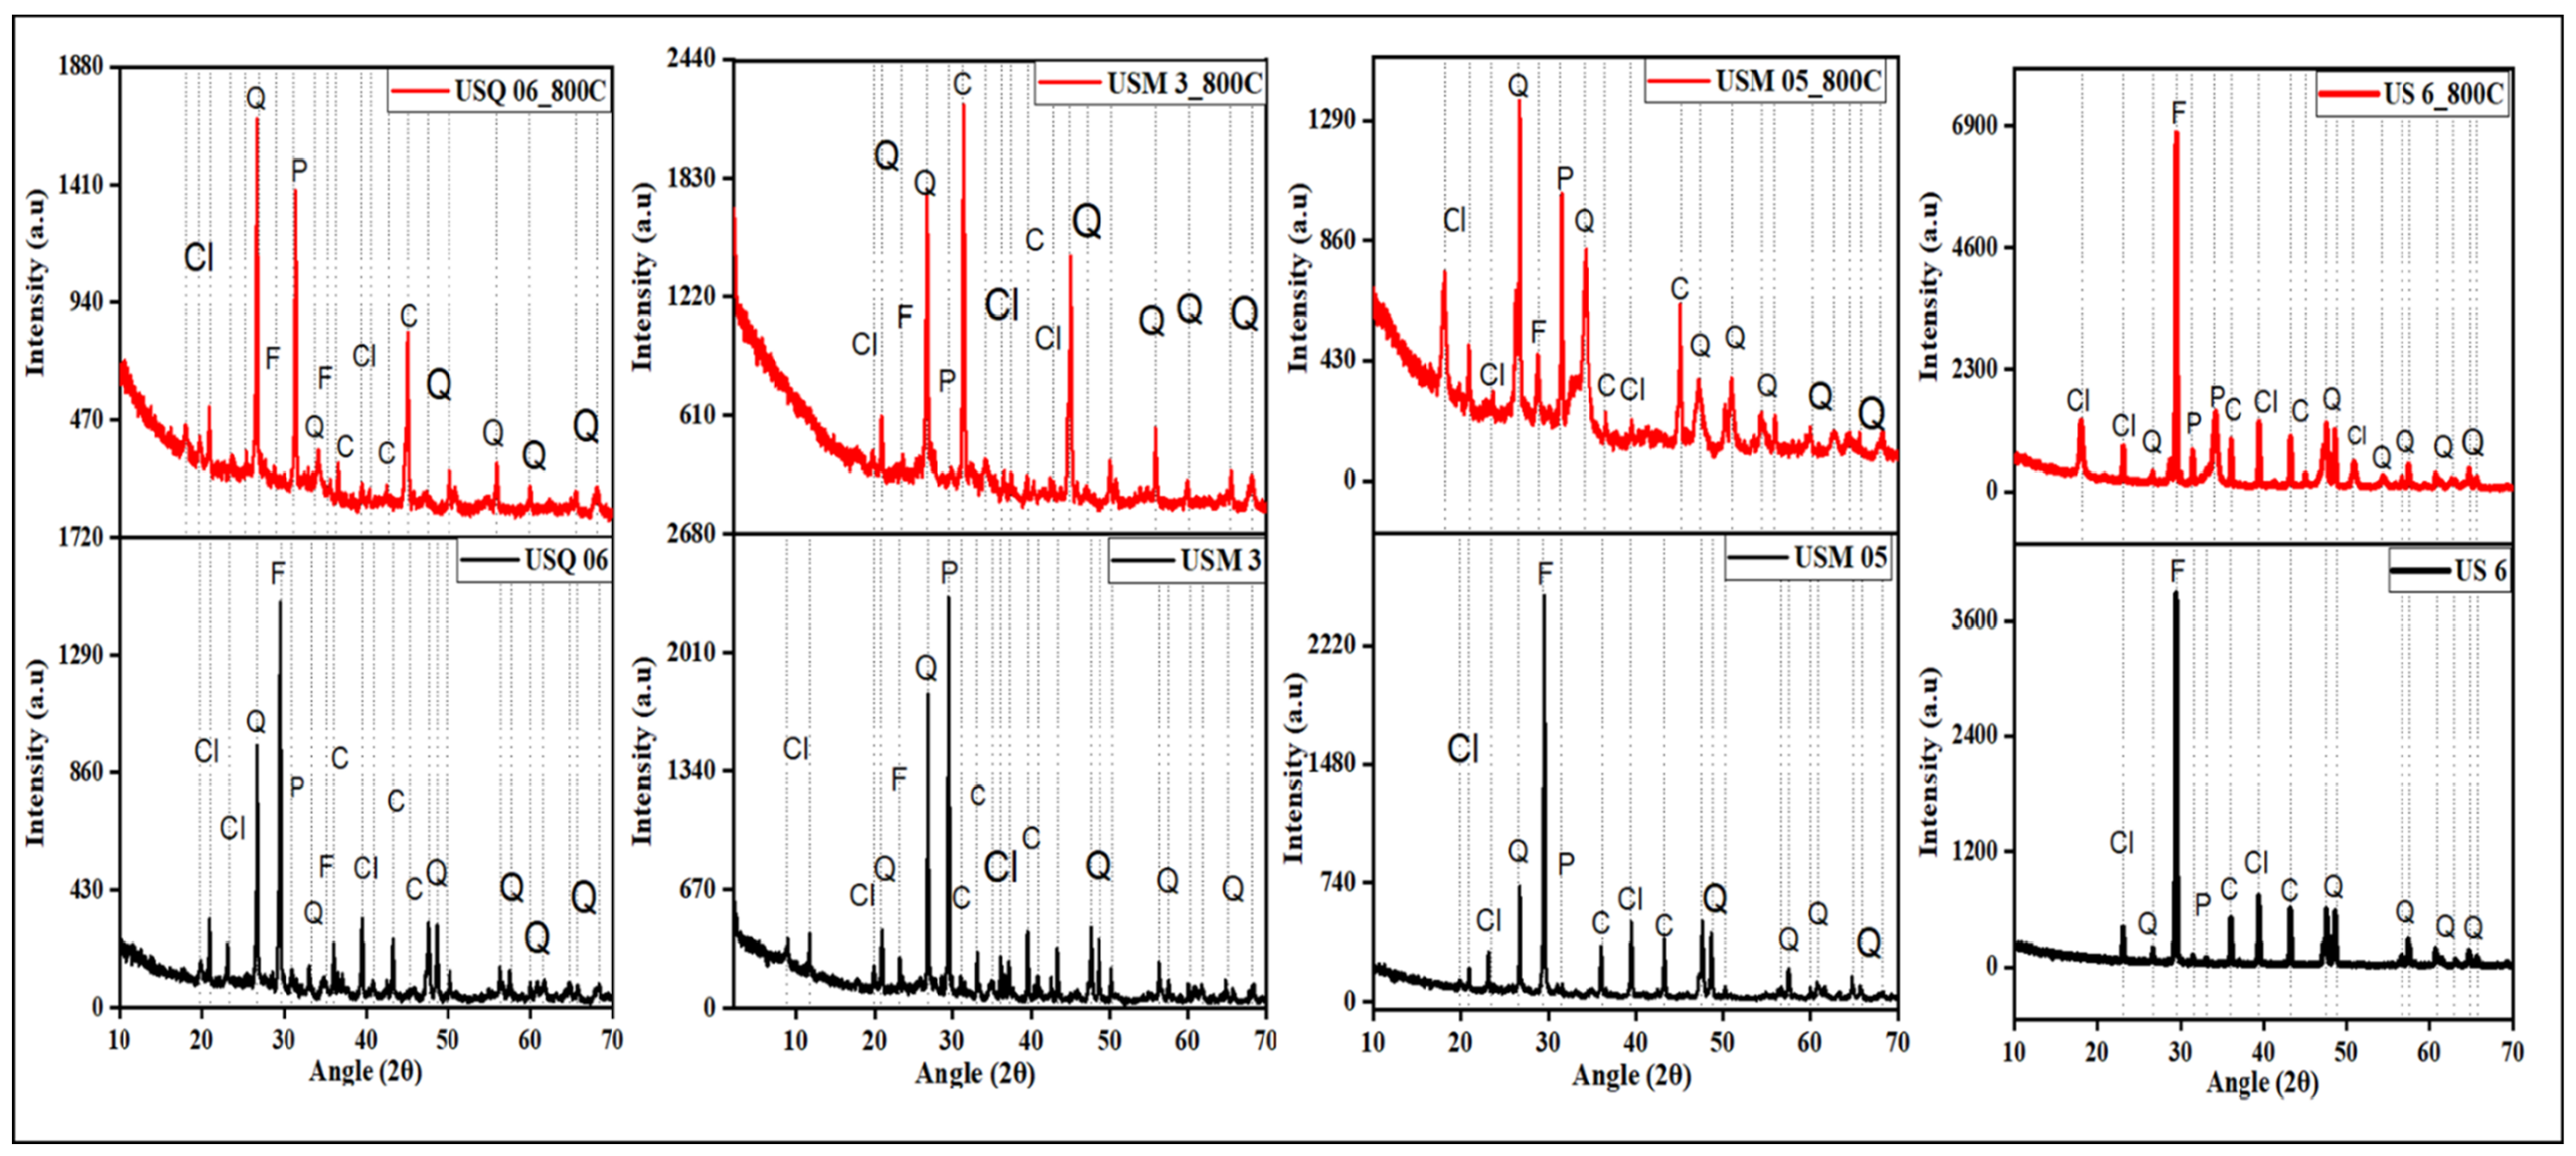
4.1. Mineralogical Content
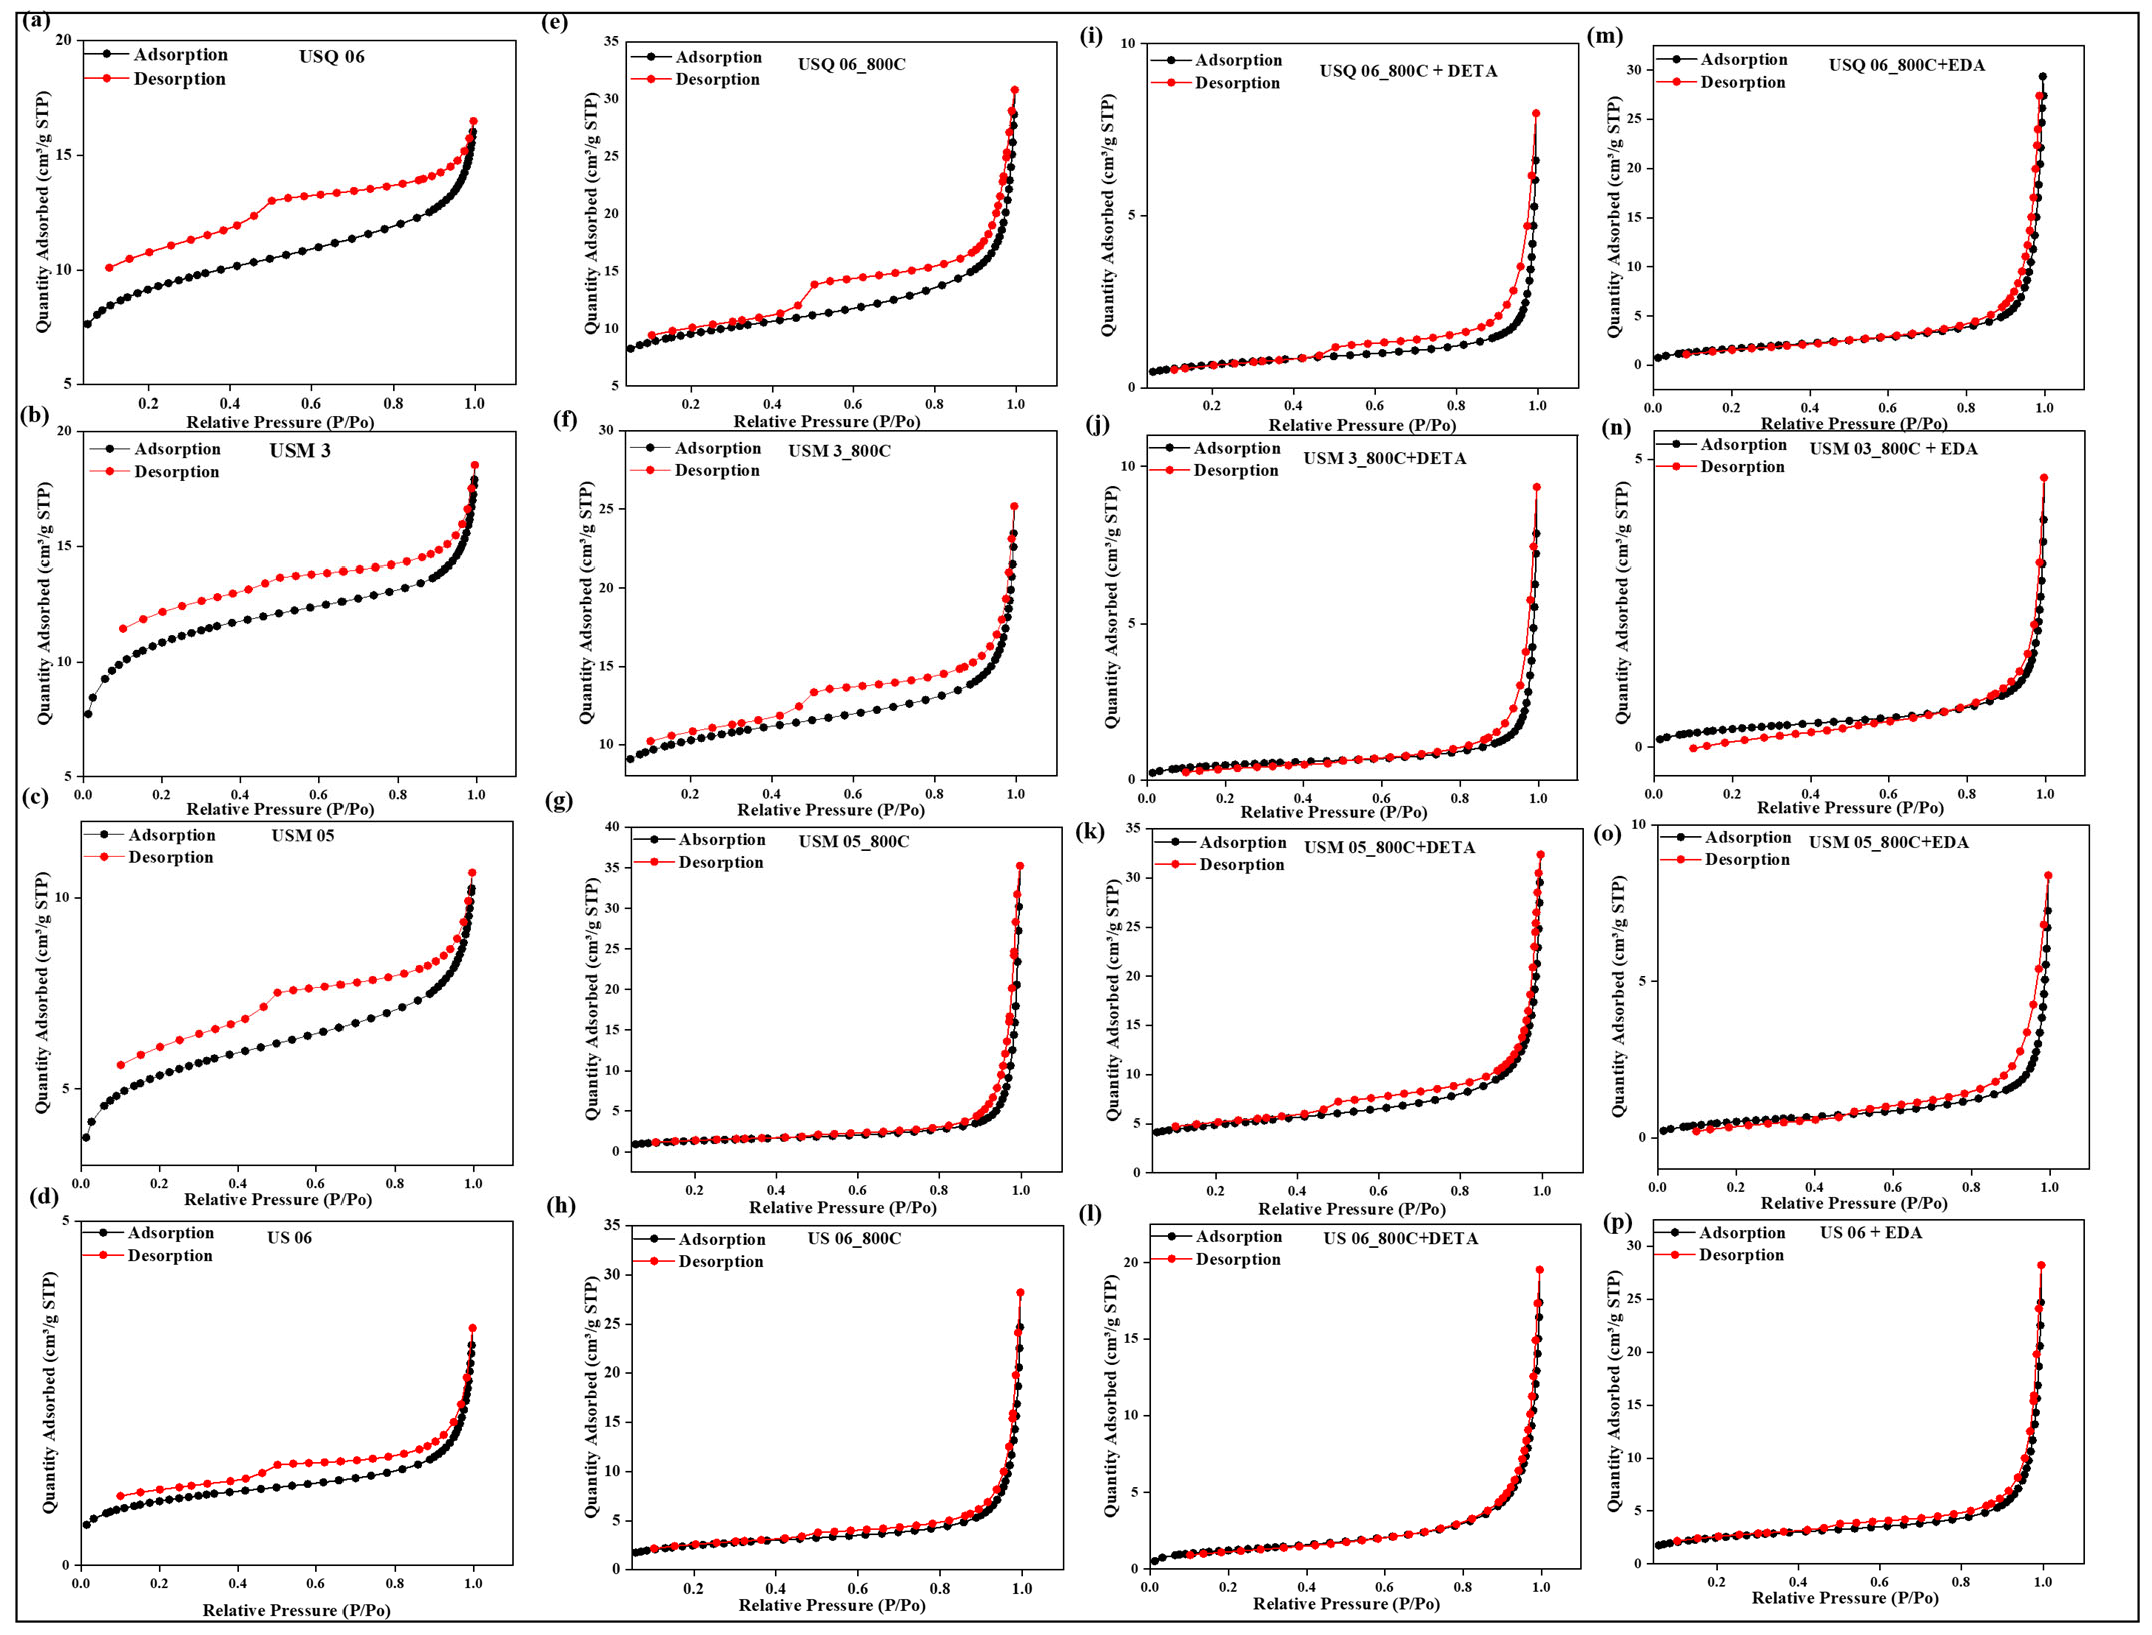
4.2. Porosity
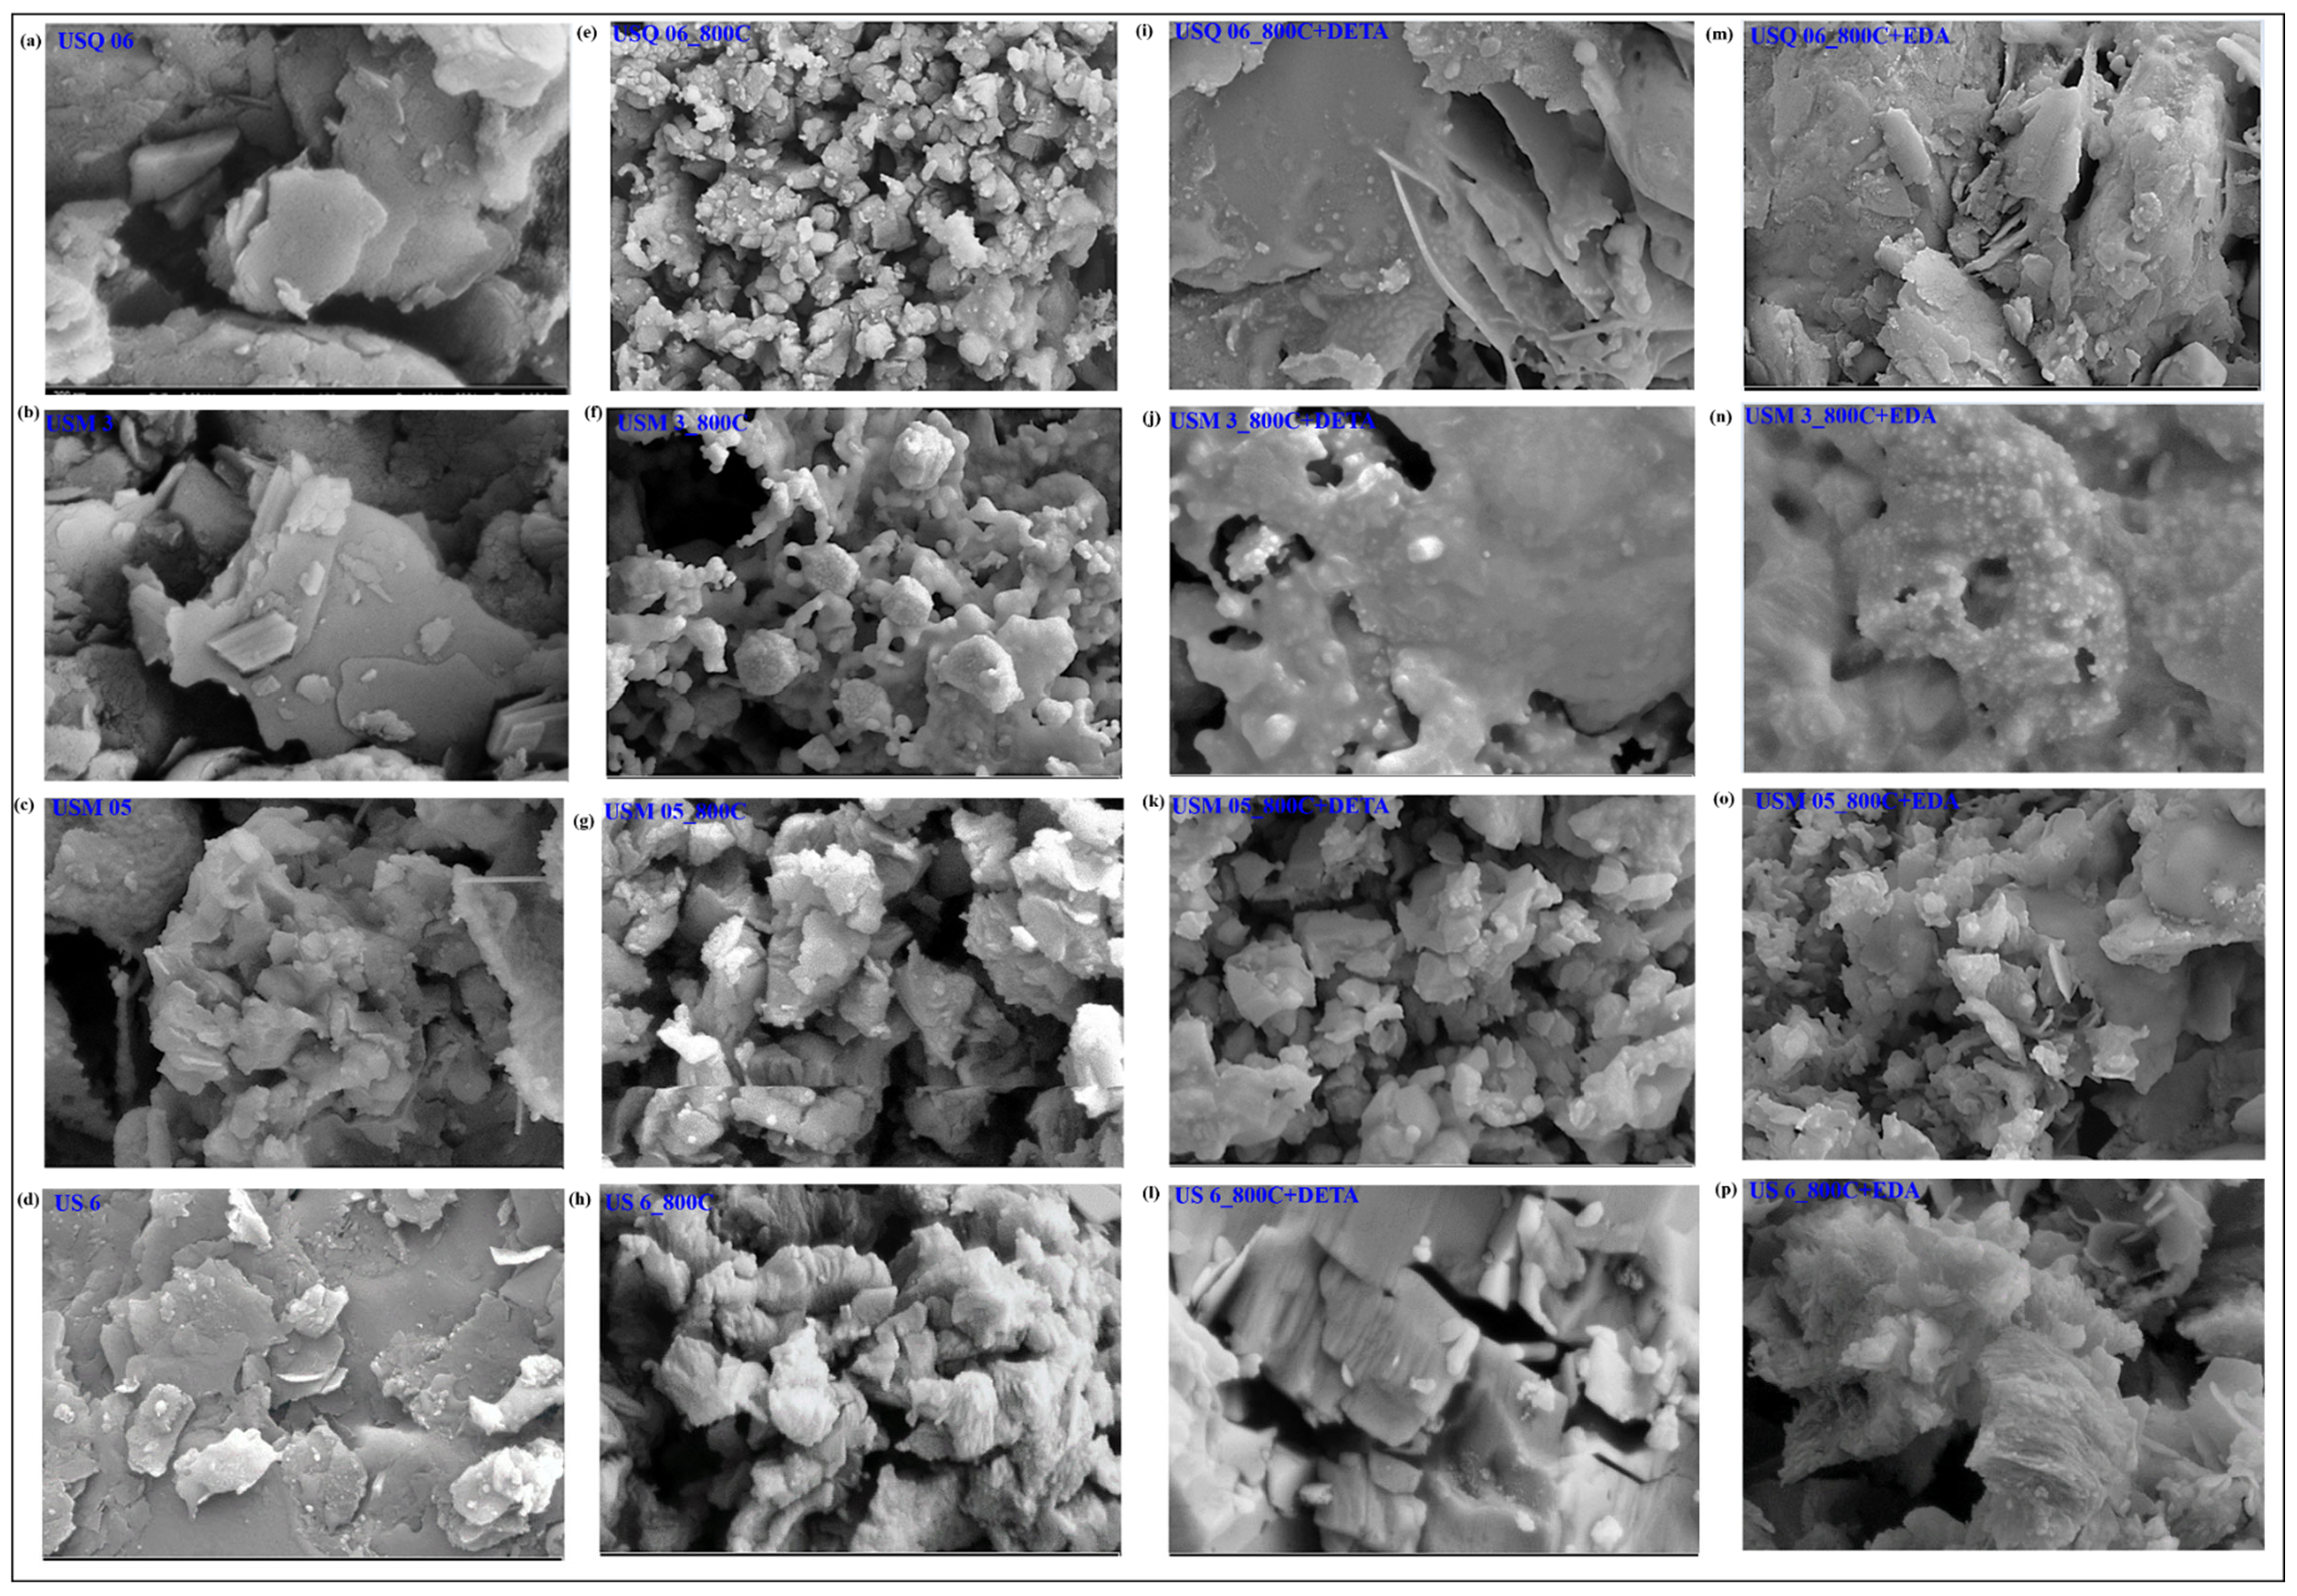
4.3. Morphology
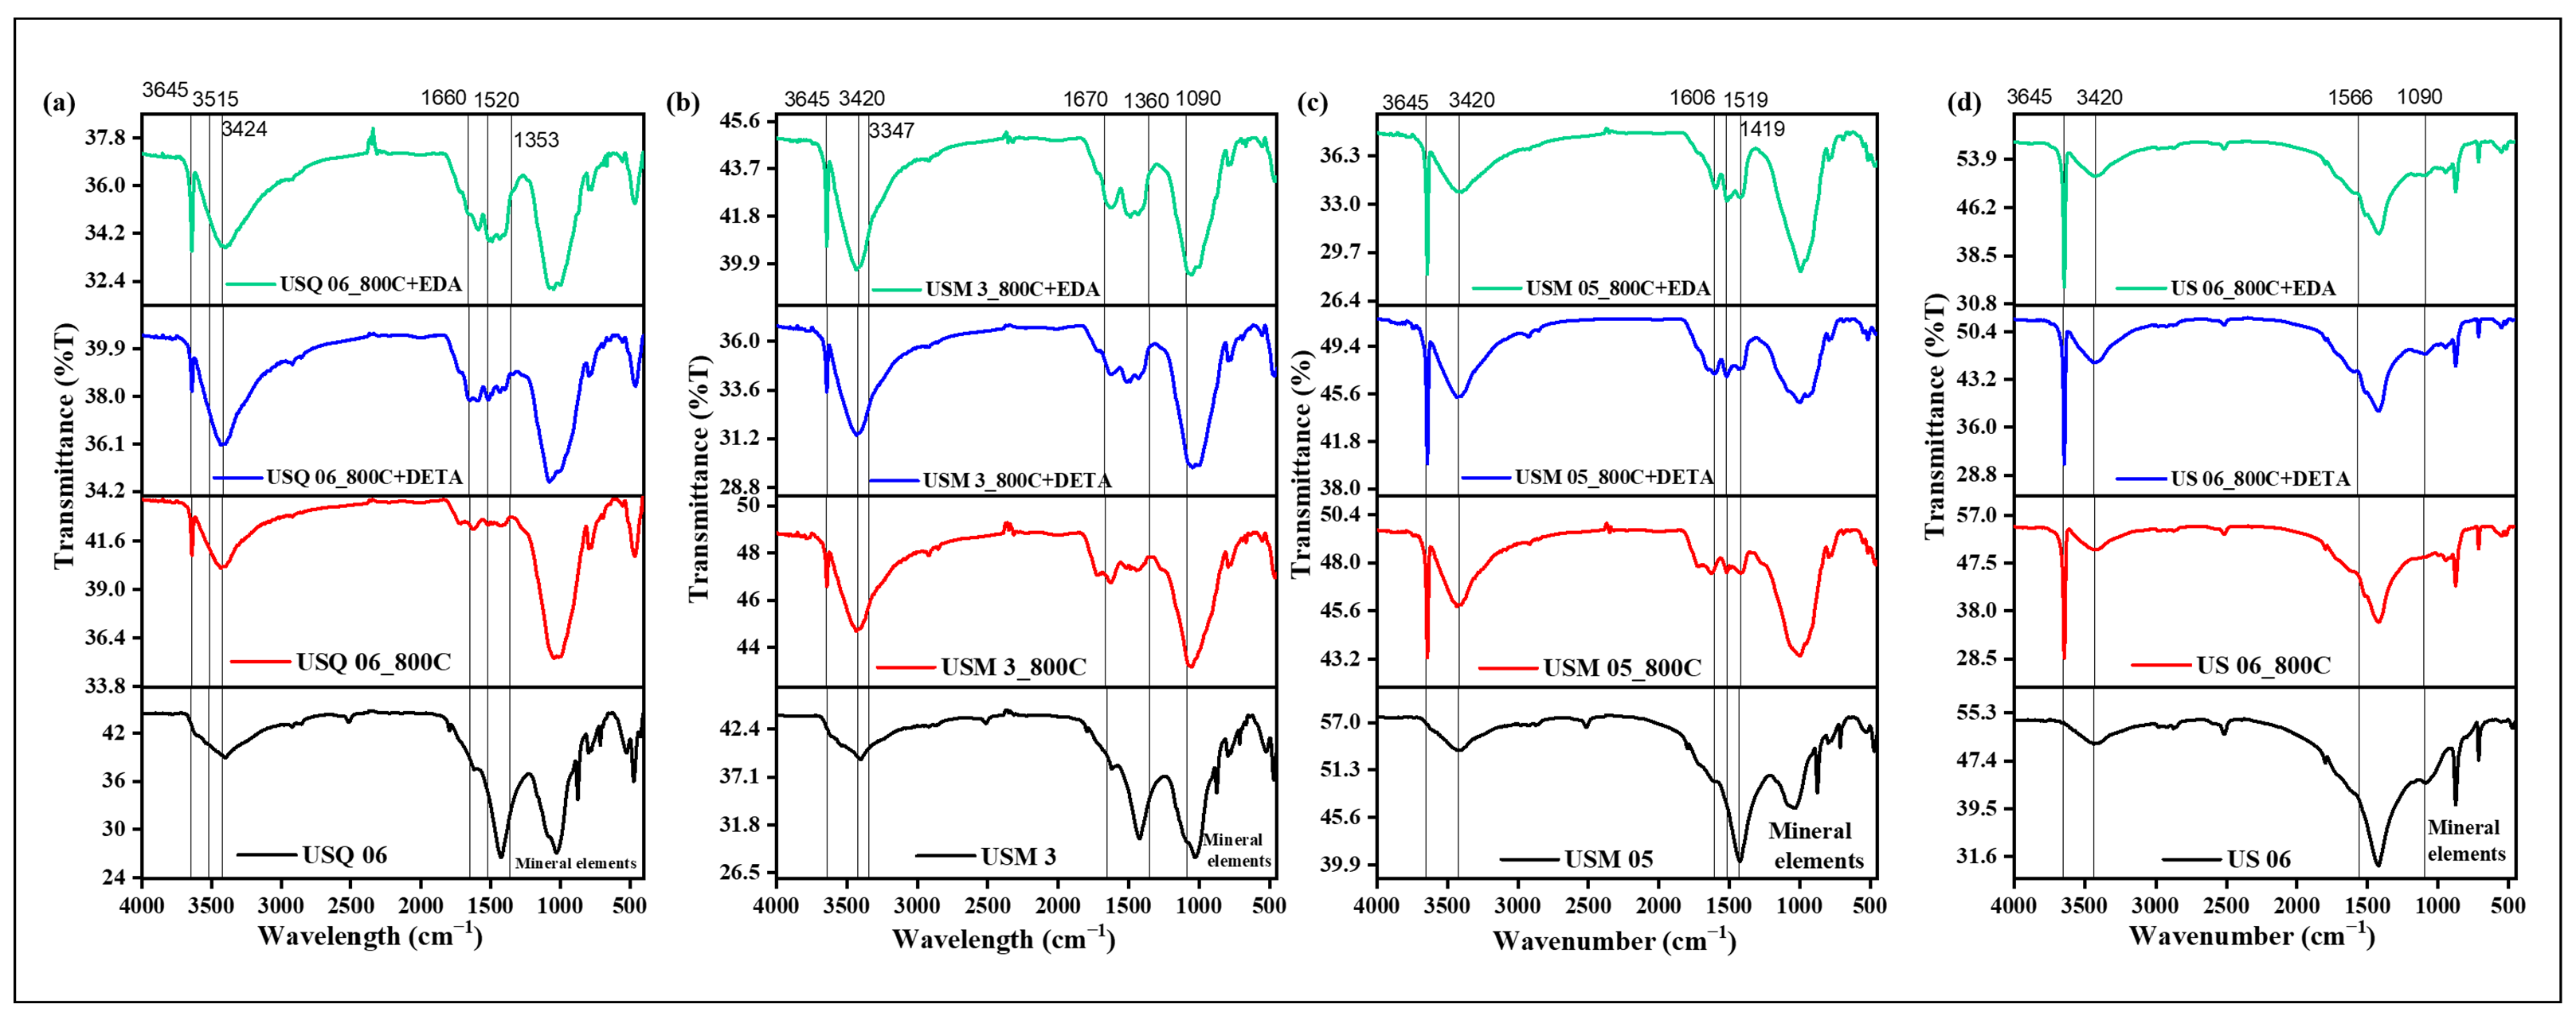
4.4. Fourier Transform Infrared Spectroscopy (FT-IR)
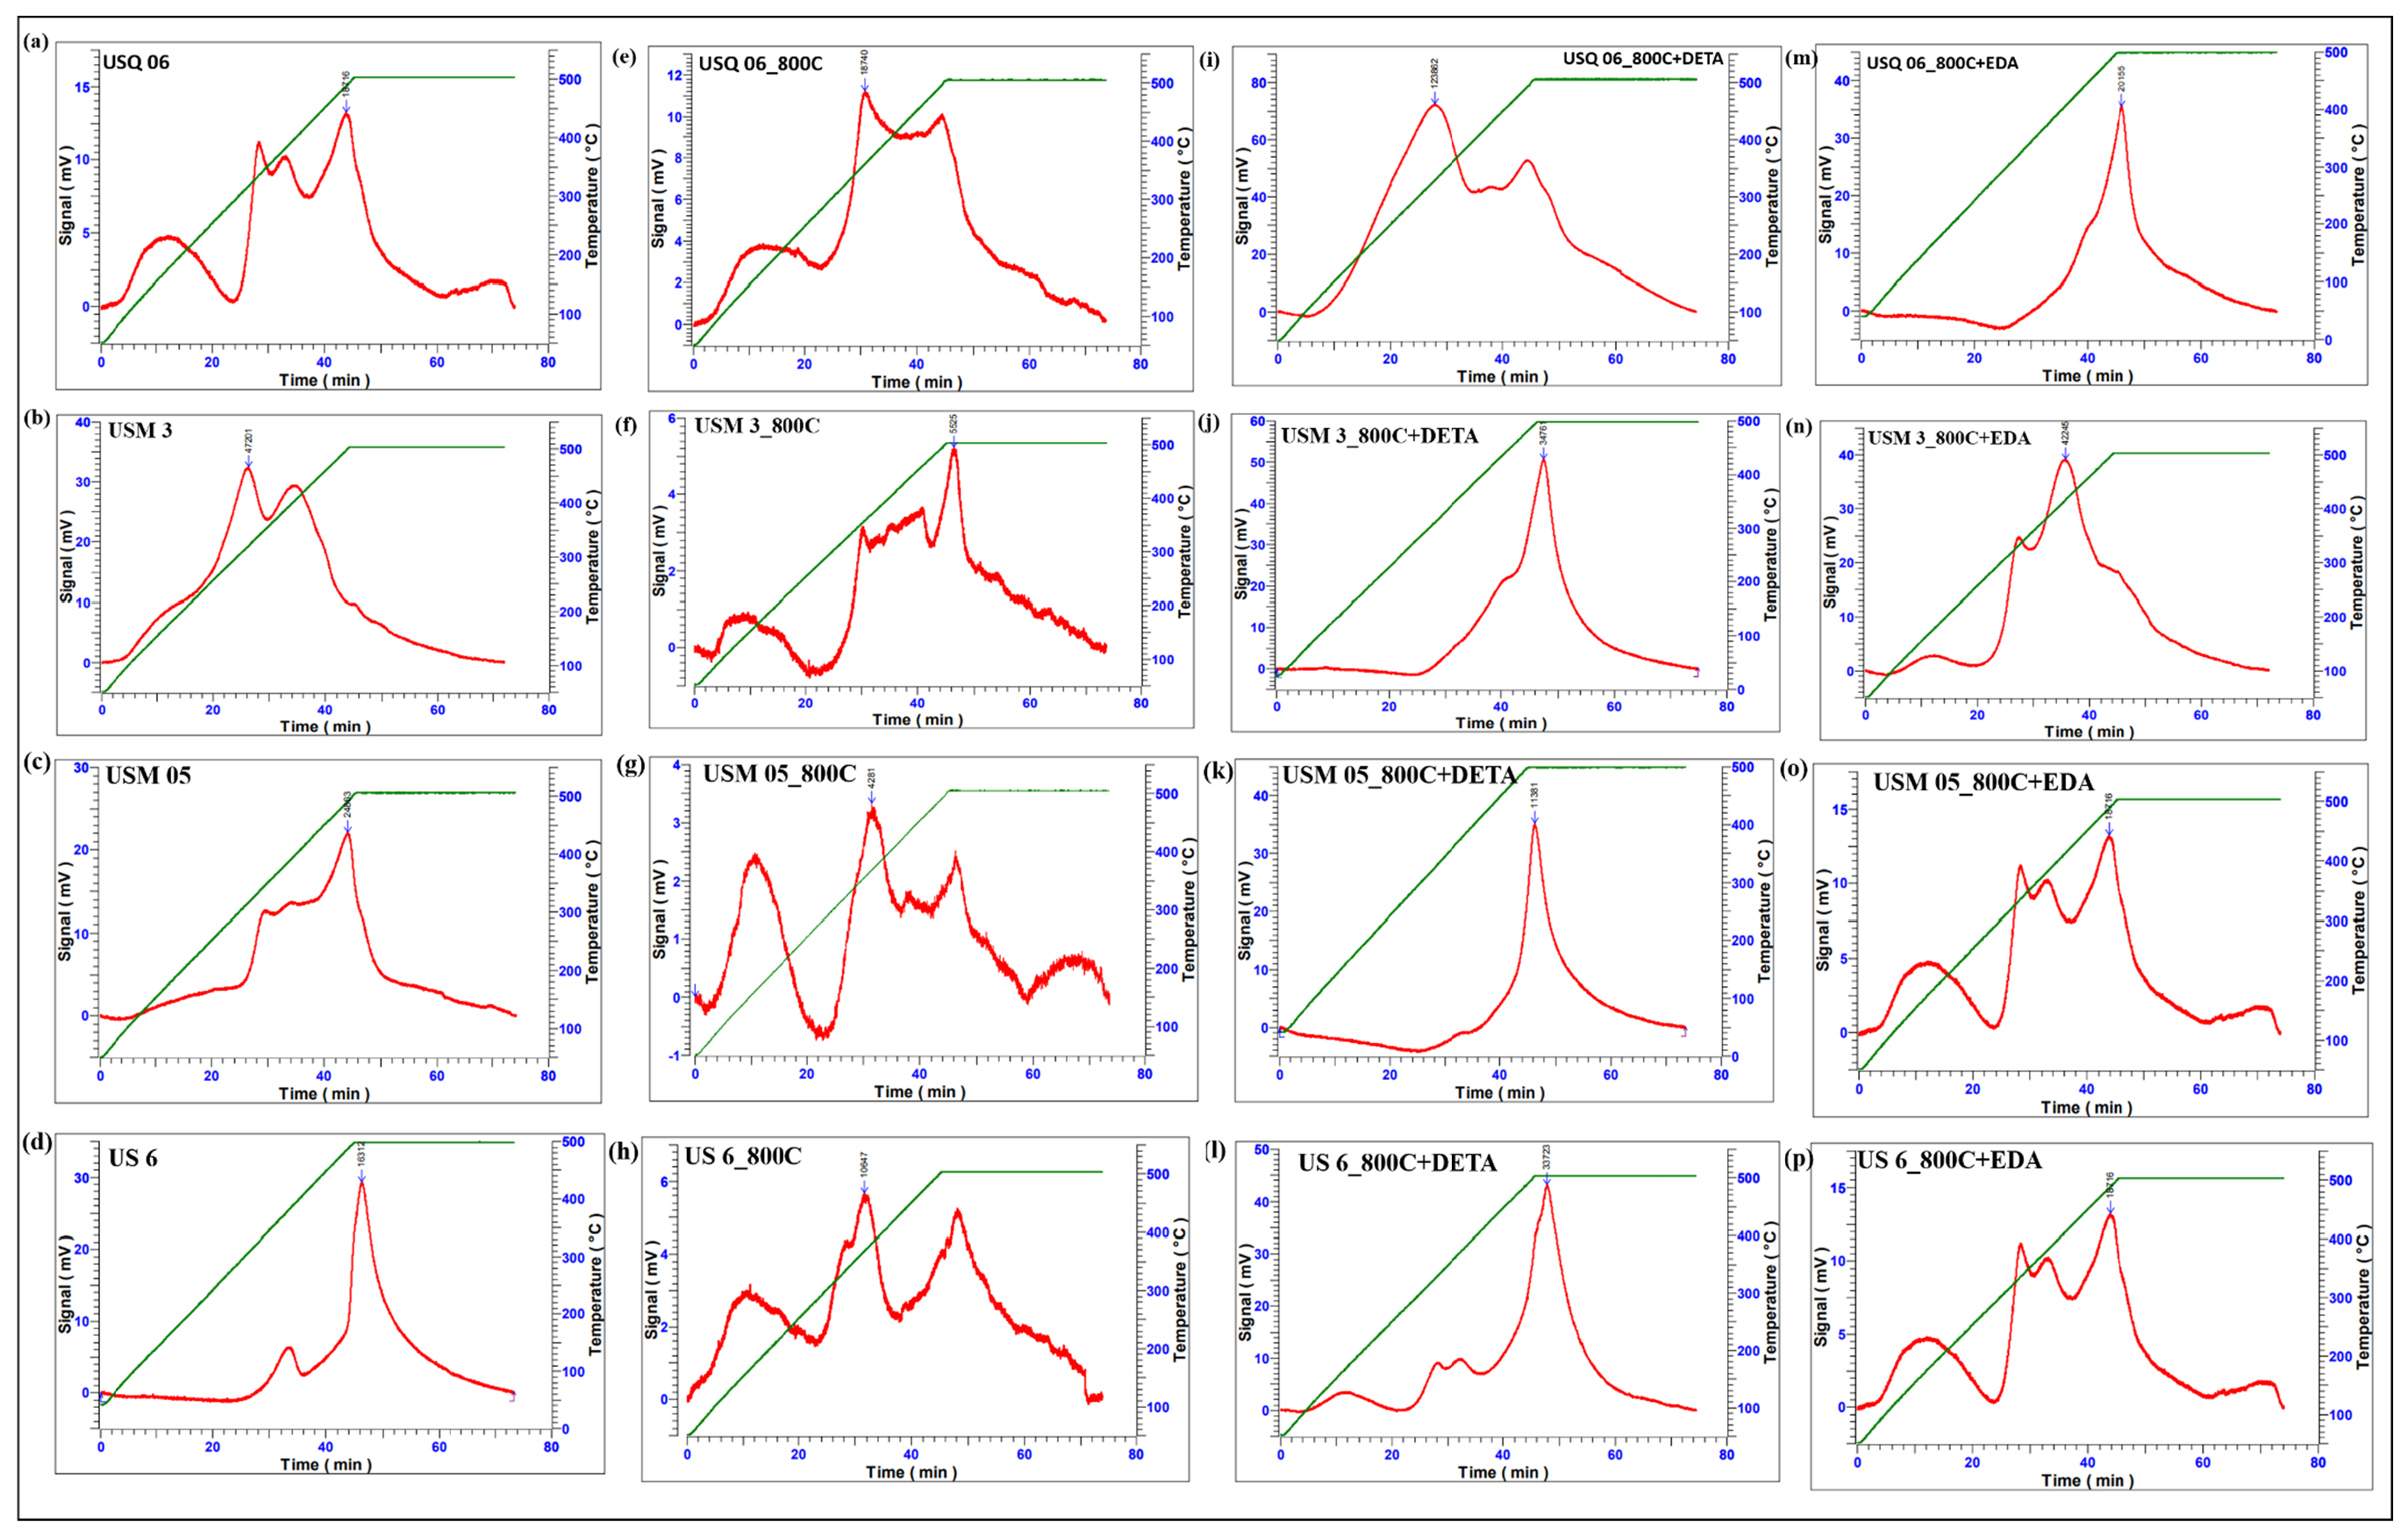
4.5. Temperature-Programmed Desorption (TPD)
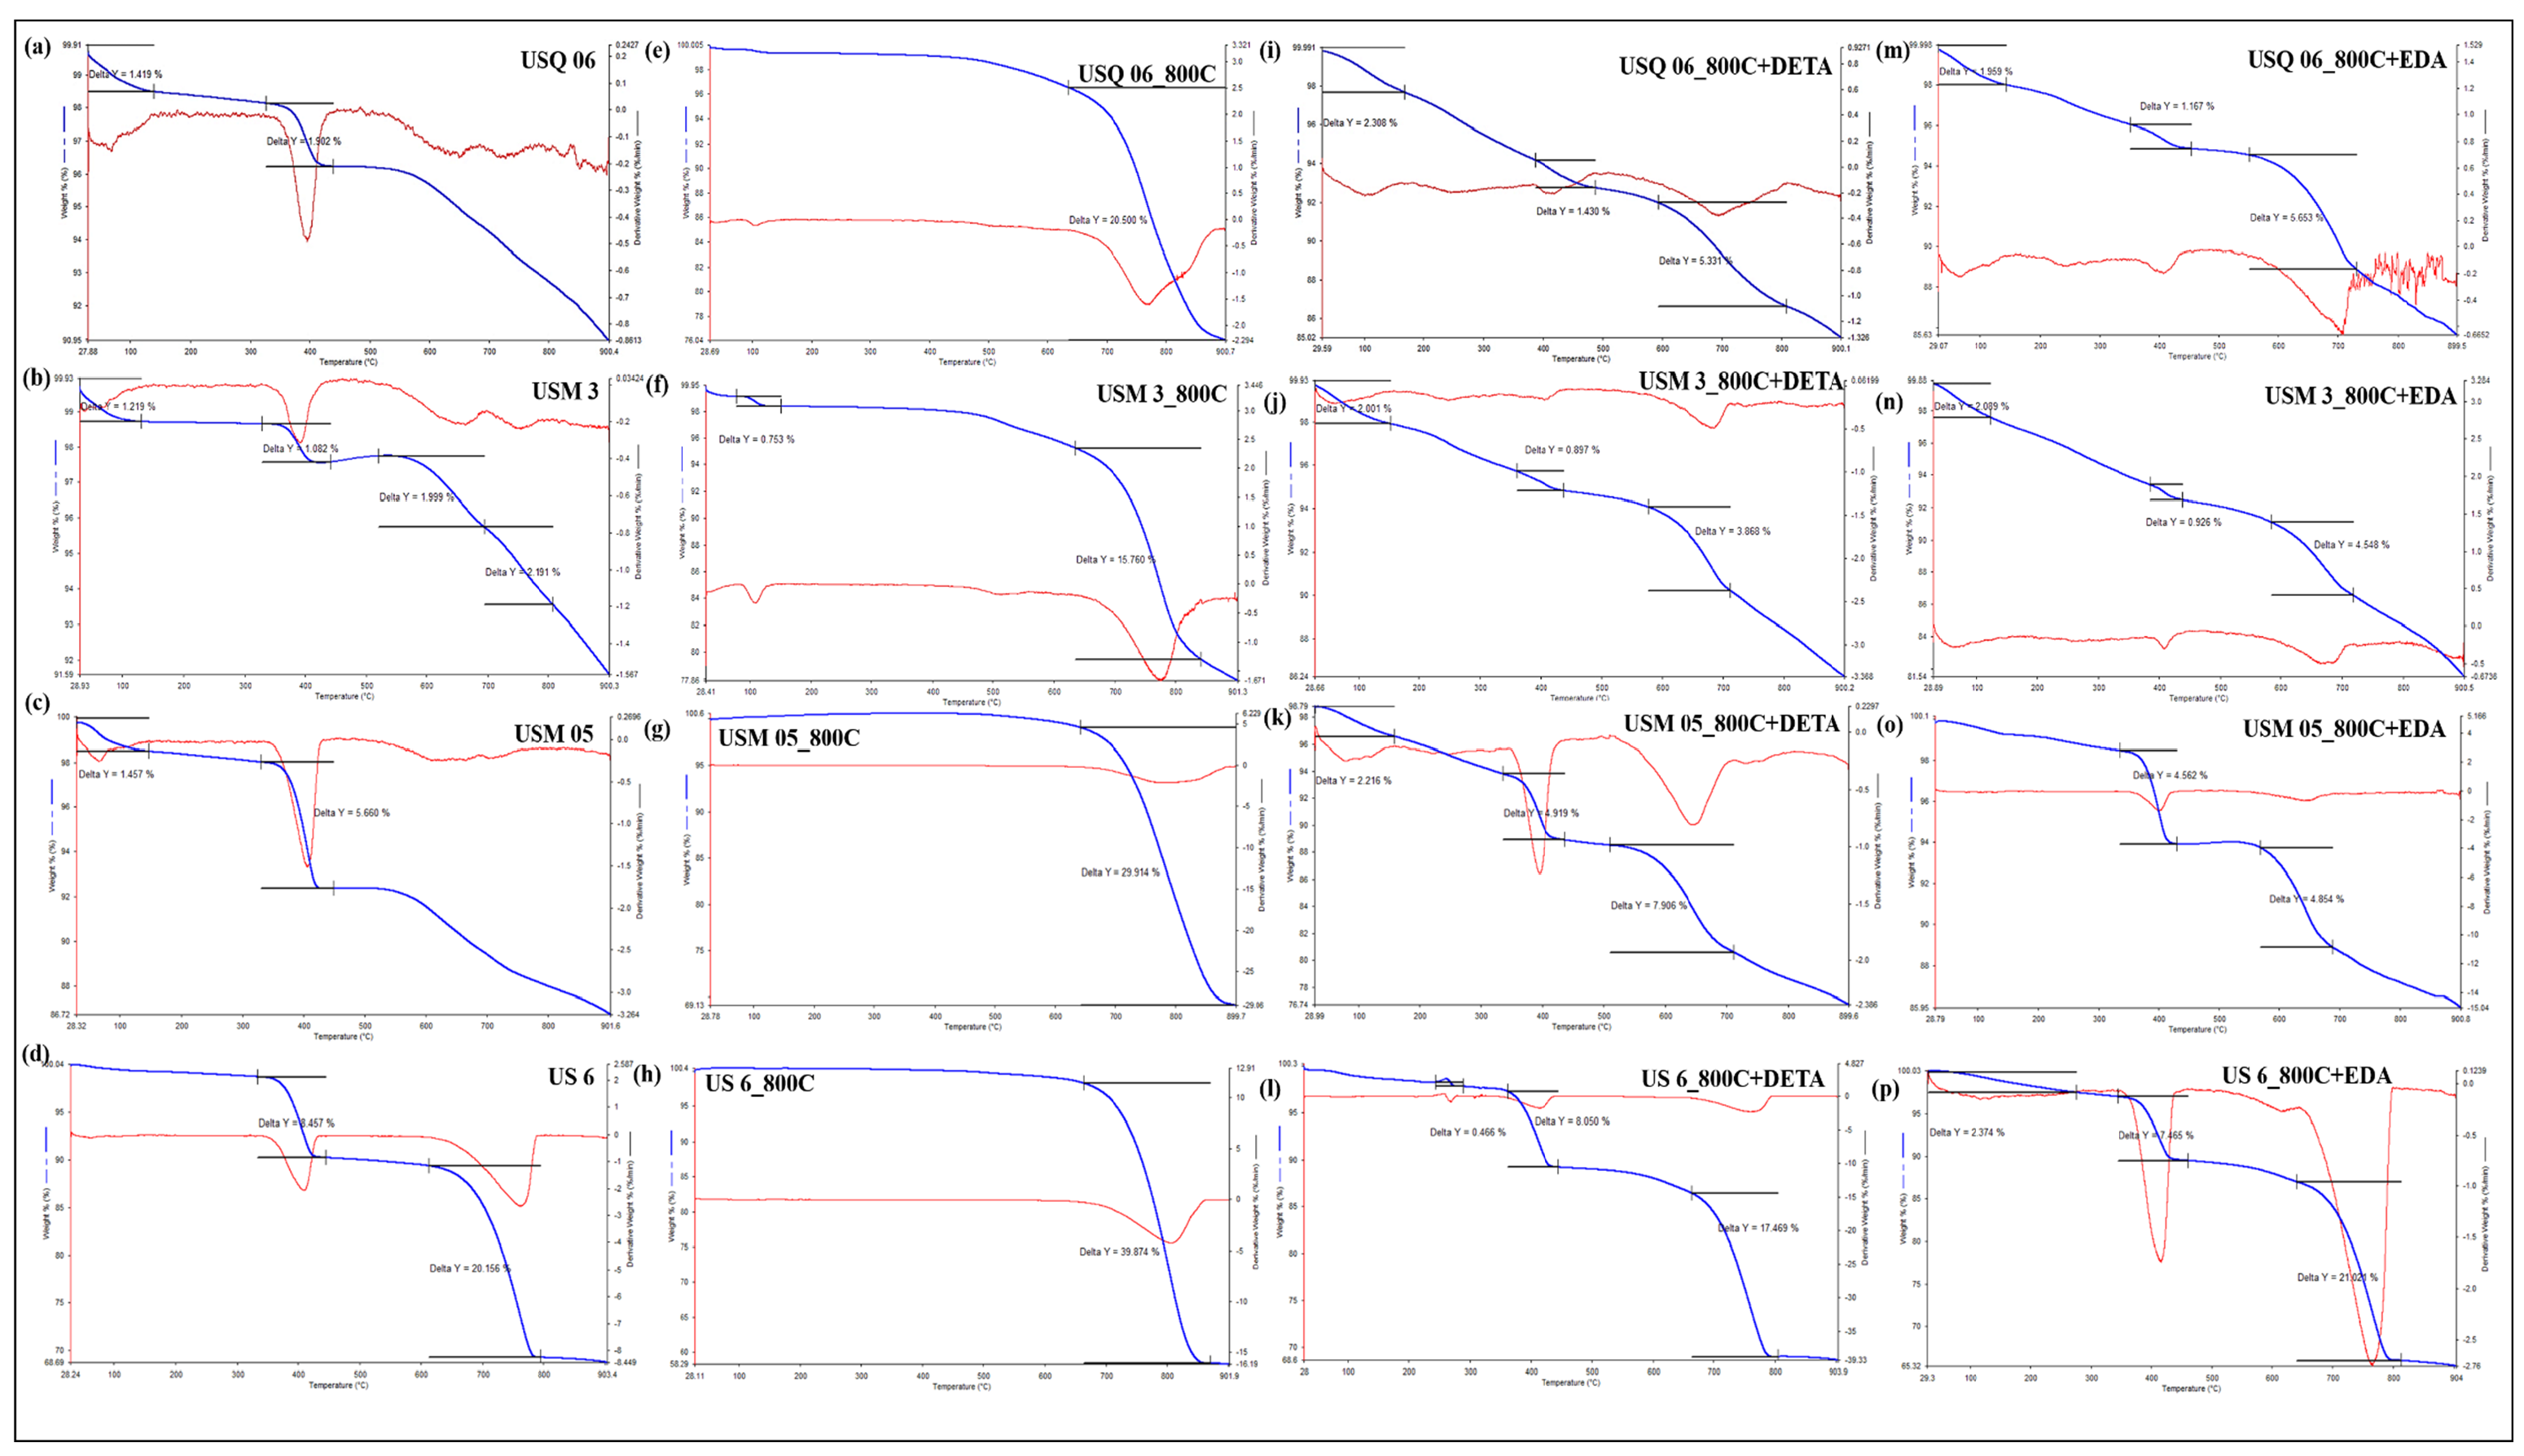
4.6. Thermal Stability
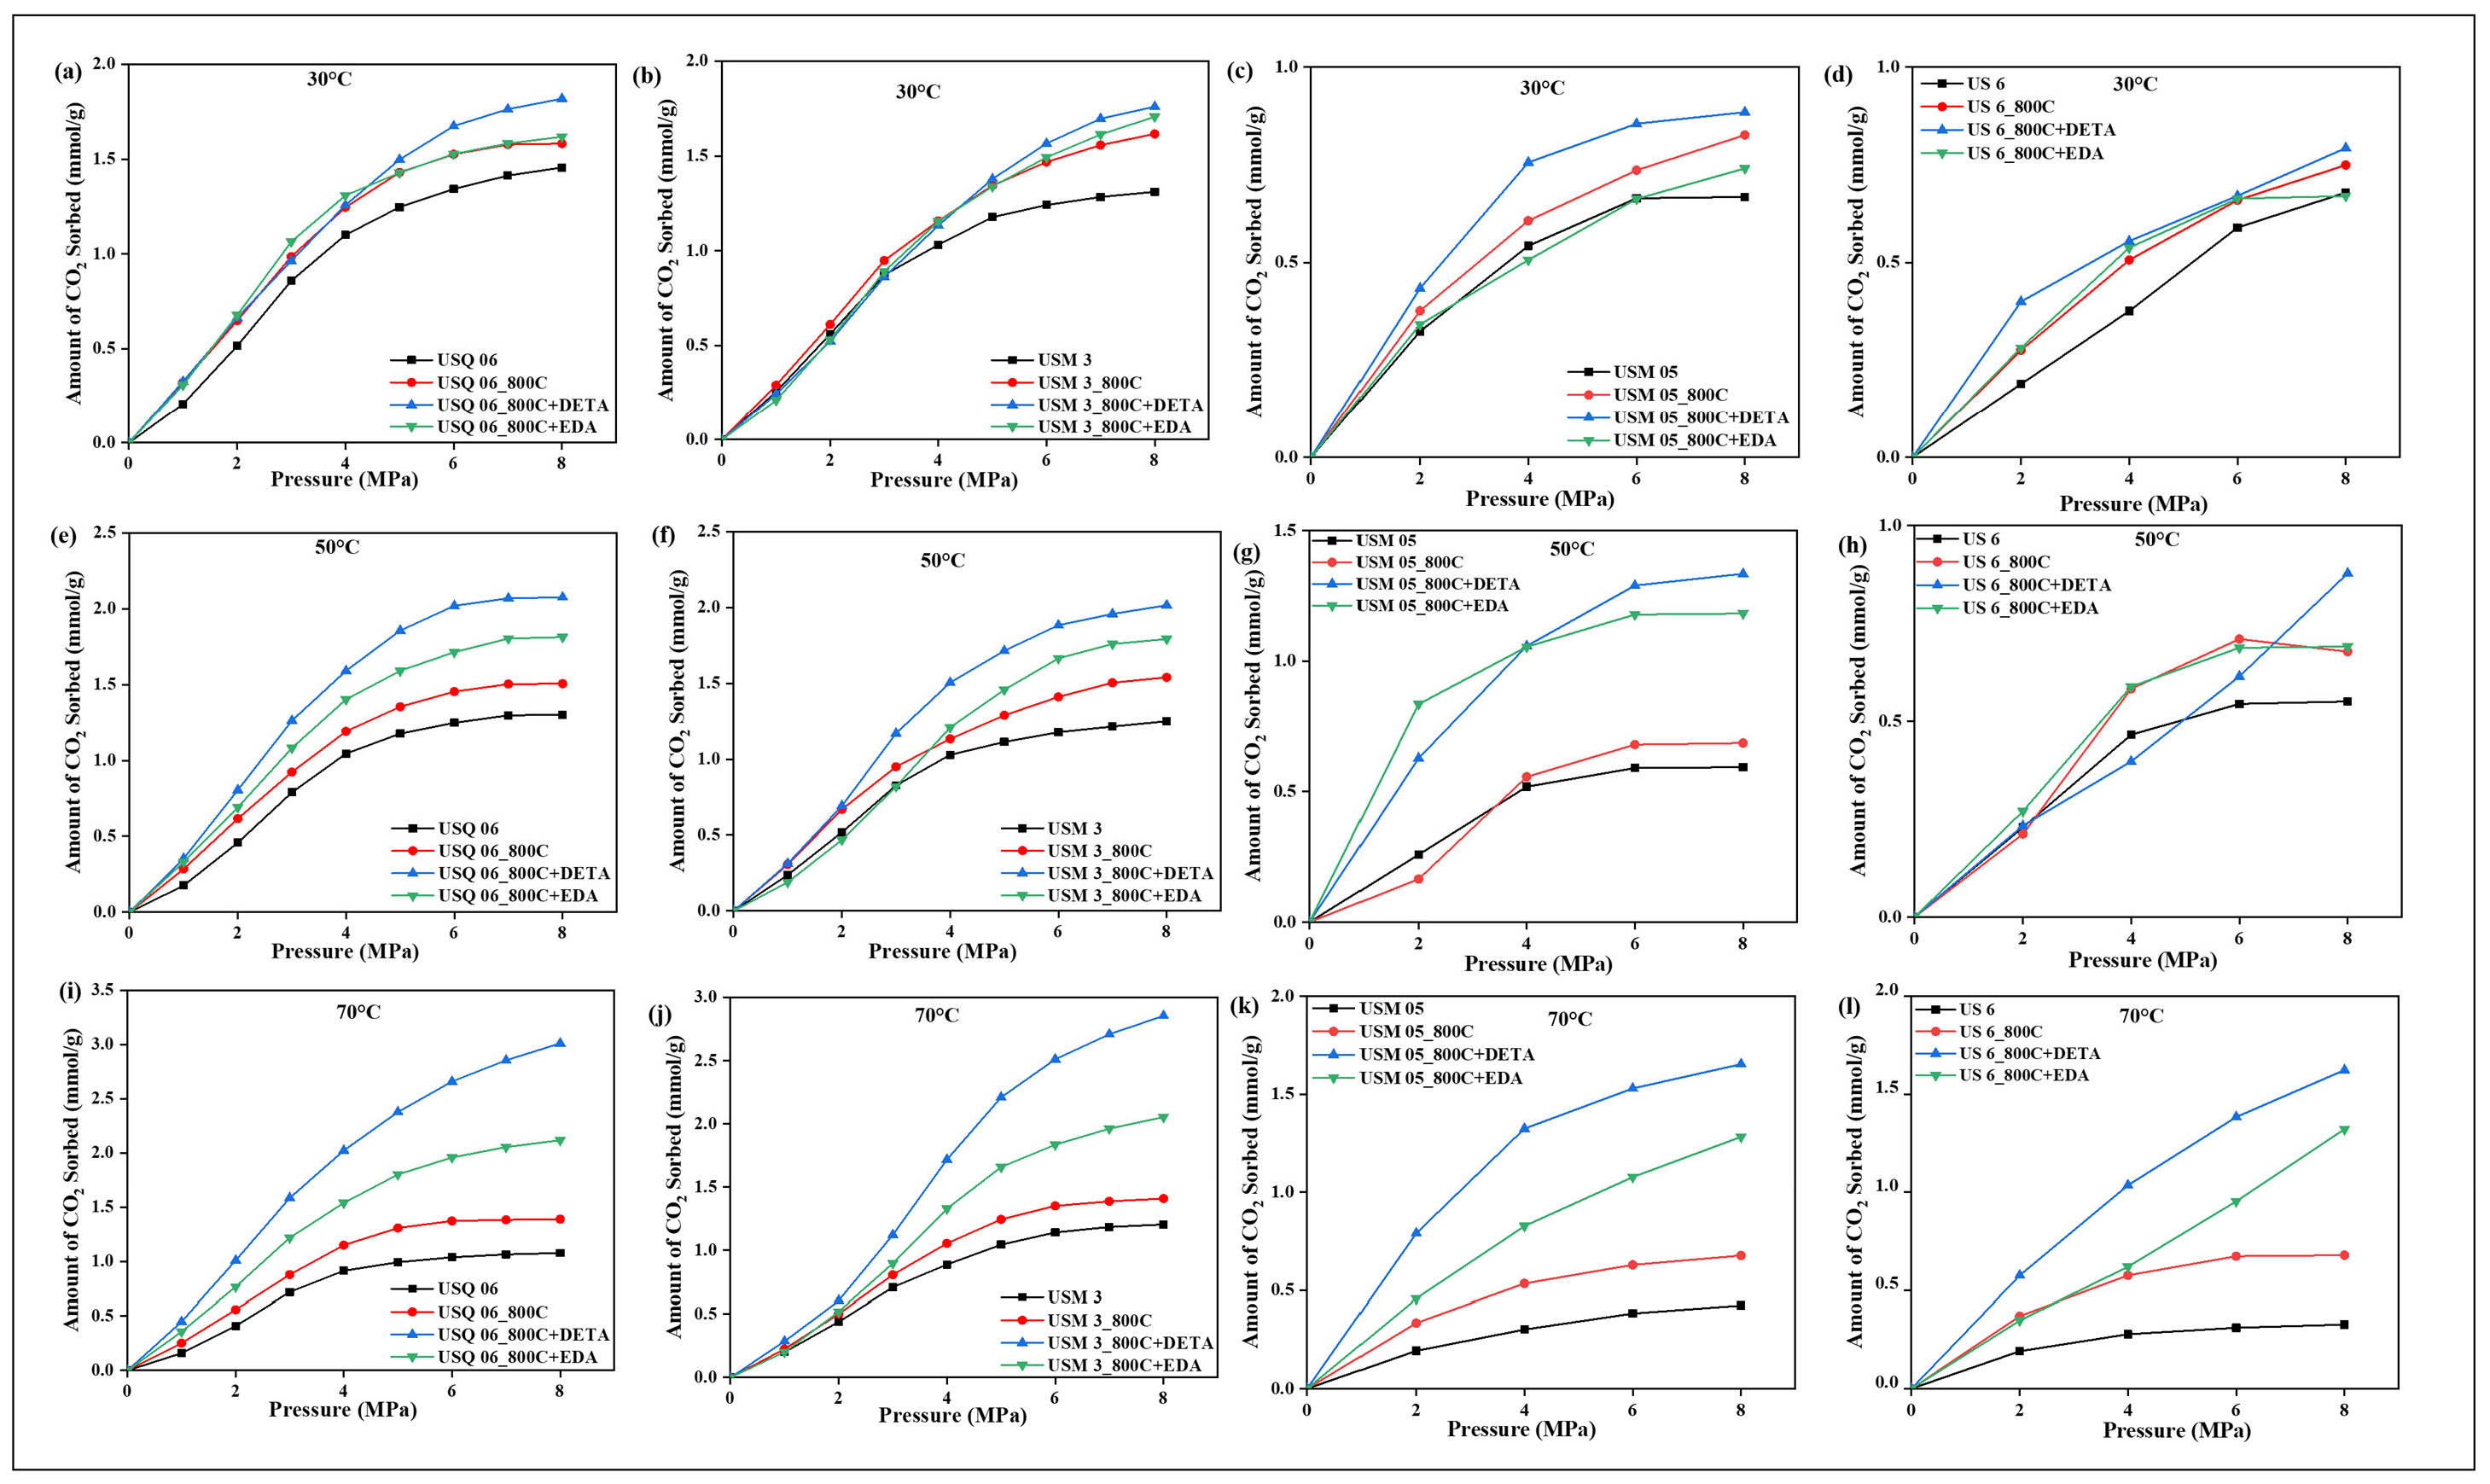
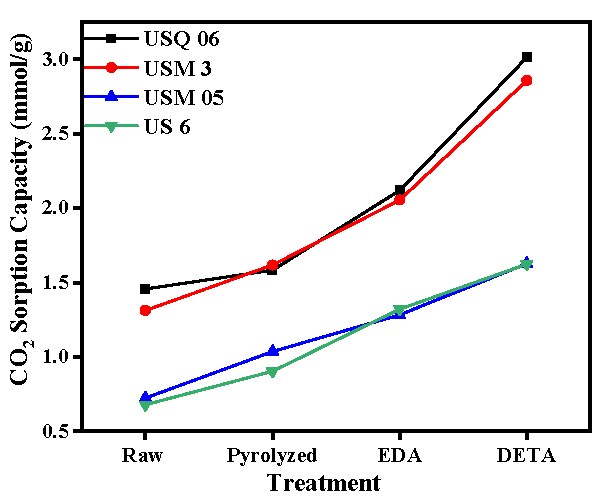
4.7. CO2 Sorption Capacity
4.8. Effects of Amine Modification on Sorption Performance
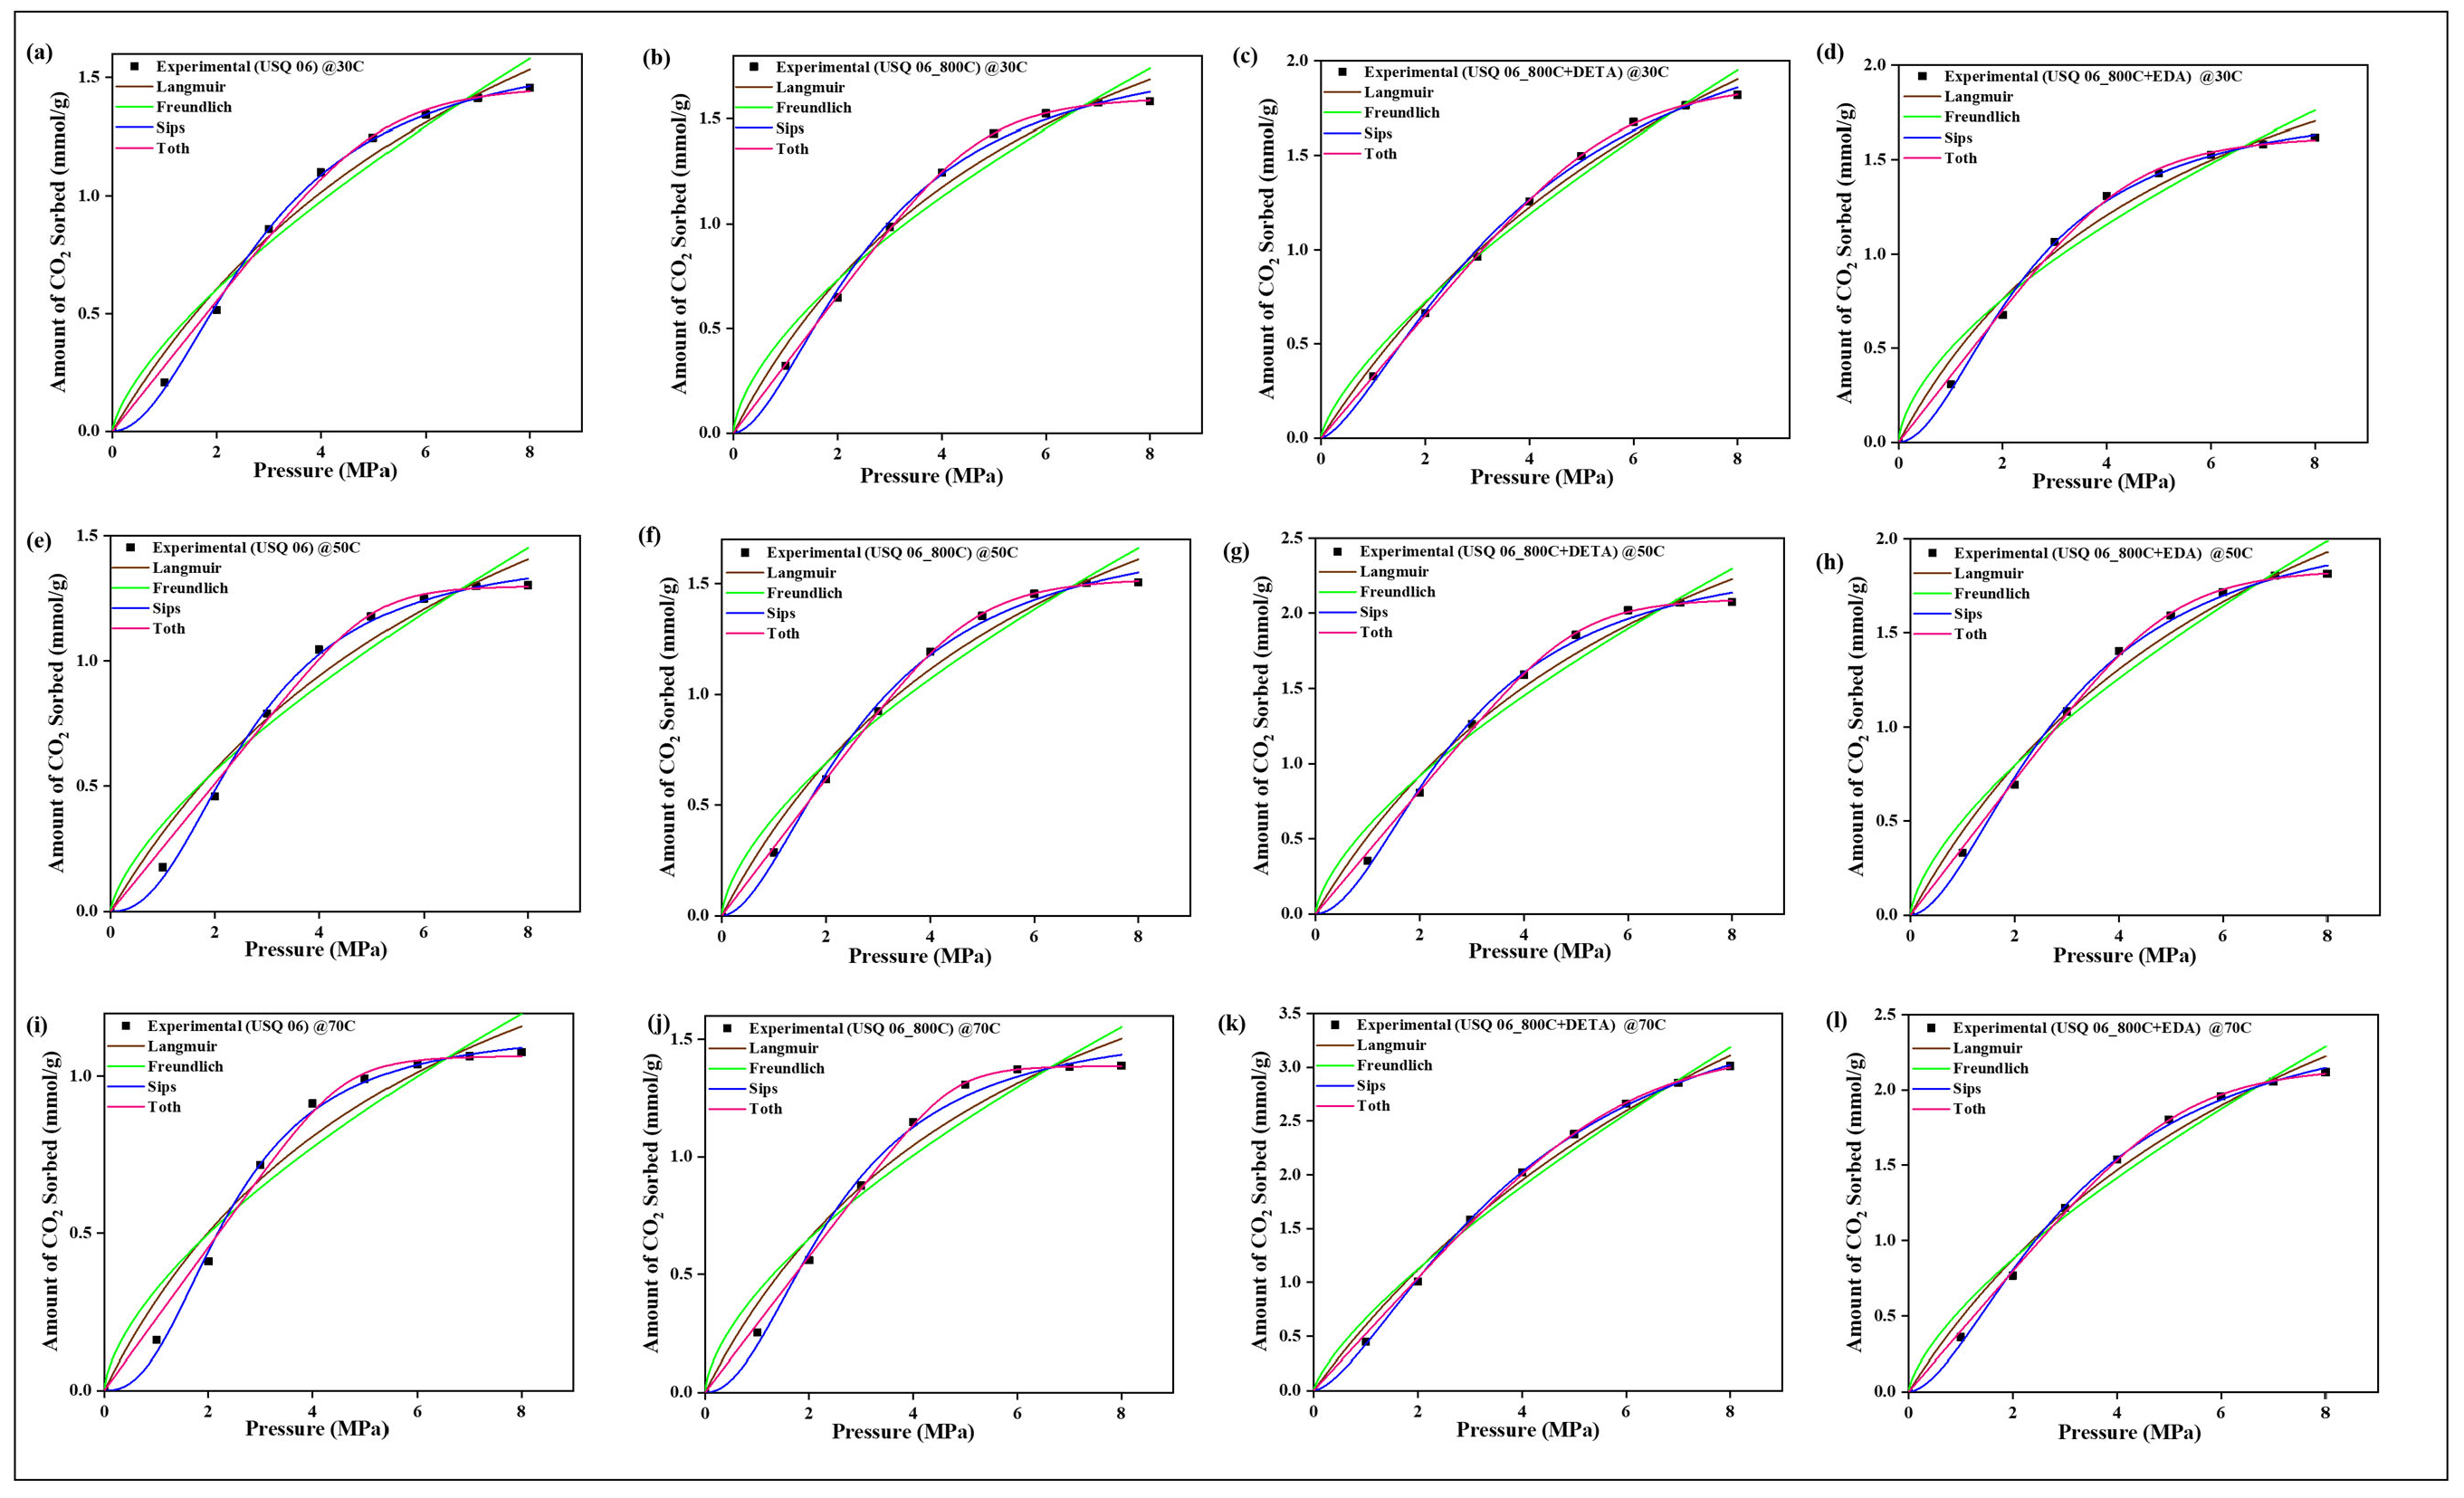
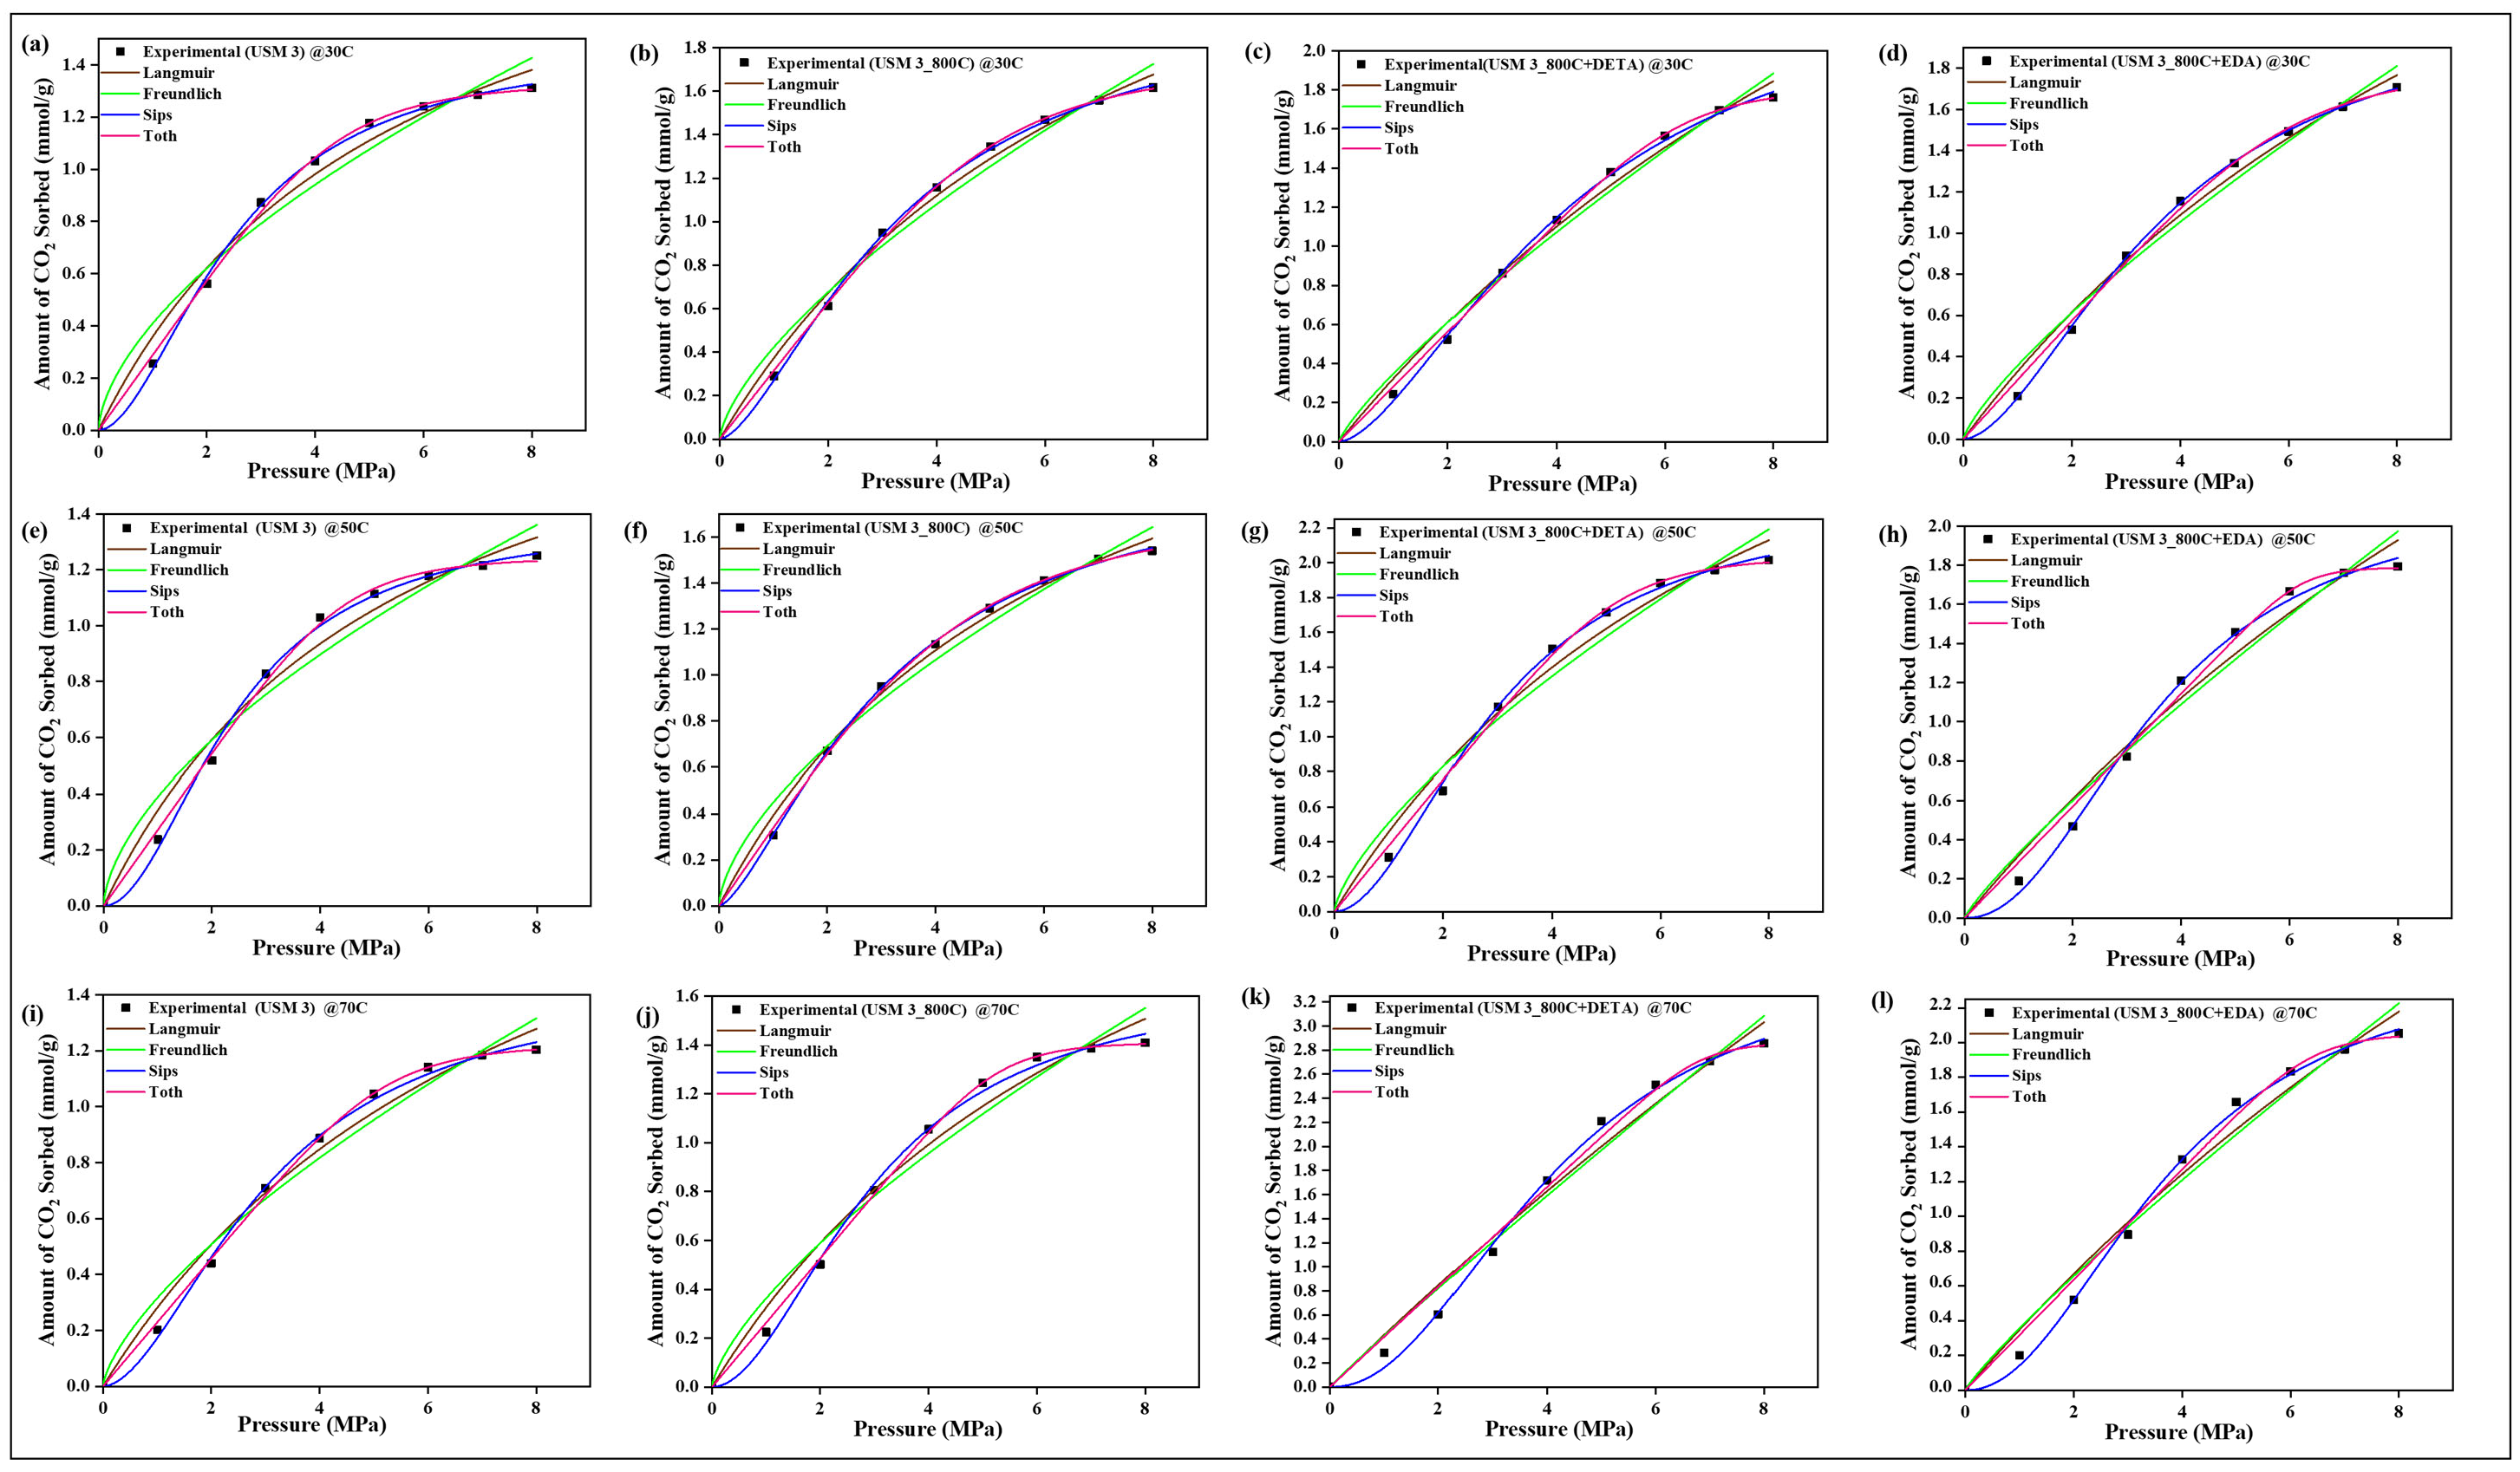
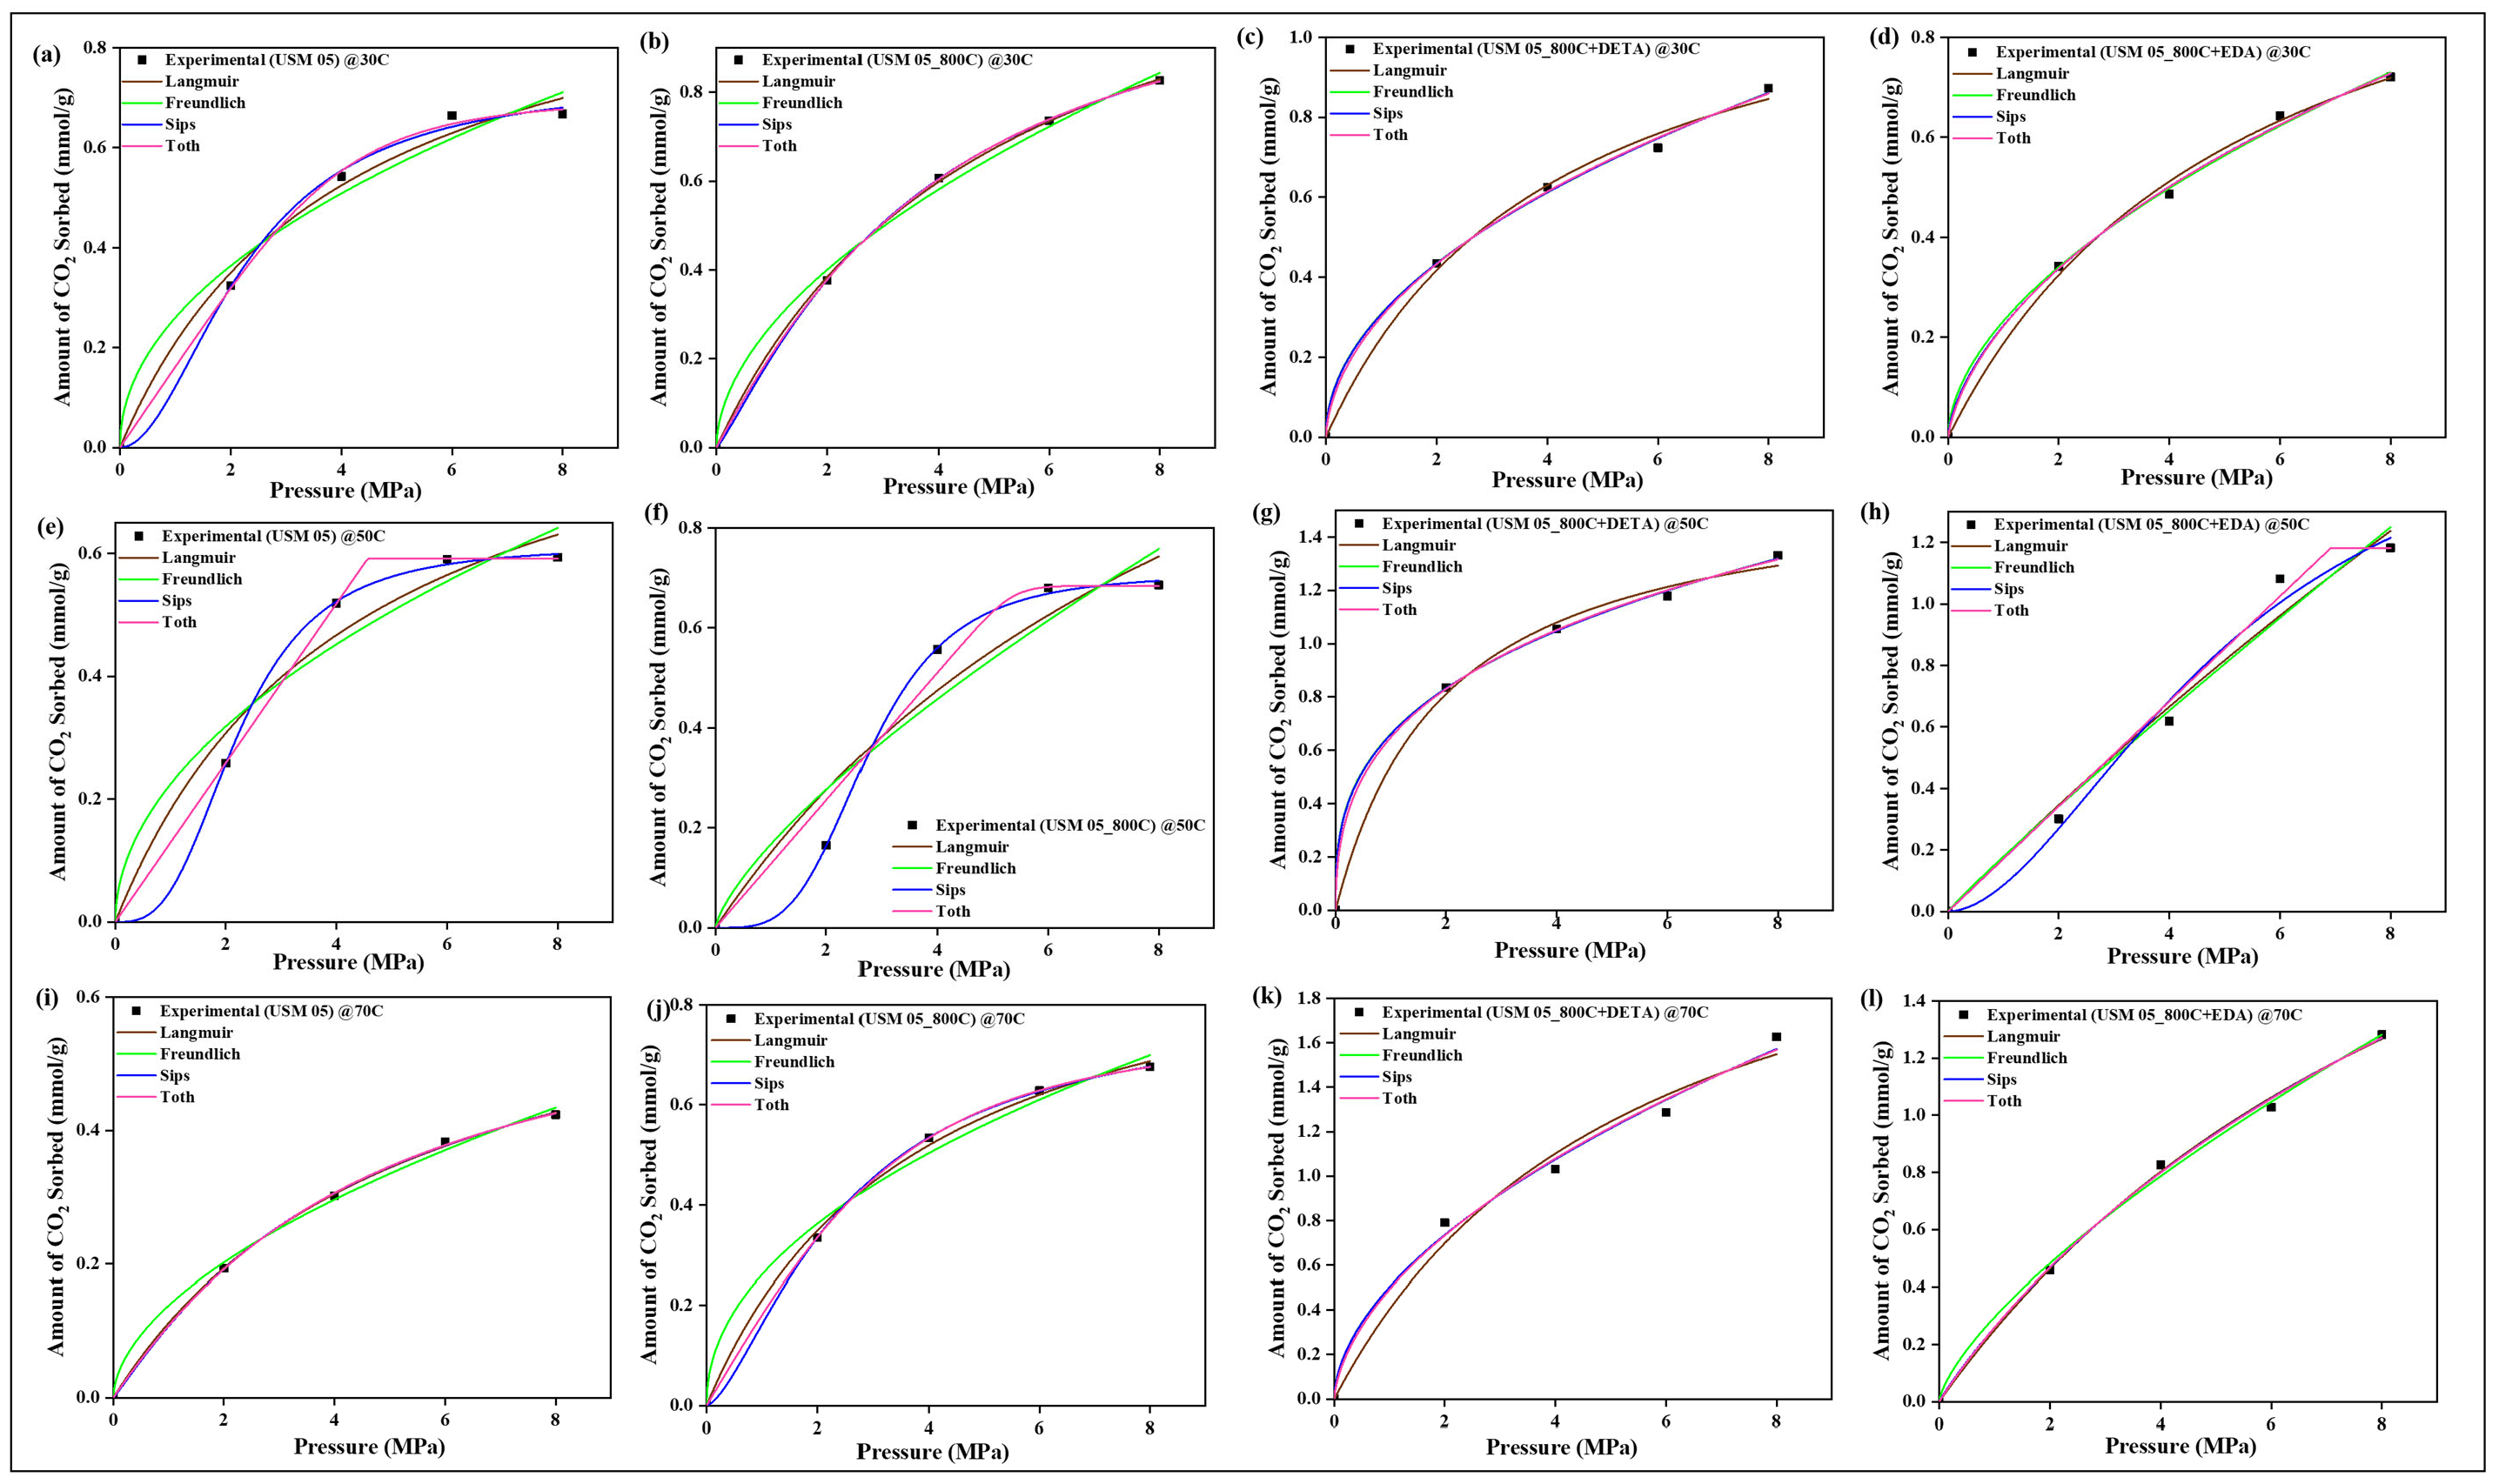
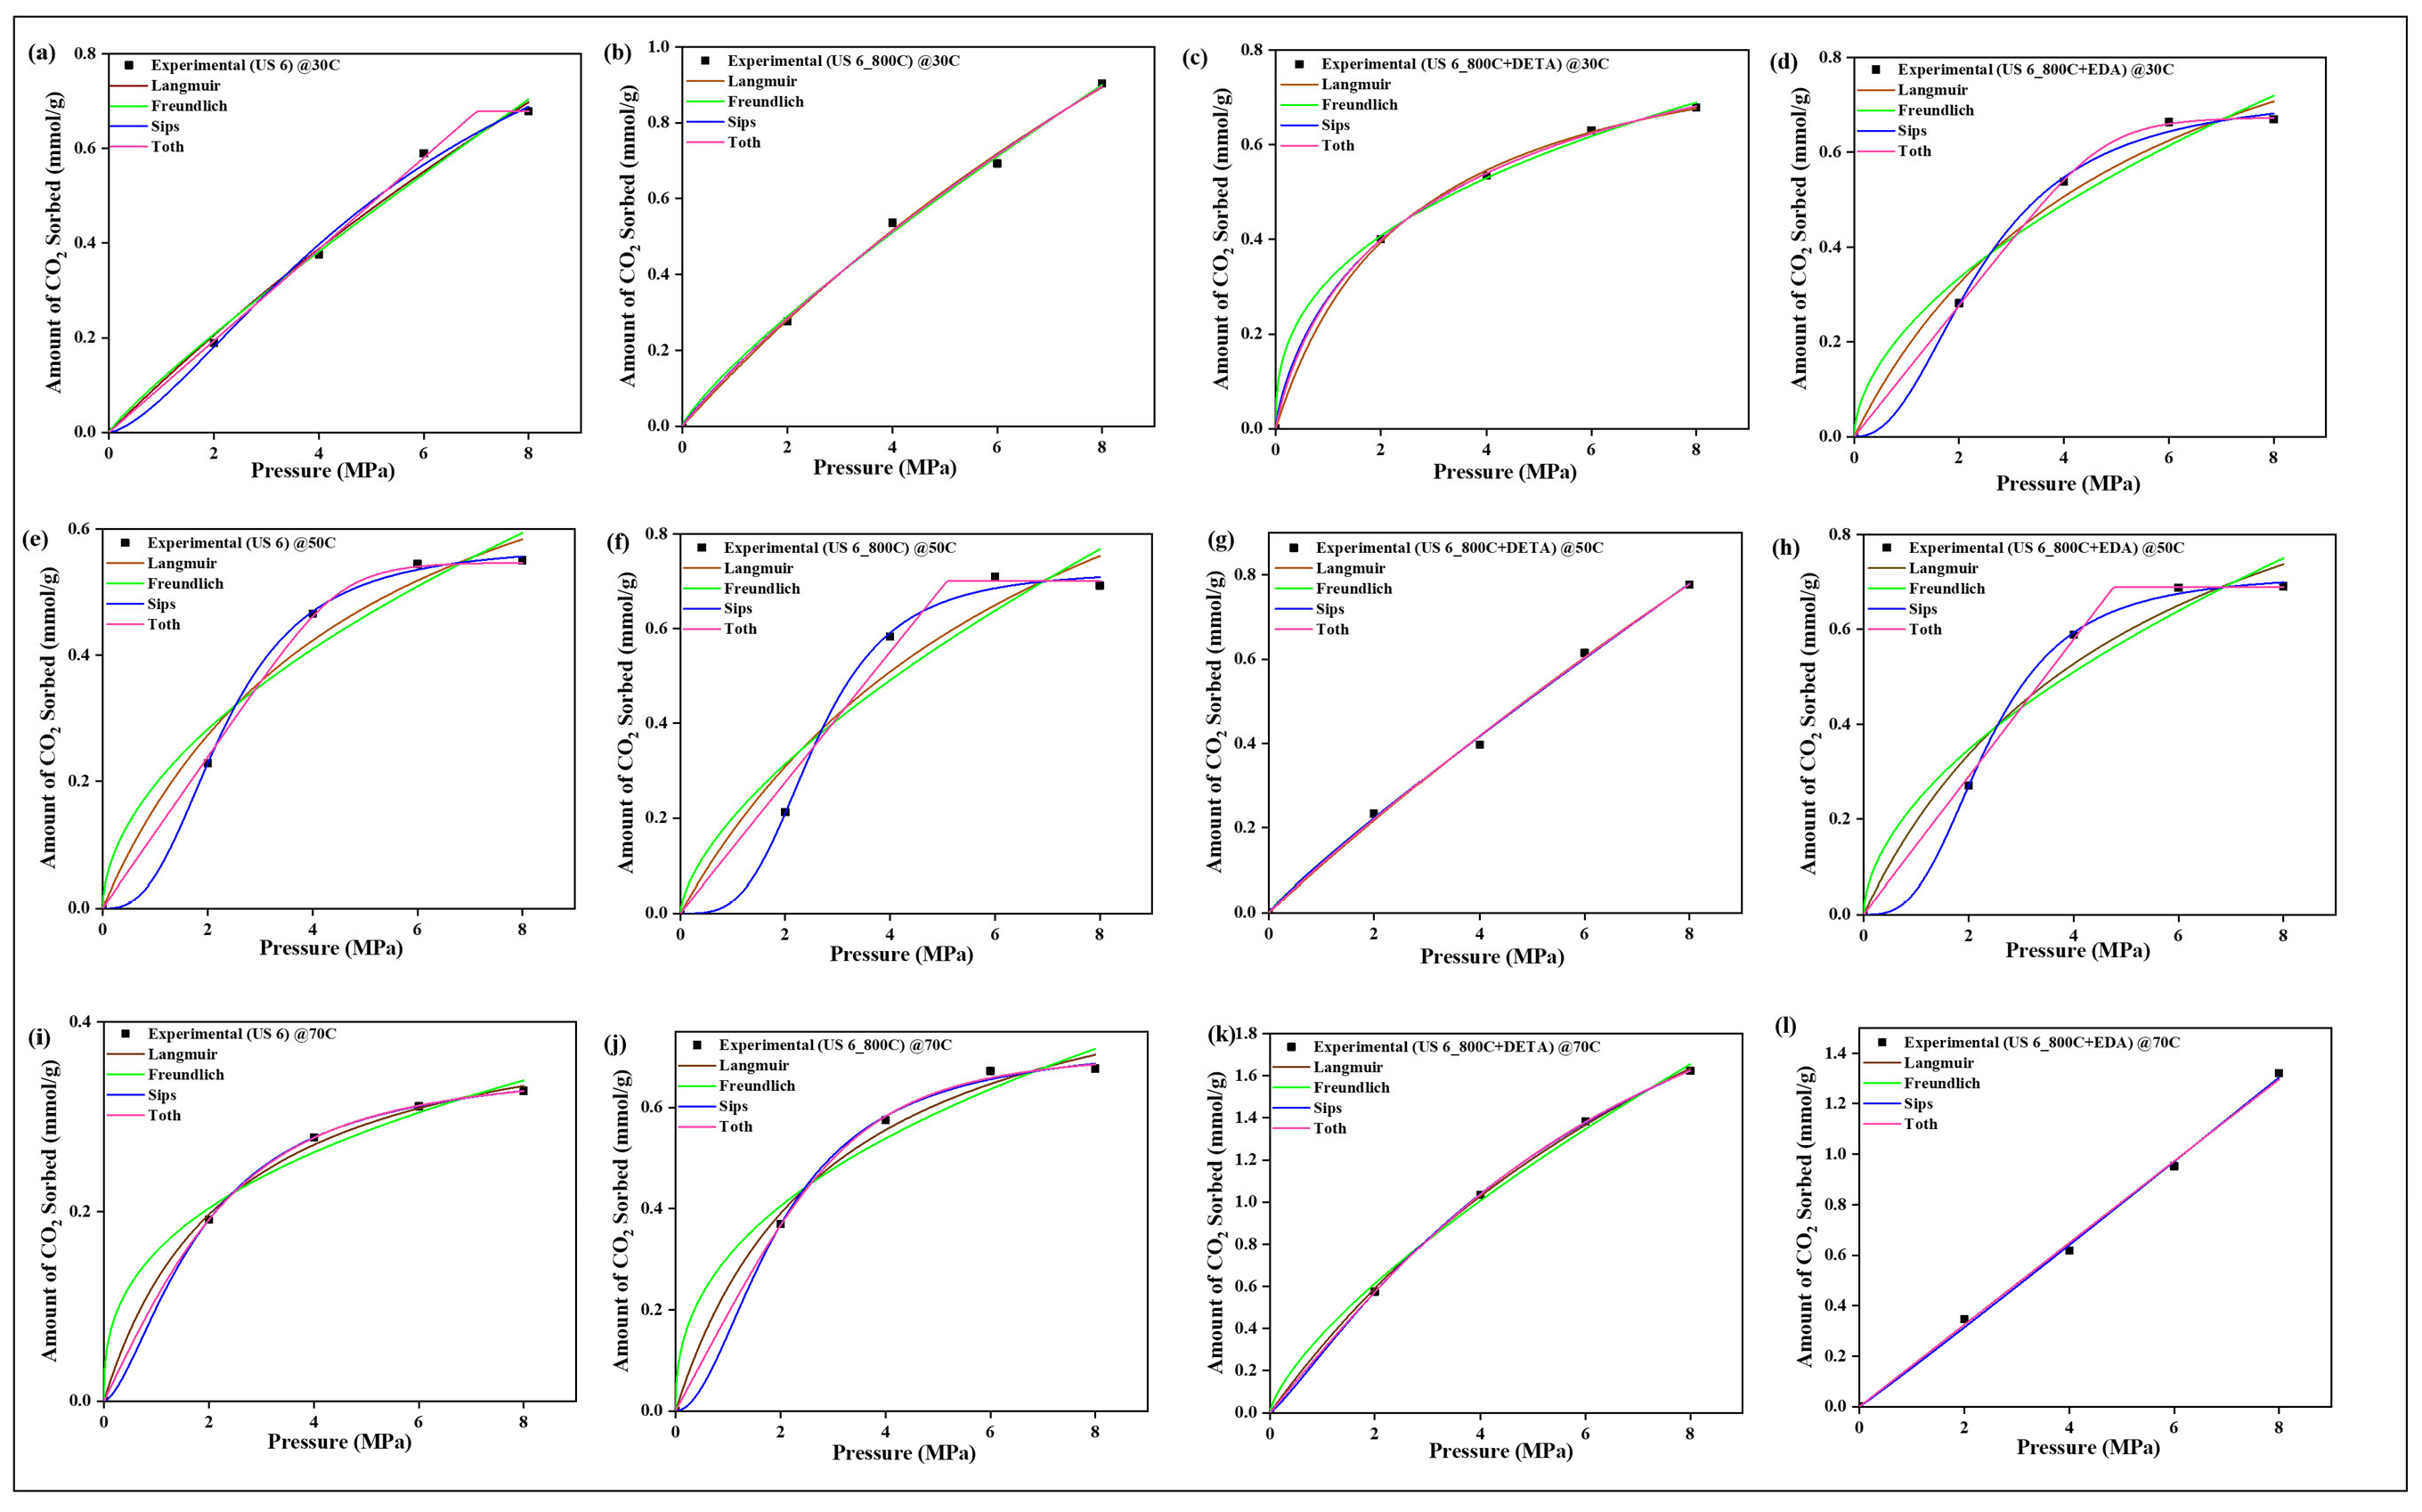
4.9. CO2 Sorption Isotherm Models
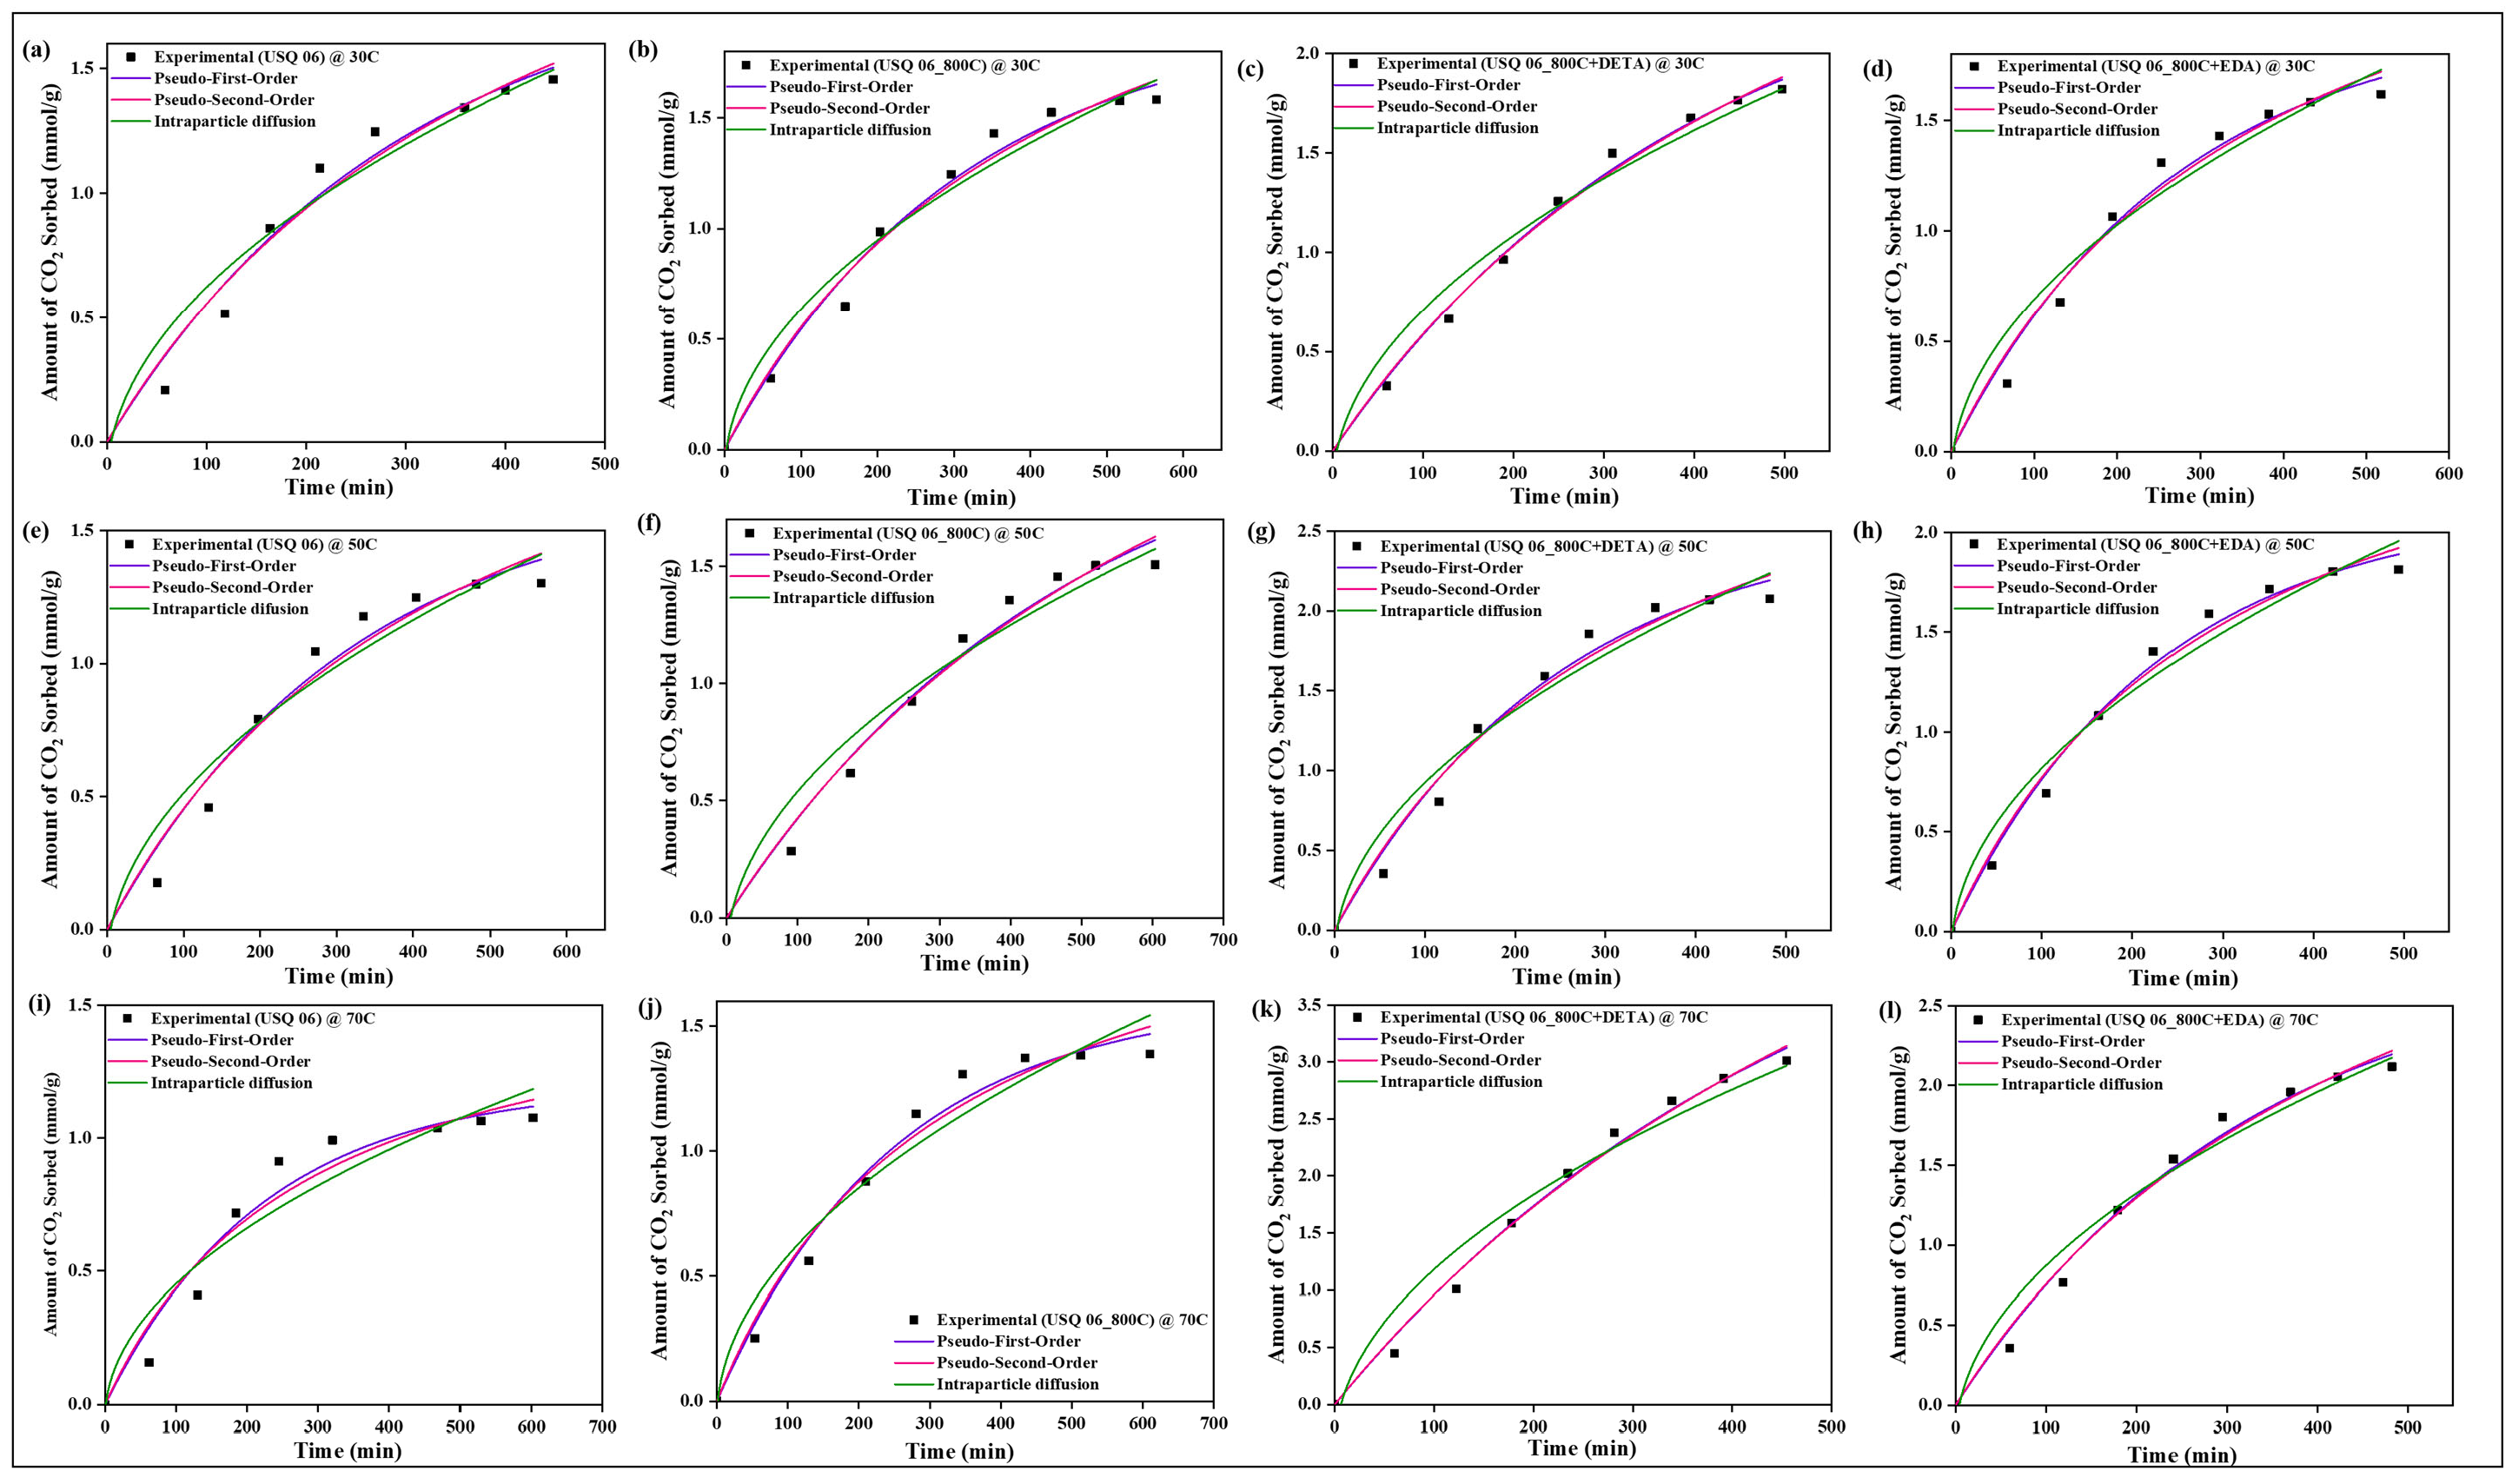
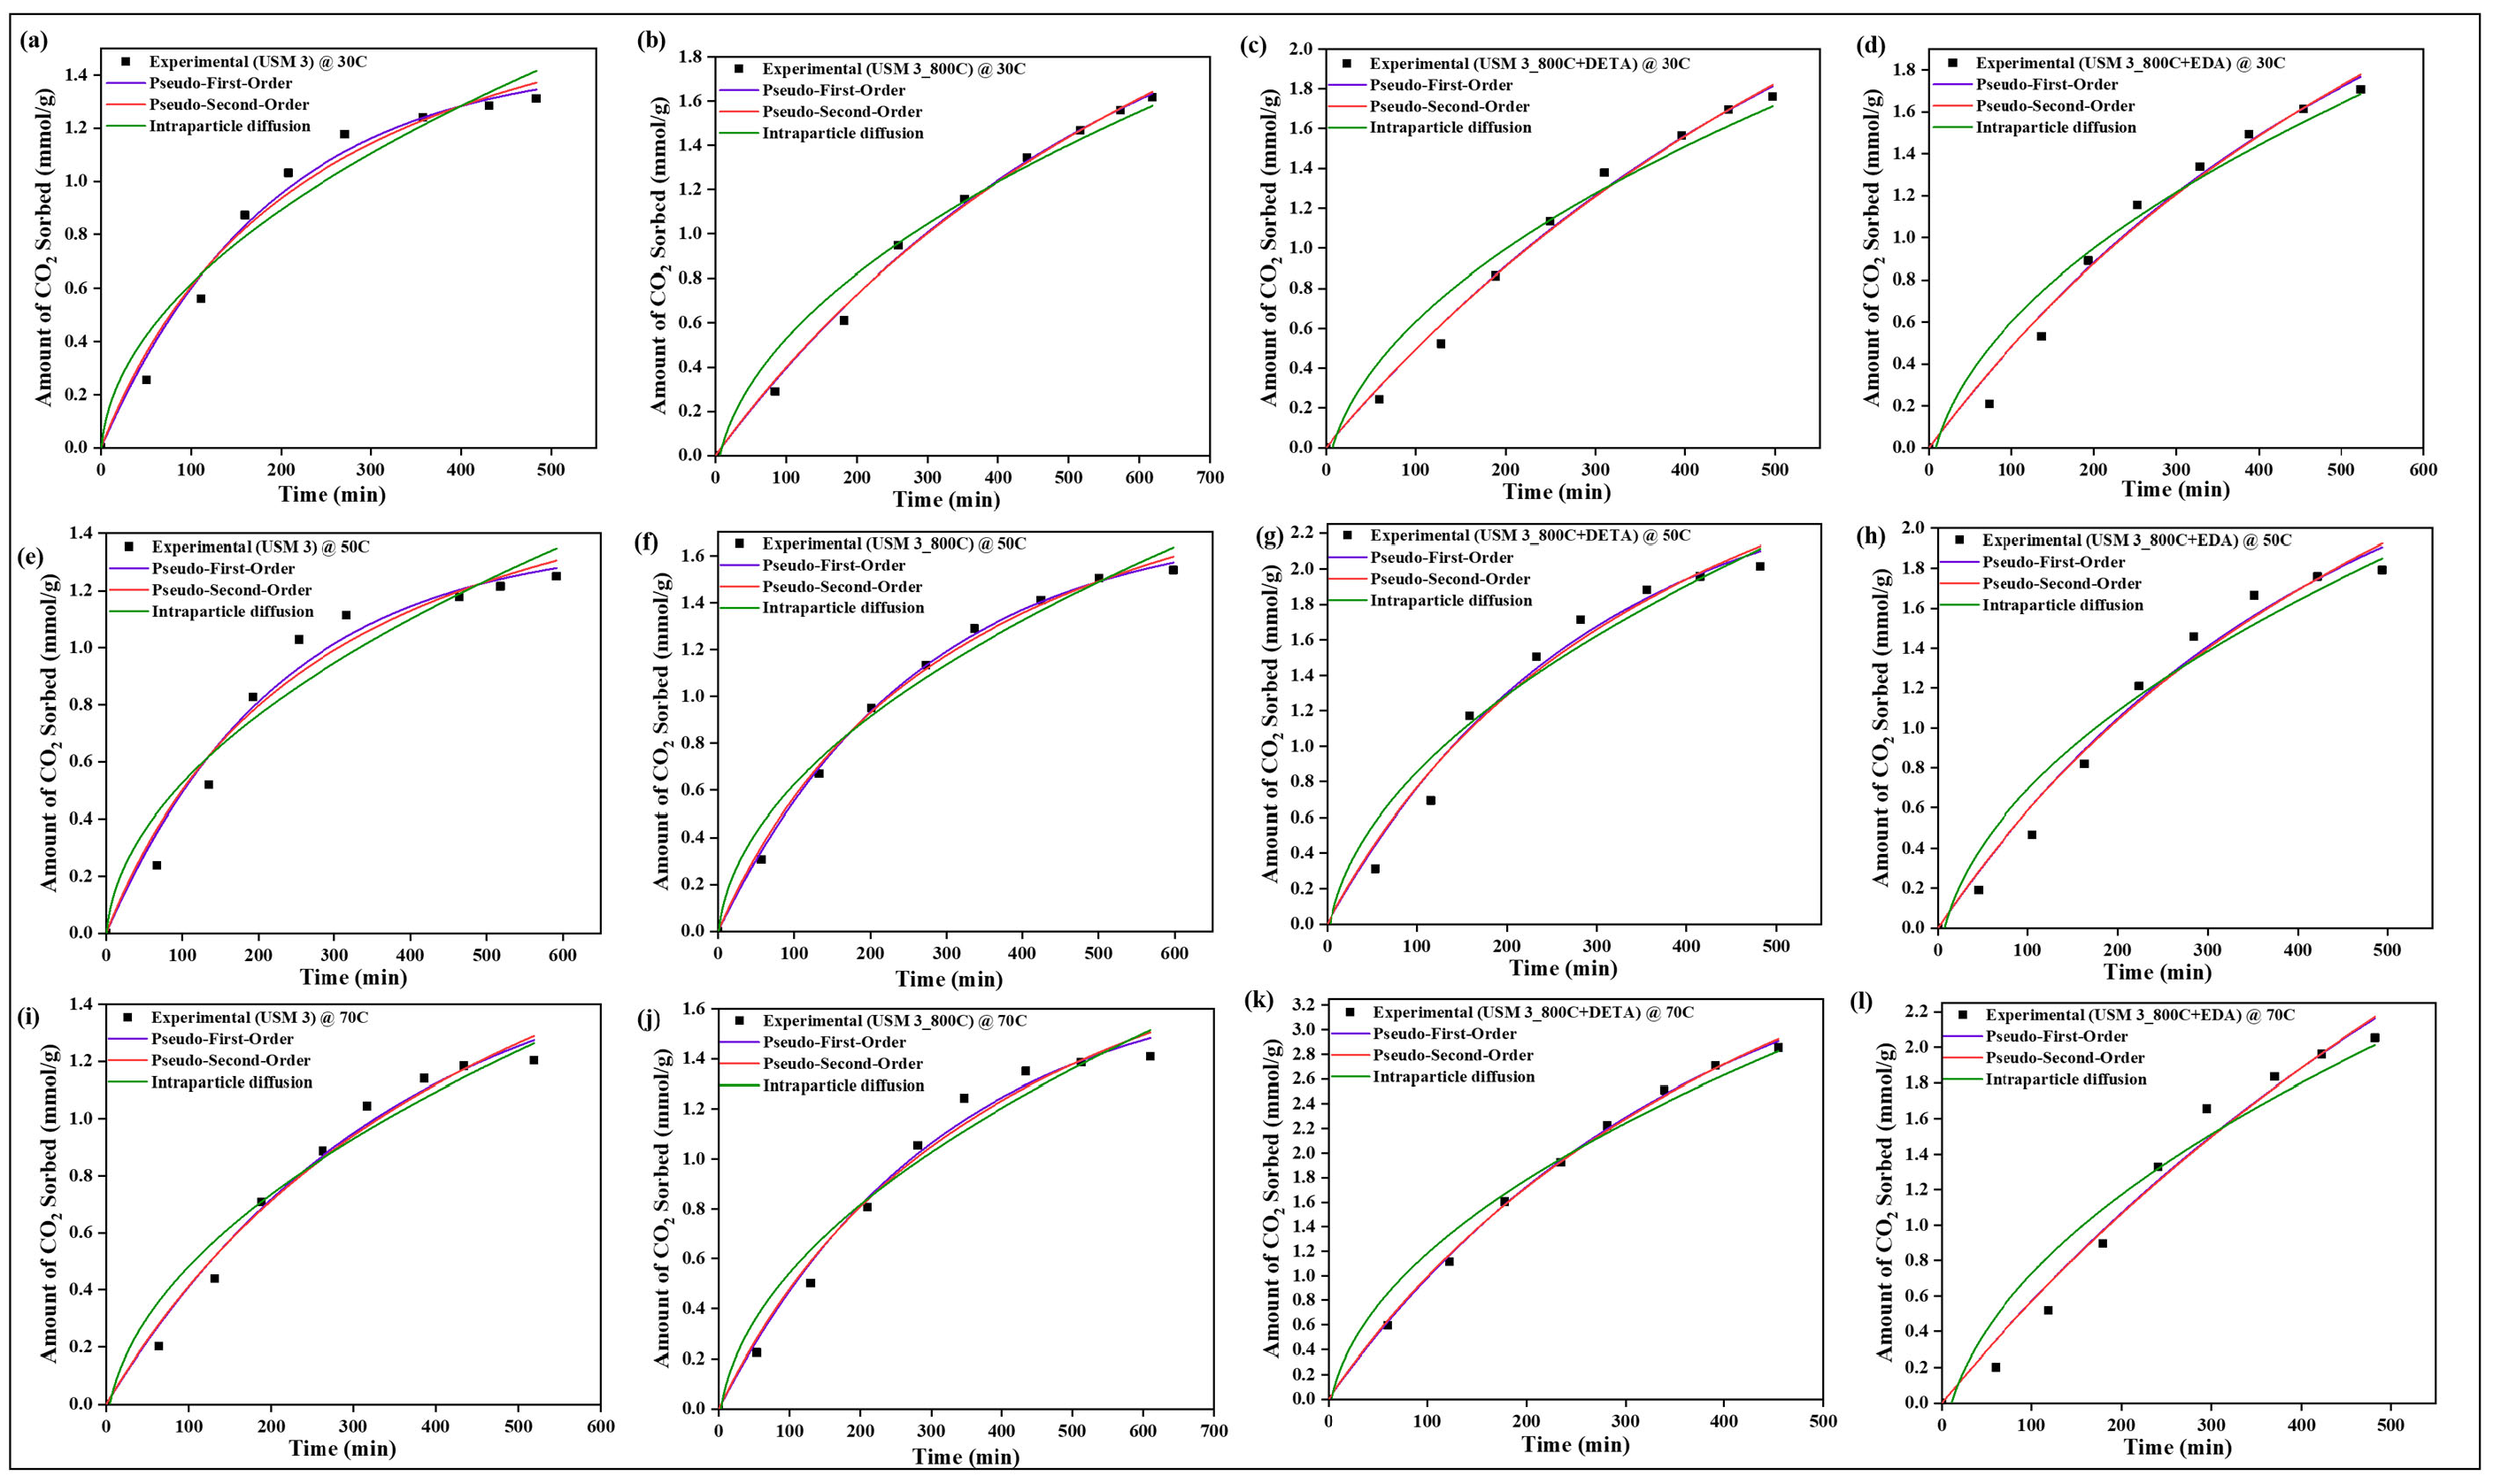
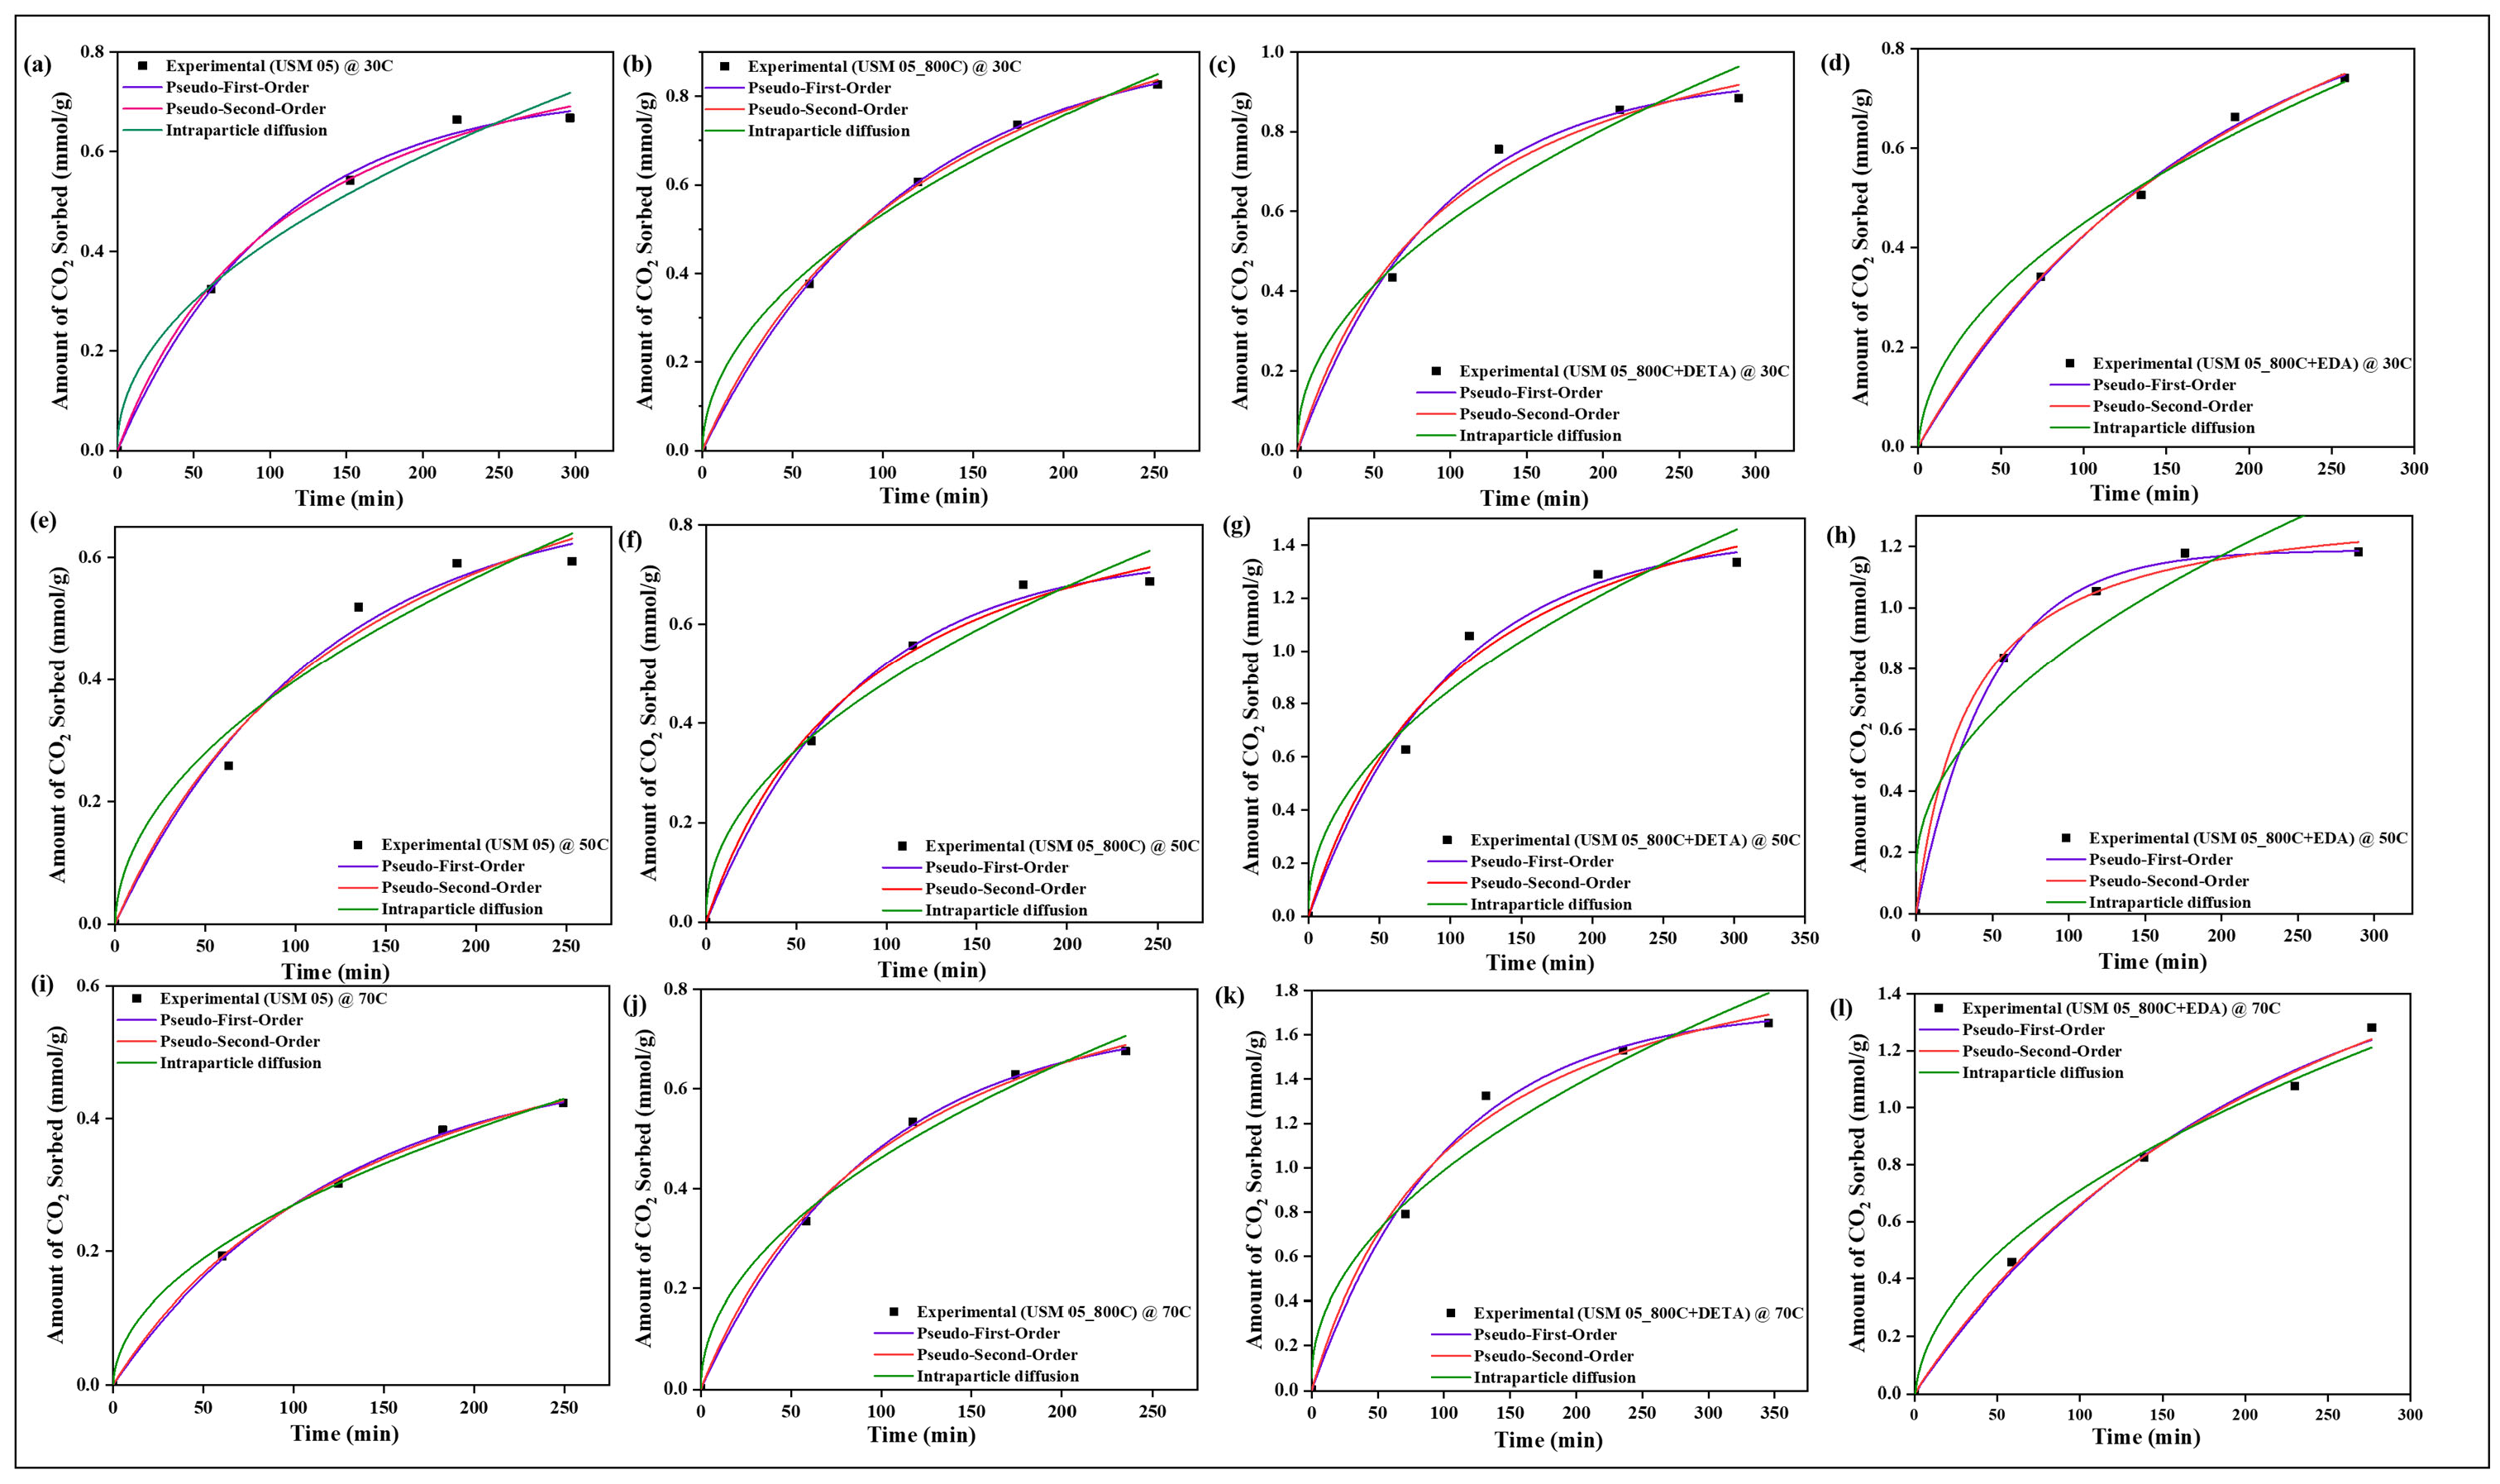
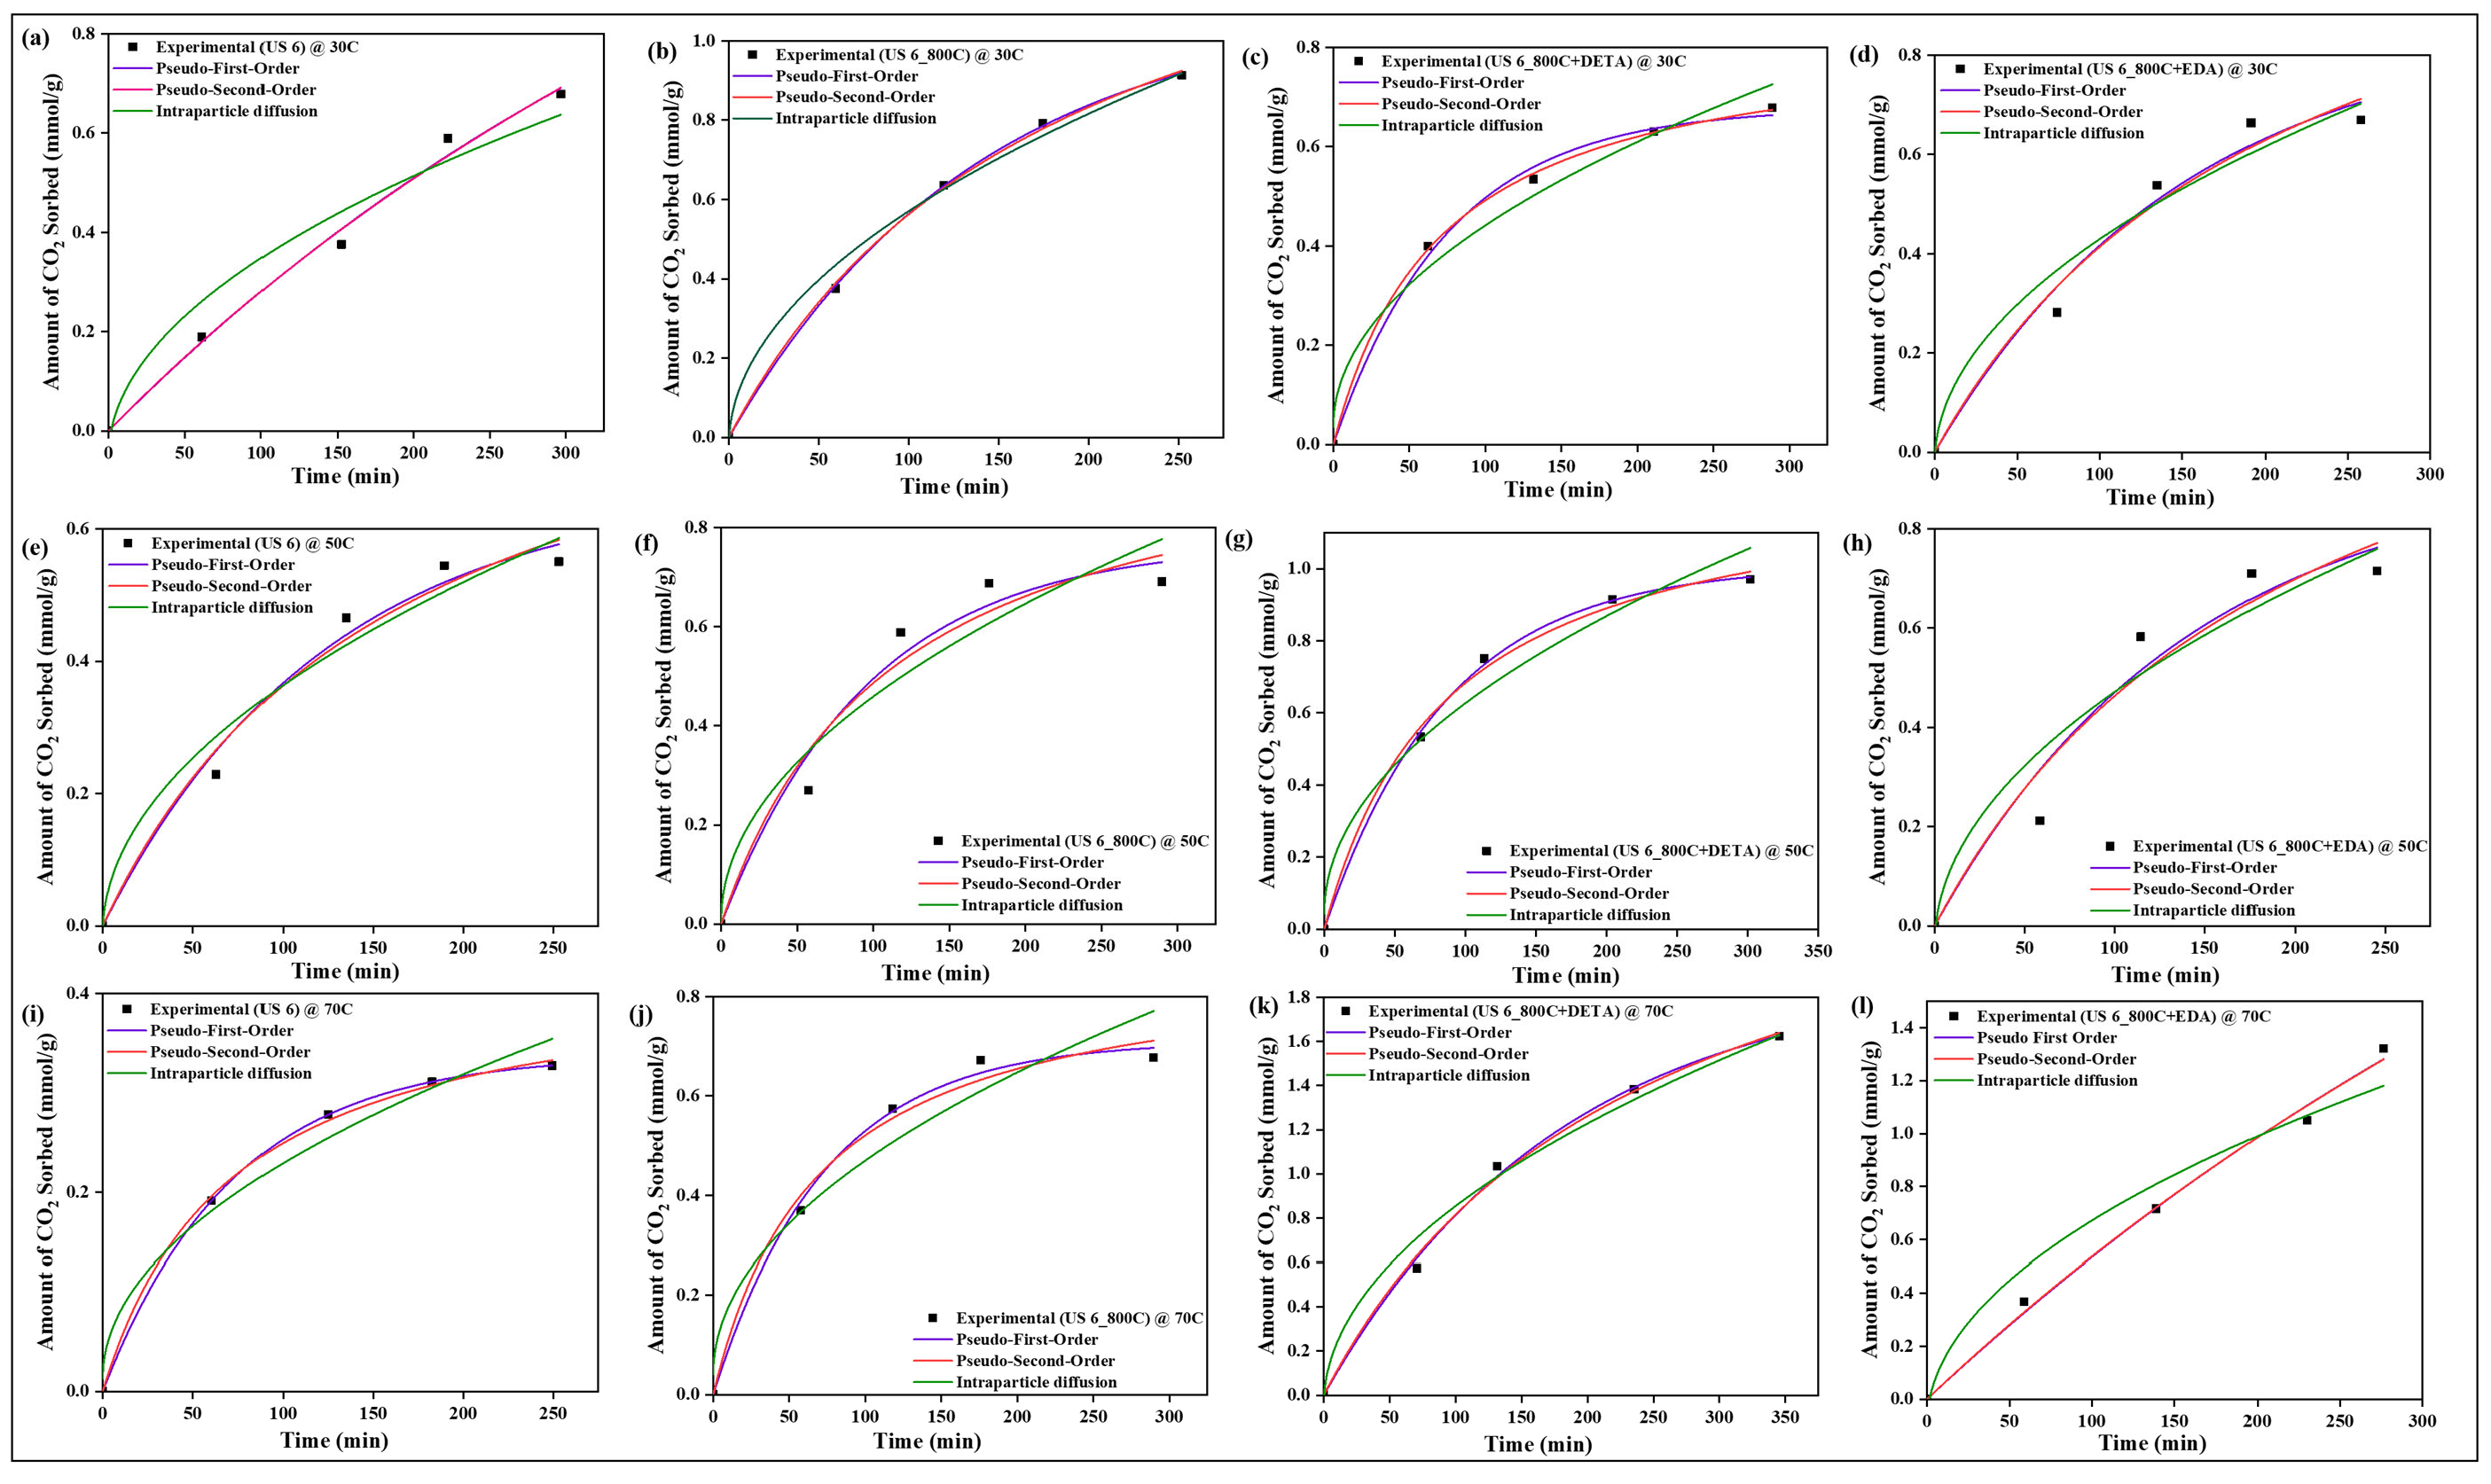
4.10. Sorption Kinetics
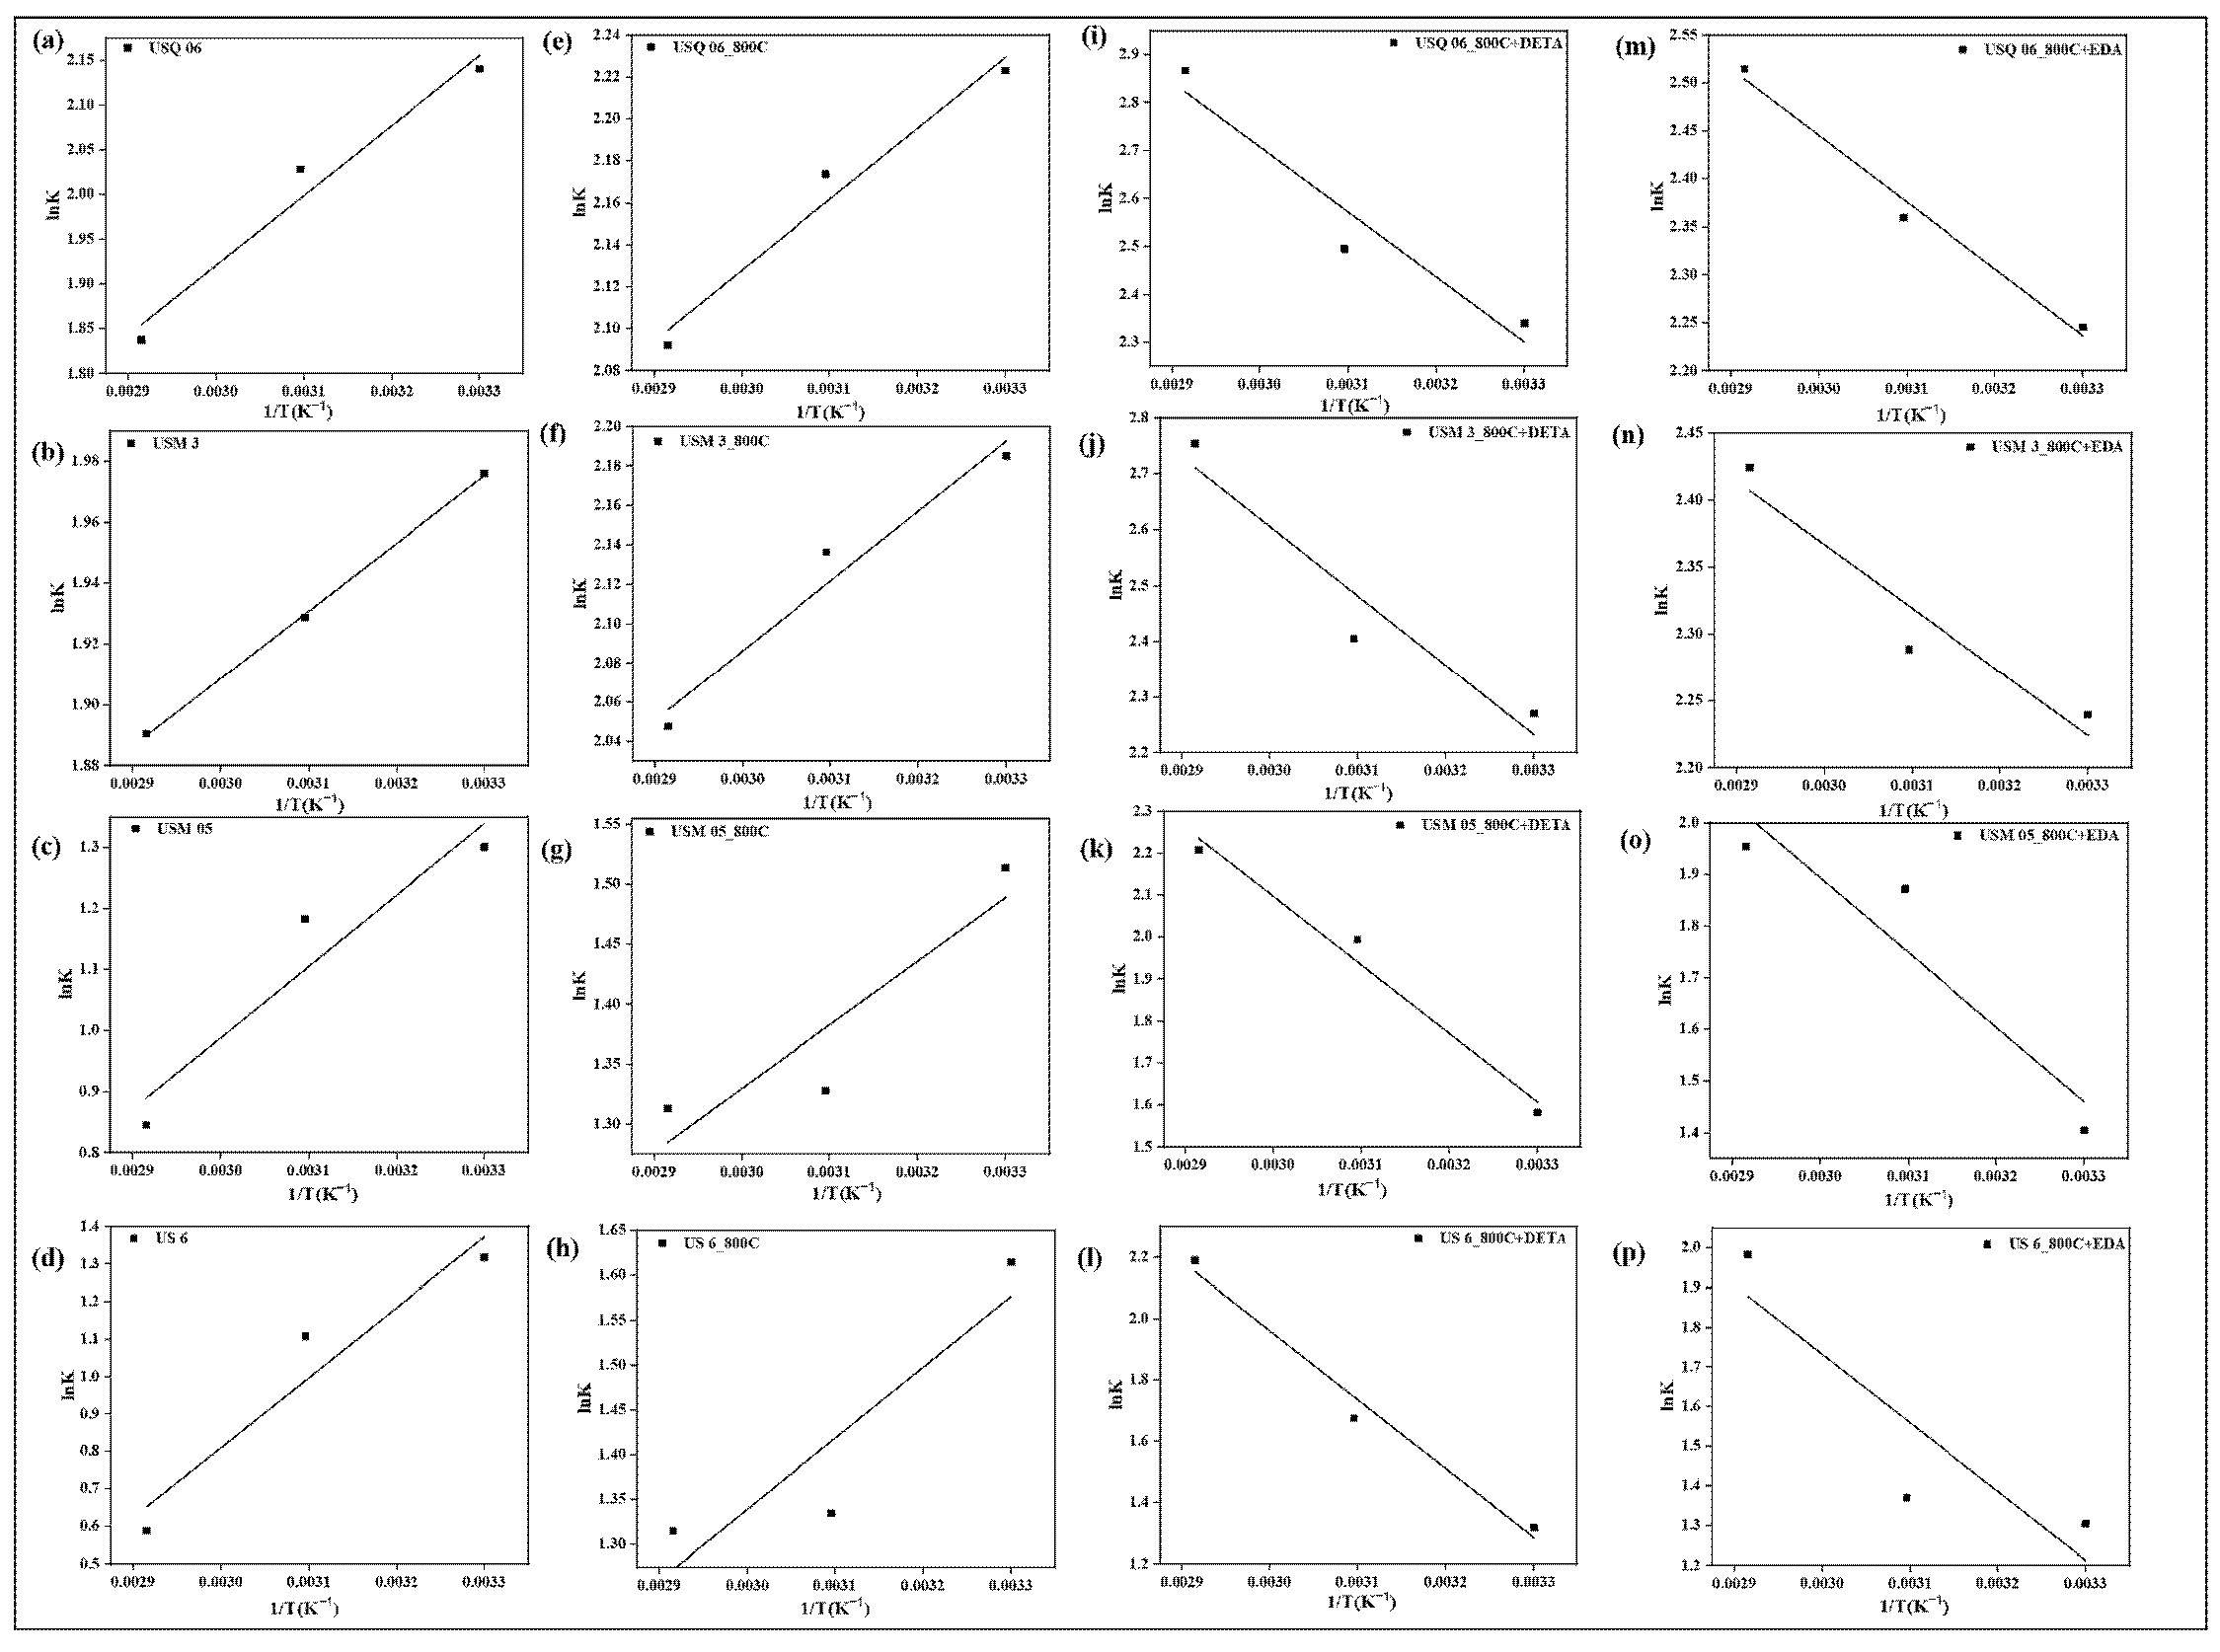
4.11. Thermodynamic Studies
5. Conclusions
Author Contributions
Funding
Acknowledgments
Conflicts of Interest
Nomenclature
| m2/g | Meter squared per gram |
| ppm | Part per million |
| mmol/g | Millimole per gram |
| λ | Wavelength |
| nm | Nanometer |
| θ | Theta |
| mL/min | Milliliter per minute |
| MPa | MegaPascal |
| atm | Atmospheric condition |
| nCO2 | Amount of CO2 |
| VCO2 | Volume of CO2 |
| Pi | Initial Pressure |
| Pf | Final Pressure |
| Zi | Initial Compressibility Factor |
| Zf | Final Compressibility Factor |
| qe | Equilibrium uptake |
| qm, | Maximum adsorption capacity |
| kL, | Langmuir constant |
| kF, | Adsorption potential |
| nF | Adsorption intensity |
| kS | Sips constant |
| nS | Sips exponential |
| kT | Toth constant |
| nT | Toth exponential |
| qt | Equilibrium uptake at time t |
| k1 | Pseudo-first-order constant |
| k2 | Pseudo-second-order constant |
| kI | Intraparticle diffusion constant |
| C | Intercept |
| ΔG | Gibbs free energy |
| ΔH | Enthalpy change |
| ΔS | Entropy change |
| P/P0 | Relative Pressure |
References
- Sayari, A.; Belmabkhout, Y.; Serna-Guerrero, R. Flue gas treatment via CO2 adsorption. Chem. Eng. J. 2011, 171, 760–774. [Google Scholar] [CrossRef]
- Ross, D.J.; Bustin, R.M. The importance of shale composition and pore structure upon gas storage potential of shale gas reservoirs. Mar. Pet. Geol. 2009, 26, 916–927. [Google Scholar] [CrossRef]
- Lan, X.; Tans, P.; Sweeney, C.; Andrews, A.; Jacobson, A.; Crotwell, M.; Dlugokencky, E.; Kofler, J.; Lang, P.; Thoning, K. Gradients of column CO2 across North America from the NOAA global greenhouse gas reference network. Atmos. Chem. Phys. 2017, 17, 15151–15165. [Google Scholar] [CrossRef] [Green Version]
- Soeder, D.J. Fossil Fuels and Climate Change. In Fracking and the Environment; Springer: Cham, Switzerland, 2021; pp. 155–185. [Google Scholar]
- Rani, S.; Padmanabhan, E.; Prusty, B.K. Review of gas adsorption in shales for enhanced methane recovery and CO2 storage. J. Pet. Sci. Eng. 2019, 175, 634–643. [Google Scholar] [CrossRef]
- Ritchie, H.; Roser, M. CO2 and Greenhouse Gas Emissions. Our World Data. 2020. Available online: https://ourworldindata.org/co2-and-other-greenhouse-gas-emissions (accessed on 2 October 2022).
- Balogun, A.I.; Abdulkareem, F.A.; Irfan, S.A.; Padmanabhan, E. The Effective Process Parameters of CO2 Adsorption on Peninsular Malaysia Shale Samples. In Proceedings of the SPE/AAPG/SEG Asia Pacific Unconventional Resources Technology Conference, Virtual, 16–18 November 2021. [Google Scholar]
- Wang, X.; Zeng, W.; Guo, Q.; Geng, Q.; Yan, Y.; Hu, X. The further activation and functionalization of semicoke for CO2 capture from flue gases. RSC Adv. 2018, 8, 35521–35527. [Google Scholar] [CrossRef] [PubMed] [Green Version]
- Wang, X.; Zeng, W.; Liu, W.; Cao, X.; Hou, C.; Ding, Q.; Lü, Y. CO2 adsorption of lignite chars after one-step KOH activation. New J. Chem. 2020, 44, 13755–13763. [Google Scholar] [CrossRef]
- Wang, N.; Chen, J.; Wang, J.; Feng, J.; Yan, W. Removal of methylene blue by Polyaniline/TiO2 hydrate: Adsorption kinetic, isotherm and mechanism studies. Powder Technol. 2019, 347, 93–102. [Google Scholar] [CrossRef]
- Zhao, Z.; Cui, X.; Ma, J.; Li, R. Adsorption of carbon dioxide on alkali-modified zeolite 13X adsorbents. Int. J. Greenh. Gas Control 2007, 1, 355–359. [Google Scholar] [CrossRef]
- Wang, X.; Guo, Q. CO2 adsorption behavior of activated coal char modified with tetraethylenepentamine. Energy Fuels 2016, 30, 3281–3288. [Google Scholar] [CrossRef]
- Hu, X.E.; Liu, L.; Luo, X.; Xiao, G.; Shiko, E.; Zhang, R.; Fan, X.; Zhou, Y.; Liu, Y.; Zeng, Z. A review of N-functionalized solid adsorbents for post-combustion CO2 capture. Appl. Energy 2020, 260, 114244. [Google Scholar] [CrossRef]
- Tejavath, V.; Kasarabada, V.; Gonuguntla, S.; Perupoga, V.; Nandury, S.V.; Bojja, S.; Pal, U. Technoeconomic Investigation of Amine-Grafted Zeolites and Their Kinetics for CO2 Capture. ACS Omega 2021, 6, 6153–6162. [Google Scholar] [CrossRef] [PubMed]
- Yang, H.; Xu, Z.; Fan, M.; Gupta, R.; Slimane, R.B.; Bland, A.E.; Wright, I. Progress in carbon dioxide separation and capture: A review. J. Environ. Sci. 2008, 20, 14–27. [Google Scholar] [CrossRef]
- Lee, S.-Y.; Park, S.-J. A review on solid adsorbents for carbon dioxide capture. J. Ind. Eng. Chem. 2015, 23, 1–11. [Google Scholar] [CrossRef]
- Hao, G.-P.; Li, W.-C.; Lu, A.-H. Novel porous solids for carbon dioxide capture. J. Mater. Chem. 2011, 21, 6447–6451. [Google Scholar] [CrossRef]
- Lu, C.; Ma, L.; Xiao, S.; Guo, J.; Feng, Q. Effect of Acidification Pretreatment on the Deep Shale Mechanical Parameters of Longmaxi-Wufeng Formation in China. In Proceedings of the AAPG ACE 2018, Salt Lake City, UT, USA, 20–23 May 2018. [Google Scholar]
- Meng, M.; Qiu, Z.; Zhong, R.; Liu, Z.; Liu, Y.; Chen, P. Adsorption characteristics of supercritical CO2/CH4 on different types of coal and a machine learning approach. Chem. Eng. J. 2019, 368, 847–864. [Google Scholar] [CrossRef]
- Li, Y.; Chen, J.; Sun, Y. Adsorption of multicomponent volatile organic compounds on semi-coke. Carbon 2008, 46, 858–863. [Google Scholar]
- Gao, X.; Dai, Y.; Zhang, Y.; Fu, F. Effective adsorption of phenolic compound from aqueous solutions on activated semi coke. J. Phys. Chem. Solids 2017, 102, 142–150. [Google Scholar] [CrossRef]
- Almoneef, M.; Jedli, H.; Mbarek, M. Experimental study of CO2 adsorption using activated carbon. Mater. Res. Express 2021, 8, 65602. [Google Scholar] [CrossRef]
- Masel, R.I. Principles of Adsorption and Reaction on Solid Surfaces; John Wiley & Sons: New York City, NY, USA, 1996; Volume 3. [Google Scholar]
- Foo, K.Y.; Hameed, B.H. Insights into the modeling of adsorption isotherm systems. Chem. Eng. J. 2010, 156, 2–10. [Google Scholar] [CrossRef]
- Majd, M.M.; Kordzadeh-Kermani, V.; Ghalandari, V.; Askari, A.; Sillanpää, M. Adsorption isotherm models: A comprehensive and systematic review (2010–2020). Sci. Total Environ. 2021, 812, 151334. [Google Scholar] [CrossRef]
- Sun, R.; Li, J.; Li, H.; Jin, B.; Li, Z.; Zhang, T.; Zhu, X. Mechanistic insights into ball milling enhanced montmorillonite modification with tetramethylammonium for adsorption of gaseous toluene. Chemosphere 2022, 296, 133962. [Google Scholar] [CrossRef]
- Qiu, H.; Vijver, M.G.; He, E.; Peijnenburg, W.J. Predicting copper toxicity to different earthworm species using a multicomponent Freundlich model. Environ. Sci. Technol. 2013, 47, 4796–4803. [Google Scholar] [CrossRef] [PubMed]
- Ng, C.; Losso, J.N.; Marshall, W.E.; Rao, R.M. Freundlich adsorption isotherms of agricultural by-product-based powdered activated carbons in a geosmin–water system. Bioresour. Technol. 2002, 85, 131–135. [Google Scholar] [CrossRef]
- Tzabar, N.; ter Brake, H. Adsorption isotherms and Sips models of nitrogen, methane, ethane, and propane on commercial activated carbons and polyvinylidene chloride. Adsorption 2016, 22, 901–914. [Google Scholar] [CrossRef] [Green Version]
- Melouki, R.; Ouadah, A.; Llewellyn, P.L. The CO2 adsorption behavior study on activated carbon synthesized from olive waste. J. CO2 Util. 2020, 42, 101292. [Google Scholar] [CrossRef]
- Özkaya, B. Adsorption and desorption of phenol on activated carbon and a comparison of isotherm models. J. Hazard. Mater. 2006, 129, 158–163. [Google Scholar] [CrossRef]
- Lagergren, S.K. About the theory of so-called adsorption of soluble substances. Sven. Vetenskapsakad. Handingarl 1898, 24, 1–39. [Google Scholar]
- Revellame, E.D.; Fortela, D.L.; Sharp, W.; Hernandez, R.; Zappi, M.E. Adsorption kinetic modeling using pseudo-first order and pseudo-second order rate laws: A review. Clean. Eng. Technol. 2020, 1, 100032. [Google Scholar] [CrossRef]
- Baharudin, L.; Severinsen, I.; Yip, A.C.; Golovko, V.B.; Watson, M.J. Kinetics and constraints of CO oxidation over hexameric copper nanocluster catalyst supported on carboxyl-functionalised MWCNT at high temperatures. Chem. Eng. J. 2020, 389, 124399. [Google Scholar] [CrossRef]
- Wu, F.-C.; Tseng, R.-L.; Juang, R.-S. Initial behavior of intraparticle diffusion model used in the description of adsorption kinetics. Chem. Eng. J. 2009, 153, 1–8. [Google Scholar] [CrossRef]
- Malash, G.F.; El-Khaiary, M.I. Piecewise linear regression: A statistical method for the analysis of experimental adsorption data by the intraparticle-diffusion models. Chem. Eng. J. 2010, 163, 256–263. [Google Scholar] [CrossRef]
- Chowdhury, S.; Mishra, R.; Saha, P.; Kushwaha, P. Adsorption thermodynamics, kinetics and isosteric heat of adsorption of malachite green onto chemically modified rice husk. Desalination 2011, 265, 159–168. [Google Scholar] [CrossRef]
- Saha, P.; Chowdhury, S. Insight into adsorption thermodynamics. Thermodynamics 2011, 16, 349–364. [Google Scholar]
- Qin, L.; Bao, S.; Zhang, Y.; Yuan, Y.; Luo, Y. Effect of two thermal activation methods on shale residue based geopolymer. Mater. Lett. 2021, 298, 130005. [Google Scholar] [CrossRef]
- Unuabonah, E.I.; Nöske, R.; Weber, J.; Günter, C.; Taubert, A. New micro/mesoporous nanocomposite material from low-cost sources for the efficient removal of aromatic and pathogenic pollutants from water. Beilstein J. Nanotechnol. 2019, 10, 119–131. [Google Scholar] [CrossRef] [PubMed]
- Unuabonah, E.I.; Agunbiade, F.O.; Alfred, M.O.; Adewumi, T.A.; Okoli, C.P.; Omorogie, M.O.; Akanbi, M.O.; Ofomaja, A.E.; Taubert, A. Facile Synthesis of New Amino-functionalized Agrogenic Hybrid Composite Clay Adsorbents for Phosphate Capture and Recovery from Water. J. Clean. Prod. 2017, 164, 652–663. [Google Scholar] [CrossRef]
- Unuabonah, E.I.; Kolawole, M.O.; Agunbiade, F.O.; Omorogie, M.O.; Koko, D.T.; Ugwuja, C.G.; Ugege, L.E.; Oyejide, N.E.; Günter, C.; Taubert, A. Novel Metal-doped Bacteriostatic Hybrid Clay Composites for Point-of-Use Disinfection of Water. J. Environ. Chem. Eng. 2017, 5, 2128–2141. [Google Scholar] [CrossRef]
- Ionescu, C.; Höck, V.; Simon, V. Effect of the temperature and the heating time on the composition of an illite-rich clay: An XRPD study. Stud. Universt. Babes-Bolyai Phys. 2011, 56, 70. [Google Scholar]
- Han, X.; Kulaots, I.; Jiang, X.; Suuberg, E.M. Review of oil shale semicoke and its combustion utilization. Fuel 2014, 126, 143–161. [Google Scholar] [CrossRef]
- Chen, Y.-H.; Lu, D.-L. Amine modification on kaolinites to enhance CO2 adsorption. J. Colloid Interface Sci. 2014, 436, 47–51. [Google Scholar] [CrossRef]
- Bustin, R.M.; Bustin, A.M.; Cui, A.; Ross, D.; Pathi, V.M. Impact of shale properties on pore structure and storage characteristics. In Proceedings of the SPE Shale Gas Production Conference, Fort Worth, TX, USA, 16 November 2008. [Google Scholar]
- Wang, X.; Zeng, W.; Zhang, H.; Li, D.; Tian, H.; Hu, X.; Wu, Q.; Xin, C.; Cao, X.; Liu, W. The dynamic CO2 adsorption of polyethylene polyamine-loaded MCM-41 before and after methoxypolyethylene glycol codispersion. RSC Adv. 2019, 9, 27050–27059. [Google Scholar] [CrossRef] [PubMed] [Green Version]
- Abdulkareem, F.A.; Radman, A.; Faugere, G.; Sathiavelu, S.; Irfan, S.A.; Padmanabhan, E. Petro-physical properties of Marcellus shale samples and their impact on CO2 adsorption: Equilibrium, kinetics, and empirical modeling study. J. Nat. Gas Sci. Eng. 2020, 81, 103423. [Google Scholar] [CrossRef]
- Liang, Z.; Wang, Q.; Dong, B.; Jiang, B.; Xing, F. Ion-triggered calcium hydroxide microcapsules for enhanced corrosion resistance of steel bars. RSC Adv. 2018, 8, 39536–39544. [Google Scholar] [CrossRef] [PubMed] [Green Version]
- Shahraki, B.; Mehrabi, B.; Dabiri, R. Thermal behavior of Zefreh dolomite mine (Central Iran). J. Min. Metall. B: Metall. 2009, 45, 35–44. [Google Scholar] [CrossRef]
- Nandiyanto, A.B.D.; Oktiani, R.; Ragadhita, R. How to read and interpret FTIR spectroscope of organic material. Indones. J. Sci. Technol. 2019, 4, 97–118. [Google Scholar] [CrossRef] [Green Version]
- Choudhary, R.; Koppala, S.; Swamiappan, S. Bioactivity studies of calcium magnesium silicate prepared from eggshell waste by sol–gel combustion synthesis. J. Asian Ceram. Soc. 2015, 3, 173–177. [Google Scholar] [CrossRef] [Green Version]
- Bahadur, A.; Shoaib, M.; Saeed, A.; Iqbal, S. FT-IR spectroscopic and thermal study of waterborne polyurethane-acrylate leather coatings using tartaric acid as an ionomer. e-Polymers 2016, 16, 463–474. [Google Scholar] [CrossRef]
- Williams, P.T.; Ahmad, N. Investigation of oil-shale pyrolysis processing conditions using thermogravimetric analysis. Appl. Energy 2000, 66, 113–133. [Google Scholar] [CrossRef]
- Cychosz, K.A.; Thommes, M. Progress in the physisorption characterization of nanoporous gas storage materials. Engineering 2018, 4, 559–566. [Google Scholar] [CrossRef]
- Zhai, Y.; Chuang, S.S. The nature of adsorbed carbon dioxide on immobilized amines during carbon dioxide capture from air and simulated flue gas. Energy Technol. 2017, 5, 510–519. [Google Scholar] [CrossRef]
- Liu, Z.; Teng, Y.; Zhang, K.; Chen, H.; Yang, Y. CO2 adsorption performance of different amine-based siliceous MCM-41 materials. J. Energy Chem. 2015, 24, 322–330. [Google Scholar] [CrossRef]
- Song, F.; Zhao, Y.; Ding, H.; Cao, Y.; Ding, J.; Bu, Y.; Zhong, Q. Capture of carbon dioxide by amine-loaded as-synthesized TiO2 nanotubes. Environ. Technol. 2013, 34, 1405–1410. [Google Scholar] [CrossRef] [PubMed]
- Xian, S.; Wu, Y.; Wu, J.; Wang, X.; Xiao, J. Enhanced dynamic CO2 adsorption capacity and CO2/CH4 selectivity on polyethylenimine-impregnated UiO-66. Ind. Eng. Chem. Res. 2015, 54, 11151–11158. [Google Scholar] [CrossRef]
- Czepirski, L.; Balys, M.R.; Komorowska-Czepirska, E. Some generalization of Langmuir adsorption isotherm. Internet J. Chem. 2000, 3, 1099–8292. [Google Scholar]
- Kalam, S.; Abu-Khamsin, S.A.; Kamal, M.S.; Patil, S. Surfactant adsorption isotherms: A review. ACS Omega 2021, 6, 32342–32348. [Google Scholar] [CrossRef]
- Kumar, K.V.; Gadipelli, S.; Howard, C.A.; Kwapinski, W.; Brett, D.J. Probing adsorbent heterogeneity using Toth isotherms. J. Mater. Chem. A 2021, 9, 944–962. [Google Scholar] [CrossRef]
- Gao, X.; Zhai, X.; Wang, Z.; Fu, F.; Li, W. Effective adsorption of phenol from aqueous solutions on activated semi-coke. J. Mater. Sci. 2015, 50, 4200–4208. [Google Scholar] [CrossRef]
- Myers, A. Thermodynamics of adsorption in porous materials. AIChE J. 2002, 48, 145–160. [Google Scholar] [CrossRef]
- Sun, R.; Shen, L.; Wang, S.; Bai, H. CO conversion over LaFeO3 perovskite during chemical looping processes: Influences of Ca-doping and oxygen species. Appl. Catal. B: Environ. 2022, 316, 121598. [Google Scholar] [CrossRef]
- Yen, P.-S.; Deveau, N.D.; Datta, R. Dissociative adsorption, dissolution, and diffusion of hydrogen in liquid metal membranes. A phenomenological model. Ind. Eng. Chem. Res. 2018, 57, 1607–1620. [Google Scholar] [CrossRef]


| Models | Equations | Parameters | References |
|---|---|---|---|
| Langmuir | Maximum adsorption capacity, qm, (mmol/g) | [25,26] | |
| Langmuir constant, kL, (1/MPa) | |||
| Freundlich | Adsorption potential, kF, | [27,28] | |
| Adsorption intensity, nF | |||
| Sips | Maximum adsorption capacity qm, (mmol/g) | [29,30] | |
| Sips constant, kS, (1/MPa) | |||
| Sips exponential, nS | |||
| Toth | Maximum adsorption capacity, qm, (mmol/g) | [25,31] | |
| Toth constant, kT, (1/MPa) | |||
| Toth exponential, nT | |||
| Pseudo-first-order | Equilibrium uptake, qe, (mmol/g) | [32,33] | |
| Pseudo-first-order constant, k1, (min−1) | |||
| Pseudo-second-order | Equilibrium uptake, qe, (mmol/g) | [33,34] | |
| Pseudo-second-order constant, k2, (g/mmol·min−1) | |||
| Intraparticle diffusion | Intraparticle diffusion constant, kI, (mmol/g·min−1) | [35,36] | |
| Intercept, C | |||
| Thermodynamics | Enthalpy change, ΔH, (kJ/mol) | [37,38] | |
| Entropy change, ΔS, (kJ/K) | |||
| Entropy change, ΔS, (kJ/K) |
| Samples | Surface Area (m2g−1) | Pore Volume (cm3g−1) | Average Pore Size (nm) |
|---|---|---|---|
| USQ 06 USQ 06_800C USQ 06_800C+DETA USQ 06_800C+EDA | 45.7949 47.9182 8.8351 10.0212 | 0.0146 0.0328 0.0336 0.0526 | 5.4257 11.1047 27.6622 20.9626 |
| USM 3 USM 3_800C USM 3_800C+DETA USM 3_800C+EDA | 31.2450 33.5156 2.6855 1.9170 | 0.0144 0.0229 0.0107 0.0052 | 3.0972 9.3728 35.6702 18.3595 |
| USM 05 USM 05_800C USM 05_800C+DETA USM 05_800C+EDA | 16.1194 25.6096 4.8760 3.1368 | 0.0128 0.0417 0.0144 0.0103 | 3.5720 18.0721 40.5760 24.0906 |
| US 6 US 6_800C US 6_800C+DETA US 6_800C+EDA | 4.7439 6.7906 3.8372 2.4535 | 0.0048 0.0303 0.0231 0.0029 | 6.0295 19.1820 24.0804 23.1902 |
| Samples | Amount of CO2 Adsorbed (μmol/g) | Signal Strength (mV) |
|---|---|---|
| USQ 06 | 40.55448 | 20,155.49 |
| USQ 06_800C | 11.97817 | 7382.51 |
| USQ 06_800C+DETA | 210.65113 | 123,862.34 |
| USQ 06_800C+EDA | 22.75174 | 18,739.77 |
| USM 3 | 71.57499 | 34,761.44 |
| USM 3 _800C | 9.44483 | 5525.20 |
| USM 3 _800C+DETA | 79.32970 | 47,200.97 |
| USM 3 _800C+EDA | 64.59448 | 42,244.61 |
| USM 05 | 21.1929 | 11,380.56 |
| USM 05_800C | 7.5368 | 4280.87 |
| USM 05_800C+DETA | 43.2398 | 24,862.82 |
| USM 05_800C+EDA | 15.3525 | 9206.34 |
| US 6 | 24.9426 | 16,312.39 |
| US 6_800C | 18.6674 | 10,646.61 |
| US 6_800C+DETA | 55.6178 | 33,722.83 |
| US 6_800C+EDA | 31.5258 | 18,715.74 |
| Sorbents | Amine Group | CO2 Sorption Capacity (mmol/g) | Operating Temperature (°C) | References |
|---|---|---|---|---|
| Spent shale | DETA | 3.011 | 70 | This work |
| Silica MCM 41 | DETA | 1.43 | 70 | [57] |
| Zeolite 13X | DETA | 1.054 | 75 | [14] |
| Zeolite Z4A | DETA | 0.135 | 75 | [14] |
| Spent shale | EDA | 2.117 | 70 | This work |
| Kaolinites | EDA | 1.495 | 25 | [45] |
| Silica MCM 41 | EDA | 1.19 | 70 | [57] |
| TiO2 nanotube | EDA | 1.09 | 30 | [58] |
| UiO-66 | PEI | 2.41 | 75 | [59] |
| Temperature | Isotherm Models | Parameters | USQ 06 | USQ 06_800C | USQ 06_800C+ DETA | USQ 06_800C+ EDA | USM 3 | USM 3_800C | USM 3_800C+ DETA | USM 3_800C+ EDA | USM 05 | USM 05_800C | USM 05_800C+ DETA | USM 05_800C+ EDA | US 6 | US 6_800C | US 6_800C+ DETA | US 6_800C+ EDA |
|---|---|---|---|---|---|---|---|---|---|---|---|---|---|---|---|---|---|---|
| 30 °C | Langmuir | qm kL R2 | 3.1468 0.1189 0.9809 | 2.994 0.161 0.984 | 4.2526 0.1012 0.9918 | 2.8950 0.1176 0.9797 | 2.3283 0.1820 0.9840 | 3.3388 0.1660 0.9924 | 5.6865 0.0600 0.9911 | 4.7109 0.0750 0.9892 | 2.3251 0.0585 0.9947 | 1.2833 0.2169 0.9989 | 1.2873 0.2396 0.9949 | 1.2072 0.0183 0.9967 | 3.4617 0.0315 0.9928 | 3.3317 0.0458 0.9976 | 0.8891 0.3975 0.9994 | 1.1713 0.1905 0.9831 |
| Freundlich | kF nF R2 | 0.3720 0.6960 0.9646 | 0.474 0.625 0.965 | 0.4398 0.7164 0.9728 | 0.4996 0.6057 0.9556 | 0.4092 0.6006 0.9633 | 0.4233 0.6756 0.9802 | 0.3469 1.2291 0.9845 | 0.3572 1.2811 0.9775 | 0.1451 0.7891 0.9922 | 0.2825 0.5172 0.9938 | 0.3087 0.4935 0.9981 | 0.2323 0.5505 0.9981 | 0.1124 0.8820 0.9909 | 0.1640 0.8186 0.9976 | 0.3128 0.3797 0.9988 | 0.2284 0.6057 0.9699 | |
| Sips | qm kS nS R2 | 1.6585 0.1224 1.9802 0.9993 | 1.8823 0.1712 1.7426 0.9968 | 2.5264 0.1312 1.4686 0.9973 | 1.8152 0.1781 1.8803 0.9986 | 1.4872 0.1863 1.8205 0.9988 | 2.0460 0.1531 1.5566 0.9995 | 2.4544 0.0926 1.6207 0.9989 | 2.1537 0.1031 1.7304 0.9998 | 1.3076 0.0859 1.3001 0.9959 | 1.0192 0.2304 1.3430 0.9999 | 3.8935 0.0080 1.9929 0.9981 | 3.6484 0.0651 1.5502 0.9982 | 1.1479 0.0658 1.5028 0.9963 | 5.4818 0.0289 0.9184 0.9977 | 1.0948 0.3377 0.7622 0.9997 | 0.7276 0.1282 2.2823 0.9981 | |
| Toth | qm kT nT R2 | 1.4672 0.1887 0.1814 0.9962 | 1.6056 0.2045 0.1804 0.9999 | 1.8955 0.1719 0.2072 0.9998 | 1.6299 0.2161 0.2165 0.9975 | 1.3316 0.2166 0.2314 0.9985 | 1.7244 0.1832 0.2883 0.9993 | 1.8103 0.1553 0.1450 0.9990 | 1.8086 0.1590 0.2241 0.9965 | 0.7322 0.1485 0.0857 0.9986 | 0.9551 0.2212 0.5585 0.9999 | 2.5651 0.2959 0.1133 0.9980 | 3.3605 0.0800 0.1922 0.9982 | 0.6787 0.1425 0.0031 0.9993 | 15.660 0.0117 0.1929 0.9977 | 1.1875 0.5347 0.1626 0.9997 | 0.6738 0.2055 0.1242 0.9998 | |
| 50 °C | Langmuir | qm kL R2 | 2.7916 0.1268 0.9688 | 2.9096 0.1548 0.9830 | 5.2520 0.1375 0.9983 | 3.6873 0.1372 0.9844 | 2.2180 0.1925 0.9791 | 2.8348 0.2203 0.9945 | 4.4594 0.1142 0.9825 | 6.8522 0.0889 0.9764 | 0.9700 0.2322 0.9733 | 1.7003 0.0969 0.9366 | 1.6110 0.5076 0.9965 | 0.8750 0.0206 0.9787 | 0.9399 0.2048 0.9757 | 1.4498 0.1352 0.9444 | 5.6694 0.5199 0.9979 | 1.4087 0.7411 0.9986 |
| Freundlich | kF nF R2 | 0.3481 0.6865 0.9684 | 0.4434 0.6350 0.9644 | 0.5793 0.6623 0.9577 | 0.5029 0.6610 0.9680 | 0.3897 0.6015 0.9667 | 0.4489 0.6238 0.9812 | 0.3315 0.8577 0.9687 | 0.3315 0.8577 0.9687 | 0.2245 0.5048 0.9564 | 0.1670 0.7273 0.9205 | 0.6616 0.3314 0.9994 | 0.1786 1.0687 0.9768 | 0.1949 0.5357 0.9599 | 0.2008 0.6449 0.9255 | 0.1190 0.9039 0.9982 | 0.7238 0.2524 0.9950 | |
| Sips | qm kS nS R2 | 1.4371 0.1026 2.3015 0.9979 | 1.7763 0.1617 1.8012 0.9973 | 2.4413 0.1419 1.8780 0.9974 | 2.1656 0.1484 1.7827 0.9976 | 1.3823 0.1741 1.9547 0.9979 | 1.9437 0.1892 1.4939 0.9997 | 2.3584 0.1229 1.9011 0.9985 | 2.1712 0.0627 2.1510 0.9973 | 0.6120 0.0918 2.9886 0.9996 | 0.7087 0.0238 3.6559 0.9995 | 4.1557 0.0161 2.9373 0.9994 | 1.7473 0.0517 1.8211 0.9877 | 0.5750 0.0977 2.7519 0.9994 | 0.7228 0.0375 3.4513 0.9975 | 4.7208 0.0025 1.9137 0.9982 | 1.2901 0.6912 1.3975 0.9990 | |
| Toth | qm kT nT R2 | 1.2991 0.1961 0.1163 0.9943 | 1.5259 0.2023 0.1700 0.9997 | 2.1001 0.1951 0.1489 0.9989 | 1.8420 0.1947 0.1790 0.9992 | 1.2443 0.2188 0.1924 0.9977 | 1.7199 0.1981 0.3951 0.9991 | 2.0341 0.1856 0.1710 0.9974 | 1.7881 0.1598 0.0656 0.9930 | 0.5918 0.2189 0.0032 0.9999 | 0.6845 0.1866 0.0468 0.9740 | 3.6442 0.2226 0.1027 0.9993 | 1.1819 0.1445 0.2125 0.9911 | 0.5471 0.2180 0.1217 0.9808 | 0.7004 0.1966 0.2017 0.9870 | 4.0584 0.0030 0.8642 0.9980 | 1.2766 0.5161 0.6396 0.9990 | |
| 70 °C | Langmuir | qm kL R2 | 2.0506 0.1624 0.9629 | 2.6476 0.1640 0.9717 | 7.7024 0.1847 0.9934 | 4.5870 0.1786 0.9880 | 2.5956 0.2213 0.9848 | 3.1293 0.2661 0.9803 | 21.5549 0.12045 0.9787 | 8.7837 0.0912 0.9787 | 0.7137 0.6861 0.9995 | 1.0172 0.2604 0.9980 | 2.6067 0.8830 0.9832 | 3.0228 0.0902 0.9981 | 0.4319 0.4179 0.9983 | 0.9626 0.3412 0.9932 | 3.9817 0.9871 0.9996 | 4.0993 1.9553 0.9977 |
| Freundlich | kF nF R2 | 0.6335 0.3210 0.9371 | 0.4224 0.6257 0.9486 | 0.6651 0.7534 0.9851 | 0.5419 0.6924 0.9745 | 0.3150 0.6875 0.9698 | 0.3630 0.6984 0.9945 | 0.4237 0.9545 0.9760 | 0.3564 0.8809 0.9725 | 0.1379 0.5511 0.9967 | 0.2606 0.4748 0.9915 | 0.5031 0.8249 0.9927 | 0.2954 0.4165 0.9975 | 0.1577 0.3669 0.9922 | 0.3049 0.4108 0.9835 | 0.3735 0.3971 0.9973 | 0.1539 0.0277 0.9979 | |
| Sips | qm kS nS R2 | 1.1501 0.1152 1.4378 0.9974 | 1.5684 0.1449 1.0682 0.9948 | 4.0715 0.1166 1.5432 0.9998 | 2.5937 0.1374 1.7088 0.9988 | 1.4499 0.1350 1.7917 0.9981 | 1.6667 0.1220 1.9135 0.9971 | 3.6019 0.0467 2.1491 0.9972 | 2.5032 0.0604 2.1114 0.9980 | 0.6570 0.1954 1.0788 0.9995 | 0.7898 0.2578 1.5107 0.9999 | 5.0901 0.0019 1.8175 0.9927 | 3.5758 0.0784 1.0663 0.9981 | 0.3587 0.3783 1.5924 1 | 0.7327 0.2627 1.9436 0.9987 | 2.9451 0.1069 1.1750 0.9999 | 2.6598 0.3492 1.0305 0.9979 | |
| Toth | qm kT nT R2 | 1.0642 0.2137 0.1174 0.9931 | 1.3868 0.2079 0.1019 0.9991 | 3.2494 0.1604 0.2539 0.9991 | 2.1644 0.1840 0.1993 0.9992 | 1.2215 0.1871 0.1685 0.9989 | 1.4096 0.1868 0.1225 0.9988 | 2.8616 0.1454 0.0714 0.9986 | 2.0524 0.1549 0.0921 0.9917 | 0.6222 0.1922 0.8181 0.9996 | 0.7510 0.2462 0.4822 1 | 4.2664 0.0360 0.102 0.9919 | 4.6906 0.0662 0.7288 0.9982 | 0.3507 0.3264 0.5039 0.9999 | 0.7083 0.2739 0.3436 0.9990 | 2.4255 0.1239 0.5726 0.9999 | 1.2324 0.0132 0.0155 0.9977 |
| Temperature | Kinetic Models | Parameters | USQ 06 | USQ 06_800C | USQ 06_800C+ DETA | USQ 06_800C+ EDA | USM 3 | USM 3_800C | USM 3_800C+ DETA | USM 3_800C+ EDA | USM 05 | USM 05_800C | USM 05_800C+ DETA | USM 05_800C+ EDA | US 6 | US 6_800C | US 6_800C+ DETA | US 6_800C+ EDA |
|---|---|---|---|---|---|---|---|---|---|---|---|---|---|---|---|---|---|---|
| 30 °C | Pseudo-First-Order | k1 qe R2 | 0.0034 1.9211 0.9755 | 0.0033 1.9653 0.9860 | 0.0025 2.6050 0.9952 | 0.0037 1.9793 0.9841 | 0.0028 1.1726 0.9729 | 0.0017 2.4869 0.9965 | 0.0016 3.2340 0.9928 | 0.0018 2.8463 0.9840 | 0.0096 0.7225 0.9967 | 0.0088 0.9297 0.9999 | 0.0110 0.9412 0.9952 | 0.0058 0.9625 0.9983 | 0.0020 1.5237 0.9923 | 0.0072 1.0955 0.9998 | 0.0132 0.6784 0.9957 | 0.0066 0.8639 0.9793 |
| Pseudo-Second-Order | K2 qe R2 | 0.0007 3.0374 0.9720 | 0.0008 2.9446 0.9824 | 0.0004 4.1958 0.9939 | 0.0009 2.9782 0.9792 | 0.0006 3.4843 0.9819 | 0.0003 4.1026 0.9957 | 0.0002 5.6202 0.9921 | 0.0002 4.8769 0.9828 | 0.0089 0.9621 0.9948 | 0.0055 1.3012 0.9989 | 0.0082 1.2299 0.9895 | 0.0028 1.4576 0.9980 | 0.0004 2.6893 0.9922 | 0.0034 1.6044 0.9989 | 0.0168 0.8396 0.9993 | 0.0035 1.3123 0.9753 | |
| Intraparticle diffusion | KI C R2 | 0.0782 −0.1597 0.9408 | 0.0752 −0.1152 0.9614 | 0.0903 −0.1931 0.9650 | 0.0815 −0.1259 0.9527 | 0.0667 −0.0499 0.9512 | 0.0706 −0.1774 0.9641 | 0.0879 −0.2468 0.9473 | 0.0841 −0.2412 0.9381 | 0.0412 0.0086 0.9844 | 0.0539 −0.0053 0.9930 | 0.0554 0.0225 0.9680 | 0.0469 −0.0202 0.9893 | 0.0400 −0.0521 0.9487 | 0.0593 −0.0219 0.9904 | 0.0406 0.0352 0.9779 | 0.0451 −0.0213 0.9583 | |
| 50 °C | Pseudo-First-Order | k1 qe R2 | 0.0032 1.6707 0.9726 | 0.0021 2.2510 0.9835 | 0.0040 2.5635 0.9836 | 0.0044 2.1302 0.9920 | 0.0044 1.3809 0.9754 | 0.0038 1.7495 0.9984 | 0.0035 2.5677 0.9836 | 0.0024 2.7355 0.9812 | 0.0089 0.6958 0.9847 | 0.0121 0.7432 0.9965 | 0.0101 1.4417 0.9866 | 0.0205 1.1881 0.9985 | 0.0081 0.6618 0.9857 | 0.0103 0.7686 0.9699 | 0.0115 1.0083 0.9991 | 0.0071 0.9224 0.9519 |
| Pseudo-Second-Order | K2 qe R2 | 0.0008 2.5822 0.9669 | 0.0004 3.6919 0.9810 | 0.0007 3.8523 0.9786 | 0.0011 3.0945 0.9873 | 0.0018 1.9386 0.9665 | 0.0012 2.4936 0.9957 | 0.0006 3.9648 0.9798 | 0.0003 4.5572 0.9789 | 0.0069 0.9933 0.9789 | 0.0113 0.9777 0.9925 | 0.0048 1.9034 0.9795 | 0.0213 1.3595 0.9969 | 0.0062 0.9655 0.9808 | 0.0085 1.0343 0.9668 | 0.0089 1.2783 0.9960 | 0.0034 1.4222 0.9757 | |
| Intraparticle diffusion | KI C R2 | 0.0651 −0.1381 0.9347 | 0.0710 −0.1709 0.9464 | 0.1098 −0.1742 0.9520 | 0.0932 −0.1154 0.9648 | 0.0574 0.0484 0.9355 | 0.0698 0.0731 0.9781 | 0.1052 0.1987 0.9517 | 0.0946 0.2534 0.9414 | 0.0407 −0.0082 0.9634 | 0.0467 0.0155 0.9763 | 0.0822 0.0306 0.9568 | 0.0729 0.1396 0.8987 | 0.0376 −0.0123 0.9652 | 0.0452 0.0066 0.9230 | 0.0583 0.0433 0.9705 | 0.0508 −0.0367 0.9181 | |
| 70 °C | Pseudo-First-Order | k1 qe R2 | 0.0044 1.1997 0.9601 | 0.0039 1.6097 0.9840 | 0.0020 5.1254 0.9919 | 0.0031 2.8421 0.9903 | 0.0028 1.6461 0.9860 | 0.0032 1.7326 0.9879 | 0.0028 4.0597 0.9987 | 0.0013 4.5482 0.9792 | 0.0079 0.4917 0.9990 | 0.0105 0.7432 0.9996 | 0.0097 1.7214 0.9938 | 0.0051 1.6364 0.9942 | 0.0137 0.3384 1 | 0.0136 0.7103 0.9957 | 0.0056 1.9045 0.9975 | 0.0017 3.4086 0.9941 |
| Pseudo-Second-Order | K2 qe R2 | 0.0021 1.6850 0.9688 | 0.0013 2.2954 0.9766 | 0.0014 8.7602 0.9909 | 0.0004 4.4892 0.9877 | 0.0007 2.6131 0.9830 | 0.0009 2.5937 0.9834 | 0.0003 6.4875 0.9980 | 0.0001 8.3234 0.9785 | 0.0089 0.7021 0.9989 | 0.0088 1.0168 0.9979 | 0.0042 2.2220 0.9890 | 0.0015 2.4831 0.9954 | 0.0324 0.4287 0.9986 | 0.0163 0.8819 0.9876 | 0.0015 2.7832 0.9963 | 0.0002 5.9639 0.9943 | |
| Intraparticle diffusion | KI C R2 | 0.0503 −0.0509 0.9120 | 0.0655 −0.0754 0.9492 | 0.1577 −0.3949 0.9482 | 0.1090 −0.2194 0.9590 | 0.0611 −0.1293 0.9524 | 0.0660 −0.1169 0.9588 | 0.1451 −0.2690 0.97147 | 0.1076 −0.3512 0.9221 | 0.0276 −0.0056 0.9950 | 0.0459 0.0028 0.9907 | 0.0932 0.0557 0.9647 | 0.0758 −0.0482 0.9867 | 0.0216 0.0129 0.9780 | 0.0429 0.0404 0.9417 | 0.0902 −0.0484 0.9849 | 0.0767 −0.0958 0.9518 |
| Thermodynamic Parameters | USQ 06 | USQ 06_800C | USQ 06_800C+ DETA | USQ 06_800C+ EDA | USM 3 | USM 3_800C | USM 3_800C+ DETA | USM 3_800C+ EDA | USM 05 | USM 05_800C | USM 05_800C+ DETA | USM 05_800C+ EDA | US 6 | US 6_800C | US 6_800C+ DETA | US 6_800C+ EDA |
|---|---|---|---|---|---|---|---|---|---|---|---|---|---|---|---|---|
| ΔG° (kJ/mol)@ 30 °C ΔG° (kJ/mol)@ 50 °C ΔG° (kJ/mol)@ 70 °C | −123.42 −121.83 −120.24 | −127.66 −131.87 −136.09 | −131.75 −157.36 −182.97 | −128.07 −145.20 −162.33 | −113.12 −117.81 −122.50 | −125.56 −129.43 −133.30 | −127.82 −151.78 −175.74 | −127.36 −141.69 −156.02 | −76.69 −67.16 −57.63 | −85.26 −84.28 −83.29 | −92.00 −118.46 −144.92 | −83.58 −107.11 −130.64 | −78.62 −60.41 −42.20 | −90.30 −86.39 −82.48 | −73.52 −106.51 −139.50 | −69.38 −95.58 −121.78 |
| ΔH° (kJ/mol) | −147.53 | −63.83 | 426.29 | 327.50 | −42.03 | −66.94 | 235.16 | 89.72 | −221.05 | −100.23 | 308.82 | 272.90 | −354.46 | −149.48 | 256.22 | 131.41 |
| ΔS° (kJ/K) | −0.079 | −0.210 | 1.280 | 0.856 | −0.234 | 0.1934 | 1.197 | 0.7164 | −0.476 | −0.049 | 1.322 | 1.176 | −0.910 | −0.195 | 1.649 | 1.309 |
Publisher’s Note: MDPI stays neutral with regard to jurisdictional claims in published maps and institutional affiliations. |
© 2022 by the authors. Licensee MDPI, Basel, Switzerland. This article is an open access article distributed under the terms and conditions of the Creative Commons Attribution (CC BY) license (https://creativecommons.org/licenses/by/4.0/).
Share and Cite
Balogun, A.I.; Padmanabhan, E.; Abdulkareem, F.A.; Gebretsadik, H.T.; Wilfred, C.D.; Soleimani, H.; Viswanathan, P.M.; Wee, B.S.; Yusuf, J.Y. Optimization of CO2 Sorption onto Spent Shale with Diethylenetriamine (DETA) and Ethylenediamine (EDA). Materials 2022, 15, 8293. https://doi.org/10.3390/ma15238293
Balogun AI, Padmanabhan E, Abdulkareem FA, Gebretsadik HT, Wilfred CD, Soleimani H, Viswanathan PM, Wee BS, Yusuf JY. Optimization of CO2 Sorption onto Spent Shale with Diethylenetriamine (DETA) and Ethylenediamine (EDA). Materials. 2022; 15(23):8293. https://doi.org/10.3390/ma15238293
Chicago/Turabian StyleBalogun, Asmau Iyabo, Eswaran Padmanabhan, Firas Ayad Abdulkareem, Haylay Tsegab Gebretsadik, Cecilia Devi Wilfred, Hassan Soleimani, Prasanna Mohan Viswanathan, Boon Siong Wee, and Jemilat Yetunde Yusuf. 2022. "Optimization of CO2 Sorption onto Spent Shale with Diethylenetriamine (DETA) and Ethylenediamine (EDA)" Materials 15, no. 23: 8293. https://doi.org/10.3390/ma15238293