
Welding Defect and Mechanical Properties of Nanosecond Laser Cleaning 6005A Aluminum Alloy
Abstract
:1. Introduction
2. Materials and Methods
2.1. Material
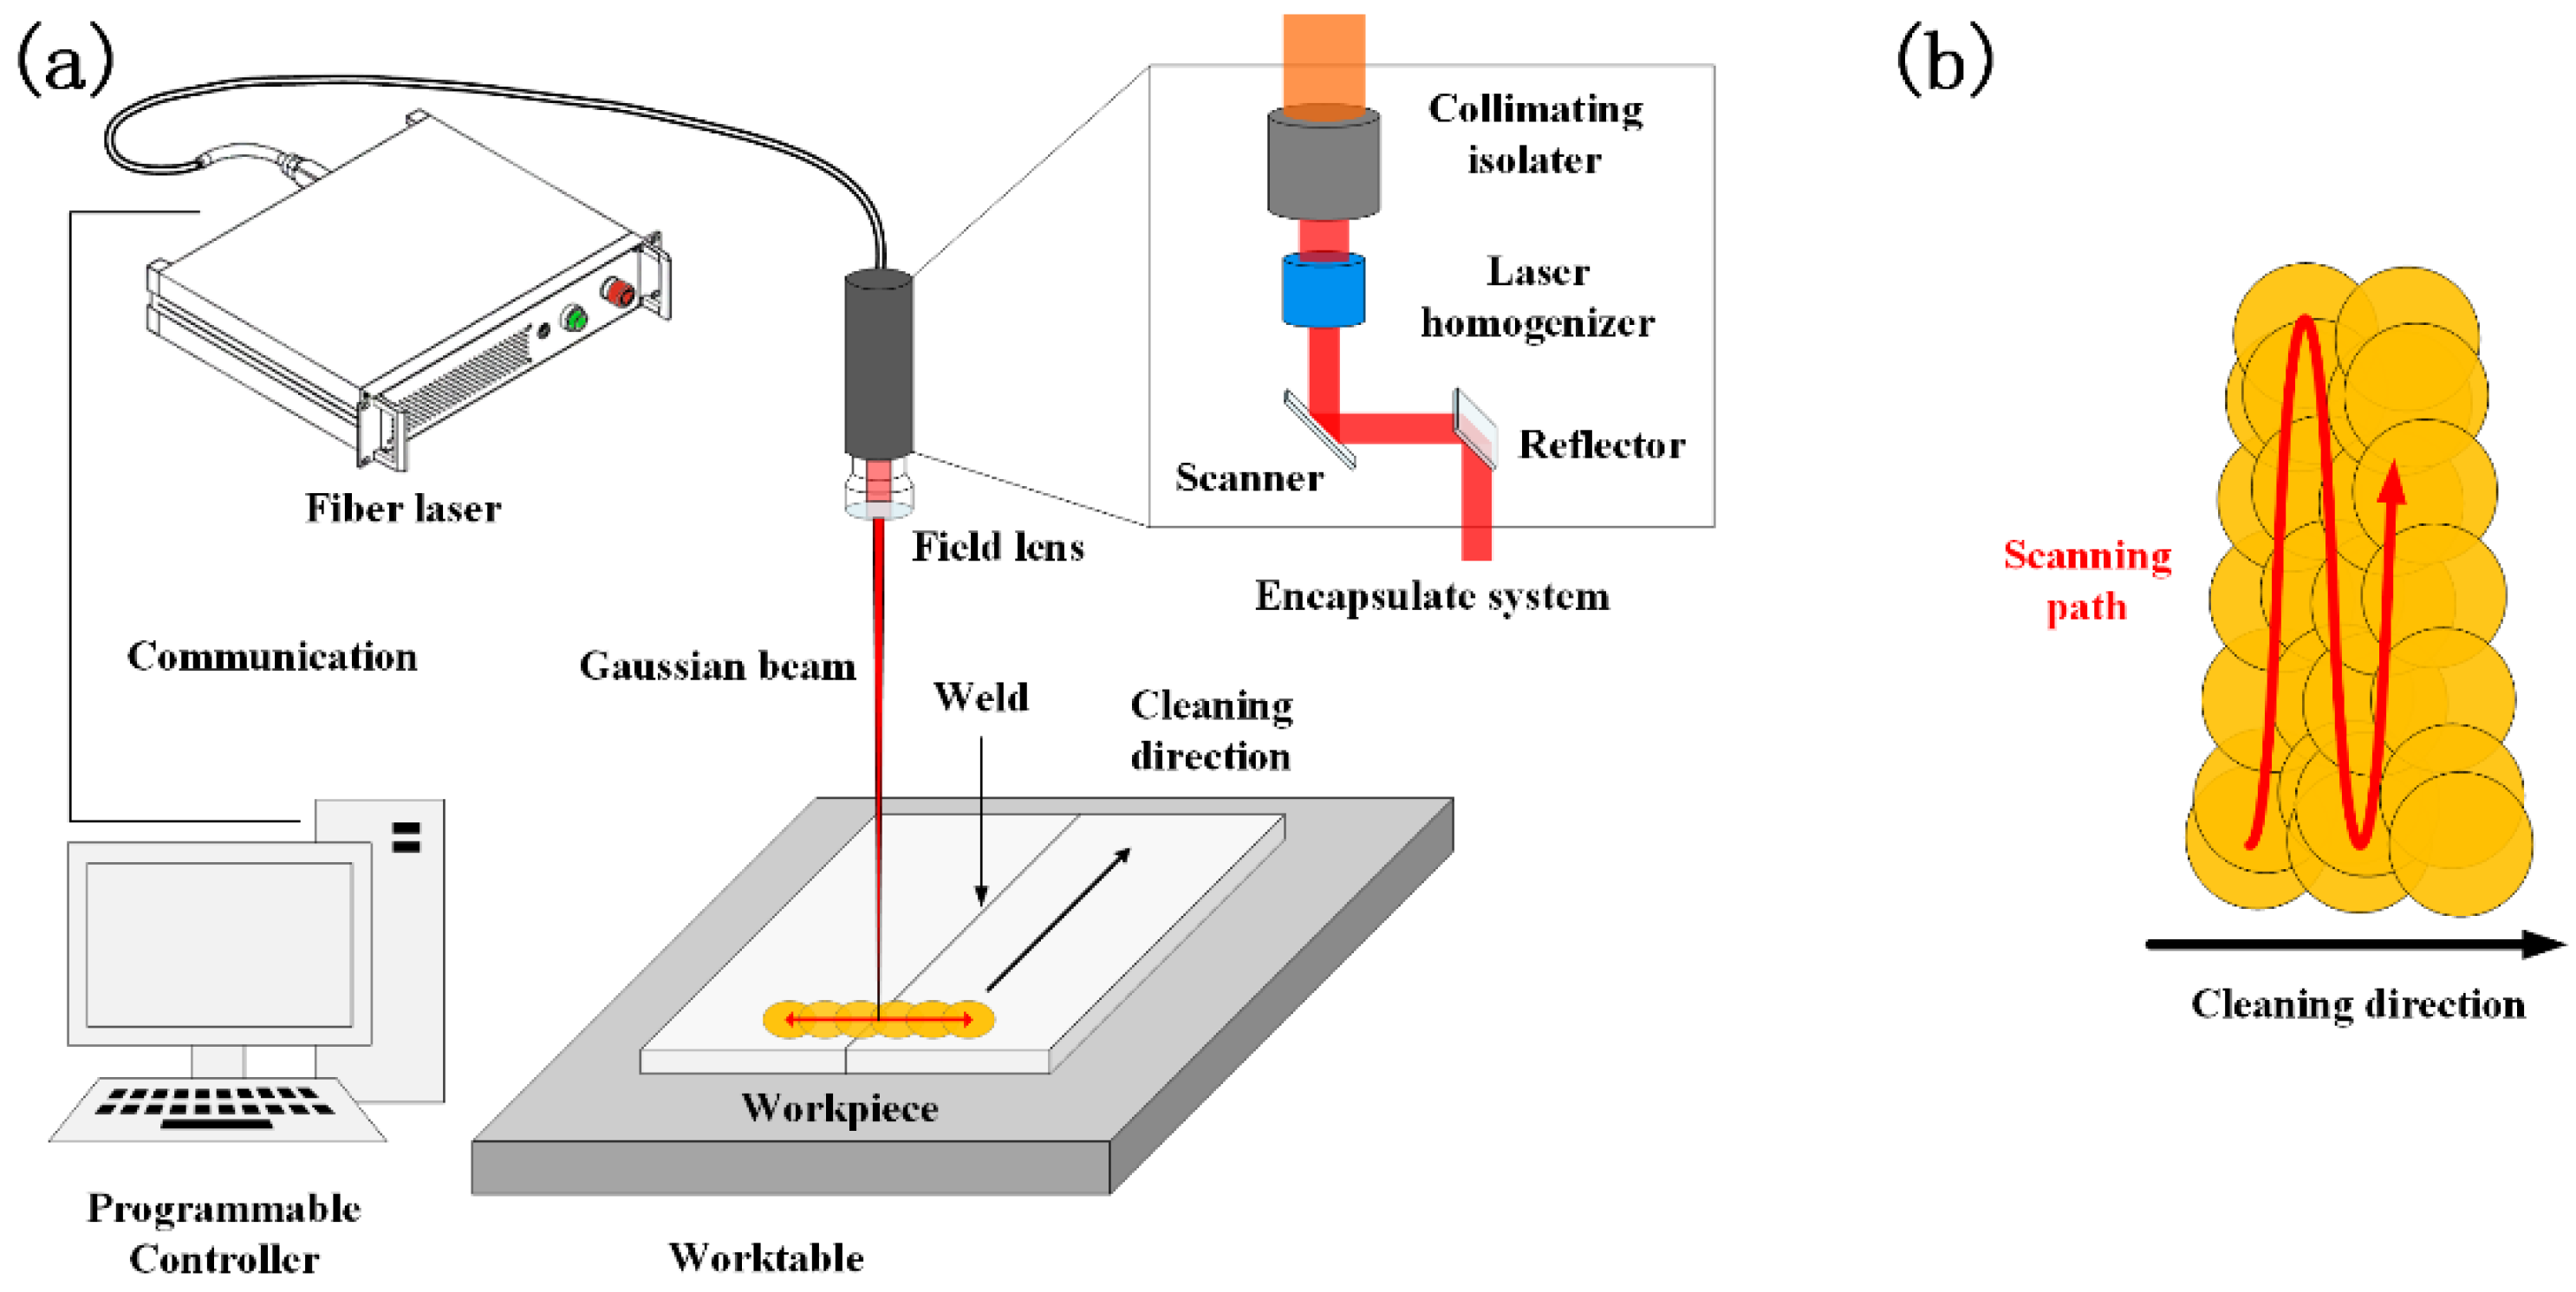
2.2. Equipment
2.3. Laser Processing Procedure
2.4. Welding Quality Assessment
3. Results
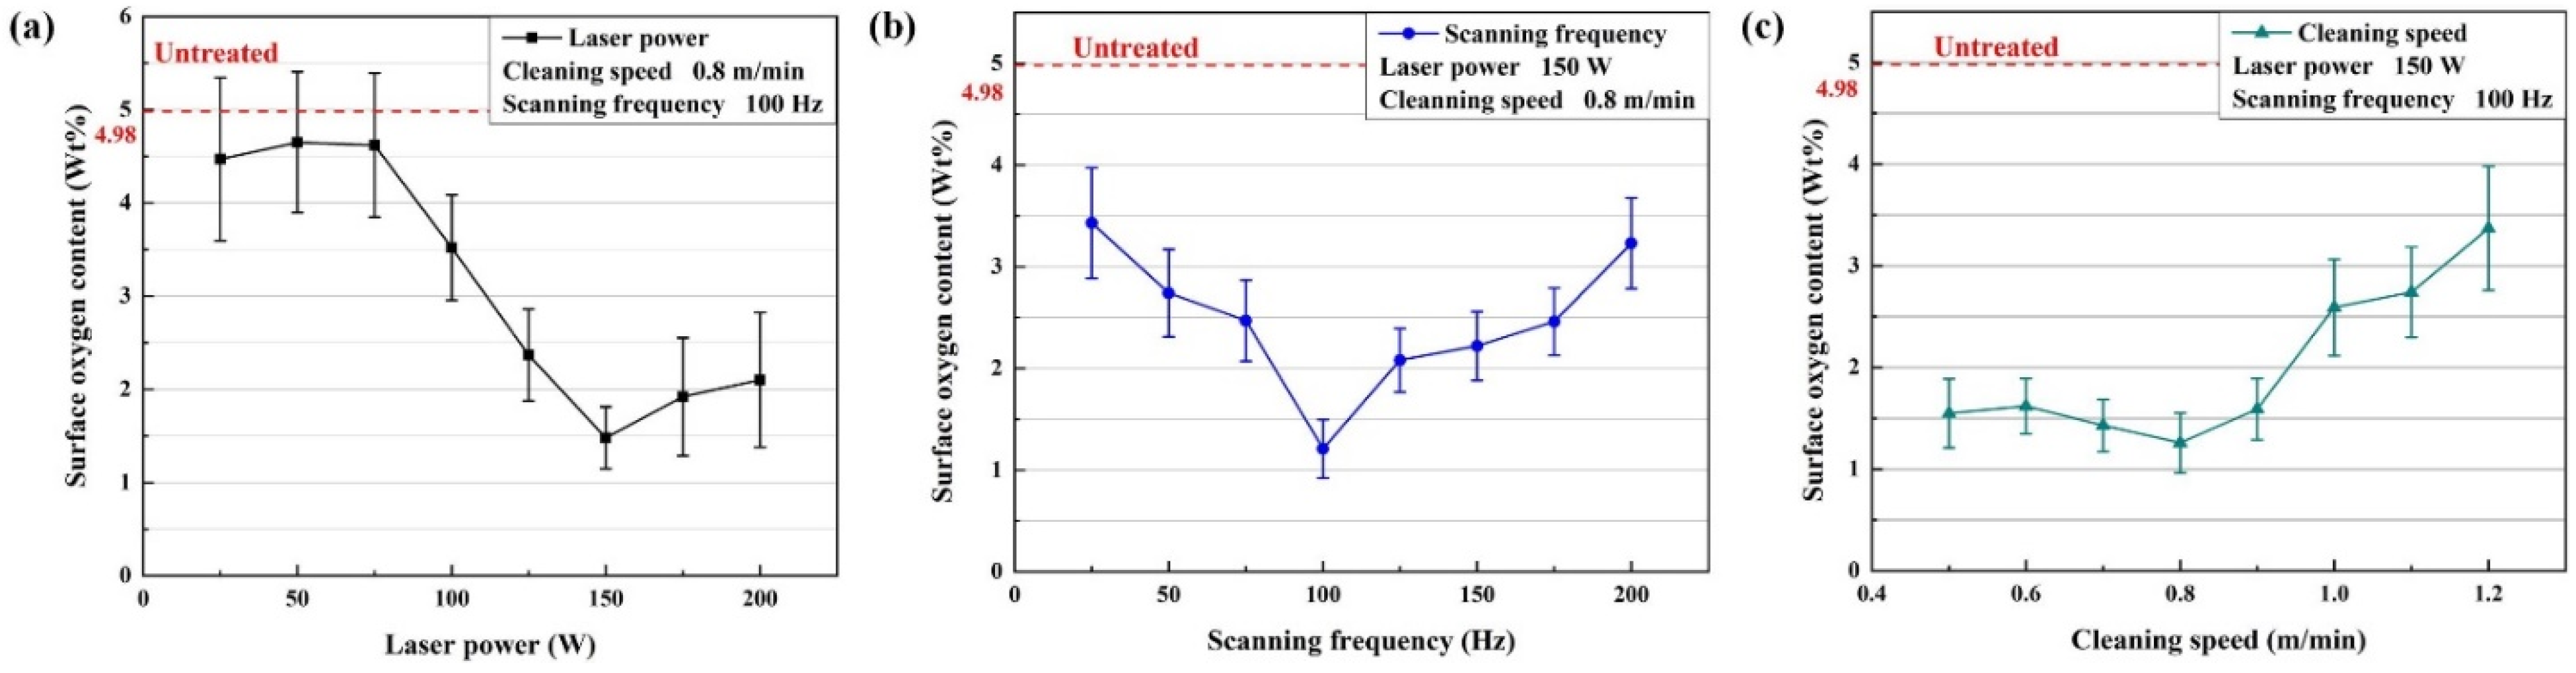
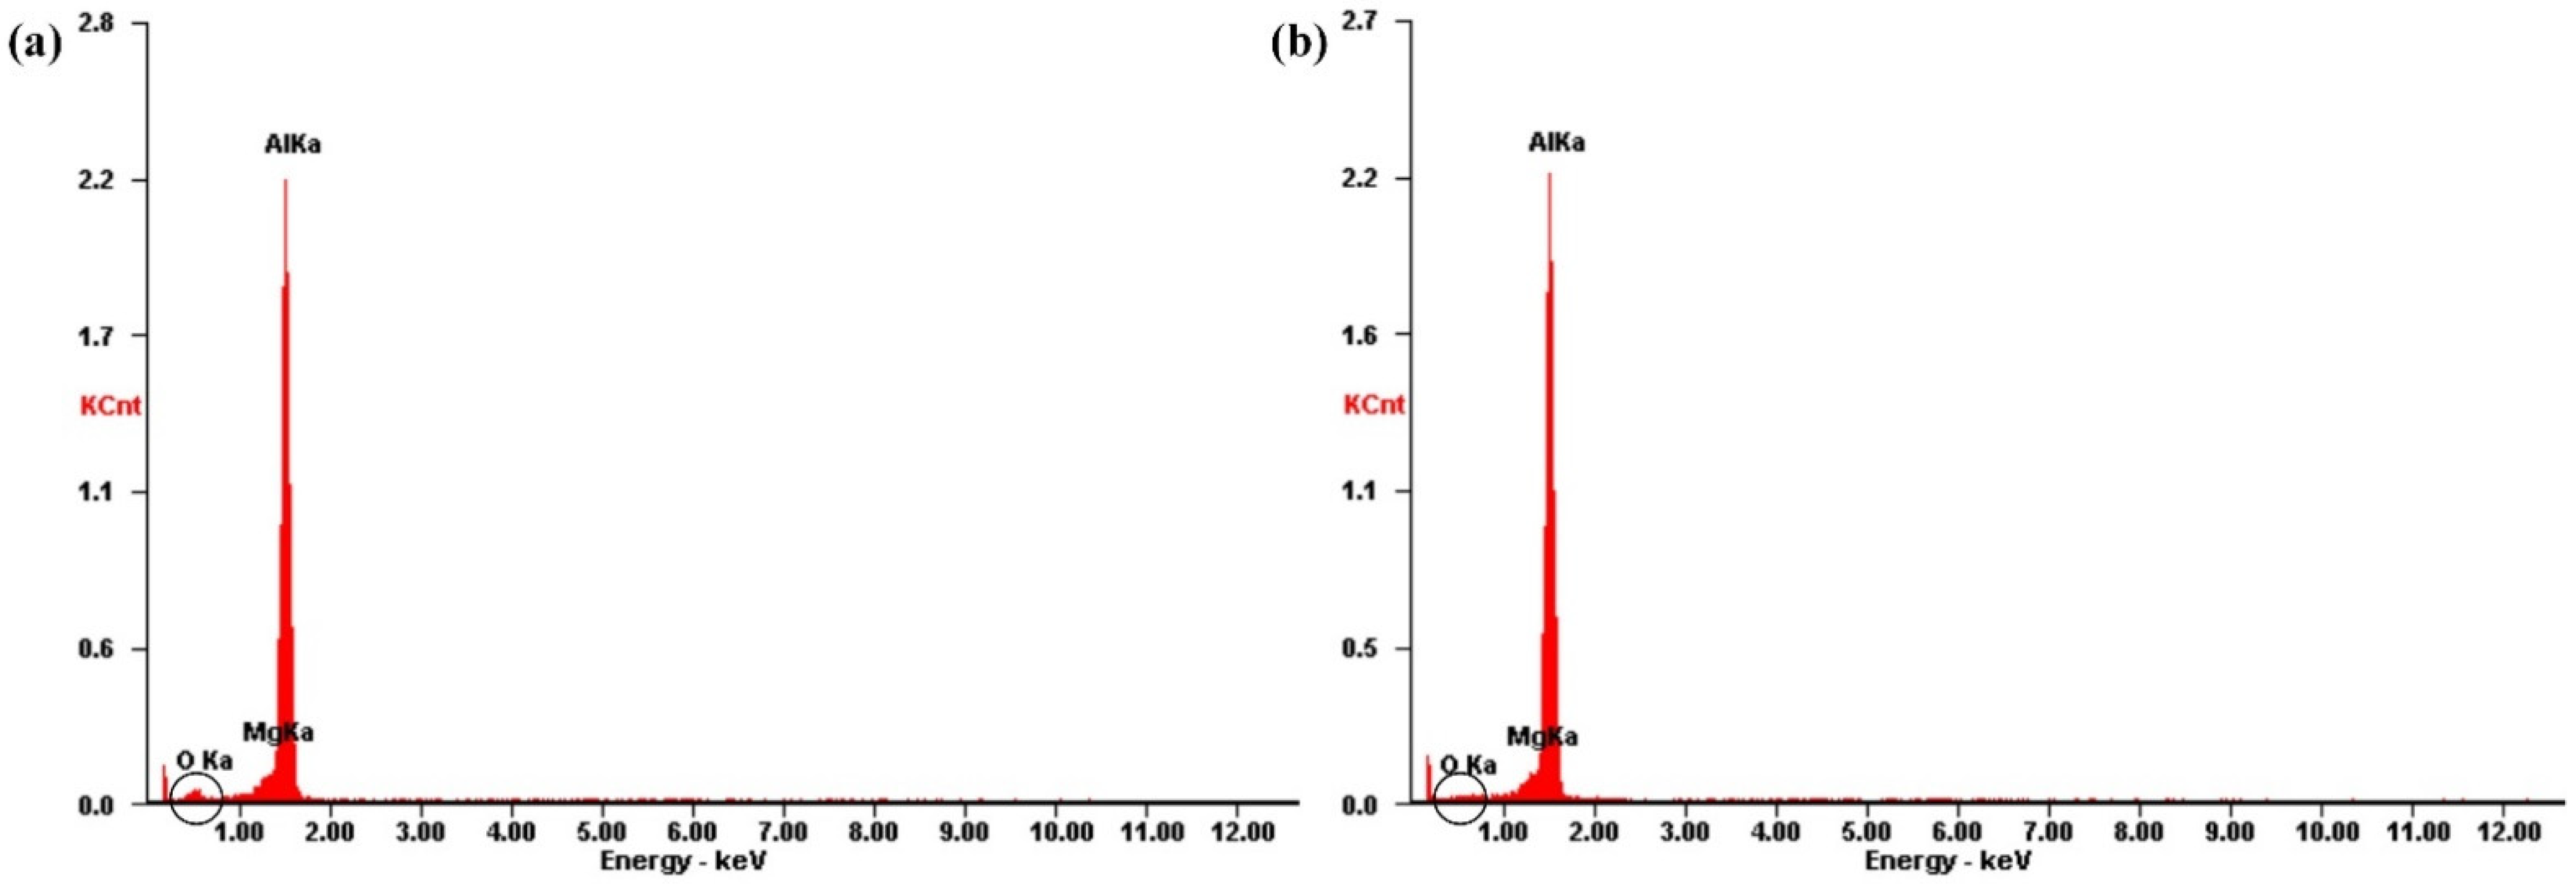
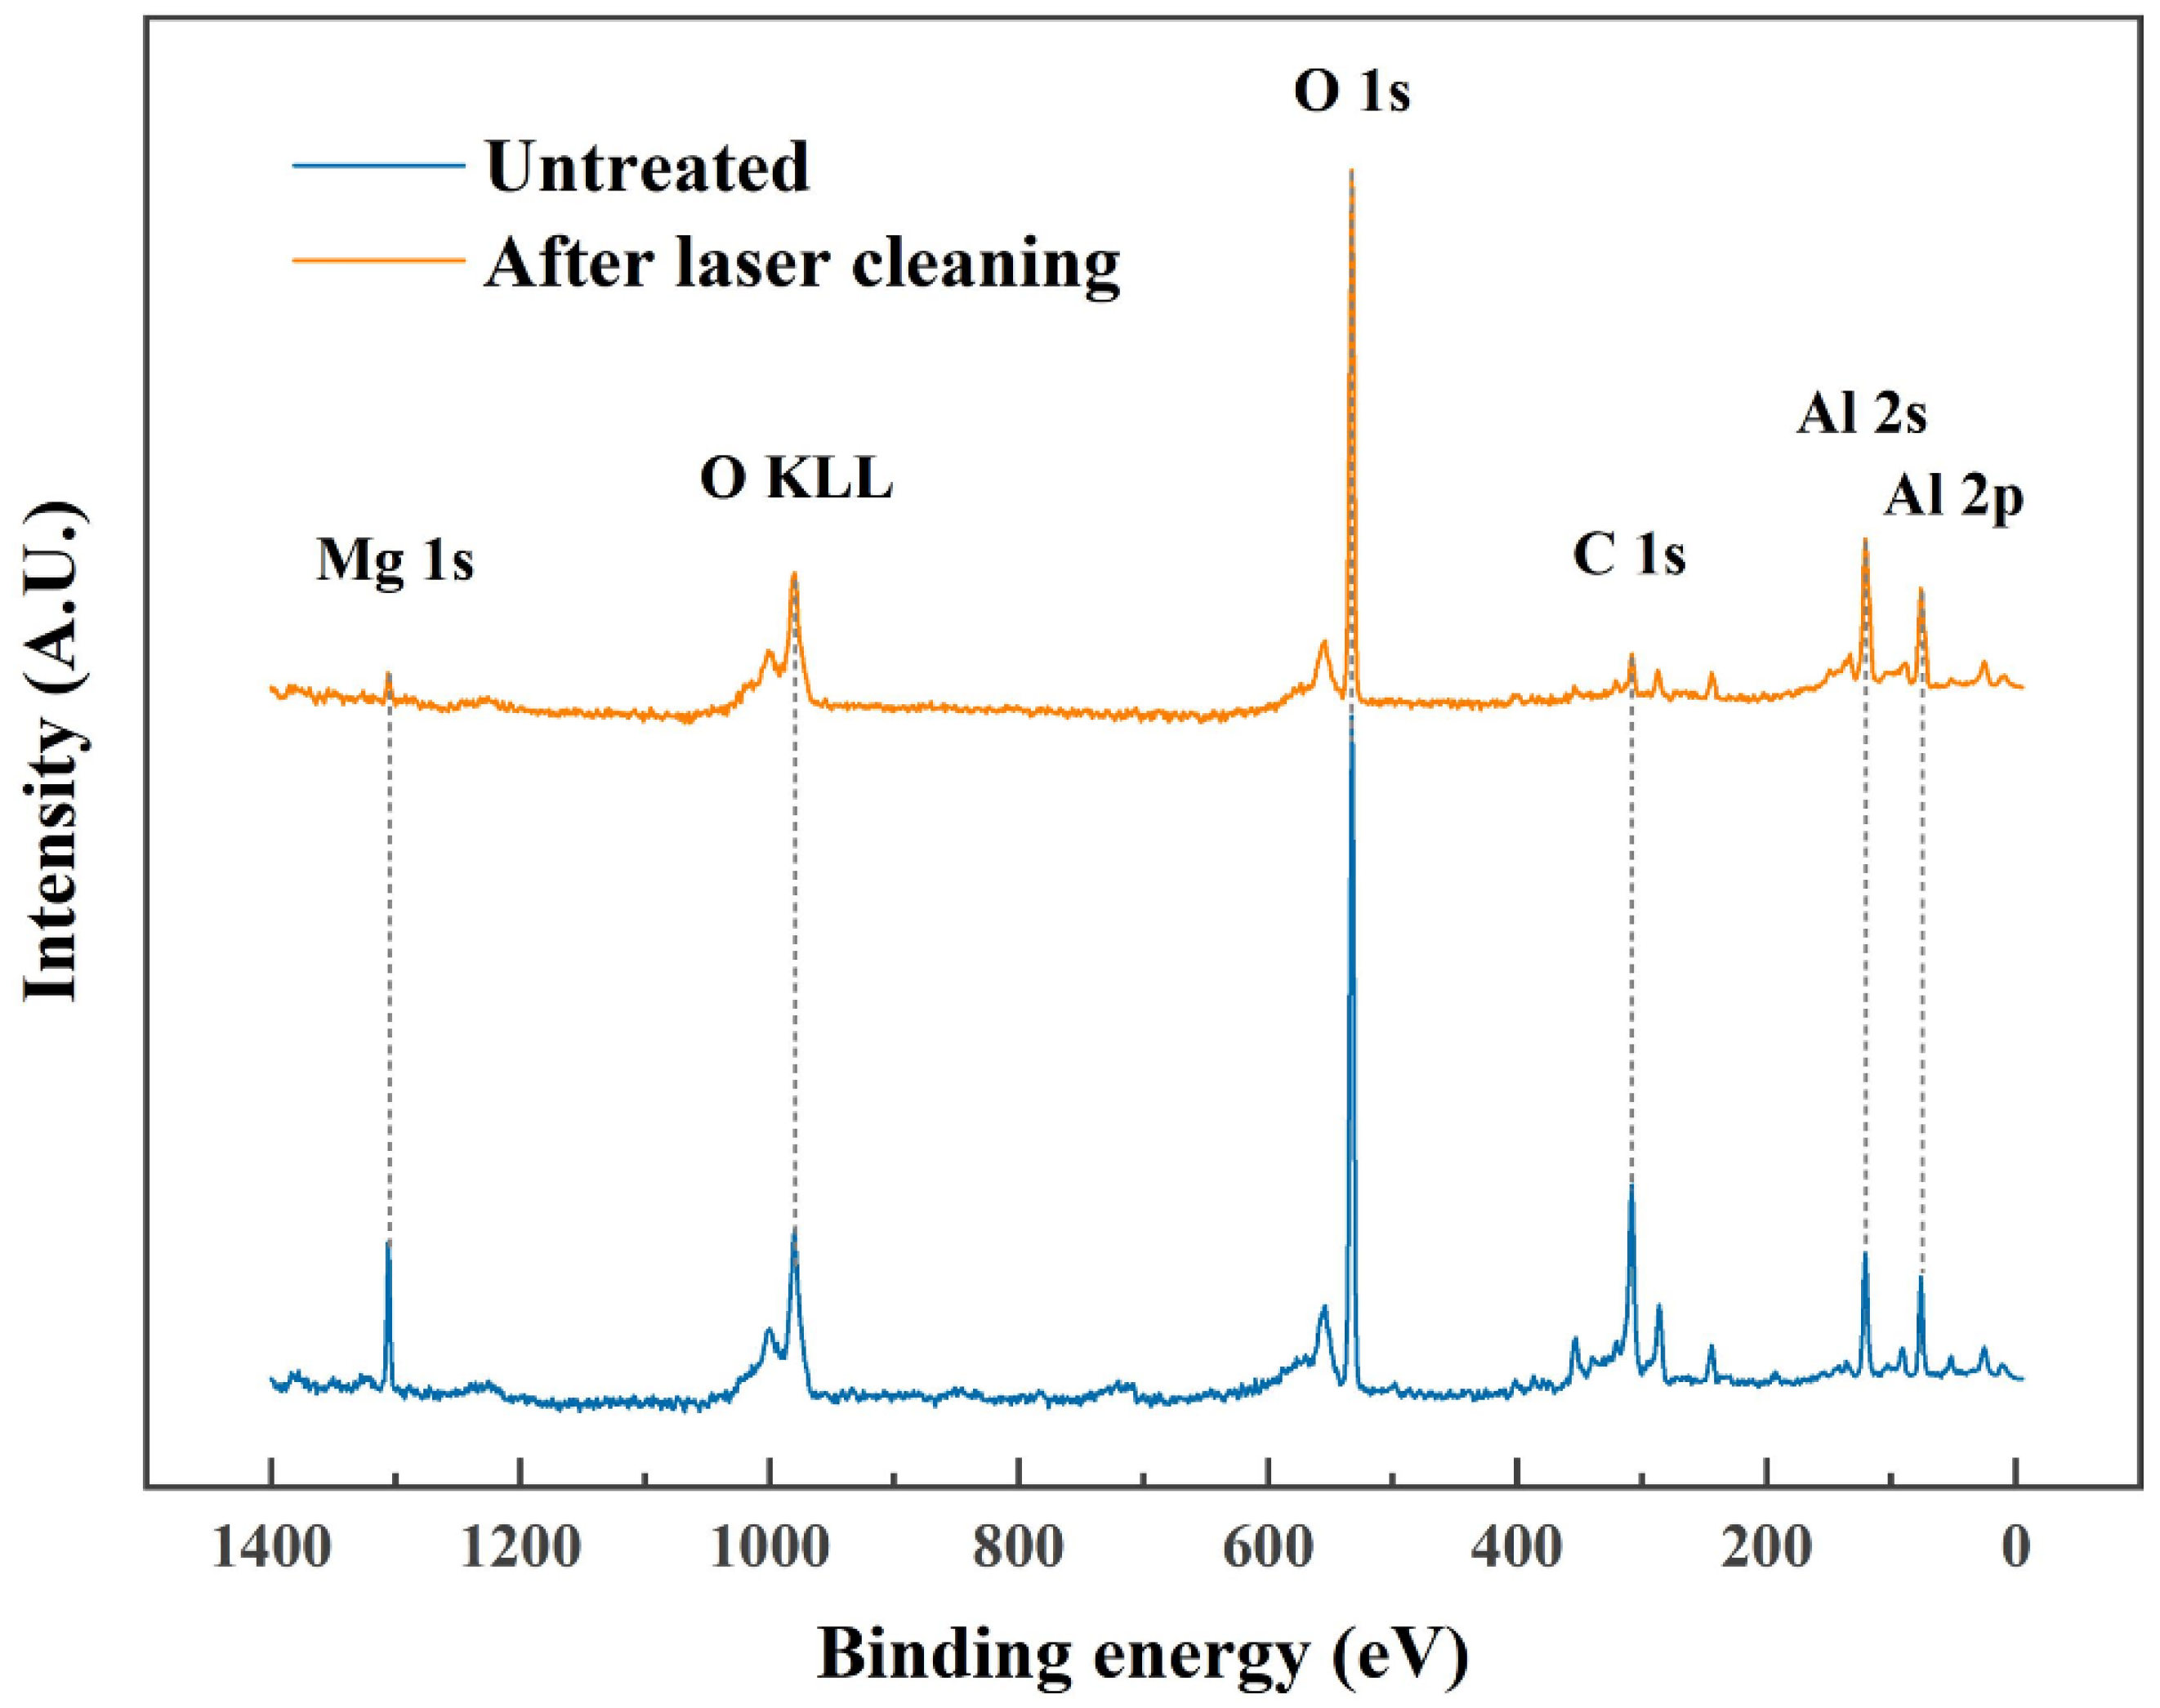
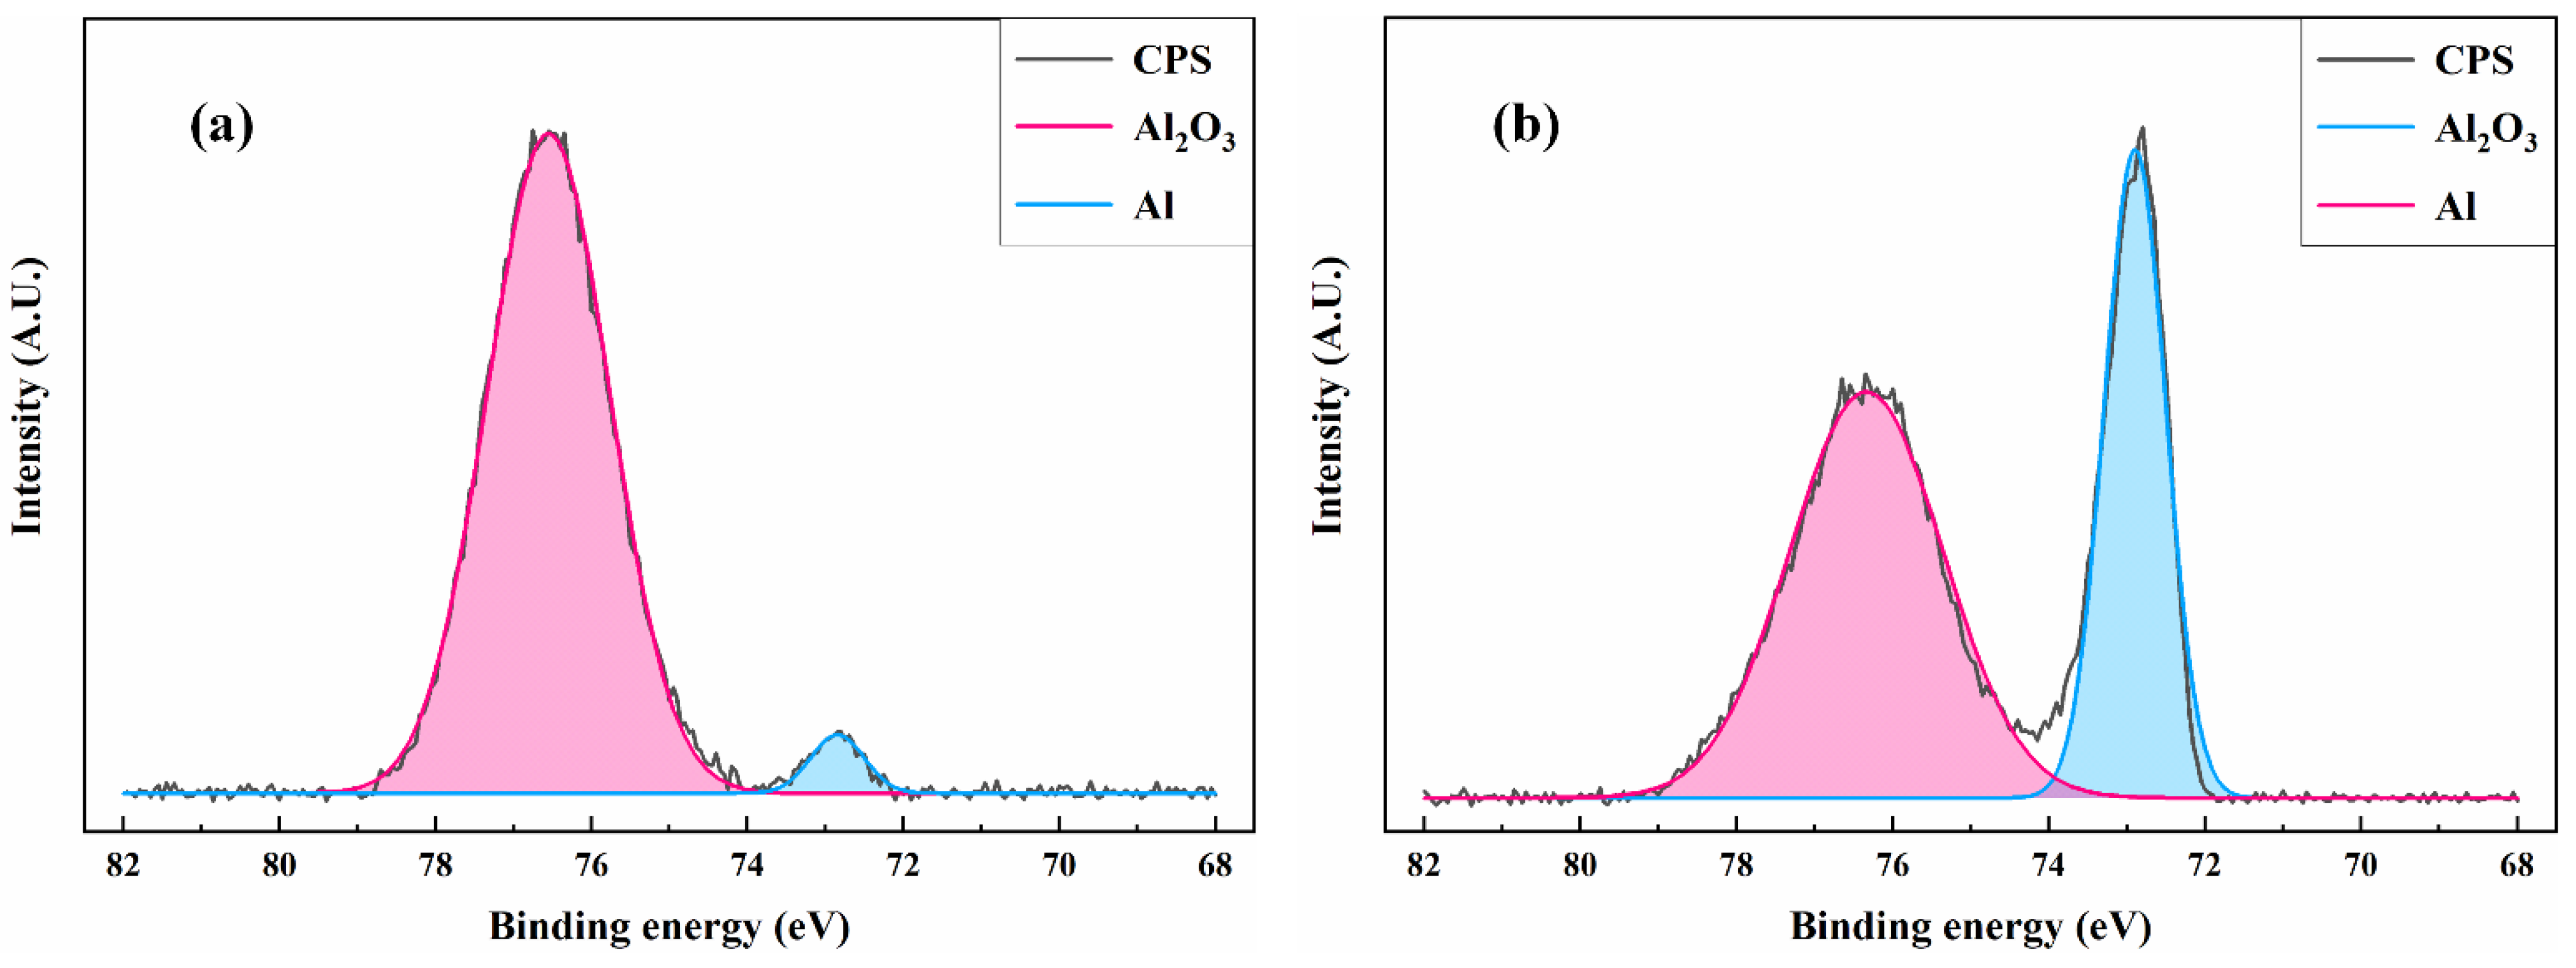
3.1. Surface Oxygen Content
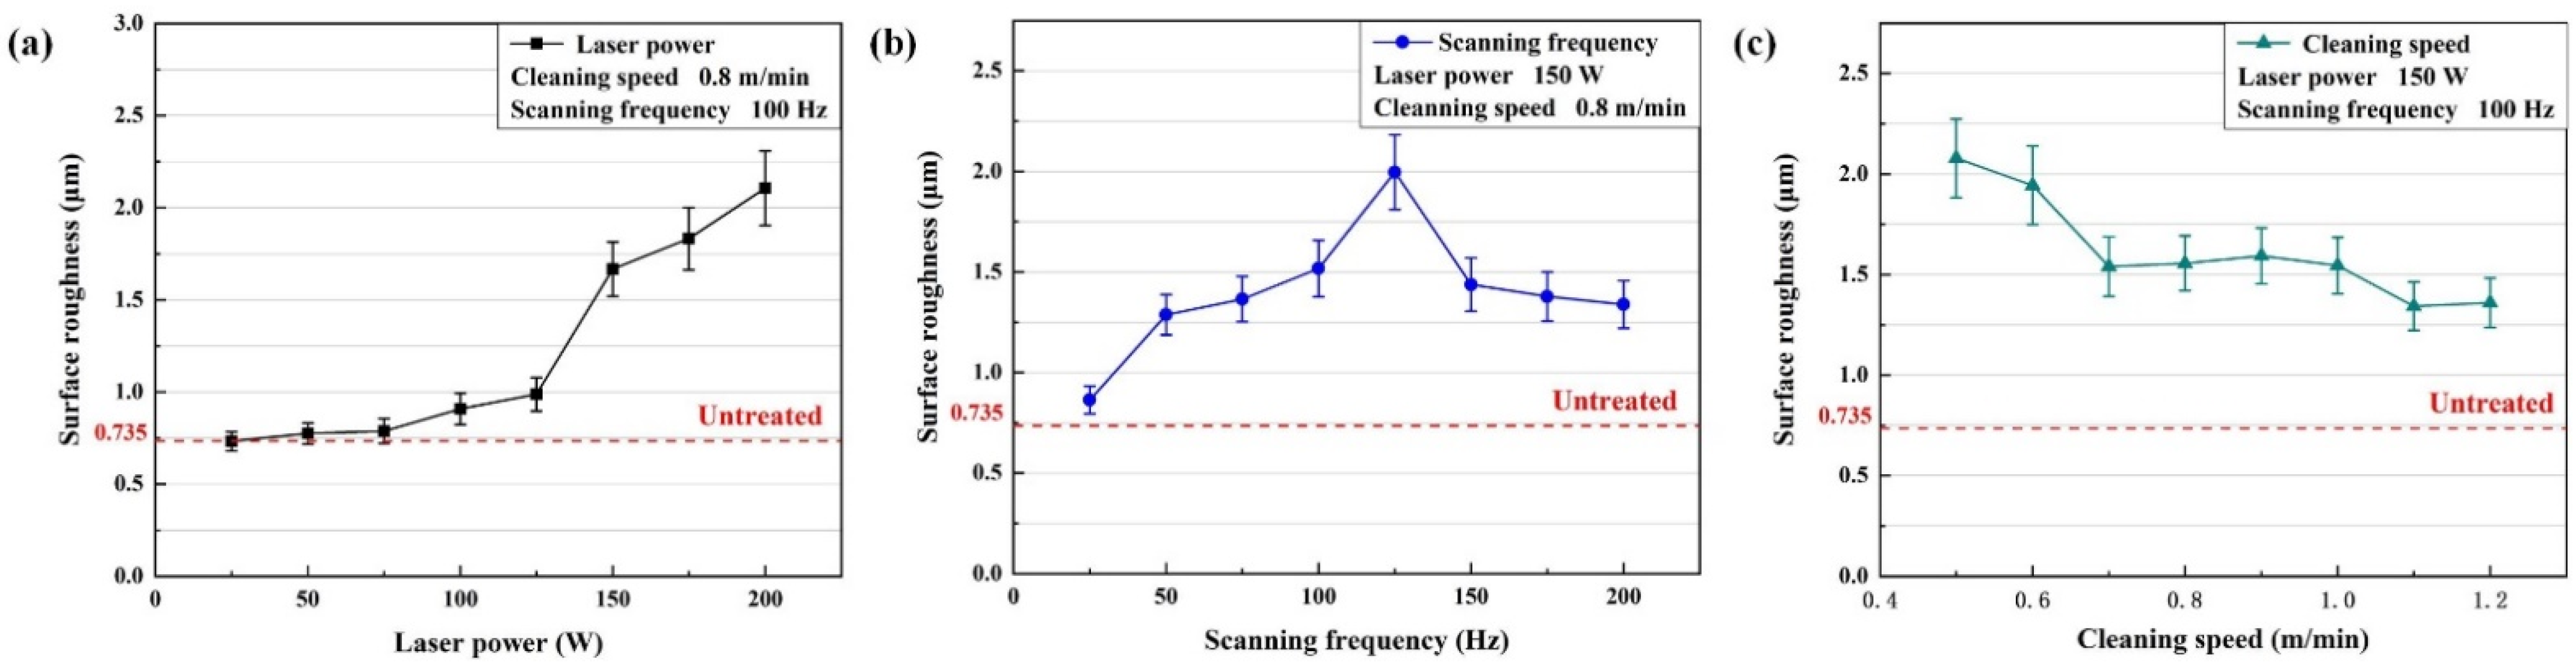
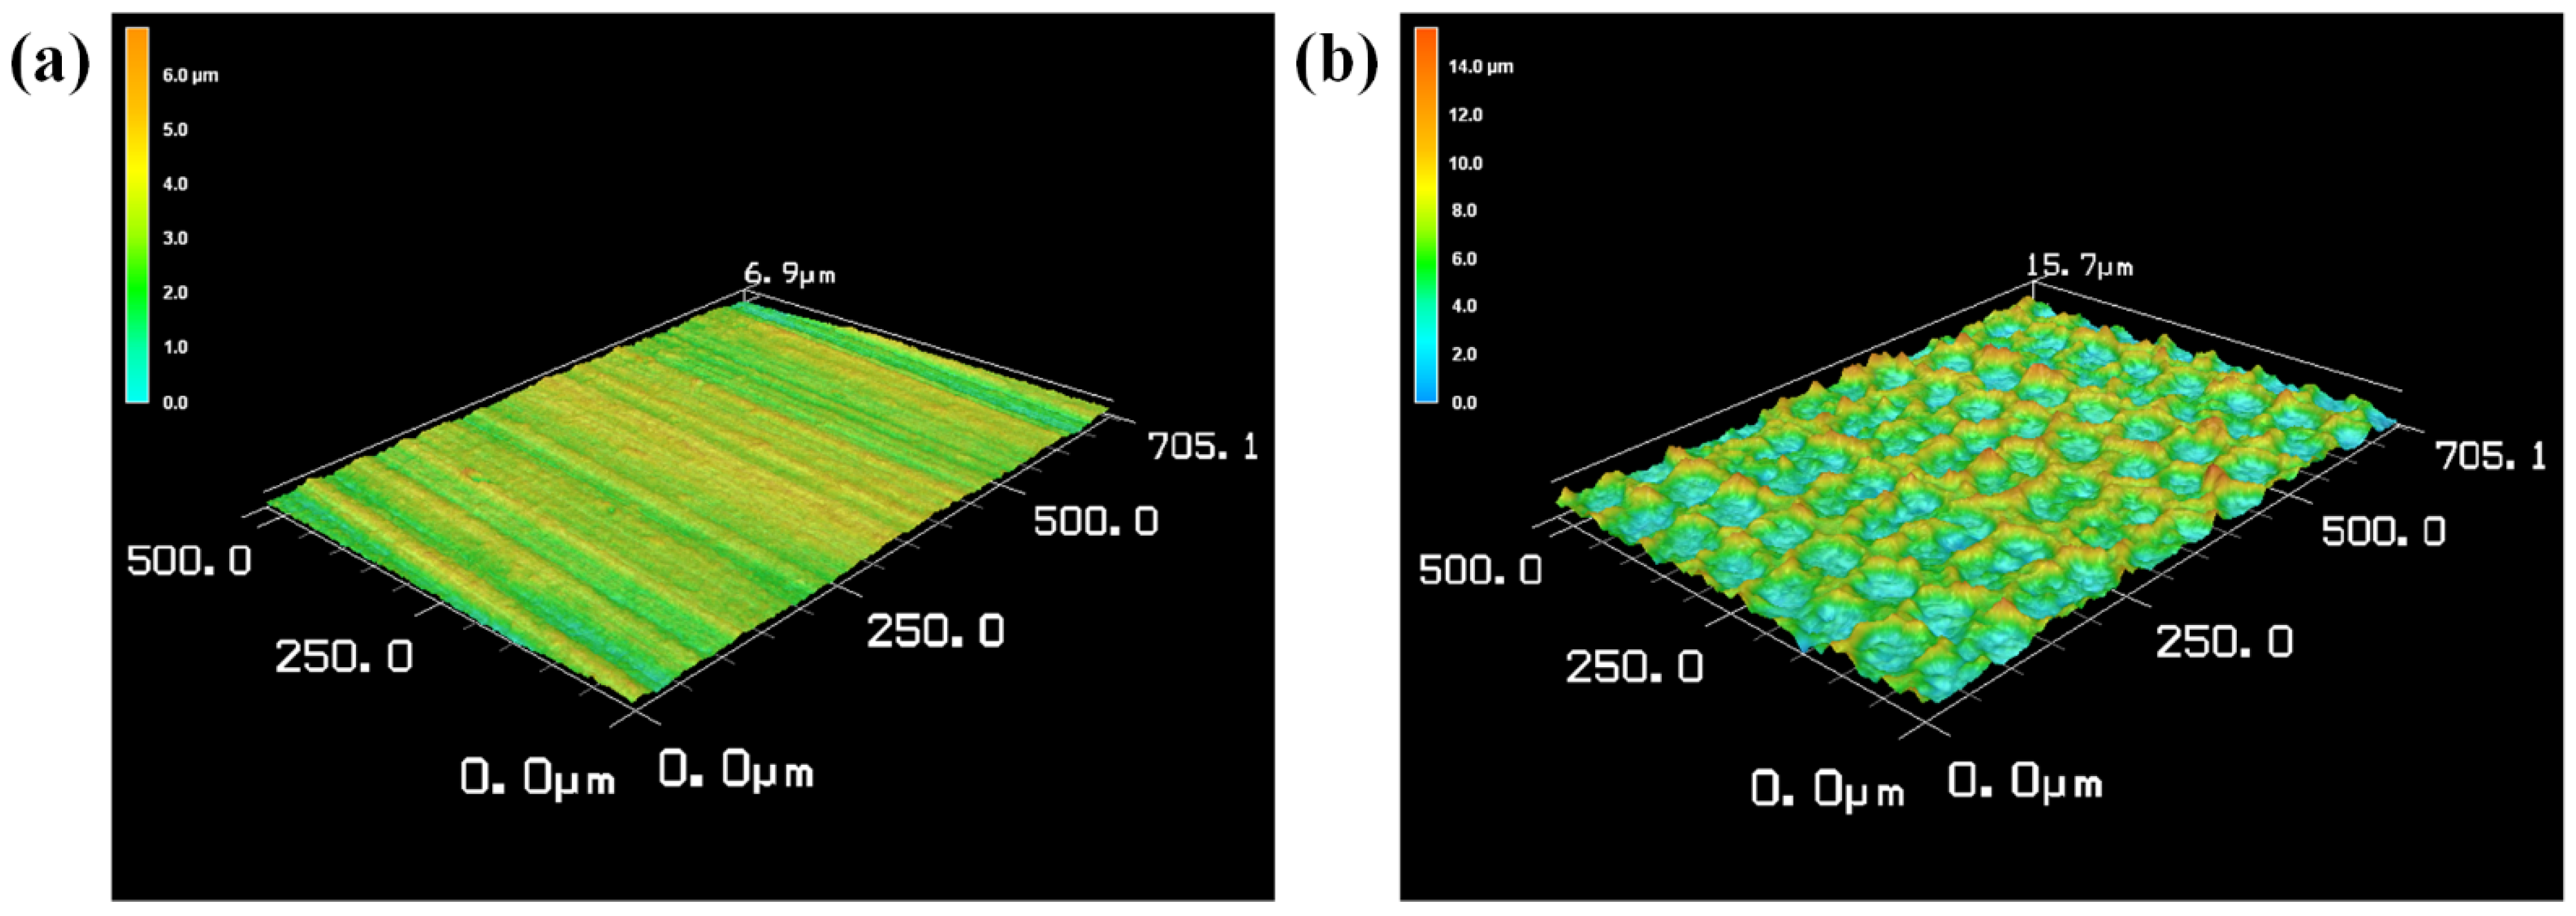
3.2. Surface Roughness
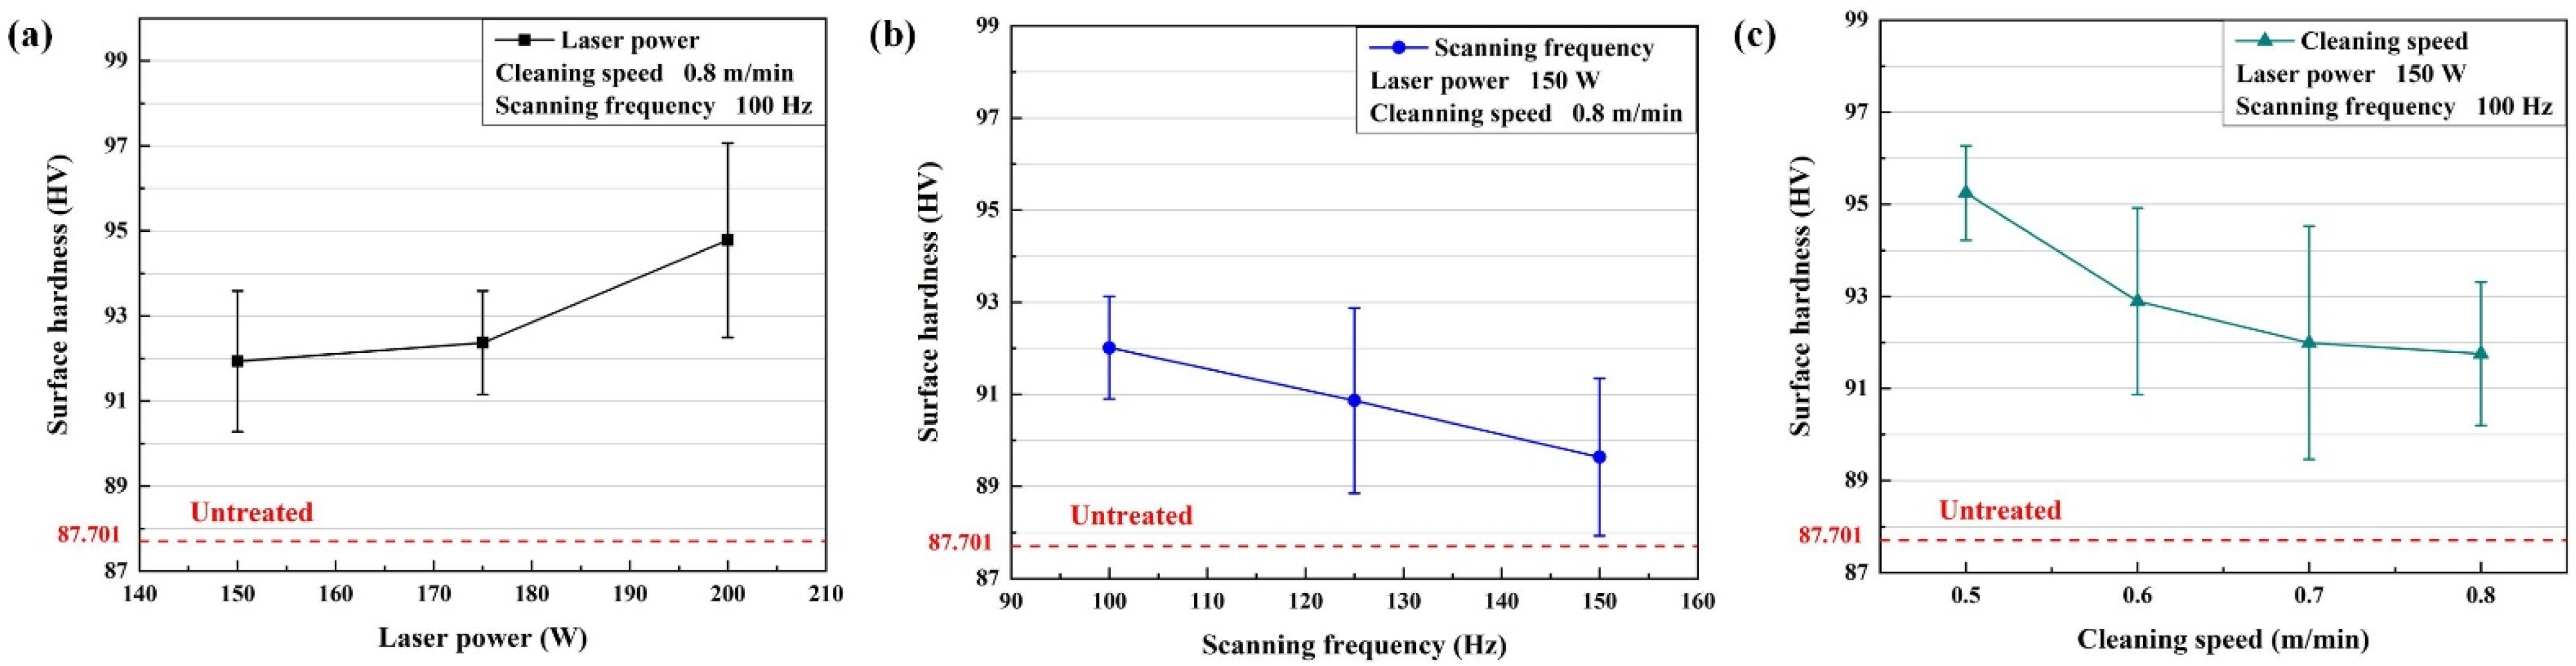
3.3. Surface Hardness
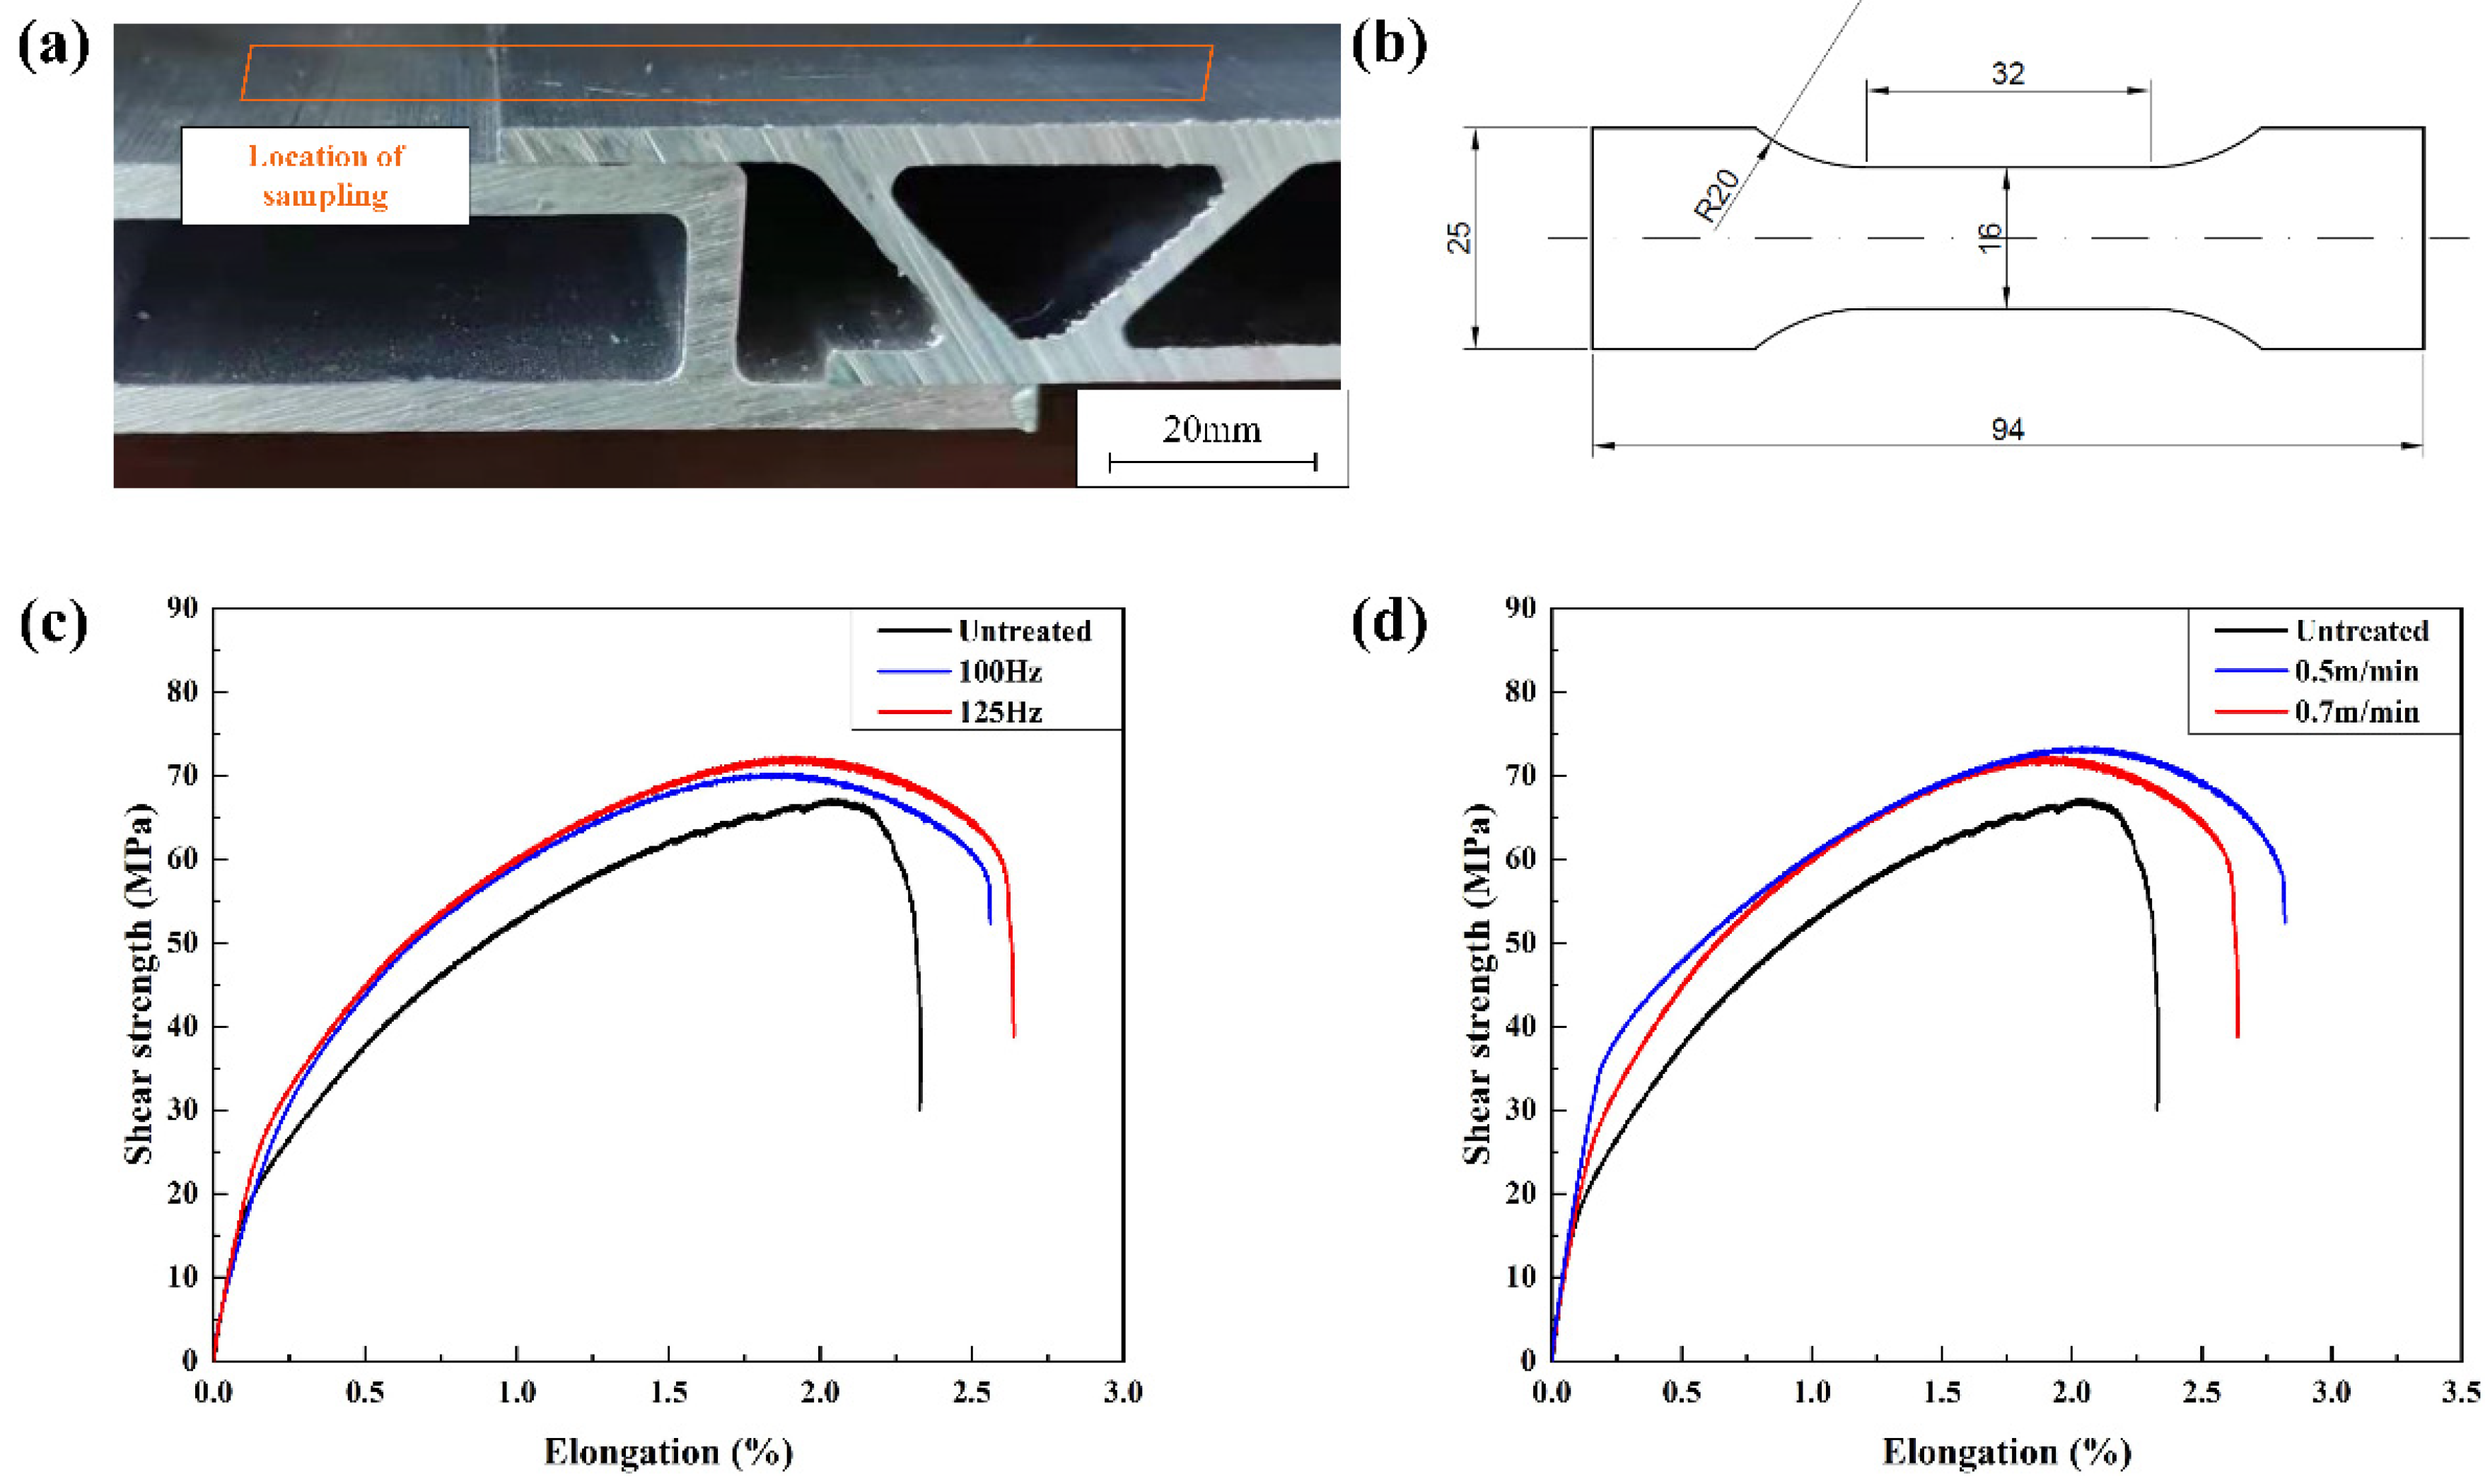
3.4. Weld Performance
3.5. Welding Defect
3.6. Correlation of Process Parameters with Welding Defects
3.7. Weld Performance and Defect of Post-Weld Cleaning
4. Discussion
5. Conclusions
- Laser cleaning can effectively reduce the surface oxygen content of aluminum alloy. The oxygen content decreases first and then increases with the increase of laser power and scanning frequency, with the increase of cleaning speed and decrease.
- Laser cleaning produces craters on the surface of the sample and increases the surface roughness. Laser cleaning slightly improves the microhardness of the surface. At 0.5 m/min, the highest rise in hardness was 8.601%.
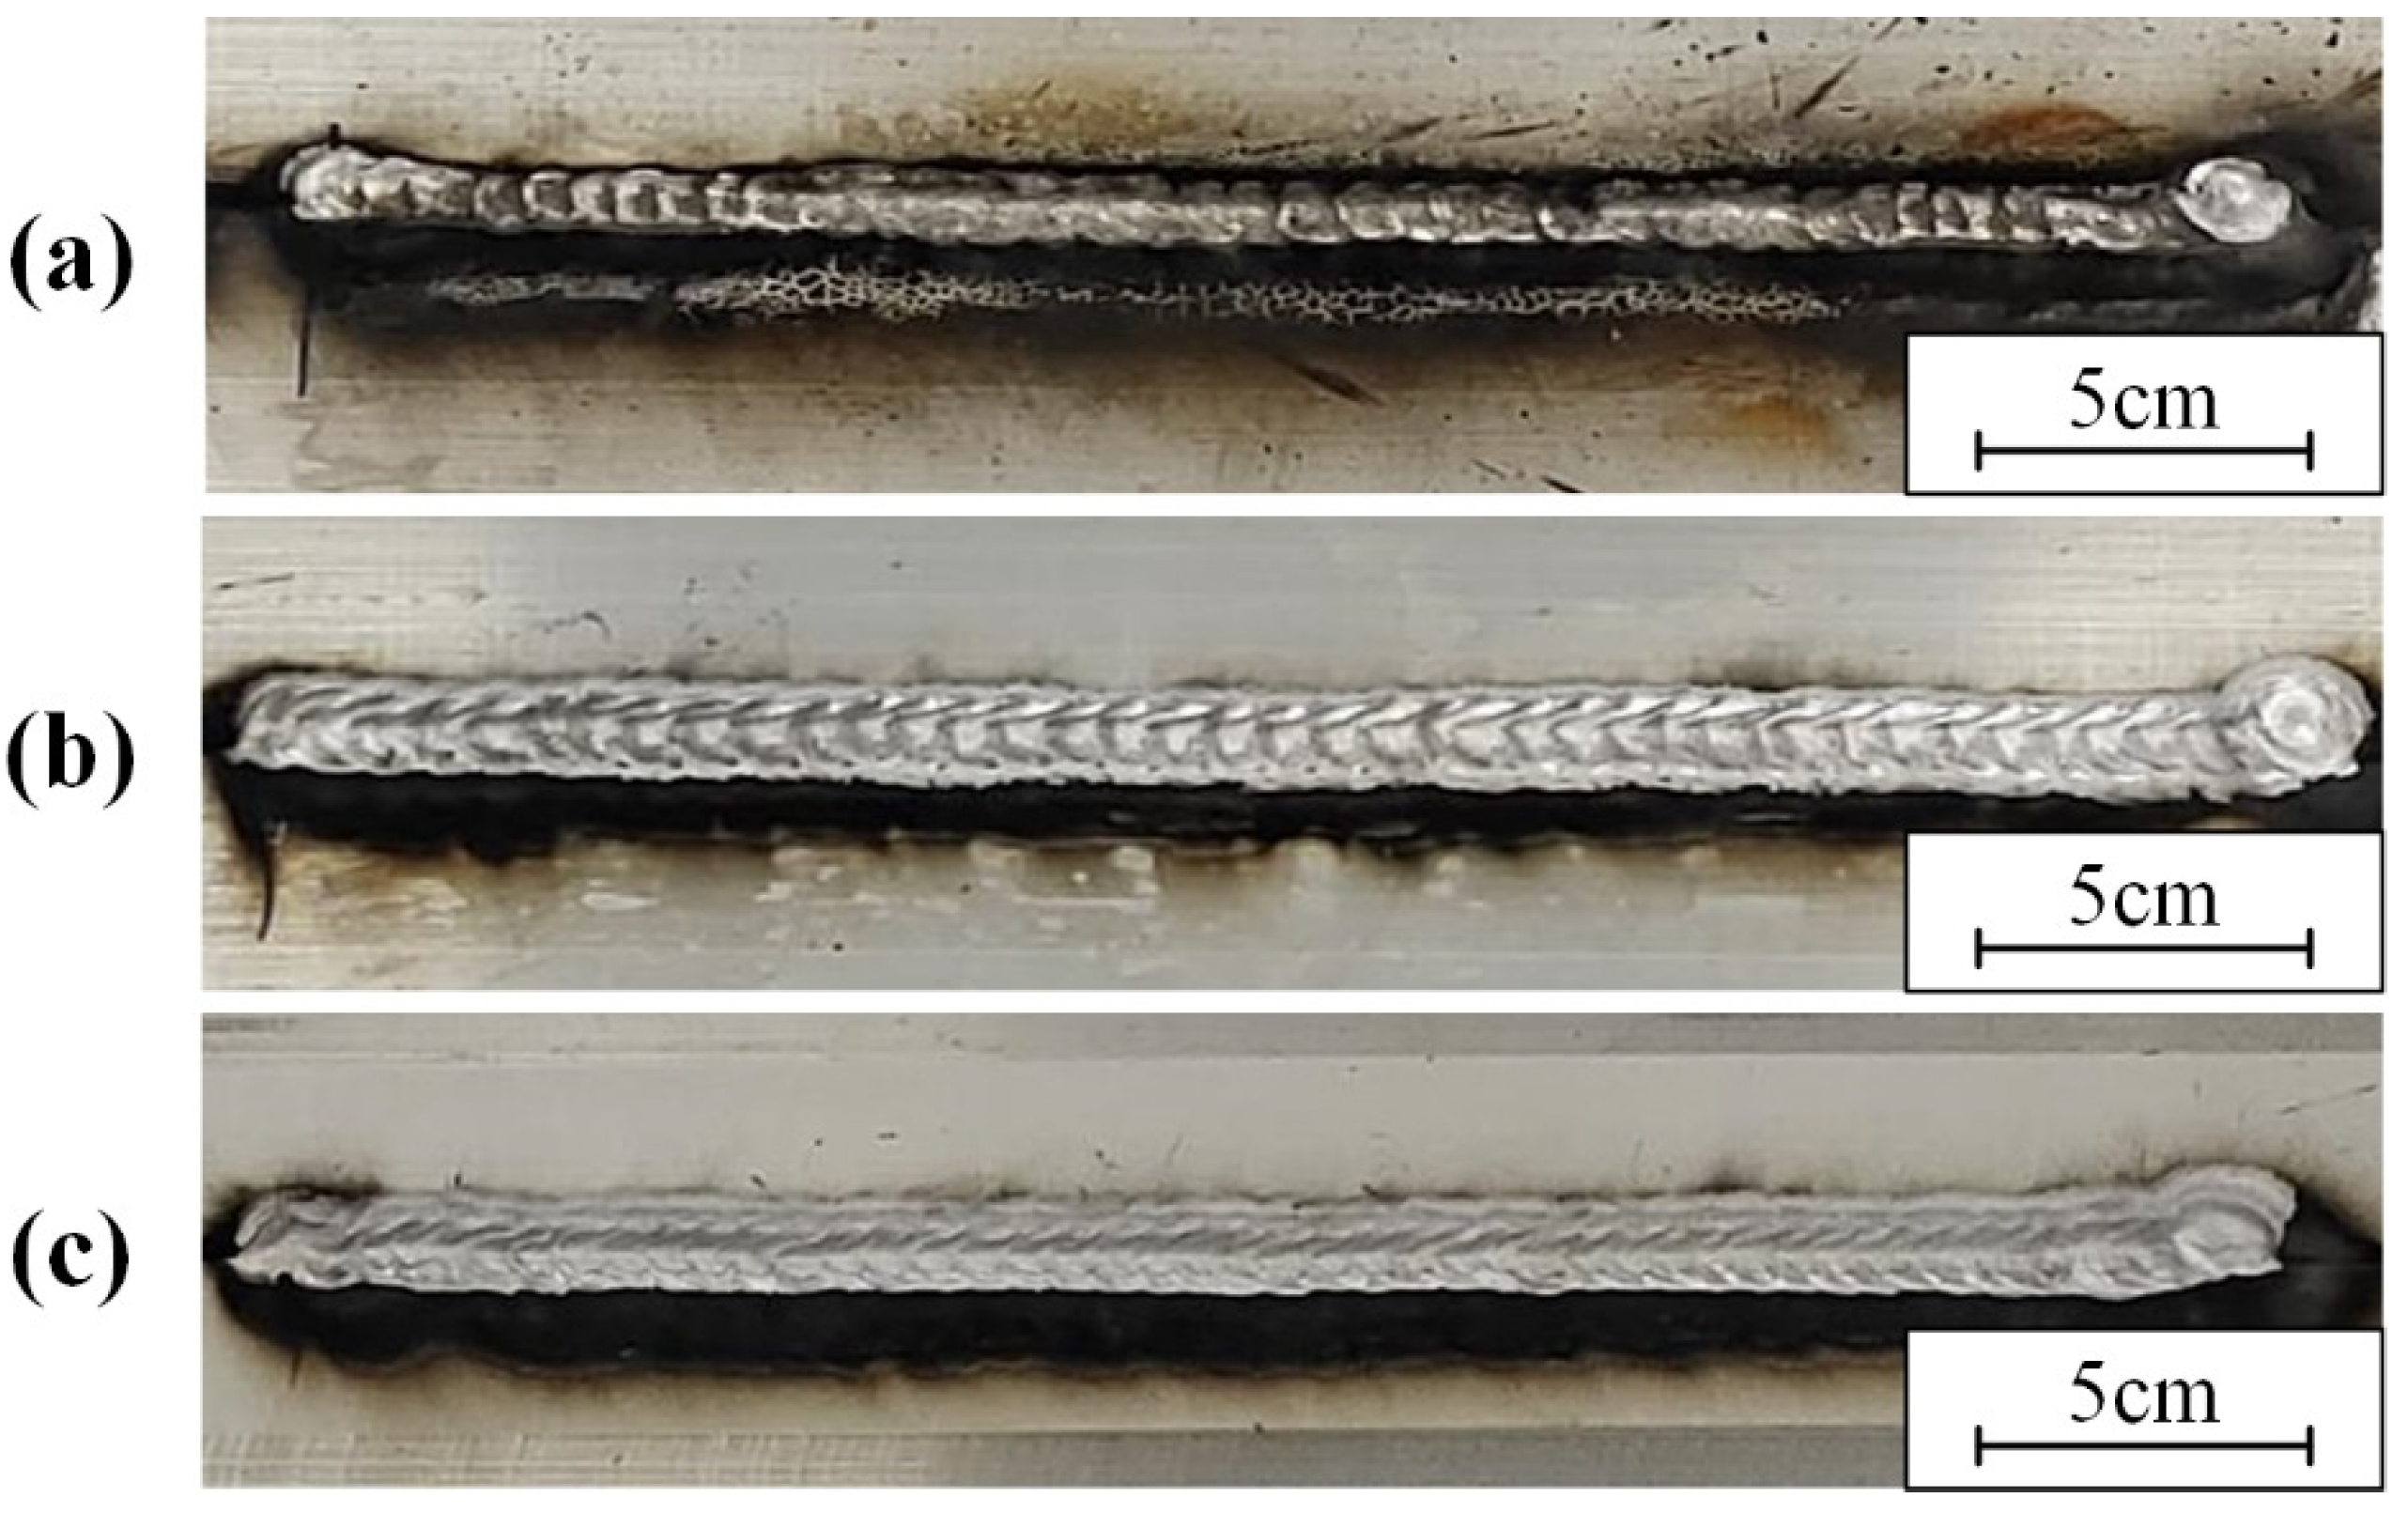
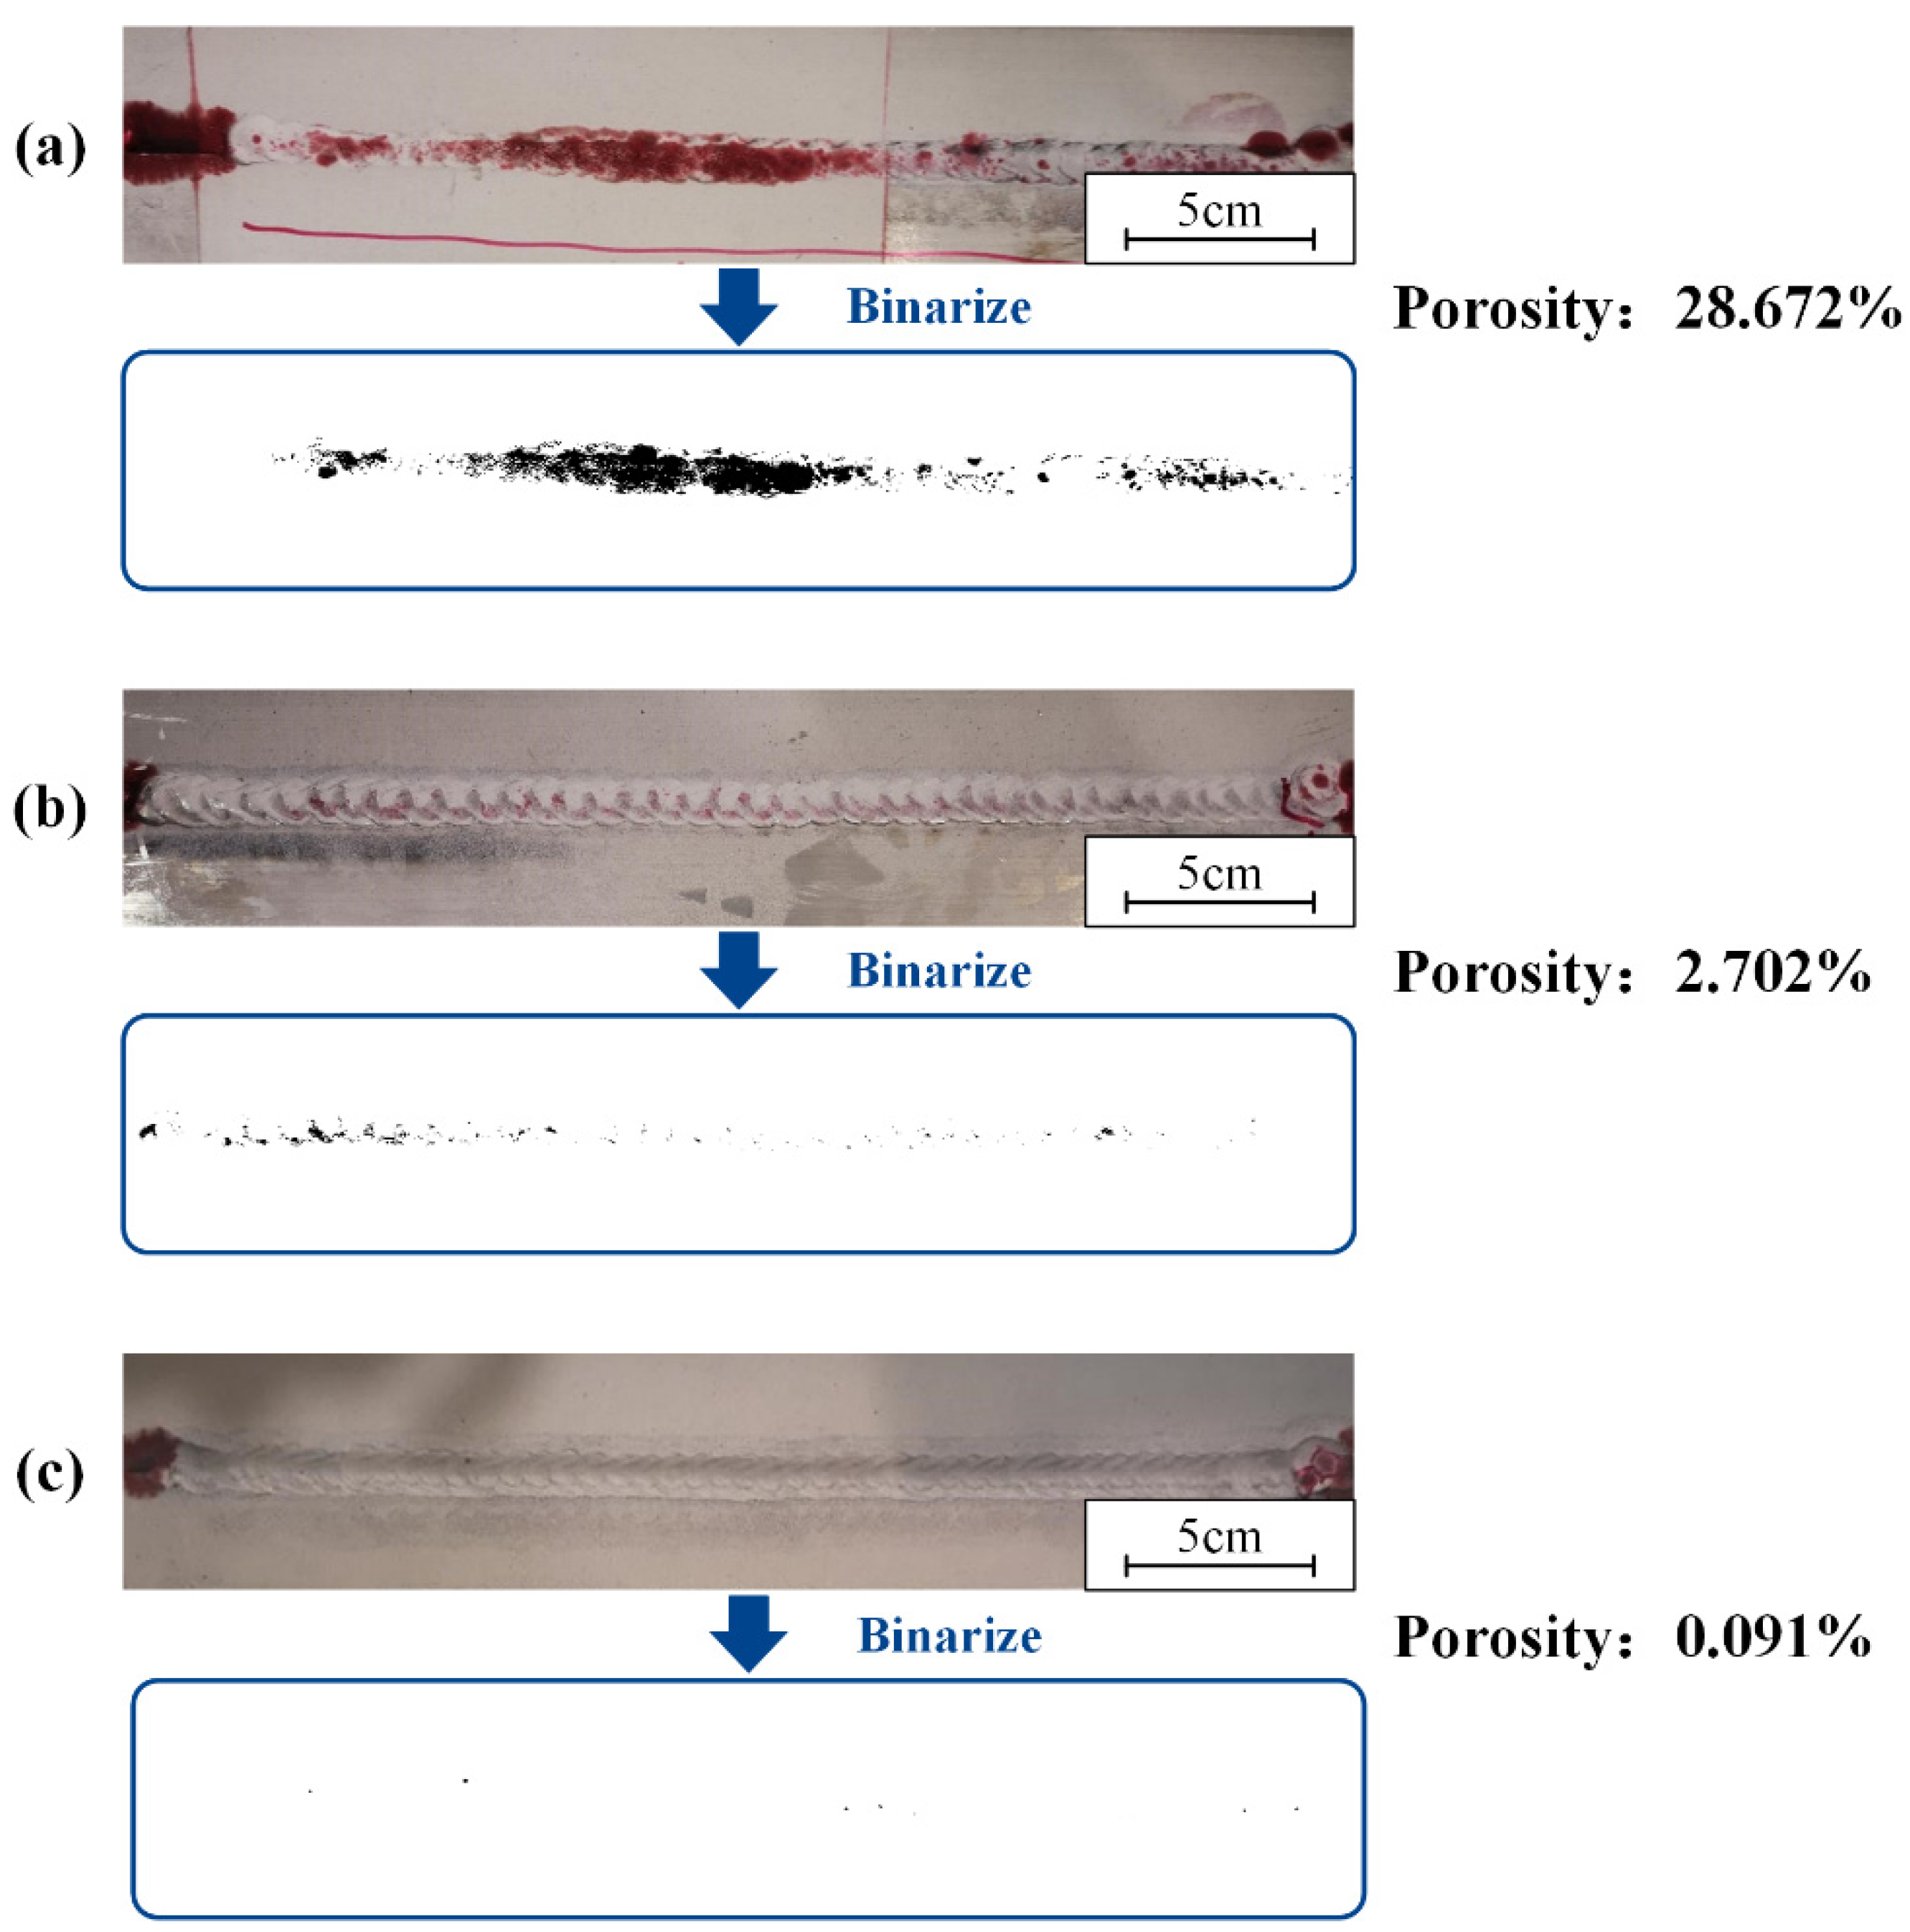
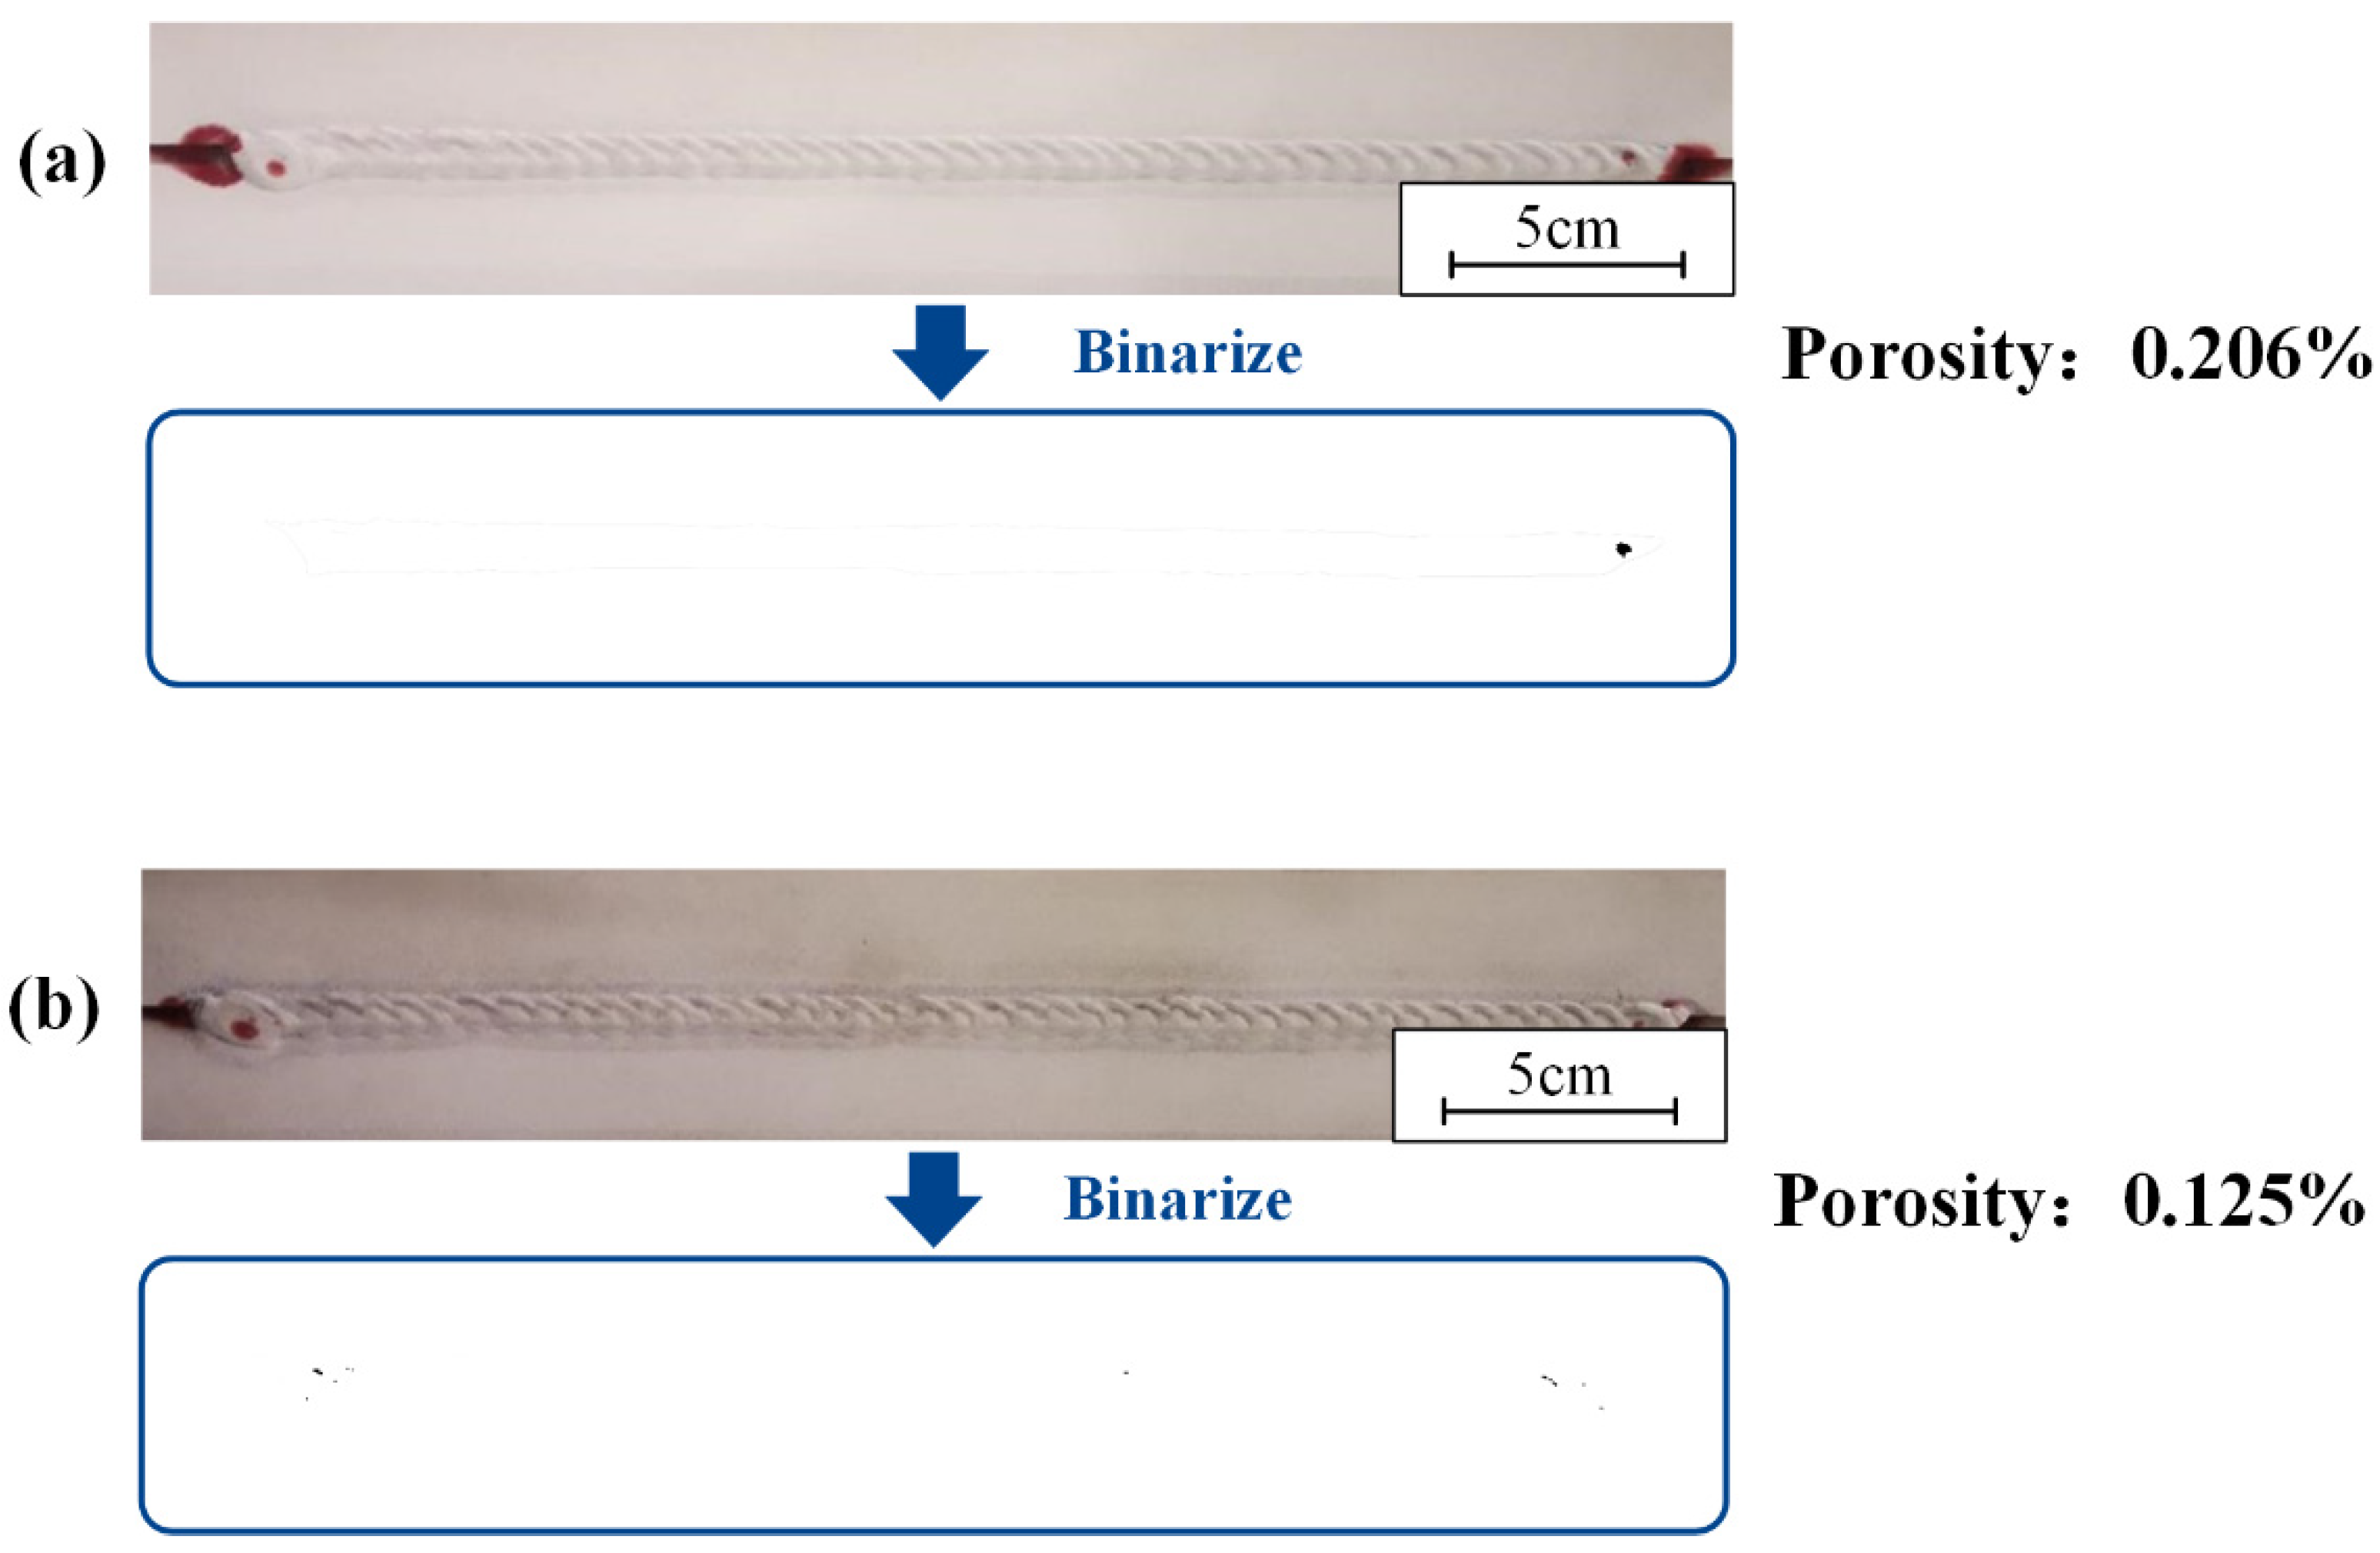
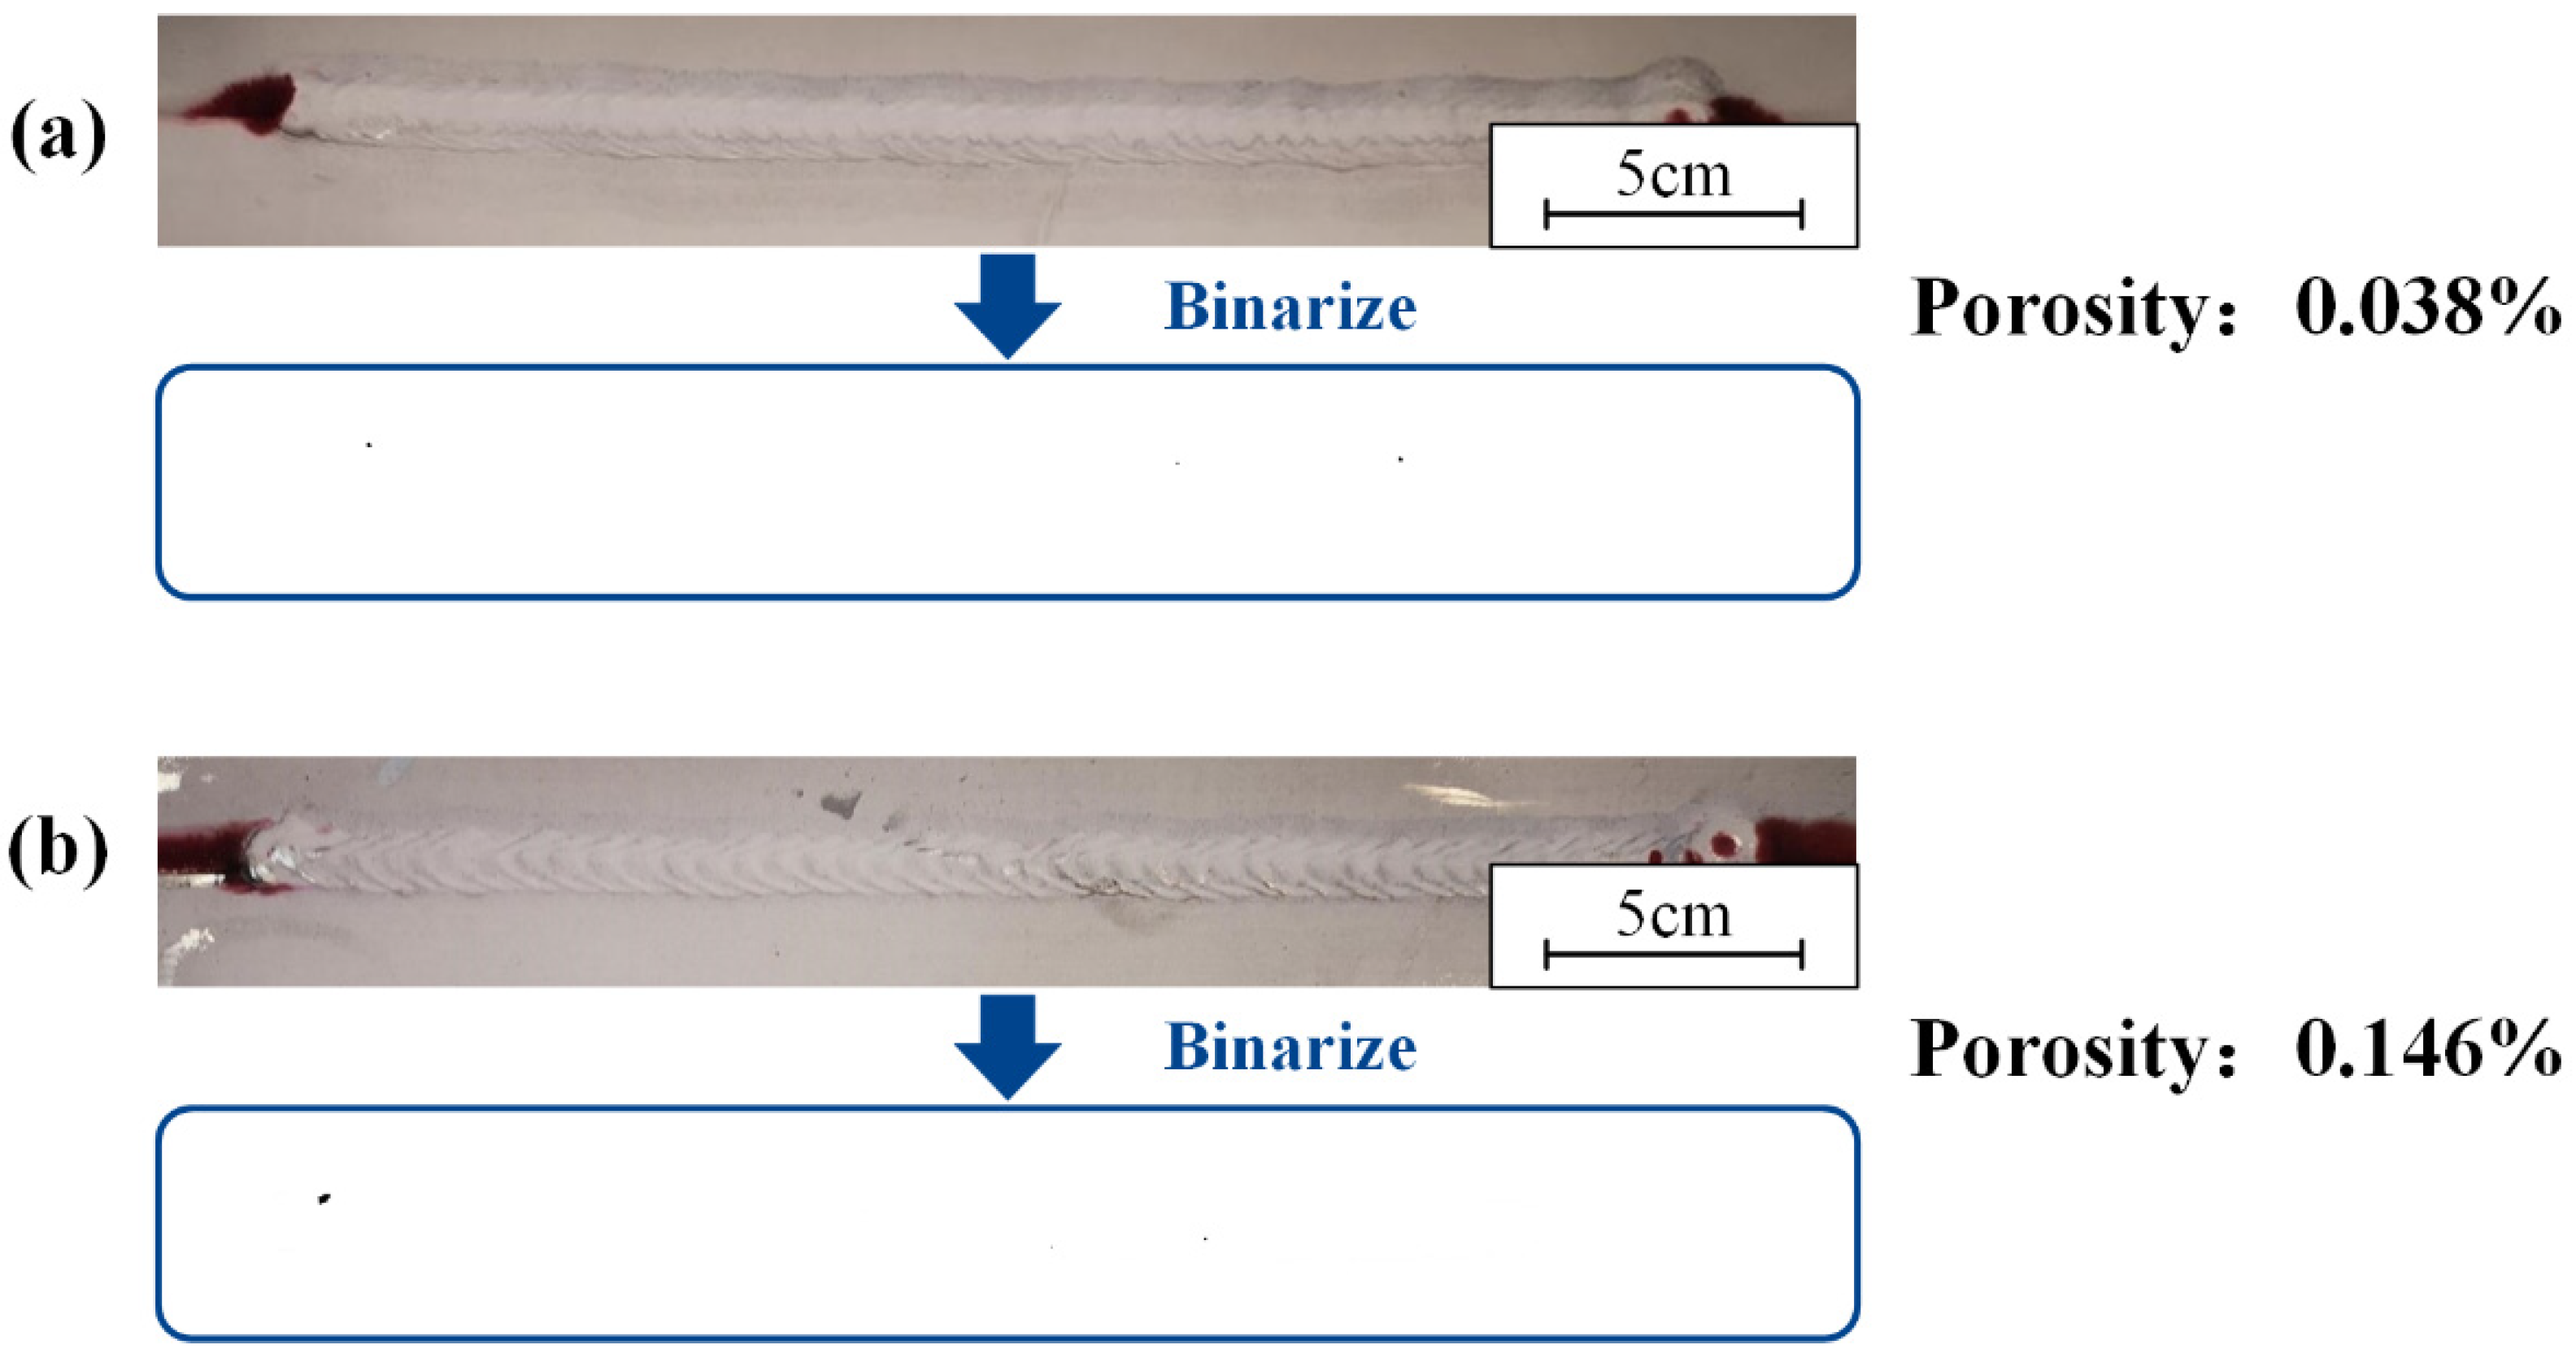
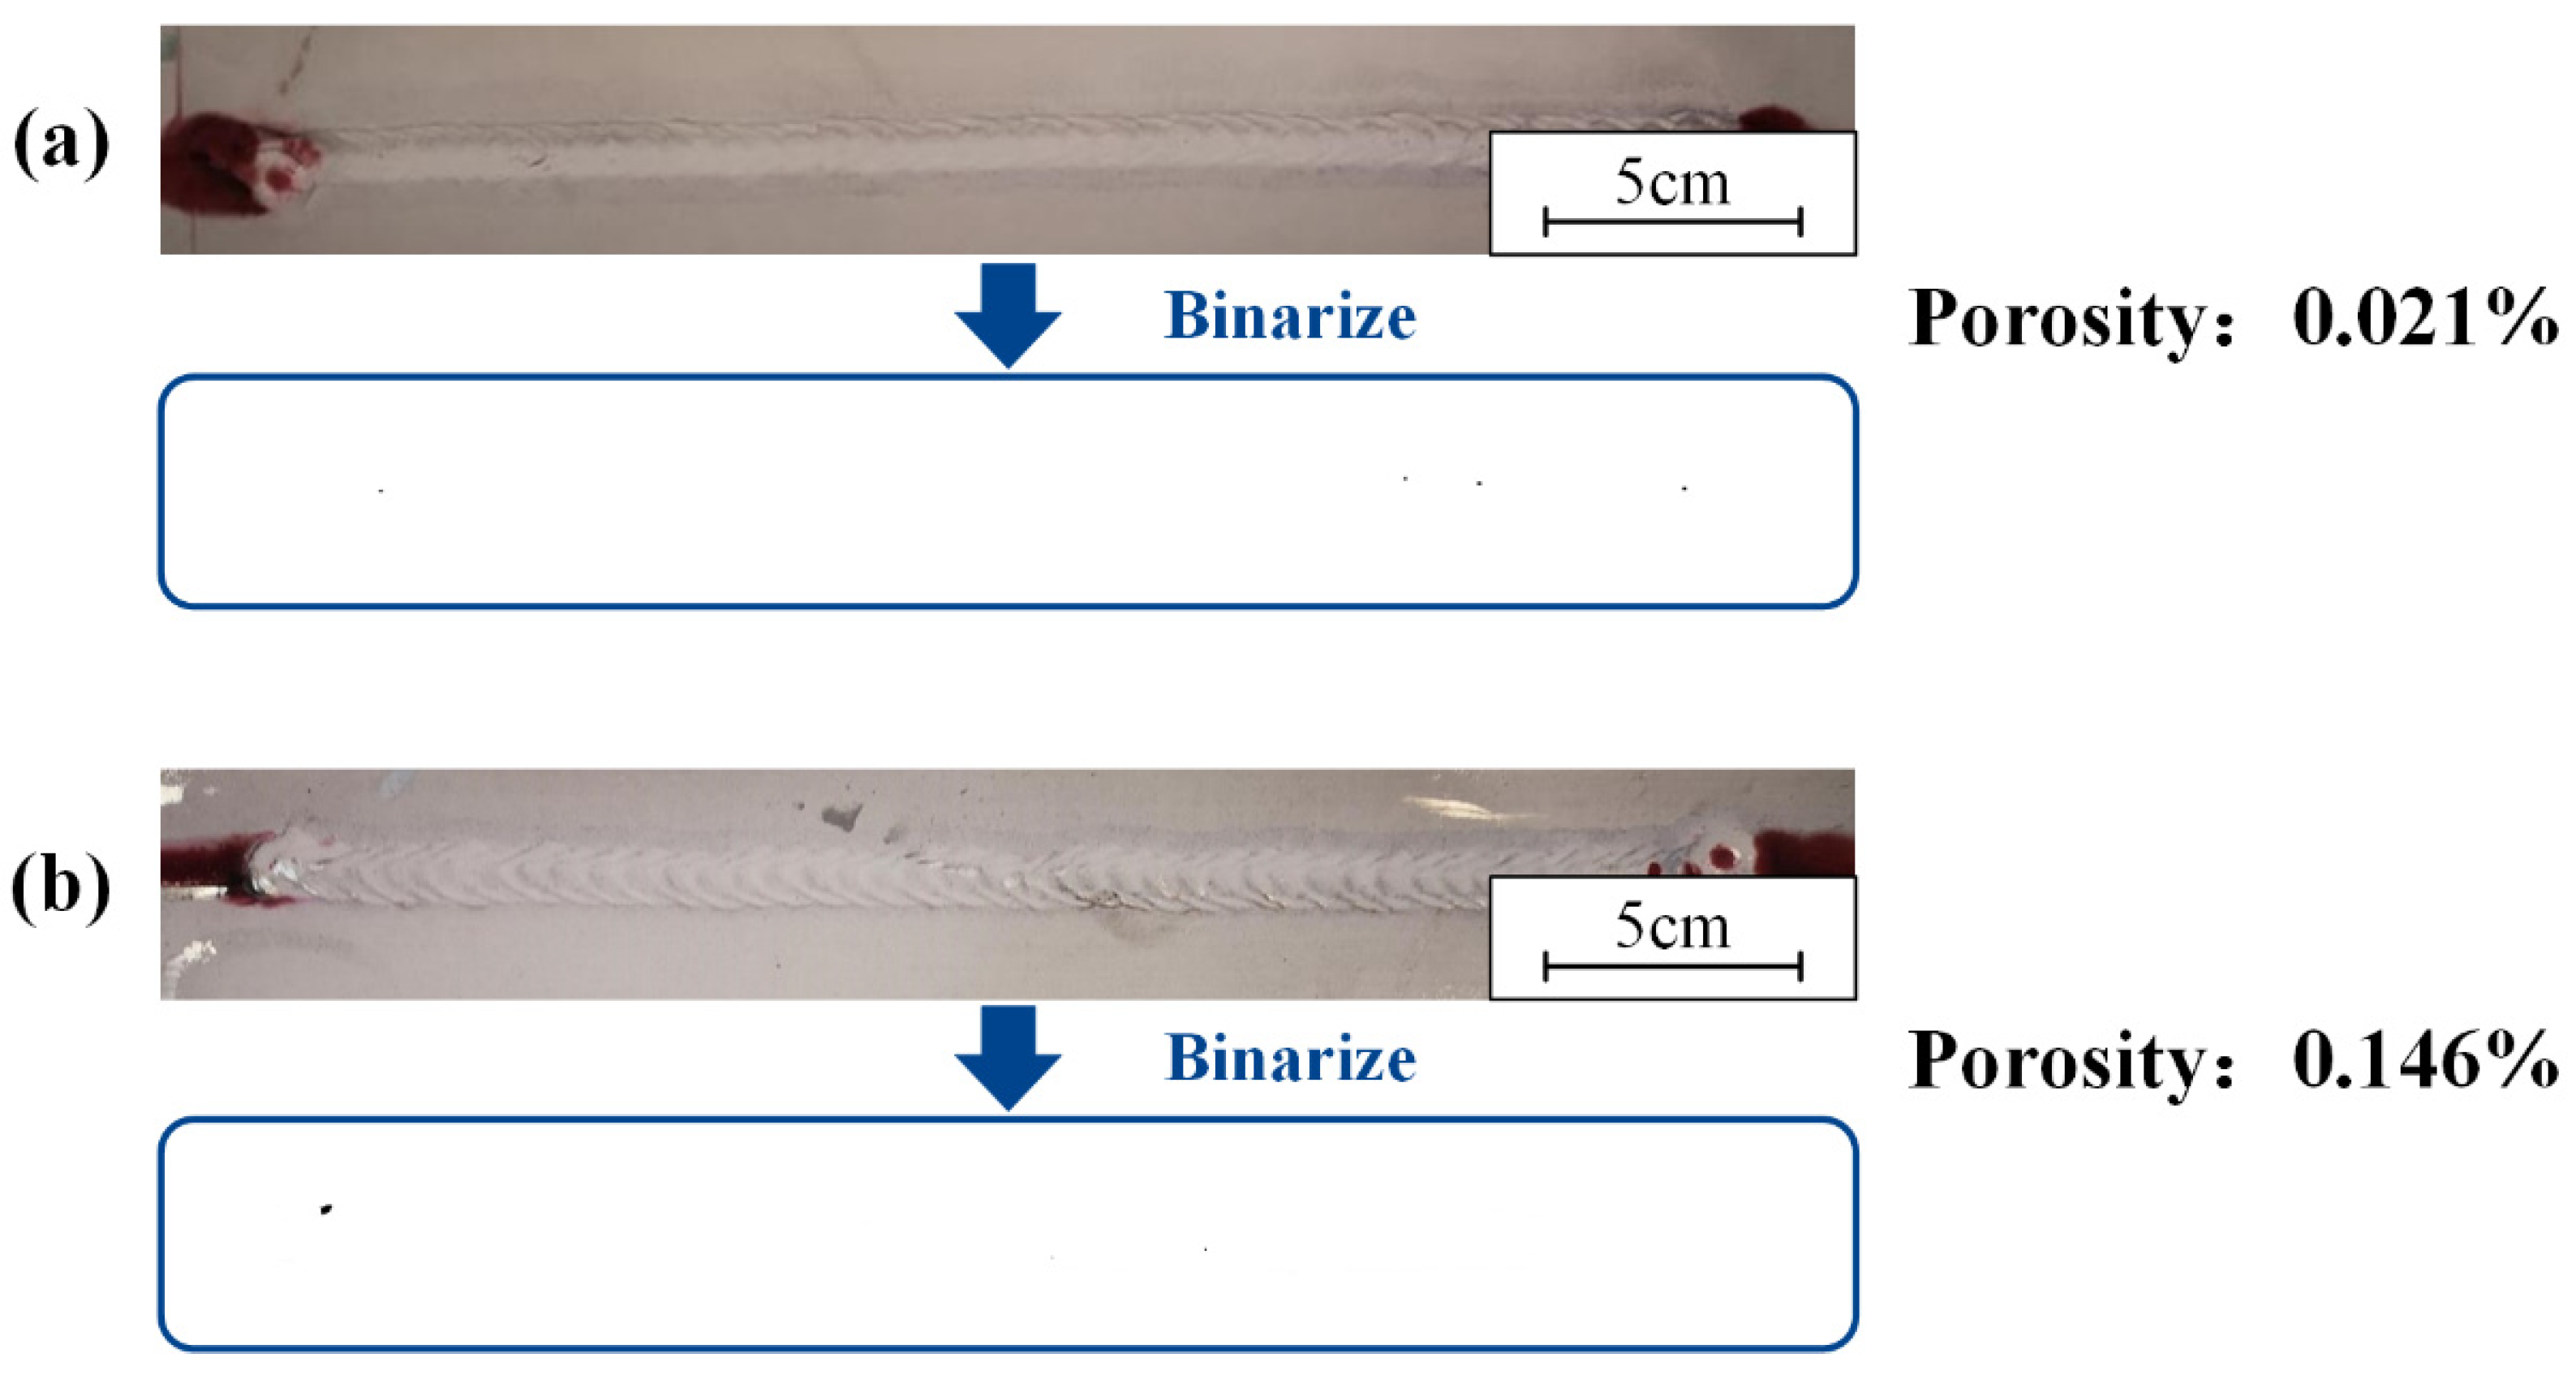
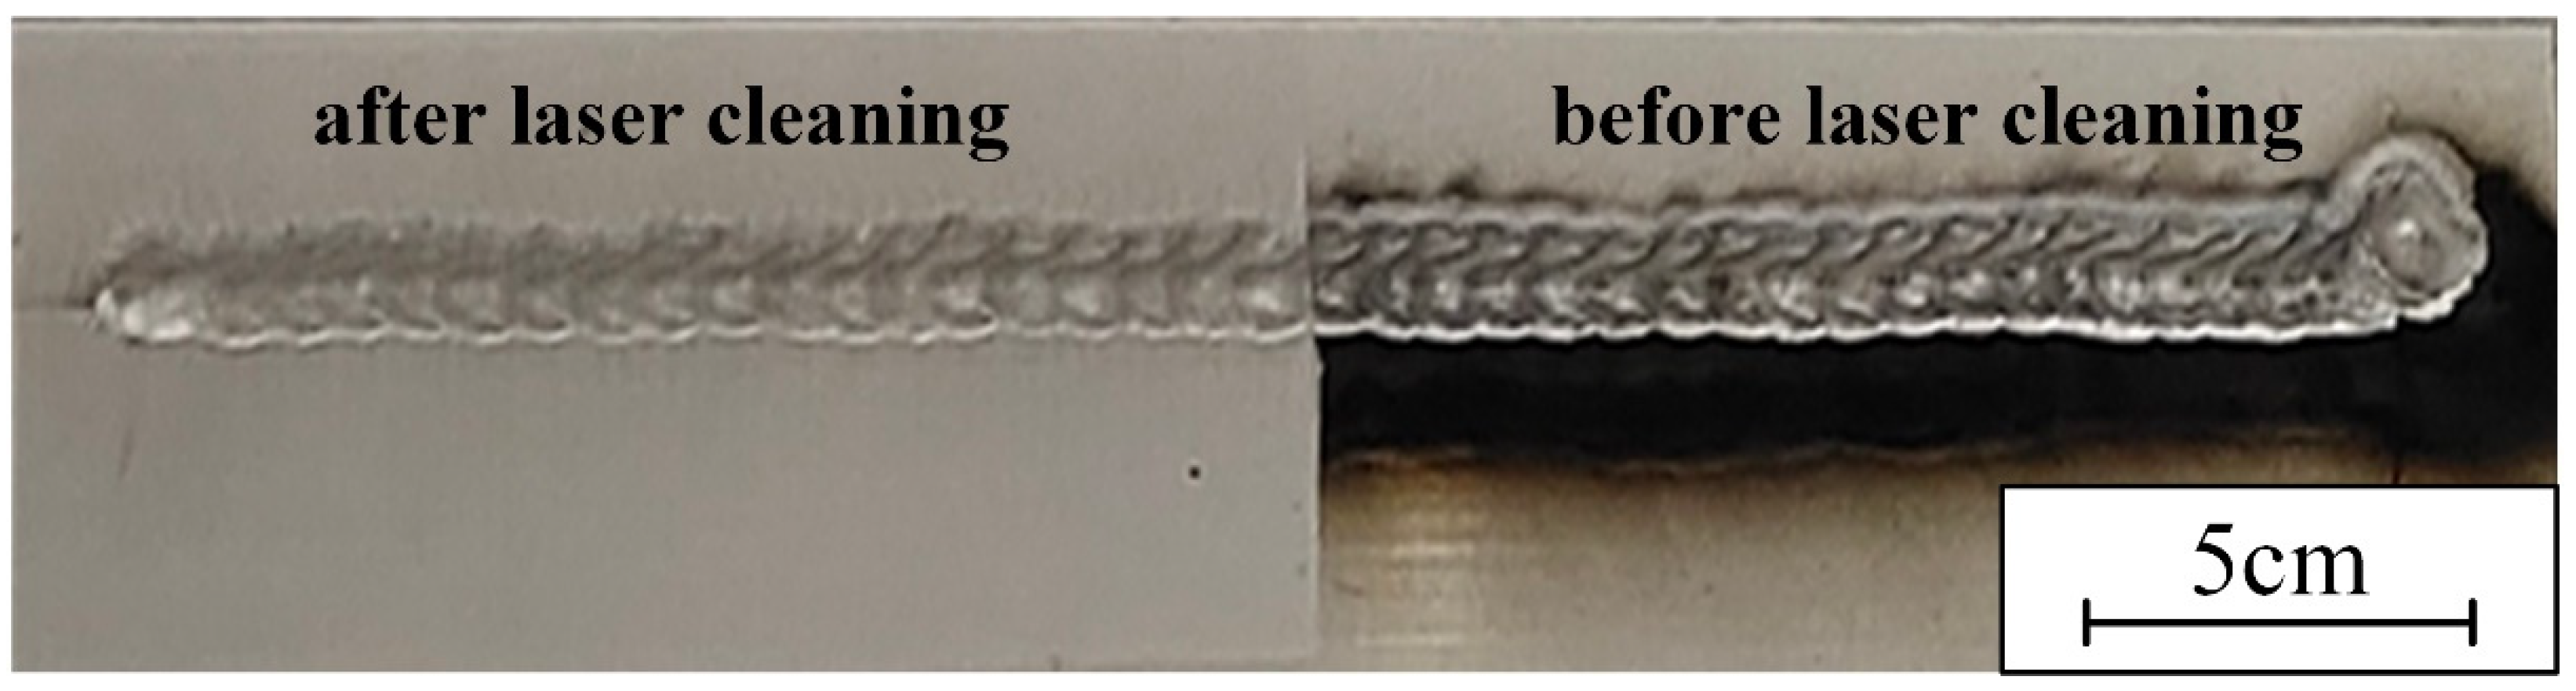
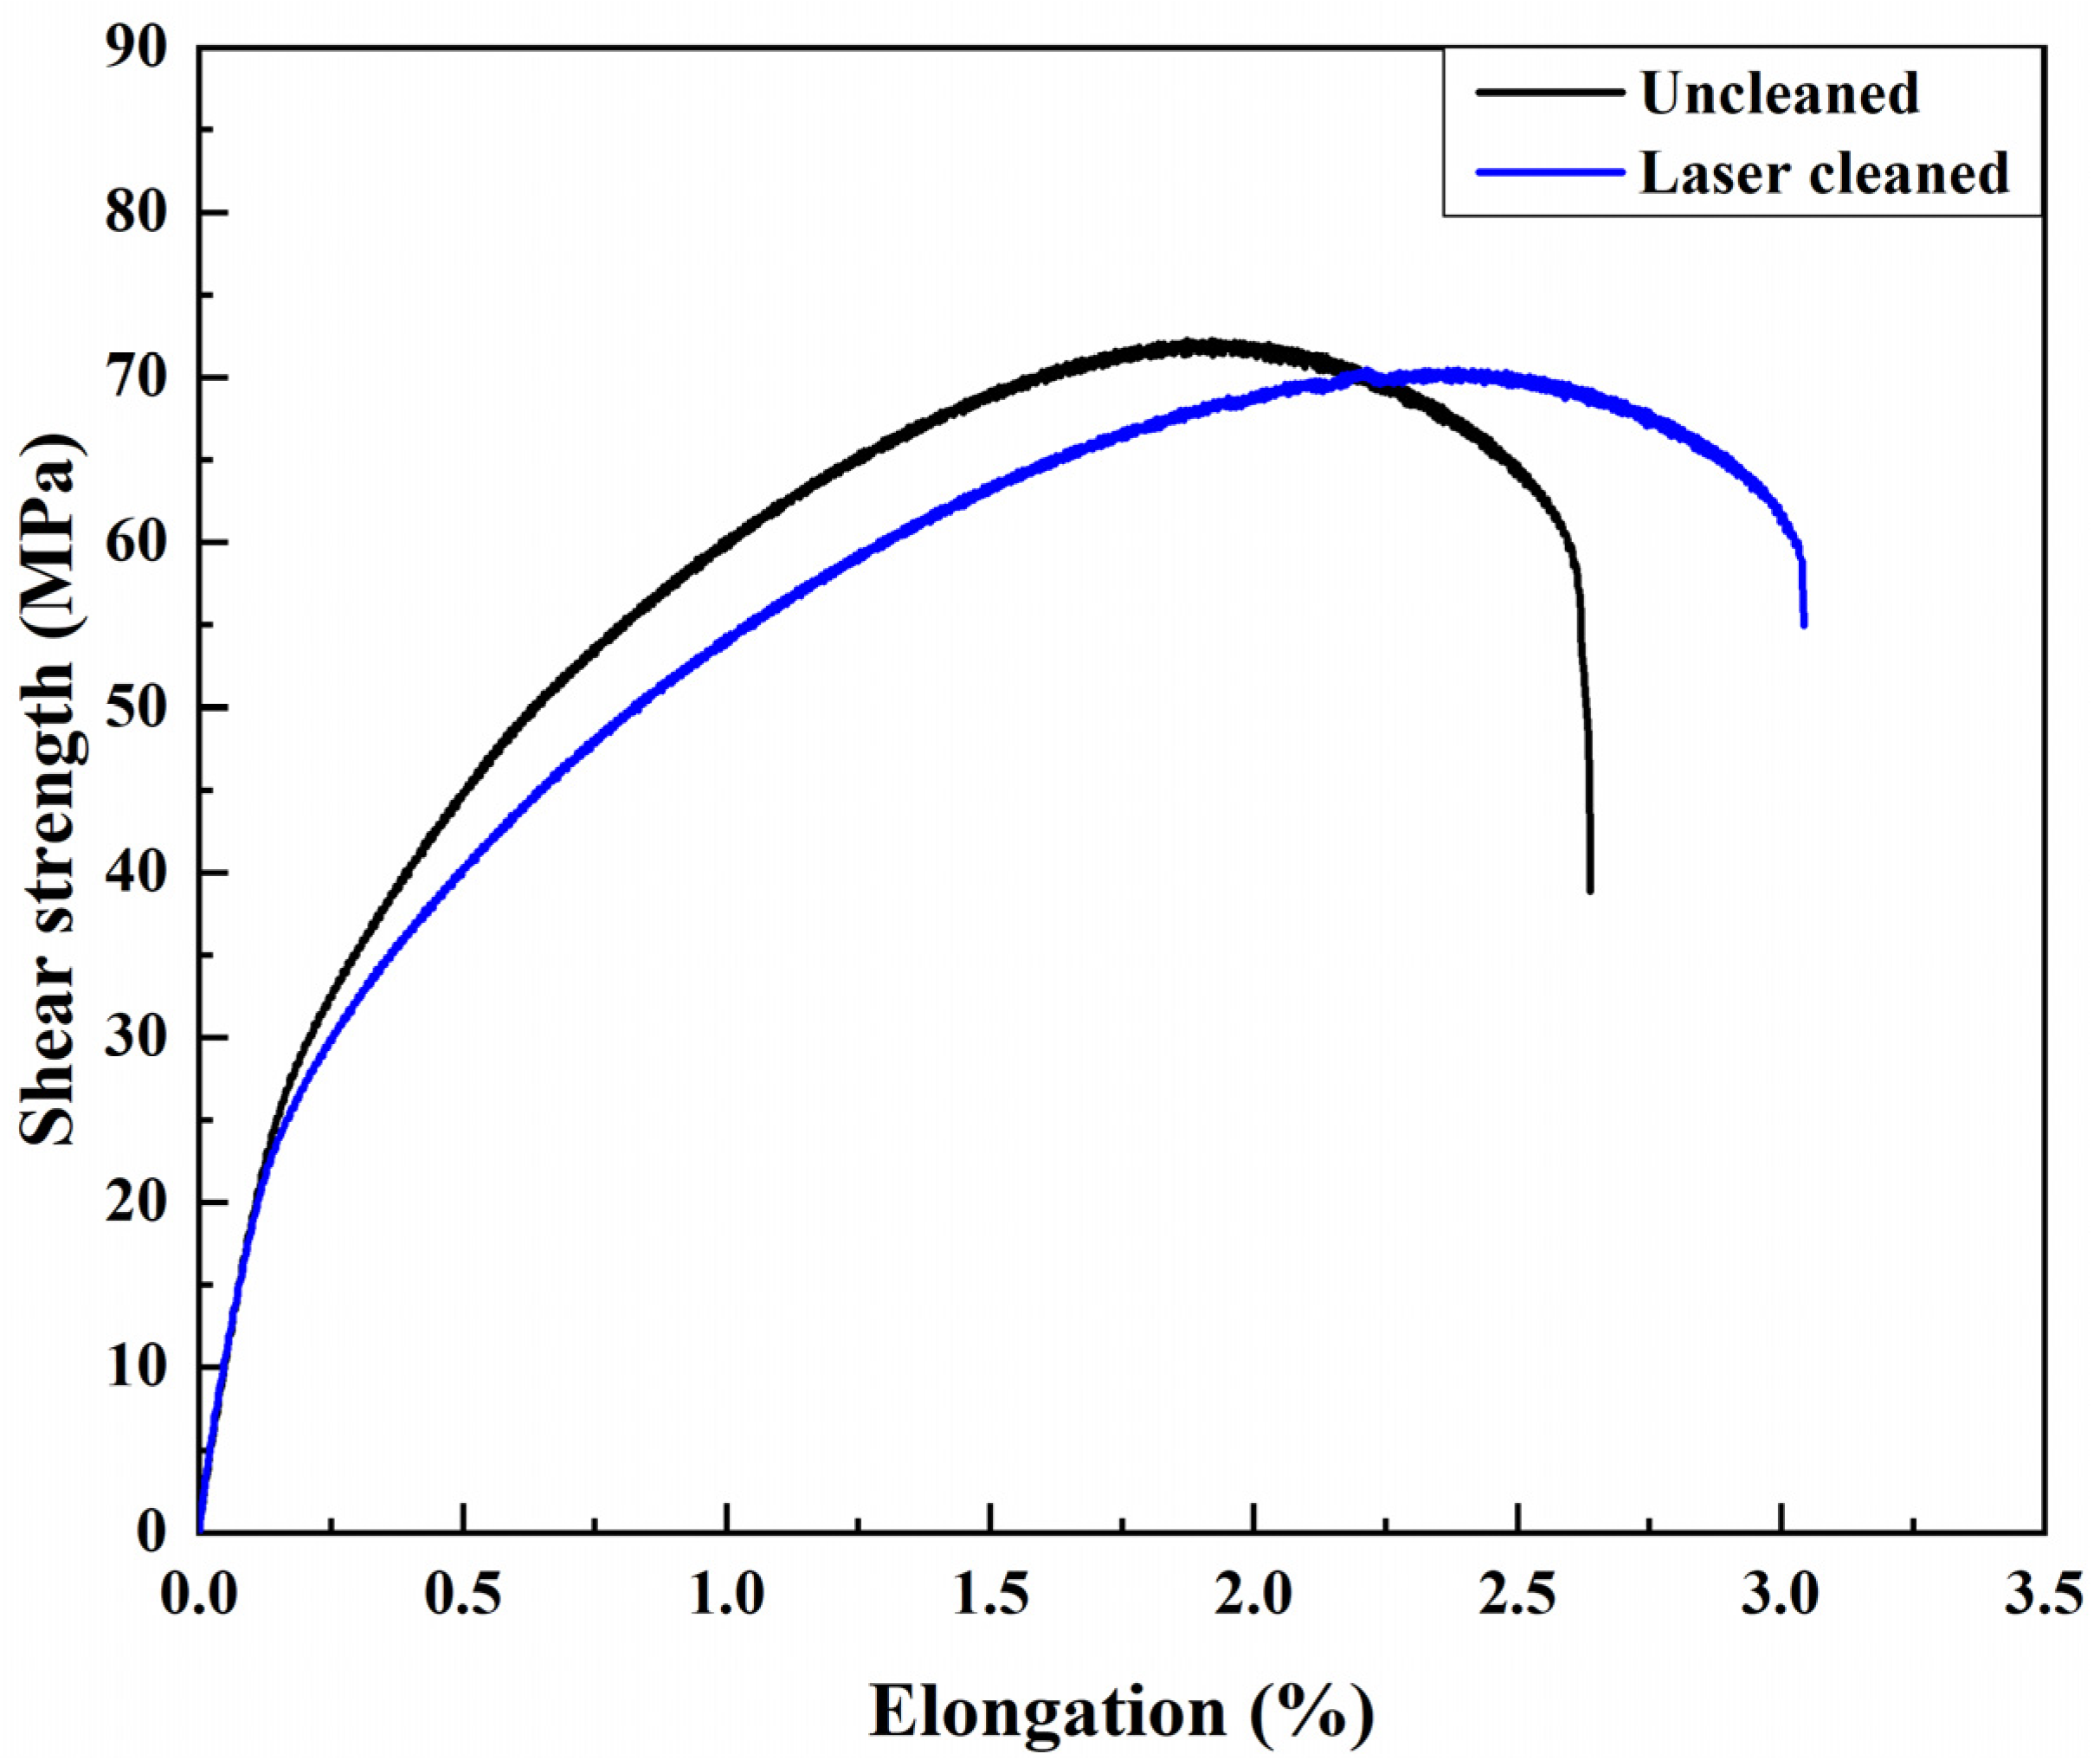
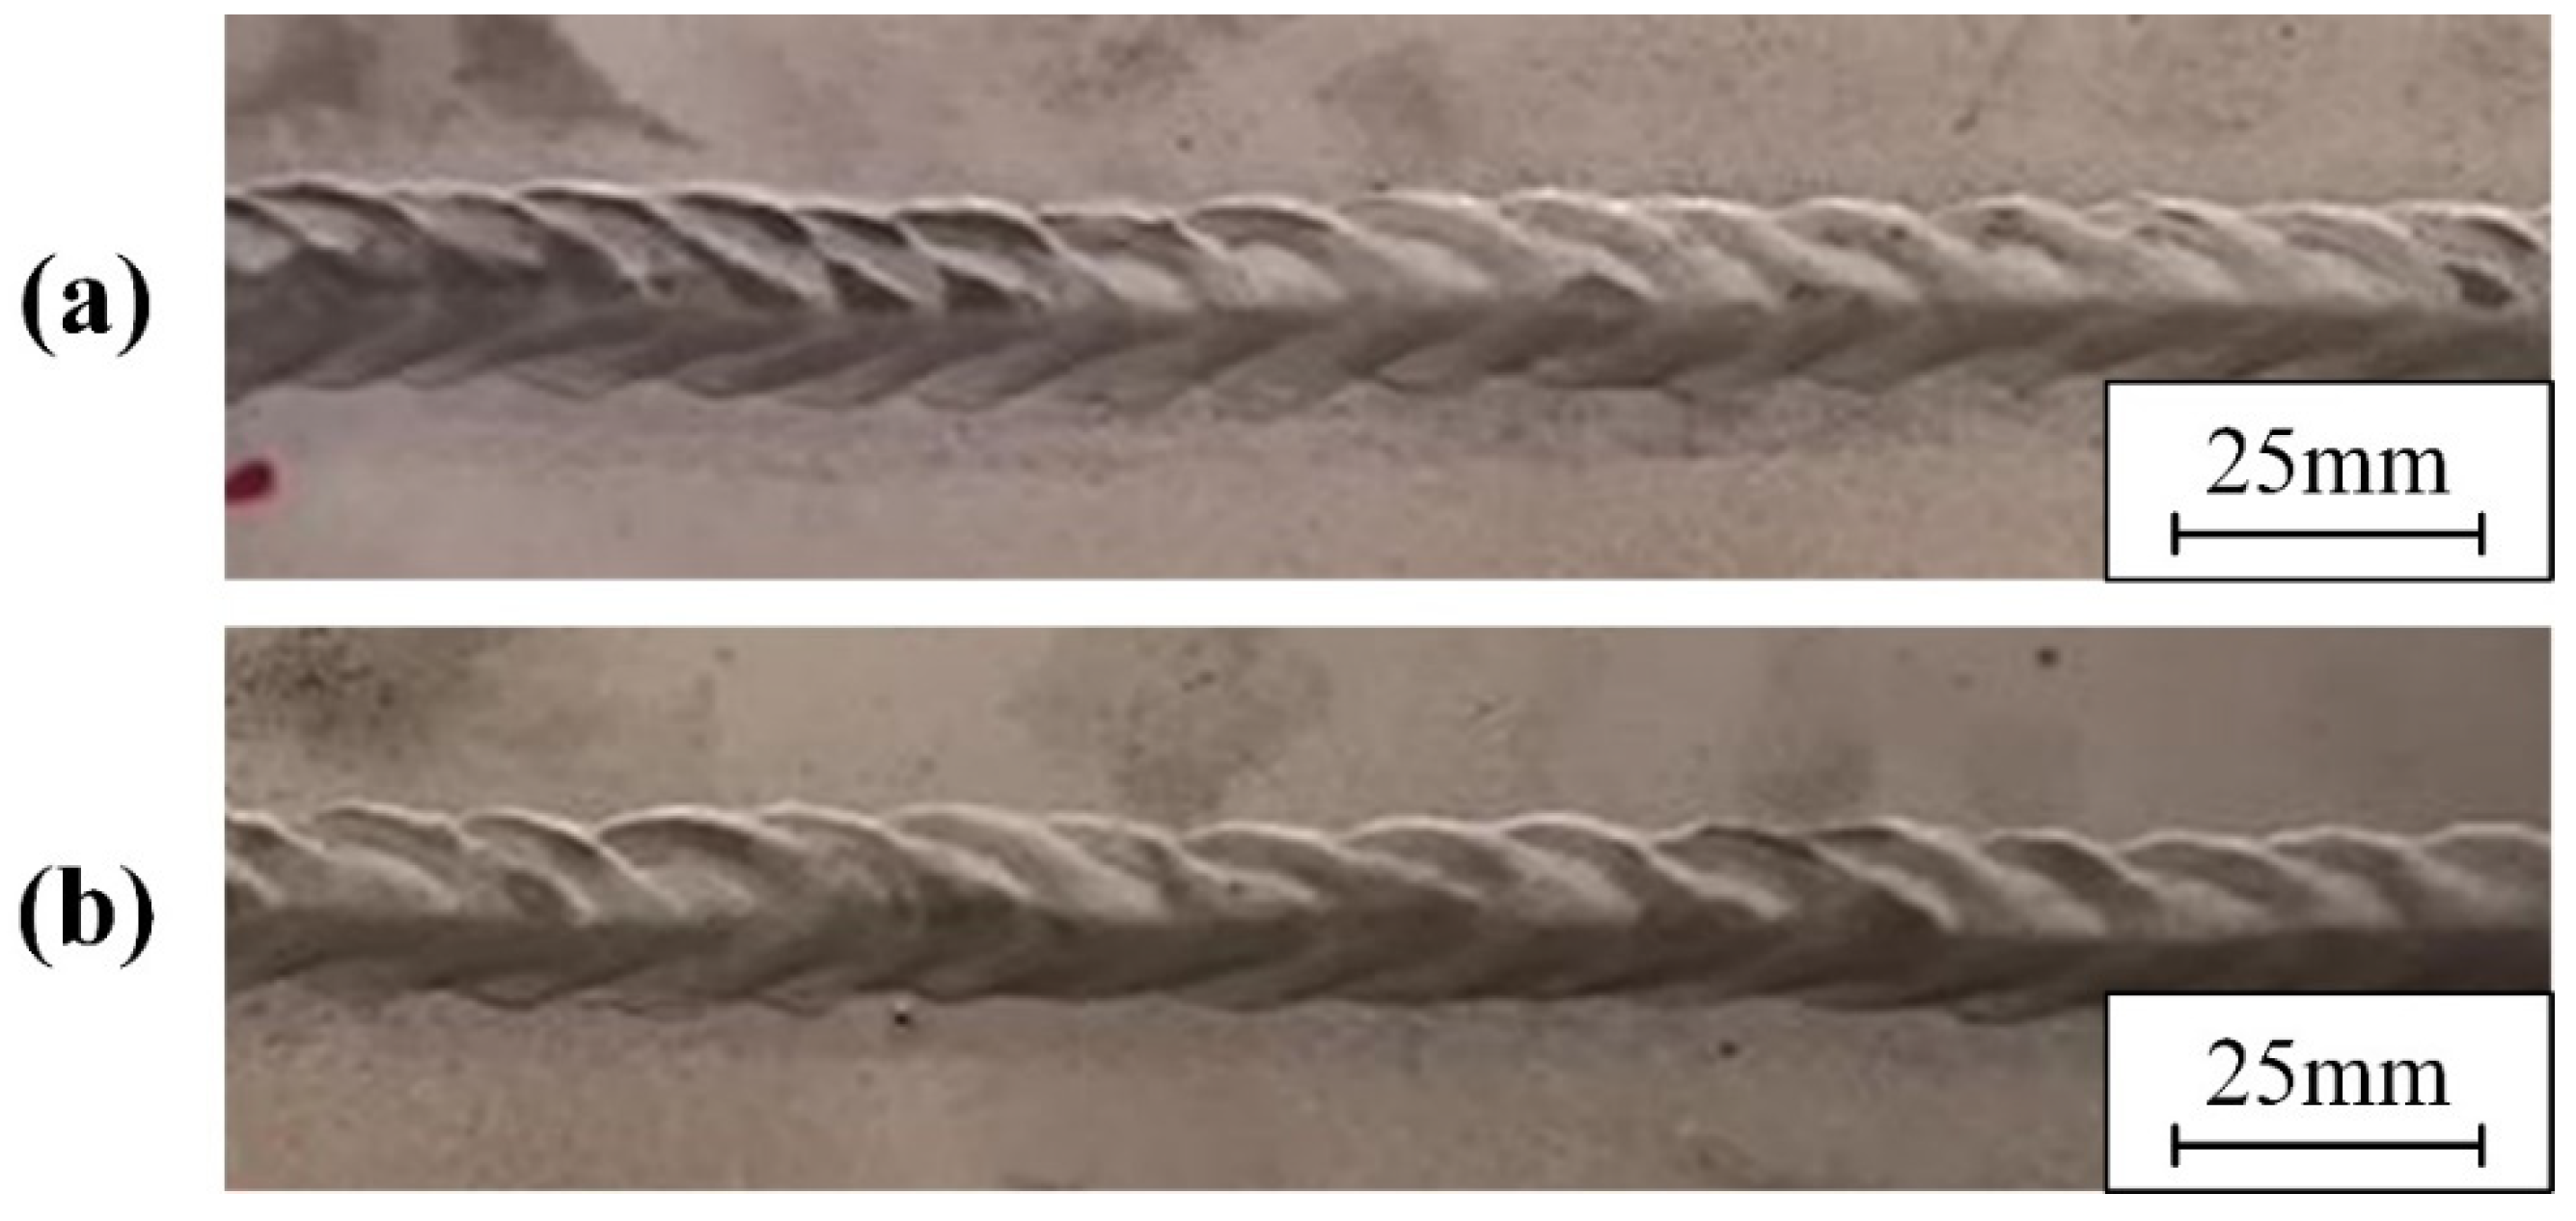
- For the surfaces with oil and water, laser cleaning can effectively remove dirt and suppress the weld porosities. For the surfaces with oil and water, the porosity reduced from 28.672% and 2.702% to 0.091%, respectively. Black ash around the weld seam can be effectively removed by post-weld laser cleaning. Laser cleaning after welding slightly improves the elongation of the weld.
Author Contributions
Funding
Institutional Review Board Statement
Informed Consent Statement
Data Availability Statement
Conflicts of Interest
References
- Gou, G.; Huang, N.; Chen, H.; Liu, H.; Tian, A.; Guo, Z. Research On Corrosion Behavior of A6N01S-T5 Aluminum Alloy Welded Joint for High-Speed Trains. J. Mech. Sci. Technol. 2012, 26, 1471–1476. [Google Scholar] [CrossRef]
- Feliu, S.; Pardo, A.; Merino, M.C.; Coy, A.E.; Viejo, F.; Arrabal, R. Correlation Between the Surface Chemistry and the Atmospheric Corrosion of AZ31, AZ80 and AZ91D Magnesium Alloys. Appl. Surf. Sci. 2009, 255, 4102–4108. [Google Scholar] [CrossRef] [Green Version]
- Ardika, R.D.; Triyono, T.; Muhayat, N. Triyono A Review Porosity in Aluminum Welding. Procedia Struct. Integr. 2021, 33, 171–180. [Google Scholar] [CrossRef]
- Zhao, Y.; Zhou, X.; Liu, T.; Kang, Y.; Zhan, X. Investigate on the Porosity Morphology and Formation Mechanism in laser-MIG Hybrid Welded Joint for 5A06 Aluminum Alloy with Y-shaped Groove. J. Manuf. Process. 2020, 57, 847–856. [Google Scholar] [CrossRef]
- Han, X.; Yang, Z.; Ma, Y.; Shi, C.; Xin, Z. Porosity Distribution and Mechanical Response of laser-MIG Hybrid Butt Welded 6082-T6 Aluminum Alloy Joint. Opt. Laser Technol. 2020, 132, 106511. [Google Scholar] [CrossRef]
- Yang, X.; Chen, H.; Li, M.V.; Bu, H.; Zhu, Z.; Cai, C. Porosity Suppressing and Grain Refining of Narrow-Gap Rotating laser-MIG Hybrid Welding of 5A06 Aluminum Alloy. J. Manuf. Process. 2021, 68, 1100–1113. [Google Scholar] [CrossRef]
- Talbot, D.E.J. Effects of Hydrogen in Aluminium, Magnesium, Copper, and their Alloys. Int. Metall. Rev. 1975, 20, 166–184. [Google Scholar] [CrossRef]
- Pastor, M.; Zhao, H.; Debroy, T. Pore Formation During Continuous Wave Nd:YAG Laser Welding of Aluminium for Automotive Applications. Weld. Int. 2001, 15, 275–281. [Google Scholar] [CrossRef]
- Zhou, Y.; Chen, G.; Zhang, Y.; Li, C.; Jiang, Y. Studies on 5A06 Aluminum Alloy in Fiber Laser MIG Arc Hy Brid Welding. Appl. Laser 2016, 36, 156–164. [Google Scholar]
- Cherepy, N.J.; Shen, T.H.; Esposito, A.P.; Tillotson, T.M. Characterization of an Effective Cleaning Procedure for Aluminum Alloys: Surface Enhanced Raman Spectroscopy and Zeta Potential Analysis. J. Colloid Interf. Sci. 2005, 282, 80–86. [Google Scholar] [CrossRef] [Green Version]
- Watanabe, T.; Takayama, H.; Yanagisawa, A. Joining of Aluminum Alloy to Steel by Friction Stir Welding. J. Mater. Process. Technol. 2006, 178, 342–349. [Google Scholar] [CrossRef]
- Tian, M.; Xu, S.; Wang, J.; Kumar, N.; Wertz, E.; Li, Q.; Campbell, P.M.; Chan, M.H.W.; Mallouk, T.E. Penetrating the Oxide Barrier in Situ and Separating Freestanding Porous Anodic Alumina Films in One Step. Nano Lett. 2005, 5, 697–703. [Google Scholar] [CrossRef]
- Xu, Z.; Ma, L.; Yan, J.; Yang, S.; Du, S. Wetting and Oxidation During Ultrasonic Soldering of an Alumina Reinforced Aluminum-Copper-Magnesium (2024 Al) Matrix Composite. Compos. Part A Appl. Sci. Manuf. 2012, 43, 407–414. [Google Scholar] [CrossRef]
- Qiang, W.; Yingchun, G.; Baoqiang, C.; Bojin, Q. Laser Cleaning of Commercial Al Alloy Surface for Tungsten Inert Gas Welding. J. Laser Appl. 2016, 28, 022507. [Google Scholar] [CrossRef]
- Wu, Y.; Lin, J.; Carlson, B.E.; Lu, P.; Balogh, M.P.; Irish, N.P.; Mei, Y. Effect of Laser Ablation Surface Treatment on Performance of Adhesive-Bonded Aluminum Alloys. Surf. Coat. Technol. 2016, 304, 340–347. [Google Scholar] [CrossRef]
- AlShaer, A.W.; Li, L.; Mistry, A. The Effects of Short Pulse Laser Surface Cleaning on Porosity Formation and Reduction in Laser Welding of Aluminium Alloy for Automotive Component Manufacture. Opt. Laser Technol. 2014, 64, 162–171. [Google Scholar] [CrossRef]
- Zhou, C.; Li, H.; Chen, G.; Wang, G.; Shan, Z. Effect of Single Pulsed Picosecond and 100 Nanosecond Laser Cleaning on Surface Morphology and Welding Quality of Aluminium Alloy. Opt. Laser Technol. 2020, 127, 106197. [Google Scholar] [CrossRef]
- Liu, B.; Wang, C.; Mi, G.; Wang, J.; Zhang, W.; Zhang, X. Oxygen Content and Morphology of Laser Cleaned 5083 Aluminum Alloy and its Influences On Weld Porosity. Opt. Laser Technol. 2021, 140, 107031. [Google Scholar] [CrossRef]
- Wei, P.; Chen, Z.; Wang, D.; Zhang, R.; Li, X.; Zhang, F.; Sun, K.; Lei, Y. Effect of Laser Cleaning on Mechanical Properties of Laser Lap Welded Joint of SUS310S Stainless Steel and 6061 Aluminum Alloy. Mater. Lett. 2021, 291, 129549. [Google Scholar] [CrossRef]
- Afonso, C.N.; Vega, F.; Solís, J. Real Time Optical Diagnostics During Pulsed Uv Laser Induced Surface Cleaning and Oxidation. Microelectron. Eng. 1994, 25, 223–228. [Google Scholar] [CrossRef]
- Zhang, G.; Hua, X.; Li, F.; Zhang, Y.; Shen, C.; Cheng, J. Effect of Laser Cleaning Process Parameters on the Surface Roughness of 5754-Grade Aluminum Alloy. Int. J. Adv. Manuf. Technol. 2019, 105, 2481–2490. [Google Scholar] [CrossRef]
- Liu, B.; Mi, G.; Wang, C. Reoxidation Process and Corrosion Behavior of TA15 Alloy by Laser Ablation. Rare Met. 2021, 40, 865–876. [Google Scholar] [CrossRef]
- Munro, M. Evaluated Material Properties for a Sintered alpha-Alumina. J. Am. Ceram. Soc. 1997, 80, 1919–1928. [Google Scholar] [CrossRef]
- Fan, Z.; Li, C. Preparation of NiB Alloy From Spent NiAl Catalysts by Induction Furnace. J. Alloys Compd. 2007, 436, 178–180. [Google Scholar] [CrossRef]
- Duley, W.W. Laser Processing and Analysis of Materials; Plenum Press: New York, NY, USA, 1983. [Google Scholar]
- Daminelli, G.; Meja, P.; Cortona, A.; Krueger, J.; Autric, M.L.; Kautek, W. Femtosecond and Nanosecond Laser Removal of Anodic Oxide Layers From Aluminum. In High-Power Laser Ablation IV; SPIE: Bellingham, WA, USA, 2002. [Google Scholar]
- Zhang, G.; Hua, X.; Huang, Y.; Zhang, Y.; Li, F.; Shen, C.; Cheng, J. Investigation On Mechanism of Oxide Removal and Plasma Behavior during Laser Cleaning on Aluminum Alloy. Appl. Surf. Sci. 2020, 506, 144666. [Google Scholar] [CrossRef]
- Guo, H.; Martukanitz, R.; DebRoy, T. Laser Assisted Cleaning of Oxide Films on SUS409 Stainless Steel. J. Laser Appl. 2004, 16, 236–244. [Google Scholar] [CrossRef]
- Li, Z.; Zhang, D.; Su, X.; Yang, S.; Xu, J.; Ma, R.; Shan, D.; Guo, B. Removal Mechanism of Surface Cleaning on TA15 Titanium Alloy Using Nanosecond Pulsed Laser. Opt. Laser Technol. 2021, 139, 106998. [Google Scholar] [CrossRef]
- Shi, T.; Wang, C.; Mi, G.; Yan, F. A Study of Microstructure and Mechanical Properties of Aluminum Alloy Using Laser Cleaning. J. Manuf. Process. 2019, 42, 60–66. [Google Scholar] [CrossRef]
- Moshtaghi, M.; Loder, B.; Safyari, M.; Willidal, T.; Hojo, T.; Mori, G. Hydrogen Trapping and Desorption Affected by Ferrite Grain Boundary Types in Shielded Metal and Flux-Cored Arc Weldments with Ni Addition. Int. J. Hydrogen Energy 2022, 47, 20676–20683. [Google Scholar] [CrossRef]
- Liu, B.; Mi, G.; Wang, C. Study on the Morphology and Microstructure of 5A06 Alloy by High-Pulse-Frequency Pulsed Laser Micro Polishing. Mater. Chem. Phys. 2020, 255, 123500. [Google Scholar] [CrossRef]
- Wang, L.; Wang, L.; Luo, C.; Wang, S.; Hua, Z.; Wang, C. Effect of Laser Cleaning Titanium Alloy Surface Scale on Matrix Properties. Hot Work. Technol. 2020, 1–5. [Google Scholar] [CrossRef]


| Parameters | Symbol | Value | Unit |
|---|---|---|---|
| Laser power | P | 25, 50, 75, 100, 125, 150, 175, 200 | W |
| Scanning frequency | Fs | 25, 50, 75, 100, 125, 150, 175, 200 | Hz |
| Cleaning speed | ν | 0.5, 0.6, 0.7, 0.8, 0.9, 1.0, 1.1, 1.2 | m/min |
| Scanning width | L | 60 | mm |
| Pulse frequency | Fp | 130 | kHz |
| Parameters | Symbol | Value | Unit |
|---|---|---|---|
| Laser power | P | 150 | W |
| Scanning frequency | Fs | 125 | Hz |
| Cleaning speed | ν | 0.8 | m/min |
| Scanning width | L | 60 | mm |
| Pulse frequency | Fp | 130 | kHz |
Publisher’s Note: MDPI stays neutral with regard to jurisdictional claims in published maps and institutional affiliations. |
© 2022 by the authors. Licensee MDPI, Basel, Switzerland. This article is an open access article distributed under the terms and conditions of the Creative Commons Attribution (CC BY) license (https://creativecommons.org/licenses/by/4.0/).
Share and Cite
Zhang, Y.; Yao, Q.; Long, W.; Wang, C.; Lin, J.; Liu, Z. Welding Defect and Mechanical Properties of Nanosecond Laser Cleaning 6005A Aluminum Alloy. Materials 2022, 15, 7841. https://doi.org/10.3390/ma15217841
Zhang Y, Yao Q, Long W, Wang C, Lin J, Liu Z. Welding Defect and Mechanical Properties of Nanosecond Laser Cleaning 6005A Aluminum Alloy. Materials. 2022; 15(21):7841. https://doi.org/10.3390/ma15217841
Chicago/Turabian StyleZhang, Yuelai, Qi Yao, Weifeng Long, Chunming Wang, Ji Lin, and Zehui Liu. 2022. "Welding Defect and Mechanical Properties of Nanosecond Laser Cleaning 6005A Aluminum Alloy" Materials 15, no. 21: 7841. https://doi.org/10.3390/ma15217841