
Numerical Investigation on Progressive Collapse Mitigation of Steel Beam–Column Joint Using Steel Plates

Abstract
:1. Introduction
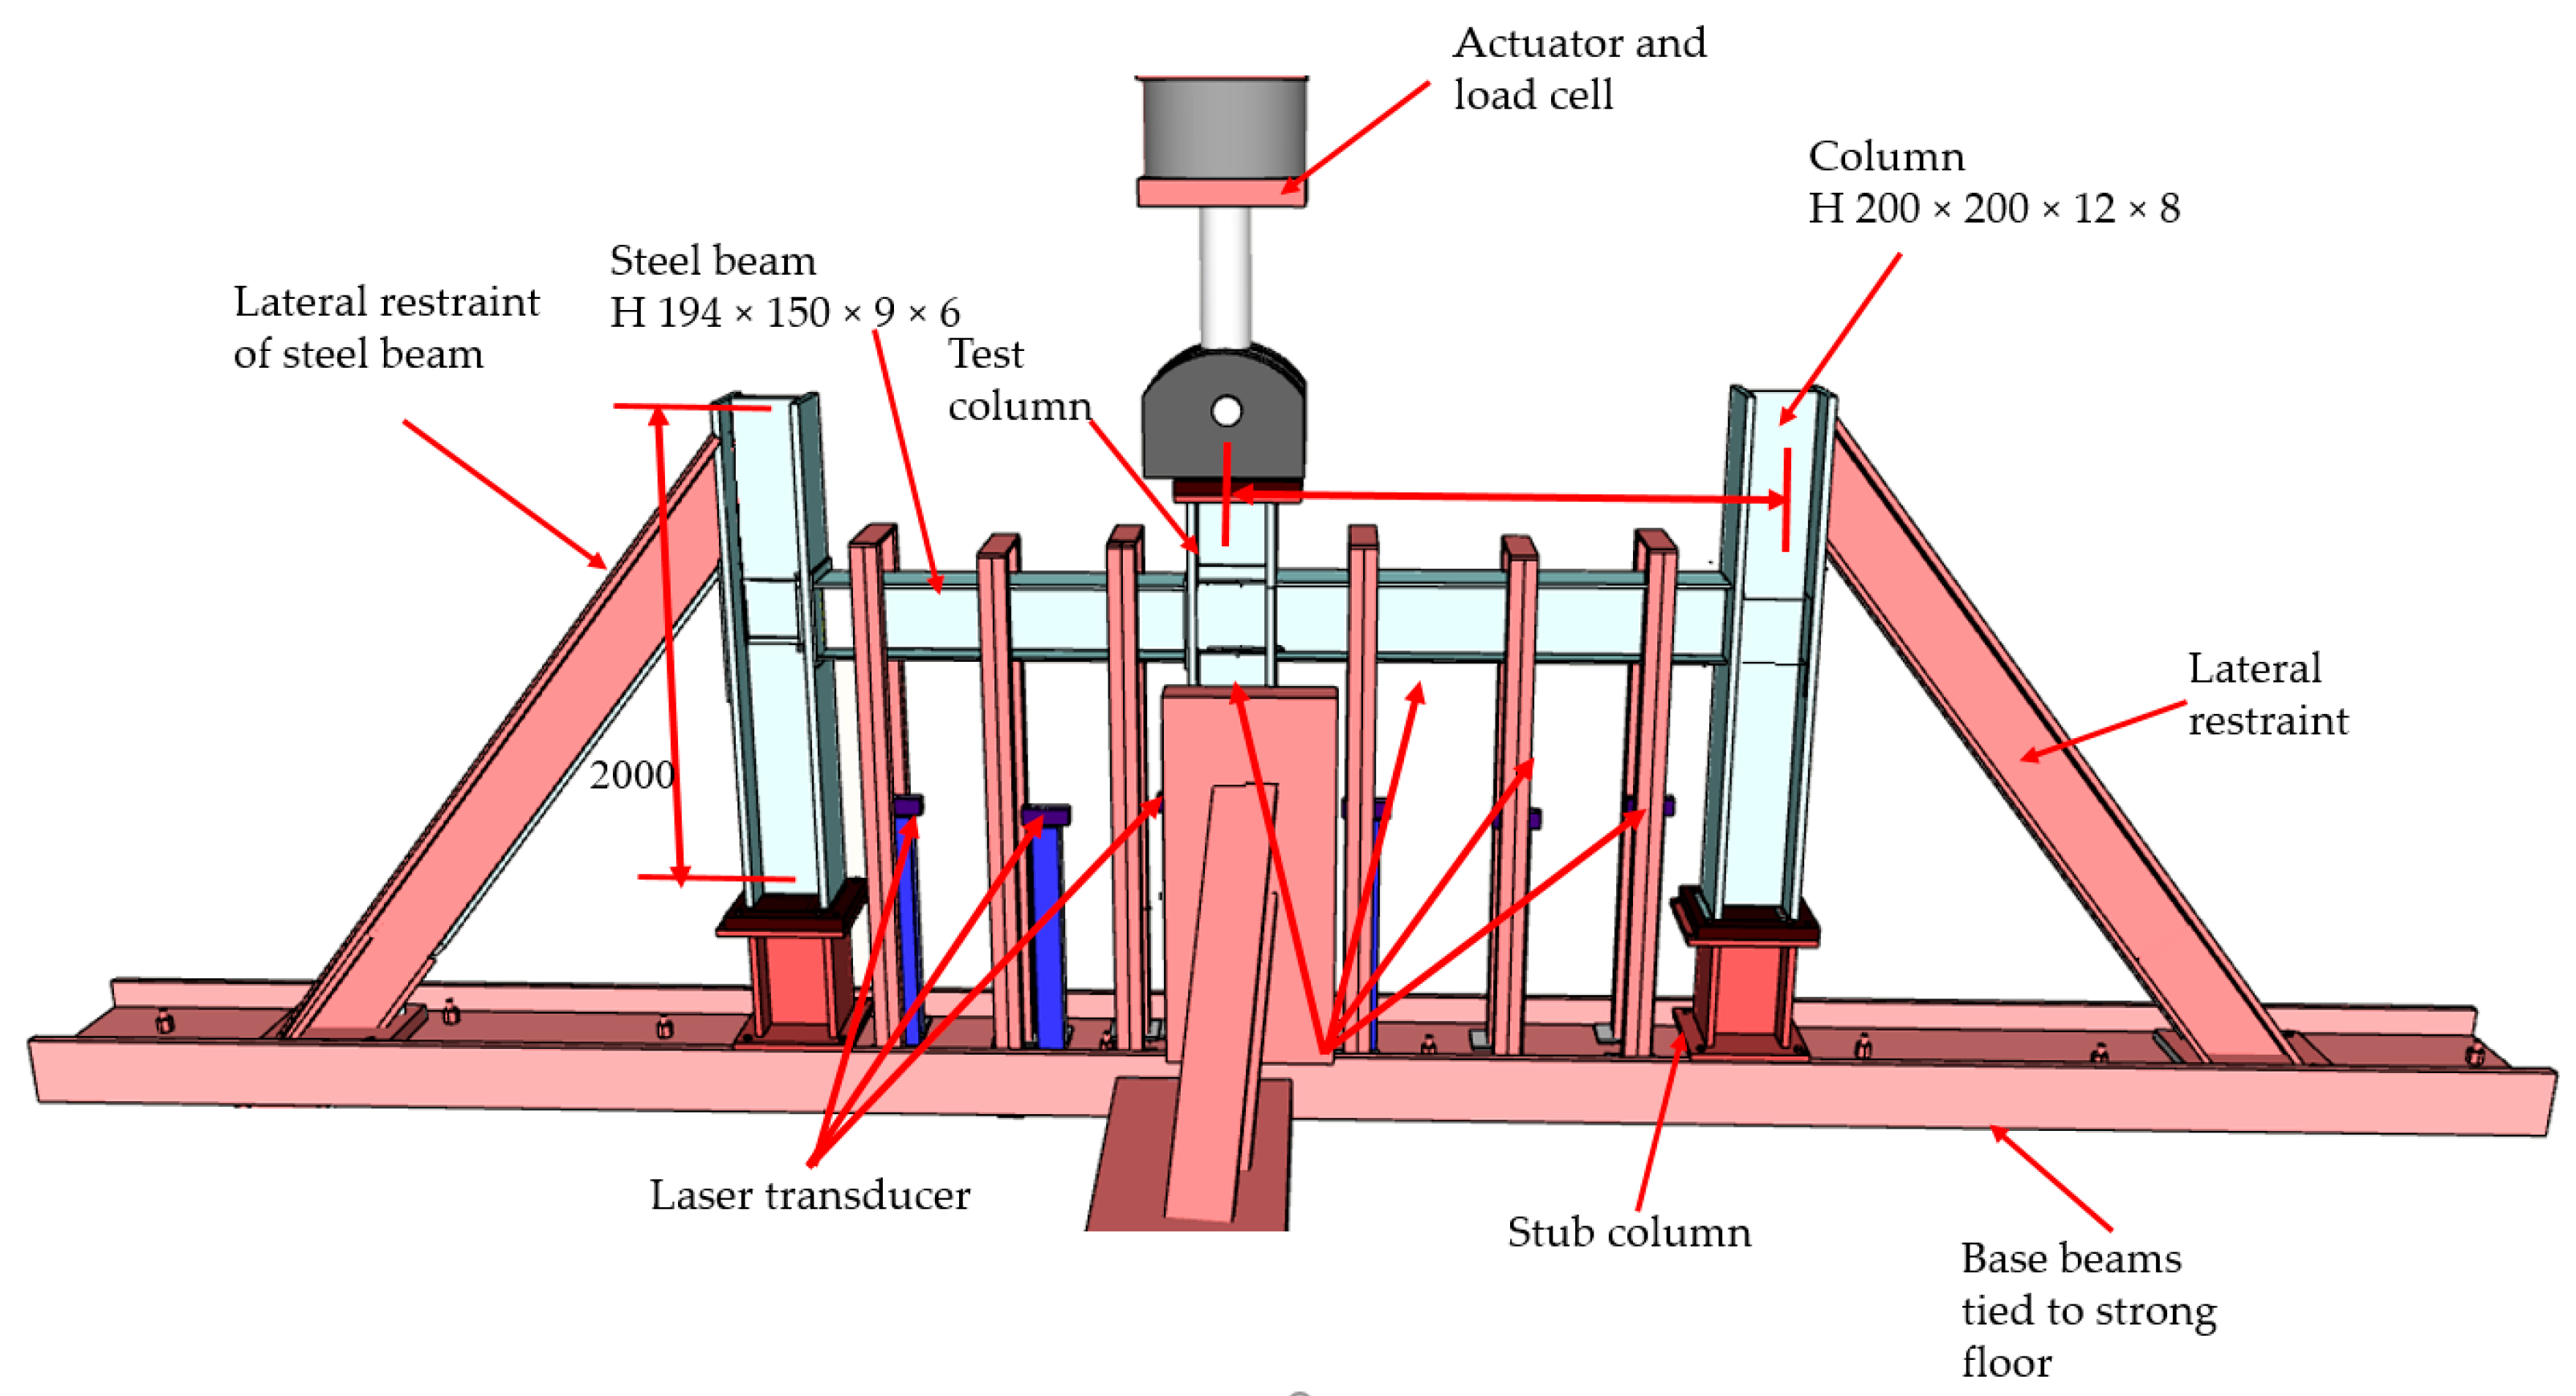
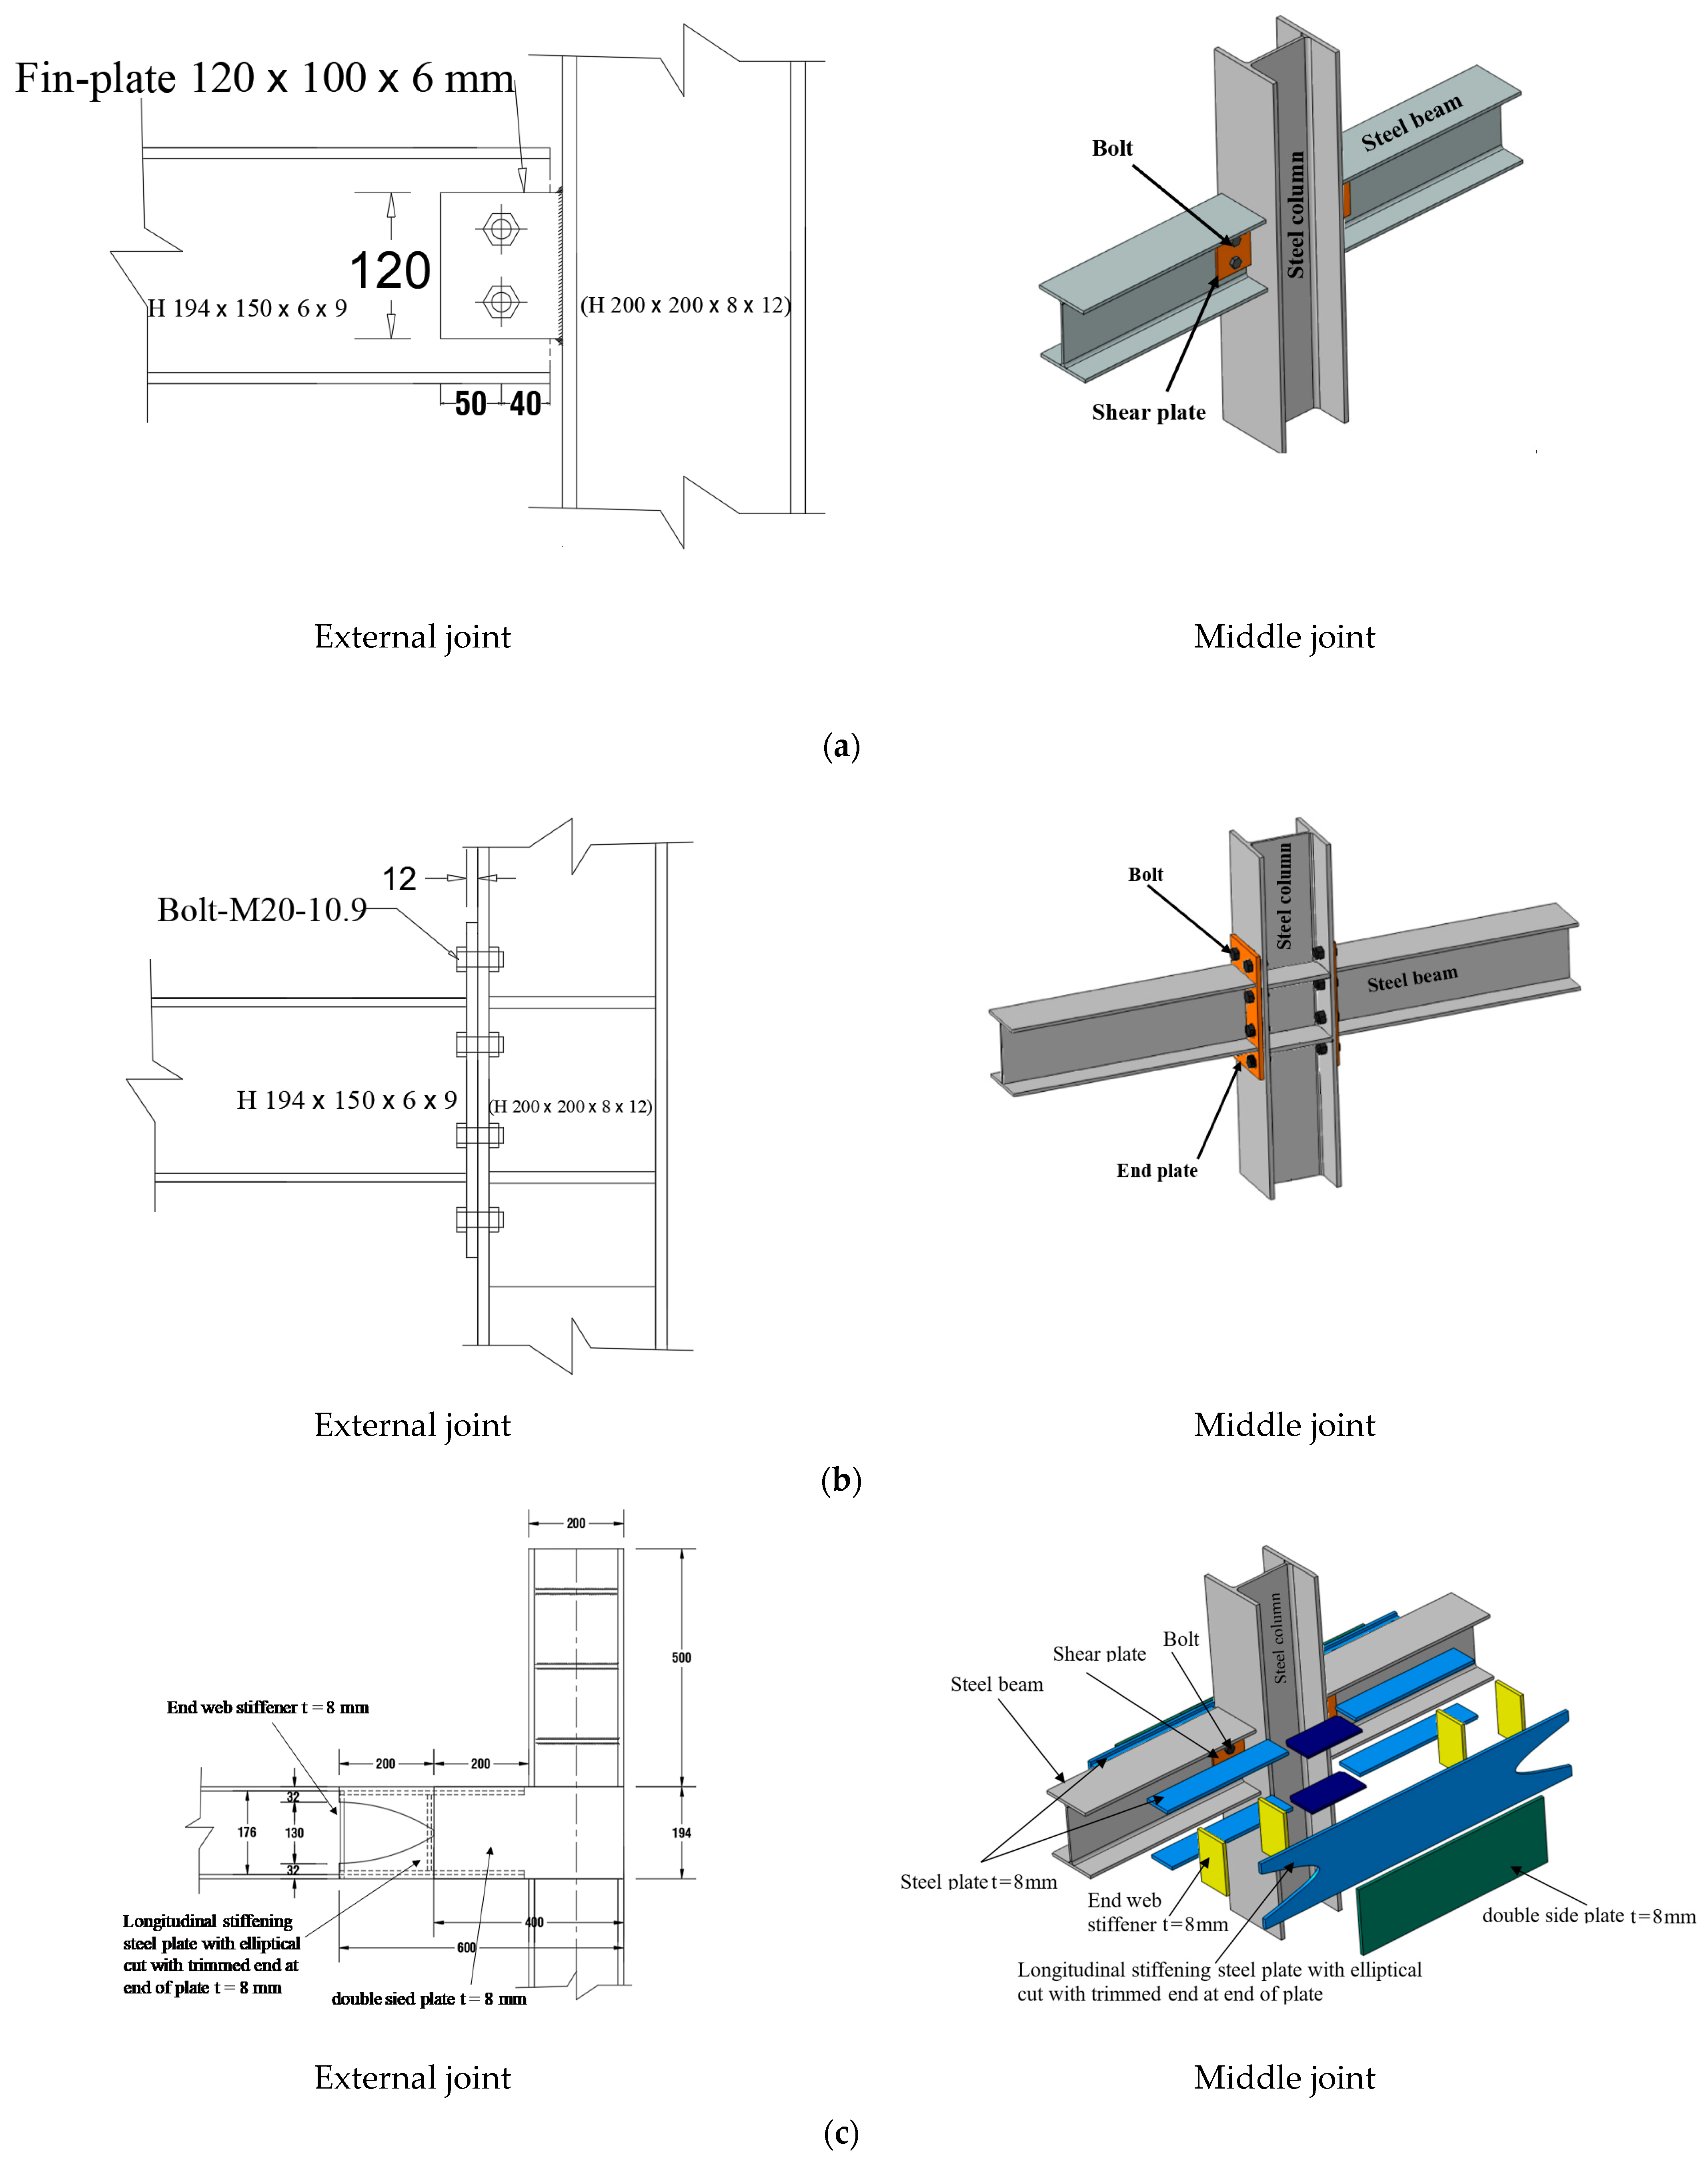
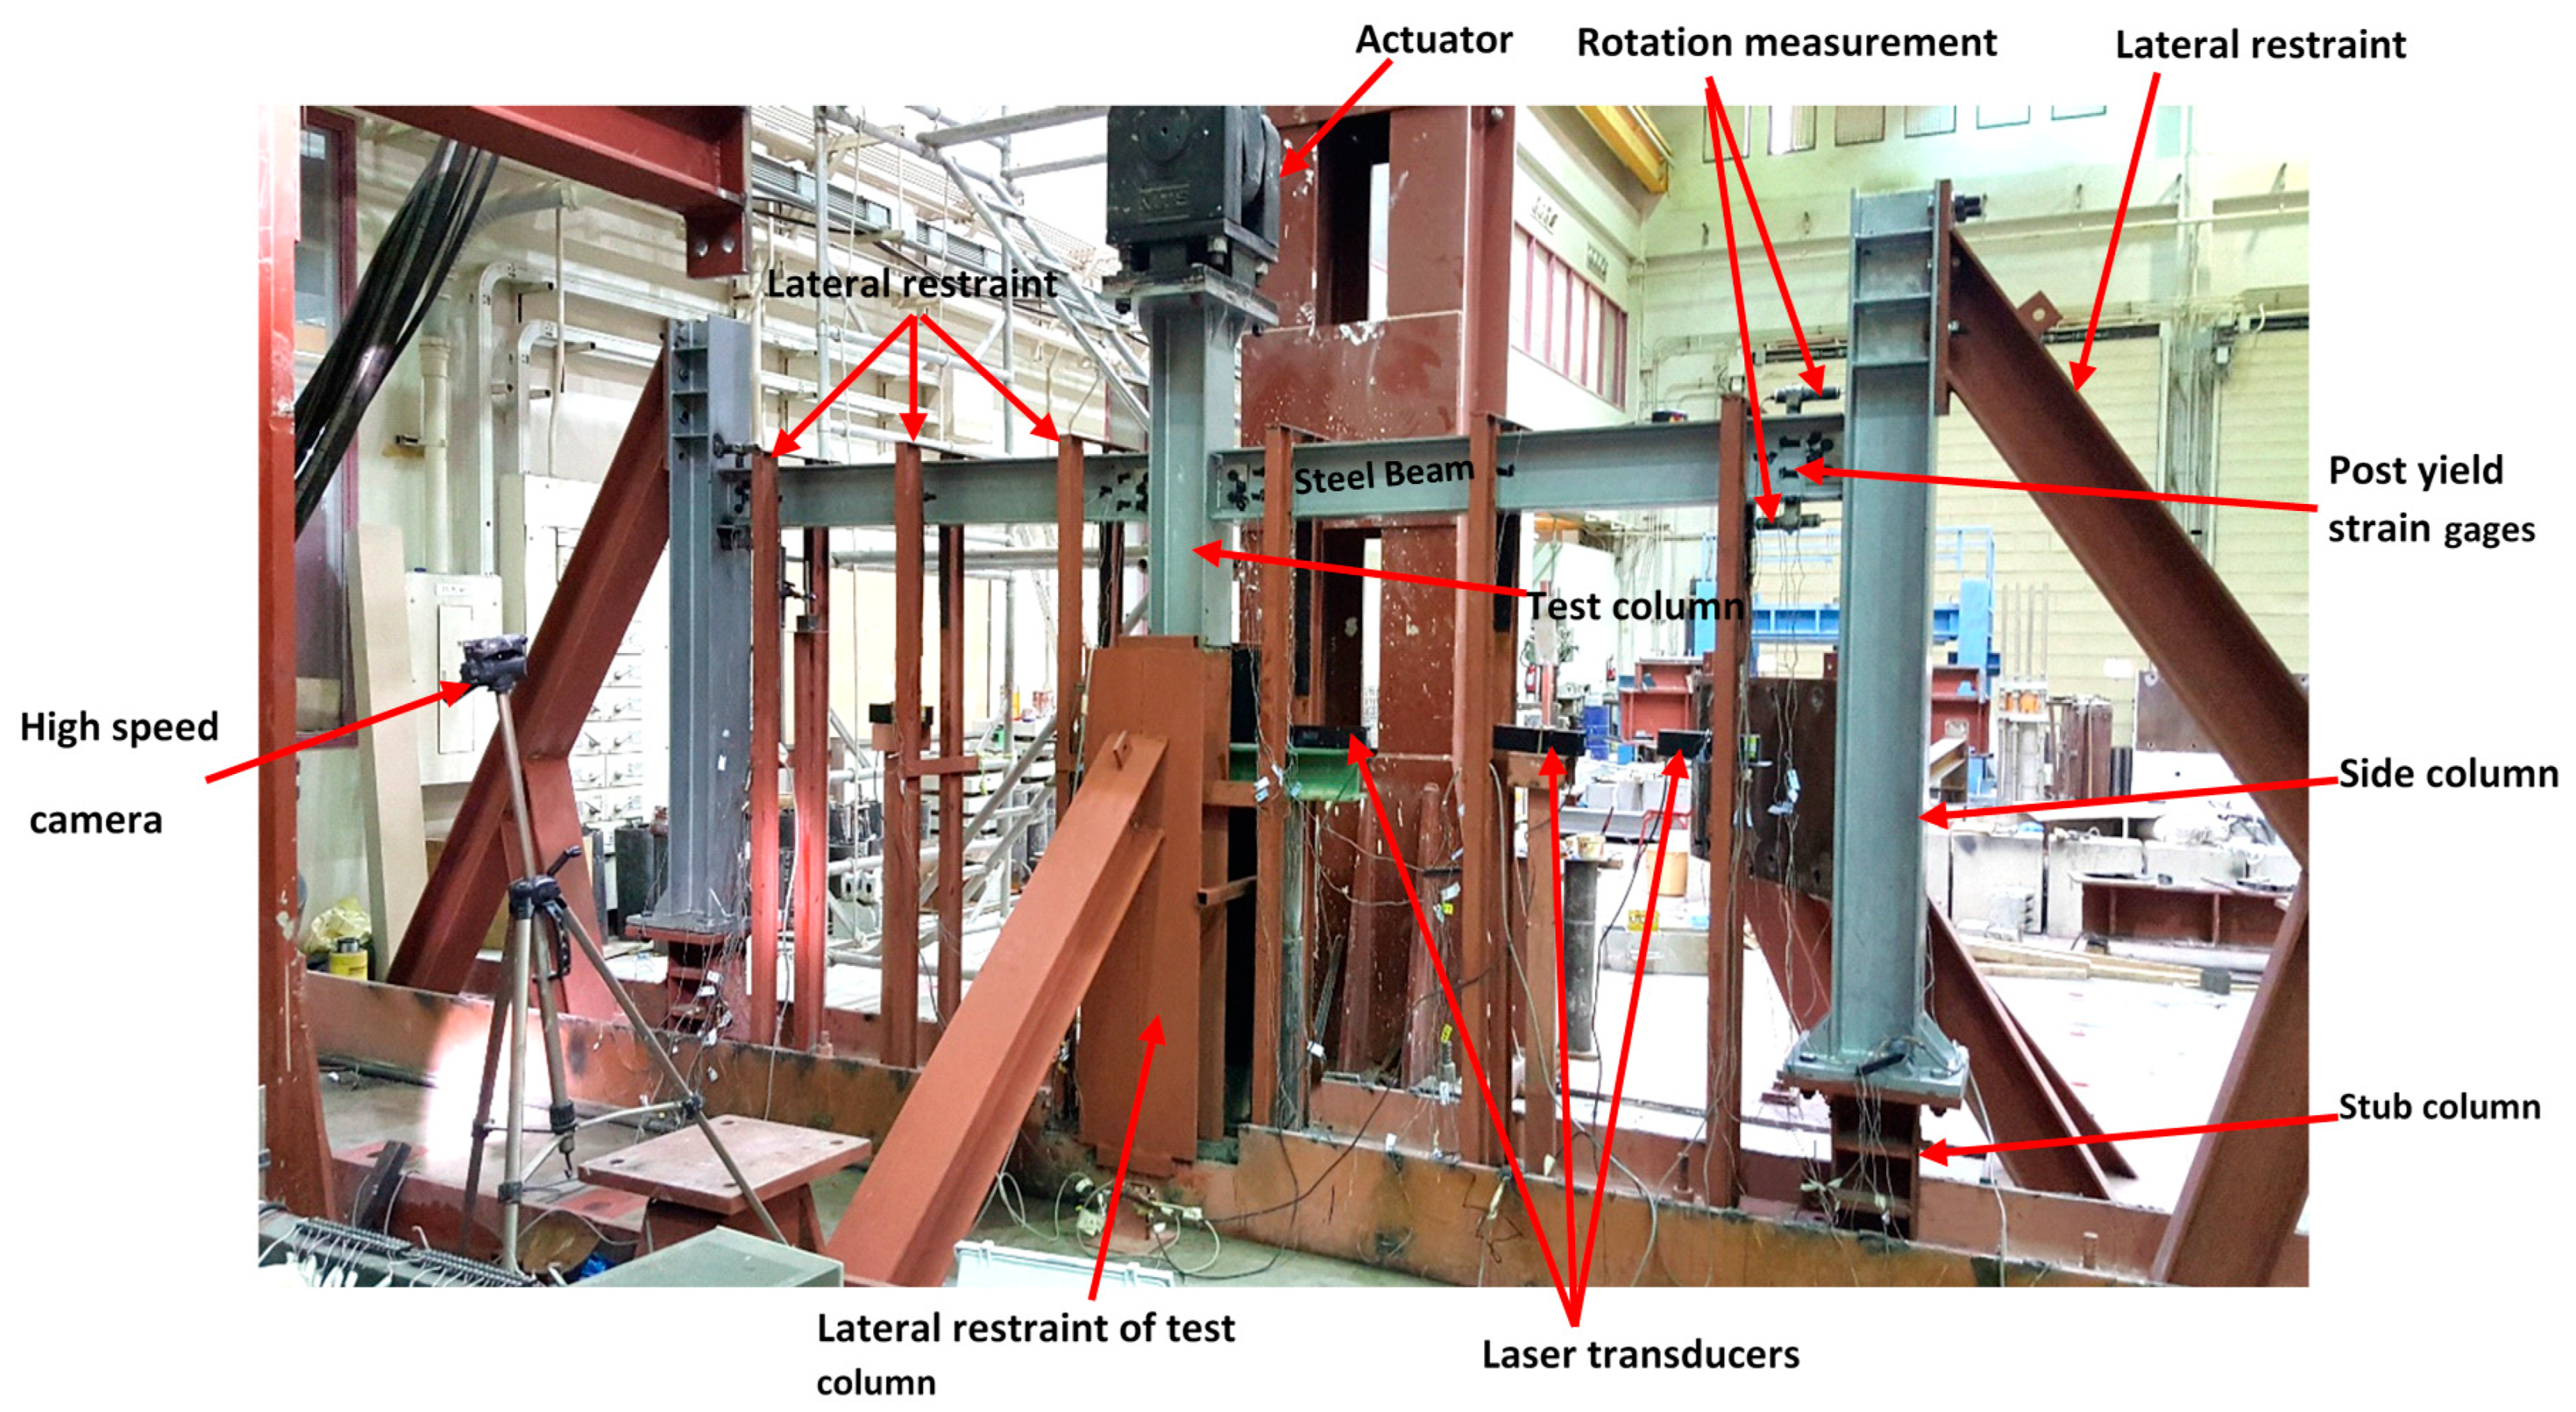
2. Experimental Specimens and Test Setup
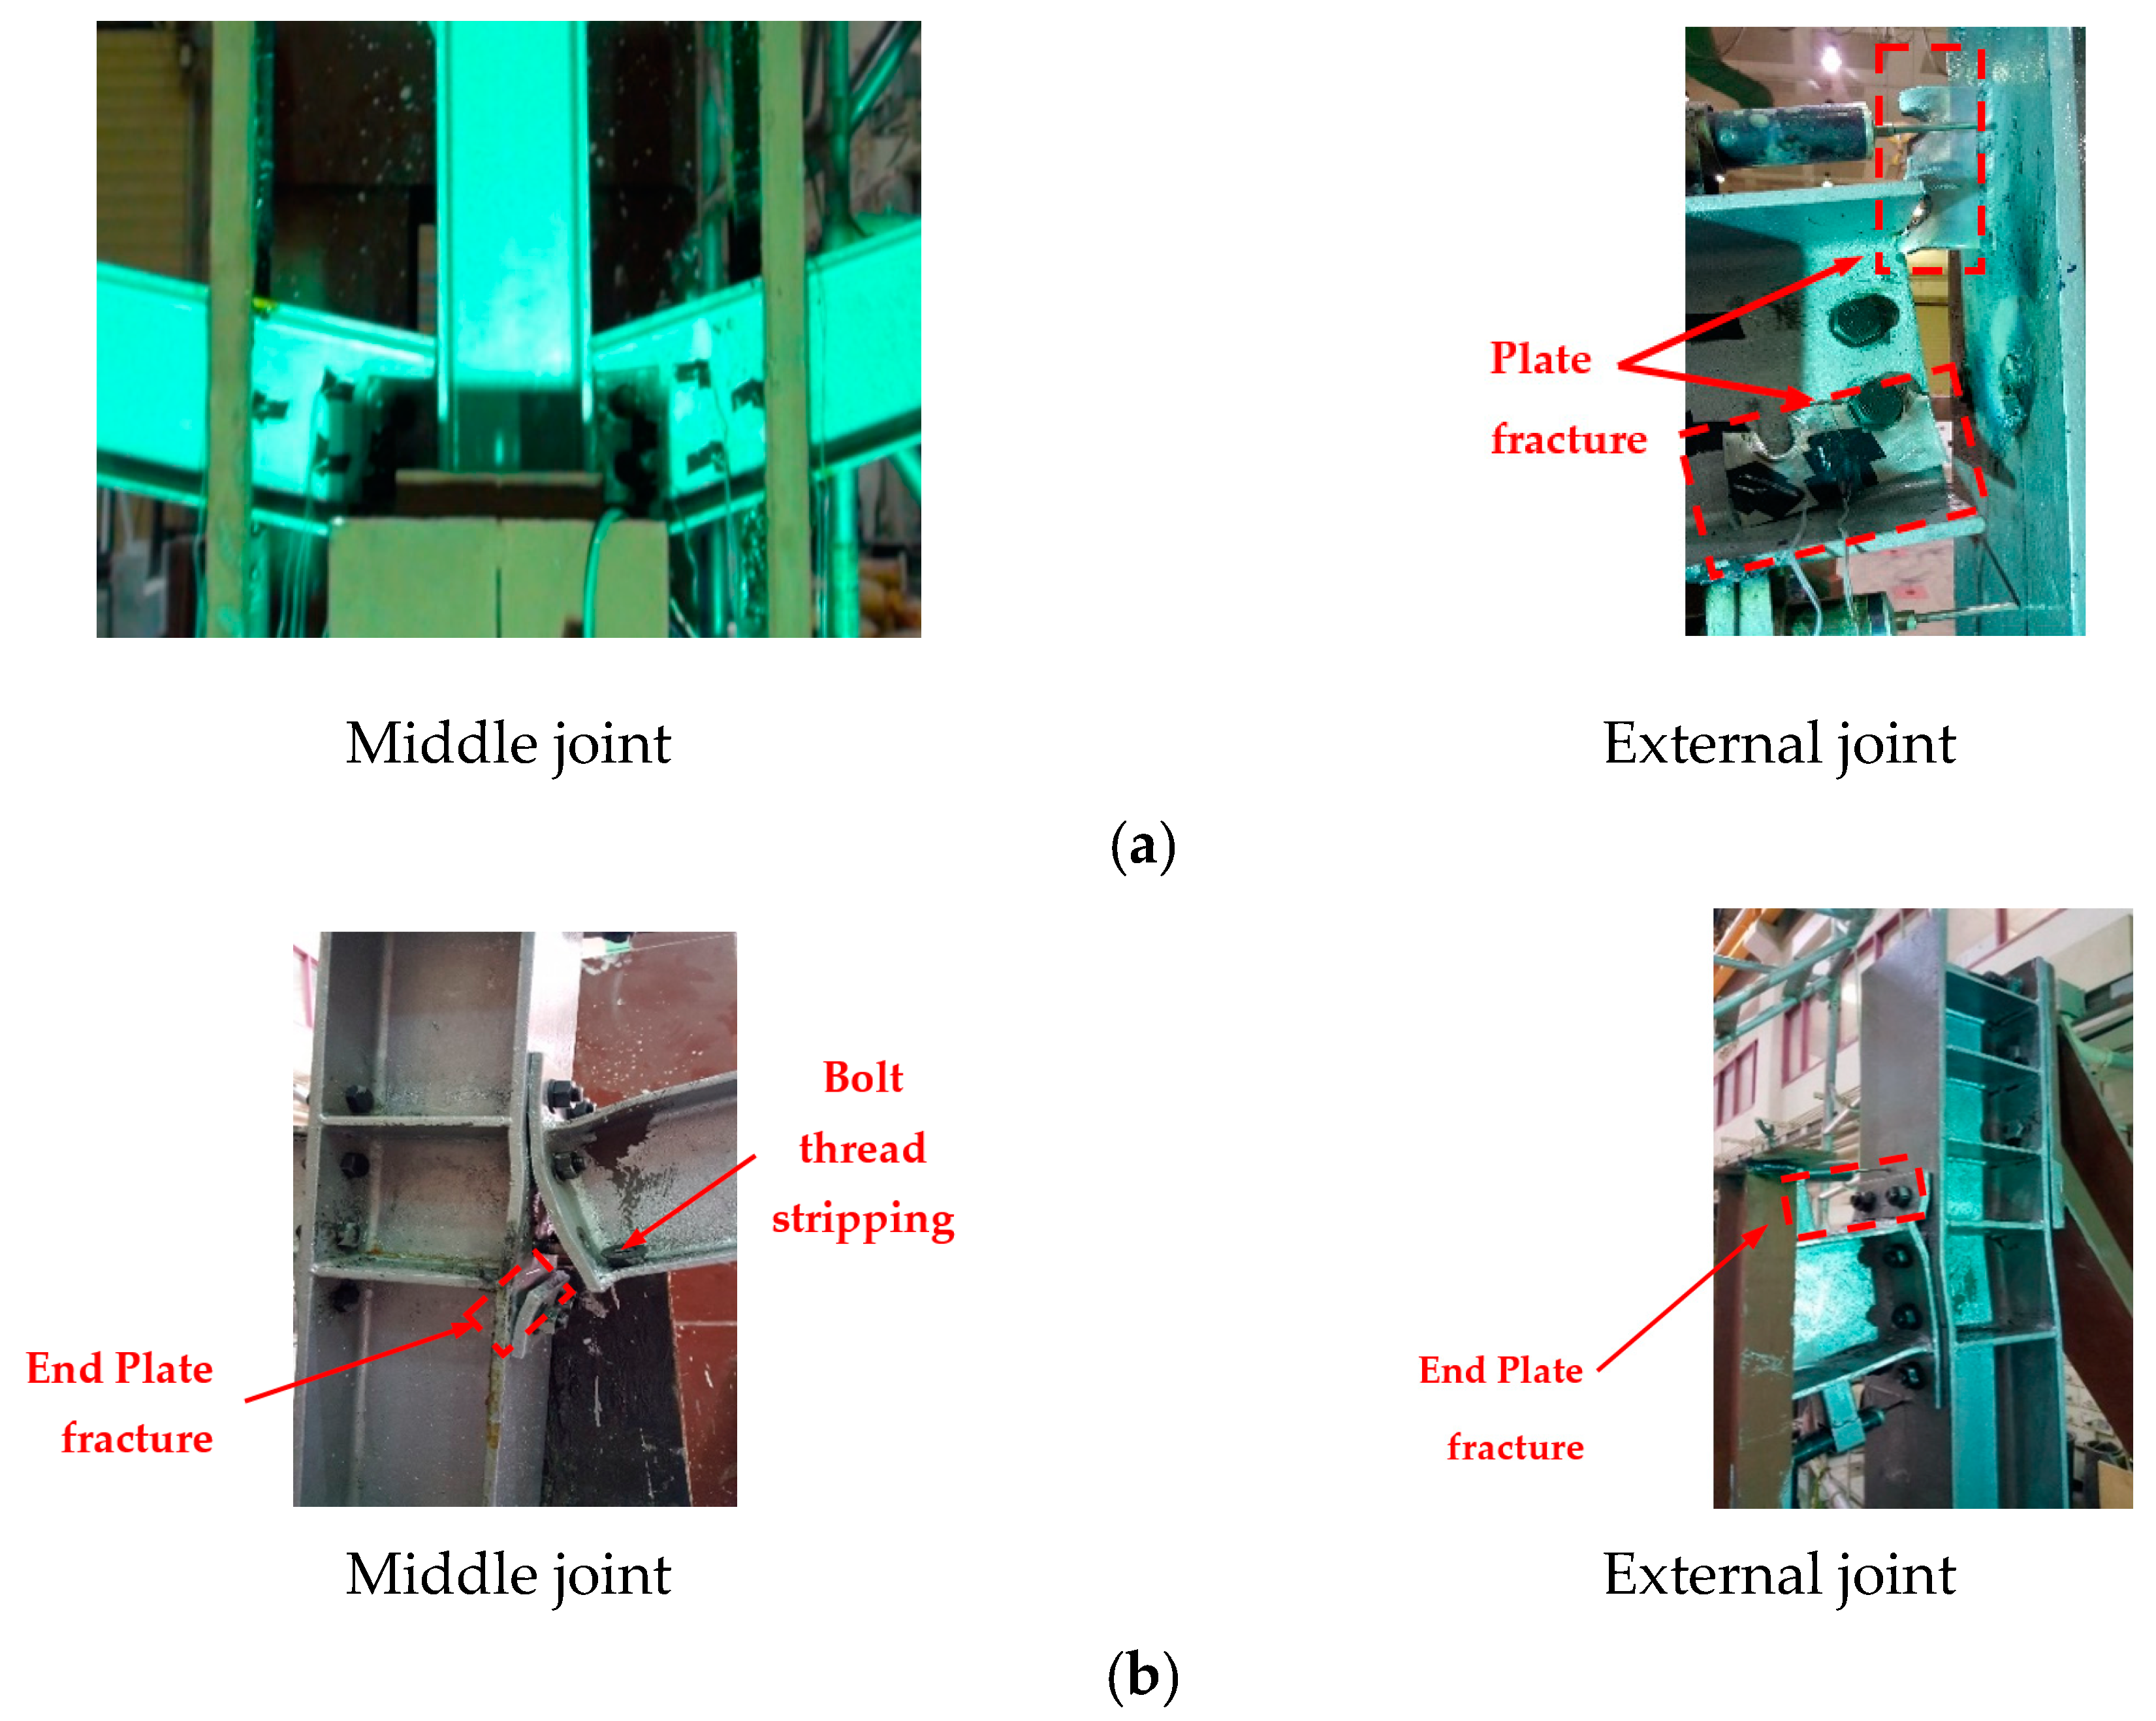
3. Experimental Results
4. FE Modeling
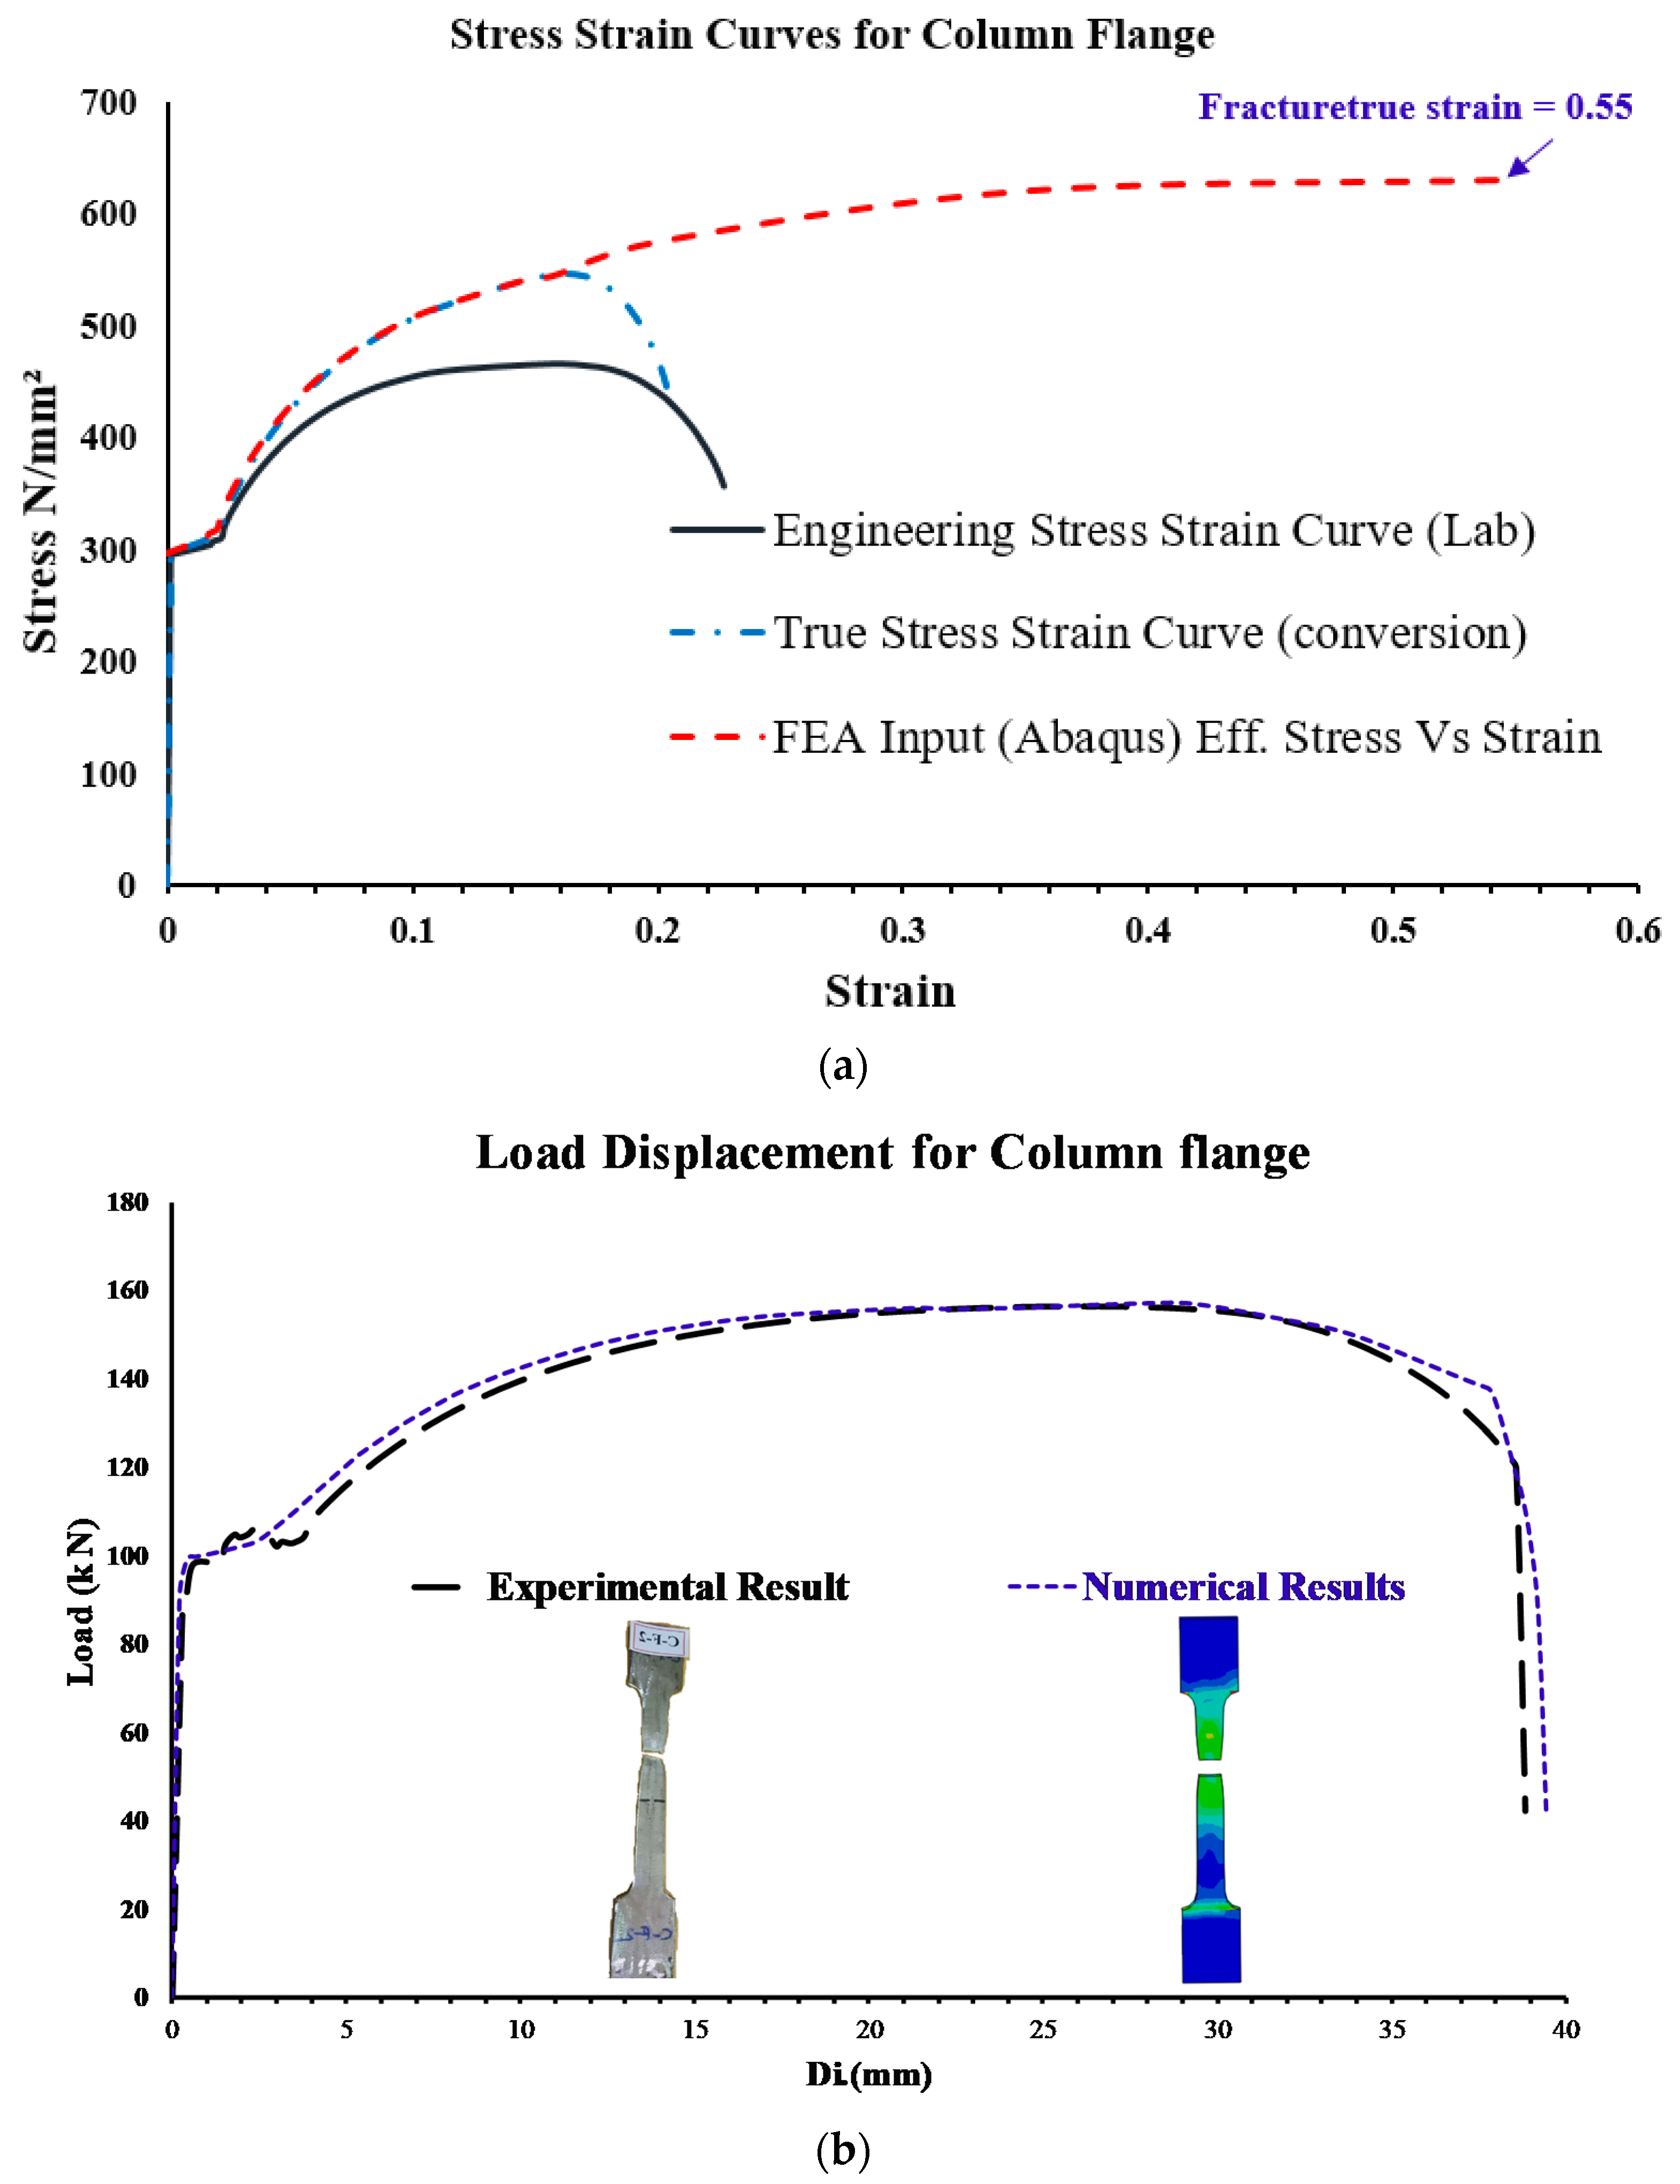
4.1. Material Modeling
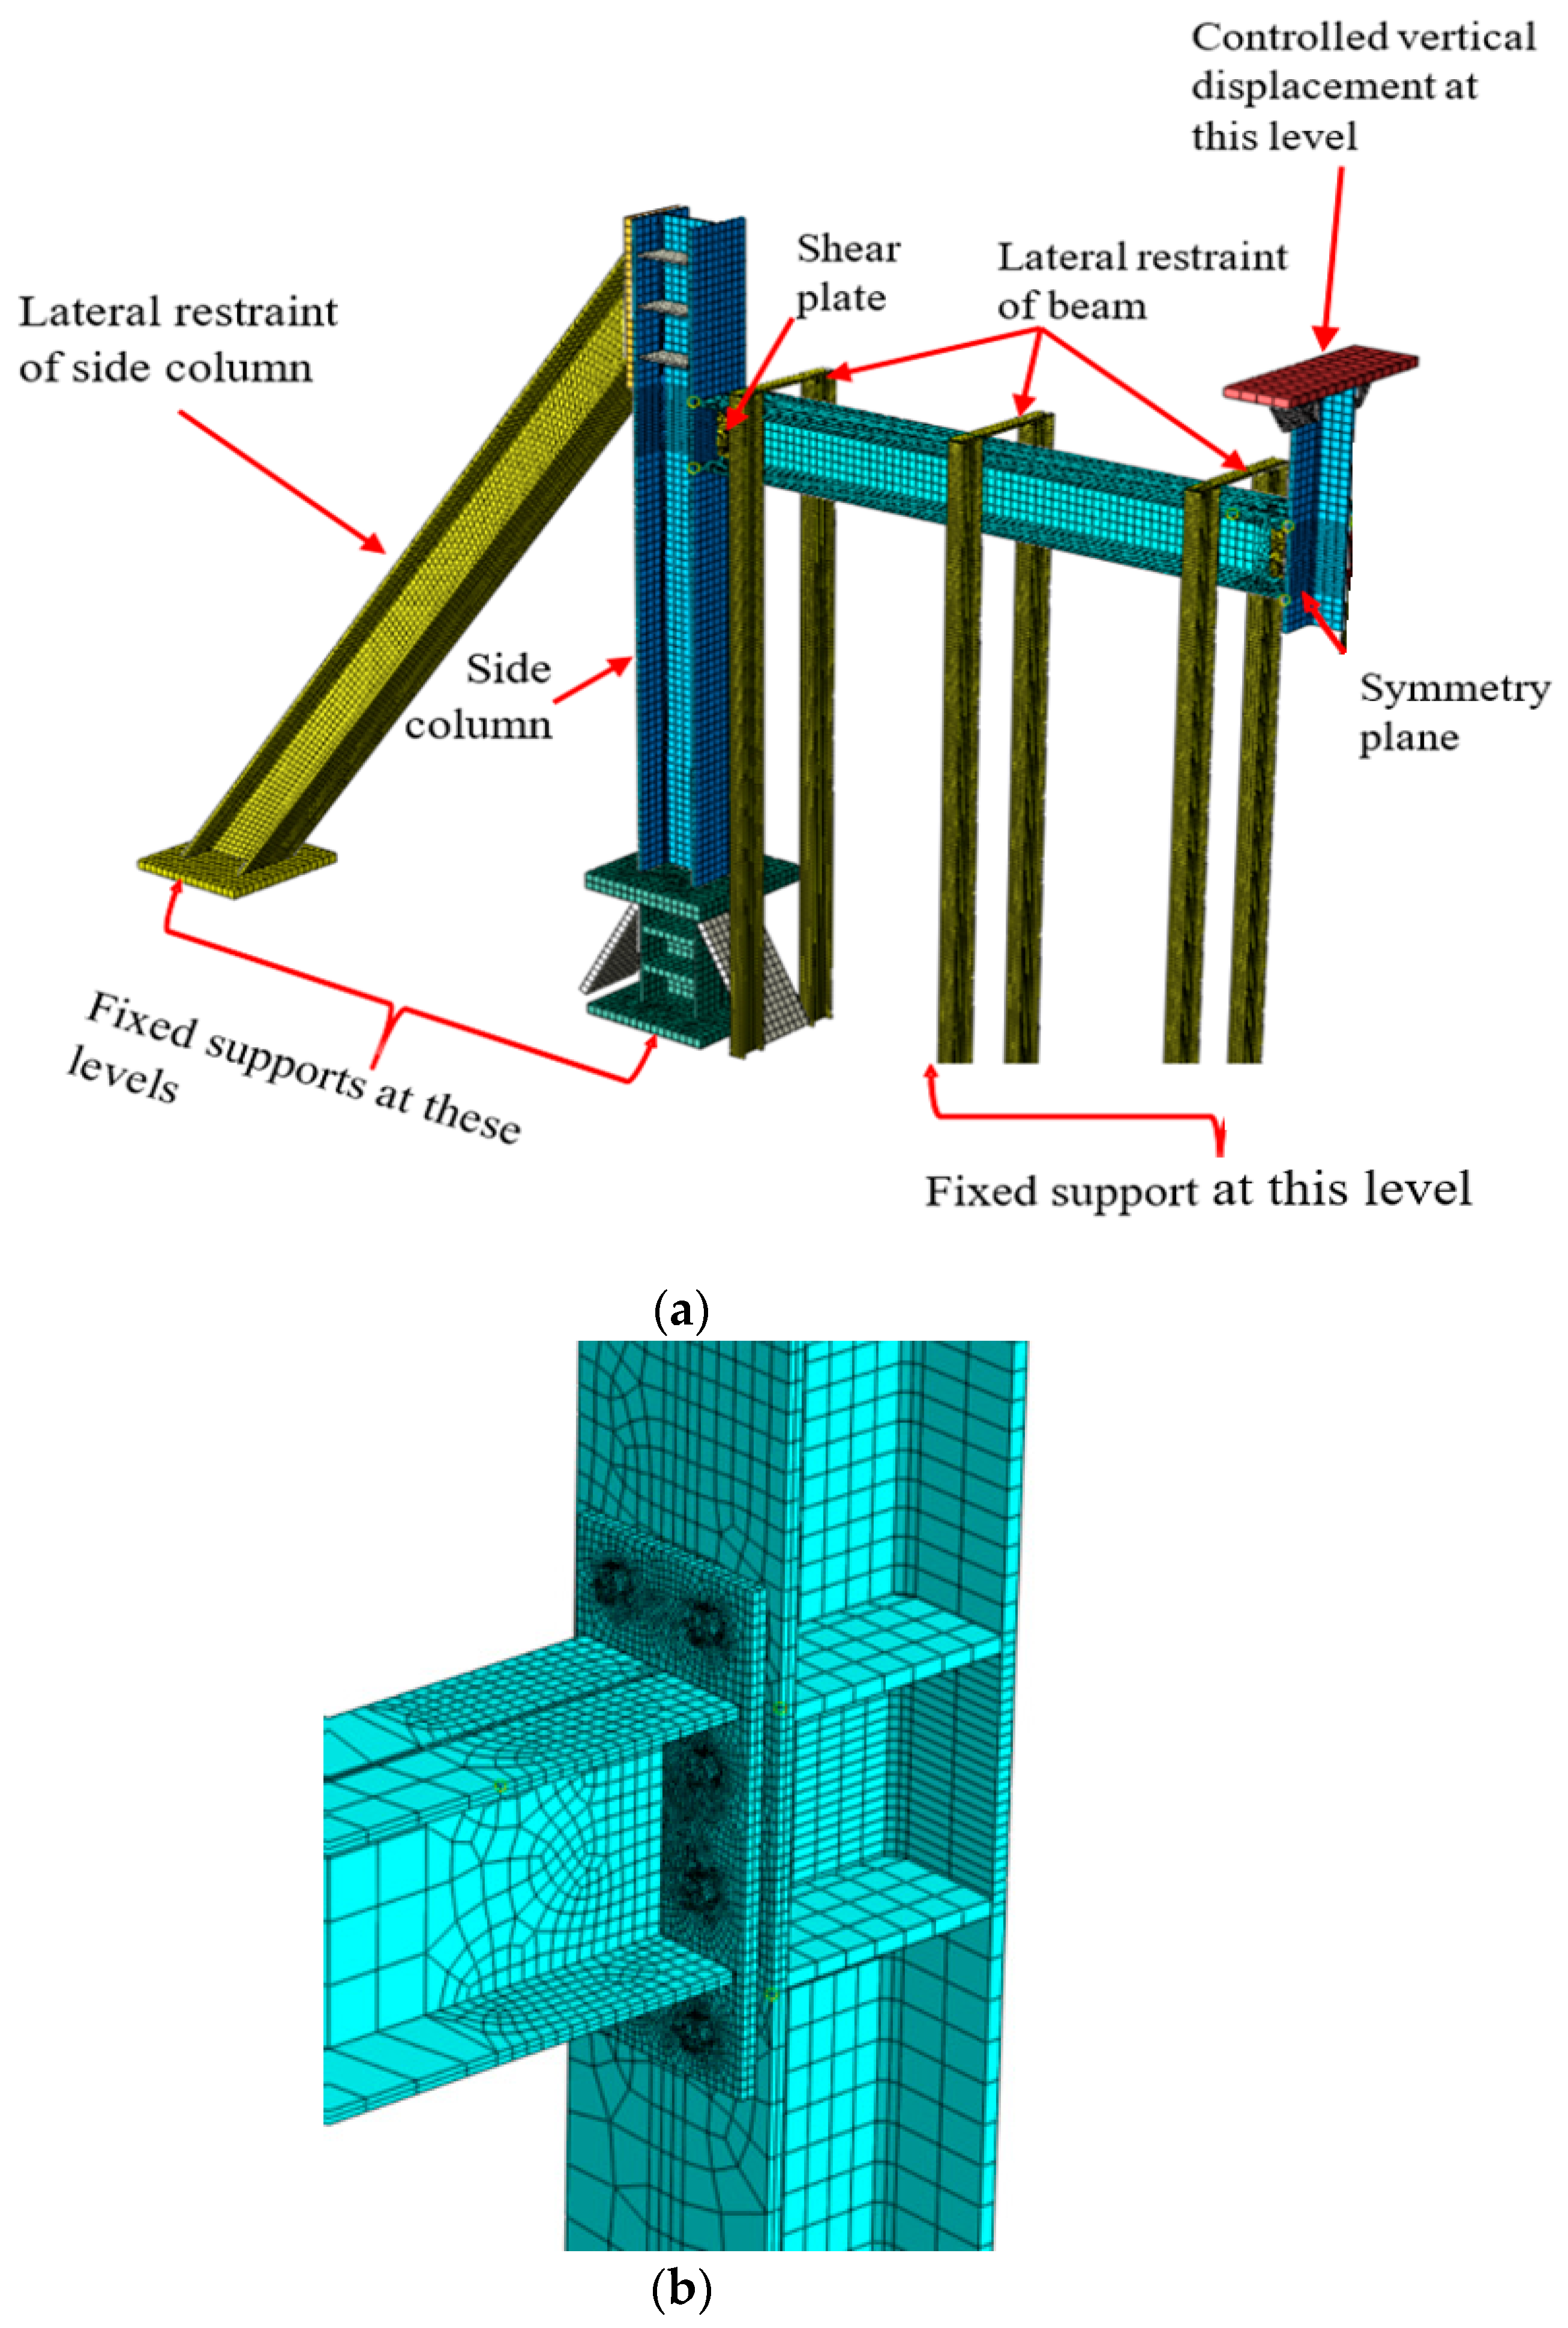
4.2. Mesh Generation
4.3. Loading and Boundary Conditions
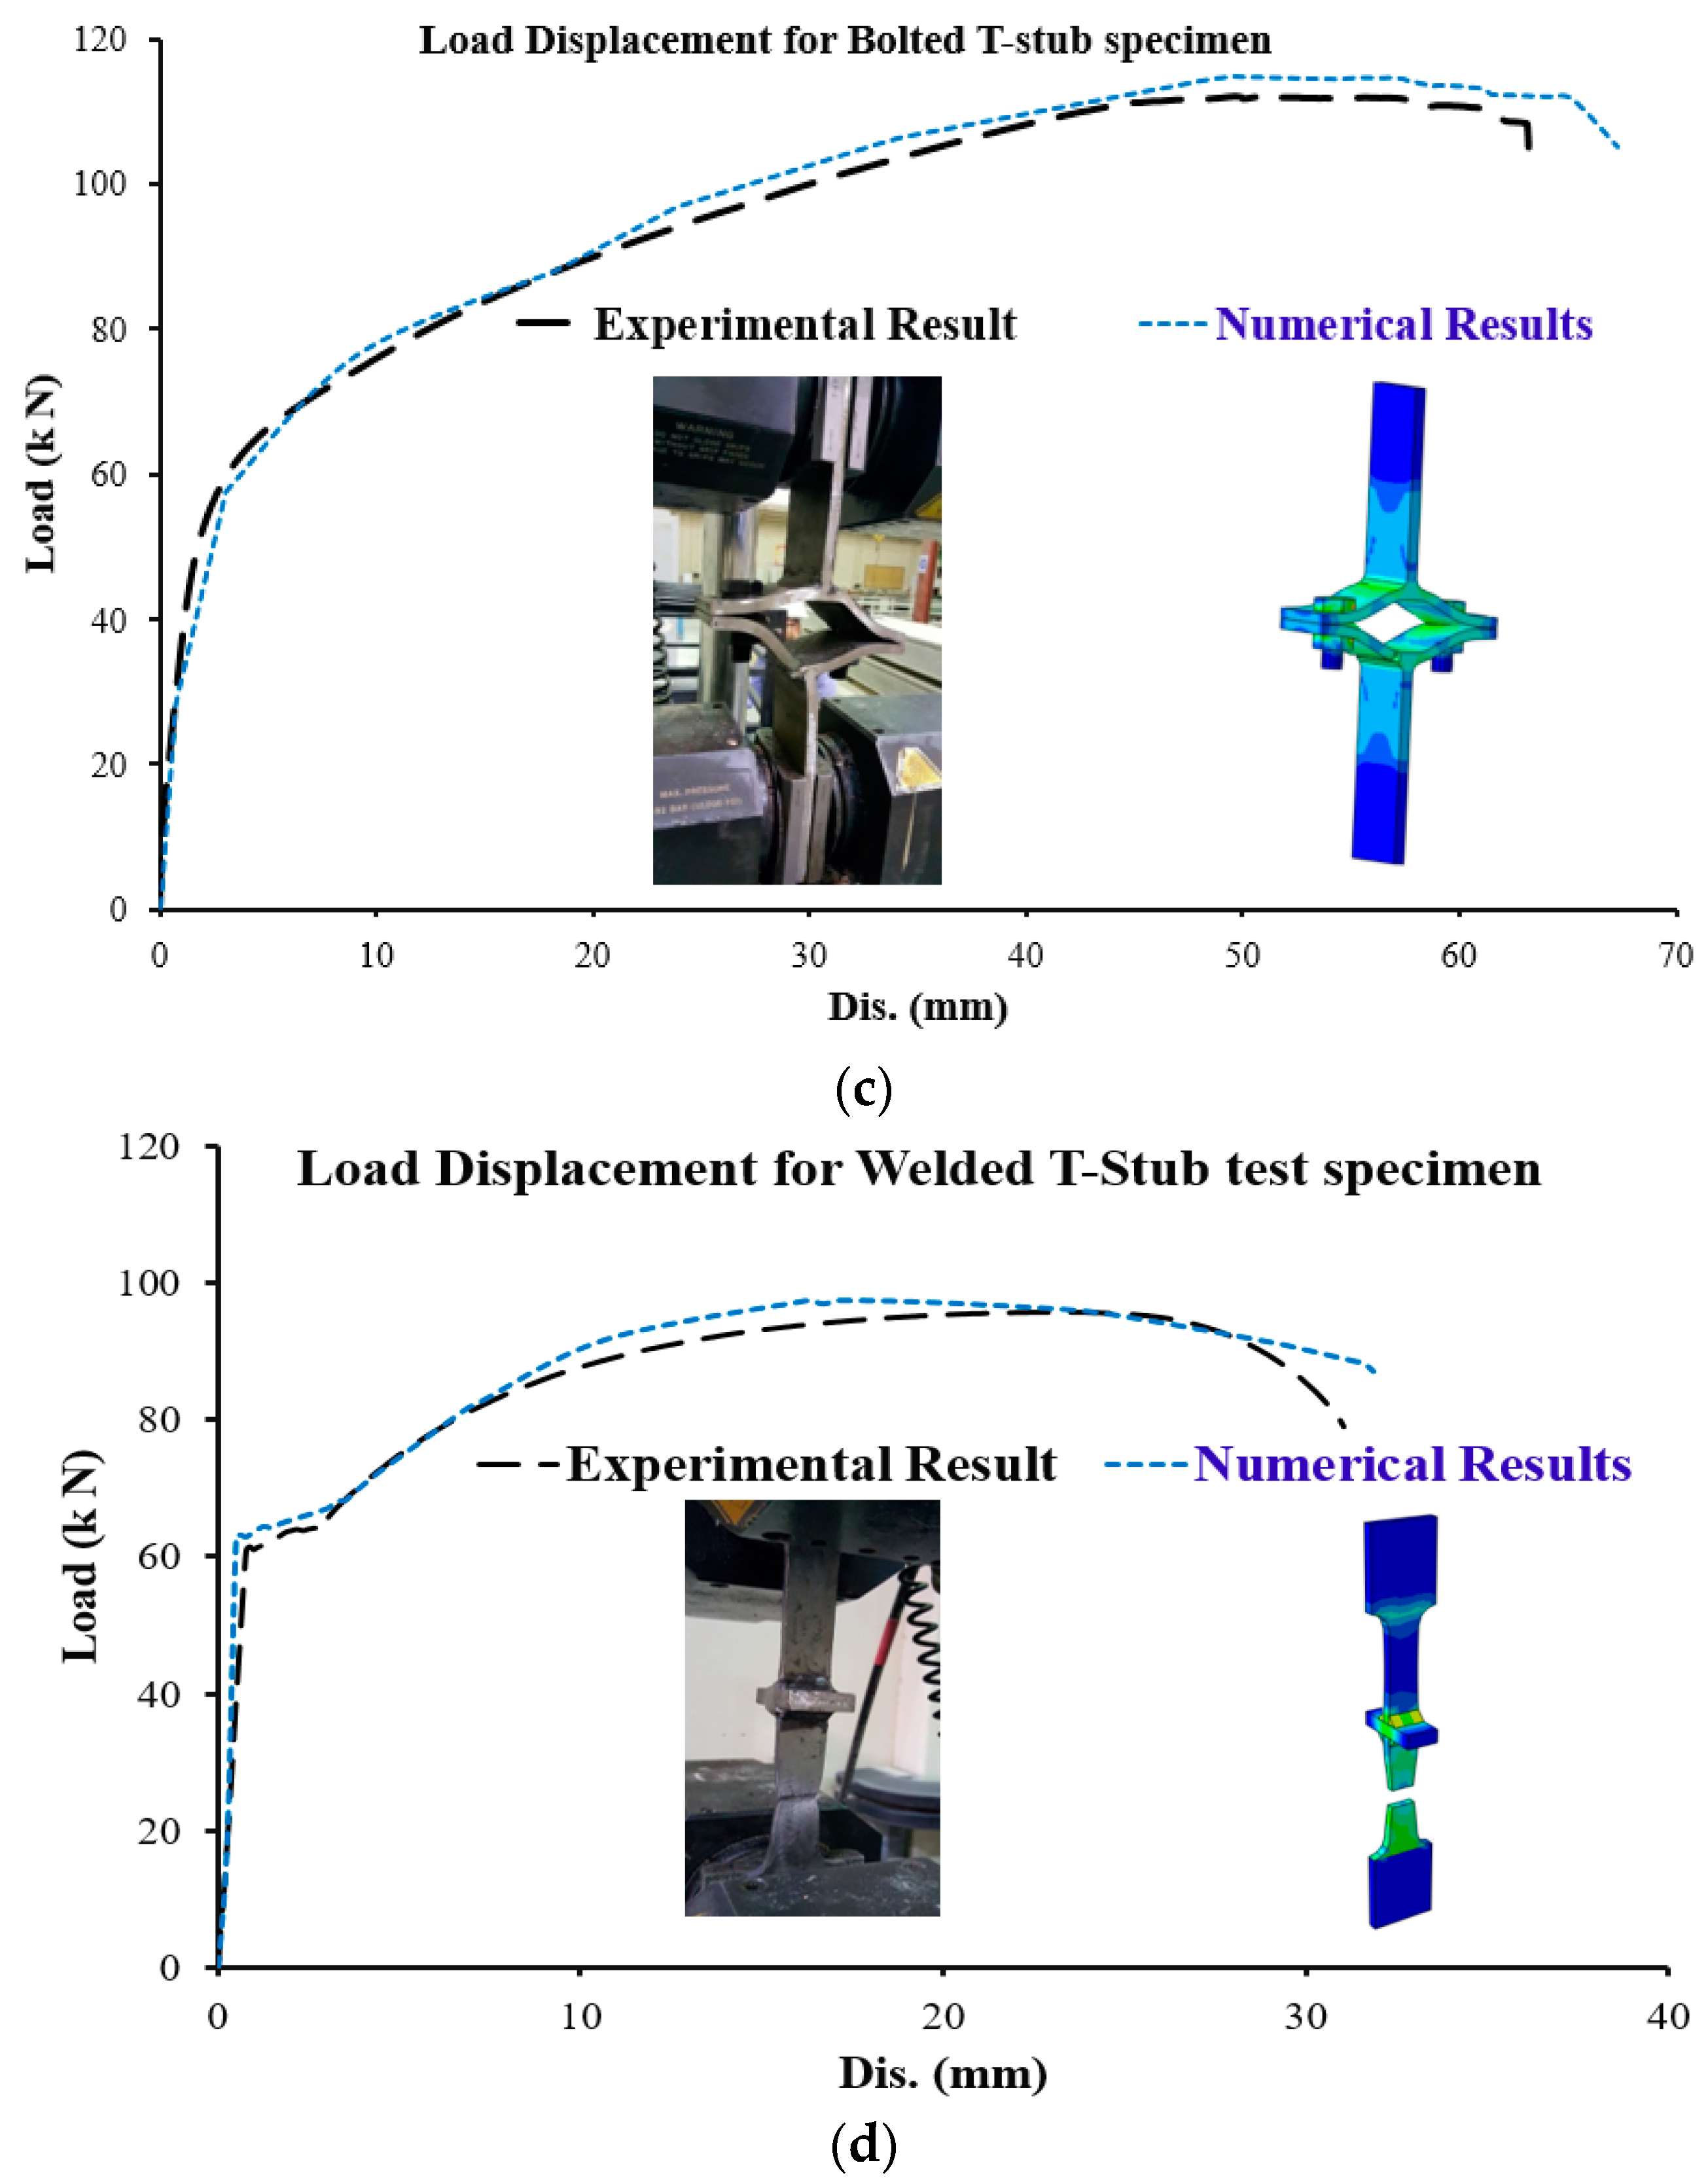
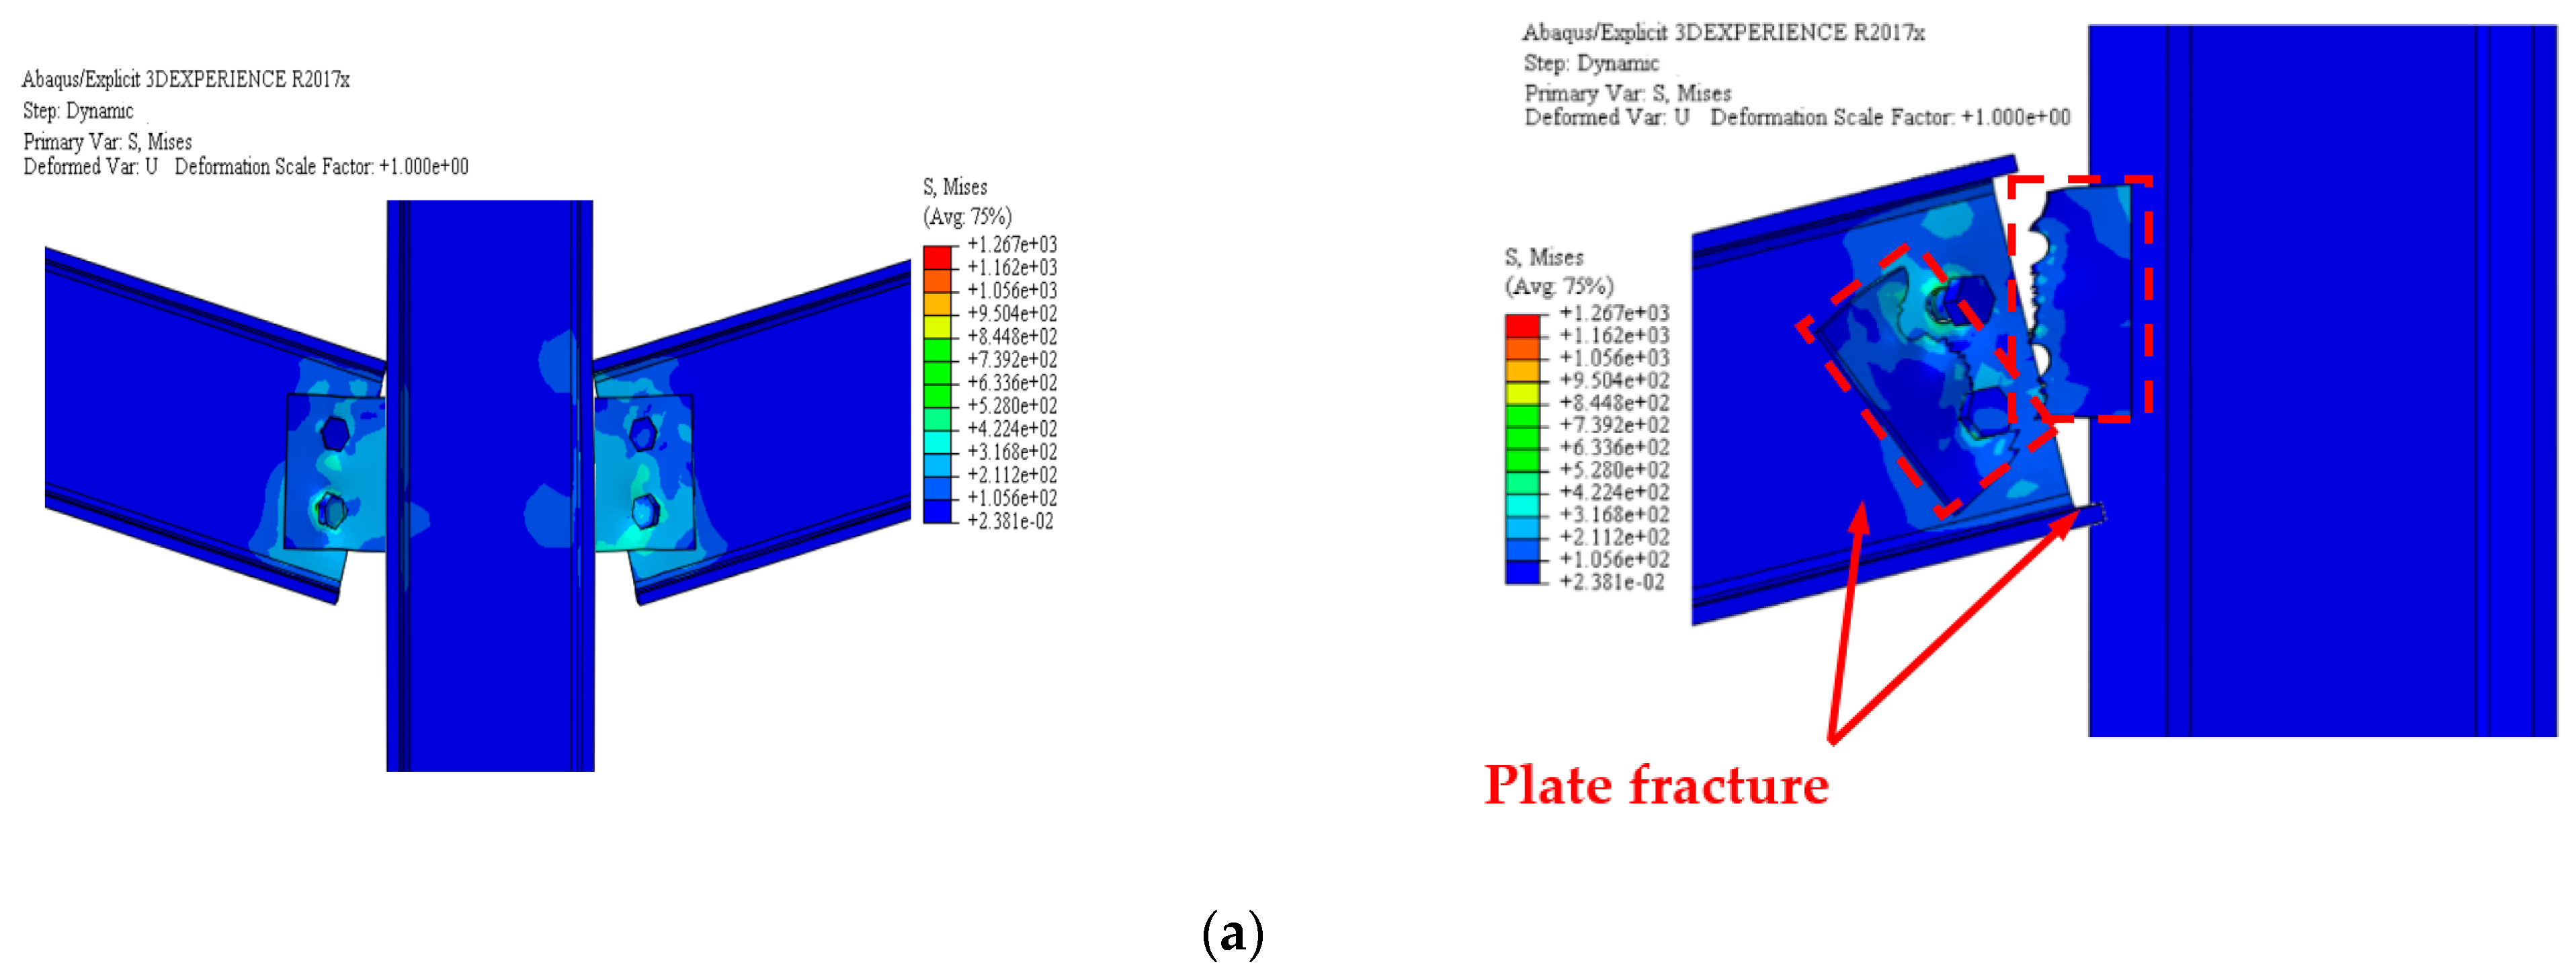
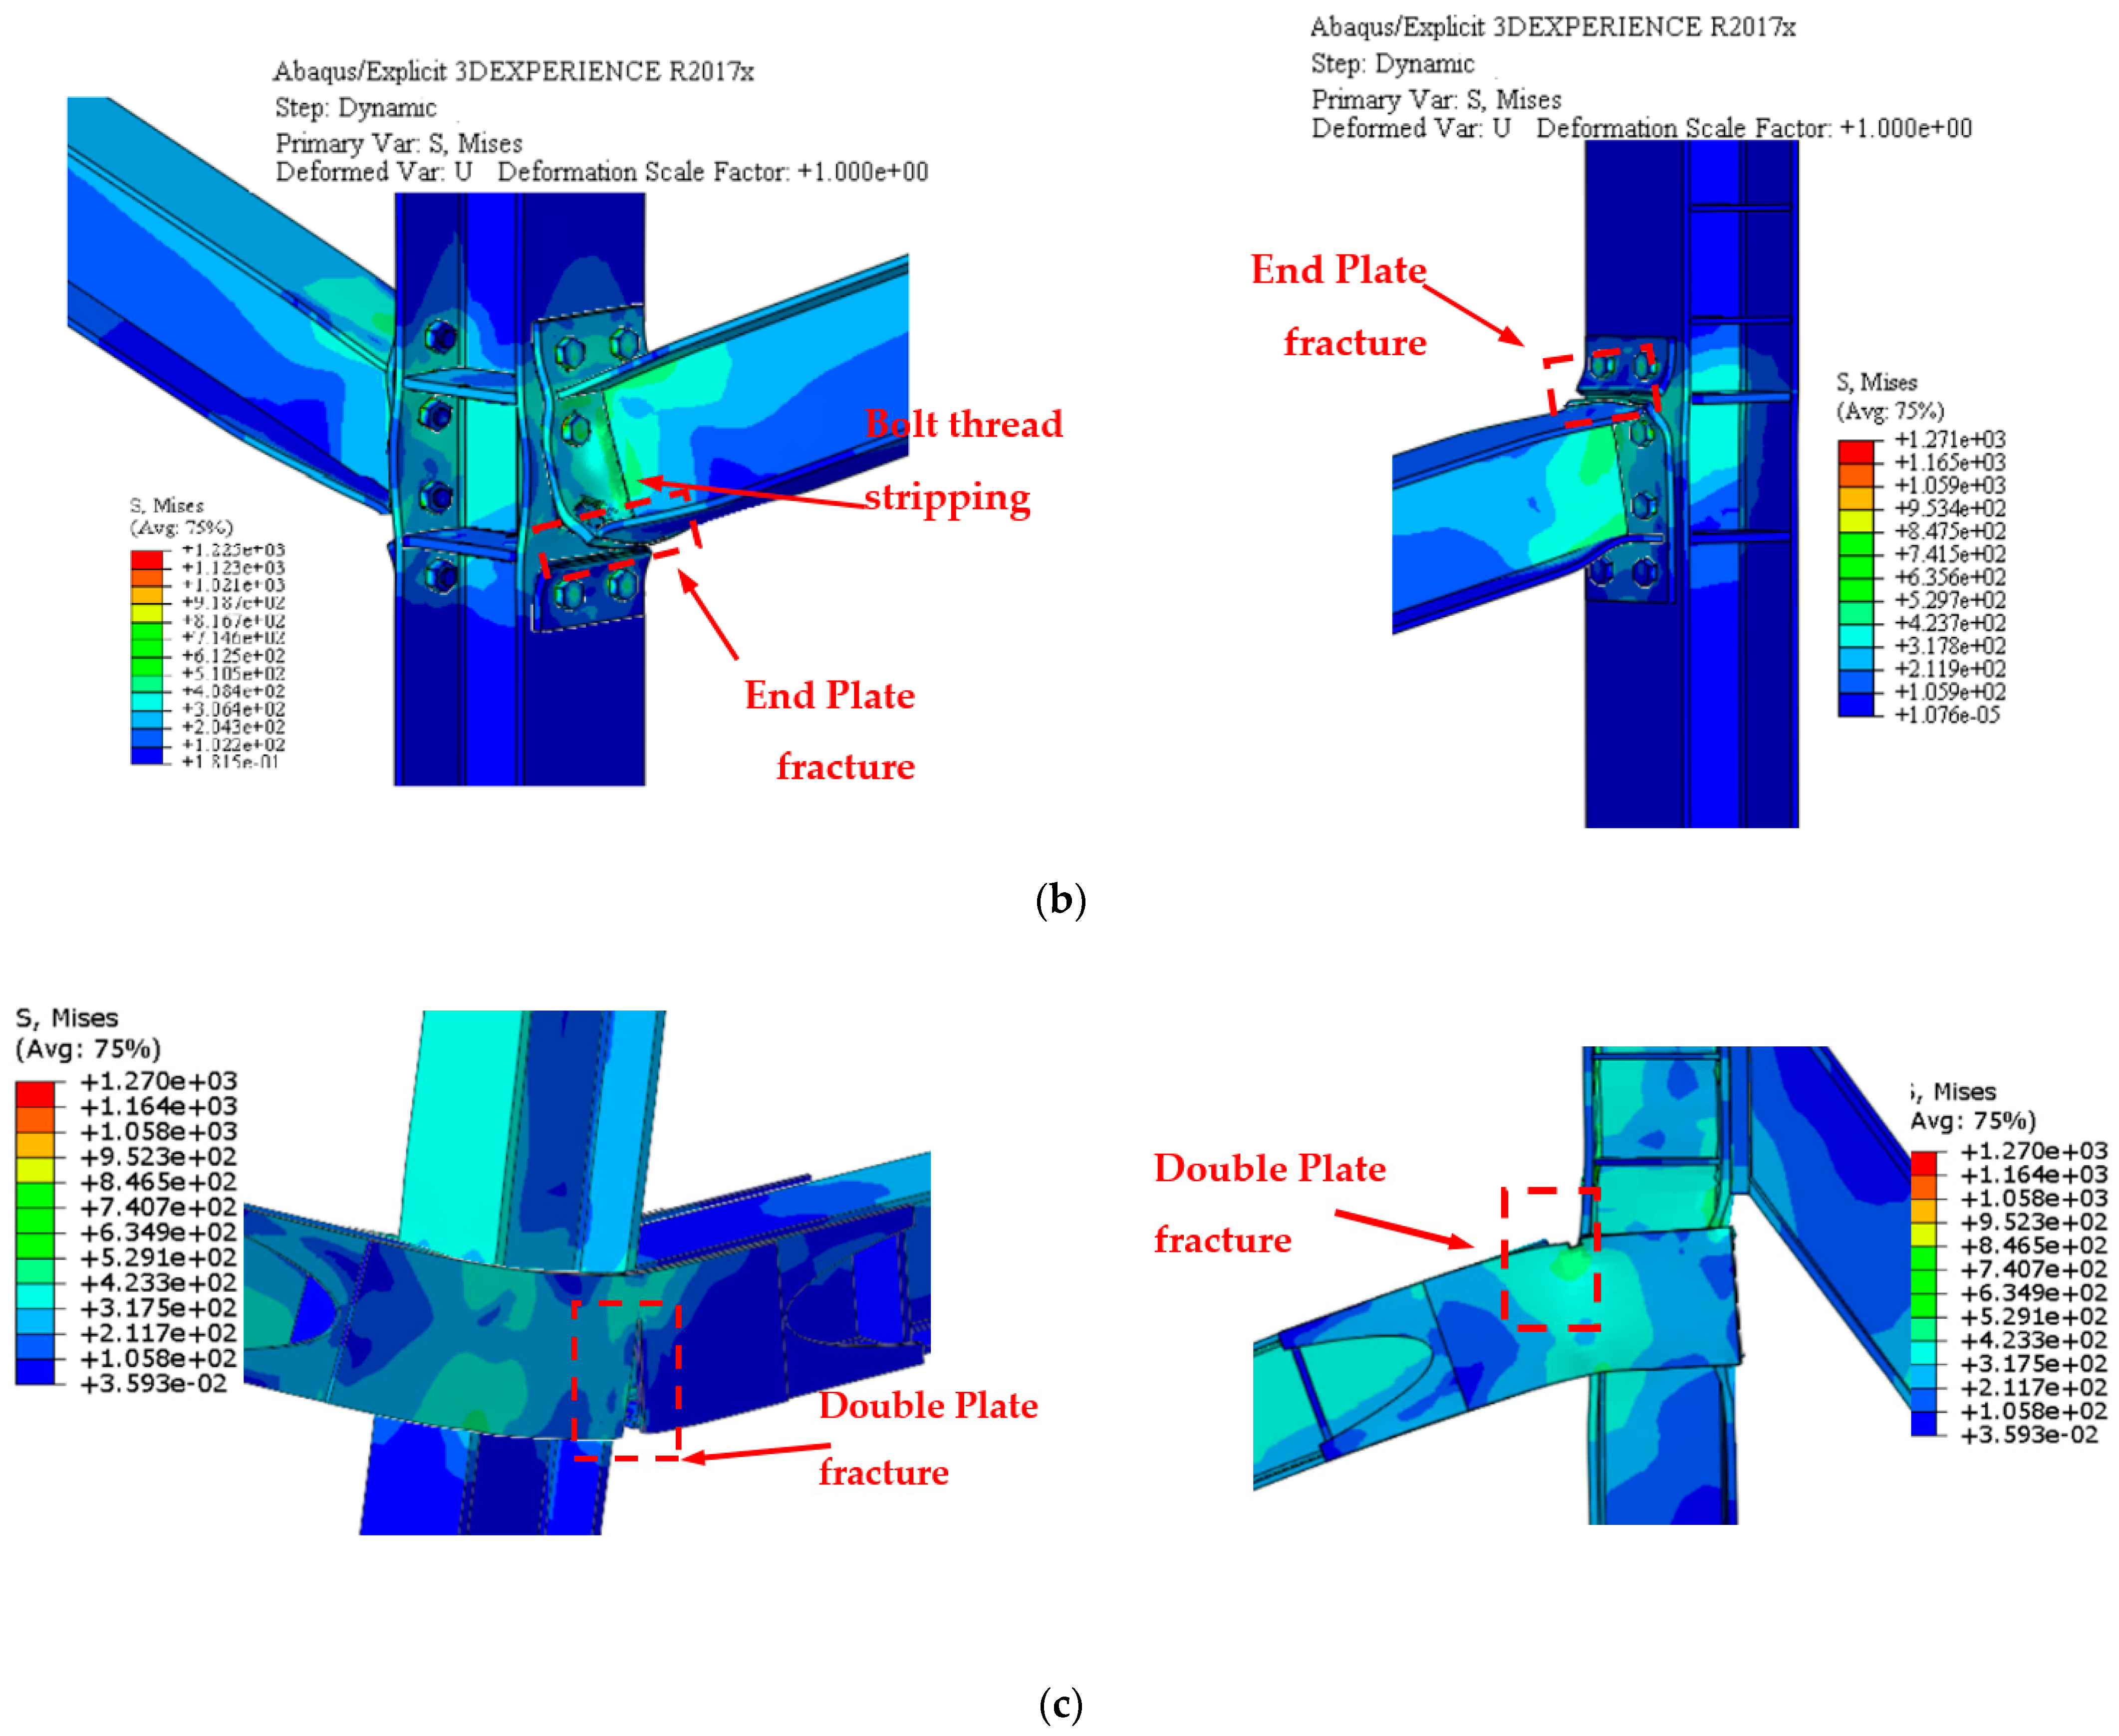
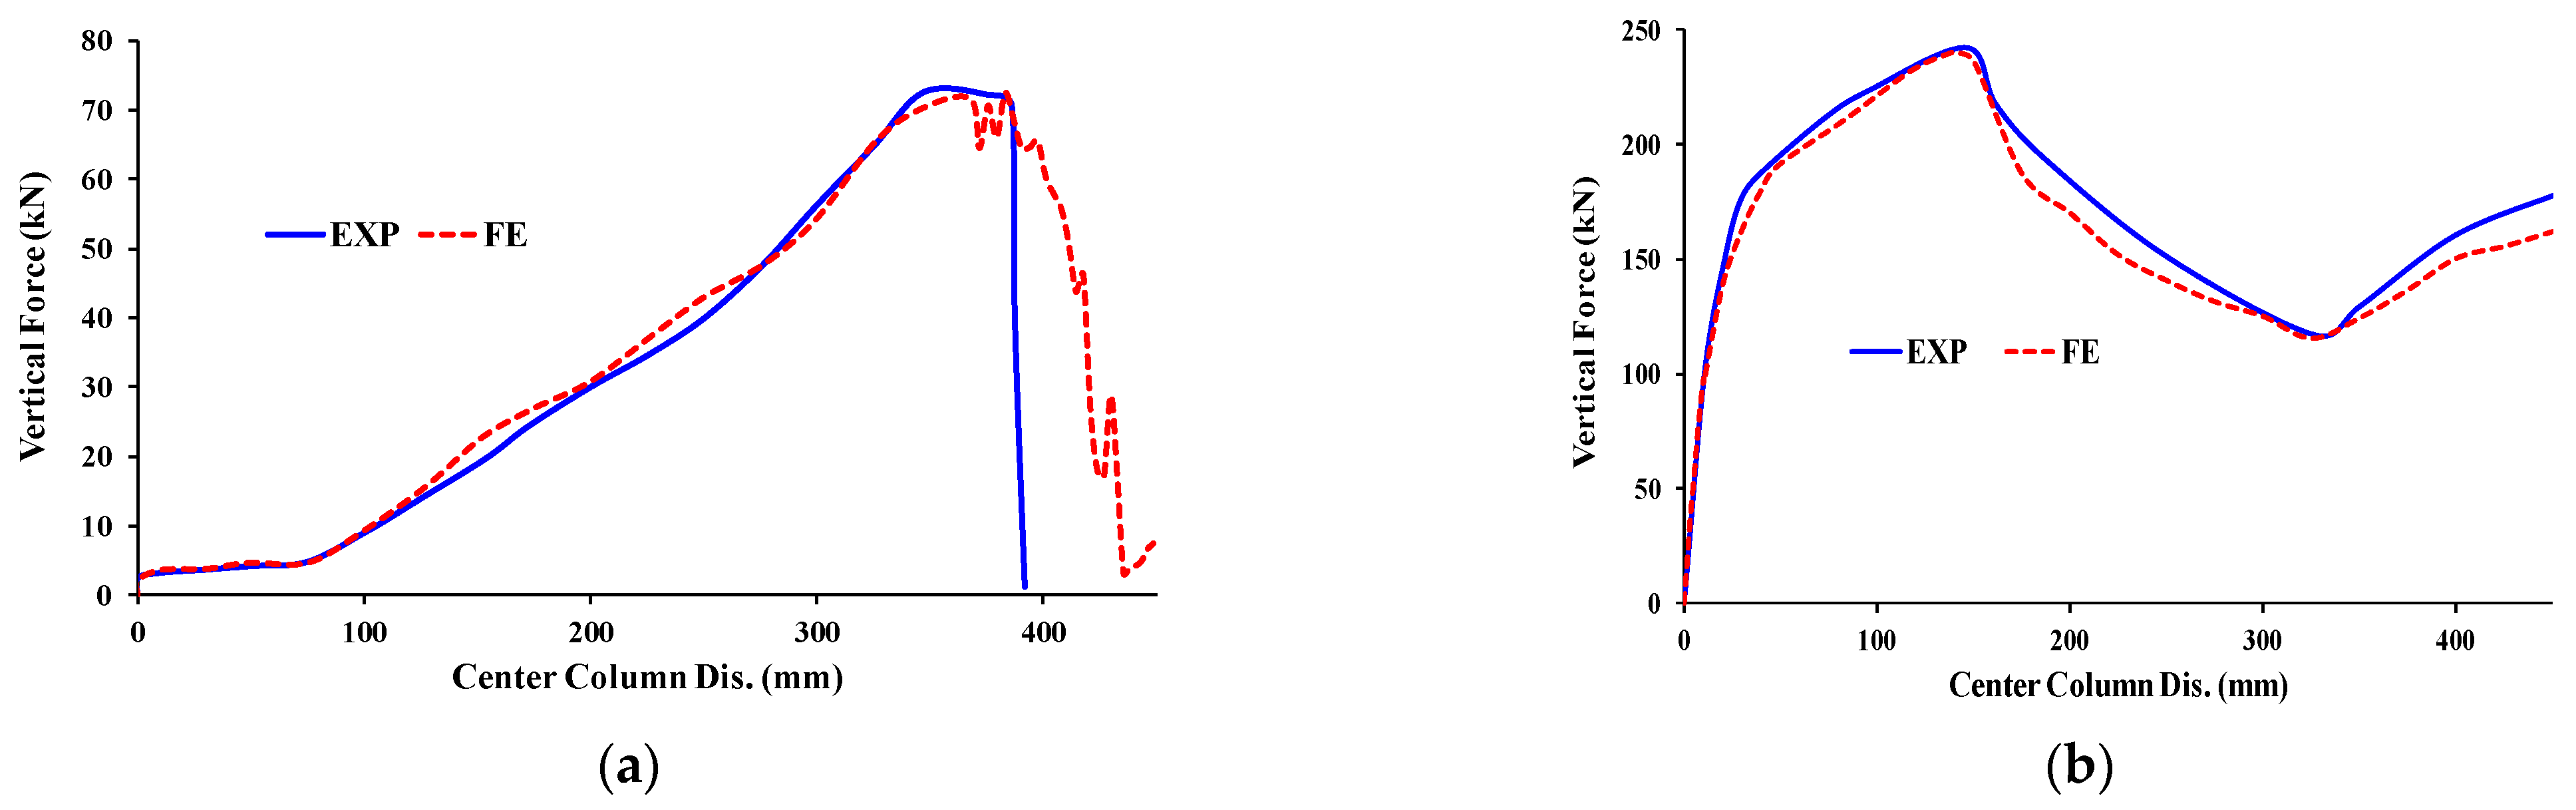
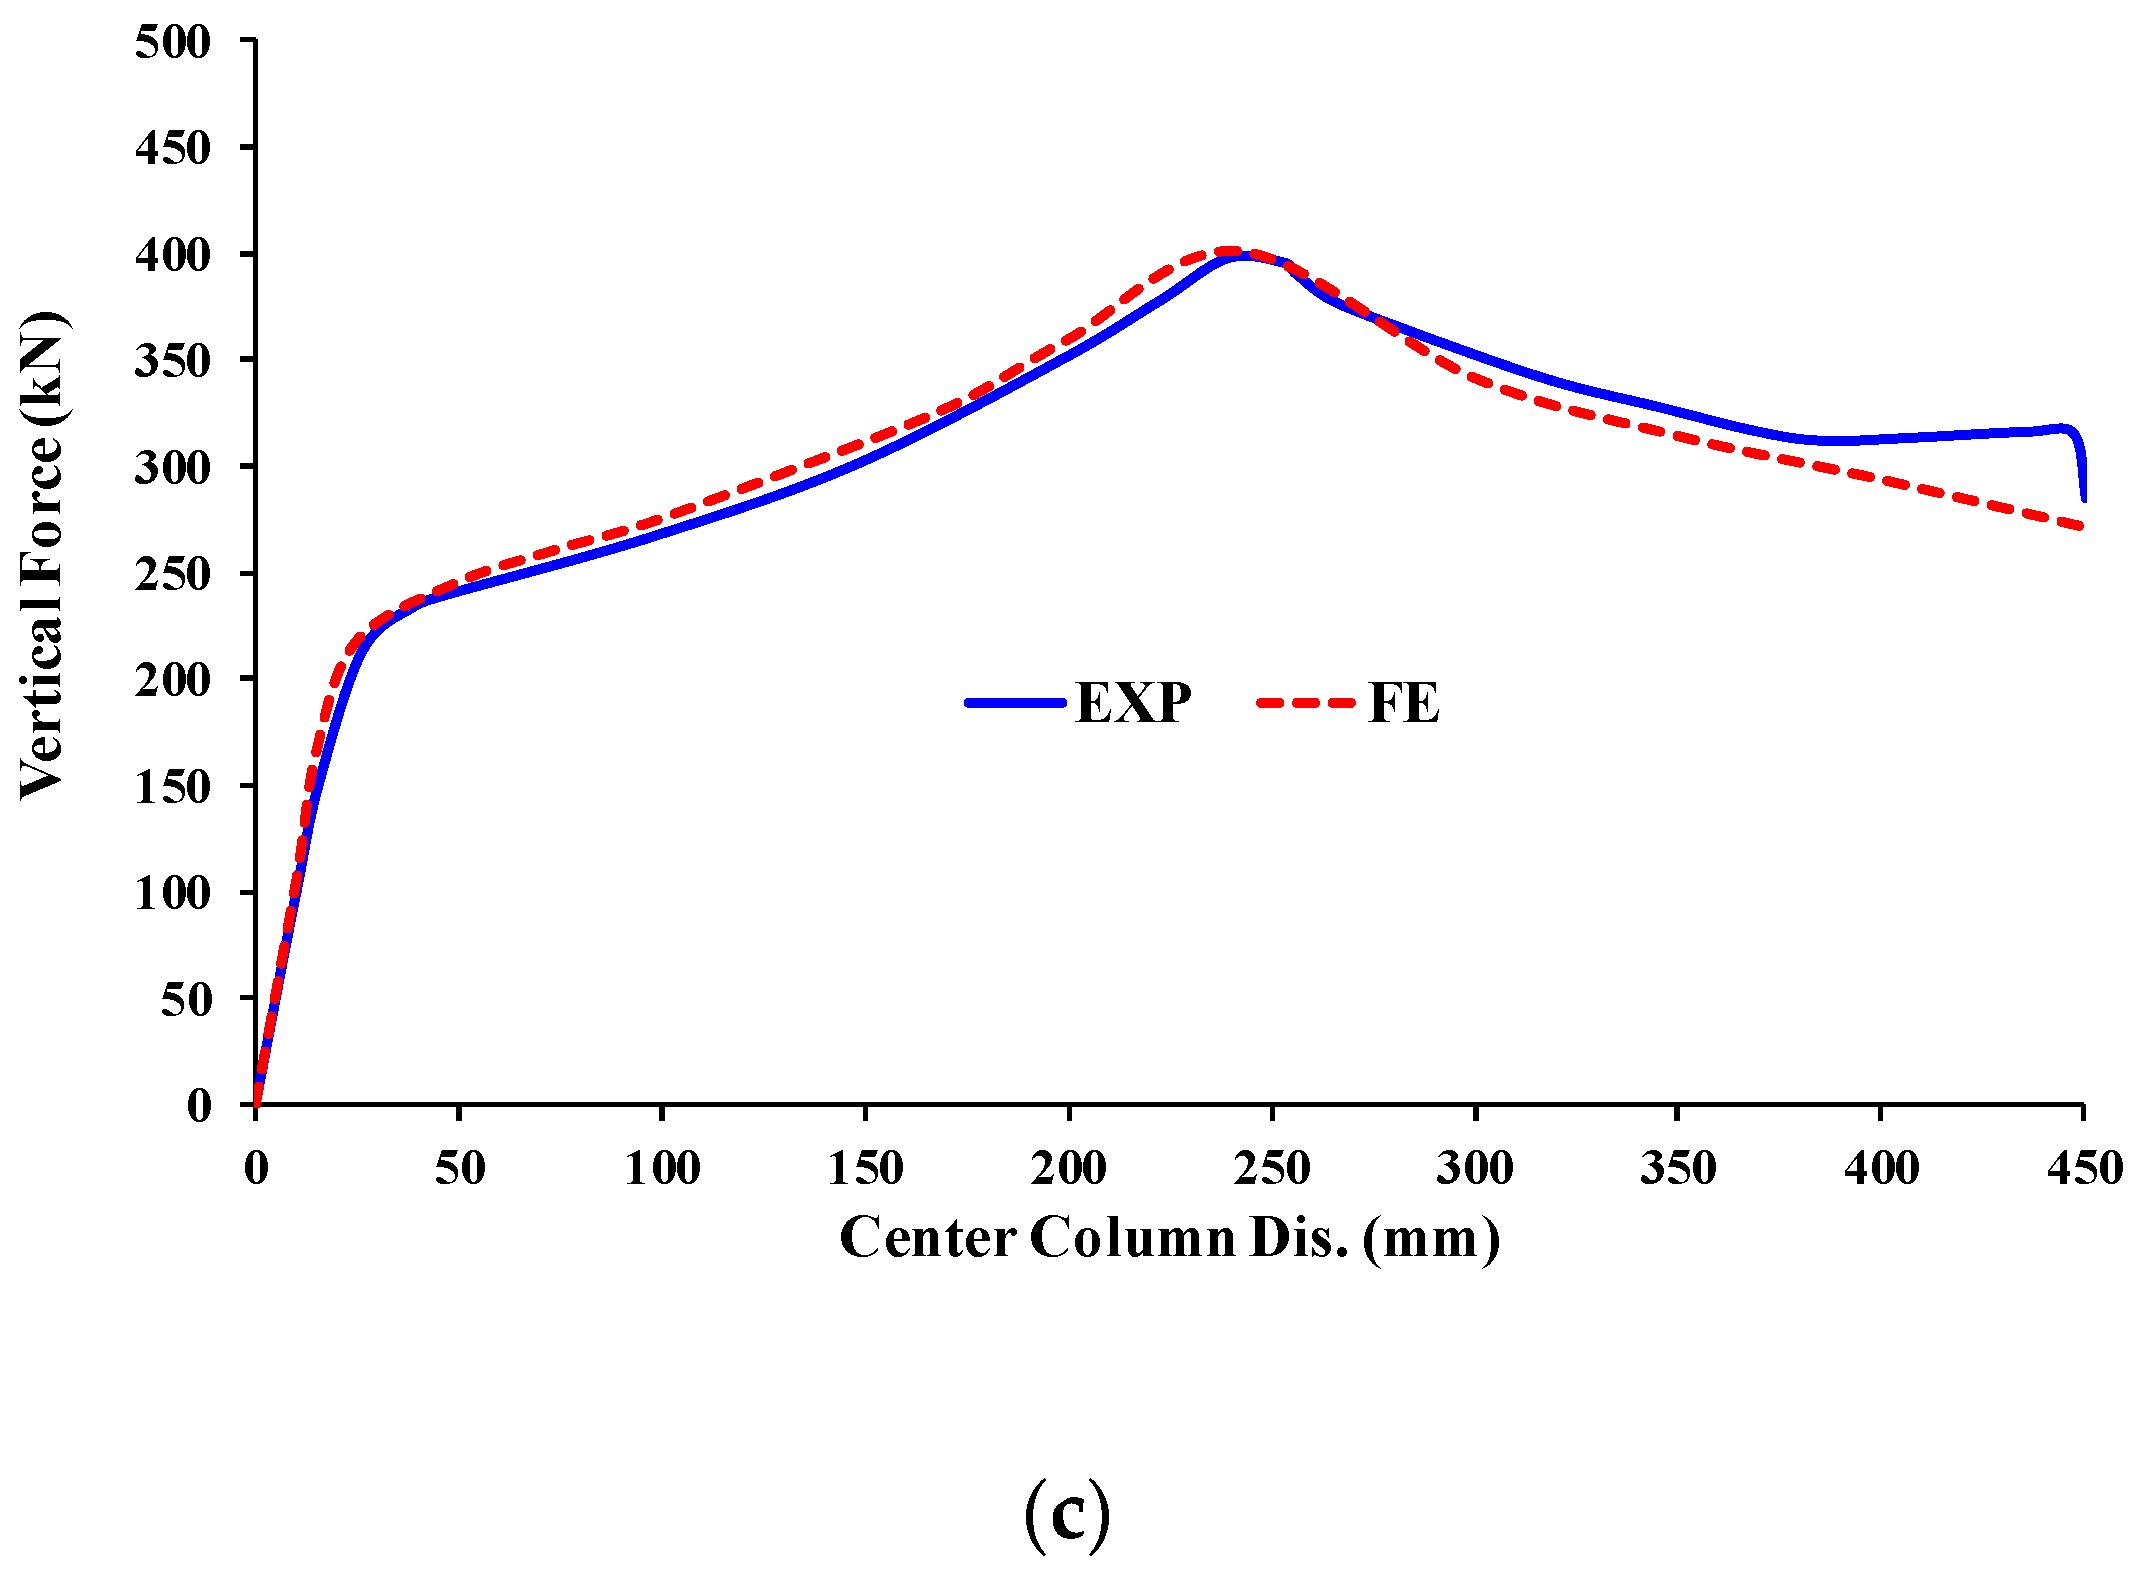
4.4. FE Model Validation
4.5. Models for the Parametric Analysis
5. FE Investigation of Different Parametric Study
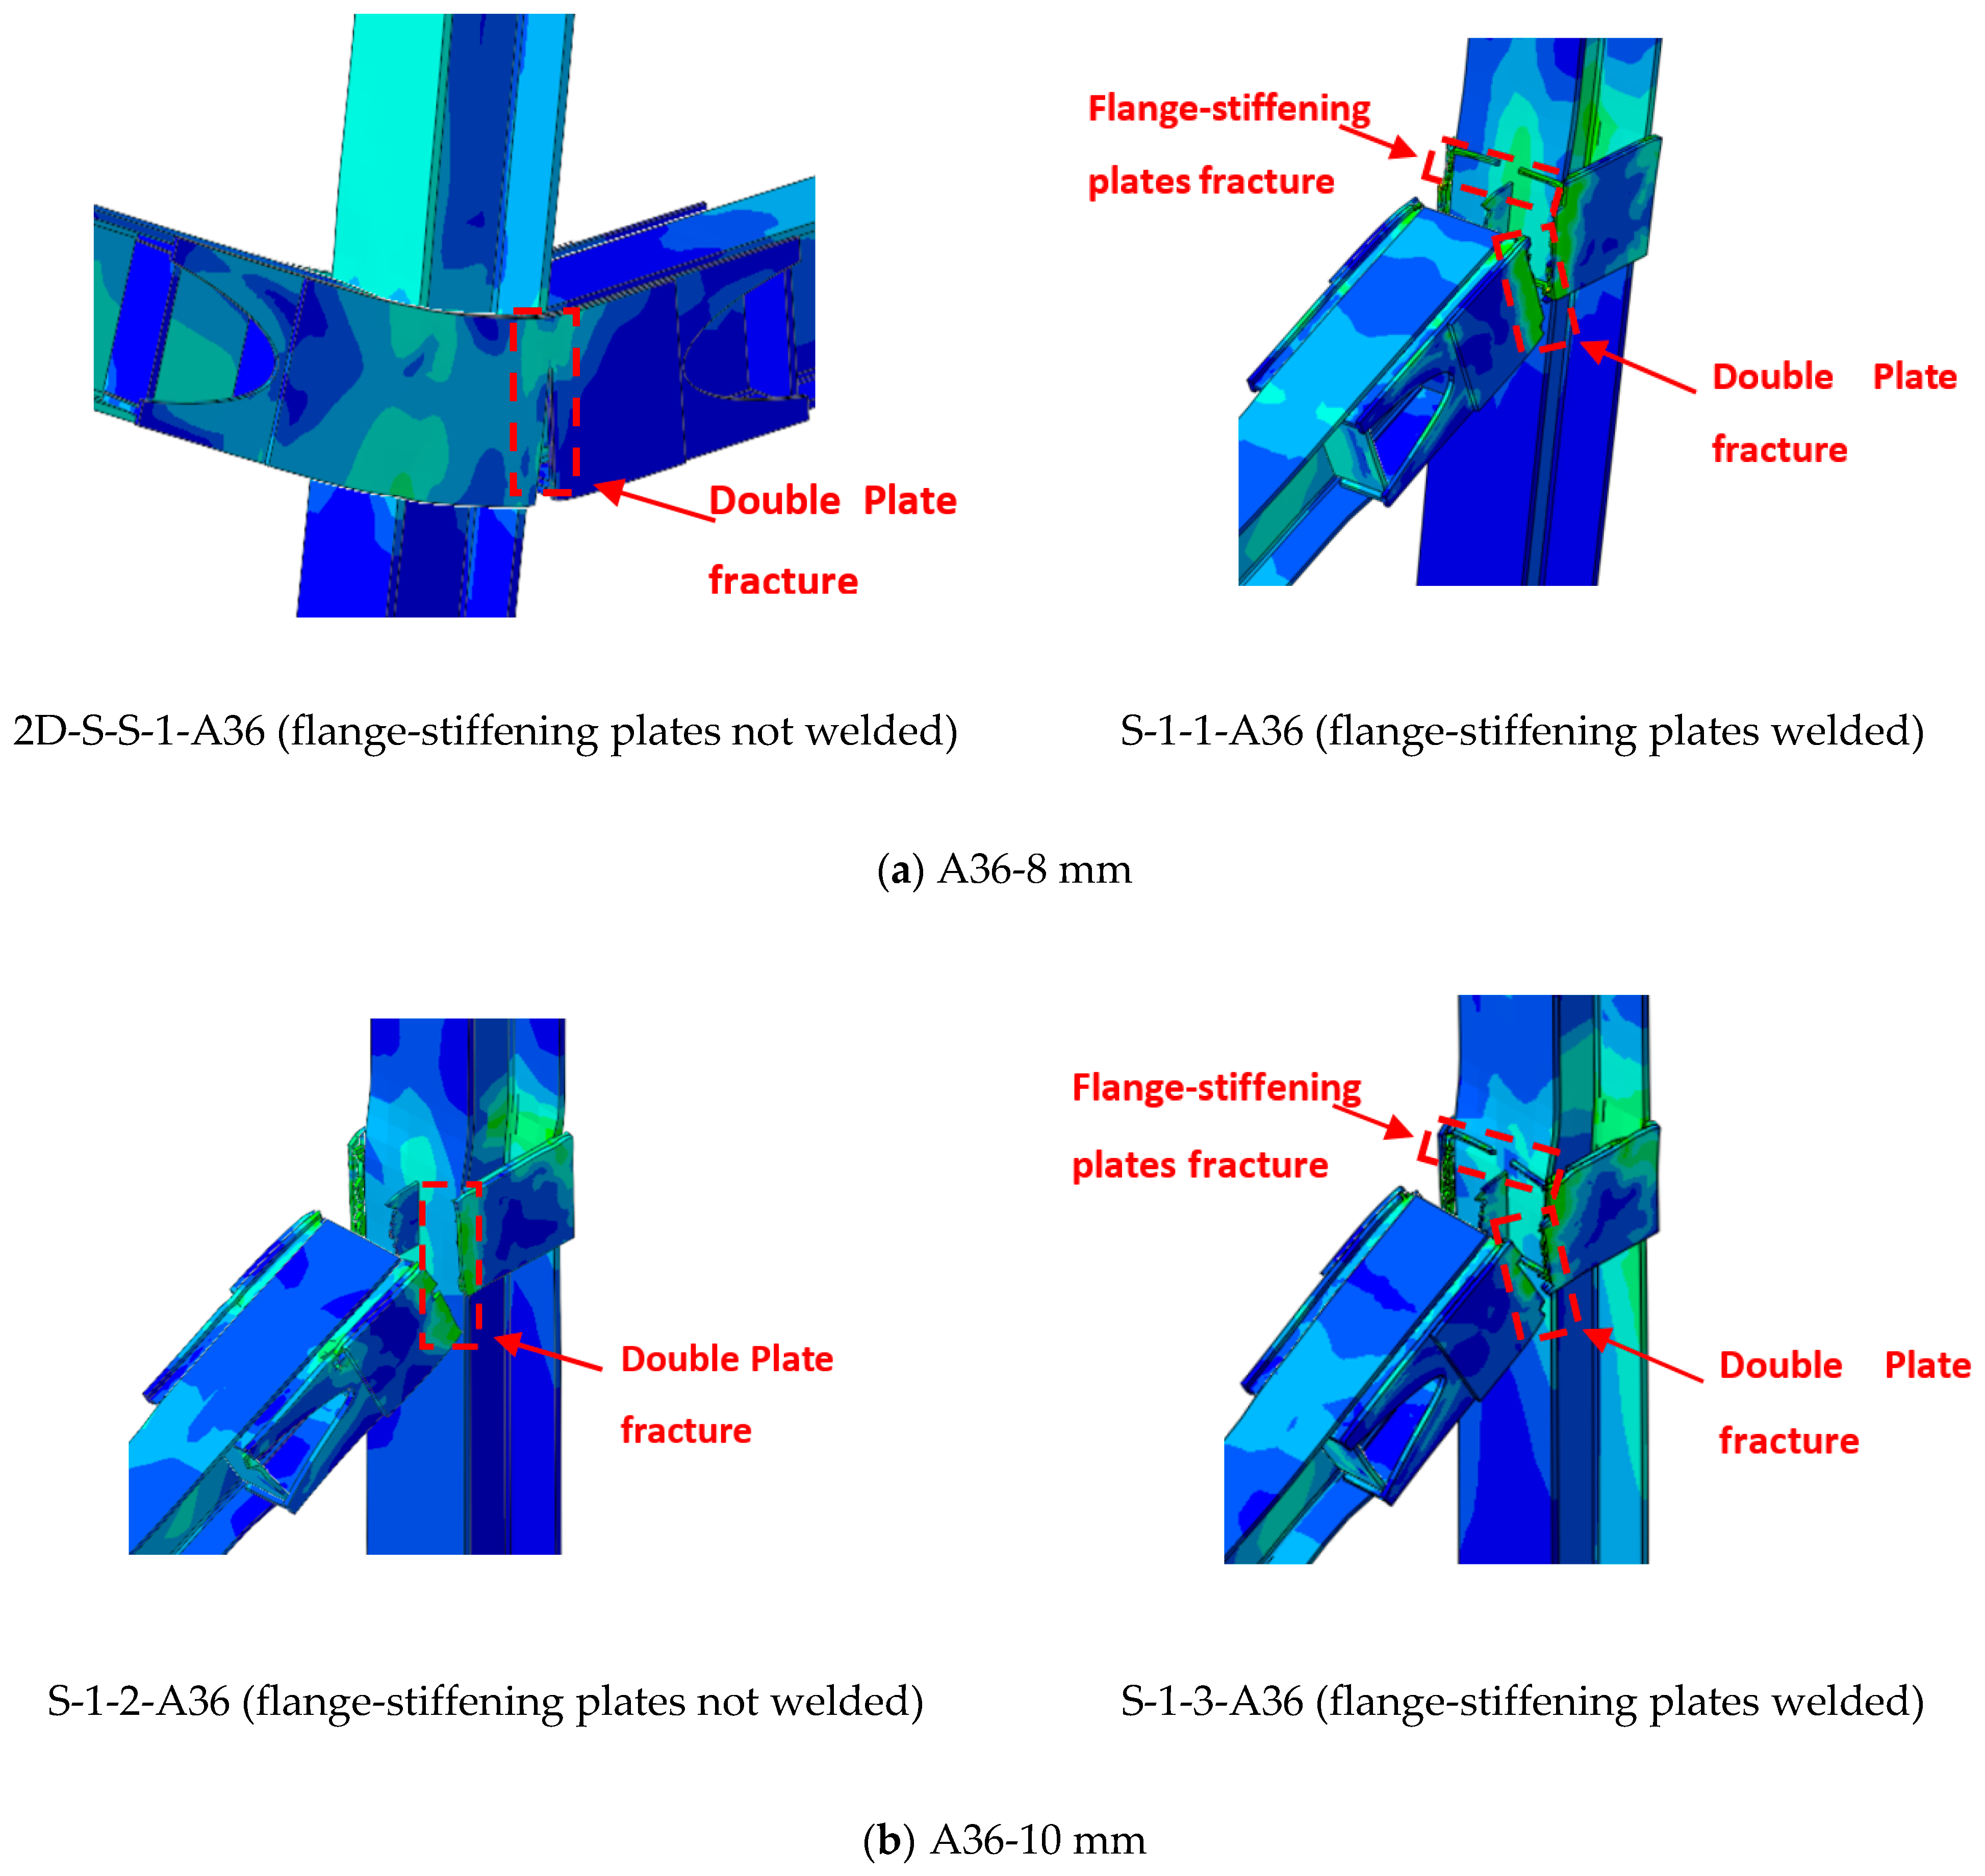
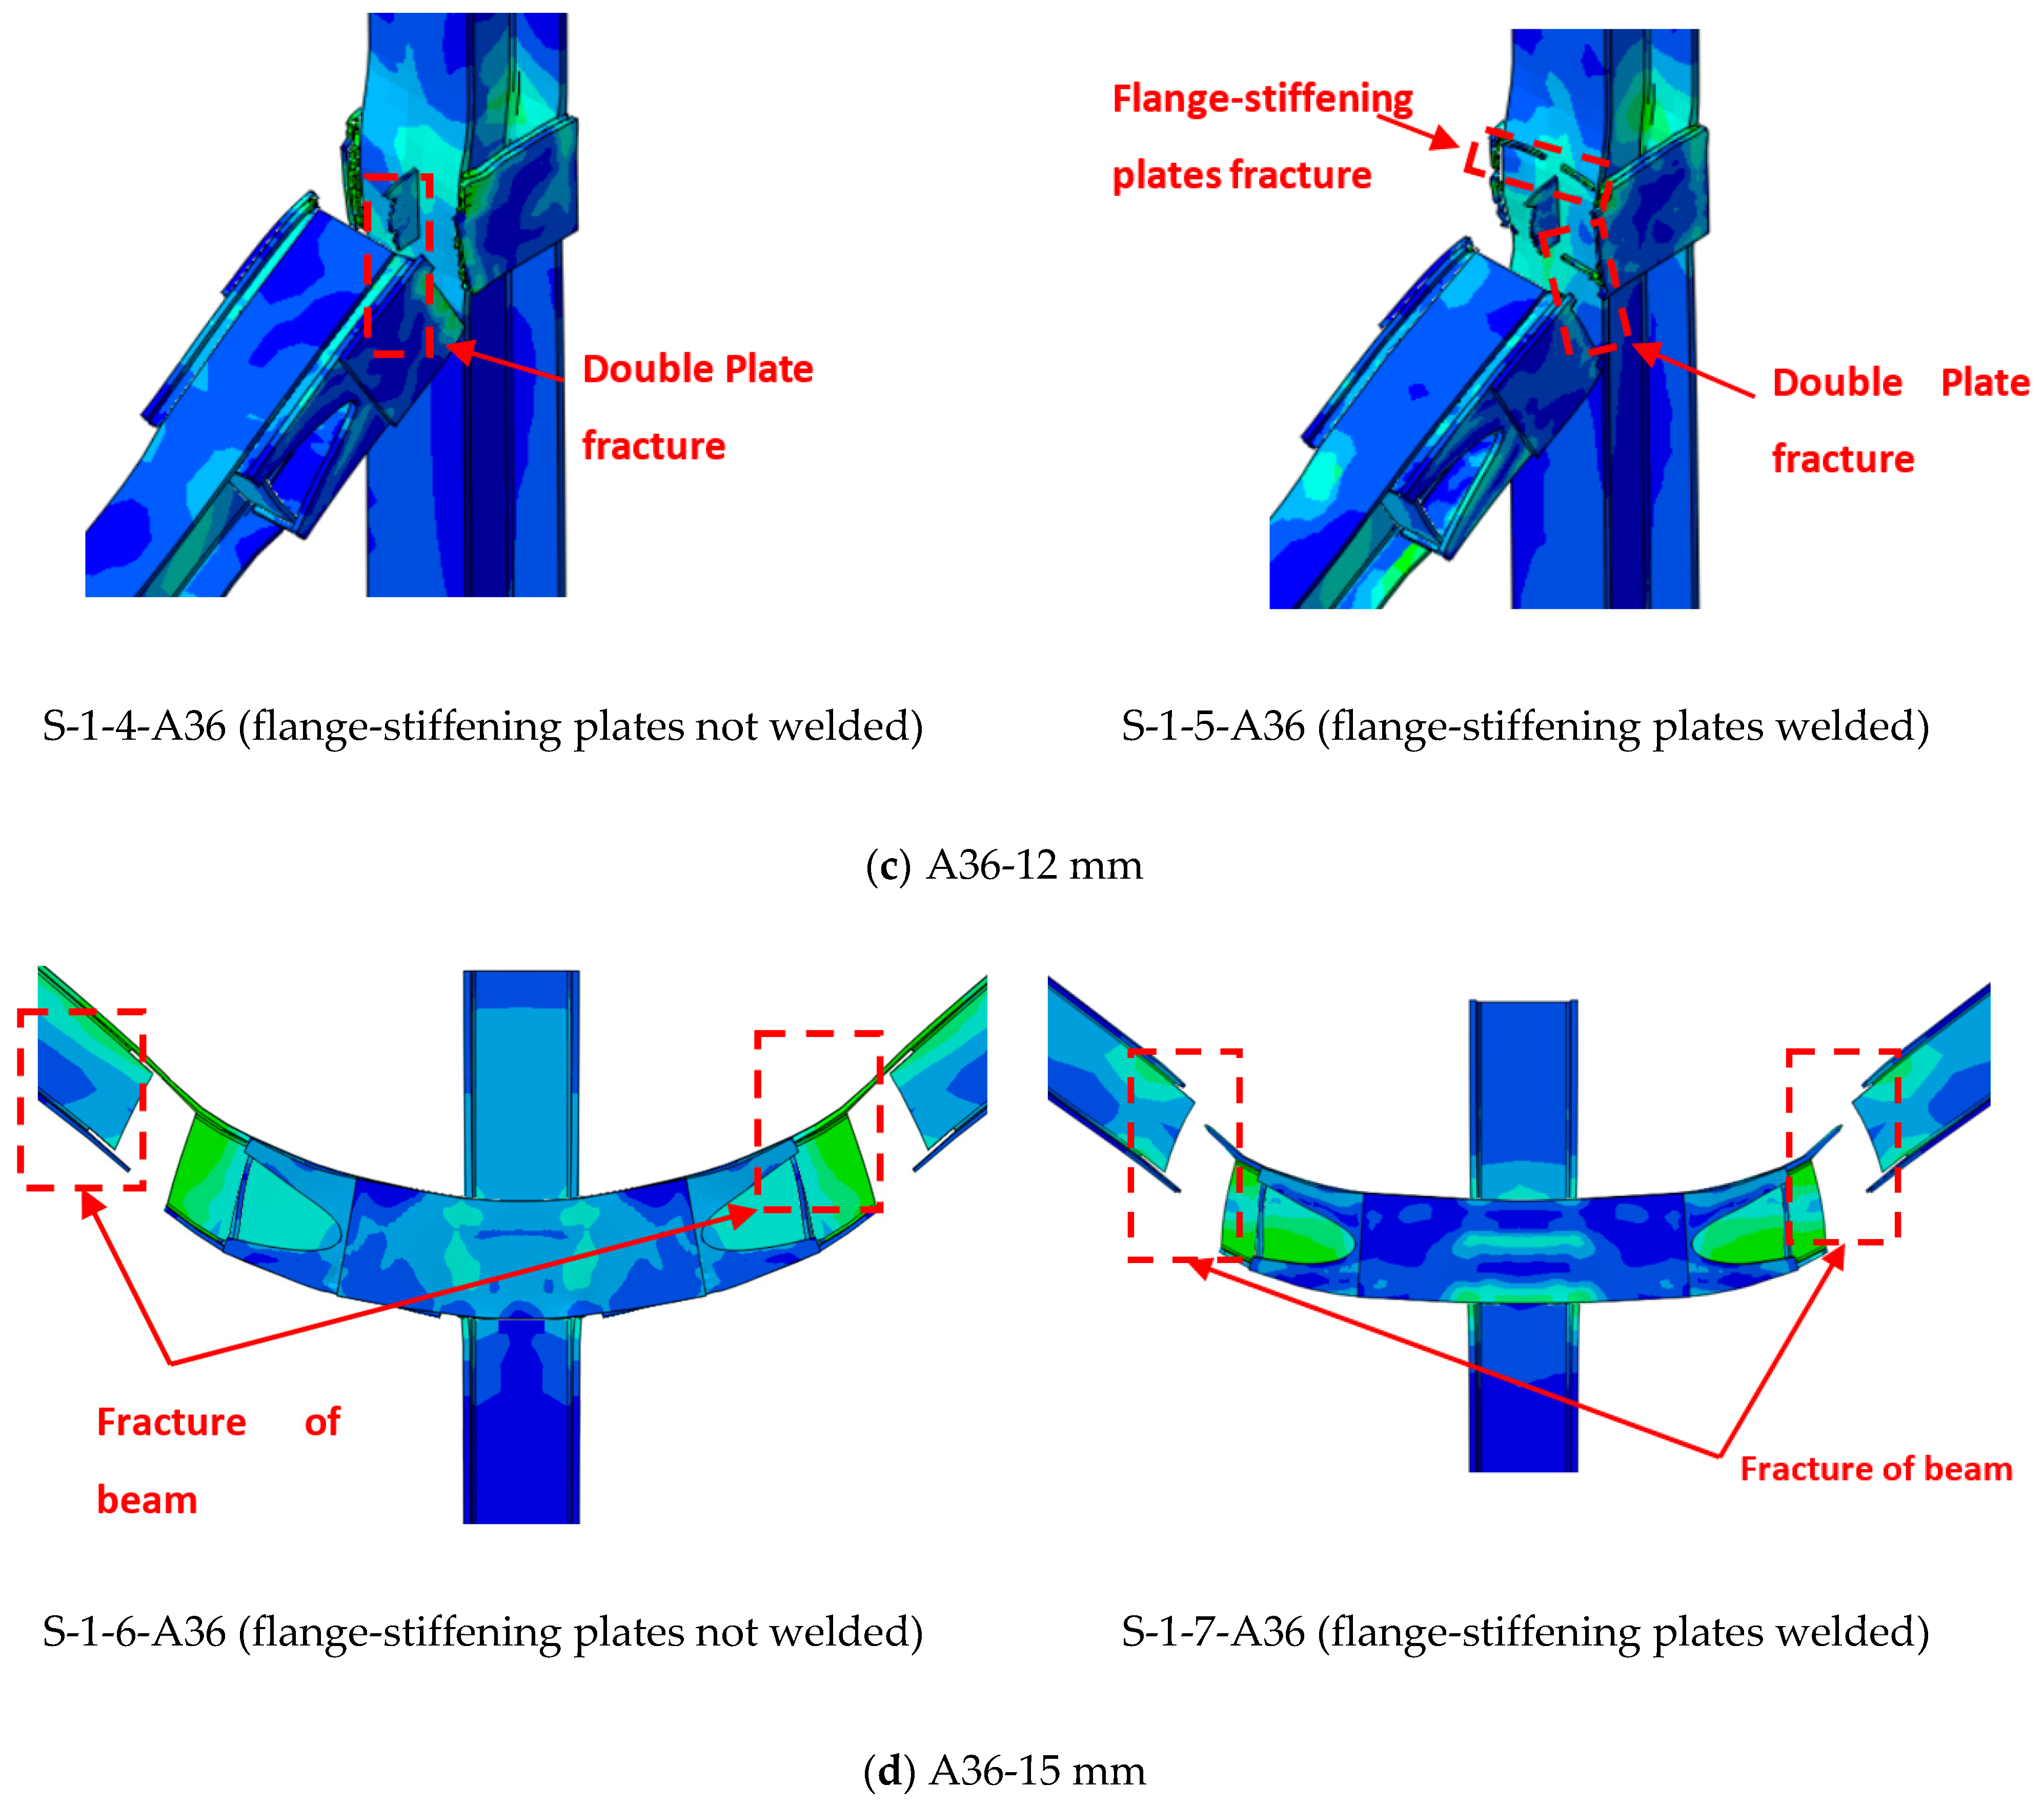
5.1. Effects of Plate Thickness
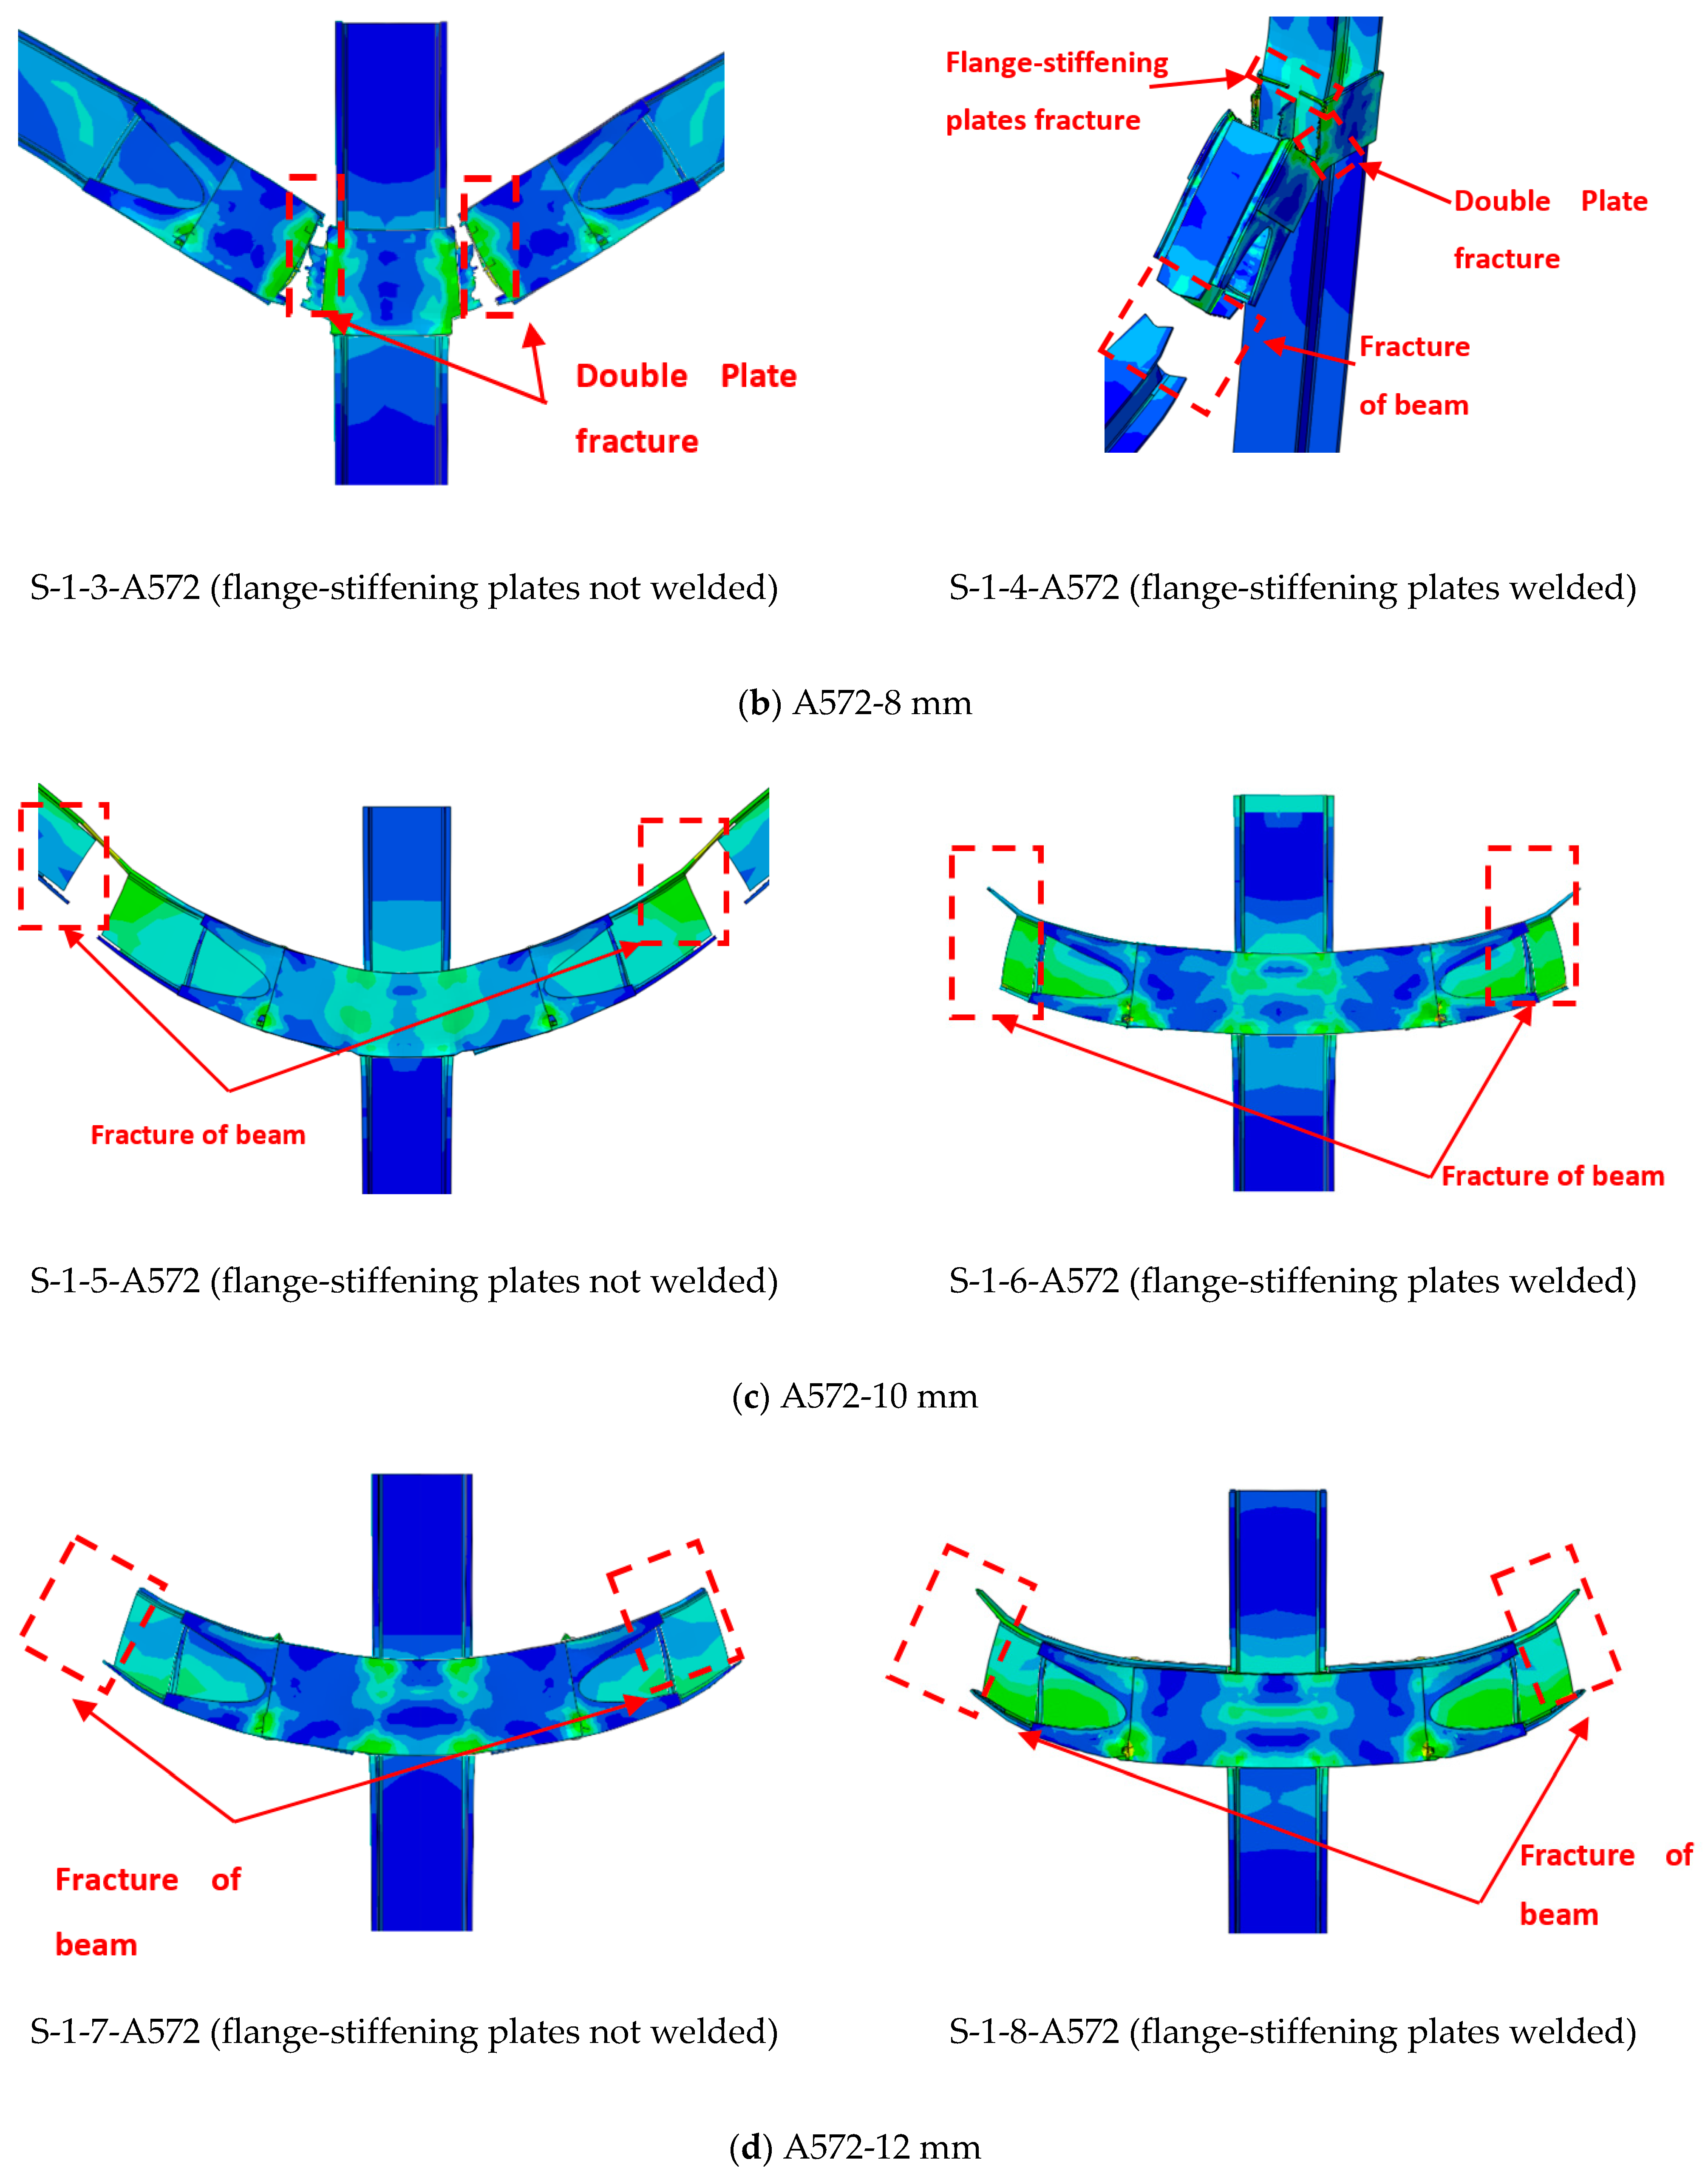
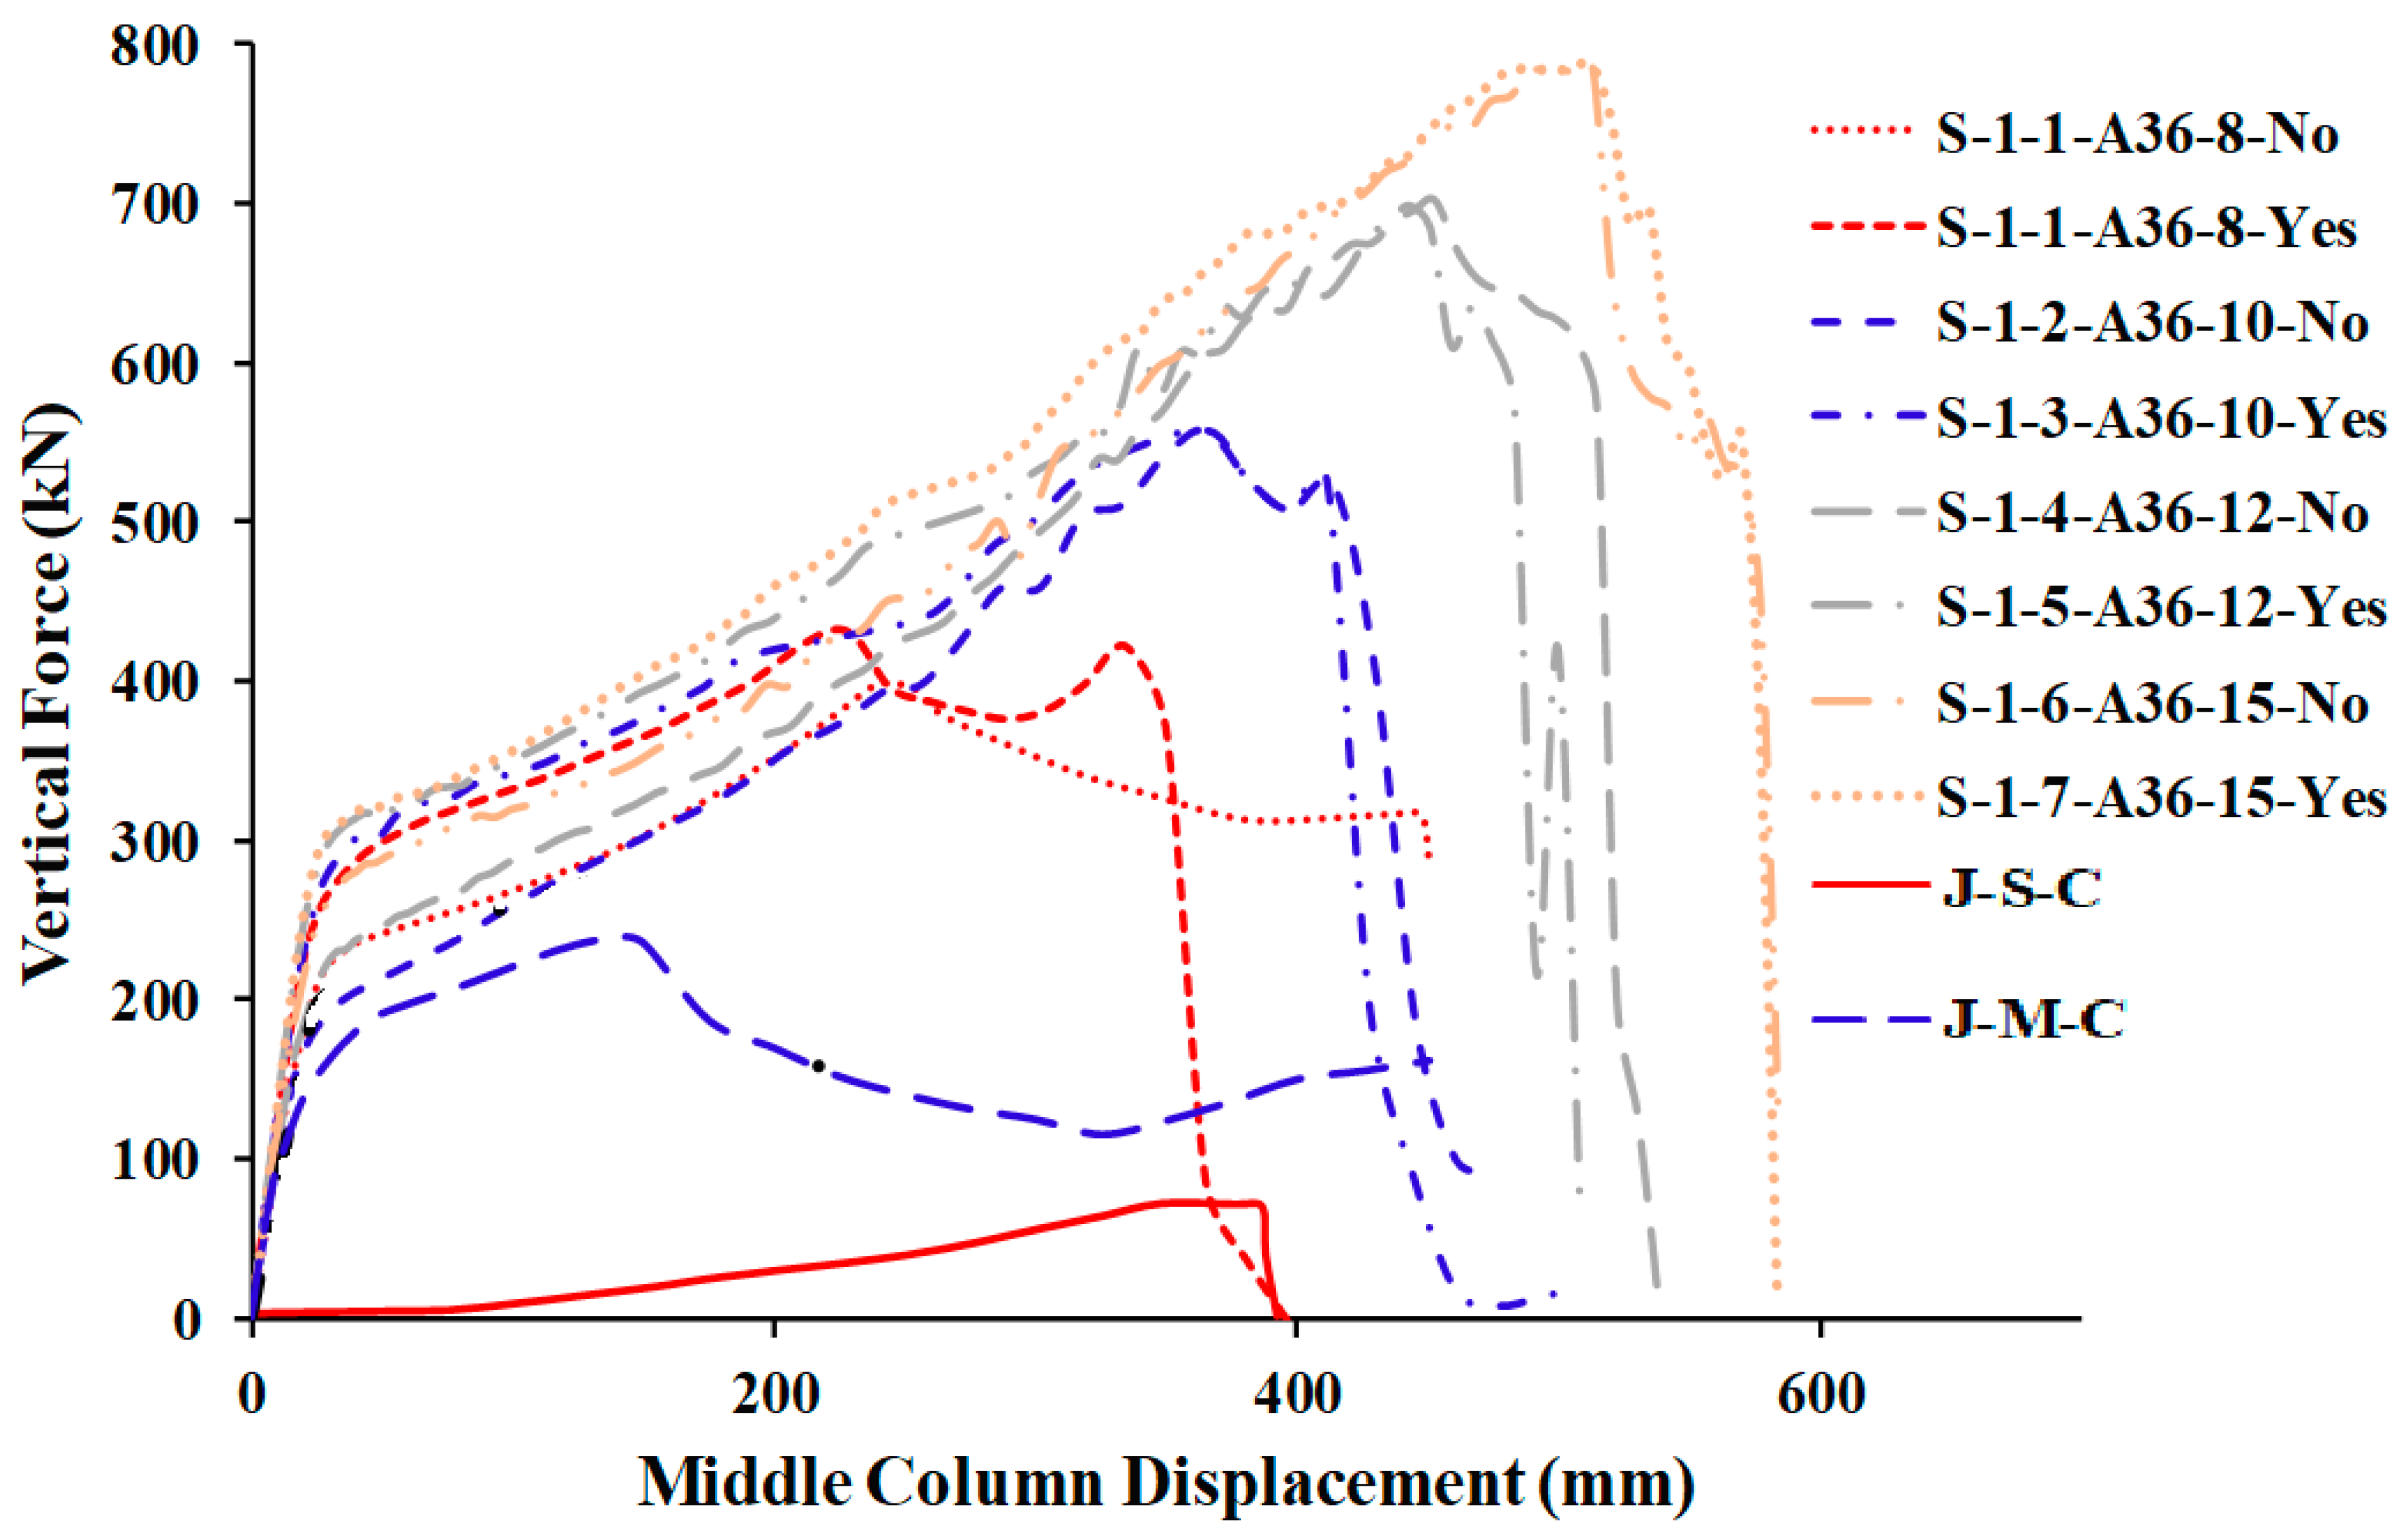
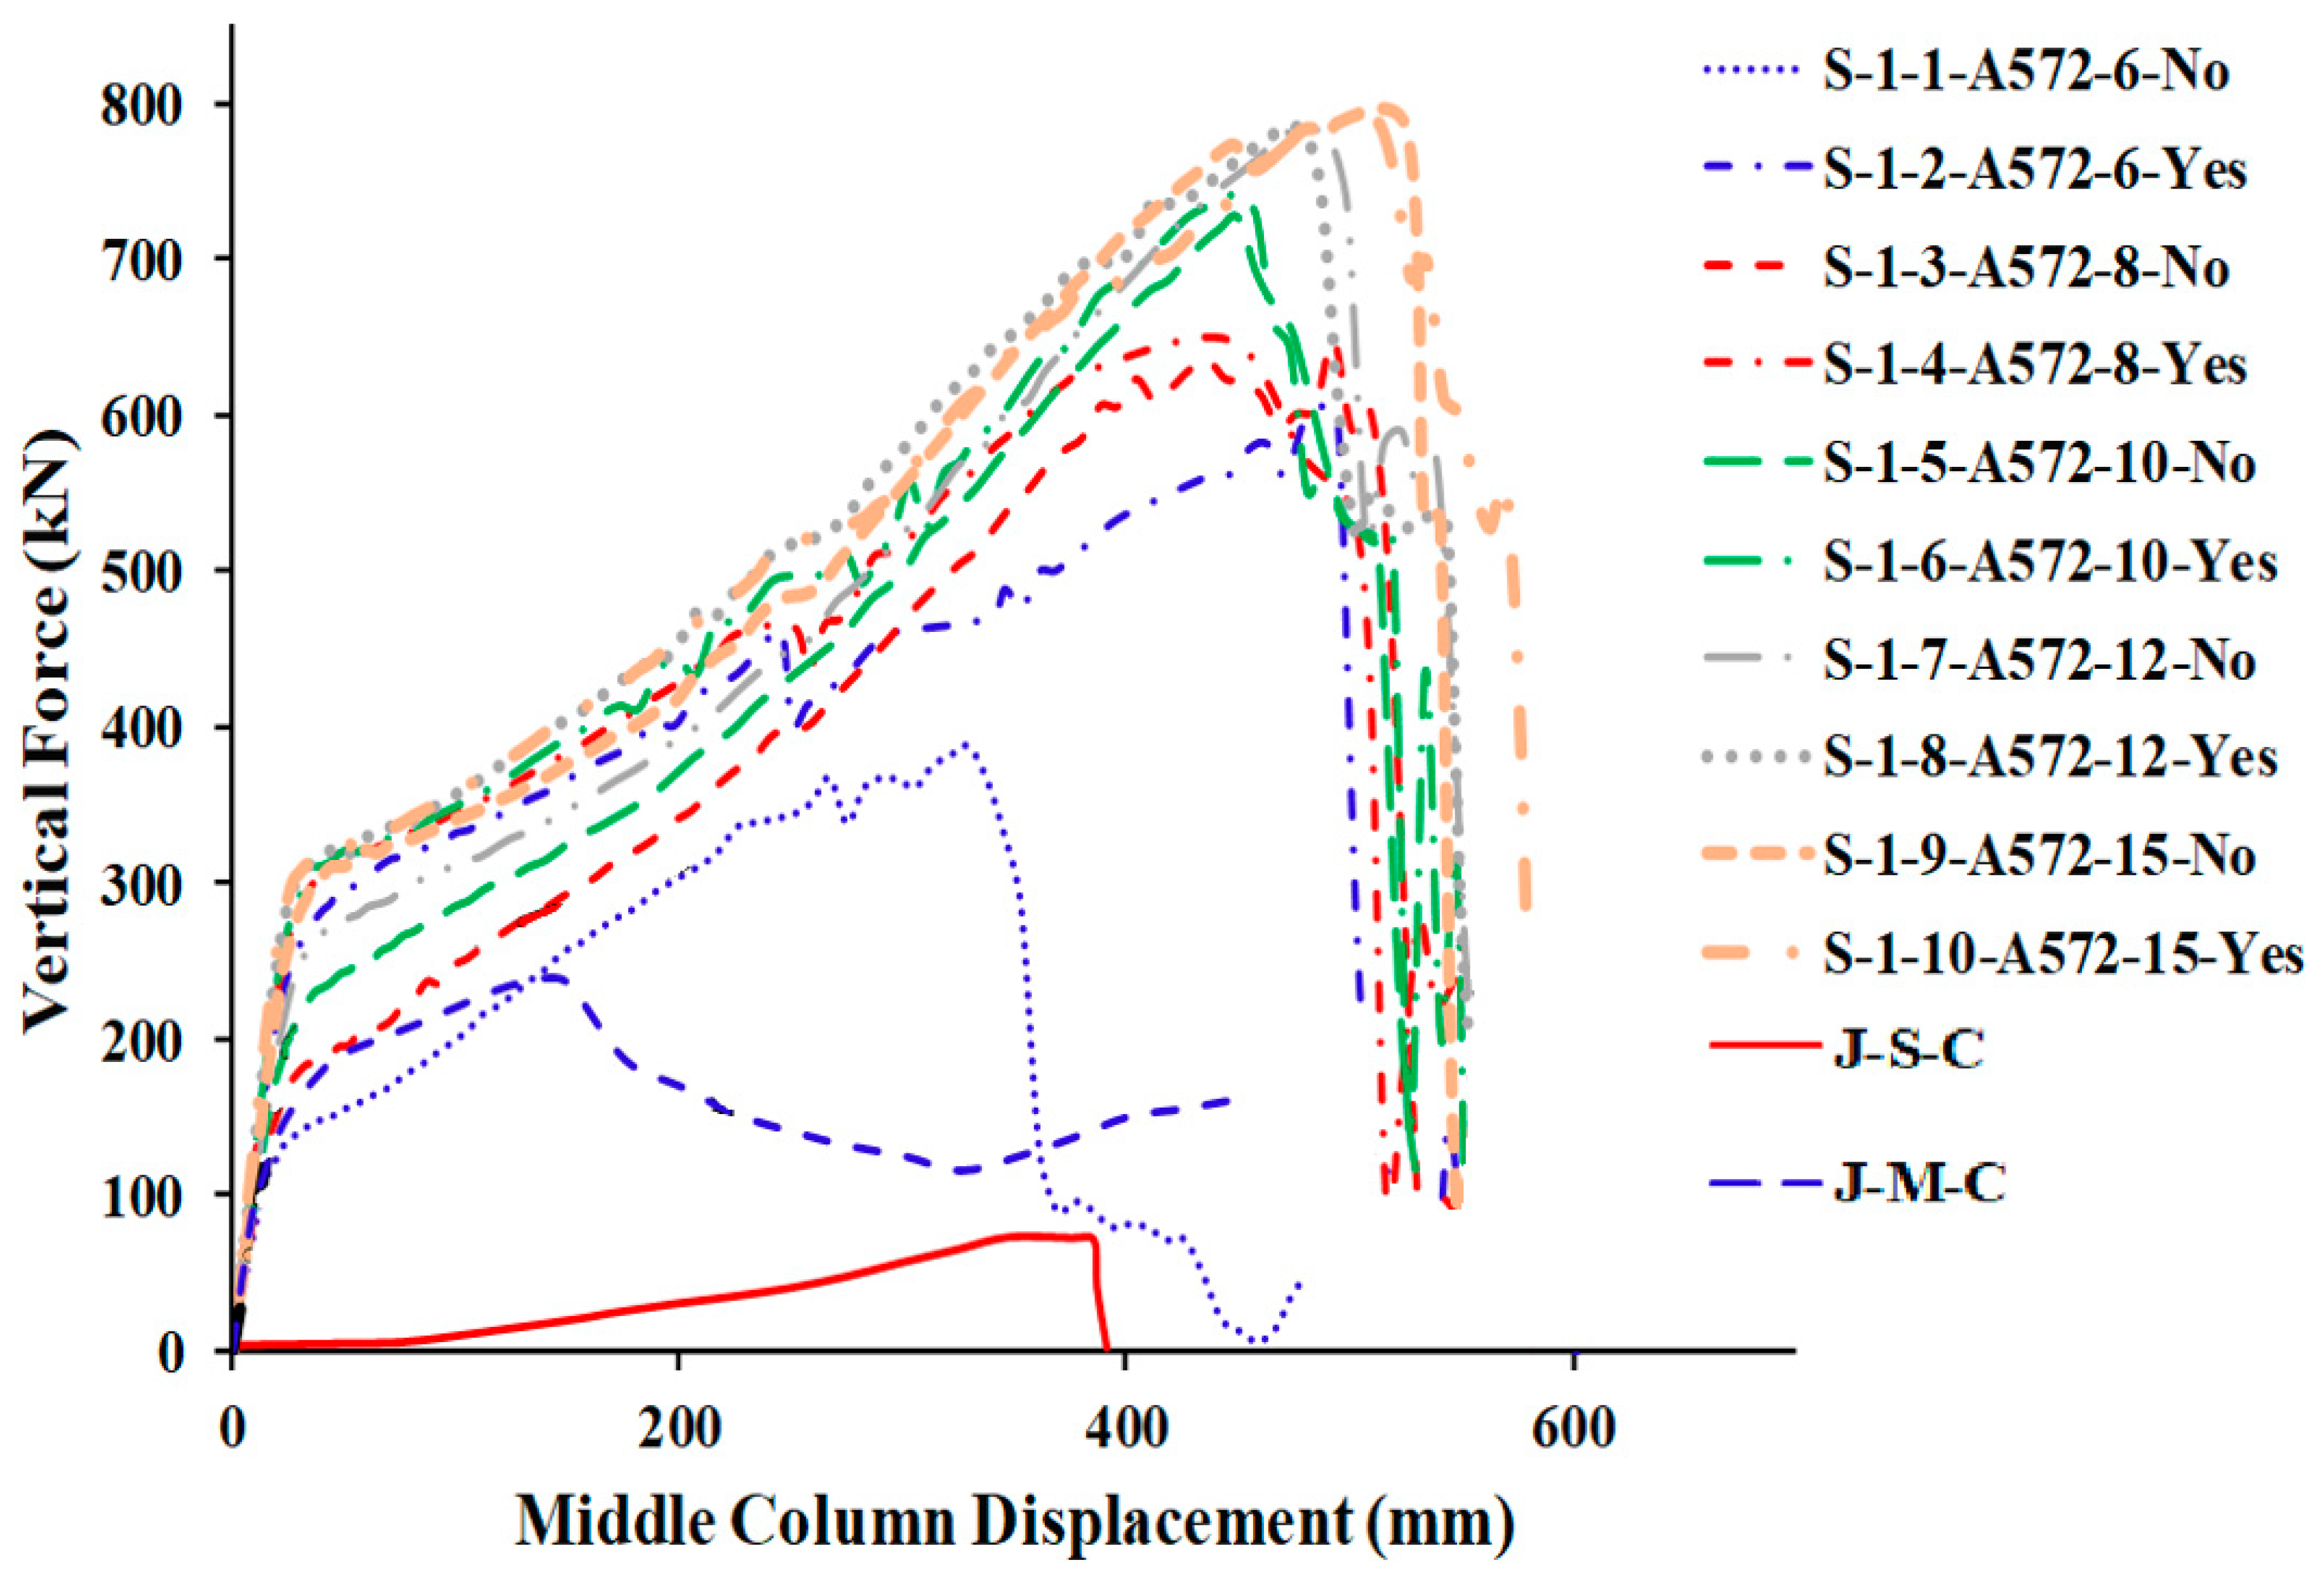
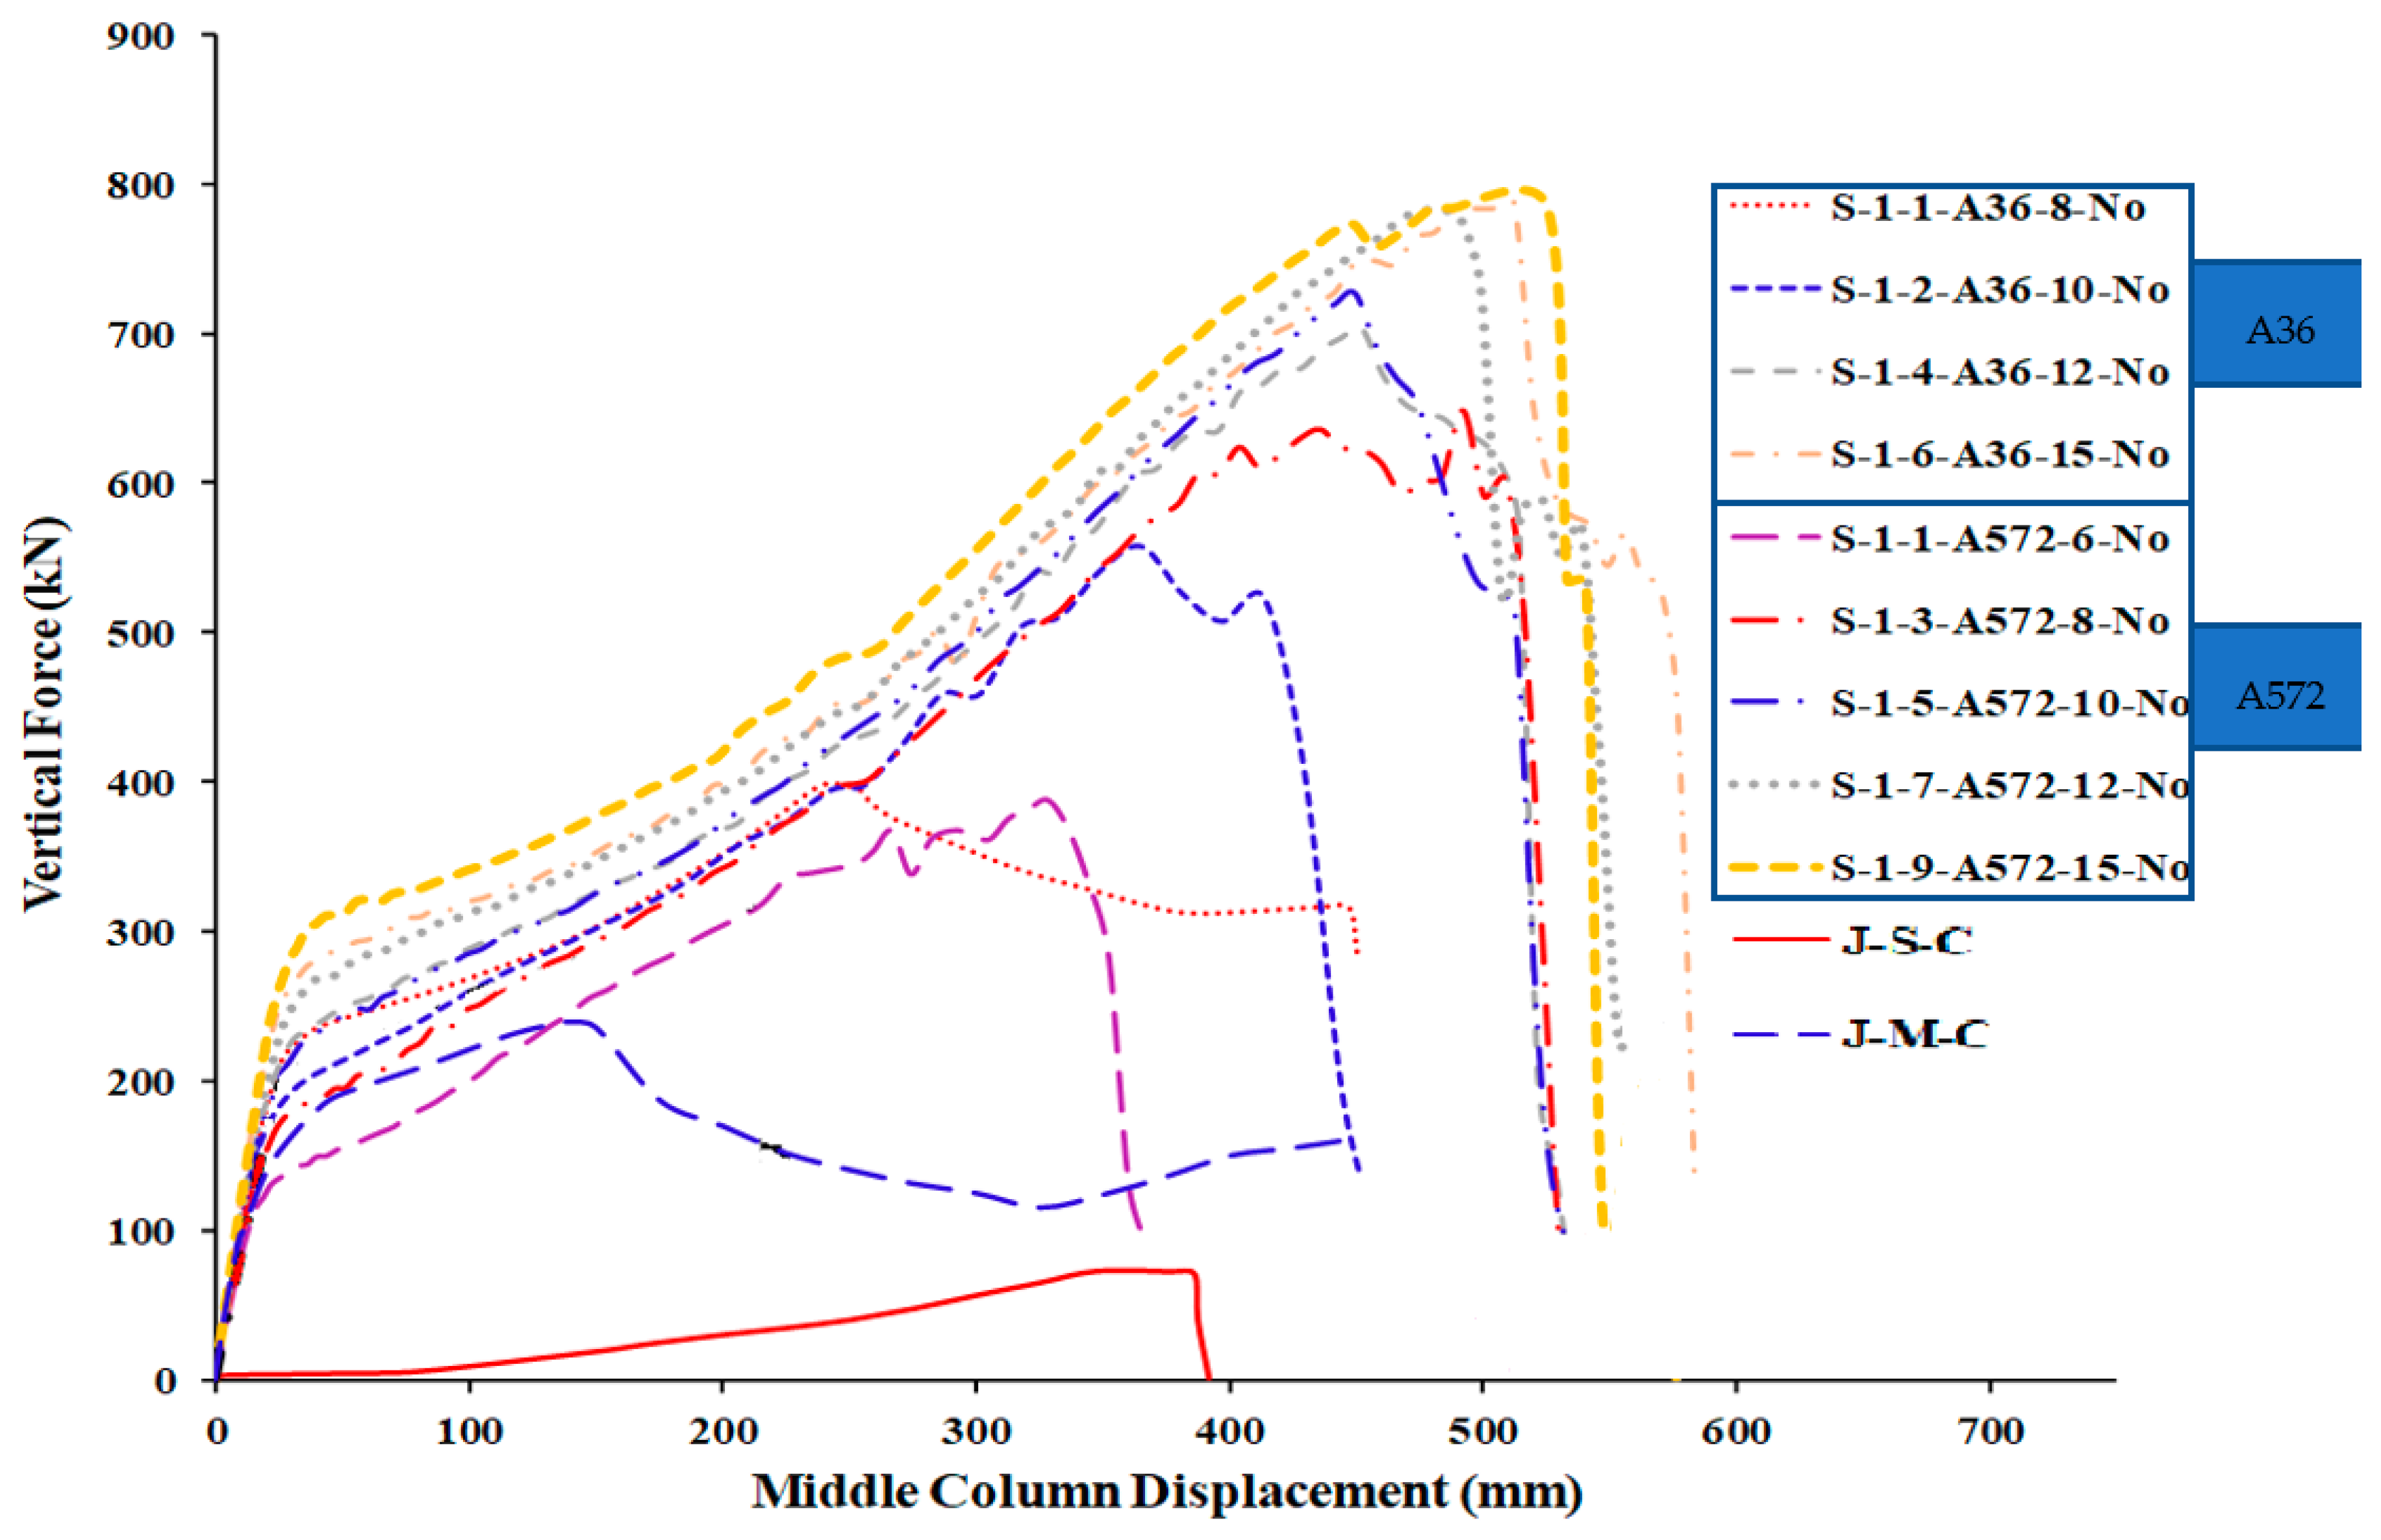
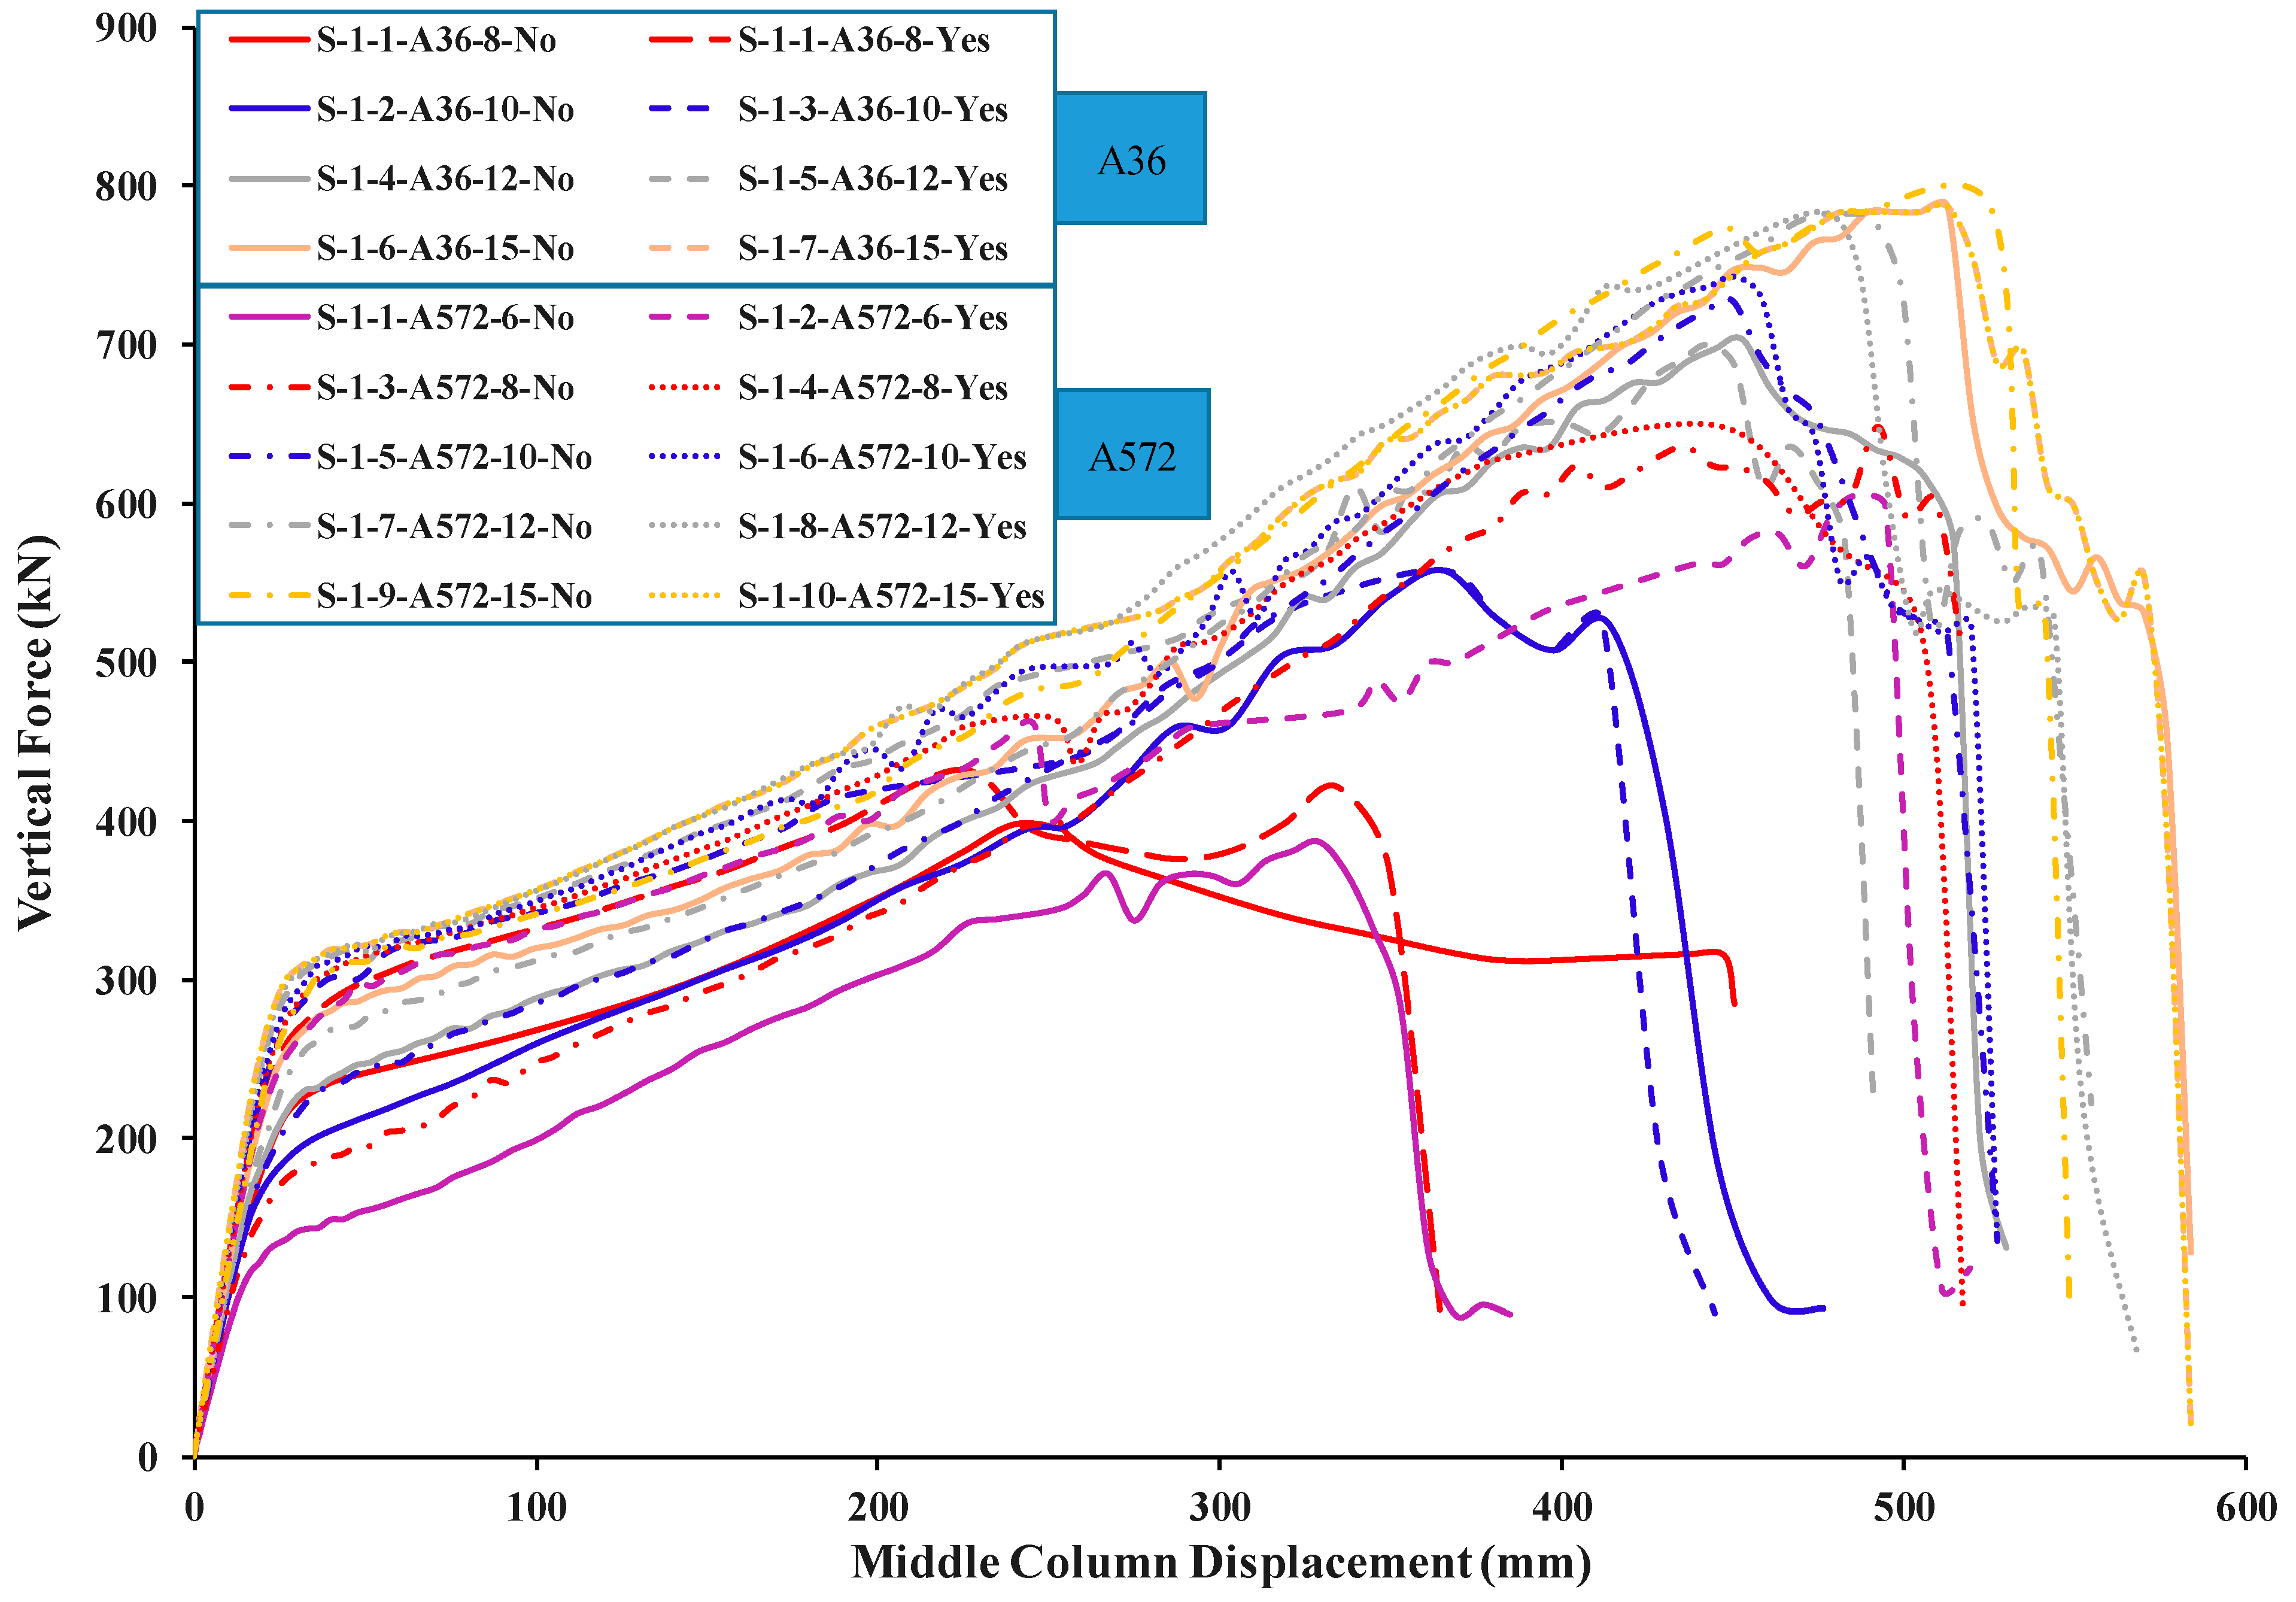
5.2. Effects of Steel Grade (A36 & A572)
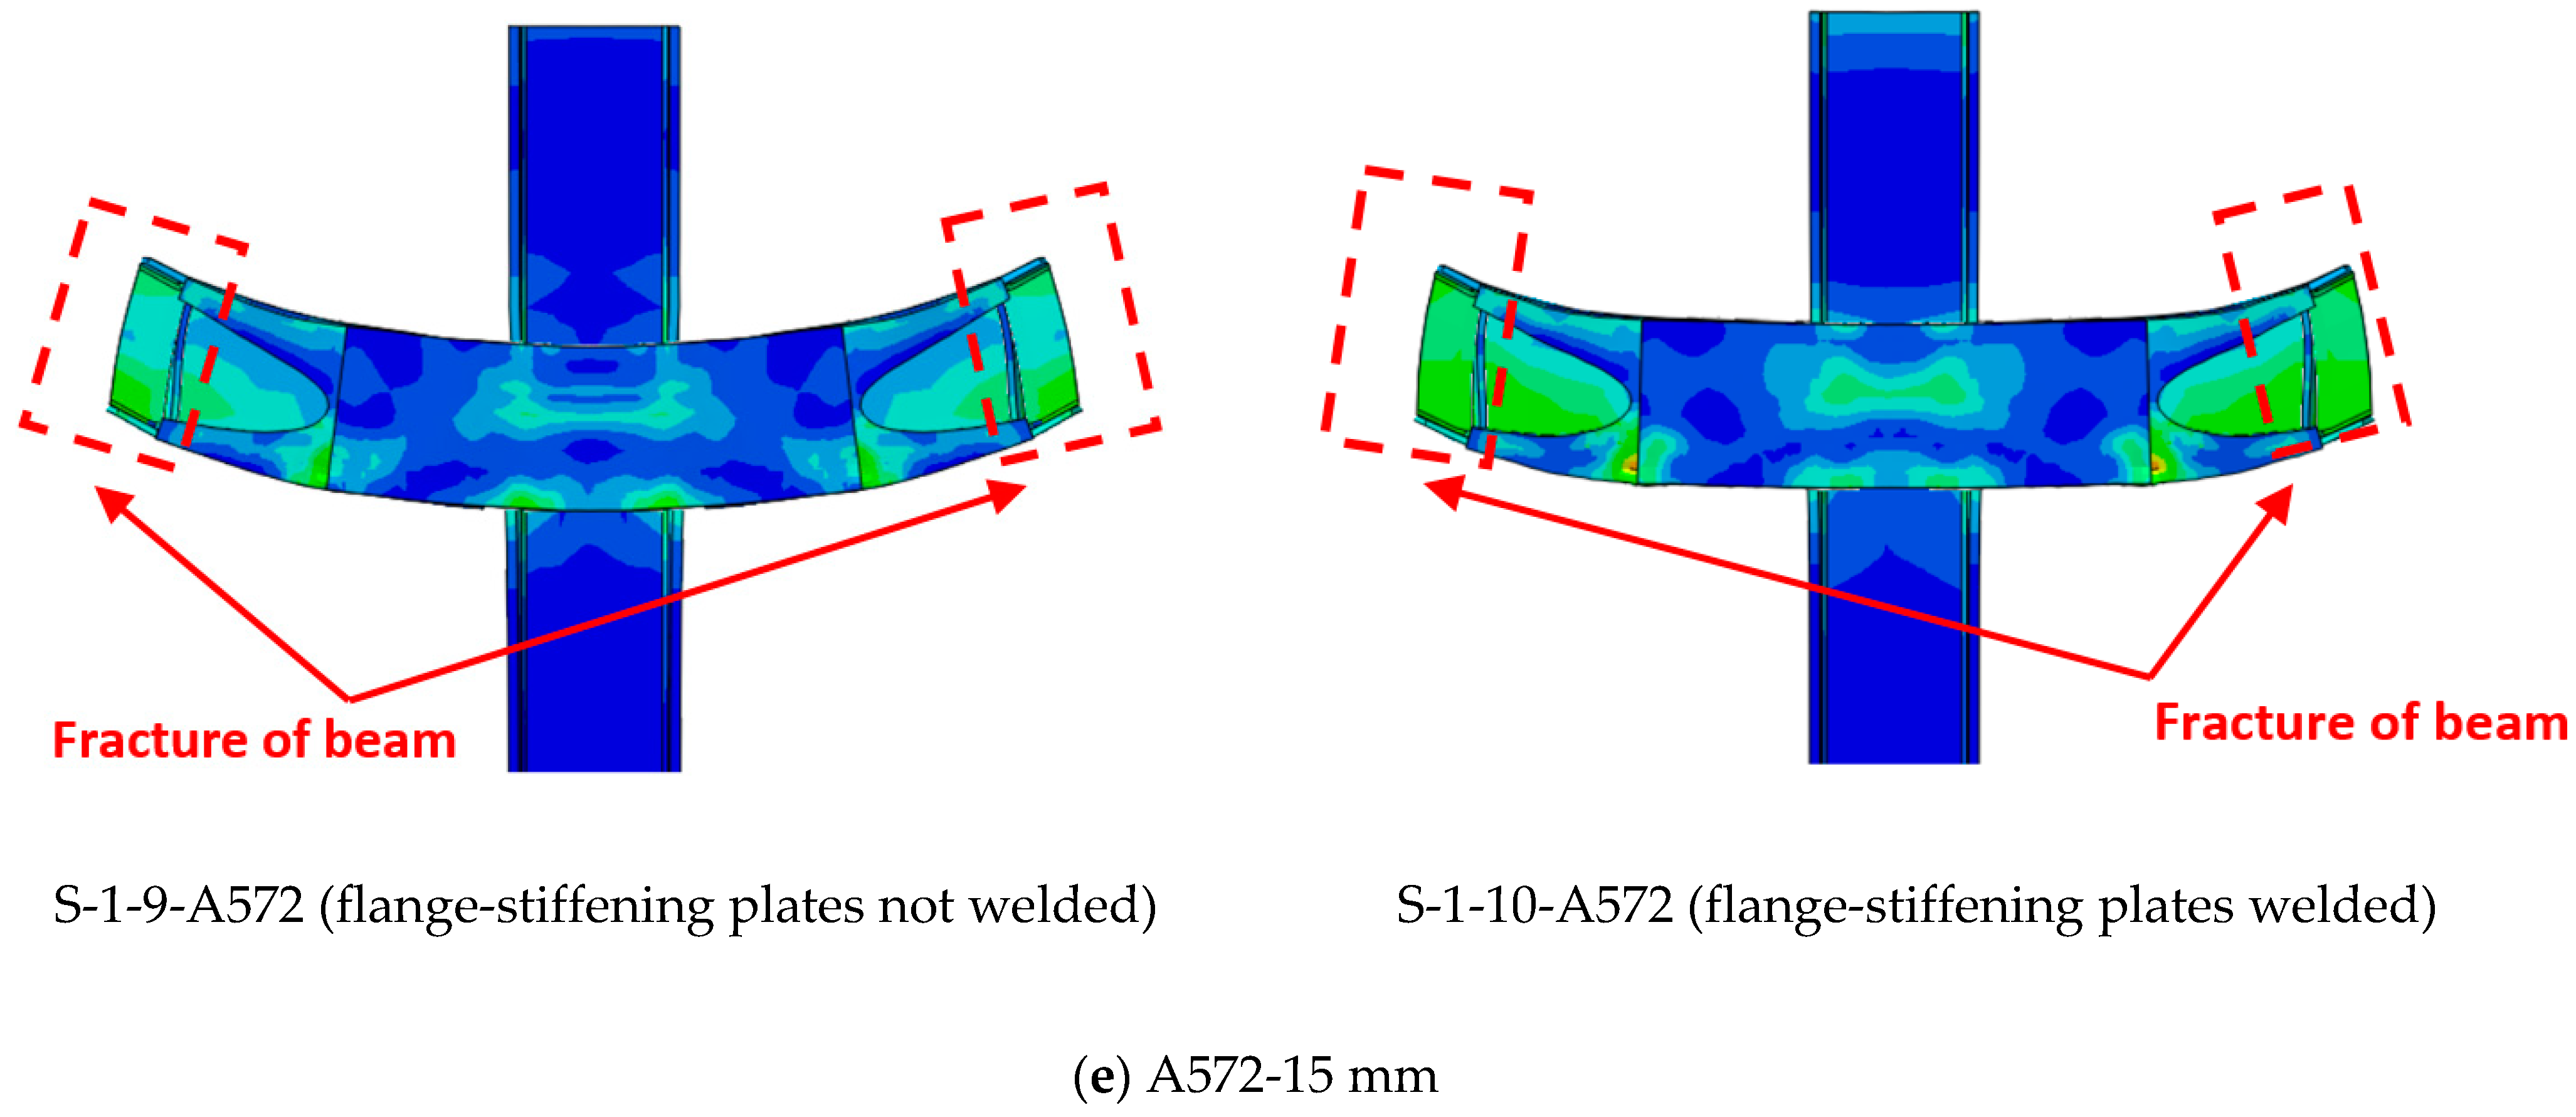
5.3. Effects of Welding of the Beam Flange-Stiffening Plates
6. Comparison of Parametric Study Results
7. Recommendations and Future Research Directions
- It was discovered that there is a limit to the progressive collapse resistance offered by simple beam–column connections. The linkages between these elements (beam and column) need to be strengthened so that the danger of progressive collapse may be reduced in significant existing buildings.
- It’s possible that the IMF connection, which is good for providing resistance to ground motions, will not be able to resist the progressive collapse.
- It is advised that a scheme be used for strengthening connections in multistory steel structures in order to mitigate the possibility of progressive collapse.
- The validated numerical models can be used for studying progressive collapse resistance of: (i) existing steel beam–column connections upgraded with any new strengthening scheme, (ii) newly developed steel moment beam–column connections.
- Experimental and validated numerical finite modeling is recommended to study the behavior of different strengthening designs such as: post-tension wire systems within the beam–column connection.
- It is recommended to develop simplified reduced finite element models using beam and spring elements to predict the progressive collapse risk of different types of steel beam–column connections due to column-loss events. This may include simple shear, IMF, and strengthened connections, and the models will be validated using the experimental results of this study in addition to other tests available in the literature. The validated reduced models may be further utilized to study the progressive collapse risk of existing multistory steel framed buildings under column loss events. Additionally, the progressive collapse risk of the full steel framed buildings, simulated using reduced FEMs, may be numerically investigated under blast generated waves.
- Further research is needed to study experimentally and numerically the effect of composite RC slabs on reducing the progressive collapse potential of different types of steel beam–column connections (simple shear, IMF, special moment resisting frame, and strengthened connections) under column-loss scenarios. Effect of different designs of metal studs should be included.
8. Conclusions
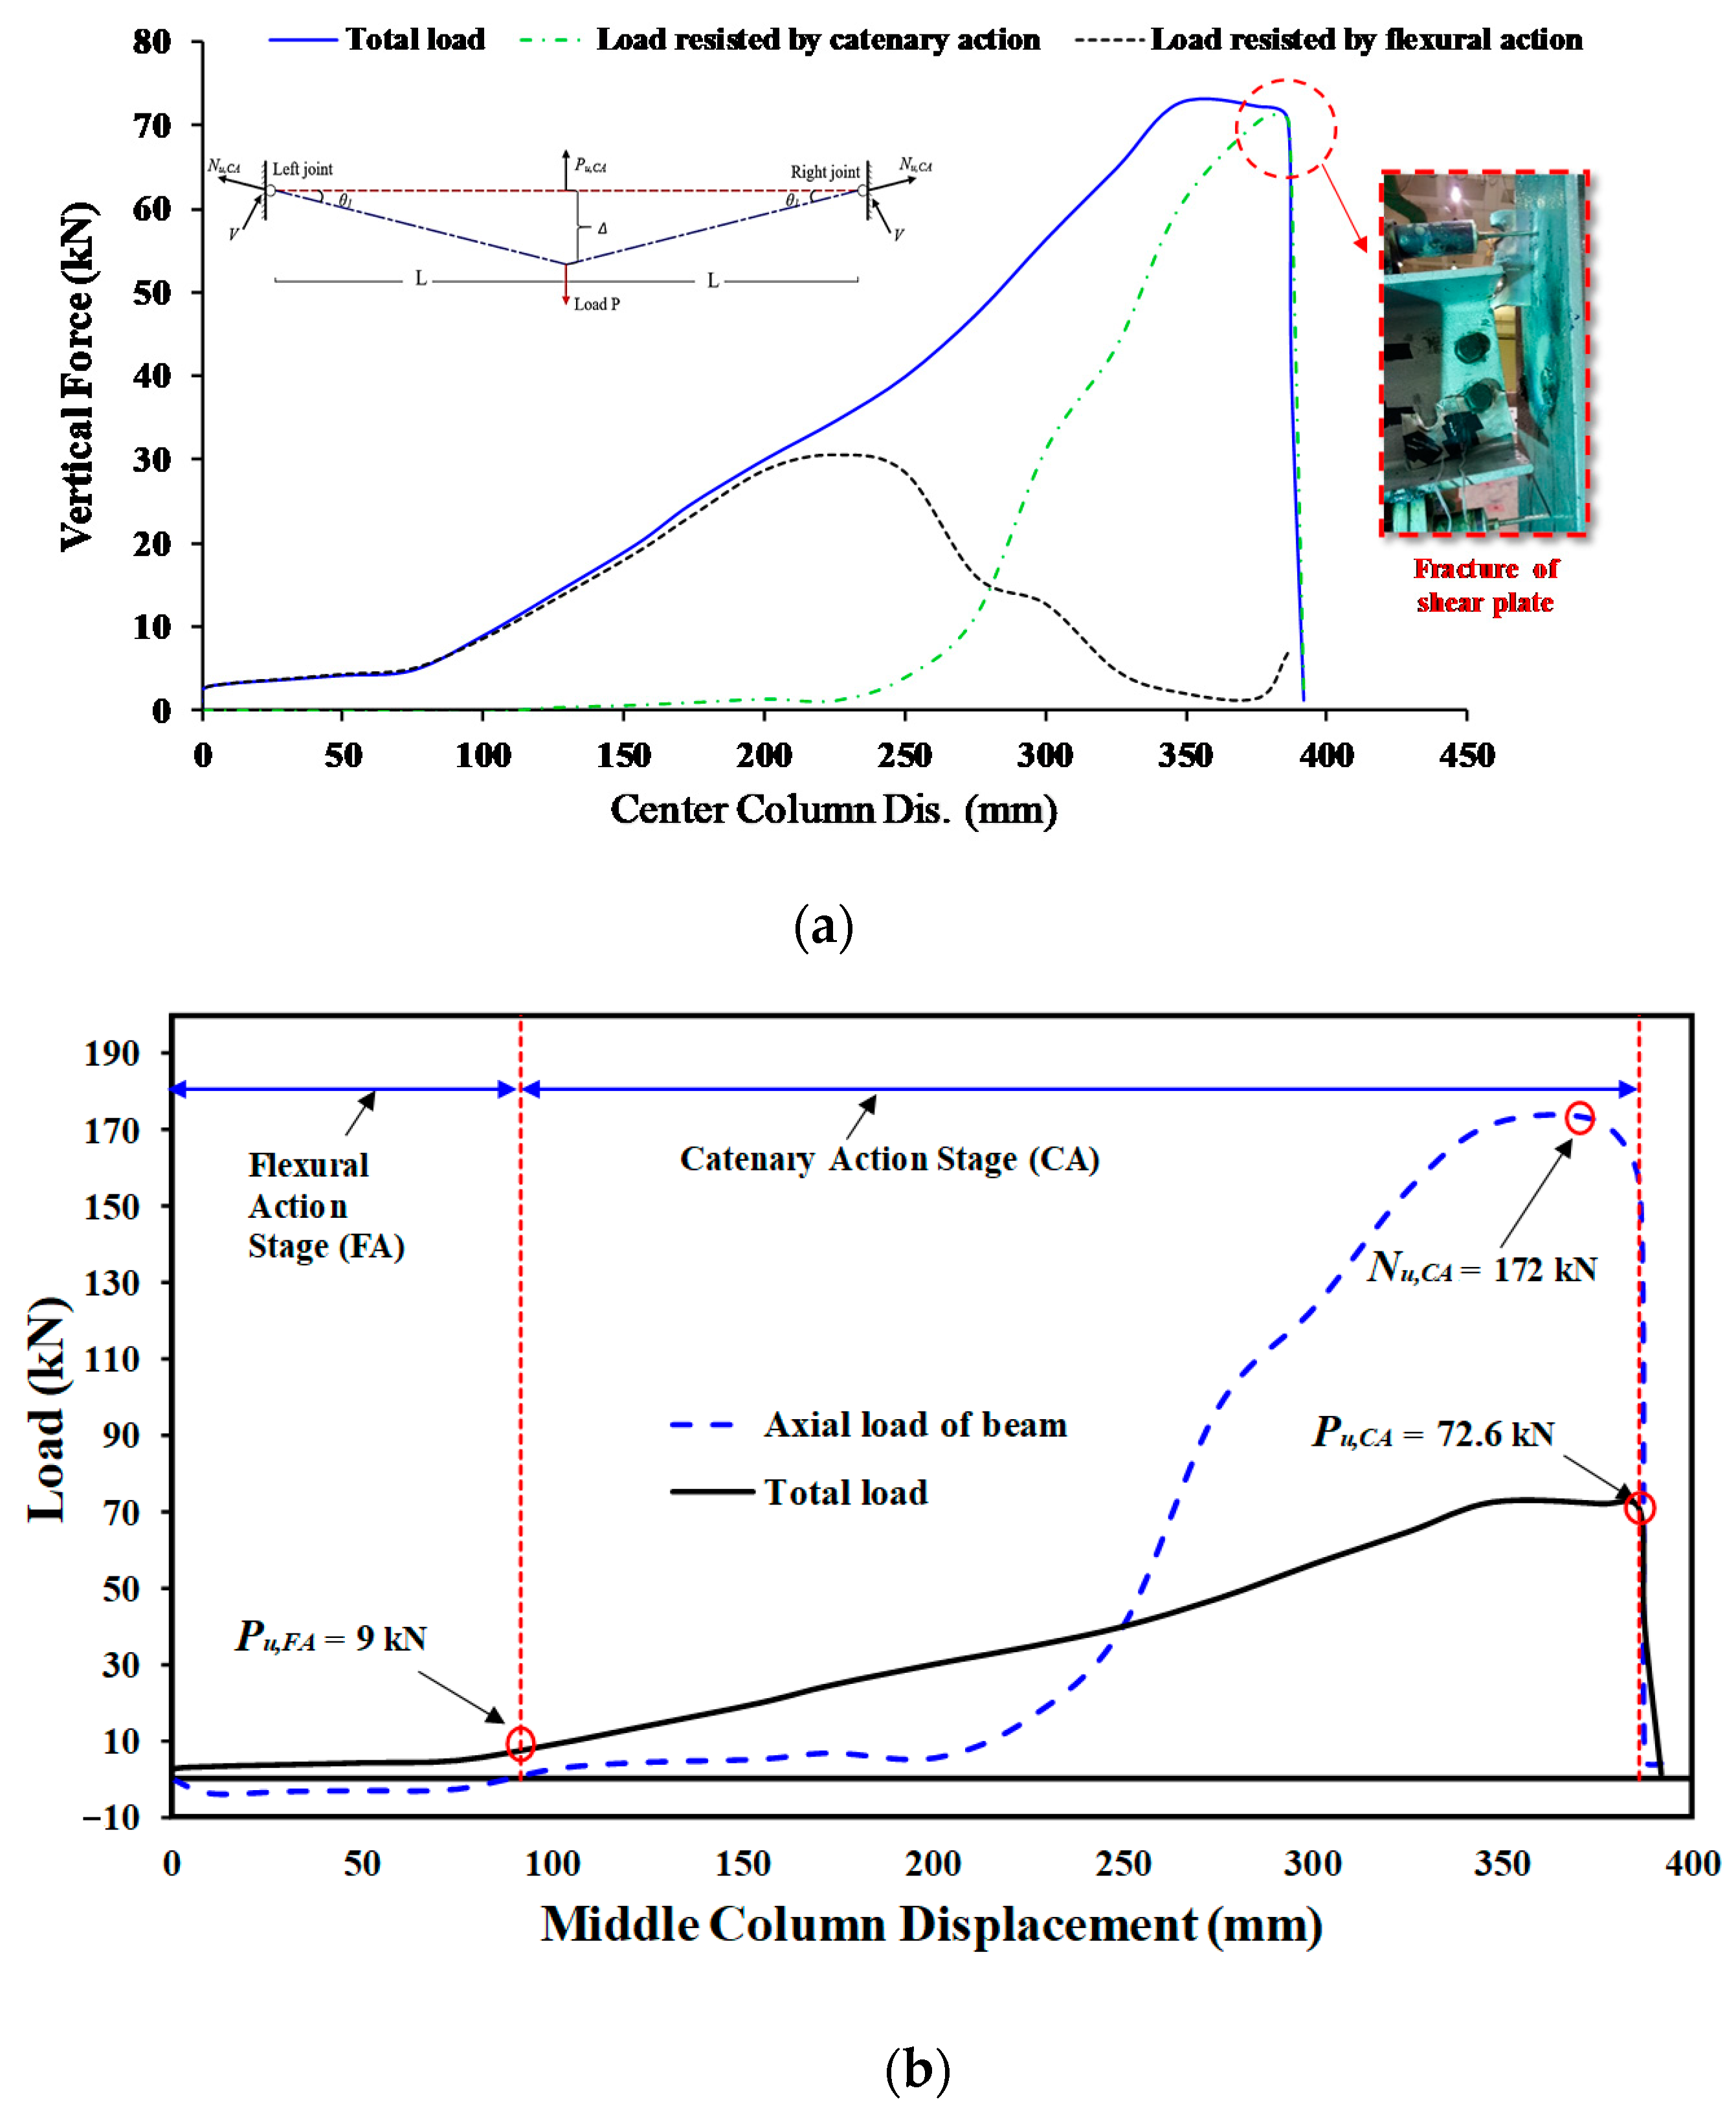
- The shear-specimen J-S-C had a significantly high risk of progressive collapse because there were not enough load pathways available.
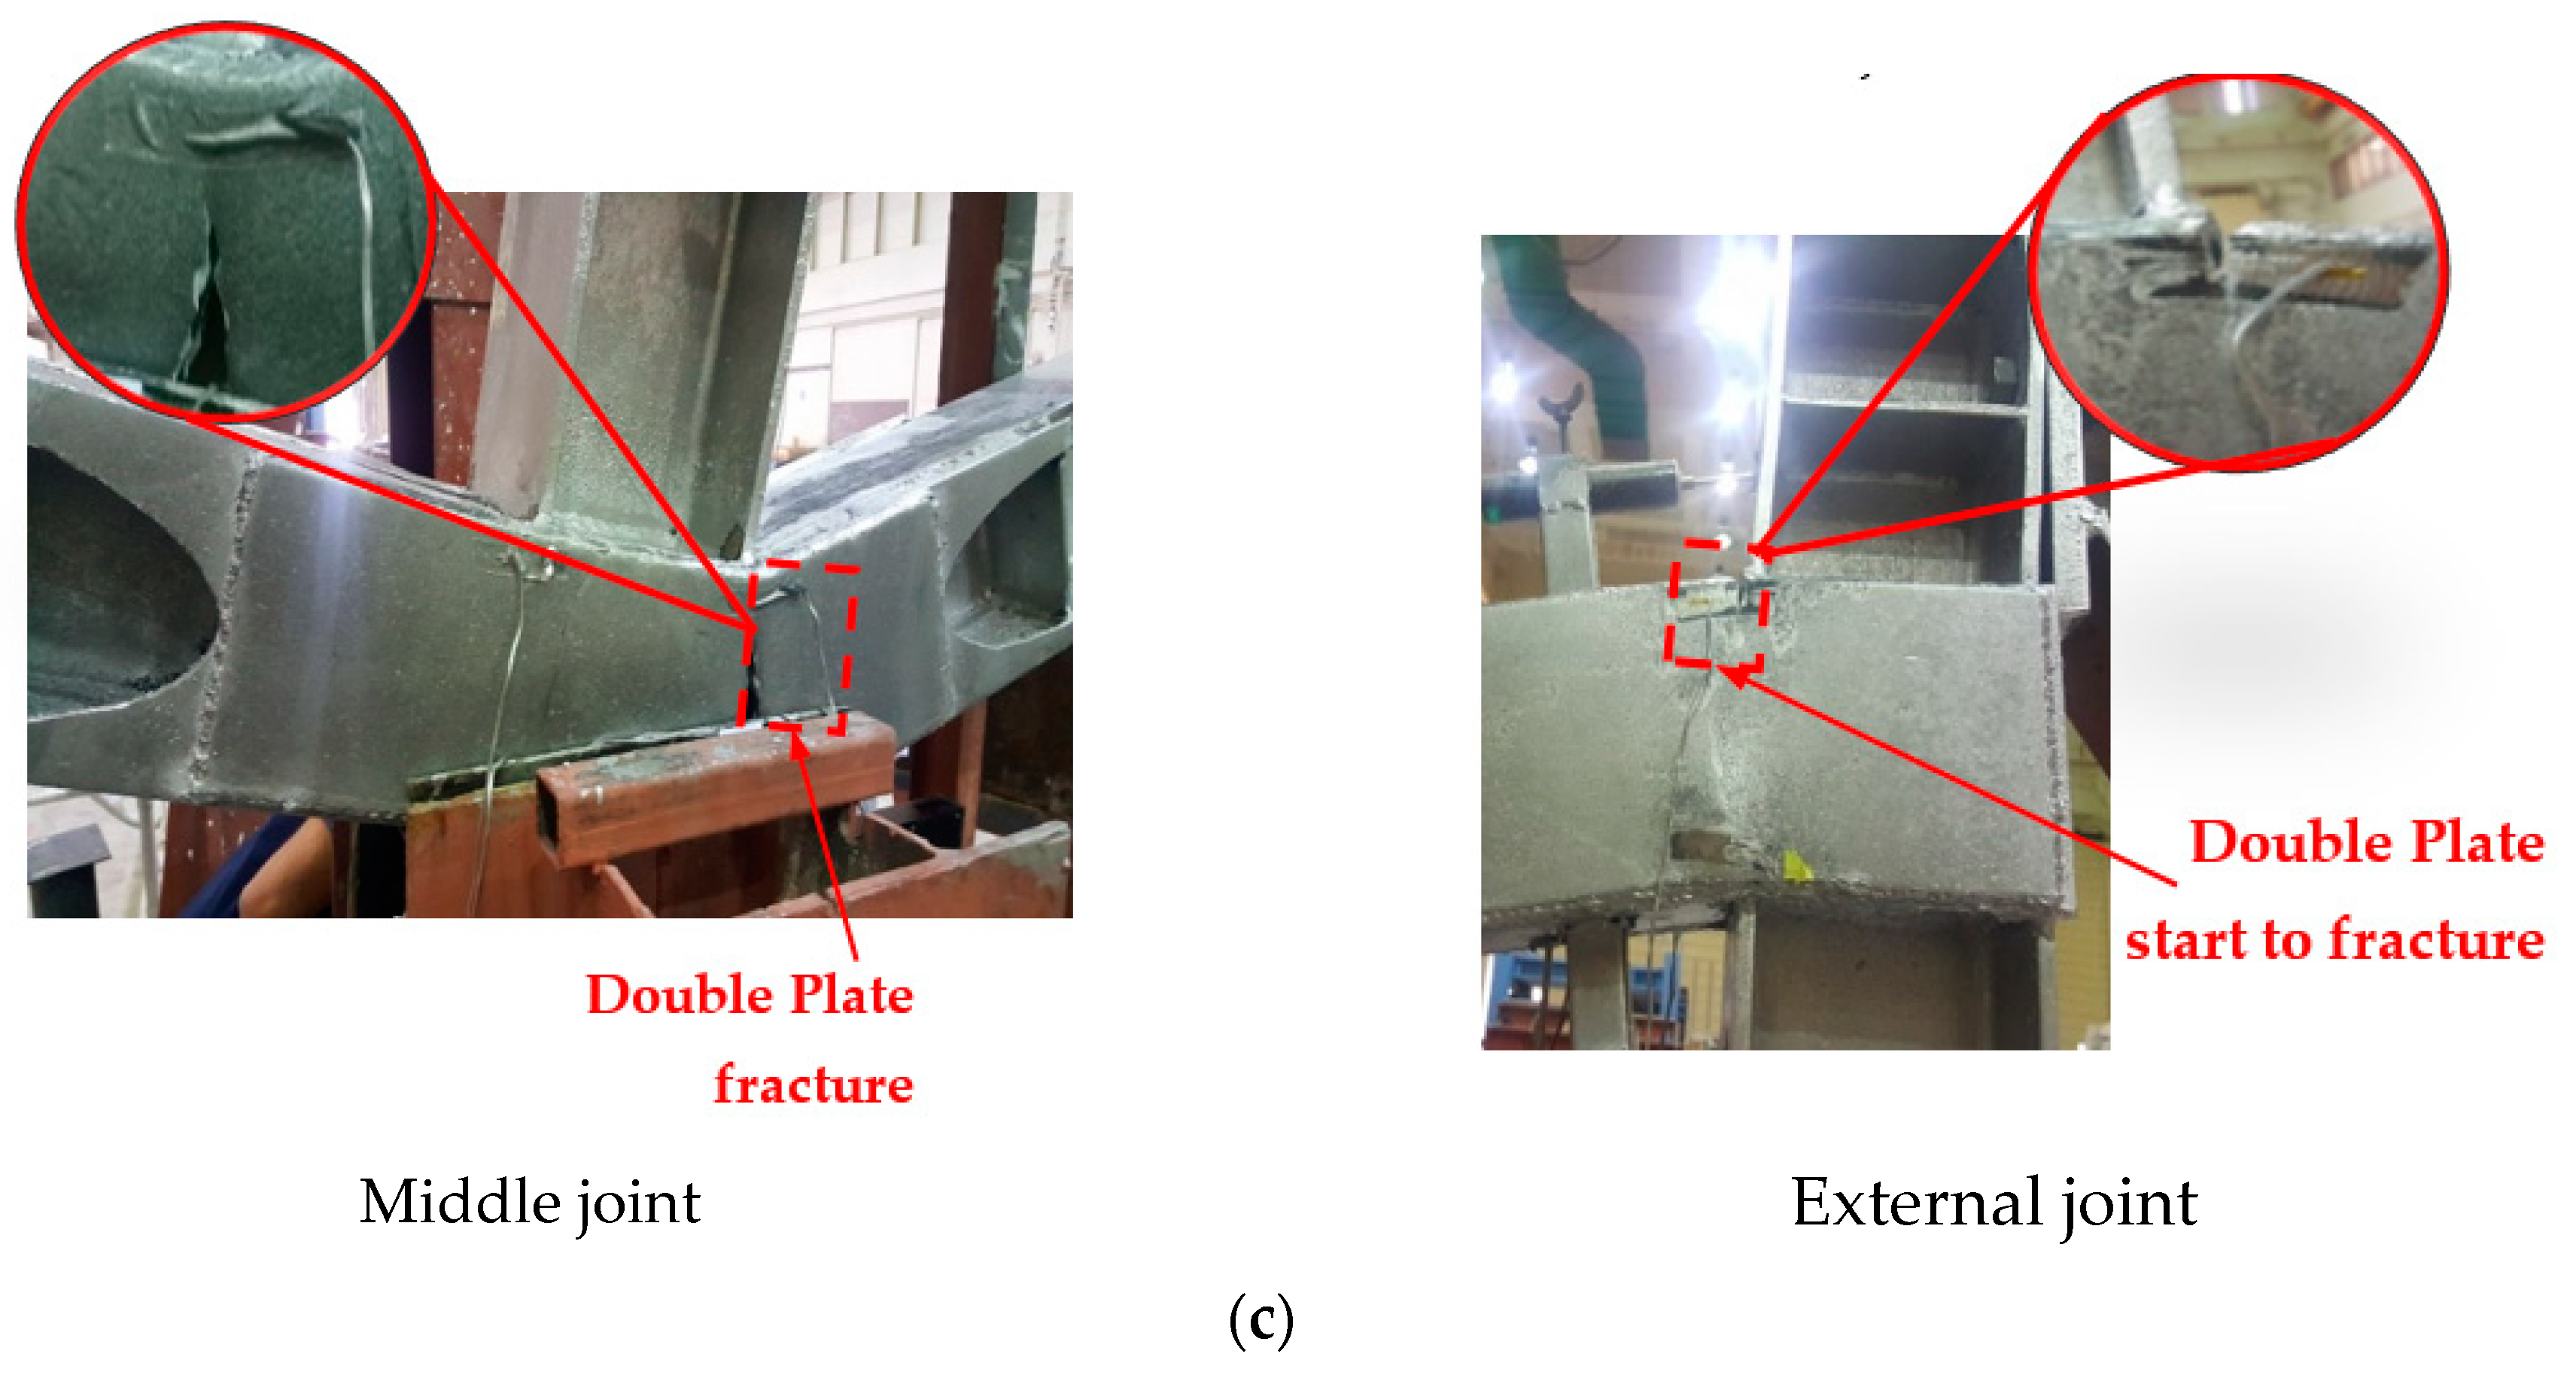
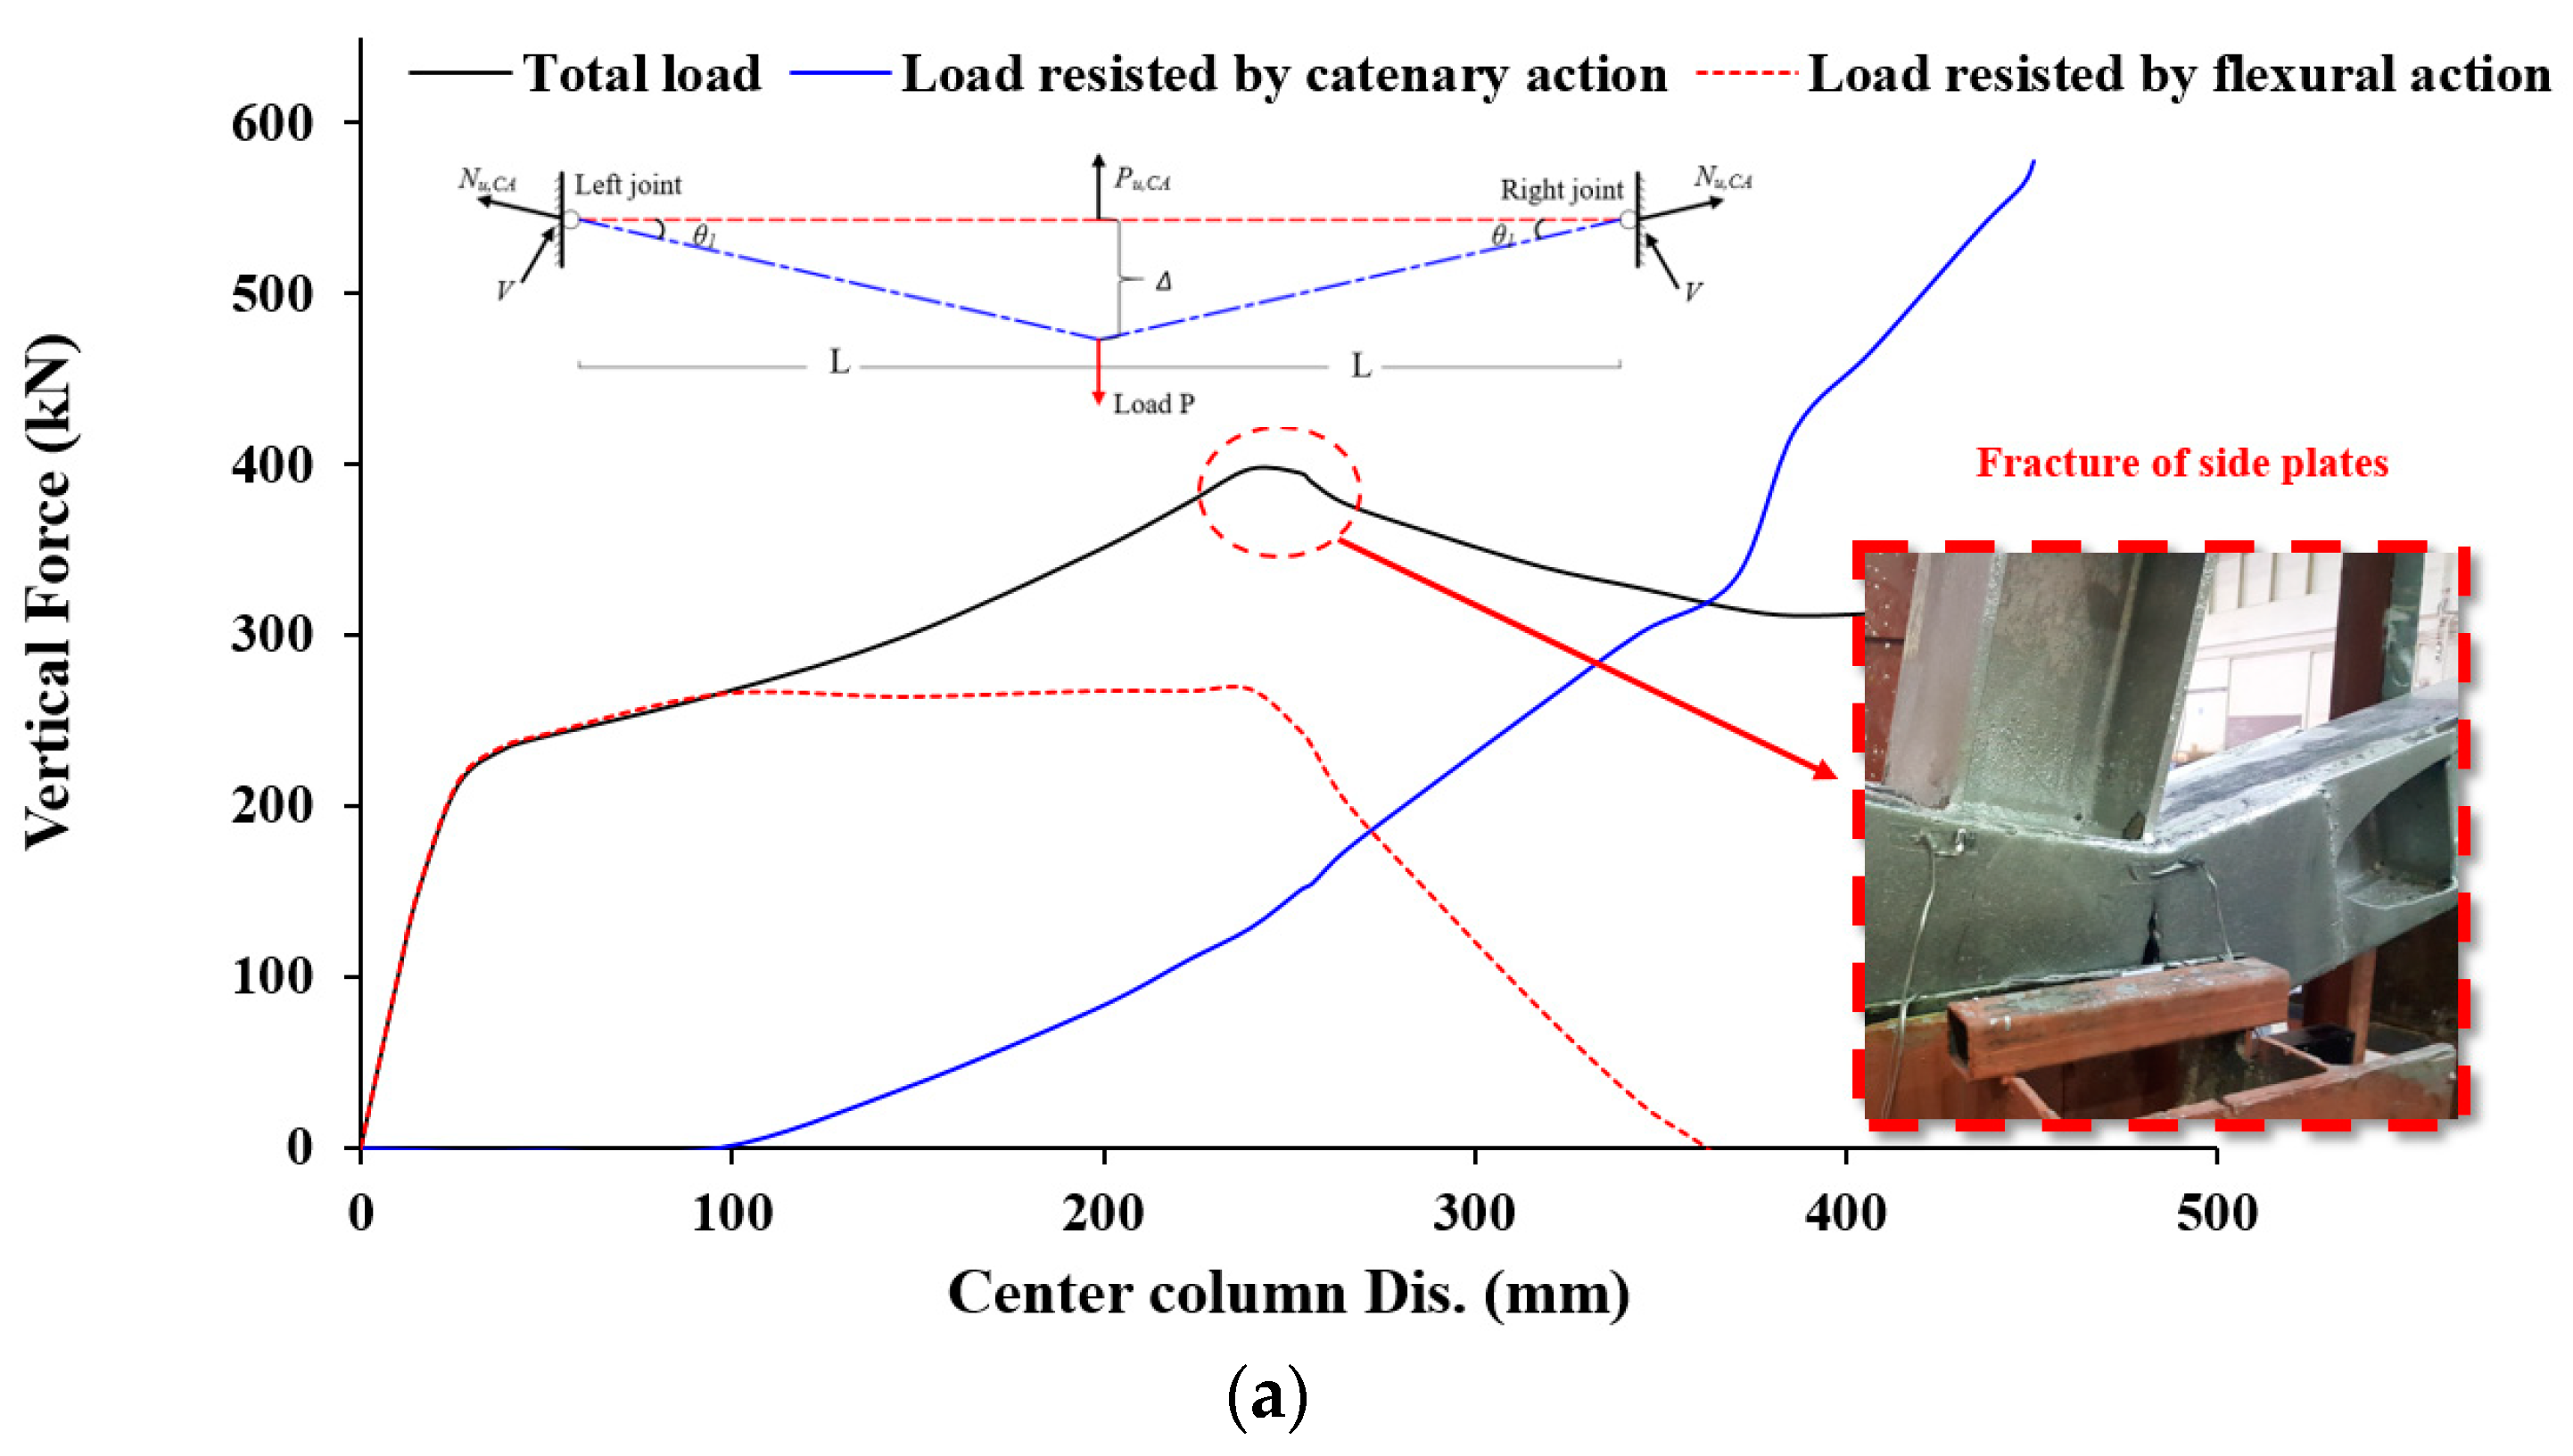
- The load-deformation response during a sudden column removal event was significantly enhanced by the employment of welded double-sided steel plates in the beam-to-column joint zone for the upgrading of shear beam-to-column joints. The enhanced frame J-S-S-EX could support around 5.5 times the maximum load of its predecessor, designated J-S-C (control specimen). However, in the final state, the amount of energy dissipated in the test frame J-S-S-EX was around 11.0 times that in the control frame J-S-C.
- The strengthened frame J-S-S-EX was able to support around 1.6 times as much weight as the IMF test frame J-M-C. In addition, the peak energy absorbed by test frame J-S-S-EX was almost 1.80% more than that of IMF specimen J-M-C.
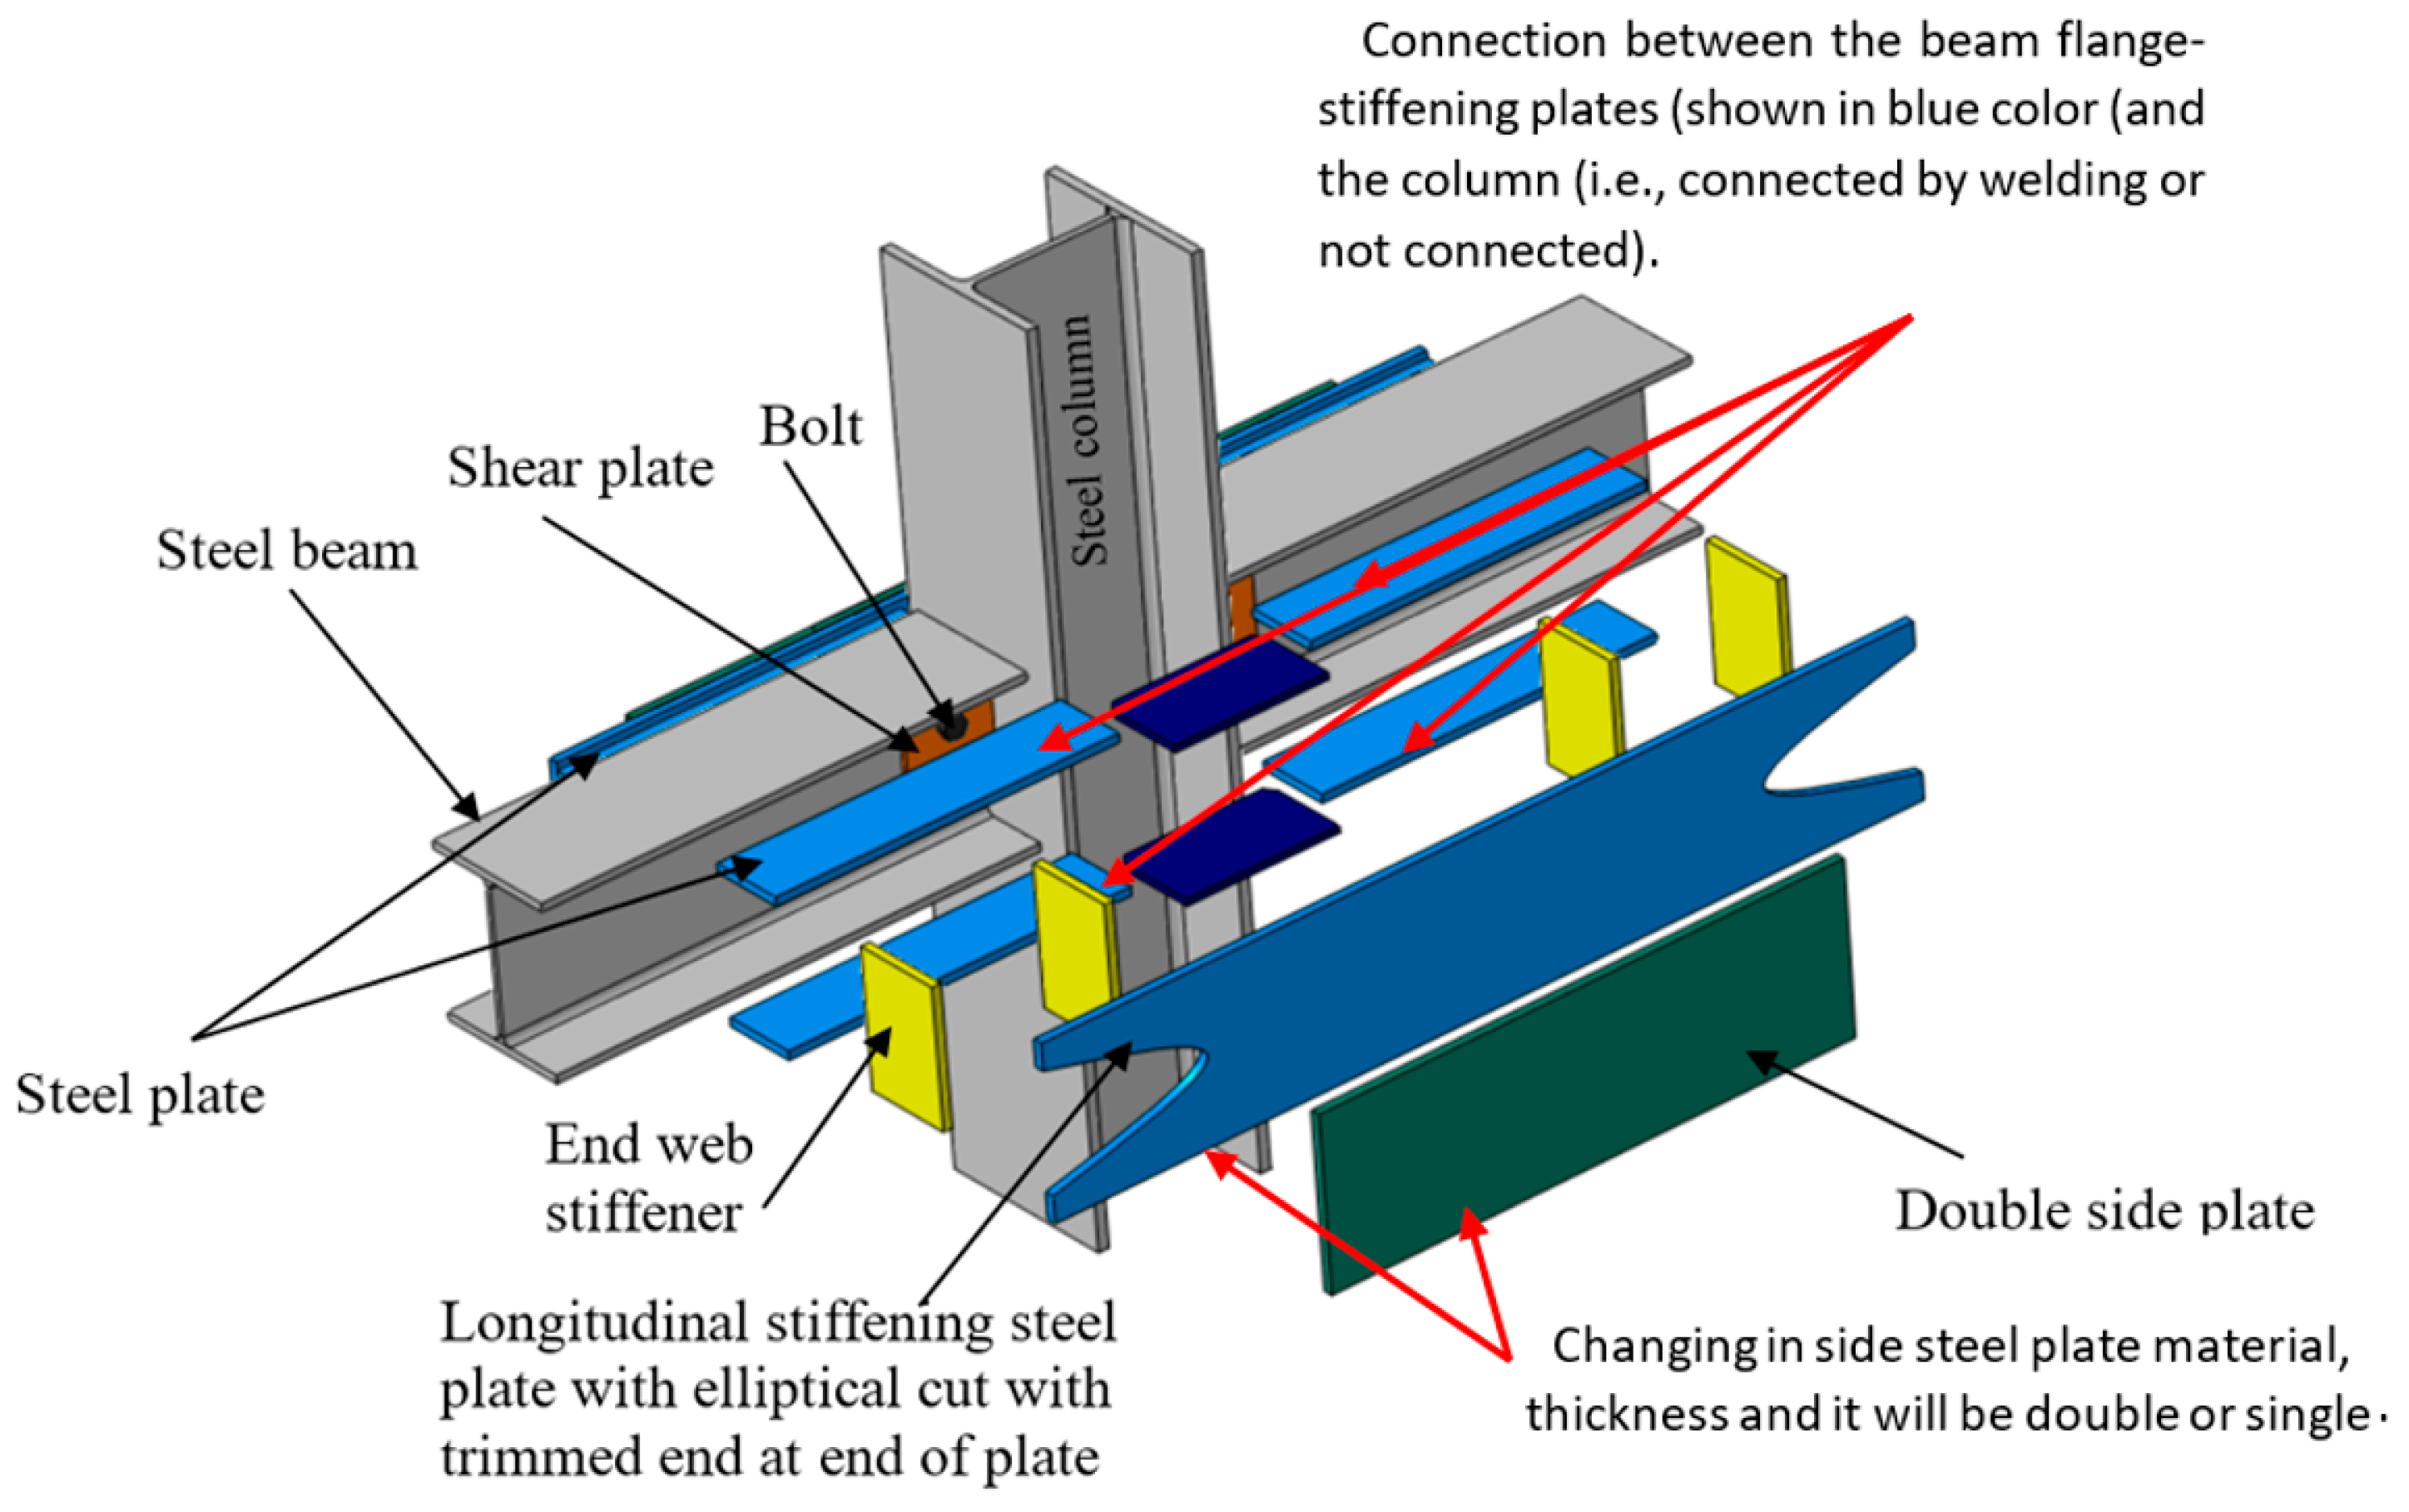
- Three parameters were numerically investigated for strengthening of the shear beam–column connections using welded double side plates: (i) plate thickness, (ii) steel grade, and (iii) connection between the beam flange-stiffening plates and the column (i.e., connected by welding or not connected).
- It should be noted that the average increase in the peak load due to the change in plate thickness from 6 mm to 15 mm is about 22% and 8% for grades A36 and A572, respectively.
- The average increase in the peak load due to the change in steel grade of plates from A36 to A572 is about 30%.
- The average increase in the load-carrying capacity due to welding between the beam flange-stiffening plates and column is about 25%. The results of the analysis for all parameters of this scheme show that the catenary action stage was reached in all specimens, which helps mitigate (or diminish) the progressive collapse risk.
- The specimen that used a side plate with 15 mm of thickness, regardless of whether it was made of A36 or A572 material, showed the greatest performance in load displacement characteristics when subjected to the progressive collapse test out of all of the FE tested specimens.
Author Contributions
Funding
Institutional Review Board Statement
Informed Consent Statement
Data Availability Statement
Acknowledgments
Conflicts of Interest
References
- Seffen, K.A. Progressive collapse of the world trade center: Simple analysis. J. Eng. Mech. 2008, 134, 125–132. [Google Scholar] [CrossRef] [Green Version]
- Fu, F. Progressive collapse analysis of high-rise building with 3-D finite element modeling method. J. Const. Steel Res. 2009, 65, 1269–1278. [Google Scholar] [CrossRef]
- Khandelwal, K.; El-Tawil, S.; Sadek, F. Progressive collapse analysis of seismically designed steel braced frames. J. Const. Steel Res. 2009, 65, 699–708. [Google Scholar] [CrossRef]
- Bazant, Z.P.; Verdure, M. Mechanics of progressive collapse: Learning from world trade center and building demolitions. J. Eng. Mech. 2007, 133, 308–319. [Google Scholar]
- Leyendecker, E.V.; Ellingwood, B.R. Design Methods for Reducing the Risk of Progressive Collapse in Buildings; National Bureau of Standards: Washington, DC, USA, 1977. [Google Scholar]
- Alrubaidi, M.; Elsanadedy, H.; Abbas, H.; Almusallam, T.; Al-Salloum, Y. Investigation of different steel intermediate mo-ment frame connections under column-loss scenario. Thin-Walled Struct. 2020, 154, 106875. [Google Scholar] [CrossRef]
- Alrubaidi, M.; Alhammadi, S.A. Effectiveness of masonry infill walls on steel frames with different beam-column connections under progressive collapse. In Structures; Elsevier: Amsterdam, The Netherlands, 2022; Volume 38, pp. 202–224. [Google Scholar]
- Marjanishvili, S.; Agnew, E. Comparison of various procedures for progressive collapse analysis. J. Perform. Constr. Facil. 2006, 20, 365–374. [Google Scholar] [CrossRef]
- Kim, J.; Kim, T. Assessment of progressive collapse-resisting capacity of steel moment frames. J. Const. Steel Res. 2009, 65, 169–179. [Google Scholar] [CrossRef]
- Kim, J.; An, D. Evaluation of progressive collapse potential of steel moment frames considering catenary action. Struct. Des. Tall Spec. Build. 2009, 18, 455–465. [Google Scholar] [CrossRef]
- Grierson, D.; Safi, M.; Xu, L.; Liu, Y. Simplified methods for progressive-collapse analysis of buildings. In Proceedings of the Structures Congress 2005: Metropolis and Beyond, New York, NY, USA, 20–24 April 2005. [Google Scholar]
- Izzuddin, B.A.; Vlassis, A.G.; Elghazouli, A.Y.; Nethercot, D.A. Progressive collapse of multistory buildings due to sudden column loss. Part I: Simplified assessment framework. J. Struct. Eng. 2008, 30, 1308–1318. [Google Scholar] [CrossRef] [Green Version]
- Vlassis, A.G.; Izzuddin, B.A.; Elghazouli, A.Y.; Nethercot, D.A. Progressive collapse of multistorey buildings due to sudden column loss—Part II: Application. J. Struct. Eng. 2008, 30, 1424–1438. [Google Scholar] [CrossRef] [Green Version]
- Lee, C.; Kim, S.; Han, K.; Lee, K. Simplified nonlinear progressive collapse analysis of welded steel moment frames. J. Const. Steel Res. 2009, 65, 1130–1137. [Google Scholar] [CrossRef]
- Naji, A.; Irani, F. Progressive collapse analysis of steel frames: Simplified procedure and explicit expression for dynamic in-crease factor. J. Struct. Eng. 2012, 12, 537–549. [Google Scholar] [CrossRef]
- Oosterhof, S.A.; Driver, R.G. Behavior of steel shear connections under column-removal demands. J. Struct. Eng. 2015, 141, 04014126. [Google Scholar] [CrossRef]
- Liu, C.; Tan, K.H.; Fung, T.C. Dynamic behaviour of web cleat connections subjected to sudden column removal scenario. J. Const. Steel Res. 2013, 86, 92–106. [Google Scholar] [CrossRef]
- Yang, B.; Tan, K.H. Robustness of bolted-angle connections against progressive collapse: Experimental tests of beam-column joints and development of component-based models. J. Struct. Eng. 2013, 139, 1498–1514. [Google Scholar] [CrossRef]
- Li, H.; Cai, X.; Zhang, L.; Zhang, B.; Wang, W. Progressive collapse of steel moment-resisting frame subjected to loss of inte-rior column: Experimental tests. J. Struct. Eng. 2017, 150, 203–220. [Google Scholar] [CrossRef]
- Bae, S.W.; LaBoube, R.A.; Belarbi, A.; Ayoub, A. Progressive collapse of cold-formed steel framed structures. Thin-Walled Struct. 2008, 46, 706–719. [Google Scholar] [CrossRef]
- Han, Q.; Li, X.; Liu, M.; Spencer, B.F., Jr. Performance analysis and macromodel simulation of steel frame structures with beam-column joints using cast steel stiffeners for progressive collapse prevention. Thin-Walled Struct. 2019, 140, 404–415. [Google Scholar] [CrossRef]
- Farzampour, A. Innovative Structural Fuse Systems for Various Prototype Applications. Materials 2022, 15, 805. [Google Scholar] [CrossRef]
- Paslar, N.; Farzampour, A. Effects of Infill Plate’s Interconnection and Boundary Element Stiffness on Steel Plate Shear Walls’ Seismic Performance. Materials 2022, 15, 5487. [Google Scholar] [CrossRef]
- Farzampour, A.; Eatherton, M.R. Investigating limit states for butterfly-shaped and straight shear links. In Proceedings of the 16th European Conference on Earthquake Engineering, 16ECEE, Thessaloniki, Greece, 18 June 2018; pp. 18–21. [Google Scholar]
- Zhong, W.; Meng, B.; Hao, J. Performance of different stiffness connections against progressive collapse. J. Const. Steel Res. 2017, 135, 162–175. [Google Scholar] [CrossRef]
- Lew, H.S.; Main, J.A.; Robert, S.D.; Sadek, F.; Chiarito, V.P. Performance of Steel Moment Connections under a Column Re-moval Scenario. I: Experiments. J. Struct. Eng. 2013, 139, 98–107. [Google Scholar] [CrossRef] [Green Version]
- Wang, W.; Li, H.; Wang, J. Progressive collapse analysis of concrete-filled steel tubular column to steel beam connections us-ing multi-scale model. In Structures; Elsevier: Amsterdam, The Netherlands, 2017; Volume 9, pp. 123–133. [Google Scholar]
- Özkılıç, Y.O.; Topkaya, C. Extended end-plate connections for replaceable shear links. Eng. Struct. 2021, 240, 112385. [Google Scholar] [CrossRef]
- Alrubaidi, M.; Abbas, H.; Elsanadedy, H.; Almusallam, T.; Iqbal, R.; Al-Salloum, Y. Experimental and FE study on strength-ened steel beam-column joints for progressive collapse robustness under column-loss event. Eng. Struct. 2022, 258, 114103. [Google Scholar] [CrossRef]
- Christopoulos, C.; Filiatrault, A.; Uang, C.M.; Folz, B. Posttensioned energy dissipating connections for moment-resisting steel frames. J. Struct. Eng. 2002, 128, 1111–1120. [Google Scholar] [CrossRef]
- Rojas, P.; Ricles, J.M.; Sause, R. Seismic performance of post-tensioned steel moment resisting frames with friction devices. J. Struct. Eng. 2005, 131, 529–540. [Google Scholar] [CrossRef]
- Chou, C.C.; Chen, J.H.; Chen, Y.C.; Tsai, K.C. Evaluating performance of post-tensioned steel connections with strands and reduced flange plates. Earthq. Eng. Struct. Dyn. 2006, 35, 1167–1185. [Google Scholar] [CrossRef]
- Christopoulos, C.; Filiatrault, A.; Uang, C.M. Self-centering post-tensioned energy dissipating (PTED) steel frames for seismic regions. In Structural Systems Research Project Report No. SSRP2002/06; University of California: Sand Diego, CA, USA, 2022. [Google Scholar]
- Liu, J.L. Preventing progressive collapse through strengthening beam-to-column connection, Part 1: Theoretical analysis. J. Const. Steel Res. 2010, 66, 229–237. [Google Scholar] [CrossRef]
- ANSI/AISC 360-16; Specifications for Structural Steel Buildings. American Institute of Steel Construction: Chicago, IL, USA, 2016.
- Analysis User’s Manual. 6.20. Dassault Systems; Abaqus 6.20; Simulia: Johnston, RI, USA, 2020.
- ASTM A370-05; Standard Test Methods and Definitions for Mechanical Testing of Steel Products. ASTM International: West Conshohocken, PA, USA, 2005.
- EN 1993-1-5; Eurocode 3: Design of Steel Structures—Part 1–5: General Rules—Plated Structural Elements. CEN: Brussels, Belgium, 2006.


| ID of Specimen | Connection Type | Size of Steel Plate (mm) | Side Plates t (mm) | I-Section Column (mm) | I-Section Beam (mm) | Bolt Grade 10.9 |
|---|---|---|---|---|---|---|
| J-S-C | Simple (Shear) | shear steel plate 120 × 100 × 6 | - | H × B × tf × tw 200 × 200 × 12 × 8 | H × B × tf × tw 194 × 150 × 9 × 6 | D16 (mm) |
| J-M-C | IMF | shear steel plate 120 × 100 × 6 | - | 200 × 200 × 12 × 8 | 194 × 150 × 9 × 6 | D 20 (mm) |
| J-S-S-EX | Strengthened specimen | - | 6 | 200 × 200 × 12 × 8 | 194 × 150 × 9 × 6 | D16 (mm) |
| ID Specimen | Type of Results | Flexural Phase | Catenary-Action Phase | Progressive Collapse Resistance Pu (kN) | Displacement at Ultimate State Δu (mm) | Energy Dissipated at Ultimate State Eu (kN.m) | Beam Rotation at Maximum Load θ (degree) | Failure Mode | ||||||
|---|---|---|---|---|---|---|---|---|---|---|---|---|---|---|
| Yield Load-Py (kN) | Displacement Δy (mm) | Peak Load of Flexural Pu, FA (kN) | Displacement of Flexural Δu,c-FA (mm) | Peak Load of Catenary Action Pu, CA (kN) | Pu, CA/Pu, FA | Displacement of Catenary Action Δu,c-CA (mm) | Peak Beam Axial force Nu, CA (kN) | |||||||
| J-S-C | EXP | - | - | 9 | 92 | 72.6 | 8.07 | 375 | 172 | 72.6 | 386 | 12.5 | 11.9 | Fracture of tab plate |
| FE | - | - | 9 | 92 | 71.5 | 7.94 | 383 | 172 | 71.5 | 383 | 12.7 | 11.8 | ||
| EXP/FE | - | - | 1.00 | 1.00 | 1.02 | 1.02 | 0.98 | 1.00 | 1.02 | 1.01 | 0.98 | 1.01 | ||
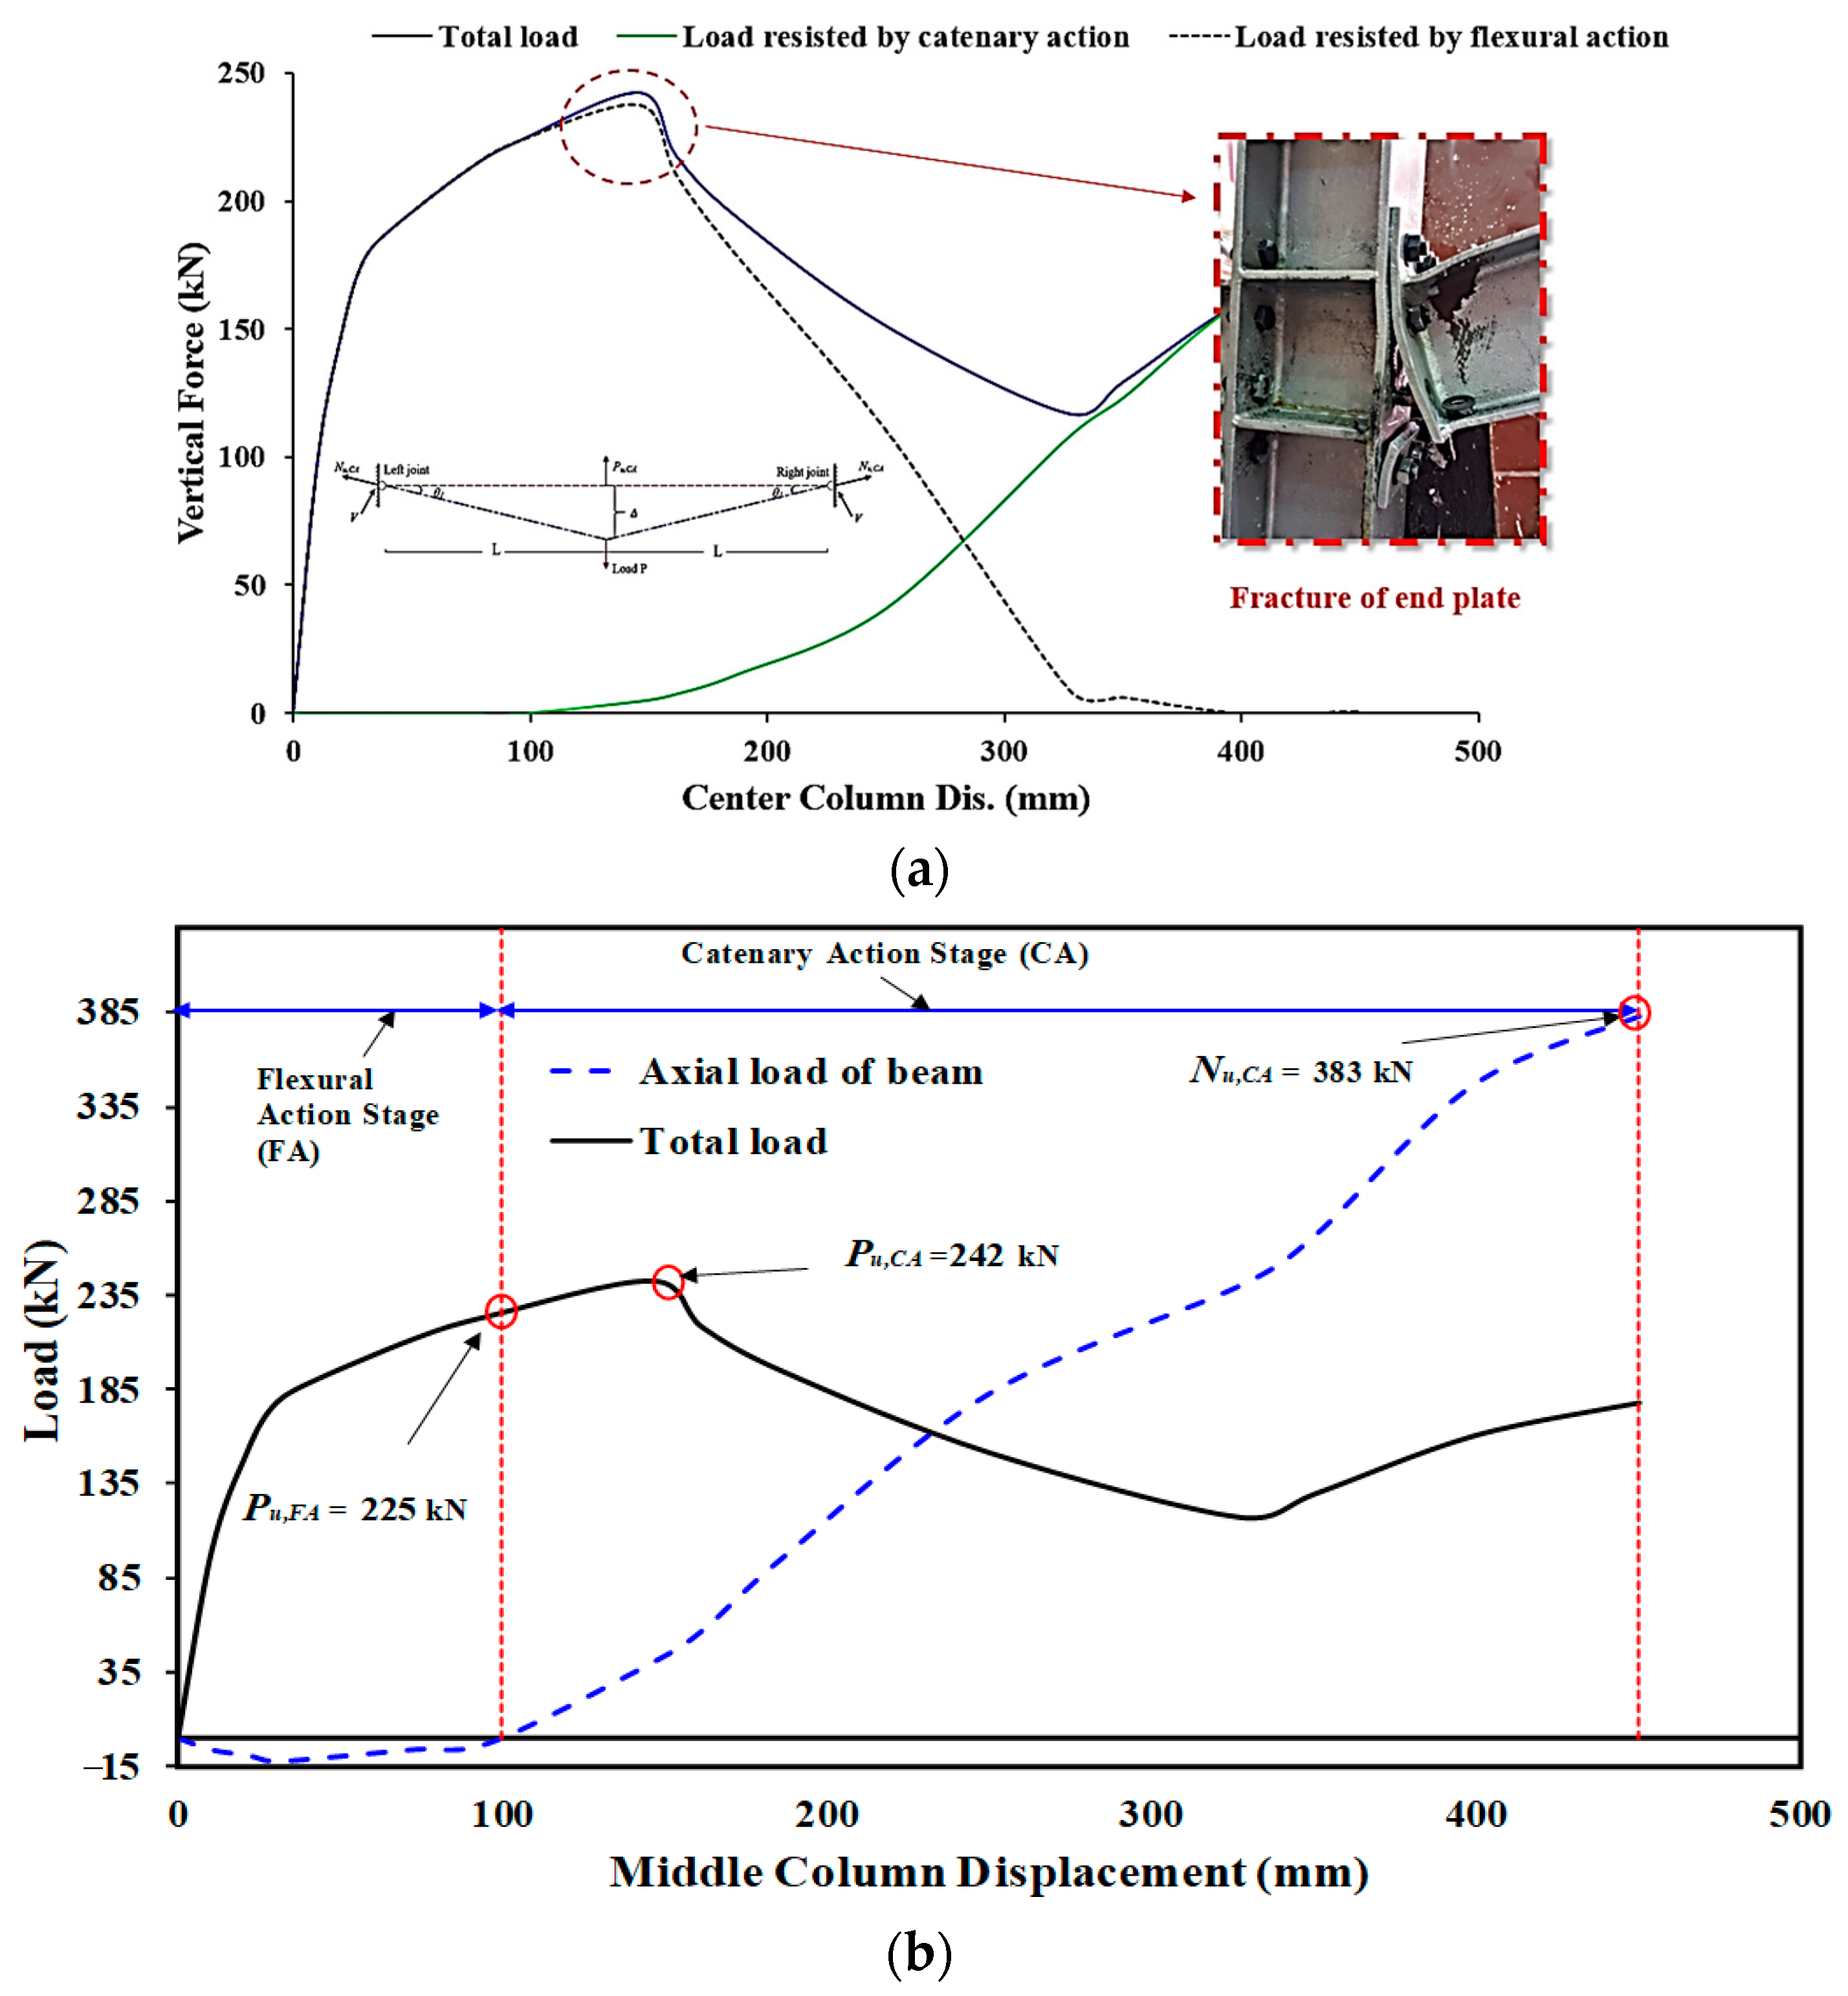
| J-M-C | EXP | 138 | 20 | 225 | 100 | 242 | 1.08 | 146 | 383 | 242 | 187 | 78.0 | 3.9 | Fracture of end plate |
| FE | 138 | 20 | 223 | 100 | 240 | 1.08 | 139 | 373 | 240 | 173 | 73.5 | 3.7 | ||
| EXP/FE | 1.00 | 1.00 | 1.01 | 1.00 | 1.01 | 1.00 | 1.05 | 1.03 | 1.01 | 1.08 | 1.06 | 1.05 | ||
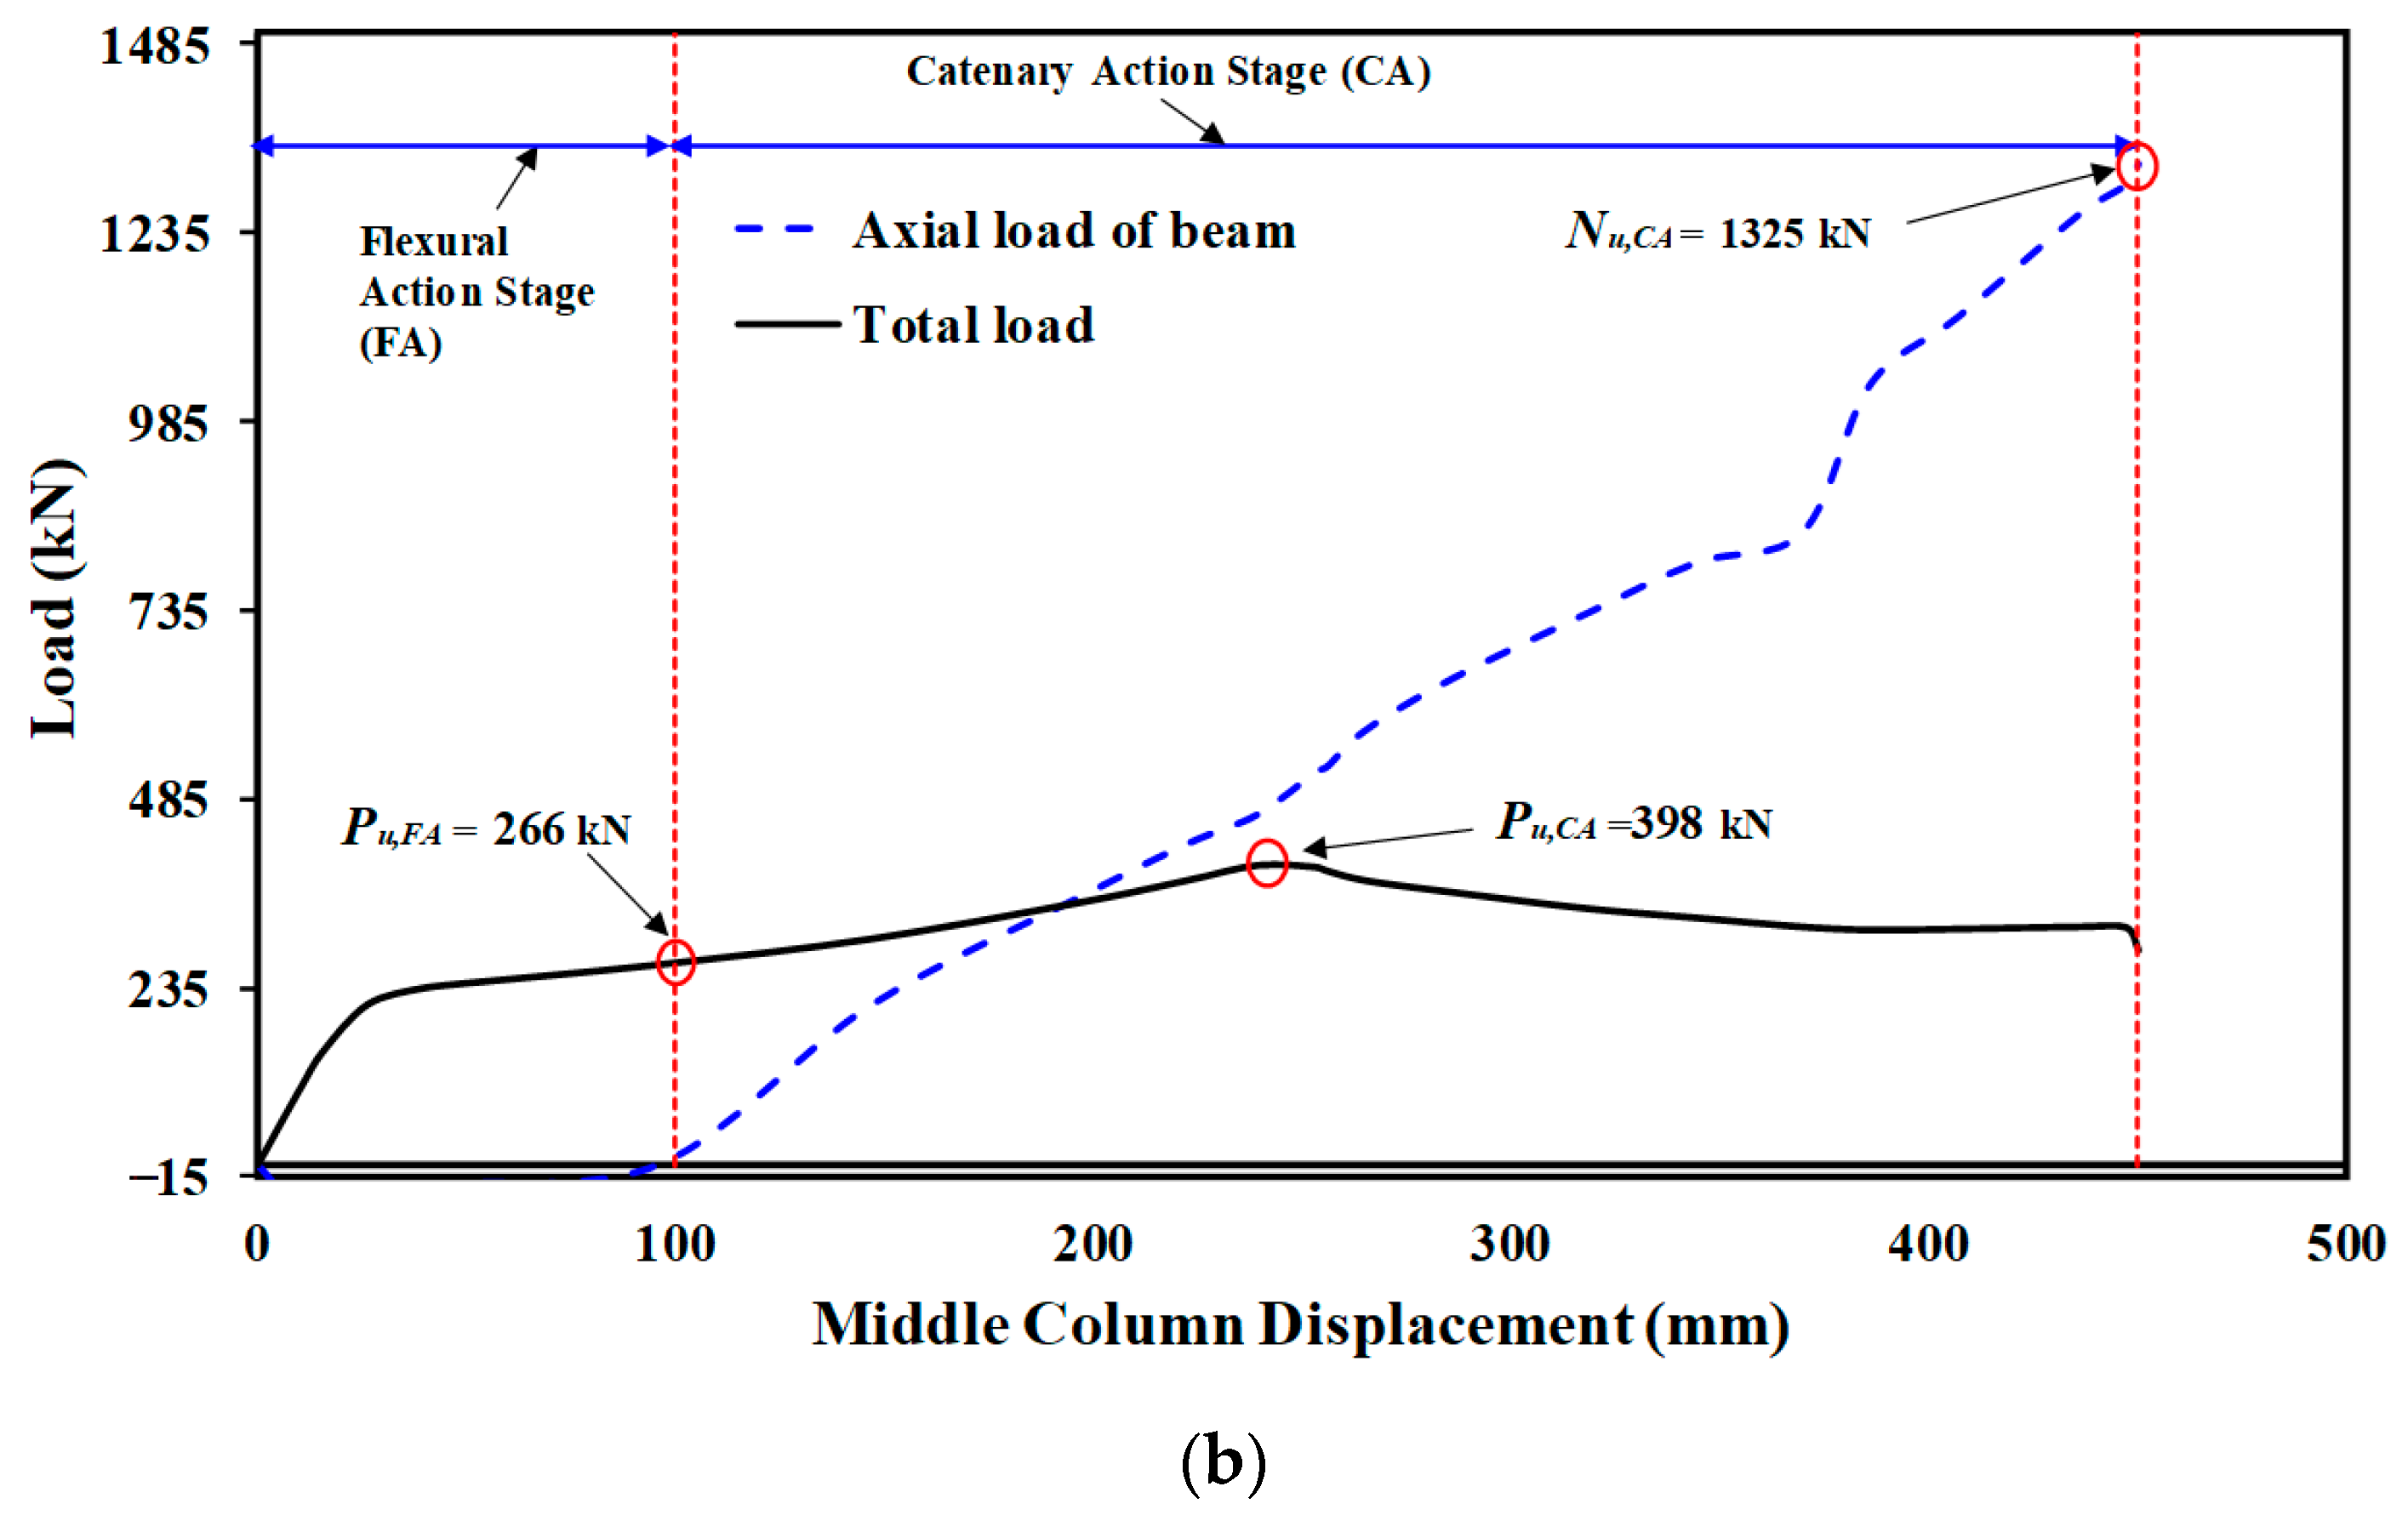
| J-S-S-EX | EXP | 213 | 26 | 266 | 97 | 398 | 1.5 | 240 | 1325 | 398 | 450 | 138 | 8.0 | Fracture of double side plate |
| FE | 218 | 25 | 275 | 100 | 401 | 1.46 | 242 | 1335 | 401 | 450 | 139 | 8.1 | ||
| EXP/FE | 0.98 | 1.04 | 0.97 | 0.97 | 0.99 | 1.03 | 0.99 | 0.99 | 0.99 | 1.00 | 0.99 | 0.99 | ||
| Components | Elastic Modulus E (GPa) | Yield Strength fy (MPa) | Tensile Strength fu (MPa) | Elongation at Max. Stress δms (%) | Elongation at Fracture δf (%) | Fracture True Strain |
|---|---|---|---|---|---|---|
| Column steel-flange | 204 | 294 | 467 | 17 | 21 | 0.55 |
| Beam steel-flange | 193 | 330 | 470 | 16 | 22 | 0.60 |
| Column steel-web | 211 | 303 | 463 | 15 | 21 | 0.56 |
| Beam steel-web | 195 | 361 | 470 | 16 | 18 | 0.61 |
| End steel-plat | 193 | 281 | 432 | 13 | 19 | 0.60 |
| Shear steel-plate | 193 | 282 | 355 | 15 | 22 | 0.60 |
| Side steel-plate | 195 | 219 | 347 | 16 | 27 | 0.62 |
| Bolt class 10.9 | 211 | 958 | 1070 | - | 10.2 | 0.21 |
| Specimen ID | Parametric Study for J-S-S-EX | Details | ||
|---|---|---|---|---|
| tp (mm) | Grade | Beam Flange-Stiffening Plates Welded to Flanges of Column | ||
| Grade of side steel plate material (A36 (Fy = 220 MPa) | All specimens (parametric study) in this Table are same as J-S-S-EX but with changing in:
| |||
| S-1-1-A36 | 8 | A36 | YES | |
| S-1-2-A36 | 10 | A36 | NO | |
| S-1-3-A36 | 10 | A36 | YES | |
| S-1-4-A36 | 12 | A36 | NO | |
| S-1-5-A36 | 12 | A36 | YES | |
| S-1-6- A36 | 15 | A36 | NO | |
| S-1-7- A36 | 15 | A36 | YES | |
| Grade of side steel plate material (A572 (Fy = 408 MPa) | ||||
| S-1-1-A572 | 6 | A572 | NO | |
| S-1-2-A572 | 6 | A572 | YES | |
| S-1-3-A572 | 8 | A572 | NO | |
| S-1-4-A572 | 8 | A572 | YES | |
| S-1-5-A572 | 10 | A572 | NO | |
| S-1-6-A572 | 10 | A572 | YES | |
| S-1-7-A572 | 12 | A572 | NO | |
| S-1-8-A572 | 12 | A572 | YES | |
| S-1-9-A572 | 15 | A572 | NO | |
| S-1-10-A572 | 15 | A572 | YES | |
| Specimen ID (Plate Thickness) | Materials | Load of Flexural Action Stage (kN) | Load at Ultimate State (kN) | Mode of Failure |
|---|---|---|---|---|
| 6 mm-welded | A572 | 400 | 605 | Fracture of side plates |
| A36 | - | - | Fracture of side plates | |
| (A572/A36) | - | - | - | |
| 8 mm-welded | A572 | 426 | 648 | Beam failure |
| A36 | 414 | 431 | Fractures in the side plates | |
| (A572/A36) | 1.03 | 1.50 | - | |
| 10 mm-welded | A572 | 444 | 742 | Beam failure |
| A36 | 426 | 557 | Fractures in the side plates | |
| (A572/A36) | 1.04 | 1.33 | - | |
| 12 mm-welded | A572 | 447 | 784 | Beam failure |
| A36 | 448 | 699 | Fractures in the side plates | |
| (A572/A36) | 1.00 | 1.12 | - | |
| 15 mm-welded | A572 | 457 | 787 | Fracture of beam |
| A36 | 465 | 787 | Fracture of beam | |
| (A572/A36) | 0.98 | 1.00 | - |
| Specimen ID (Plate Thickness) | Materials | Load of Flexural Action Stage (kN) | Load at Ultimate State (kN) | Mode of Failure |
|---|---|---|---|---|
| 6 mm-not welded | A572 | 301 | 387 | Fracture of side plates |
| A36 | - | - | Fracture of side plates | |
| (A572/A36) | - | - | - | |
| 8 mm-not welded | A572 | 338 | 648 | Fracture of side plates |
| A36 | 349 | 400 | Fracture of side plates | |
| (A572/A36) | 0.97 | 1.62 | - | |
| 10 mm-not welded | A572 | 368 | 727 | Beam failure |
| A36 | 357 | 557 | Fractures in the side plates | |
| (A572/A36) | 1.03 | 1.33 | - | |
| 12 mm-not welded | A572 | 391 | 783 | Beam failure |
| A36 | 372 | 702 | Fractures in the side plates | |
| (A572/A36) | 1.05 | 1.11 | - | |
| 15 mm-not welded | A572 | 416 | 784 | Fracture of beam |
| A36 | 397 | 787 | Fracture of beam | |
| A572/A36 | 1.05 | 1.00 | - |
| Specimen ID | Welded | Load of Flexural Action Stage (kN) | Load at Ultimate State (kN) | Mode of Failure |
|---|---|---|---|---|
| Grade of side steel plate material (A36 (Fy = 220 MPa) | ||||
| A36-8 mm | Yes | 414 | 431 | Fracture of side plates |
| No | 349 | 400 | Fracture of side plates | |
| Yes/No | 1.18 | 1.07 | - | |
| A36-10 mm | Yes | 426 | 557 | Fracture of side plates |
| No | 357 | 557 | Fracture of side plates | |
| Yes/No | 1.19 | 1.00 | - | |
| A36-12 mm | Yes | 448 | 699 | Fracture of side plates |
| No | 372 | 702 | Fracture of side plates | |
| Yes/No | 1.20 | 0.99 | - | |
| A36-15 mm | Yes | 465 | 787 | Fracture of beam |
| No | 397 | 787 | Fracture of beam | |
| Yes/No | 1.17 | 1.00 | - | |
| Grade of side steel plate material (A572 (Fy = 408 MPa) | ||||
| A572-6 mm | Yes | 400 | 605 | Fracture of side plates |
| No | 301 | 387 | Fracture of side plates | |
| Yes/No | 1.33 | 1.56 | - | |
| A572-8 mm | Yes | 426 | 648 | Fracture of beam |
| No | 338 | 648 | Fracture of side plates | |
| Yes/No | 1.26 | 1.00 | - | |
| A572-10 mm | Yes | 444 | 742 | Fracture of beam |
| No | 368 | 727 | Fracture of beam | |
| Yes/No | 1.21 | 1.02 | - | |
| A572-12 mm | Yes | 447 | 784 | Fracture of beam |
| No | 391 | 783 | Fracture of beam | |
| Yes/No | 1.14 | 1.00 | - | |
| A572-15 mm | Yes | 457 | 787 | Fracture of beam |
| No | 416 | 784 | Fracture of beam | |
| Yes/No | 1.1 | 1.00 | - | |
| Parametric Study | Average Increase in the Peak Load | Mode of Failure |
|---|---|---|
| Plate thickness | From 6 mm to 15 mm is about 22% | Shifting the failure from connection to beam |
| Steel grade (A36 & A572) | From A36 to A572 is about 30% | Fracture of double side plate (A36) Shifting the failure from connection to beam (A572) |
| Weld the beam flange-stiffening plates | From not welded to welded is about 25% | Fracture of double side plate (not welded) Shifting the failure from connection to beam (welded) |
Publisher’s Note: MDPI stays neutral with regard to jurisdictional claims in published maps and institutional affiliations. |
© 2022 by the authors. Licensee MDPI, Basel, Switzerland. This article is an open access article distributed under the terms and conditions of the Creative Commons Attribution (CC BY) license (https://creativecommons.org/licenses/by/4.0/).
Share and Cite
Alrubaidi, M.; Alhammadi, S.A. Numerical Investigation on Progressive Collapse Mitigation of Steel Beam–Column Joint Using Steel Plates. Materials 2022, 15, 7628. https://doi.org/10.3390/ma15217628
Alrubaidi M, Alhammadi SA. Numerical Investigation on Progressive Collapse Mitigation of Steel Beam–Column Joint Using Steel Plates. Materials. 2022; 15(21):7628. https://doi.org/10.3390/ma15217628
Chicago/Turabian StyleAlrubaidi, Mohammed, and S. A. Alhammadi. 2022. "Numerical Investigation on Progressive Collapse Mitigation of Steel Beam–Column Joint Using Steel Plates" Materials 15, no. 21: 7628. https://doi.org/10.3390/ma15217628