
Kinetics of Magnesiothermic Reduction of Natural Quartz

Abstract
:1. Introduction
2. Materials and Methods

| Elements | Al | Fe | K | Mg | Na | Ca | Ti | Mn | P | SiO2 |
|---|---|---|---|---|---|---|---|---|---|---|
| amount (ppm) | 106 | 20 | 23 | 9 | 10 | 3 | 4.2 | 0.3 | <2.6 | balance |
3. Results
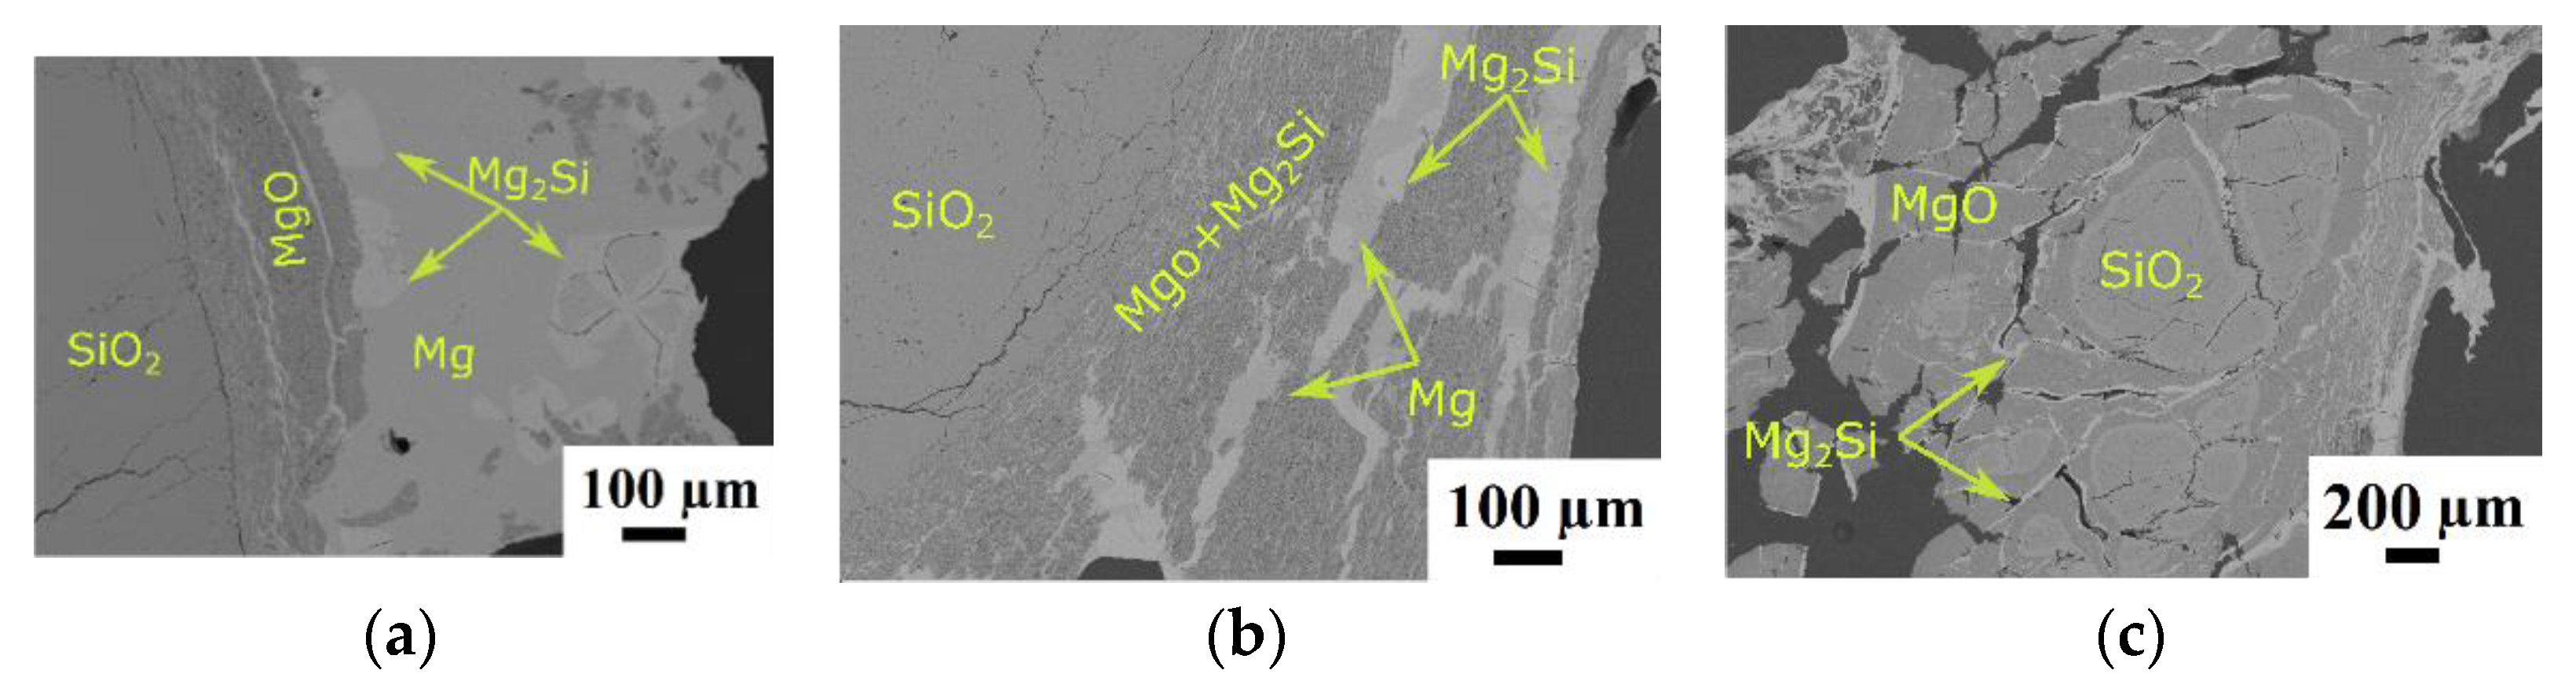
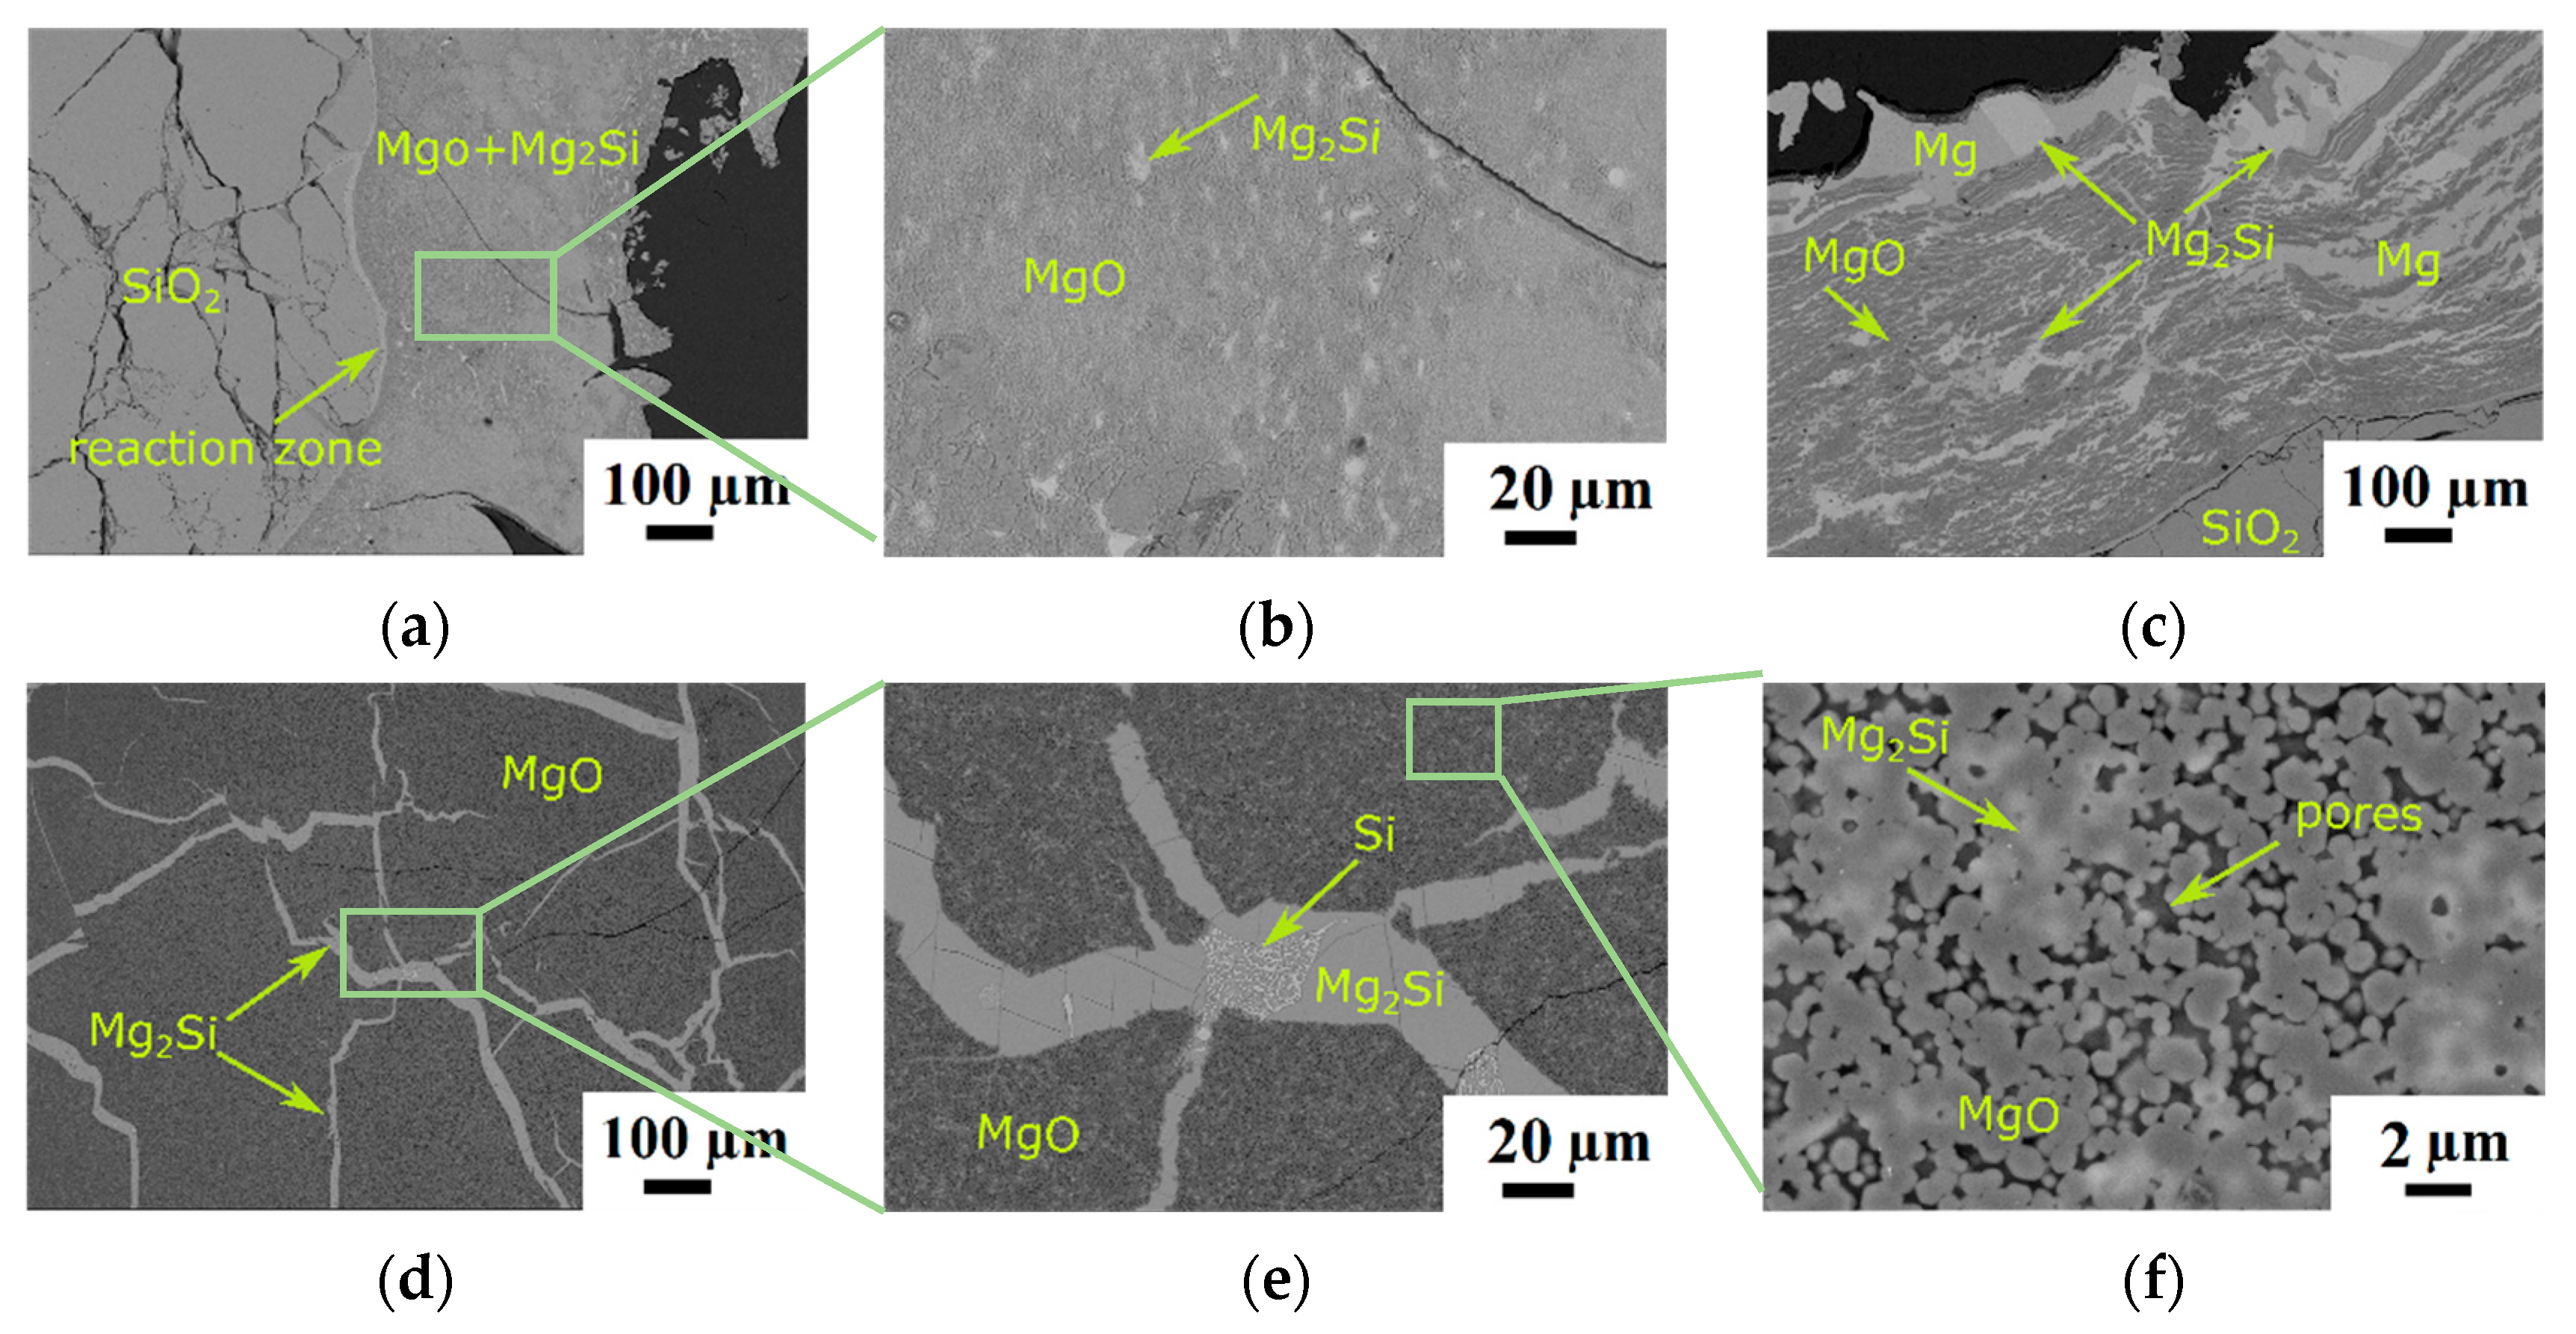
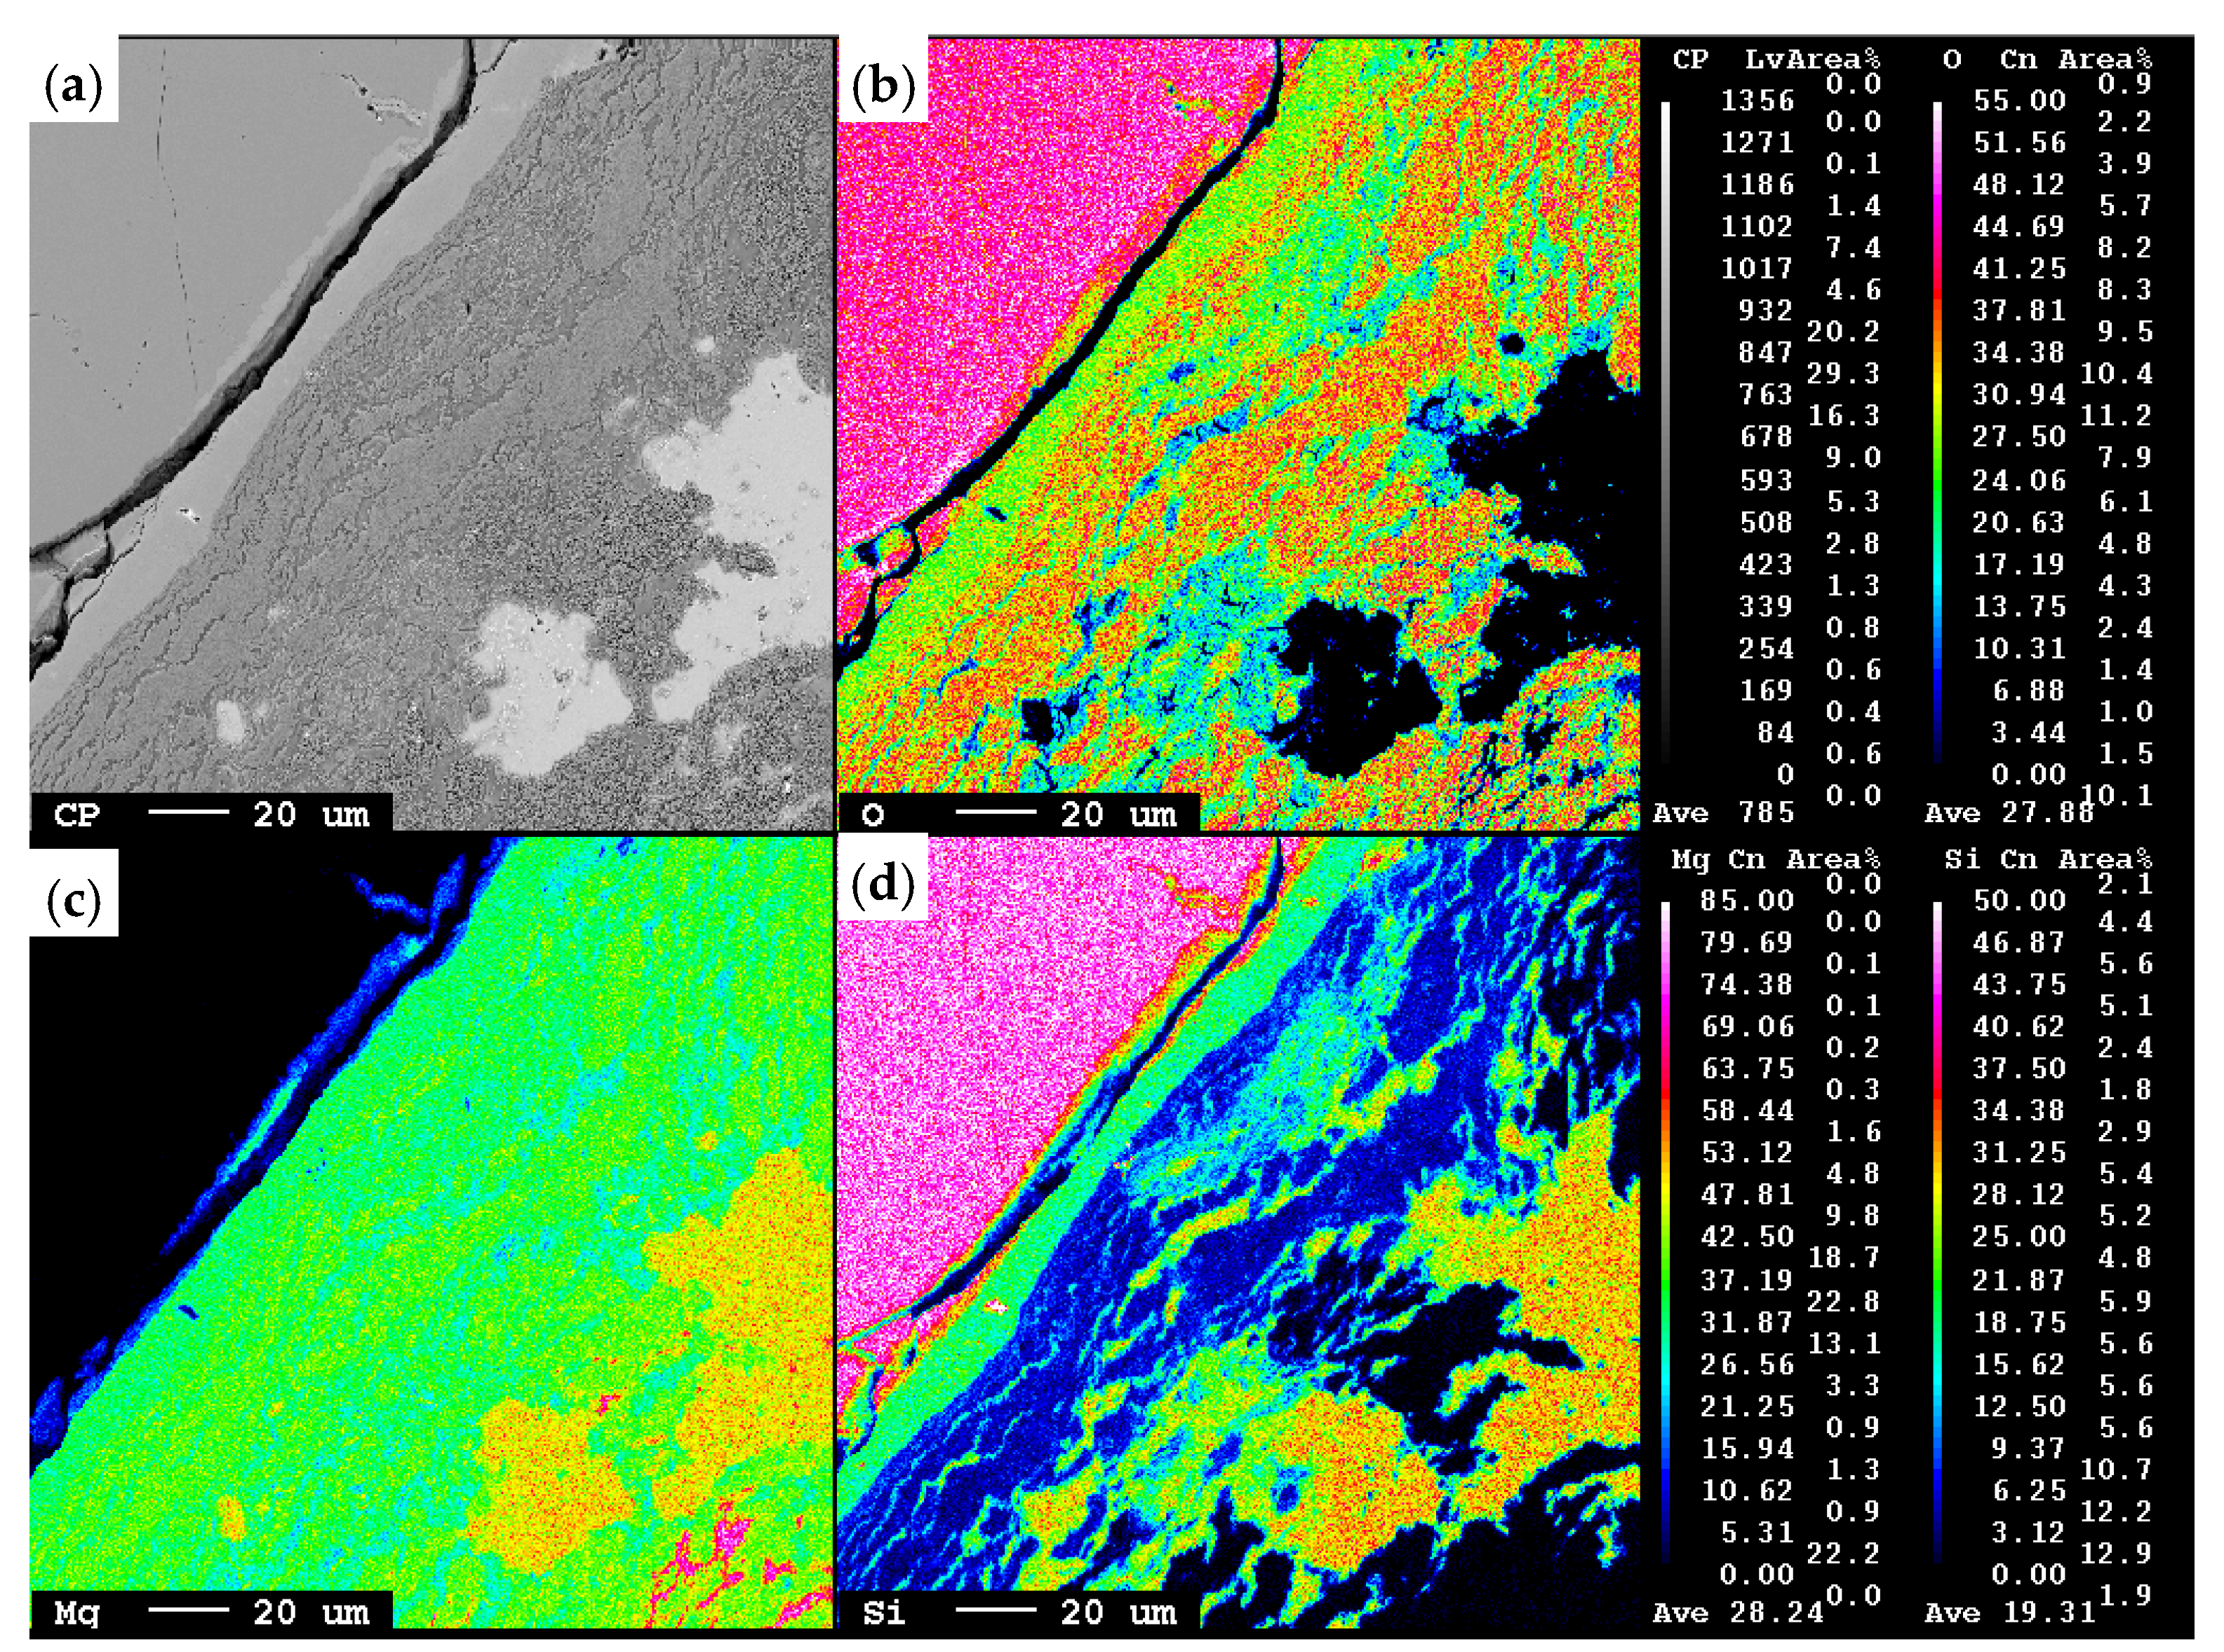
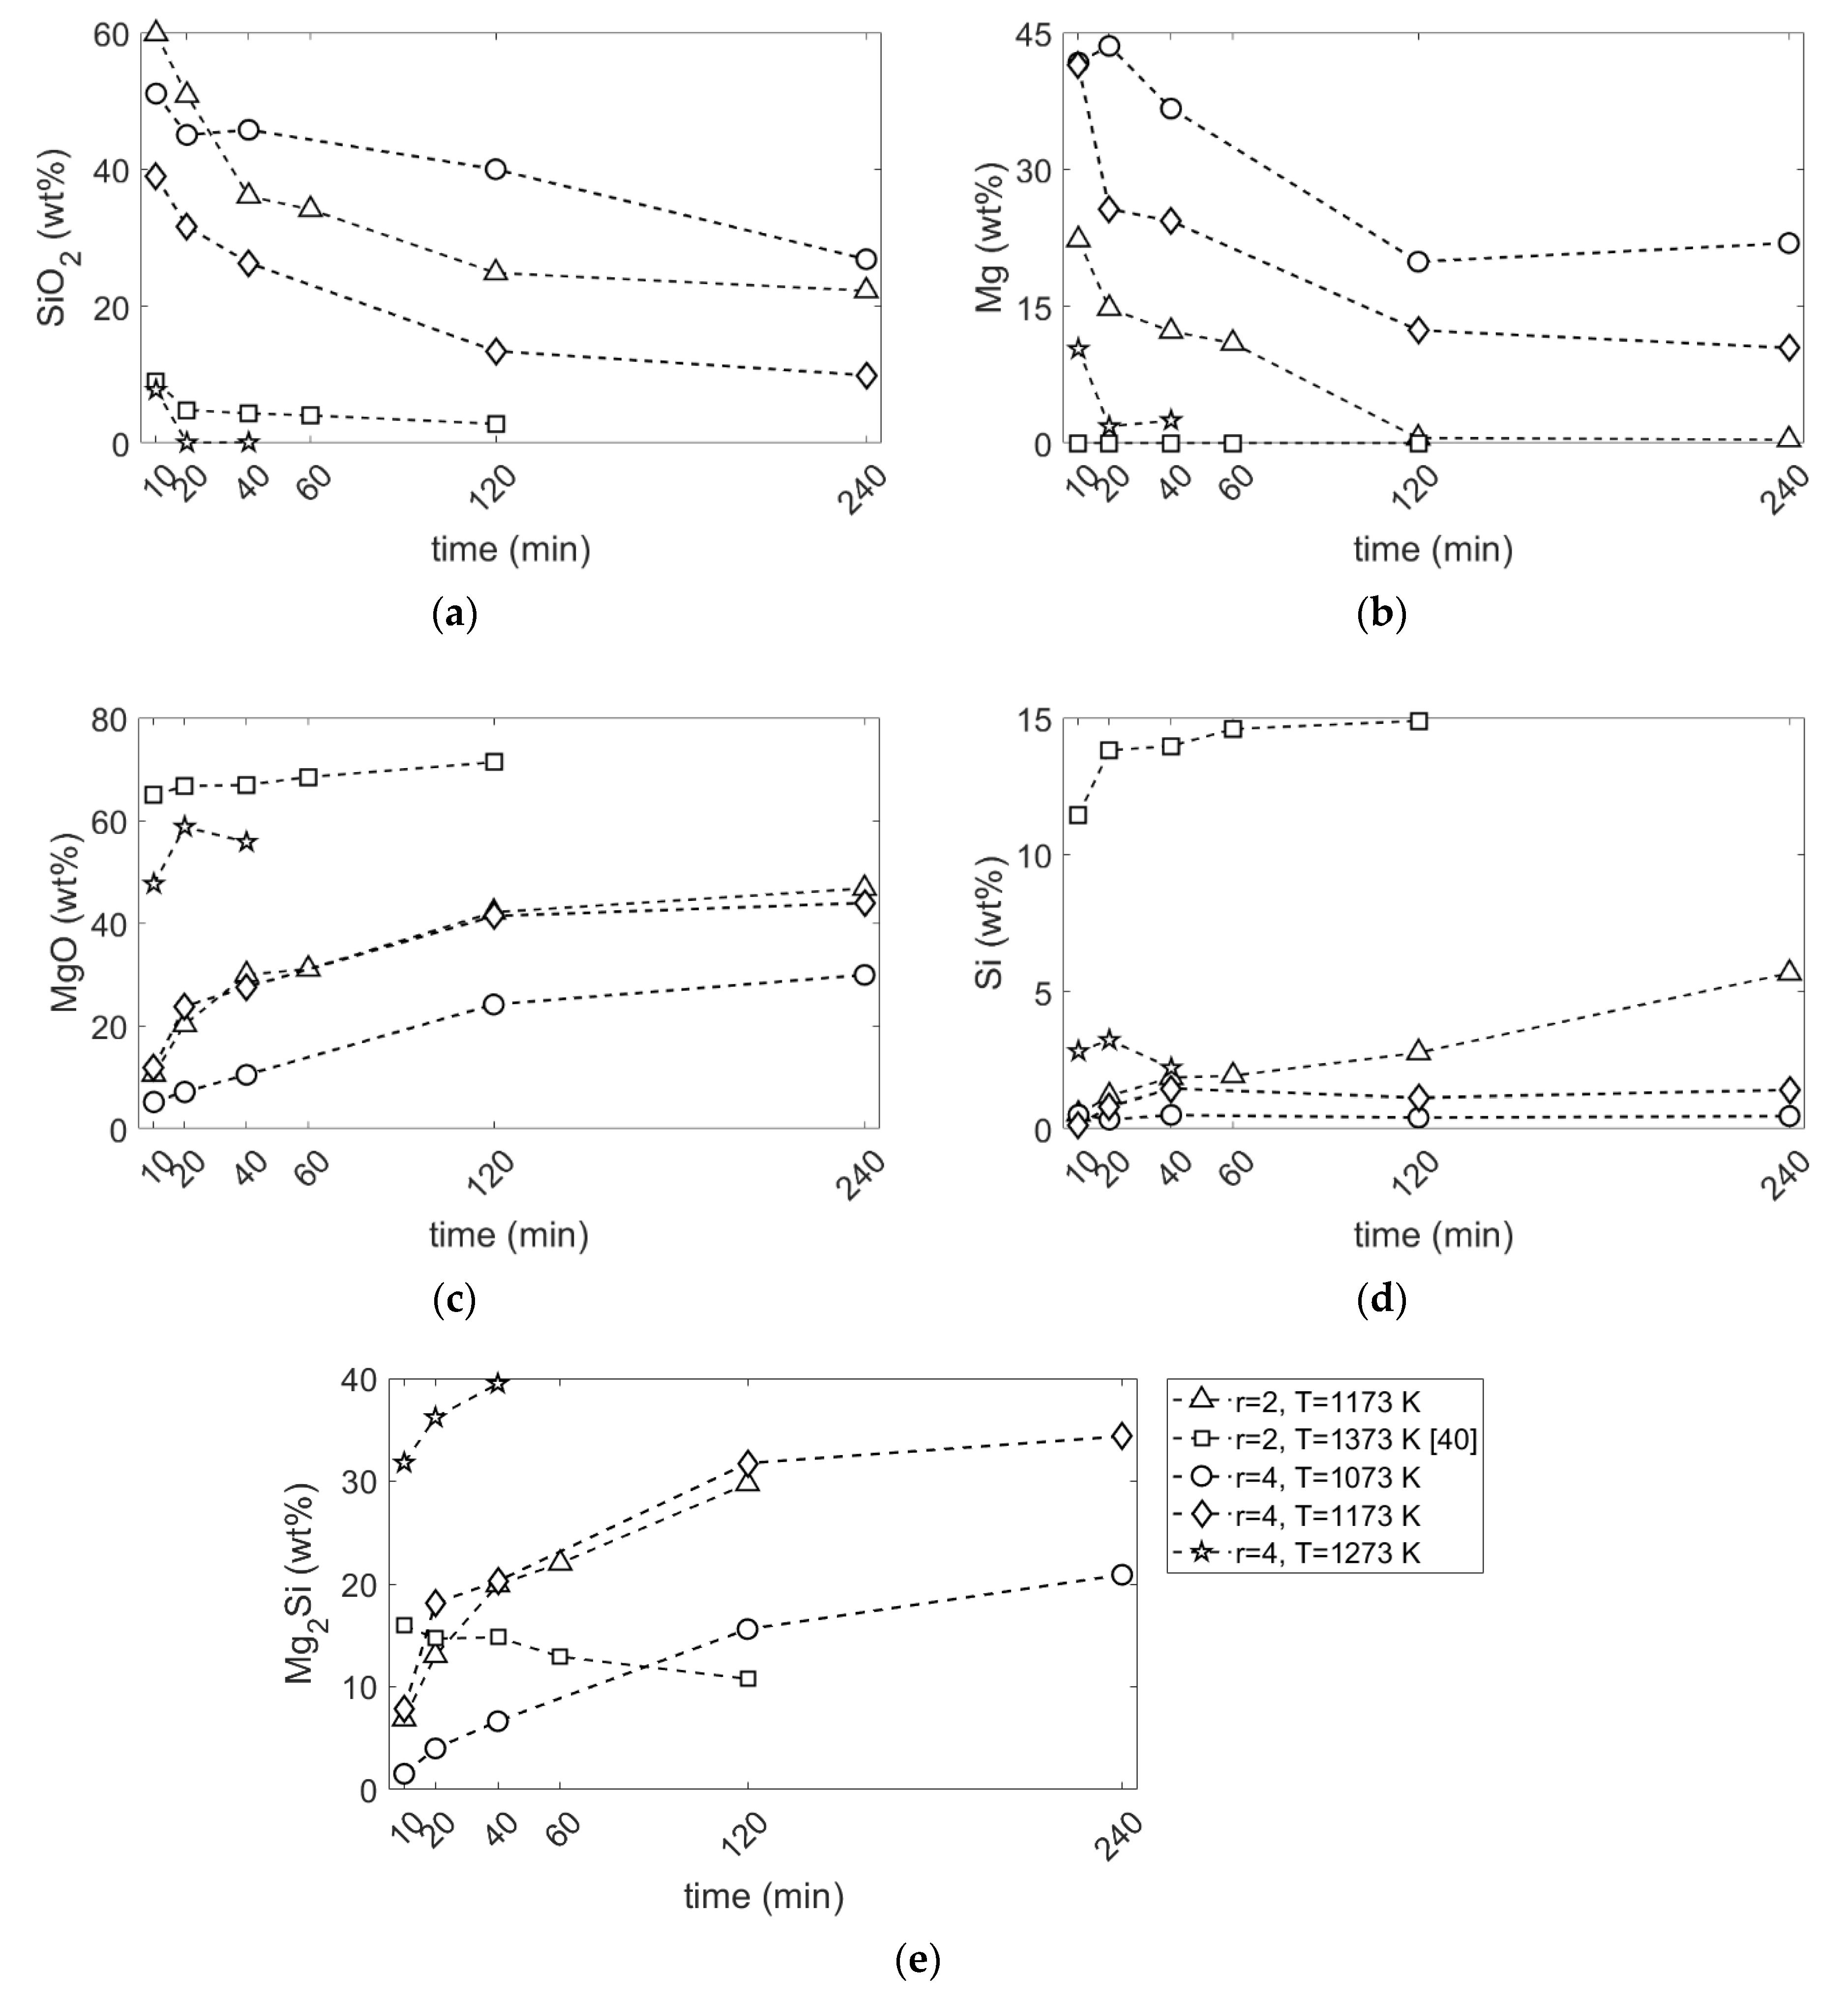
3.1. Distribution of Phases
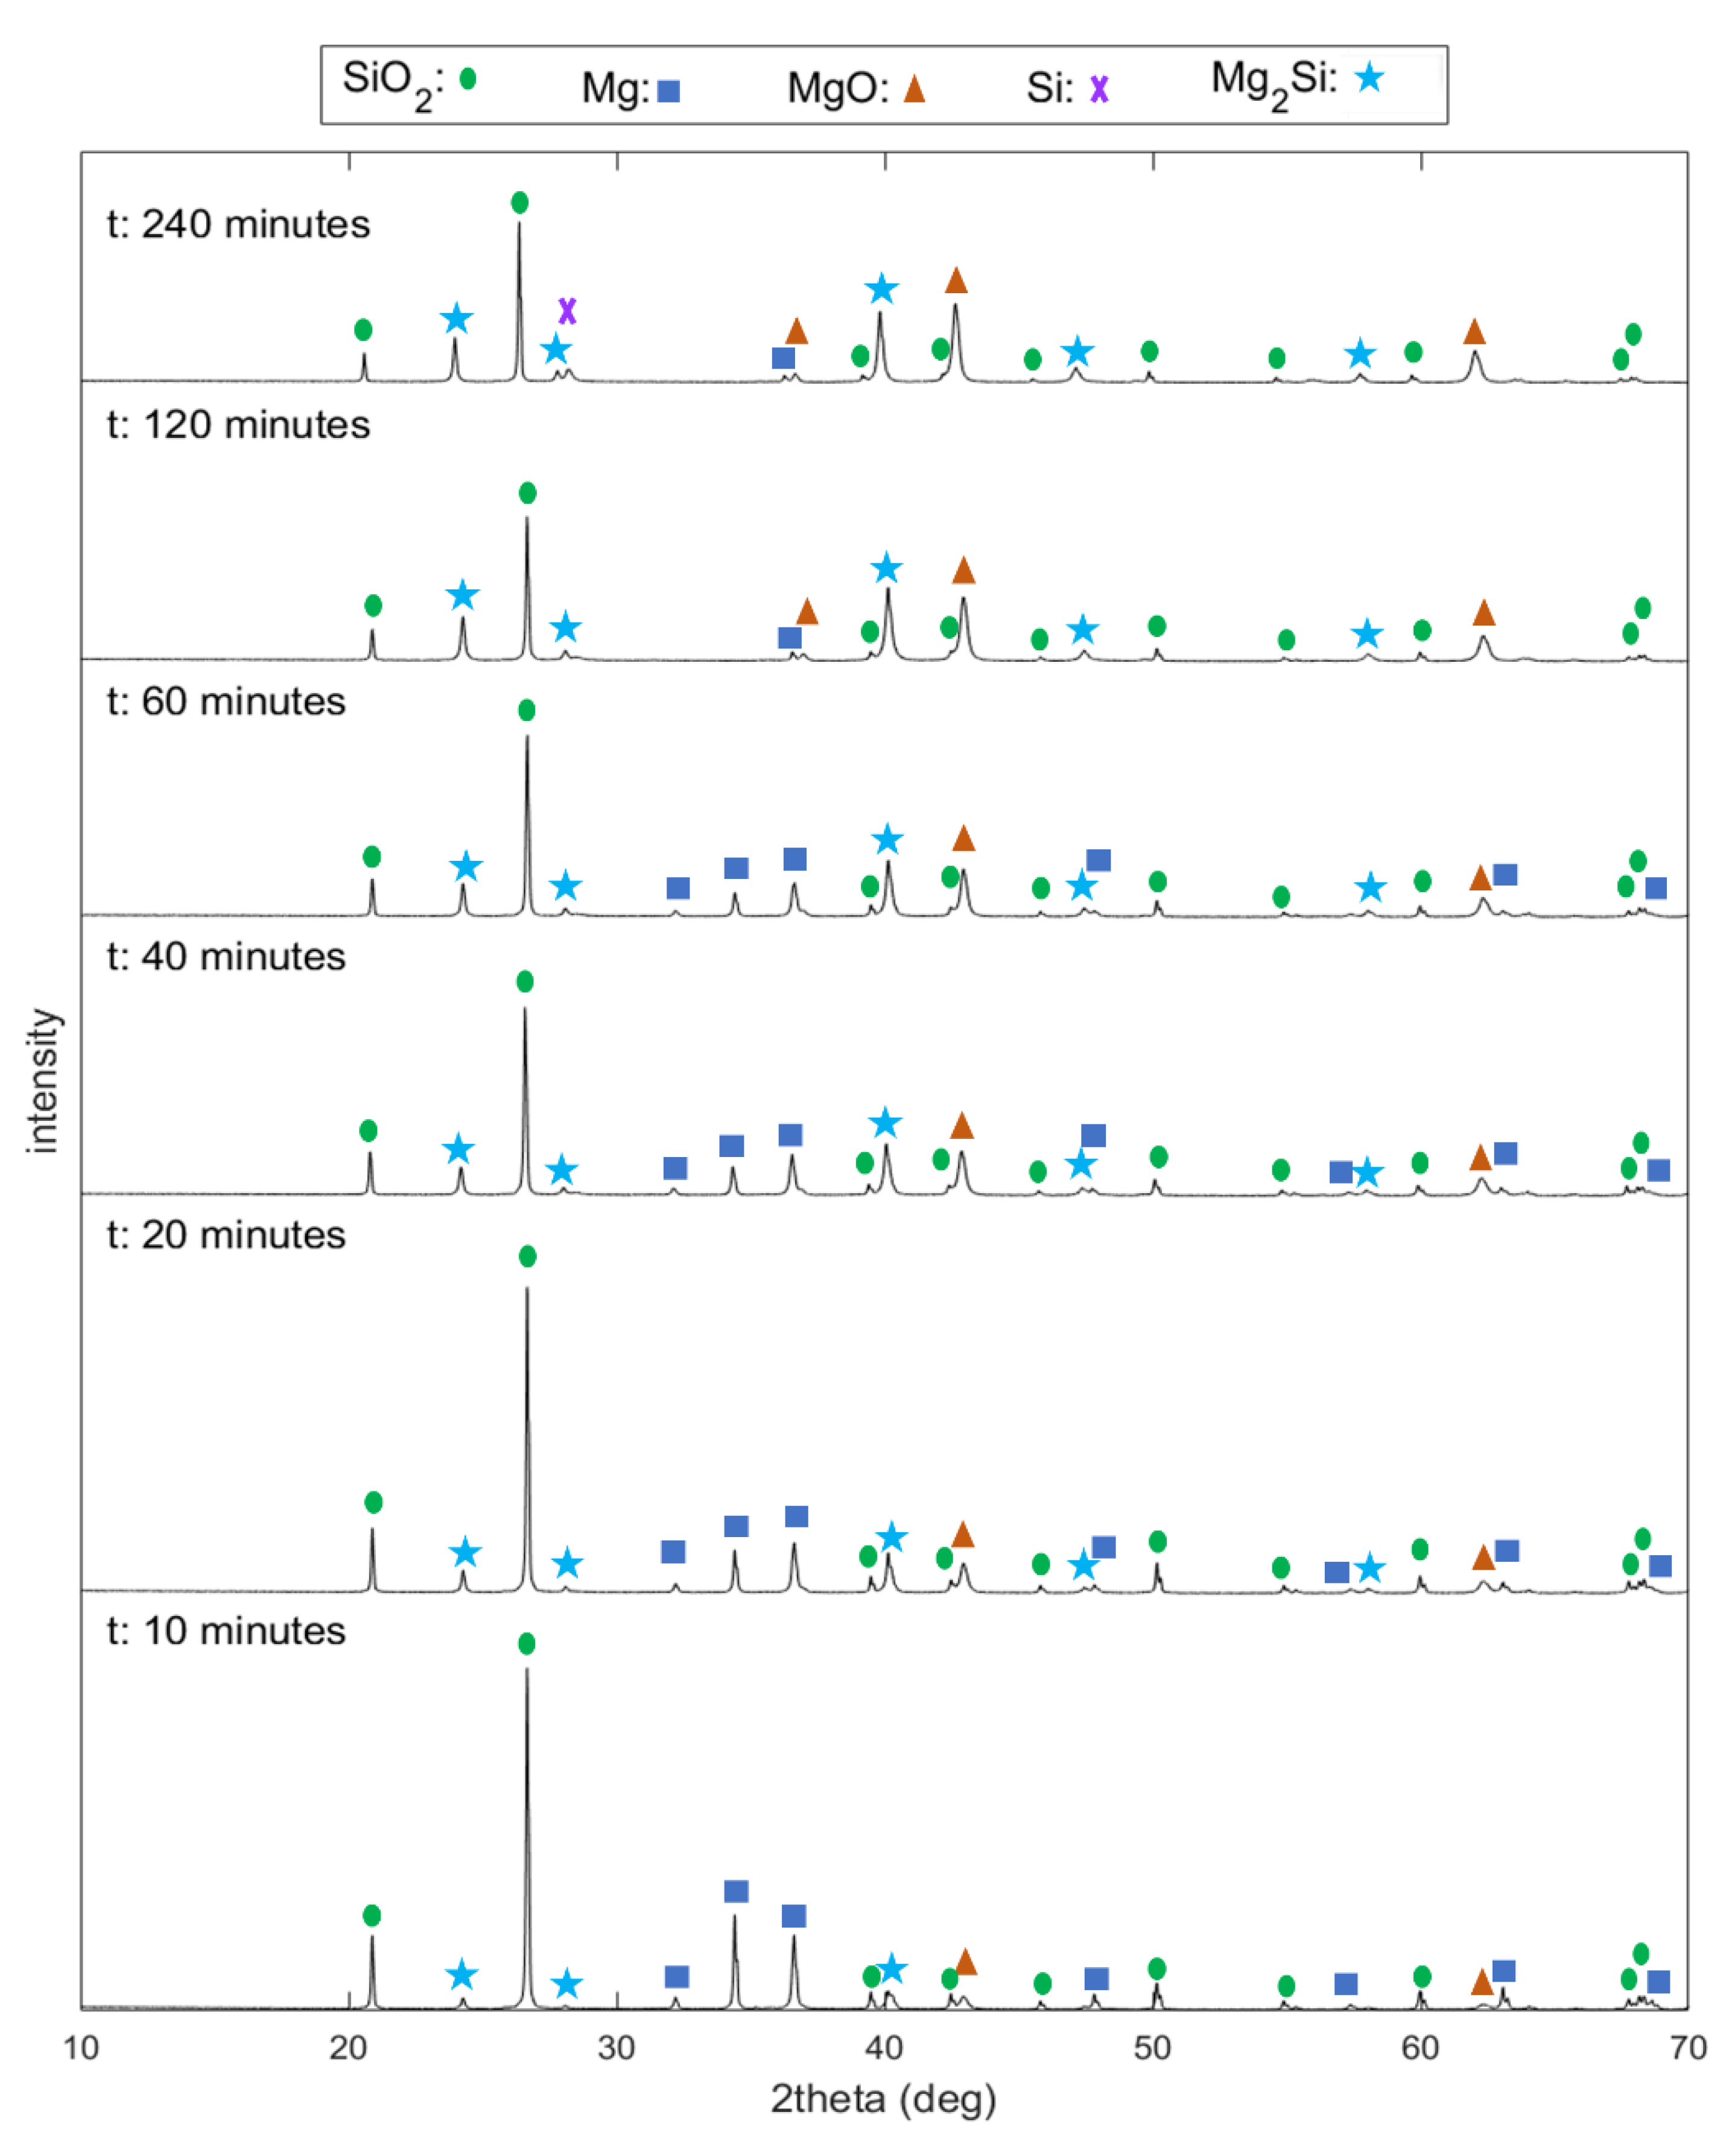
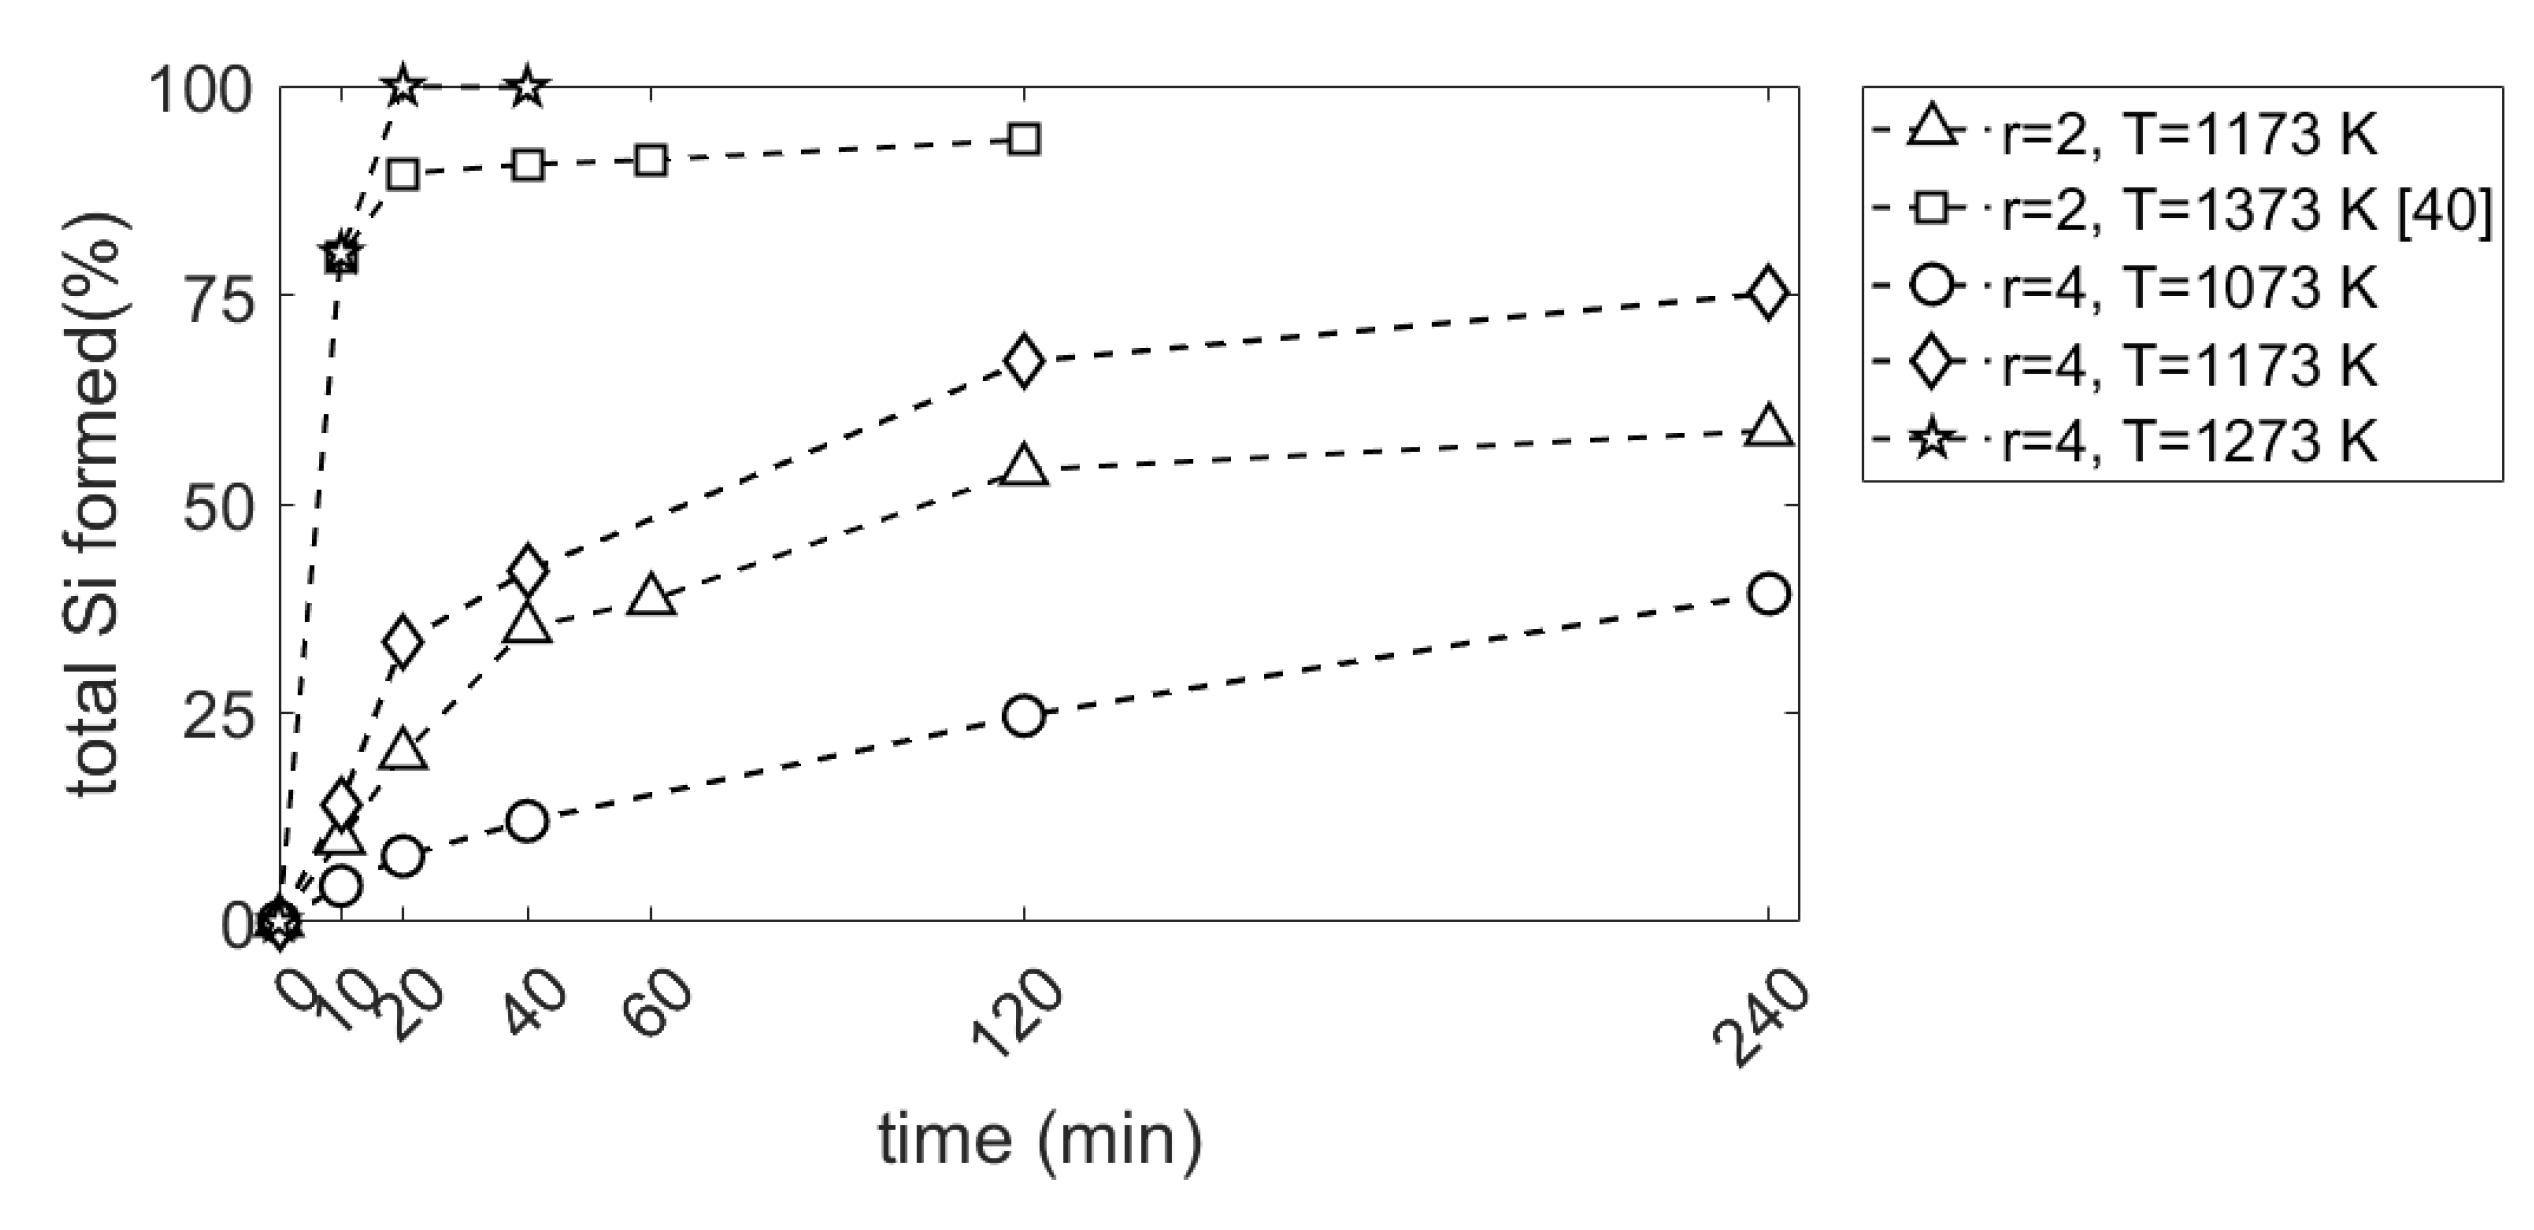
3.2. Rate of Reduction Reaction
3.2.1. Effect of Mg/SiO2 Mole Ratio
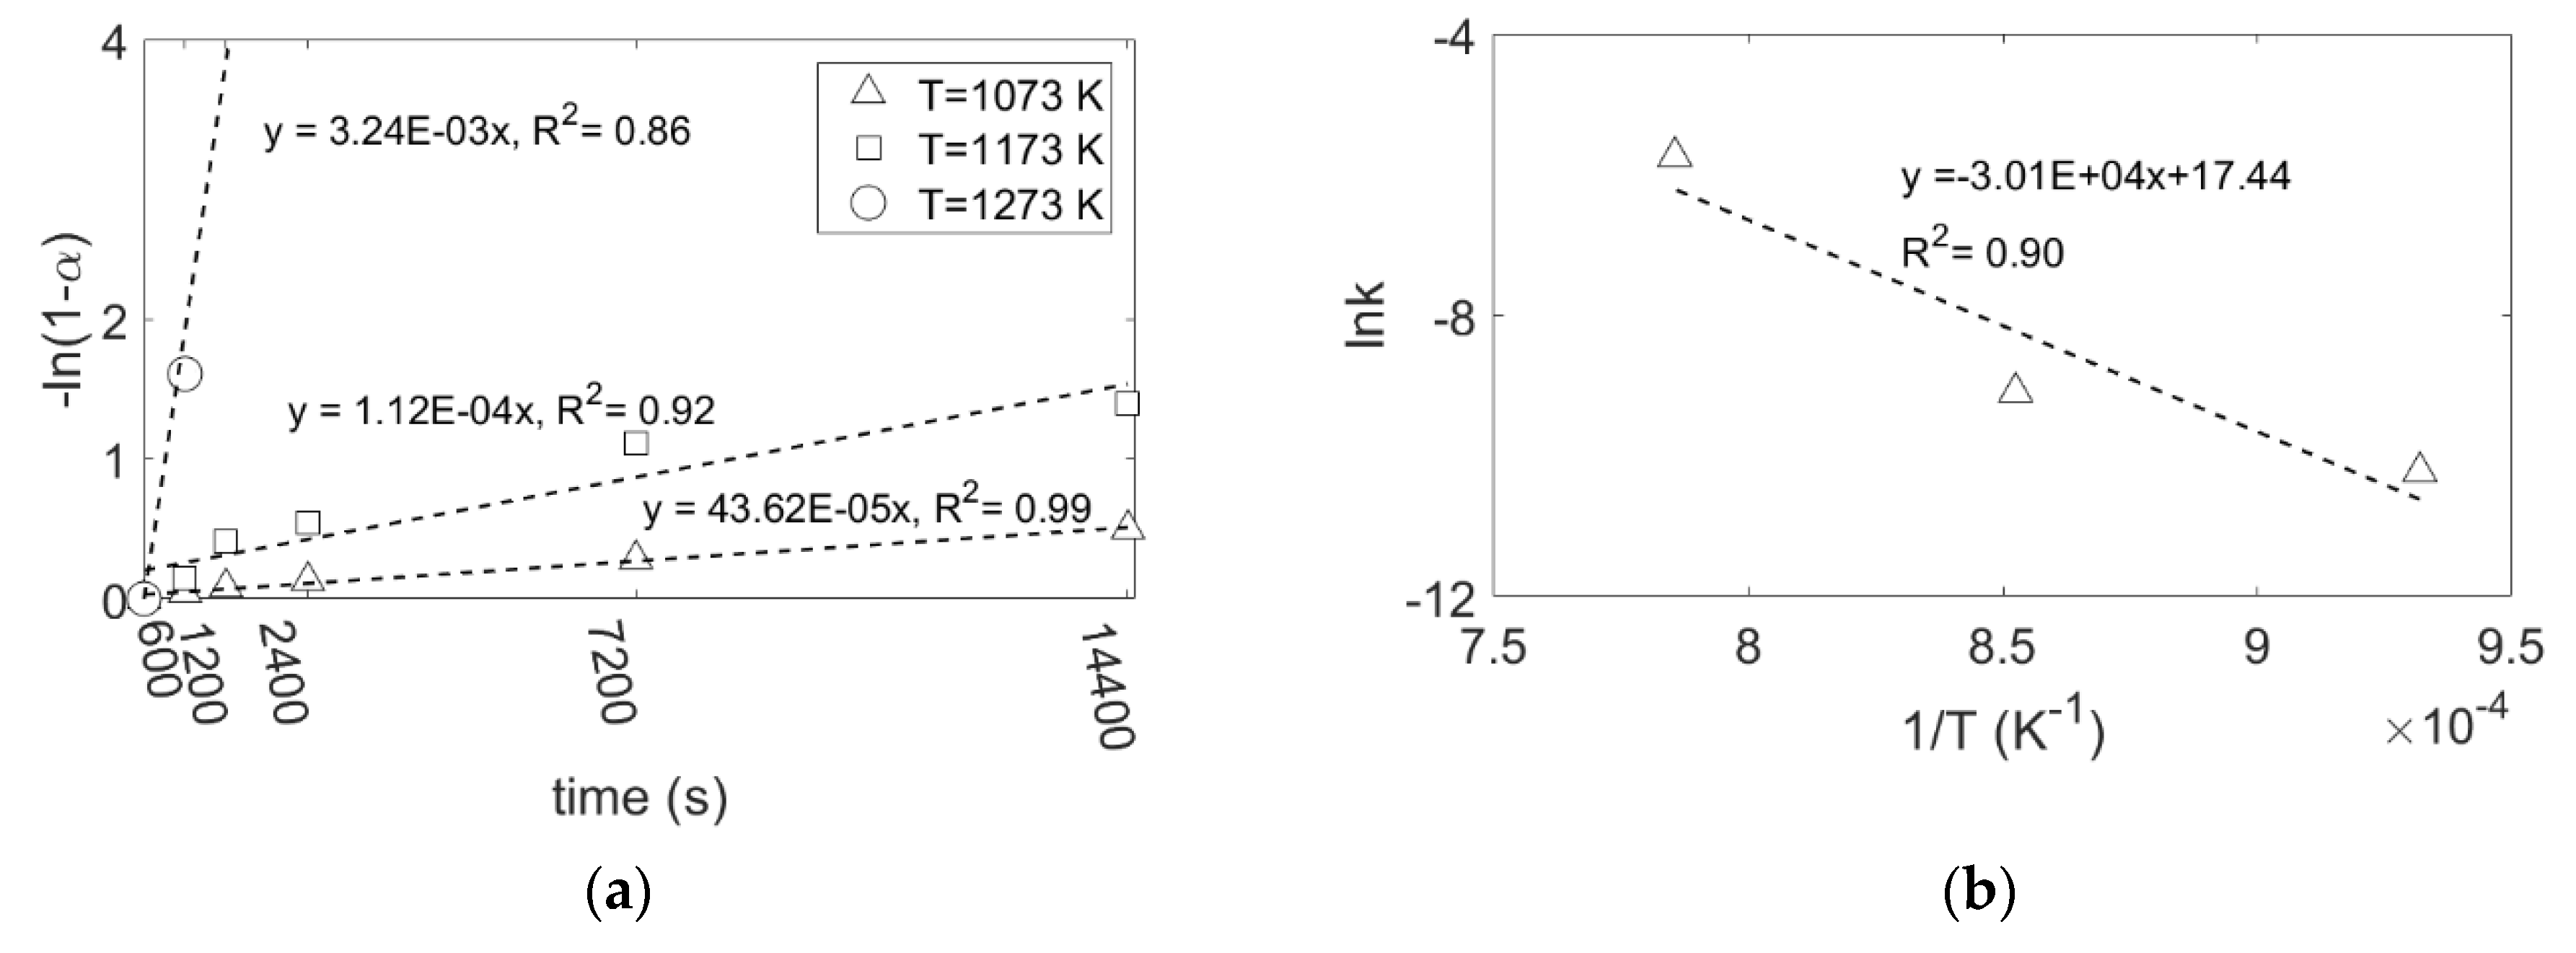
3.2.2. Effect of Temperature
4. Discussion
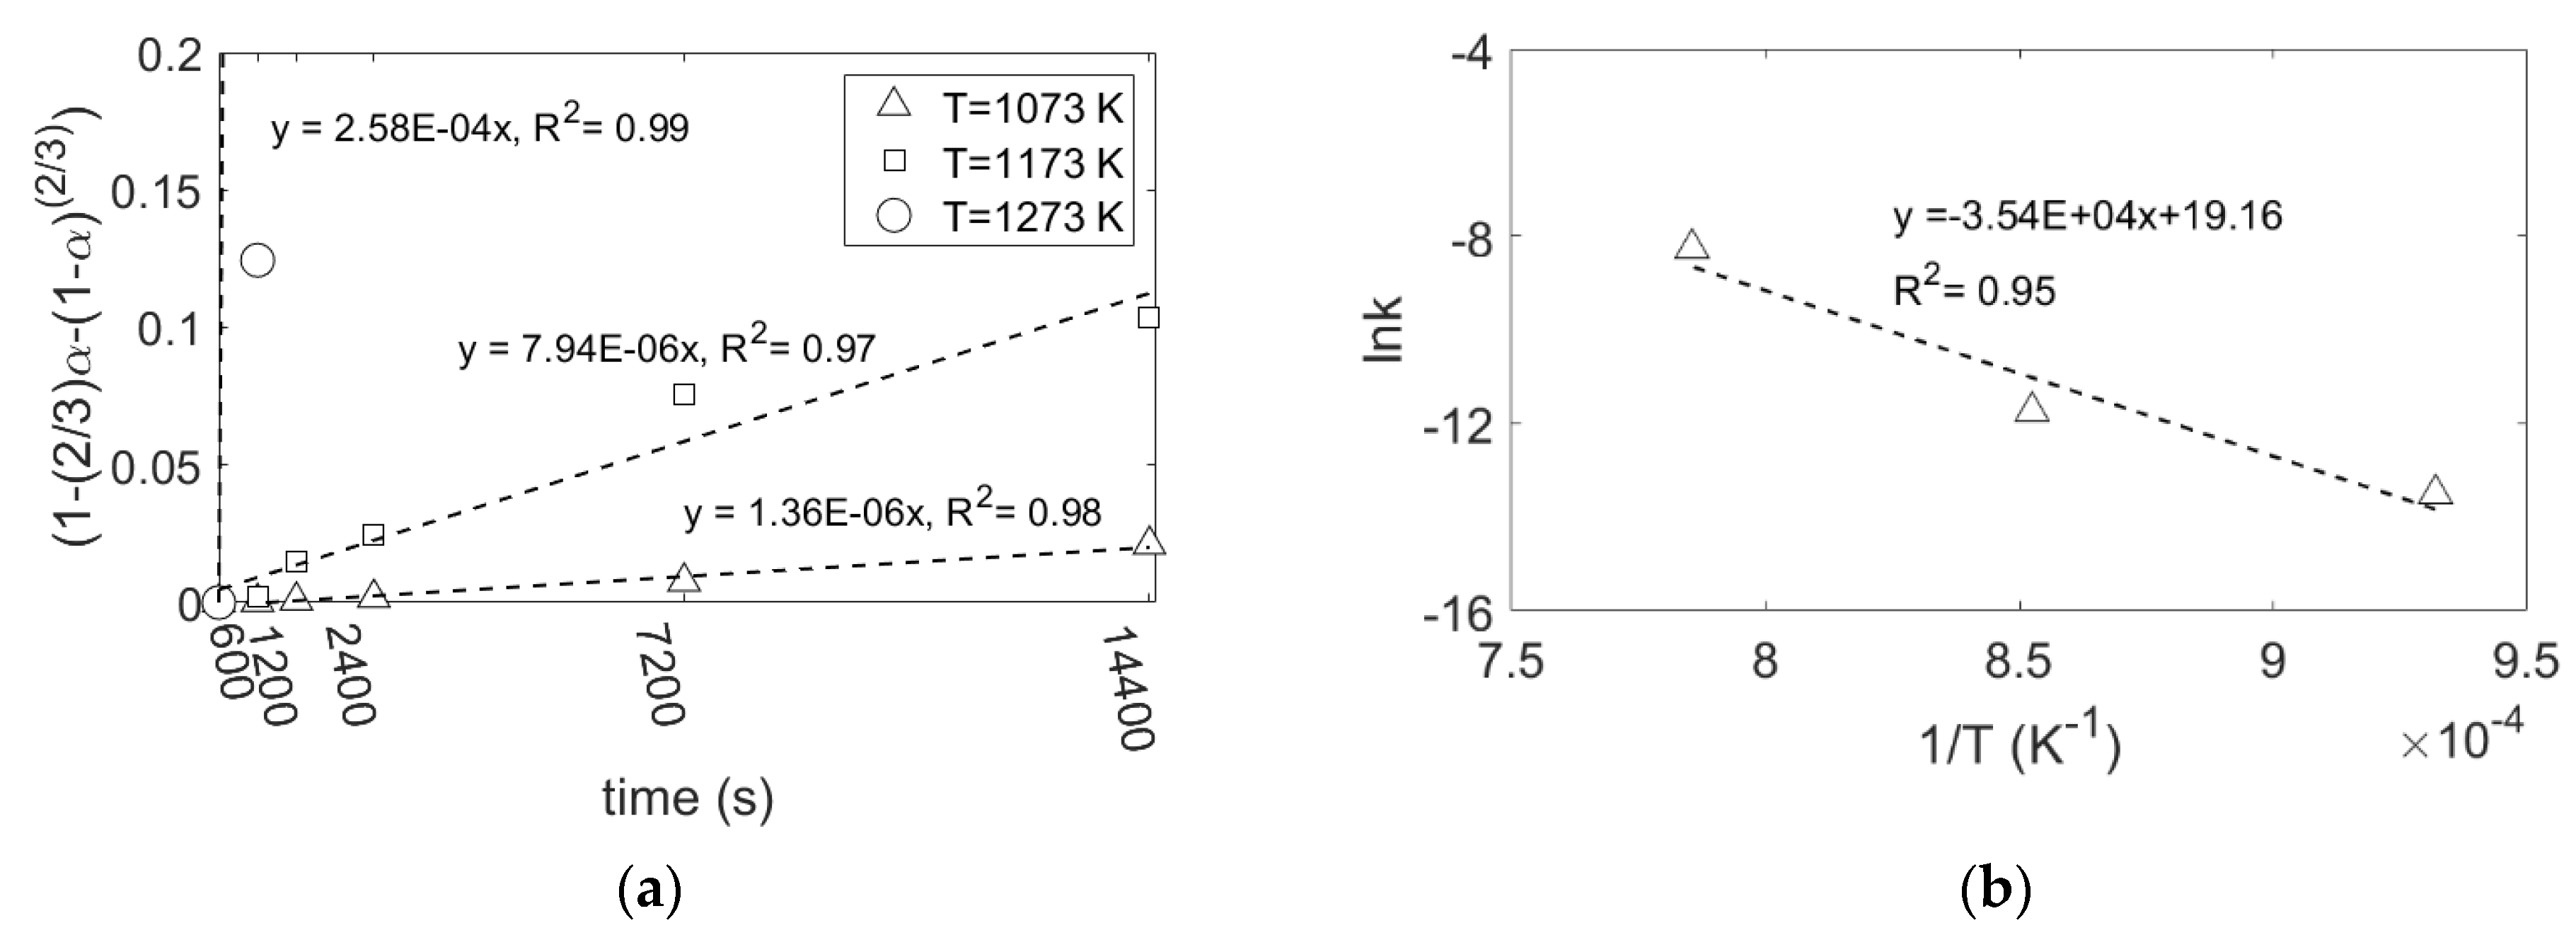
4.1. Reaction Rate
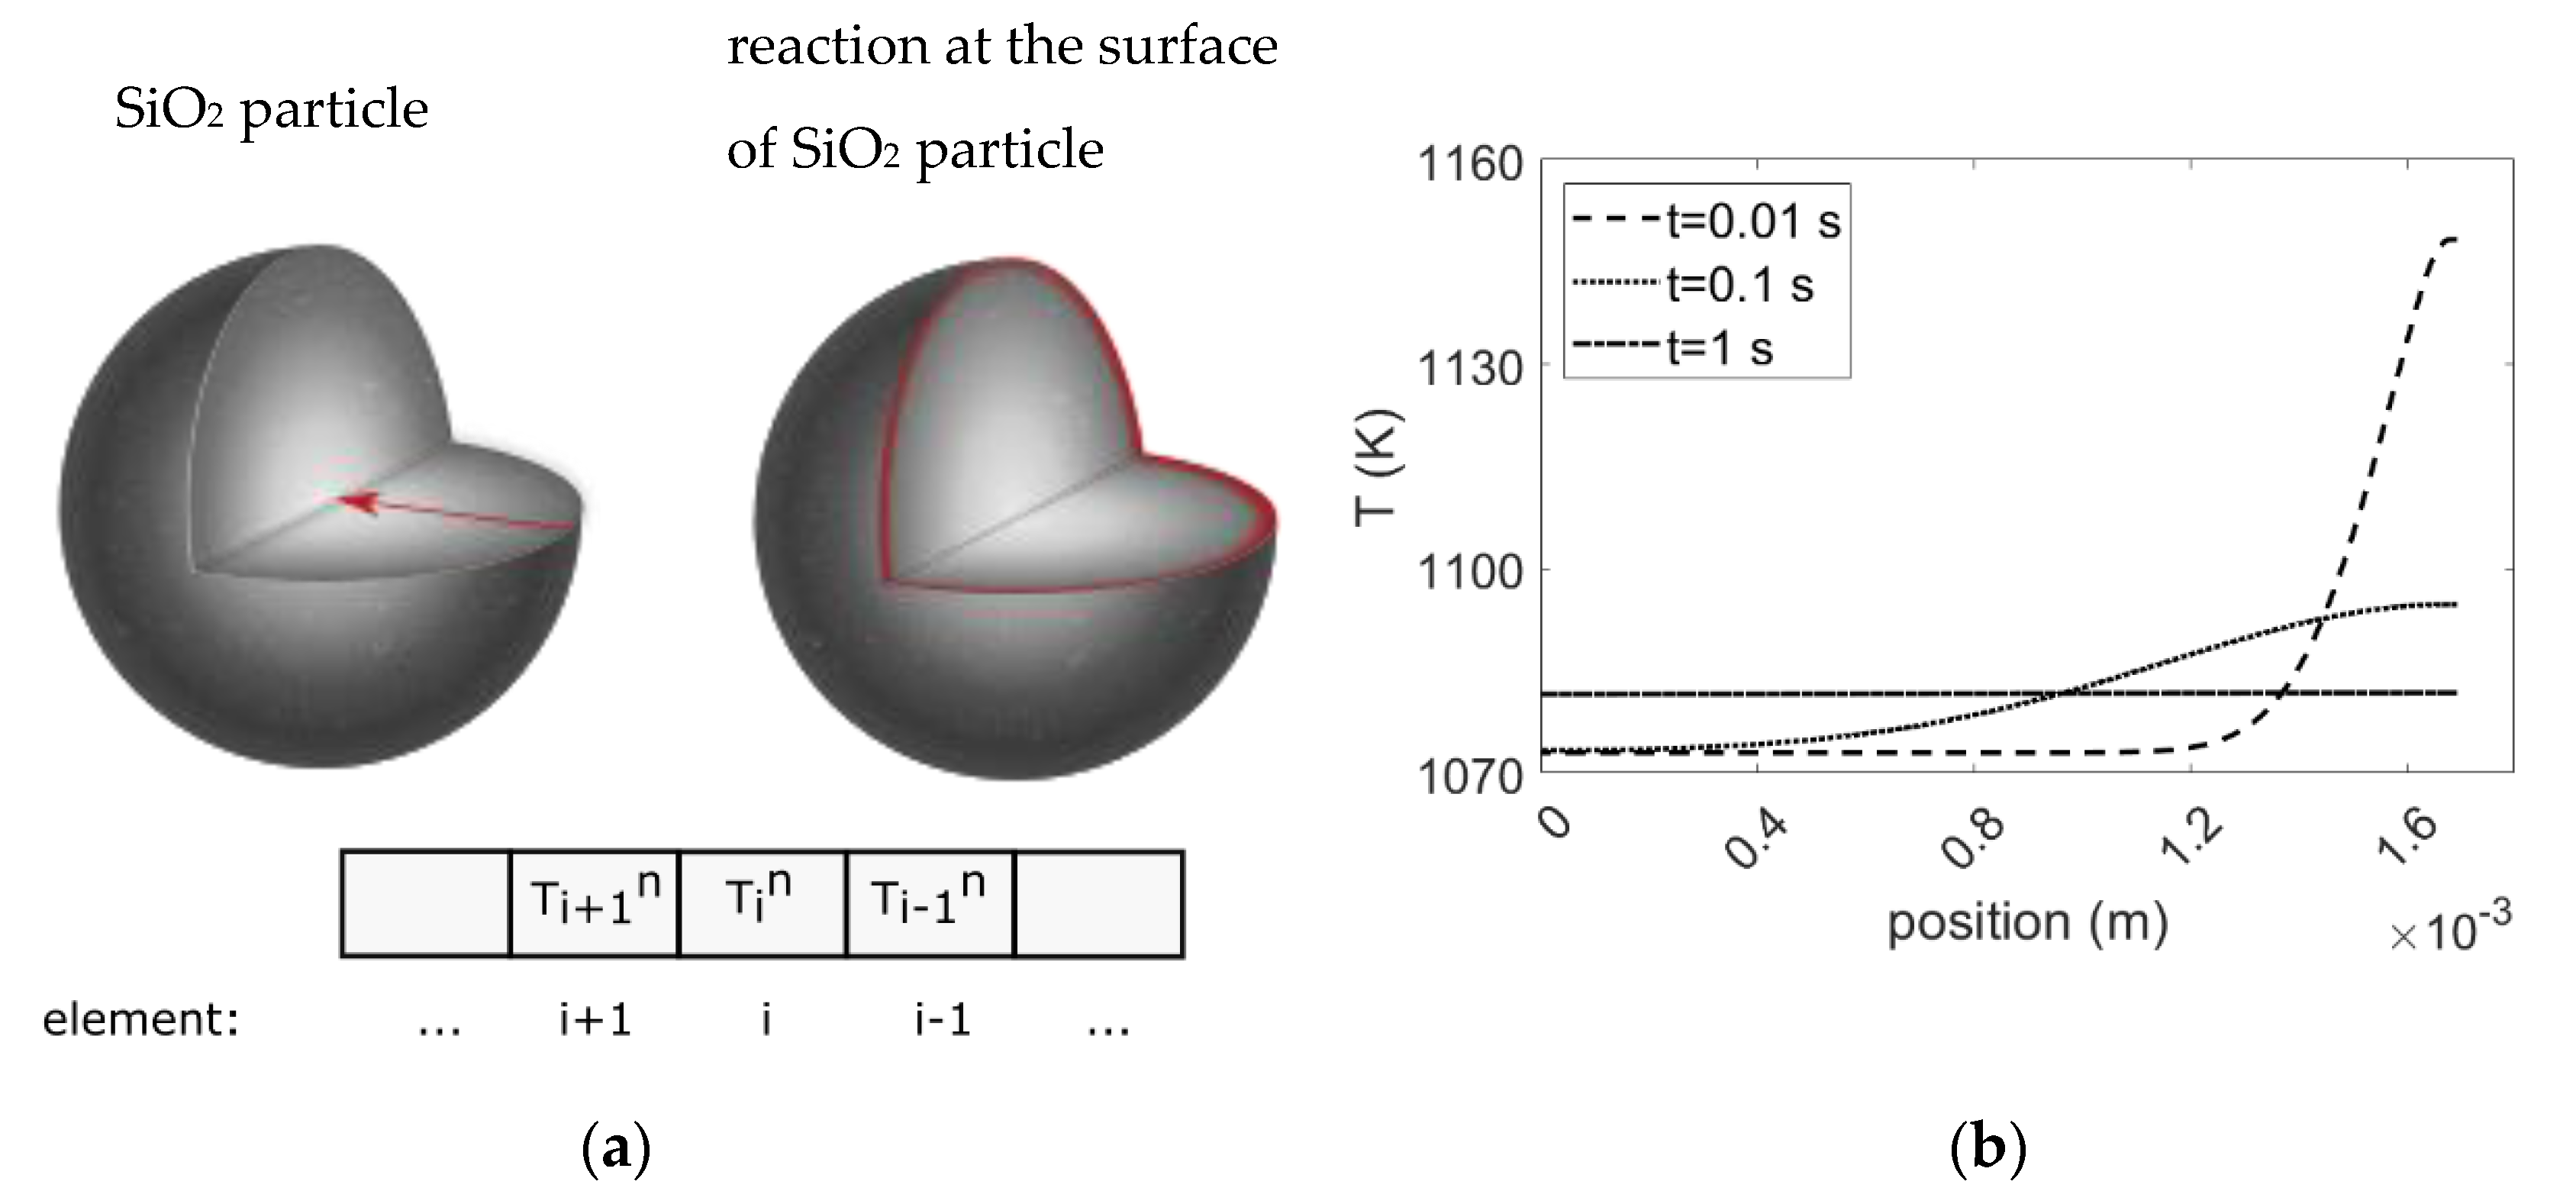
4.2. Evaluation of “True” Internal Sample Temperature during Reduction Reaction
- It is an adiabatic system that contains one quartz particle. Therefore, heat radiation and heat convection from the surface of the particle are assumed to be zero.
- Reactions progress uniformly from the surface of the particle towards the core. Therefore, the three-dimensional problem is converted to a one-dimensional problem in regard to symmetry.
- The released heat during reduction increases the temperature at the reaction zone to the adiabatic temperature of reaction.
- The heat capacity of each phase was obtained from HSC Chemistry 9 software. Two other temperature dependent properties, heat conductivity and density were calculated by FactSage 8.1 software. At higher temperatures where these properties are not available, extrapolation from the available data was applied. The heat capacity of phases is given in Table S2 and heat conductivity and density are listed in Table S3.
- There is an ideal interface between the reactant and products that the heat conducts along.
- The thicknesses of the reaction zone were obtained from the microstructure examination, as shown in Figure 3.
5. Conclusions
- The activation energy of the reduction reaction at a Mg/SiO2 mole ratio 4 was determined to be 294 and 250 kJ/mol, using the Ginstling–Brounshtein model and the first order reaction model, respectively. The calculated activation energy confirms that the Mg diffusion through the MgO-based product layer controls the reaction rate.
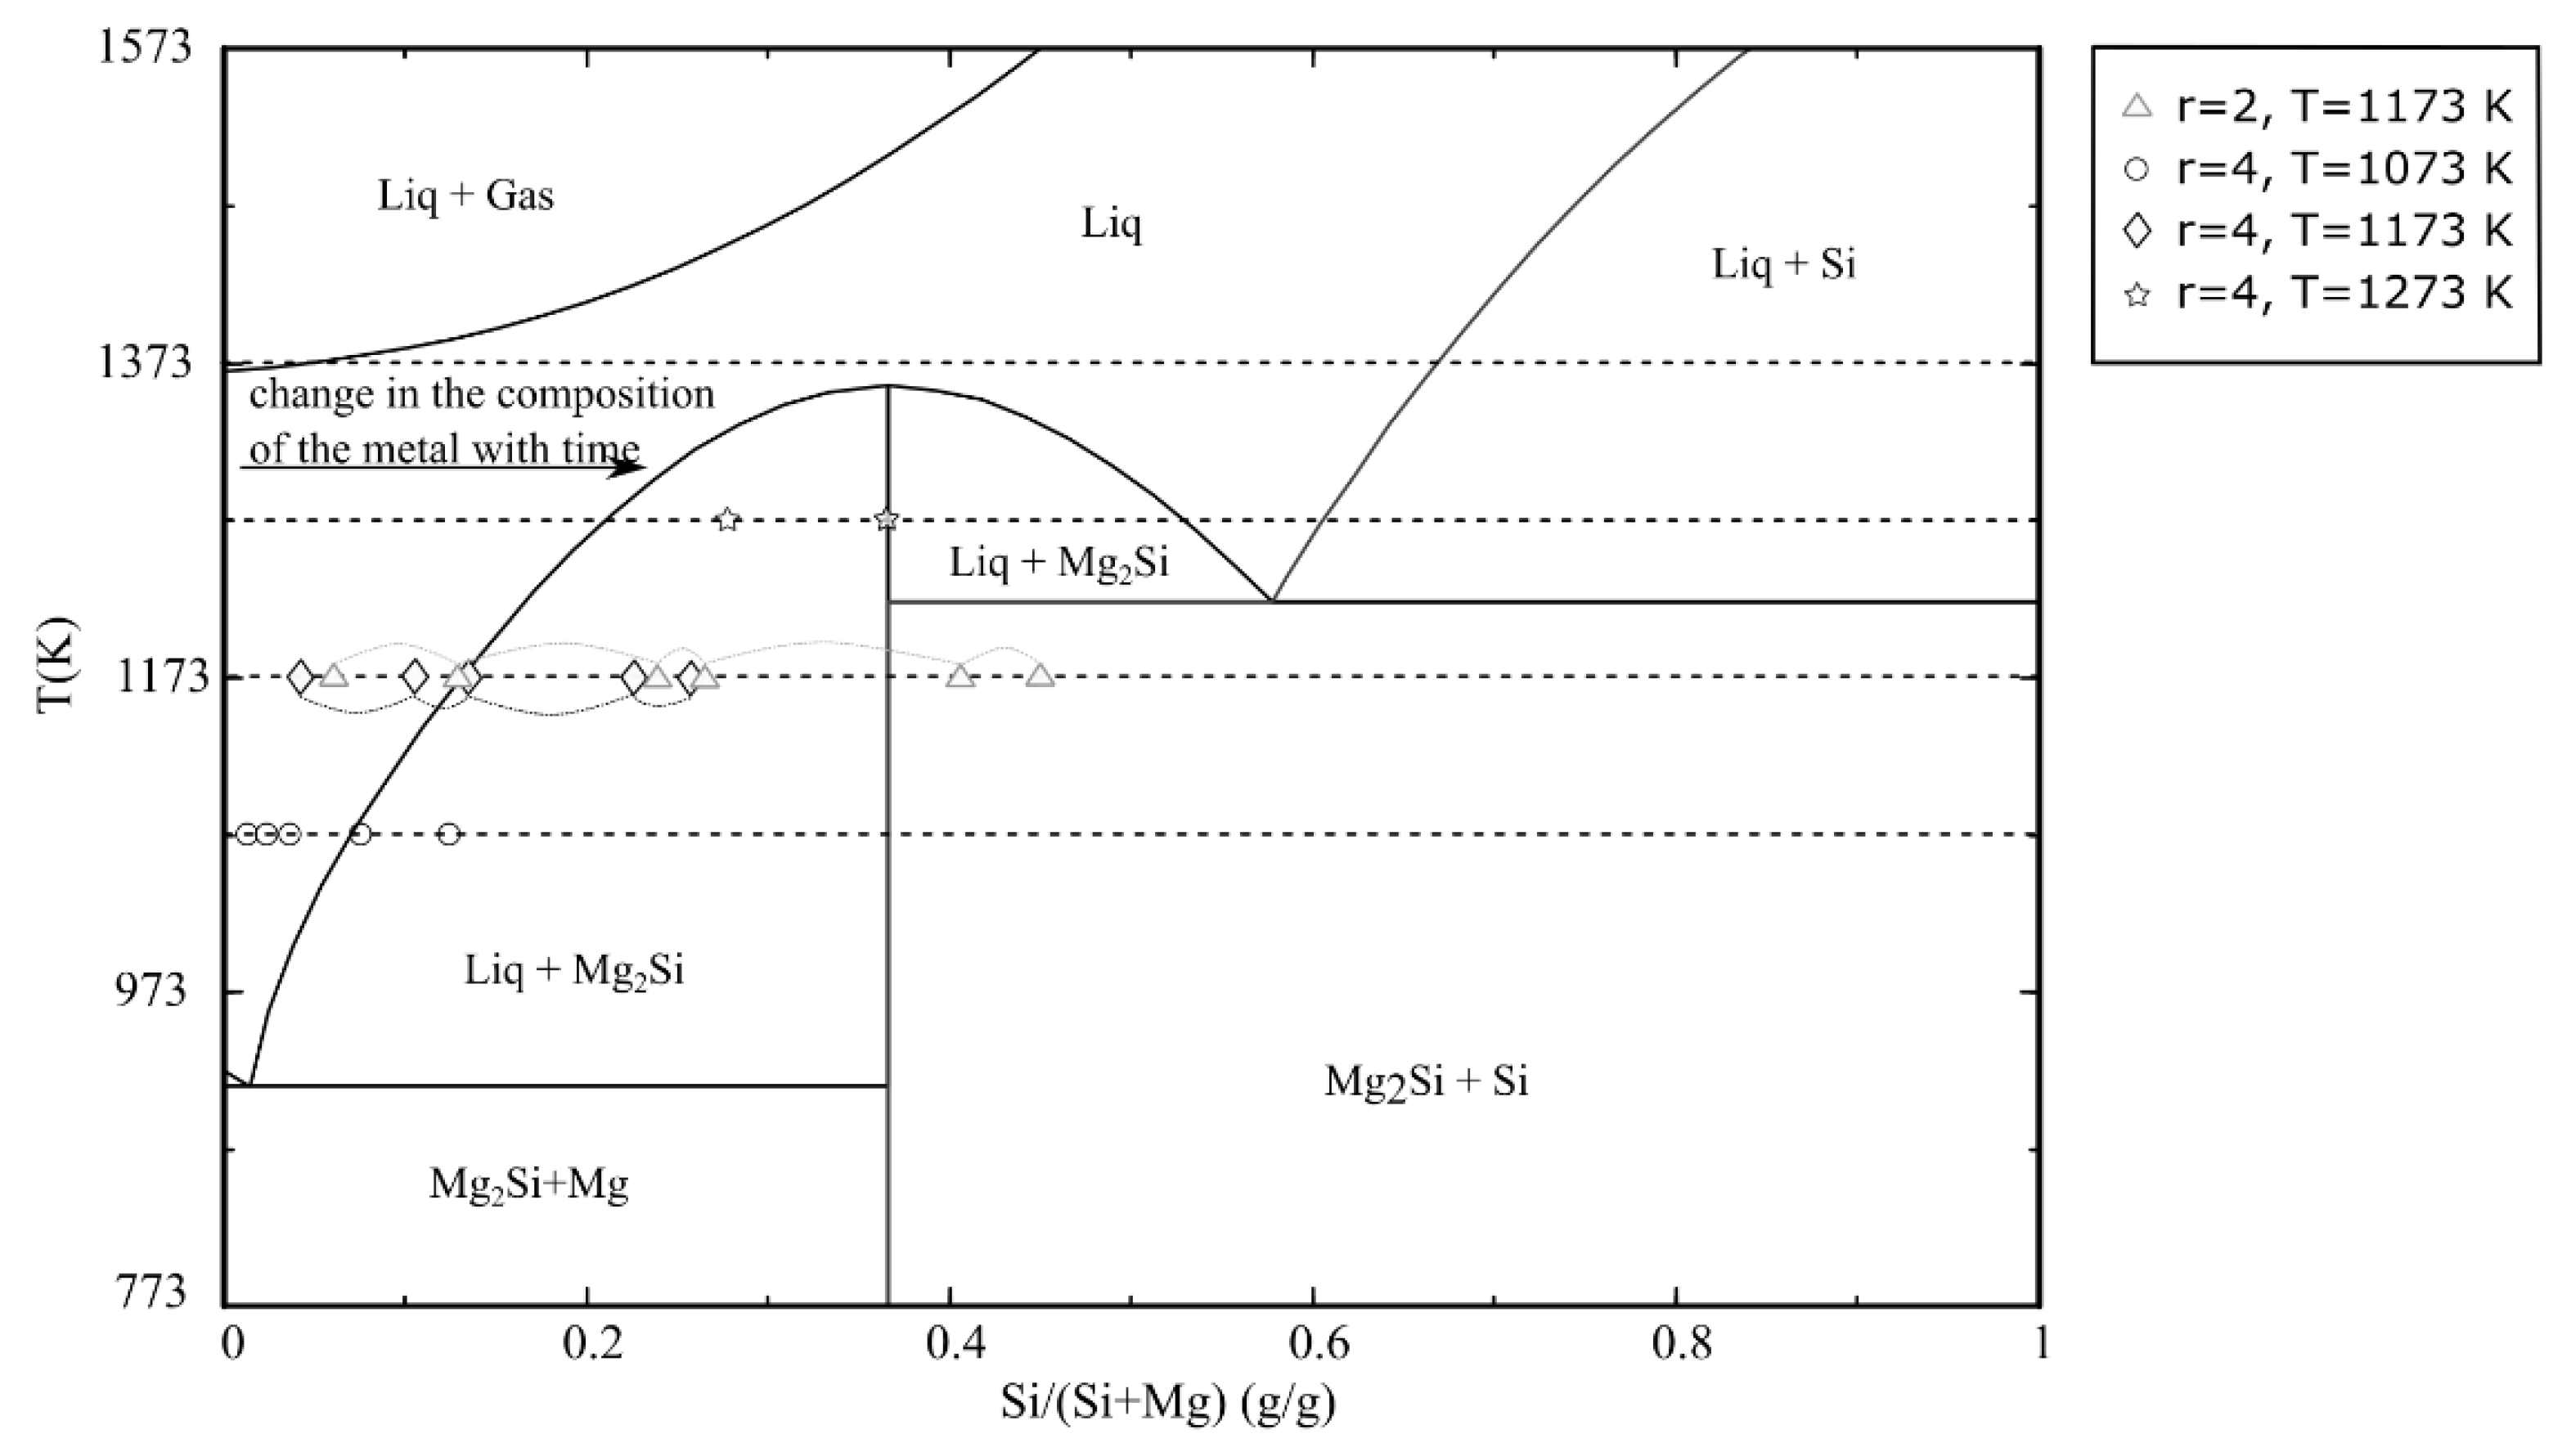
- A lower reaction rate at a Mg/SiO2 mole ratio of 2 than 4 can be attributed to the state of the metal phase that is in solid region for the latter mole ratio.
- The microstructure examination shows that the product layer has very different microstructures under different reaction conditions with respect to the distribution of product phases (MgO and metal).
- Despite the strongly exothermic reaction giving a high localized temperature at the reaction interface, the bulk temperature of the particle system did not increase substantially given the size of the current system and the high rate of heat transfer.
Supplementary Materials
Author Contributions
Funding
Institutional Review Board Statement
Informed Consent Statement
Data Availability Statement
Conflicts of Interest
References
- Sorvik, A.I. Method for the Manufacture of Pure Silicon Metal and Amorphous Silica by Reduction of Quartz (SiO2). WO Patent 2007/102745, 13 September 2007. [Google Scholar]
- Aarnæs, T.S.; Ringdalen, E.; Tangstad, M. Silicon Carbide Formation from Methane and Silicon Monoxide. Sci. Rep. 2020, 10, 1–11. [Google Scholar] [CrossRef] [PubMed]
- Sævarsdottir, G.; Kvande, H.; Magnusson, T. Greenhouse Gas Emissions from Silicon Production-Development of Carbon Footprint with Changing Energy Systems. In Proceedings of the 16th International Ferro-Alloys Congress (INFACON XVI), Trondheim, Norway, 27–29 September 2021. [Google Scholar] [CrossRef]
- Monsen, B.; Kolbeinsen, L.; Prytz, S.; Myrvågnes, V.; Tang, K. Possible Use of Natural Gas for Silicon or Ferrosilicon Production. In Proceedings of the 13th International Ferroalloys Congress, Kazakhstan, Almaty, Kazakhstan, 9–12 June 2013; Volume 1, pp. 467–478. [Google Scholar]
- Safarian, J. Duplex Process to Produce Ferromanganese and Direct Reduced Iron by Natural Gas. ACS Sustain. Chem. Eng. 2021, 9, 5010–5026. [Google Scholar] [CrossRef]
- Safarian, J. A Sustainable Process to Produce Manganese and Its Alloys through Hydrogen and Aluminothermic Reduction. Processes 2022, 10, 27. [Google Scholar] [CrossRef]
- Tranell, G.; Wallin, M.; Safarian, J. SisAl-A New Process for Production of Silicon; Silicon for the Chemical and Solar Industry XV: Trondheim, Norway, 2020. [Google Scholar]
- Toli, A.; Tsaousi, G.M.; Balomenos, E.; Panias, D.; Heuer, M.; Philipson, H.; Tranell, G. Sustainable Silicon and High Purity Alumina Production from Secondary Silicon and Aluminium Raw Materials through the Innovative SisAl Technology. Mater. Proc. 2021, 5, 85. [Google Scholar] [CrossRef]
- Cheraghi, A.; Yoozbashizadeh, H.; Safarian, J. Carburization of Manganese Oxide Sources by Natural Gas. Metall. Mater. Trans. B 2022, 53, 744–759. [Google Scholar] [CrossRef]
- Haouli, S.; Boudebane, S.; Slipper, I.J.; Lemboub, S.; Gębara, P.; Mezrag, S. Combustion Synthesis of Silicon by Magnesiothermic Reduction. Phosphorus Sulfur Silicon Relat. Elem. 2018, 193, 280–287. [Google Scholar] [CrossRef]
- Shekhovtsov, G.; Shchegolev, V.; Devyatkin, V.; Tatakin, A.; Zabelin, I. Magnesium Electrolytic Production Process. In Essential Readings in Magnesium Technology; Mathaudhu, S.N., Luo, A.A., Neelameggham, N.R., Nyberg, E.A., Sillekens, W.H., Eds.; Springer International Publishing: Cham, Switzerland, 2016; pp. 97–100. [Google Scholar]
- Evans, J.W. The Evolution of Technology for Light Metals over the Last 50 Years: Al, Mg, and Li. JOM 2007, 59, 30–38. [Google Scholar] [CrossRef]
- Froes, F.H.; Eliezer, D.; Aghion, E. The Science, Technology, and Applications of Magnesium. JOM 1998, 50, 30–34. [Google Scholar] [CrossRef]
- Larbi, K.K.; Roy, R.; Barati, M.; Lakshmanan, V.I.; Sridhar, R.; McLean, A. Use of Rice Husk for Emission Neutral Energy Generation and Synthesis of Solar-Grade Silicon Feedstock. Biomass Convers. Biorefinery 2012, 2, 149–157. [Google Scholar] [CrossRef]
- Barati, M.; Sarder, S.; Mclean, A.; Roy, R. Recovery of Silicon from Silica Fume. J. Non-Cryst. Solids 2011, 357, 18–23. [Google Scholar] [CrossRef]
- Banerjee, H.D.; Sen, S.; Acharya, H.N. Investigations on the Production of Silicon from Rice Husks by the Magnesium Method. Mater. Sci. Eng. 1982, 52, 173–179. [Google Scholar] [CrossRef]
- Amick, J.A.; Milewski, J.W.; Wright, F.J. Methods for Production Solar Cell-Grade Silicon from Rice Hulls. U.S. Patent 4214920, 29 June 1980. [Google Scholar]
- Acharya, H.N.; Dutta, S.K. Production of Magnesium Silicide and Silane from Rice Husk Ash. Sol. Energy Mater. 1980, 3, 441–445. [Google Scholar] [CrossRef]
- Kuratomi, T.; Yatsurugi, Y. Process for Production of Monosilane (SiH4) and Germanium Hydride (GeH4). U.S. Patent 3,577,220, 4 May 1971. [Google Scholar]
- Johnson, W.C.; Isenberg, S. Hydrogen Compounds of Silicon. I. The Preparation of Mono- and Disilane. J. Am. Chem. Soc. 1935, 57, 1349–1353. [Google Scholar] [CrossRef]
- Nandi, K.C.; Mukherjee, D.; Biswas, A.K.; Acharya, H.N. Optimization of Acid Concentration, Temperature and Particle Size of Magnesium Silicide, Obtained from Rice Husk, for the Production of Silanes. J. Mater. Sci. Lett. 1993, 12, 1248–1250. [Google Scholar] [CrossRef]
- Belot, D.; Rade, J.Y.; Piffard, J.F.; Larquet, C.; Cornut, P. Process and the Apparatus for the Production of Silicon Hydrides. U.S. Patent 4698218, 6 October 1987. [Google Scholar]
- Tarasevych, O.I.; Tarasevych, I.S.; Palguiev, I.A.; Kolos, P.M.S. A Process for the Production of High-Purity Silicon and an Installation Therefor. WO Patent 2014/166505, 16 October 2014. [Google Scholar]
- Liang, J.; Li, X.; Hou, Z.; Zhang, W.; Zhu, Y.; Qian, Y. A Deep Reduction and Partial Oxidation Strategy for Fabrication of Mesoporous Si Anode for Lithium Ion Batteries. ACS Nano 2016, 10, 2295–2304. [Google Scholar] [CrossRef]
- Entwistle, J.E.; Beaucage, G.; Patwardhan, S.V. Mechanistic Understanding of Pore Evolution Enables High Performance Mesoporous Silicon Production for Lithium-Ion Batteries. J. Mater. Chem. A 2020, 8, 4938–4949. [Google Scholar] [CrossRef]
- Ødegård, I.A.; Romann, J.; Fossdal, A.; Røyset, A.; Tranell, G. Synthesis and Properties of Silicon/Magnesium Silicon Nitride Diatom Frustule Replicas. J. Mater. Chem. A 2014, 2, 16410–16415. [Google Scholar] [CrossRef]
- Yu, Y.; Gu, L.; Zhu, C.; Tsukimoto, S.; Van Aken, P.A.; Maier, J. Reversible Storage of Lithium in Silver-Coated Three-Dimensional Macroporous Silicon. Adv. Mater. 2010, 22, 2247–2250. [Google Scholar] [CrossRef]
- Richman, E.K.; Kang, C.B.; Brezesinski, T.; Tolbert, S.H. Ordered Mesoporous Silicon through Magnesium Reduction of Polymer Templated Silica Thin Films. Nano Lett. 2008, 8, 3075–3076. [Google Scholar] [CrossRef]
- Cai, Y.; Allan, S.M.; Sandhage, K.H.; Zalar, F.M. Three-Dimensional Magnesia-Based Nanocrystal Assemblies Via Low- Temperature Magnesiothermic Reaction of Diatom Microshells. J. Am. Ceram. Soc. 2005, 88, 2005–2010. [Google Scholar] [CrossRef]
- Sandhage, K.H.; Dickerson, M.B.; Huseman, P.M.; Caranna, M.A.; Clifton, J.D.; Bull, T.A.; Heibel, T.J.; Overton, W.R.; Schoenwaelder, M.E.A. Novel, Bioclastic Route to Self-Assembled, 3D, Chemically Tailored Meso/Nanostructures: Shape-Preserving Reactive Conversion of Biosilica (Diatom) Microshells. Adv. Mater. 2002, 14, 429–433. [Google Scholar] [CrossRef]
- Wynnyckyj, J.R.; Bhogeswara Rao, D. The Mechanism of Reduction of Silica by Magnesium Vapor. High Temp. Sci. 1976, 8, 203–217. [Google Scholar]
- Tsuboi, Y.; Ura, S.; Takahiro, K.; Henmi, T.; Okada, A.; Wakasugi, T.; Kadono, K. Magnesiothermic Reduction of Silica Glass Substrate-Chemical States of Silicon in the Generated Layers. J. Asian Ceram. Soc. 2017, 5, 341–349. [Google Scholar] [CrossRef]
- Nandi, K.C.; Mukherjee, D.; Biswas, A.K.; Acharya, H.N. A Novel and Inexpensive Method of Production of Silanes from Rice Husk and Their Gas Chromatographic Analyses. Sol. Energy Mater. 1991, 22, 161–167. [Google Scholar] [CrossRef]
- Gutman, I.; Gotman, I.; Shapiro, M. Kinetics and Mechanism of Periodic Structure Formation at SiO2/Mg Interface. Acta Mater. 2006, 54, 4677–4684. [Google Scholar] [CrossRef]
- Chen, Y.C.; Xu, J.; Fan, X.H.; Zhang, X.F.; Han, L.; Lin, D.Y.; Li, Q.H.; Uher, C. The Mechanism of Periodic Layer Formation during Solid-State Reaction between Mg and SiO2. Intermetallics 2009, 17, 920–926. [Google Scholar] [CrossRef]
- Kodentsov, A.; Wierzbicka-Miernik, A.; Litynska-Dobrzynska, L.; Czaja, P.; Wojewoda-Budka, J. Formation of Magnesium Silicide in Bulk Diffusion Couples. Intermetallics 2019, 114, 106589. [Google Scholar] [CrossRef]
- Li, J.; Hwang, S.H.; Itskos, G.; Sandhage, K.H. Kinetic Mechanism of Conformal Magnesium Silicide (Mg2Si) Film Formation via Reaction of Si Single Crystals with Mg Vapor. J. Mater. Sci. 2020, 55, 1107–1116. [Google Scholar] [CrossRef]
- Yoo, J.K.; Kim, J.; Choi, M.J.; Park, Y.U.; Hong, J.; Baek, K.M.; Kang, K.; Jung, Y.S. Extremely High Yield Conversion from Low-Cost Sand to High-Capacity Si Electrodes for Li-Ion Batteries. Adv. Energy Mater. 2014, 4, 1400622. [Google Scholar] [CrossRef]
- Yan, Z.; Guo, J. High-Performance Silicon-Carbon Anode Material via Aerosol Spray Drying and Magnesiothermic Reduction. Nano Energy 2019, 63, 103845. [Google Scholar] [CrossRef]
- Rasouli, A.; Herstad, K.E.; Safarian, J.; Tranell, G. Magnesiothermic Reduction of Natural Quartz. Metall. Mater. Trans. B 2022, 53, 2132–2142. [Google Scholar] [CrossRef]
- DIFFRAC.EVA V6.0. Available online: https://www.bruker.com/en/products-and-solutions/diffractometers-and-scattering-systems/x-ray-diffractometers/diffrac-suite-software/diffrac-eva.html (accessed on 15 August 2022).
- PDF-4+2014. Available online: https://www.icdd.com/pdf-4/ (accessed on 15 August 2022).
- TOPAS. Available online: https://www.bruker.com/en/products-and-solutions/diffractometers-and-scattering-systems/x-ray-diffractometers/diffrac-suite-software/diffrac-topas.html (accessed on 15 August 2022).
- Young, R.A. (Ed.) The Rietveld Method; Oxford University Press: Oxford, UK, 1995; ISBN 0198559127. [Google Scholar]
- Jusnes, K.F. Phase Transformations and Thermal Degradation in Industrial Quartz; Norwegian University of Science and Tehnology: Trondheim, Norway, 2020. [Google Scholar]
- FactSage. Available online: https://www.factsage.com/ (accessed on 15 August 2022).
- Jander, V.W. Reaktionen Im Festen Zustande Bei Höheren Temperaturen. Reaktionsgeschwindigkeiten Endotherm Verlaufender Umsetzungen. Z. Anorg. Allg. Chem. 1927, 163, 1–30. [Google Scholar] [CrossRef]
- Gaskell, D.R.; Laughlin, D.E. The Behavior of Gases. In Introduction to the Thermodynamics of Materials; CRC Press: Boca Raton, FL, USA, 2018; pp. 229–266. [Google Scholar]
- Khawam, A.; Flanagan, D.R. Solid-State Kinetic Models: Basics and Mathematical Fundamentals. J. Phys. Chem. B 2006, 110, 17315–17328. [Google Scholar] [CrossRef] [PubMed]
- Galwey, A.K.; Brown, M.E. Kinetic Models for Solid-State Reactions. In Thermal Decomposition of Ionic Solids: Chemical Properties and Reactivities of Ionic Crystalline Phases; Elsevier: Amsterdam, The Netherlands, 1980; pp. 75–111. [Google Scholar]
- Wuensch, B.J.; Steele, W.C.; Vasilos, T. Cation Self-Diffusion in Single-Crystal MgO. J. Chem. Phys. 1973, 58, 5258–5266. [Google Scholar] [CrossRef]
- Martinelli, J.R.; Sonder, E.; Weeks, R.A.; Zuhr, R.A. Measurement of Cation Diffusion in Magnesium Oxide by Determining the Mg18O Buildup Produced by an Electric Field. Phys. Rev. B 1985, 32, 6756–6763. [Google Scholar] [CrossRef]
- HSC Chemisdtry. Available online: https://www.hsc-chemistry.com/ (accessed on 15 August 2022).
- Bird, R.B.; Stewart, W.E.; Lightfoot, E.N. The Equations of Change for Nonisothermal Systems. In Transport Phenomena; Wiley: New York, NY, USA, 2001; pp. 333–373. [Google Scholar]
- MATLAB. Available online: https://se.mathworks.com/products/new_products/release2021a.html (accessed on 15 August 2022).


| Parameters | T (K) | |||
|---|---|---|---|---|
| 1273 | 1173 | 1273 | 1373 | |
| Vapor pressure of Mg (Pa) | 4.39 × 10³ | 1.54 × 10⁴ | 4.37 × 10⁴ | 1.06 × 10⁵ |
| Number of Mg moles in the gas phase | 5.26 × 10⁻⁶ | 1.68 × 10⁻⁵ | 4.42 × 10⁻⁵ | 9.91 × 10⁻⁵ |
| Percent of Mg moles in the gas phase | 0.16 | 0.50 | 1.31 | 2.93 |
| Set Reaction Temperature | Tad for Complete Reaction | Tad after 4 h Reaction Time | Temperature of the System Including Reactant Material, Al2O3 Crucible and Stainless-Steel Reactor |
|---|---|---|---|
| 1073 | 2663 | 1694 | 1074 |
| 1173 | 2759 | 2366 | 1174 |
| 1273 | 2854 | 2854 | 1275 |
Publisher’s Note: MDPI stays neutral with regard to jurisdictional claims in published maps and institutional affiliations. |
© 2022 by the authors. Licensee MDPI, Basel, Switzerland. This article is an open access article distributed under the terms and conditions of the Creative Commons Attribution (CC BY) license (https://creativecommons.org/licenses/by/4.0/).
Share and Cite
Rasouli, A.; Tsoutsouva, M.; Safarian, J.; Tranell, G. Kinetics of Magnesiothermic Reduction of Natural Quartz. Materials 2022, 15, 6535. https://doi.org/10.3390/ma15196535
Rasouli A, Tsoutsouva M, Safarian J, Tranell G. Kinetics of Magnesiothermic Reduction of Natural Quartz. Materials. 2022; 15(19):6535. https://doi.org/10.3390/ma15196535
Chicago/Turabian StyleRasouli, Azam, Maria Tsoutsouva, Jafar Safarian, and Gabriella Tranell. 2022. "Kinetics of Magnesiothermic Reduction of Natural Quartz" Materials 15, no. 19: 6535. https://doi.org/10.3390/ma15196535