Article

Magnetic Zr-Based Metal-Organic Frameworks: A Highly Efficient Au (III) Trapper for Gold Recycling

1
Civil and Resource Engineering School, University of Science and Technology Beijing, Beijing 100083, China
2
BGRIMM Technology Group, State Key Laboratory of Mineral Processing, Beijing 100160, China
*
Authors to whom correspondence should be addressed.
Materials 2022, 15(19), 6531; https://doi.org/10.3390/ma15196531
Submission received: 21 August 2022 / Revised: 14 September 2022 / Accepted: 16 September 2022 / Published: 21 September 2022
(This article belongs to the Special Issue Advanced Materials and Technologies in Separation)

Abstract

:
In this work, the magnetic Zr-based MOF composites with excellent retrievability were prepared using Fe3O4@SiO2 as the core and UiO–66–NH2 as the shell. Fe3O4@SiO2 core could introduce mesopores and result in capillary condensation in MOF composites, which aggravated with the dosage of Fe3O4@SiO2. The as-synthesized MOF composites could be rapidly retrieved from aqueous solution via magnetic separation in 10 seconds. pH imposed an important effect on Au (III) adsorption by governing the ion exchange and electrostatic interaction between Au (III) anions and adsorbents, and the optimal adsorption happened at pH 7. The adsorption process fitted well with the pseudo-second order kinetics model and Langmuir adsorption model. The maximum adsorption capacity of Au (III) by FSUN–10 and FSUN–50 at 298 K were determined to be 611.18 mg∙g−1 and 463.85 mg∙g−1, respectively. Additionally, Au (III) uptakes increased with temperature. Beyond experiments, the adsorption mechanisms were thoroughly studied through systematic characterization, molecular dynamics simulation (MDS) and density functional theory (DFT) study. It was verified that Au (III) was adsorbed via coordination to hydroxyl and amino groups and was reduced to Au (I) and Au (0) by amino groups. The diffusion coefficient of Au (III) along UiO–66–NH2 was calculated to be 5.8 × 10⁻⁵ cm2∙s−1. Moreover, the magnetic Zr-based MOF composites exhibit great industrial value in gold recycling with high adsorption selectivity and good recyclability.

1. Introduction

Gold is widely utilized in jewelry, medical, chemical, electronic and electrical industries due to its excellent physical and chemical properties [1]. However, the demand of gold is increasing rapidly due to the sustainable development of industry and improvement of consumption. Nowadays, recycling gold from secondary resources has been the priority choice for countries around the world to cope with the resource shortage [2]. Recovering gold from secondary resources is more effective, much cleaner and less costly compared to mining and metallurgy, which is of great environmental and economic significance [3].
Adsorption is widely used in the preconcentration and recovery of gold from aqueous solution since it has the advantages of being a short process, a clean working environment and easy to operate [4]. Activated carbons (ACs), resin and biomaterials are conventional adsorption materials for gold recycling. ACs can effectively adsorb gold ions through physical and chemical interactions and have a high stability in harsh environments [5]. However, the main limitation is that ACs are difficult to regenerate after use, and the adsorption capacity and selectivity are relatively low. Resin is easier to be regenerated than ACs and has higher adsorption efficiency while the adsorption capacity and selectivity are limited [6]. Biomaterials such as algae, fungi, yeasts and some biopolymers are environment friendly and low cost, and have also been utilized in the adsorption and recovery of gold [7]. However, the disadvantages of biomaterials are limited adsorption capacity and poor stability, thus restricting their large-scale application in practice. Therefore, developing adsorption materials with large capacity, high efficiency and superb selectivity is vital to gold extraction and recycling.
Metal-organic frameworks (MOFs) are emerging as promising candidate adsorbents for gold recycling. MOFs are composed of inorganic metal ions and organic linkers by coordination via self-assembly. MOFs are periodic porous materials with tunable topology and pore diameter, enormous surface area and versatile chemical properties. Therefore, MOFs are widely studied in multiple applications, such as energy storage [8], biomedicine [9,10], wastewater treatment [11,12] and catalysis [13]. In the last decades, MOFs have gained a great number of attention in the capture and adsorption of precious metals. Hu [14] reported that the maximum adsorption capacity of Au (III) on zeolitic imidazolate framework (ZIF-8) was 1192 mg∙g−1 at pH 2.5. Tang et al. [15] synthesized AHPP-MOF via premodification to effectively adsorb Pd (II) from aqueous solution with the maximum uptakes being 241.6 mg∙g−1 at 298 K. In a previous study, authors found that UiO–66–NH2 exhibited exceptional adsorption selectivity and efficiency towards Au (III) [16]. However, the submicron powdery shape of MOFs requires tedious high-speed centrifugation to achieve solid–liquid separation, seriously limiting their application in practice. In addition, though great efforts have been devoted in employing Zr-based MOFs for Au (III) recovery, the underlying adsorption mechanism, especially when reducing groups (i.e., -NH2) exist in MOF, is still yet to be revealed.
The retrieval of MOFs from aqueous solution can be facilitated by functionalization with superparamagnetic iron oxide nanoparticles. Typically, the magnetic nanocomposites composed of Fe3O4 nanoparticles and MOFs can be prepared via layer-by-layer assembly strategy to generate a core-shell structure. For example, Hu et al. [17] synthesized hybrid magnetic MOF-5 by the incorporation of Fe3O4 nanoparticles, making them the ideal candidate adsorption materials for magnetic enrichment of trace analytes. Moreover, silica layer was usually adopted to stabilize the Fe3O4 core in harsh aqueous environment, and the -OH groups on silica could facilitate the in-situ growth of MOF shell by chelating with metal ions. Huang et al. [18] prepared magnetic MOFs with nano-sized Fe3O4@SiO2 as core and Zr-based MOFs as shell, which showed high adsorption capacity and fast adsorption kinetics towards heavy metal ions and organic dyes.
Herein, based on the previous study, we prepared magnetic MOF composites with Fe3O4@SiO2 as the core and UiO–66–NH2 as the shell to adsorb Au (III) from aqueous solution (Scheme 1). Effects of magnetic functionalization on the structure of MOF composites and their adsorption performance were investigated thoroughly, and the underpinning adsorption mechanisms were studied through experimental characterization, molecular dynamics simulation (MDS) and density functional theory (DFT) study.

2. Experimental

2.1. Synthesis Methods

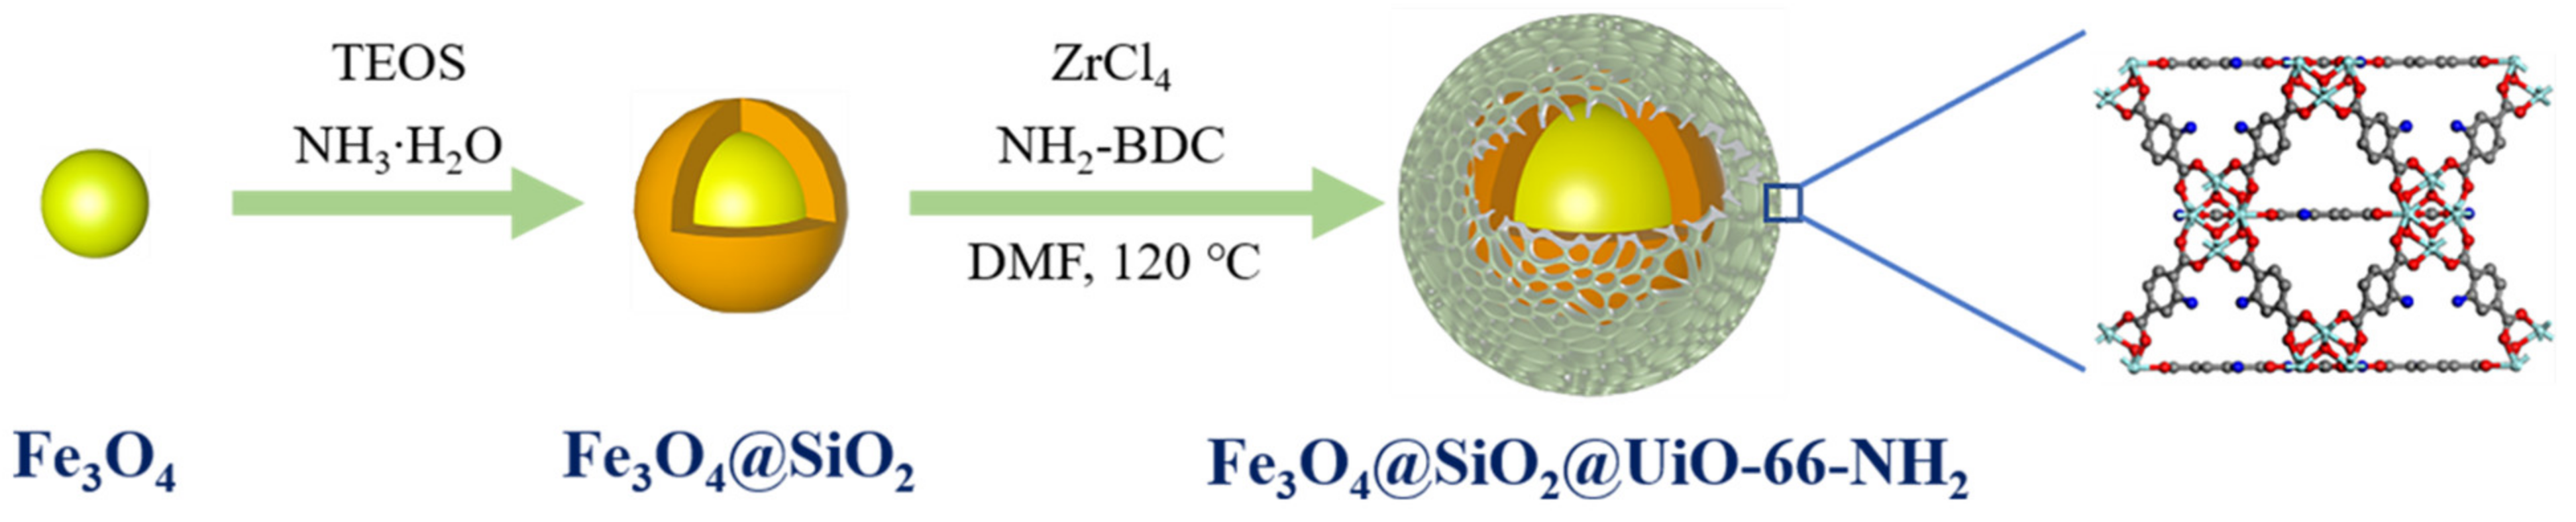
2.1.1. Fe3O4 Synthesis

In this work, Fe3O4 nanoparticles were synthesized based on the modification of a previously reported hydrothermal method [19]. Specifically, 10 mL 0.3 M FeCl3∙6H2O aqueous solution was added into 20 mL 0.45 M NaHCO3 solution and conditioned for 30 min. Then, 10 mL 0.05 M vitamin C (VC) solution was added dropwise into the mixture. The molar ratio of VC to Fe3+ was kept as 1:6. Subsequently, the mixture was transferred into a 50 mL steel-lined para-polyphenylene (PPL) autoclave and heated at 180 °C for 8 h. The obtained particles were washed with deionized water and ethanol repeatedly, followed by drying at 80 °C overnight.

2.1.2. Fe3O4@SiO2 Synthesis

The core-shell structured Fe3O4@SiO2 nanoparticles were prepared using a sol–gel method [20]. 230 mg Fe3O4 nanoparticles were dispersed into a mixture consisting of 80 mL ethanol, 20 mL ultrapure water and 1.5 mL NH3∙H2O solution (25–28 wt.%) by ultrasonic water bath for 30 min. The pH of this mixture was kept at 8–10. After that, 0.5 mL tetraethyl orthosilicate (TEOS) was introduced into the abovementioned mixture at a speed of 10 μL·min−1. The reaction was conducted for 12 h under vigorous mechanical stirring and the obtained particles were collected using a magnet, followed by washing with ethanol and ultrapure water for three times. The products, denoted as Fe3O4@SiO2, were redispersed in N, N-dimethyformamide (DMF) for the subsequent preparation of magnetic functionalized MOFs.

2.1.3. Synthesis of Fe3O4@SiO2@UiO–66–NH2 (FSUN)

FSUN was prepared using a solvothermal method. Briefly, 80 mg ZrCl4, 62 mg 2-aminoterephthalic acid (NH2-BDC) and 1.5 mL glacial acetic acid were mixed with 50 mL DMF. Fe3O4@SiO2 dispersion (10 mg∙mL−1) was added into the abovementioned mixture gradually, followed by the ultrasonic water bath for 30 min. Then the mixture was transferred into a steel lined PPL autoclave and heated at 120 °C for 24 h. The harvested products were collected by magnetic separation and washed with DMF and ethanol repeatedly, followed by drying at 80 °C overnight. To prepare FSUN with different magnetism, 1 mL (10 mg) and 5 mL (50 mg) Fe3O4@SiO2 dispersion were used and the resultant products were denoted as FSUN–10 and FSUN–50, respectively.

2.2. Adsorption Test

For each test, 3 mg FSUN particles and 3 mL Au (III) aqueous solution were mixed in a 5 mL EP tube and incubated at 200 rpm. The pH of mixture was regulated to the desired value using 0.1 M HCl or NaOH solution. The adsorbents were retrieved by magnetic separation after adsorption, and the residual Au (III) concentration was determined by ICP-OES. Au (III) uptakes by FSUN were calculated as Equations (1) and (2):
q e = ( C 0 C e ) V m
q t = ( C 0 C t ) V m
where qe (mg∙g−1) and qt (mg∙g−1) are Au (III) uptakes at equilibrium and time t (min), V (L) is the volume of aqueous solution for each test, C0 (mg∙L−1) and Ct (mg∙L−1) are the initial Au (III) concentration and residual Au (III) concentration at time t (min), and m (g) is the dosage of FSUN used for each test.
To study the adsorption kinetics, the initial Au (III) concentration was fixed at 400 mg∙L−1 with the incubation time ranging from 30 min to 24 h. The adsorption data were fitted by the pseudo-first order and pseudo-second order kinetics model, respectively. The expressions of the above adsorption kinetics models are as Equations (3) and (4):
q t = q e ( 1 exp ( k 1 t ) )
q t = k 2 q e 2 t 1 + k 2 q e t
where k1 (min−1) and k2 (g∙mg−1∙t−1) are pseudo-first order kinetics rate constant and pseudo-second order kinetics rate constant, respectively.
The adsorption isotherms and thermodynamics were investigated by varying the initial Au (III) concentration from 100 mg∙L−1 to 1600 mg∙L−1, and the temperature ranged from 298 K to 318 K. The adsorption data were fitted by Langmuir and Freundlich models with expressions as Equations (5) and (6):
q e = K L q m C e 1 + K L C e
q e = K F C e 1 n F
where qm (mg∙g−1) is the theoretical maximum Au (III) uptakes, KL (L∙mg−1) is the Langmuir adsorption constant, KF and nF are the Freundlich adsorption parameters.

2.3. Reusability Study

In this work, to study the reusability of FSUN as adsorbents, 30 mg FSUN was incubated with 100 mg∙L−1 Au (III) solution initially. After each cycle, the used adsorbents were collected by magnetic separation. Then the metal-loaded adsorbents were eluted using 5 mL 0.02 M acidic thiourea three times (15 mL in total), then washed with 5 mL ultrapure water for three times (15 mL in total). The regenerated adsorbents were dried in vacuum oven at 80 °C overnight and reused for batch adsorption tests.

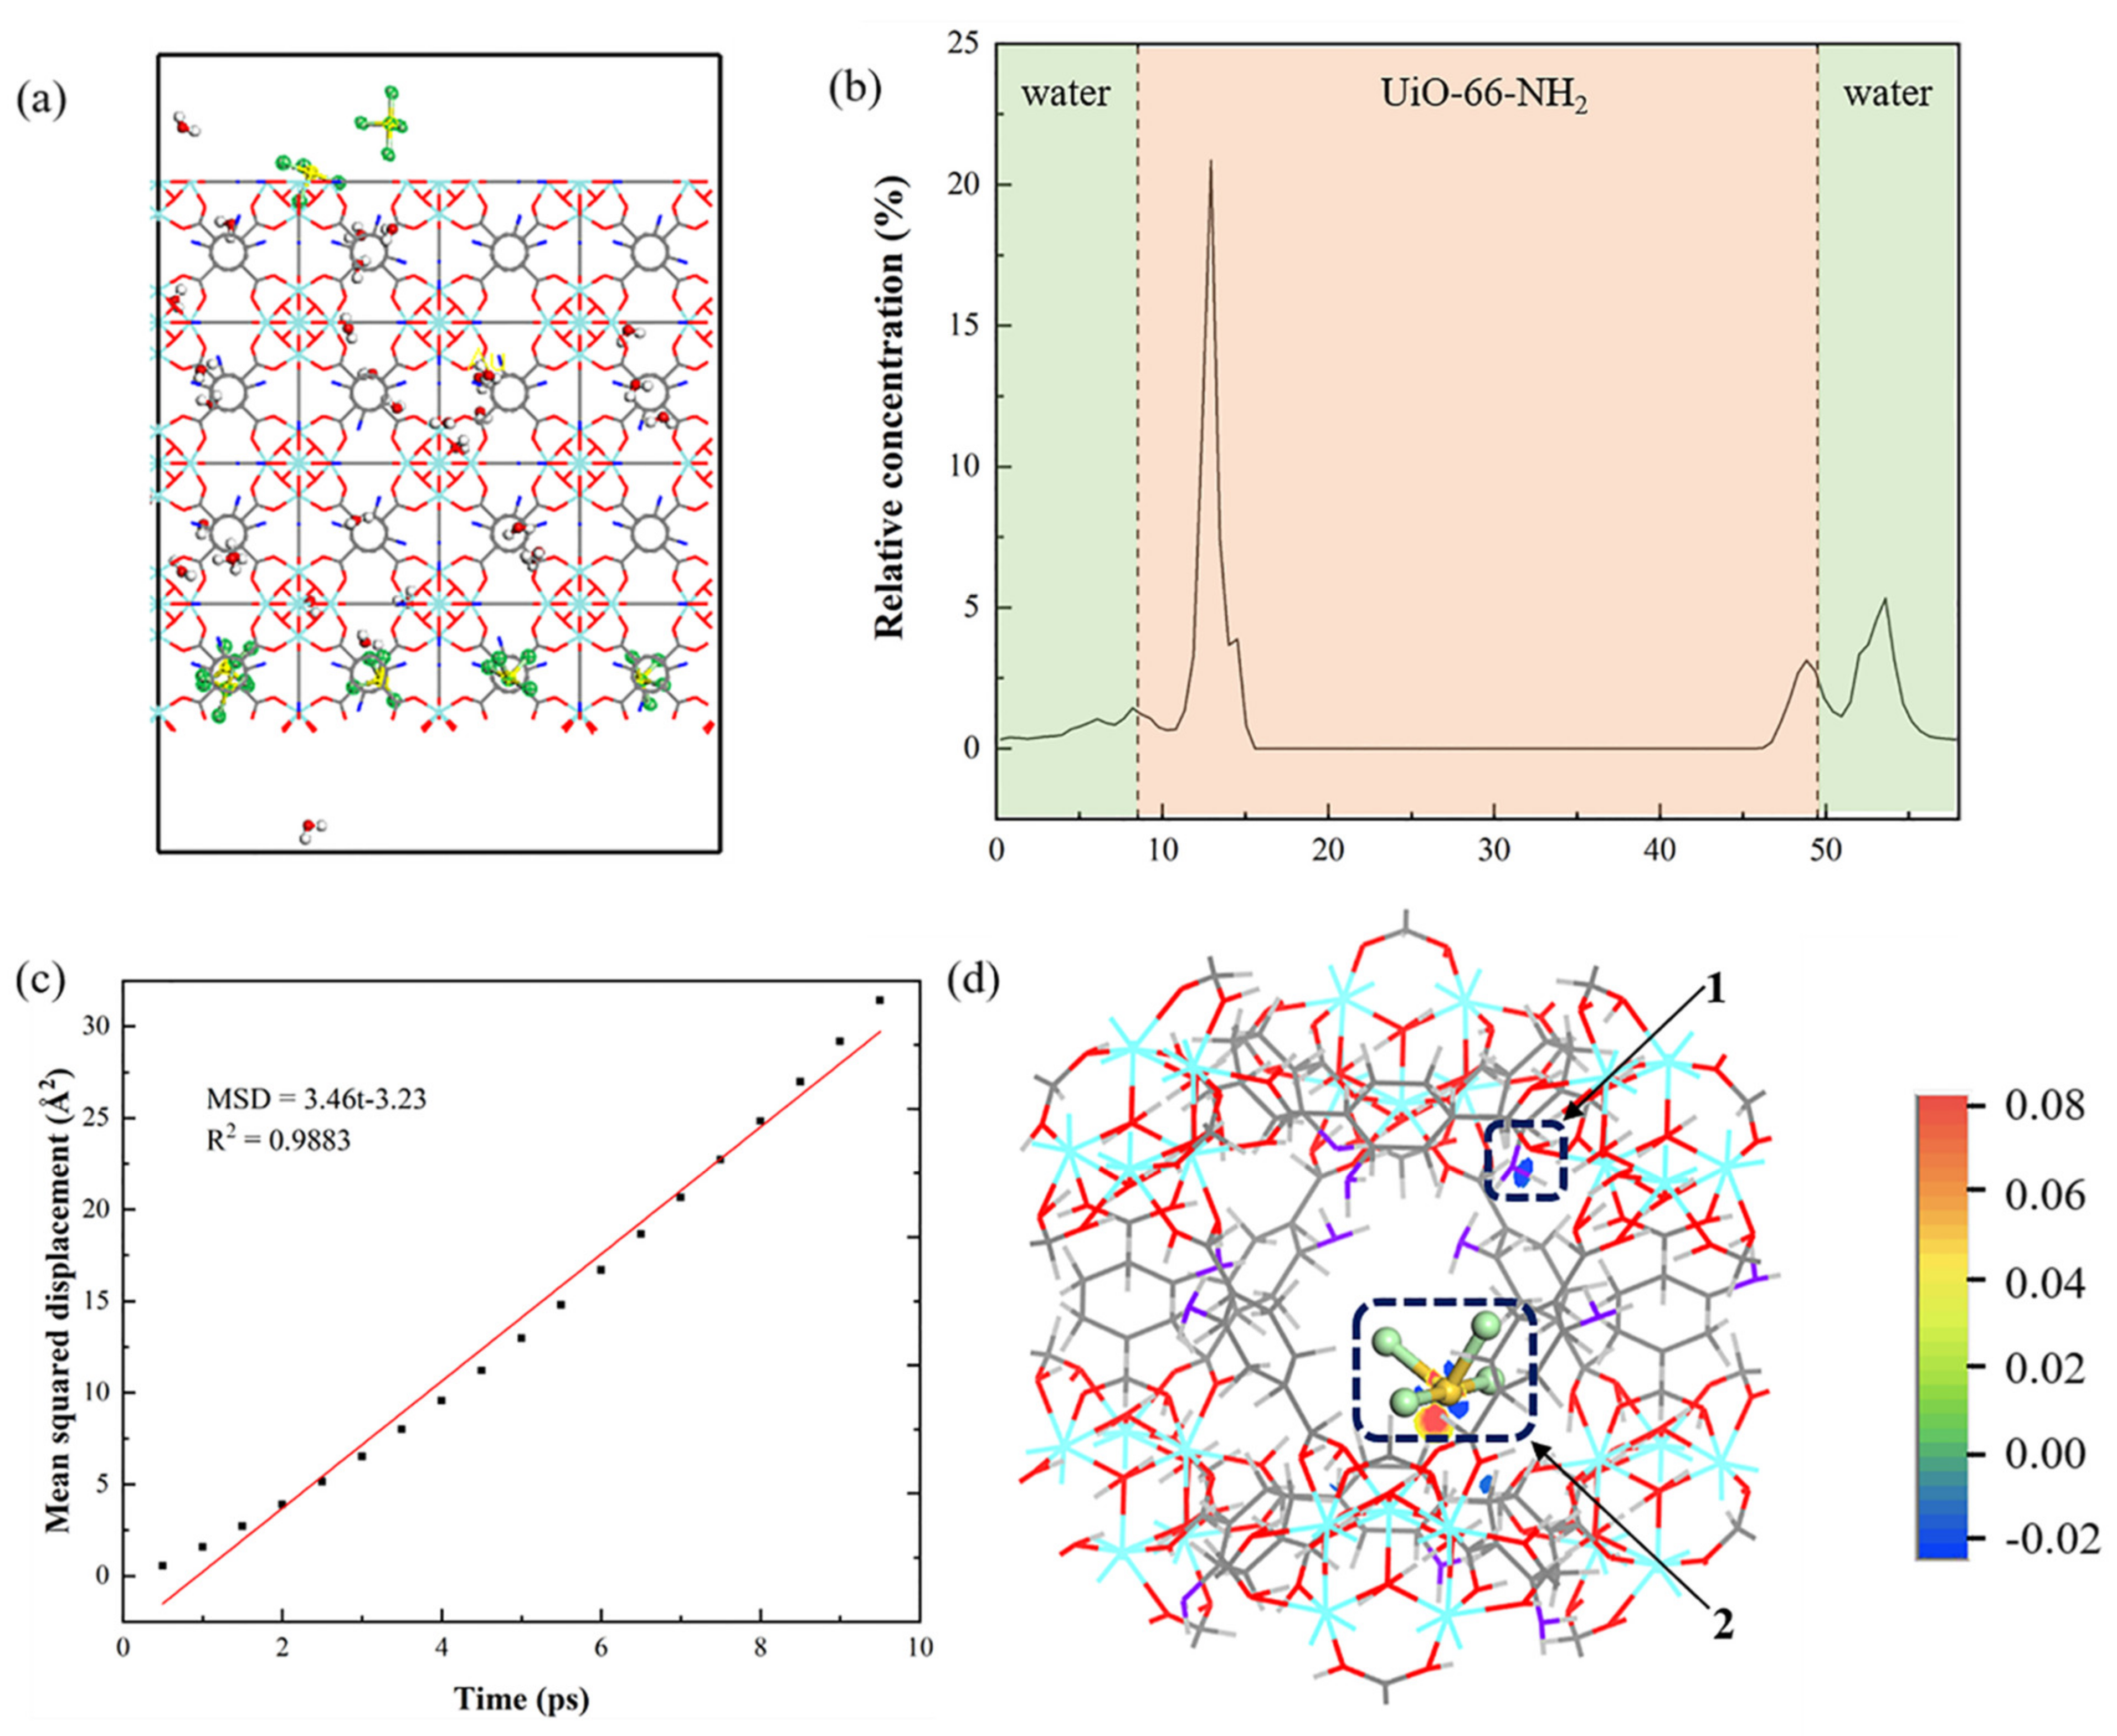
2.4. Computational Simulation

2.4.1. MDS Study

The crystallographic information file (cif) of UiO–66–NH2 used for MDS study was obtained from Cambridge Crystallographic Data Centre (CCDC) [21]. The molecular structure of AuCl4, H+ and H2O (Figure S1) were constructed by ChemDraw. The MDS study of AuCl4 adsorption by UiO–66–NH2 was carried out using the Forcite module installed in Materials Studio. Initially, a 2 × 2 × 2 supercell of UiO–66–NH2 with lattice length of 40.97 Å × 40.97 Å × 40.97 Å was built and geo-optimized. The guest molecules including 10 AuCl4 molecules, 10 H+ and 100 H2O molecules were put into a box through Amorphous Cell module. Then UiO–66–NH2 and guest molecules were put together to build a sandwich structure (Figure S1e) using the layer tool. The lattice length of this box was 40.97 Å × 40.97 Å × 58.07 Å. Geometry optimization was conducted using smart method and the threshold values for convergence tolerance were 0.001 kcal∙mol−1 for the maximum energy, 0.5 kcal∙mol−1∙Å−1 for the maximum force and 0.015 Å for maximum displacement. The adsorption dynamics was simulated using NVT ensemble and Nose thermostat at 298 K. The dynamics simulation completed within 500 ps at a timestep of 1.00 fs. During the dynamic simulation process, the Cartesian position of UiO–66–NH2 was fixed and only guest molecules were allowed to move freely. Universal Forcefield (UFF) was adopted in the whole process of geometry optimization and dynamics simulation.
Additionally, the dynamics behavior of AuCl4 adsorption was described and analyzed using mean squared displacement (MSD), which was calculated as Equation (7):
M S D ( t ) = 1 N i = 1 N ( | r i ( t + t 0 ) r ( t 0 ) | ) 2
where ri (t) is the position of atom i at time t and N is the amounts of atoms. Thereby, the diffusion coefficient (D) of guest molecules along the framework could be calculated using Equation (8) [22]:
D = 1 6 lim t d M S D d t

2.4.2. DFT Study

The DFT study was conducted using the CASTEP module installed in Materials Studio. The lowest energy was determined by Sorption locator. GGA/PBE functional was adopted for electron calculation and ultrasoft pseudopotential was used to study the interactions between guest molecules and UiO–66–NH2. The cutoff energy was set as 380 eV. In the meantime, the SCF tolerance of 1 × 10⁻⁵ eV∙atom−1 was adopted, with the maximum force and maximum displacement being 0.03 eV∙Å−1 and 0.001 Å, respectively.

3. Results and Discussion

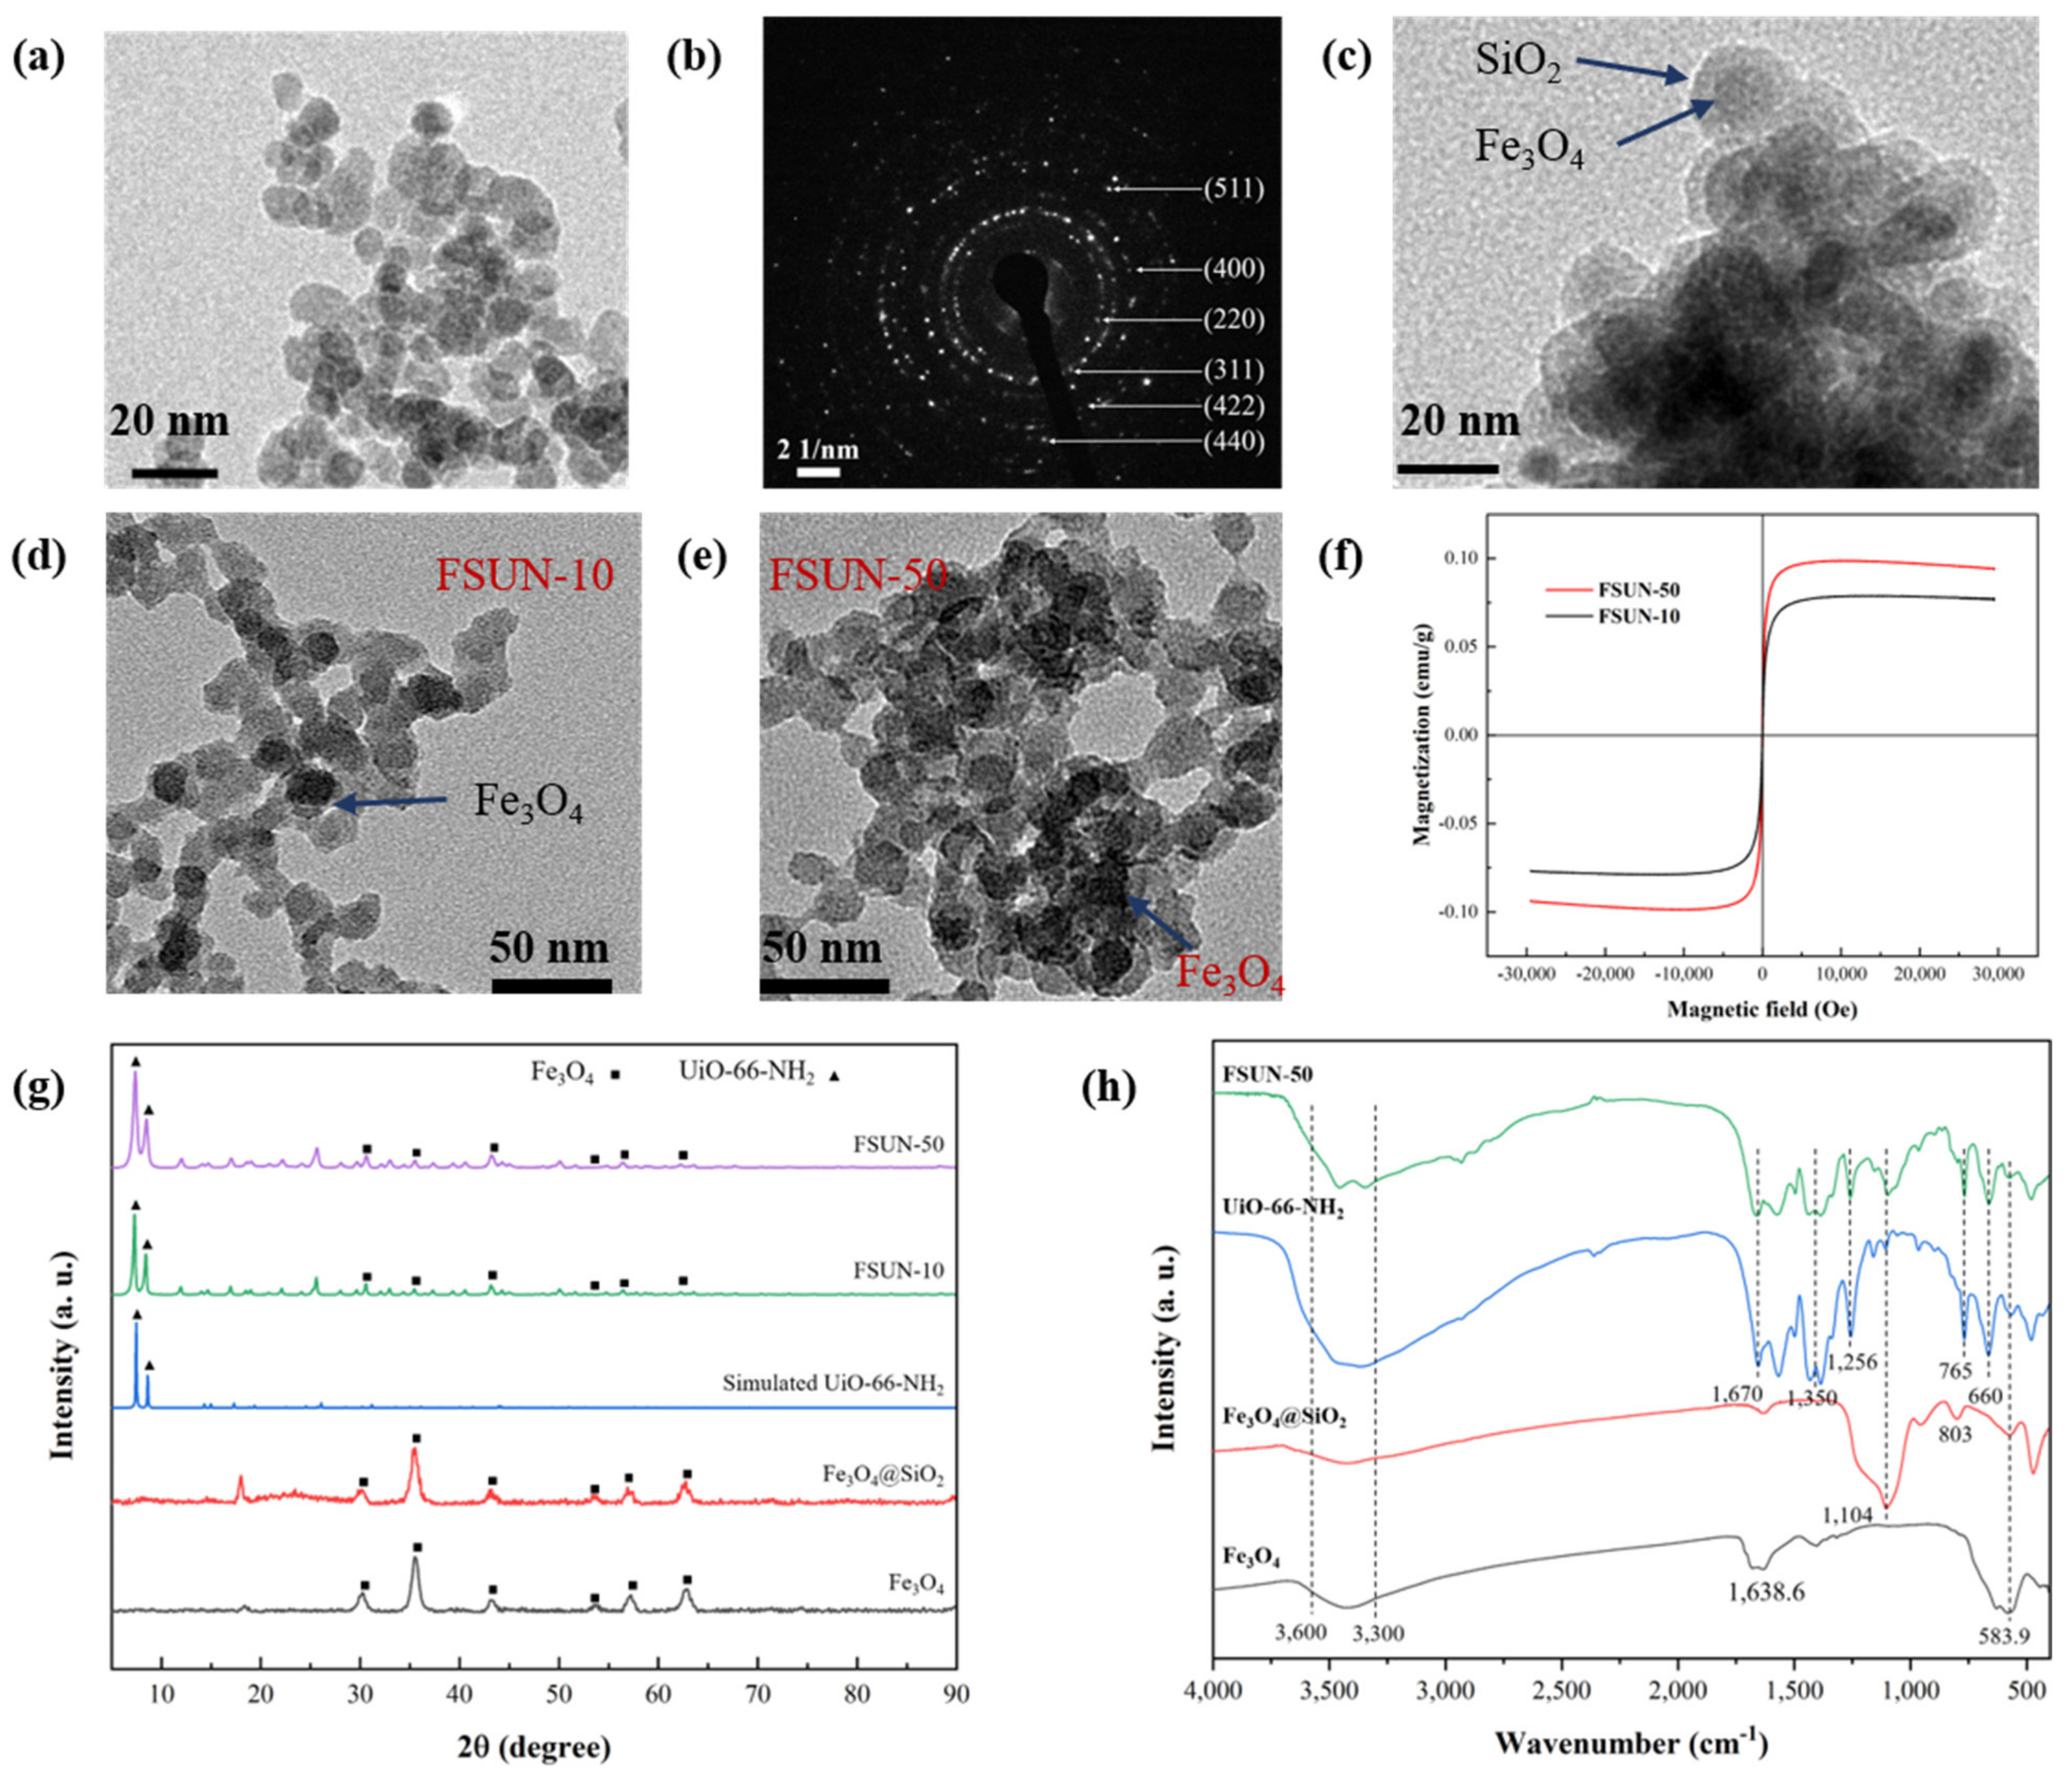
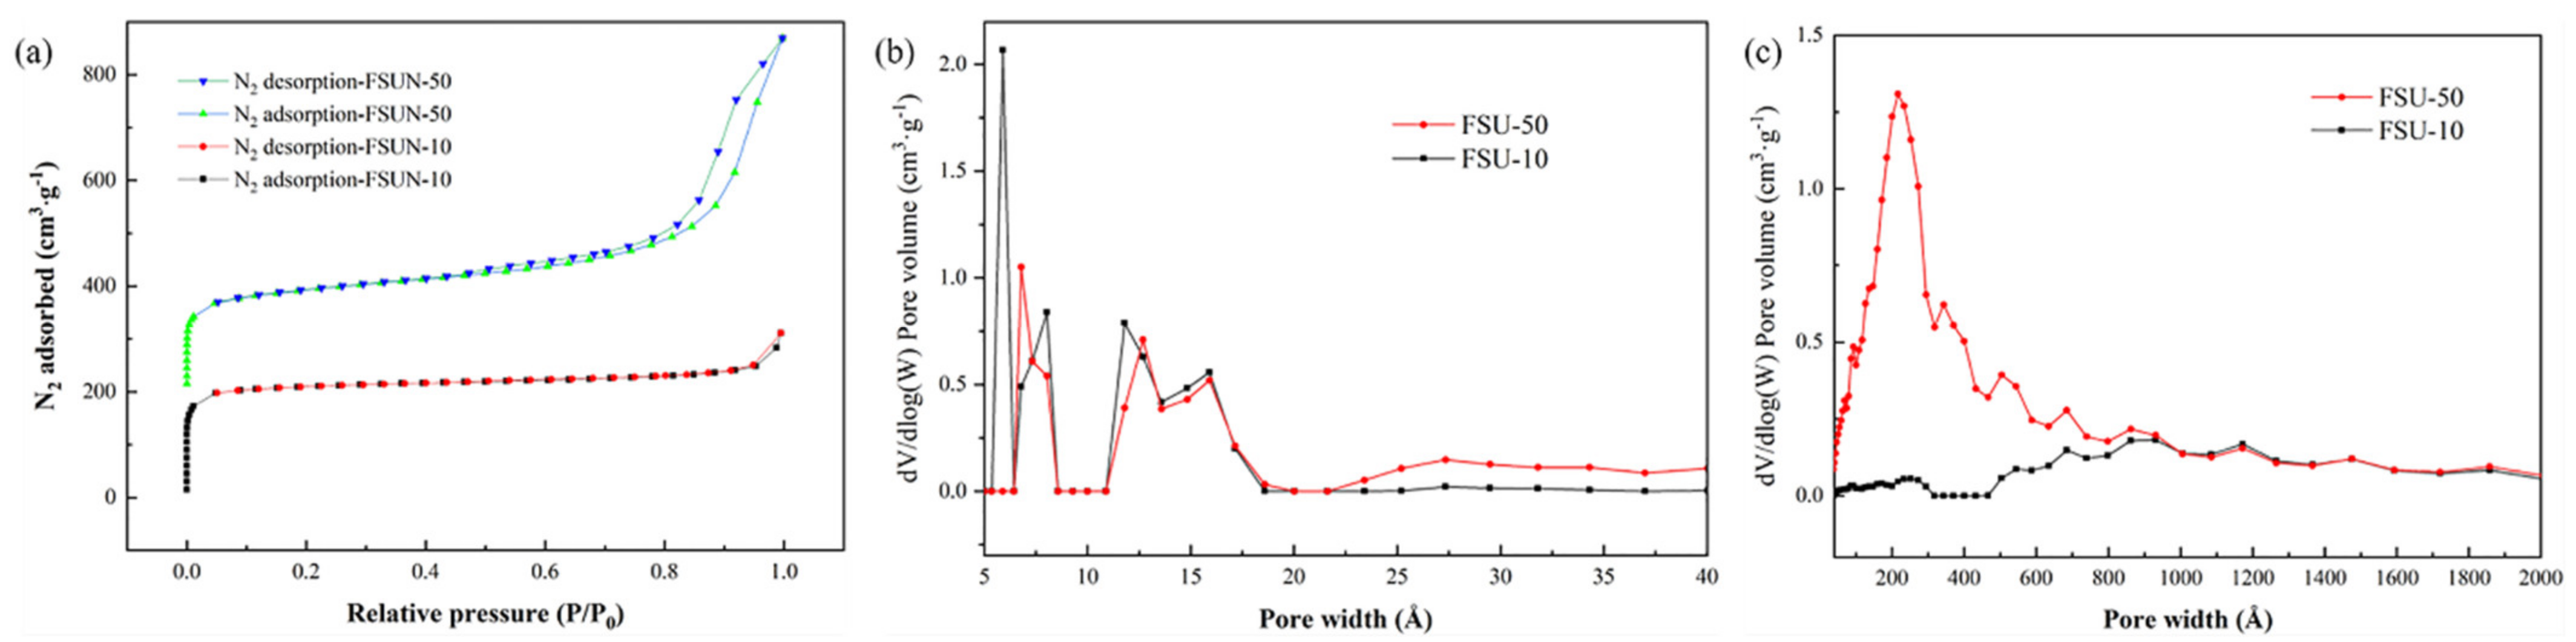
3.1. Synthesis and Characterization

The morphology of the obtained samples was characterized by TEM. The synthesized Fe3O4 nanoparticles were spherical with diameter of ~10 nm (Figure 1a). Obviously, Fe3O4 nanoparticles tended to agglomerate due to the good magnetism befitting from superparamagnetic Fe3O4. Figure 1b gives the selected area electron diffraction (SAED) of Fe3O4 nanoparticles. Fe3O4 particles presented typical polycrystalline phase characteristics, and the electron diffraction pattern was consistent well with dominant XRD diffraction peaks of crystalline Fe3O4 (Figure 1g). The TEM image of Fe3O4@SiO2 (Figure 1c) displayed a core-shell structure, and the silica shell could protect Fe3O4 nanoparticles in highly acidic solution, which is also the purpose of this work. Figure 1d,e show the TEM images of FSUN–10 and FSUN–50, respectively. As can be seen, Fe3O4@SiO2 distributed evenly in FSUN–10 while agglomerated in FSUN–50, suggesting that the amounts of magnetic nanoparticles could influence the structure of MOF composites. In the meantime, UiO–66–NH2 grew on the edge of magnetic nanoparticles or nanoclusters evidenced by TEM images. The EDX mapping of FSUN–50 (Figure S2) indicated that the magnetic MOF composites were composed of C, N, O, Zr, Fe and Si, which was in good agreement with the composition of chemicals used for material preparation. The magnetization curve (Figure 1f) indicated that the saturation magnetization value of FSUN–10 and FSUN–50 were measured to be 0.077 and 0.094 emu∙g−1, suggesting that the magnetism of MOF composites increased with the dosage of magnetic Fe3O4@SiO2 nanoparticles. As shown in Figure S2, a fast solid–liquid separation of FSUN can be achieved via magnetic separation (Figure S2), suggesting that the magnetic functionalized MOF composites can be retrieved in a facile manner instead of tedious high-speed centrifugation, which is beneficial to the industrial application of MOFs with lower cost and higher efficiency.
Figure 1g gives the XRD patterns of the obtained products. For Fe3O4, peaks at 2θ of 30.2°, 35.5°, 43.2°, 53.5°, 57.2° and 63.2° were ascribed to (2 2 0), (3 1 1), (4 0 0), (4 2 2), (5 1 1) and (4 4 0) planes of the spinal phase of Fe3O4 (JCPDS #19-0629) [23,24], indicating that the synthesized Fe3O4 possessed good crystallinity, which was consistent with the SAED results (Figure 1b). Moreover, the abovementioned characteristic peaks were also found in the XRD patterns of Fe3O4@SiO2, FSUN–10and FSUN–50, suggesting that Fe3O4 nanoparticles were successfully functionalized in the obtained products. The hump peaks at 2θ of 23° in the patterns of Fe3O4@SiO2 represented the amorphous SiO2 (JCPDS #39-1425) [25]. The XRD pattern of UiO–66–NH2 derived from crystallographic information was also presented in Figure 2. Peaks at 2θ = 7.36°, 8.48° were associated to the indices of (1 1 1) and (0 0 2) planes of the spinal phase of UiO–66–NH2 [21], which also existed in the patterns of FSUN–10 and FSUN–50, indicating that Fe3O4@SiO2 core was successfully introduced into UiO–66–NH2 without destroying the MOF structure.
Figure 1h shows the IR spectra of Fe3O4, Fe3O4@SiO2, UiO–66–NH2 and FSUN–50. The wide peak in the region of 3300~3600 cm−1 were assigned to the stretching vibrations of O-H and N-H from hydroxyl and amino groups. For the spectrum of Fe3O4, peak at 583.9 cm−1 was ascribed to the stretching vibration of Fe-O bond in bulk Fe3O4 [26], which could also be found in the spectrum of Fe3O4@SiO2 and FSUN–50. Peaks at 1104 cm−1 and 803 cm−1 were attributed to the stretching and bending vibration of Si-O-Si of SiO2 [27], indicating that SiO2 was successfully prepared in this work. As for UiO–66–NH2, peak at 1256 cm−1 referred to the stretching vibration of C-N bond, corresponding to the amino groups of NH2-BDC. Peaks at 765 and 660 cm−1 were attributed to the stretching vibration of Zr-O [28]. Furthermore, the abovementioned characteristic peaks such as Fe-O, Si-O-Si, C-N, Zr-O and benzene ring also existed in the spectrum of FSUN–50, suggesting that MOF composites composed of Fe3O4, SiO2 and UiO–66–NH2 were successfully prepared in this work, which was consistent with TEM and XRD analysis results.
The pore structure of FSUN–10 and FSUN–50was studied through N2 adsorption/desorption test and results are shown Figure 2. As revealed by Figure 2a, the adsorption of N2 onto FSUN–10 and FSUN–50complied with type I adsorption. The adsorption and desorption curves of FSUN–10 were in good agreement except at high relative pressure (P/P0 > 9.1) where small hysteresis loop was observed. While for the adsorption of N2 onto FSUN–50, big hysteresis loop existed when P/P0 > 0.8, suggesting that capillary condensation occurred due to the introduction of mesopores by magnetic nanoparticles. The Brunauer-Emmett-Teller (BET) surface area of FSUN–10 and FSUN–50 was 789.25 m2∙g−1 and 676.45 m2∙g1, respectively, indicating that the specific surface area of magnetic functionalized MOF composites decreased with the increase in magnetic nanoparticle dosage.
The pore volume of FSUN–10 (0.3832 cm3∙g−1) was smaller than that of FSUN–50 (0.8215 cm3∙g−1) due to the existence of mesopores in FSUN–50, verified by the subsequent pore size distribution (Figure 2b,c). The average pore diameter of FSUN–10 was 7.8 Å and 14.7 Å, corresponding to the octahedral pore (primitive cell) and cubo-octahedral pore of UiO–66–NH2 [29]. As for FSUN–50, in addition to the abovementioned micropores, mesopores with diameter of ~255 Å also existed, suggesting that capillary condensation occurred in FSUN–50, corresponding to the N2 adsorption/desorption curves (Figure 2a) and TEM images (Figure 1e).

3.2. Au (III) Adsorption by Magnetic Functionalized MOFs

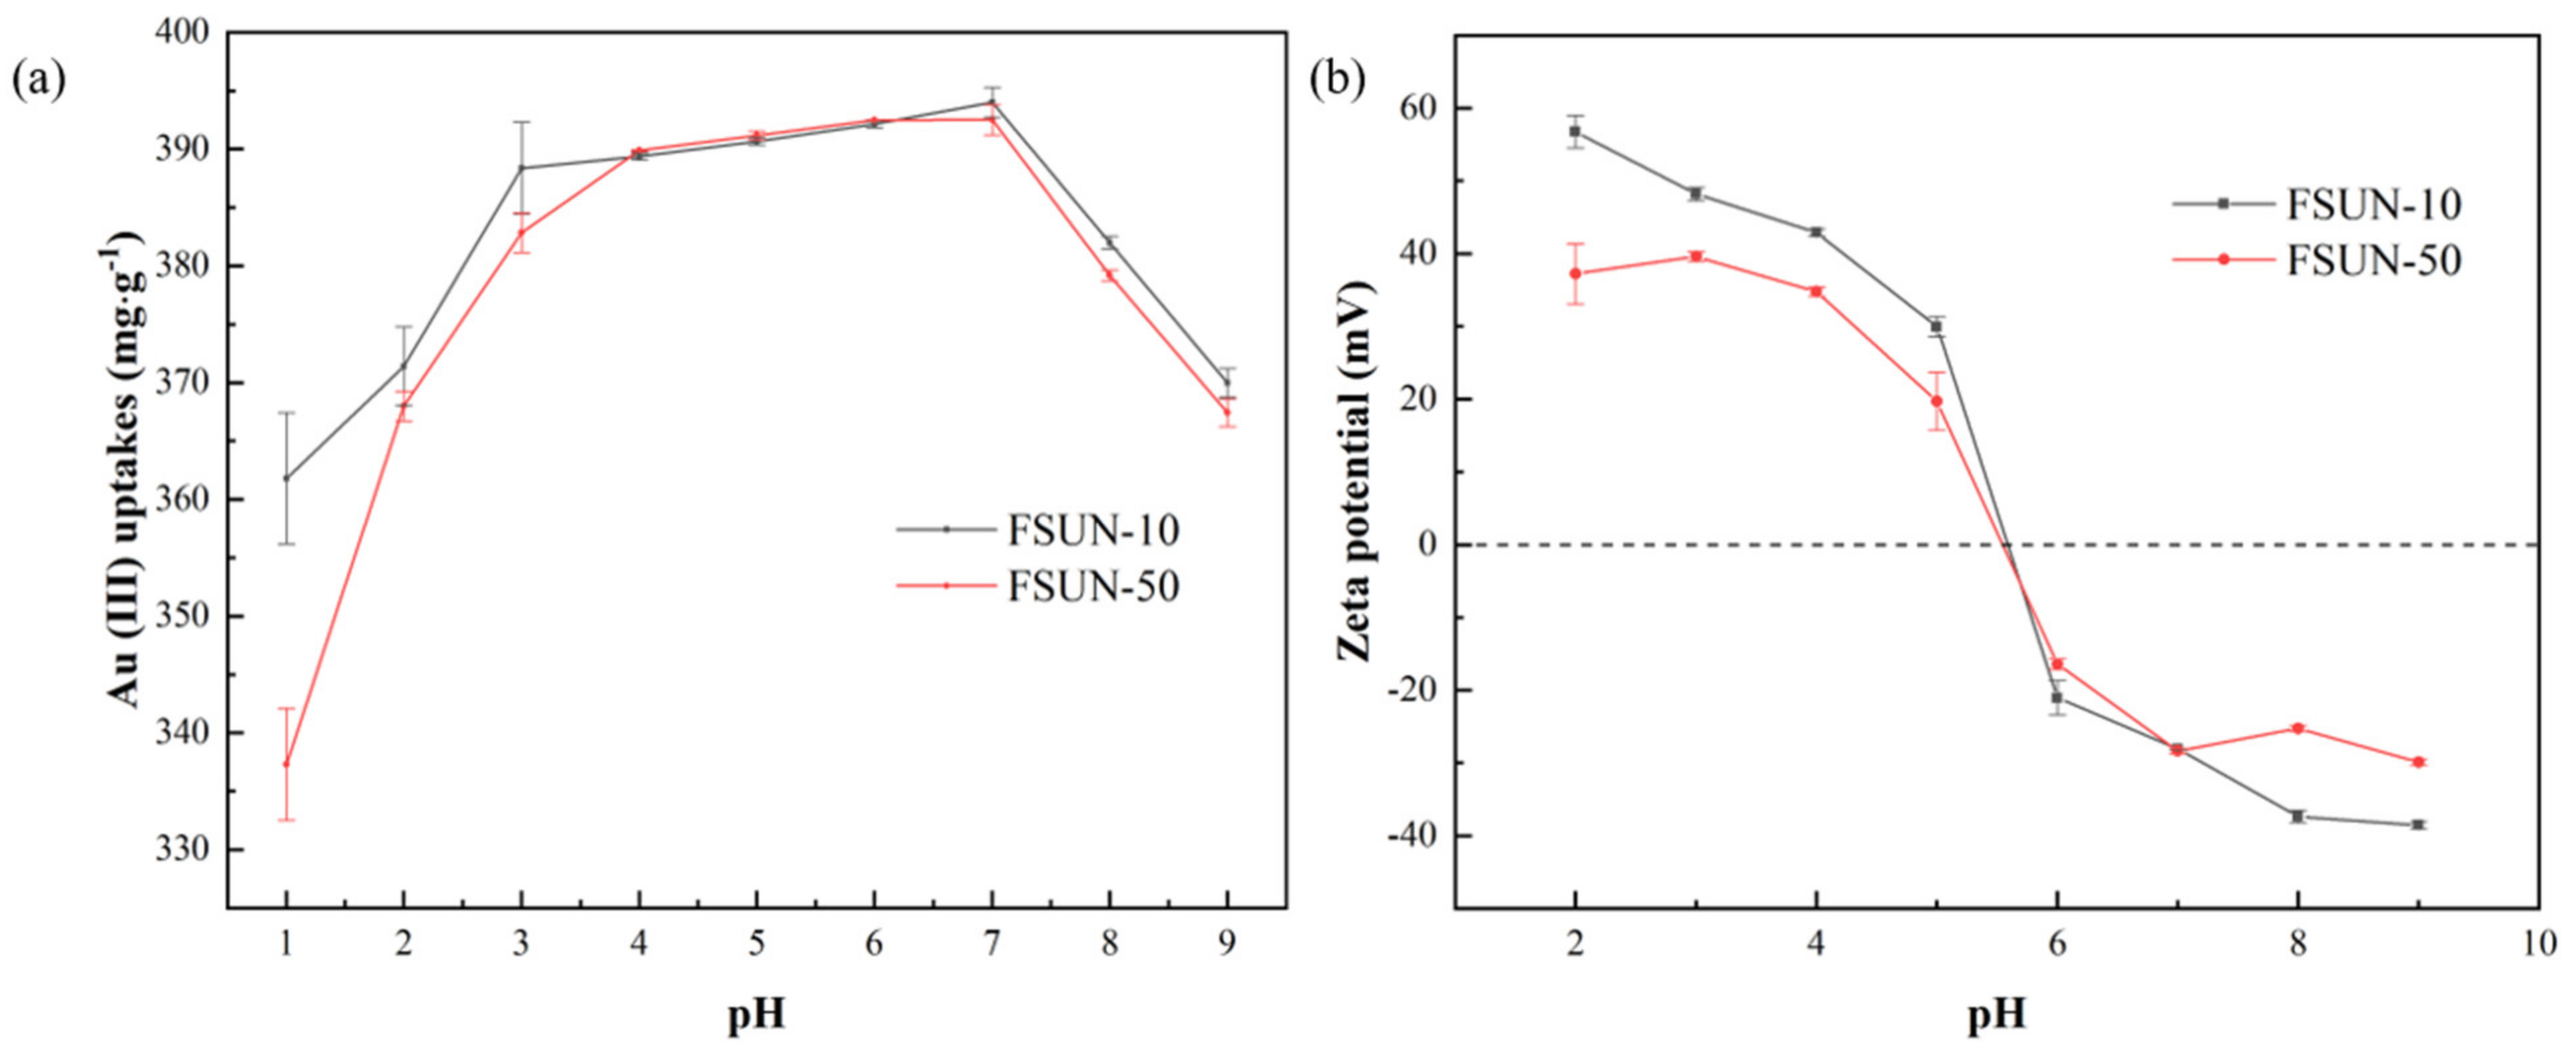
3.2.1. Effect of pH on Au (III) Adsorption

To study the effect of pH on Au (III) adsorption by FSUN–10 and FSUN–50, the initial Au (III) concentration was fixed at 400 mg∙L−1 and pH ranged from 1 to 9. As reported by Mironov et al. [30], Au (III) is prone to hydrolyze in aqueous solution as Equations (9) and (10):
A u C l 4 + H 2 O A u C l 3 ( H 2 O ) 0 + C l
A u C l 3 ( H 2 O ) 0 A u C l 3 O H 1 + H +
Additionally, the hydrolysis equilibrium constants K1, K2 are 10−5.1 and 10−0.7, respectively. By combining Equations (9) and (10), we can get Equation (11):
A u C l 4 + H 2 O A u C l 3 O H + H + + C l
The hydrolysis constant K3 = K1 × K2 = 10−5.8, and the species of Au (III) complex in aqueous solution can be determined using Equation (12):
R = [ A u C l 3 O H ] [ C l ] [ A u C l 4 ] [ H 2 O ] = K 3 [ H + ] = 10 5.8 [ H + ]
where [H2O] is assumed to be 1. The species of Au (III) complex in aqueous solution is determined by the pH value. In this work, the primary species of Au (III) complex in aqueous solution was AuCl4 in acidic solution when pH was smaller than 5.8, while hydrolyzed to be AuCl3OH when pH was bigger than 5.8.
Figure 3a shows that Au (III) uptakes by FSUN–10 and FSUN–50 initially increased rapidly as pH increased from 1 to 4, and the optimal adsorption was achieved at pH 4–7. After that, Au (III) uptakes decreased gradually at higher pH. It was reported by Chassary [31] that the ability of amino groups to react with Au was reduced in acidic solution due to protonation, and ion exchange and electrostatic interaction contributed to Au (III) uptakes. In this work, the interaction between AuCl4 and -NH3+ in acidic solution are as Equation (13) [32]:
R N H 3 + C l + A u C l 4 R N H 3 + A u C l 4 + C l
As shown in Figure 3b, the pHpzc of FSUN–10 and FSUN–50 was determined to be 5.58 and 5.54, respectively. Therefore, it can be concluded that in acidic solution, AuCl4 was adsorbed by FSUN through ion exchange and electrostatic attraction, while the protonation of amino groups reduced their ability to chelate Au (III). With an increase in pH, -NH3+ gradually deprotonated and the ability of amnio groups to chelate Au (III) was recovered, thus Au (III) uptakes also increased gradually. While in alkaline solution, Au (III) anions hydrolyzed to be AuCl3OH and both FSUN–10 and FSUN–50 were negatively charged, the electrostatic repulsion between AuCl3OH and FSUN prevented Au (III) adsorption, leading to the decrease in Au (III) uptakes. Therefore, pH study indicated that the electrostatic interaction between FSUN and Au (III) played a significant role in Au (III) adsorption and acidic environment is more favorable compared to alkaline environment.

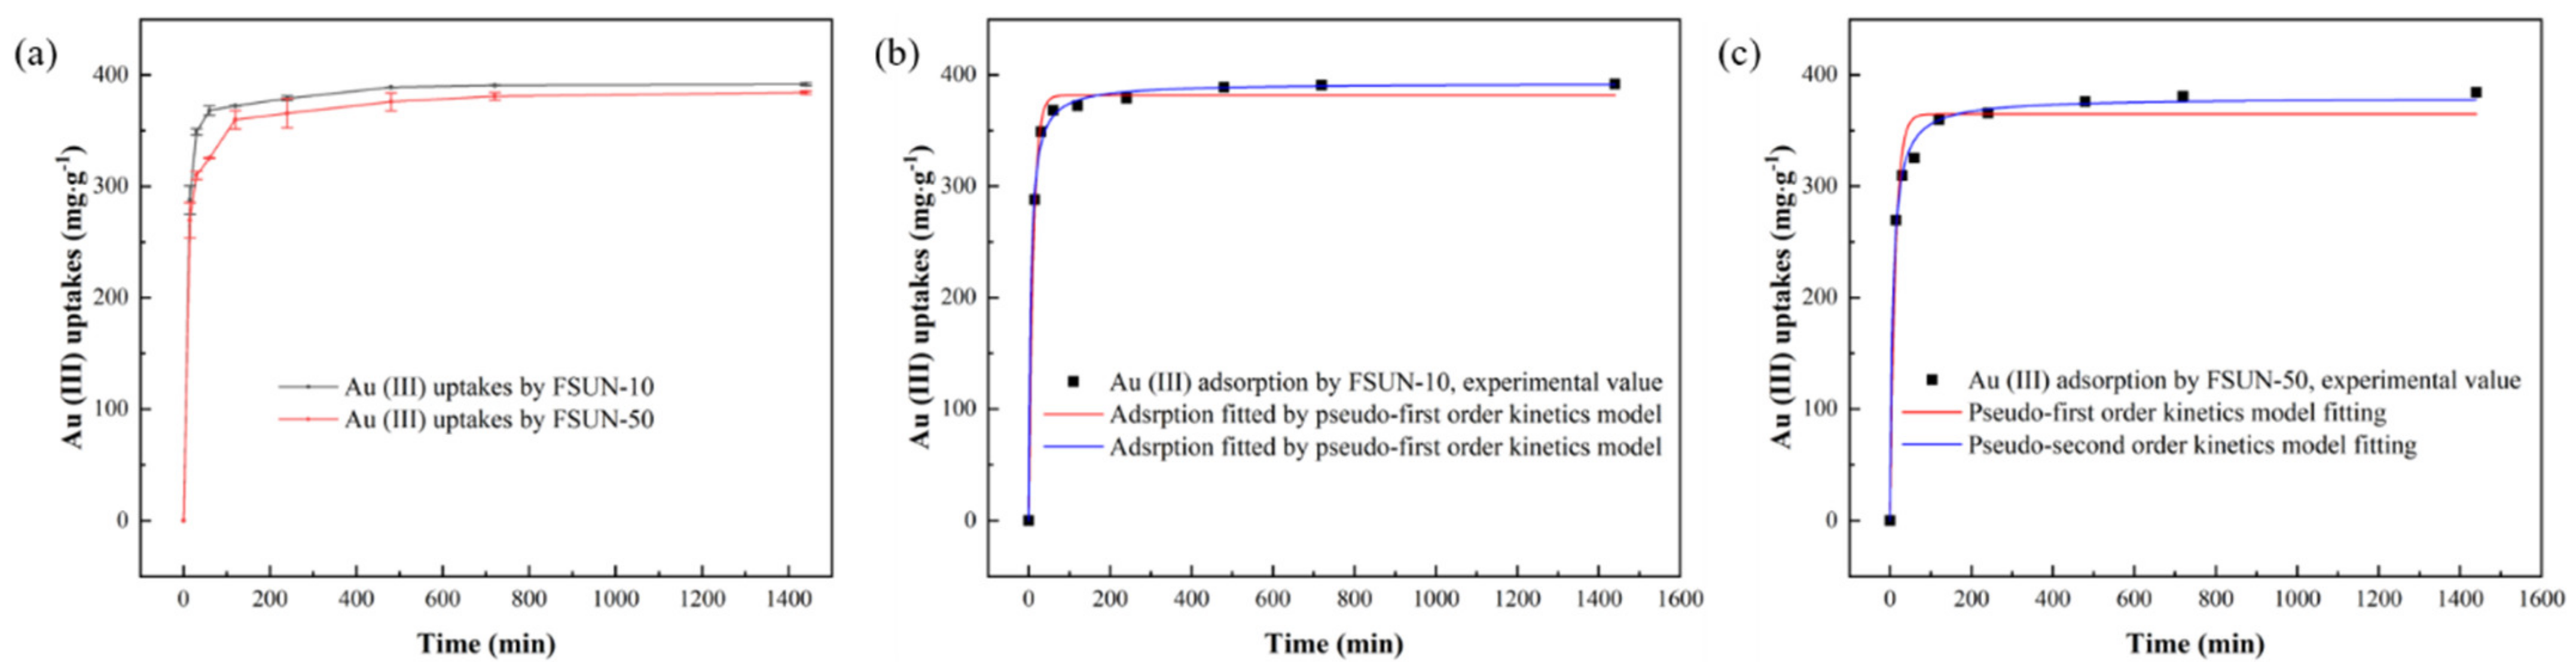
3.2.2. Adsorption Kinetics Study

The adsorption kinetics of Au (III) on FSUN was studied by examining the relationship between Au (III) uptakes and incubation time. The initial Au (III) concentration was kept at 400 mg∙L−1 with incubation time ranging from 0 to 1440 min. As Figure 4a reveals, Au (III) uptakes initially increased rapidly in the first 60 min, then gradually flattened out and finally plateaued after 480 min. The rapid capture of Au (III) could be attributed to the developed pore structure and sufficient adsorption sites provided by UiO–66–NH2. Since the majority species of Au (III) in chlorinated acidic solution are AuCl4 with effective size being 5.4 Å [33], which was much smaller than the pore diameter of FSUN–10 and FSUN–50, thus AuCl4 could diffuse conveniently in their internal pore. In the meantime, UiO–66–NH2 could provide sufficient adsorption sites (i.e., amino groups) for Au (III) at the initial stage, contributing to the fast adsorption at initial stage. And the adsorption rate gradually declined as the adsorption sites were employed.
To gain a deep insight into the adsorption kinetics, Au (III) uptakes were fitted to the incubation time using pseudo-first order kinetics model (Equation (3)) and pseudo-second order kinetics model (Equation (4)). And the adjusted fitting coefficients R2 and residual sum of squares (RSS) were used to evaluate the fitting reliability. Higher R2 and smaller RSS usually means higher predicting accuracy. Clearly, the predicted values by pseudo-second order kinetics model were closer to the experimental values than pseudo-first order kinetics model (Figure 4b,c), and R2 for pseudo-first order kinetics model and pseudo-second order kinetics model were 0.9951, 0.9975 for FSUN–10 and 0.9729, 0.9962 for FSUN–50 (Table 1), respectively. Moreover, the RSS values obtained by pseudo-second order kinetics model were smaller than pseudo-first order kinetics model. Therefore, pseudo-second order kinetics model could better describe the adsorption process, indicating that chemisorption was the rate-determining step.
Moreover, the kinetics constant for Au (III) uptakes by FSUN–10 were bigger than FSUN–50, suggesting that Au (III) uptakes by FSUN–10 was more quickly, verified by the shorter time taken to reach adsorption equilibrium, suggesting that the adsorption rate of Au (III) on FSUN decreased with an increase in the dosage of magnetic nanoparticles due to the reduced surface area and adsorption sites. In this work, the decrease in adsorption rate caused by magnetic functionalization was not so big and still within the acceptable range.

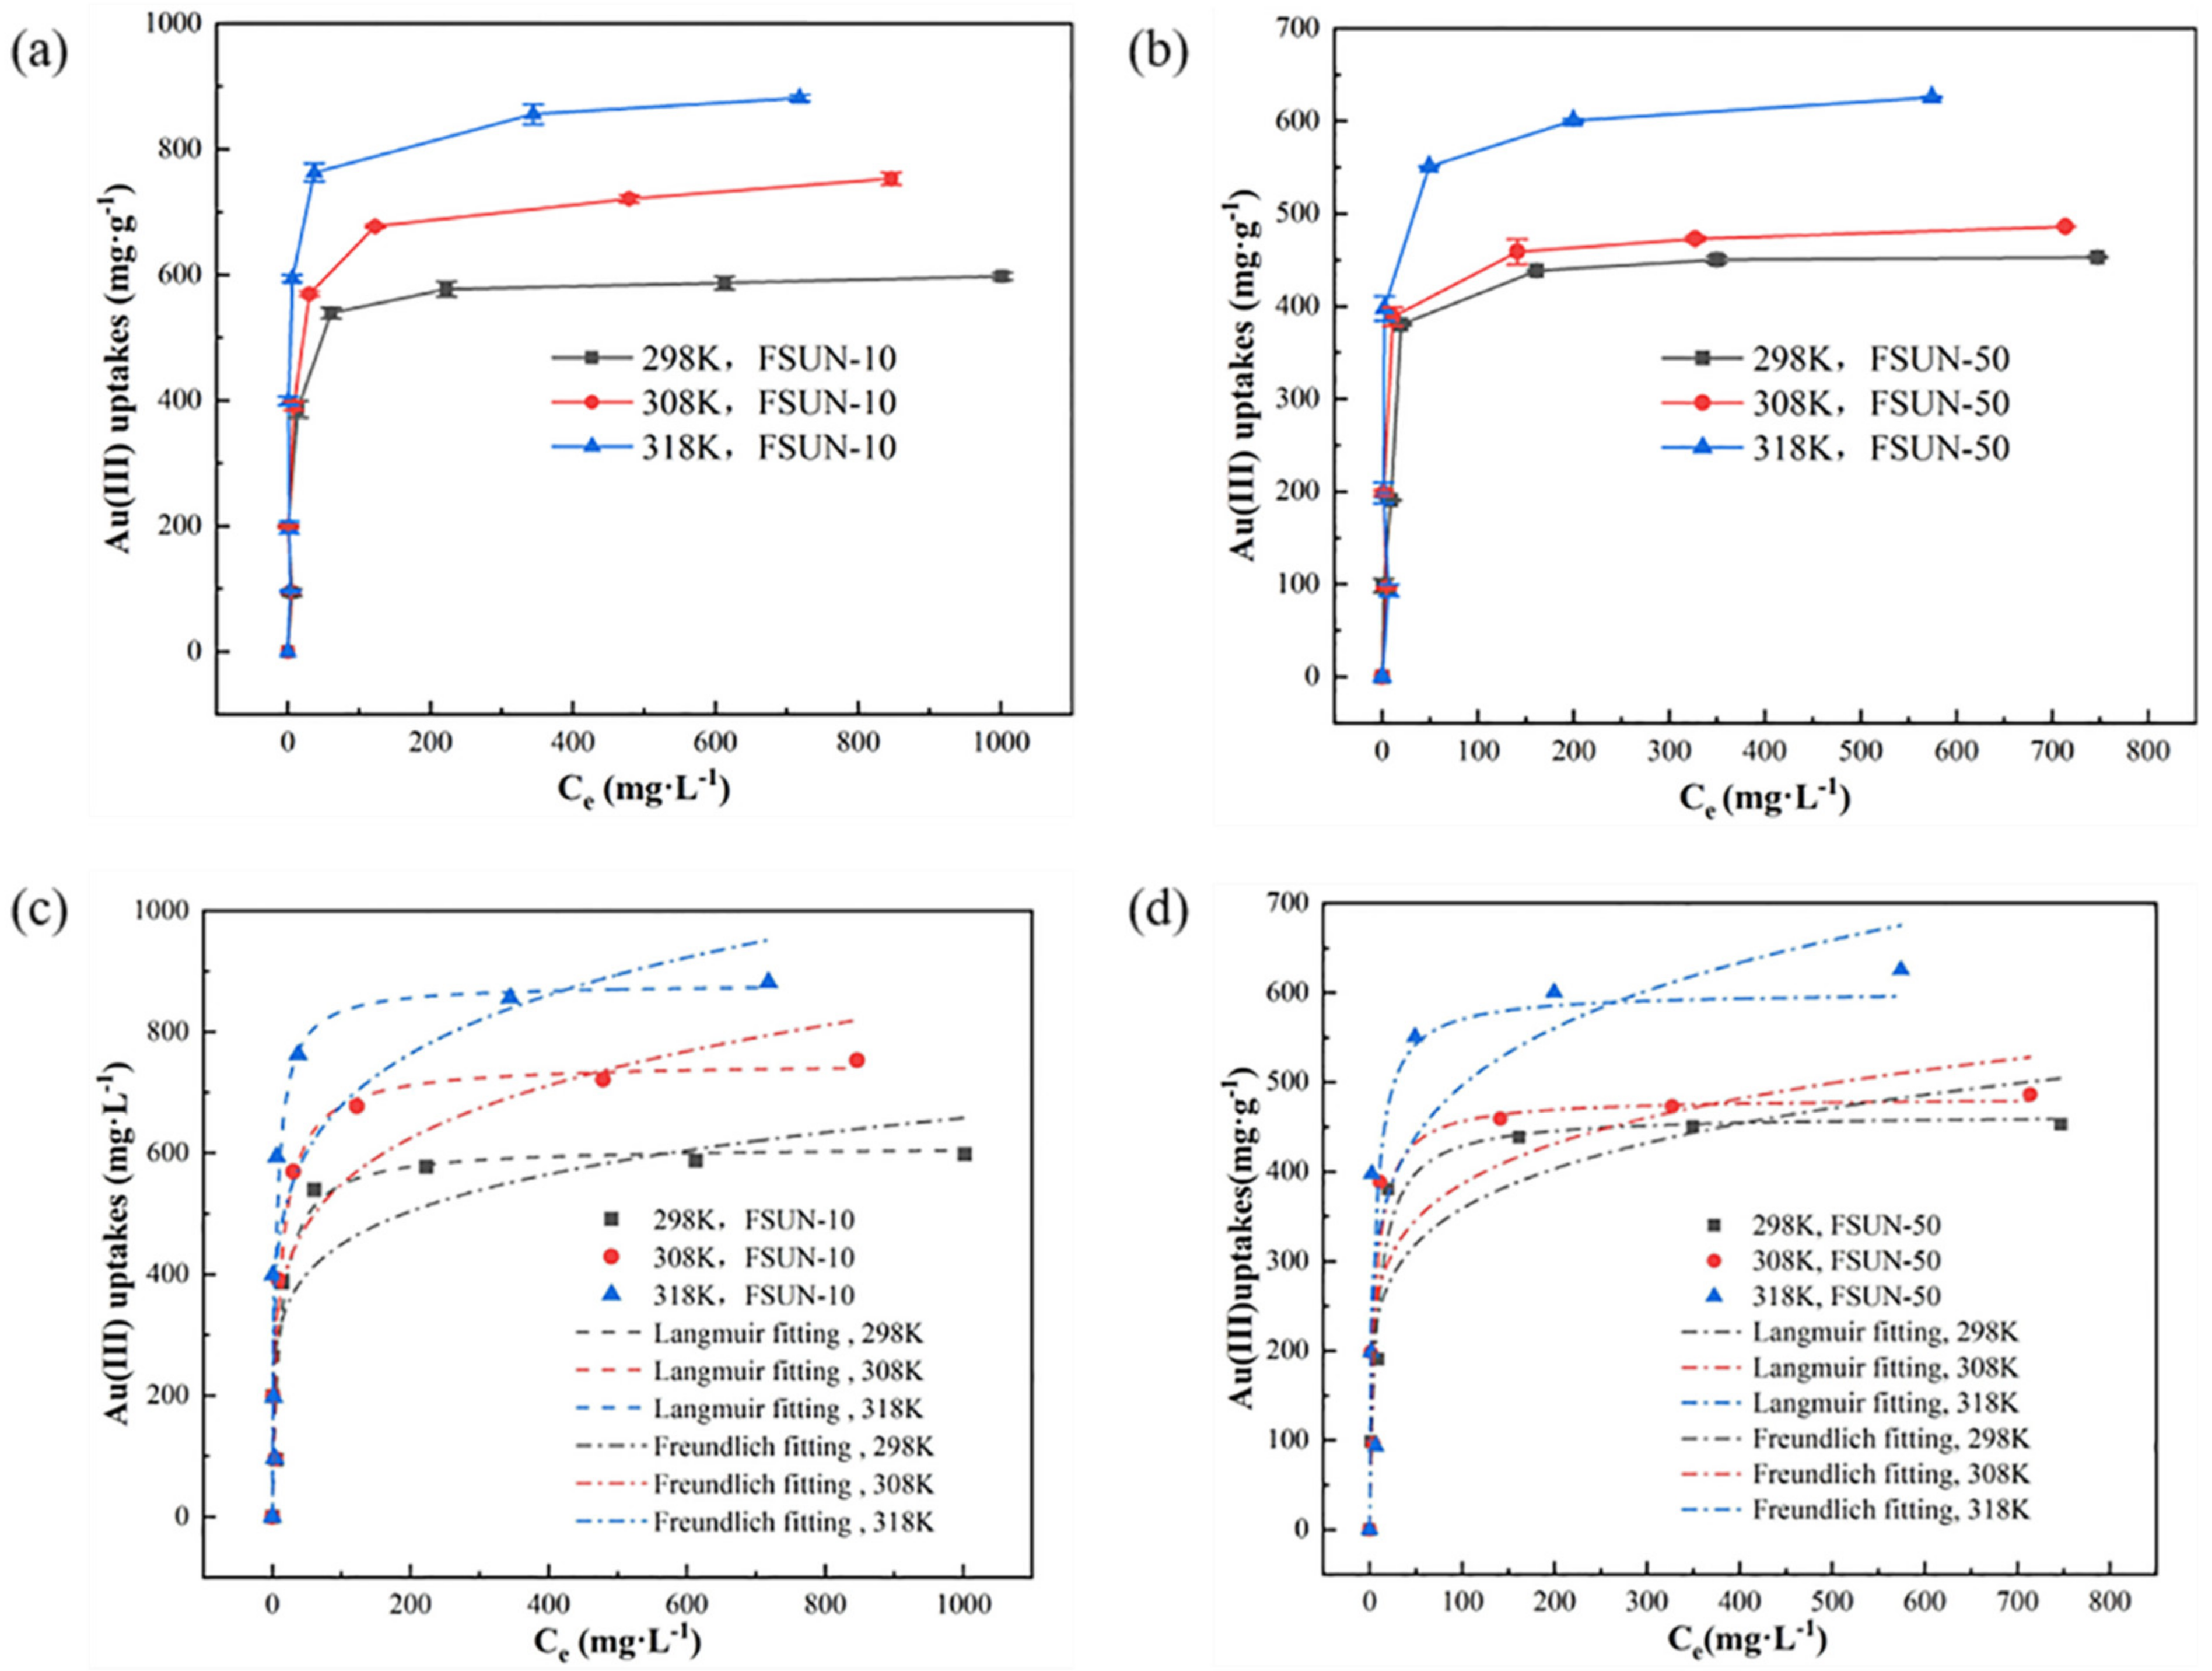
3.2.3. Adsorption Thermodynamics Study

To study the effect of initial concentration and temperature on Au (III) uptakes by FSUN, the adsorption test was conducted with initial Au (III) concentration varying from 0 to 1600 mg∙L−1, temperature ranging from 298 K to 318 K, and the incubation time was fixed at 1440 min. As shown in Figure 5a,b, Au (III) uptakes initially increased significantly as Au (III) concentration increased from 0 to 600 mg∙L−1, then the increase gradually slowed down and finally plateaued when reaching 800 mg∙L−1. In the meantime, Au (III) uptakes by FSUN increased with temperature, suggesting that the adsorption process was endothermic. Moreover, Au (III) uptakes by FSUN–10 and FSUN–50 were close at low initial concentration, while the difference in Au (III) uptakes enlarged with increasing initial concentration. This is because FSUN–10 could provide more adsorption sites for Au (III) than FSUN–50 due to less amounts of magnetic nanoparticles were introduced. Furthermore, Au (III) uptakes at different temperature were fitted to the residual Au (III) concentration using Langmuir and Freundlich adsorption models, and the fitting reliability was also evaluated by R2 and RSS. For both FSUN–10 and FSUN–50, Langmuir model fitted better than Freundlich model (Figure 5c,d), verified by bigger R2 and smaller RSS values obtained through Langmuir fitting (Table 2). Thus, it confirms that the adsorption isotherms of Au (III) by FSUN–10 and FSUN–50 were in better agreement with the Langmuir adsorption model, suggesting that Au (III) uptakes by FUSN were monolayer and homogeneous.
The maximum uptakes of Au (III) on some nanomaterials reported in the literature are summarized in Table 3. Obviously, compared to the pristine UiO–66–NH2 synthesized by authors in the previous work, the adsorption abilities of Zr-MOF composites decreased slightly after magnetic functionalization, which is expectable since magnetic functionalization reduced the overall surface area and the adsorption ability of Fe3O4@SiO2 towards Au (III) was smaller than MOFs [34]. This work is dedicated to achieving a convenient retrieval of MOF composites by sacrificing adsorption capacity within acceptable range. In the meantime, the magnetic functionalized MOF composites displayed superiority compared to other nanomaterials, which could be attributed to the developed pore structure, large surface area and abundant functional groups, thereby endowing magnetic MOFs sufficient adsorption sites and high binding ability for Au (III). Moreover, the convenient retrieval of magnetic functionalized MOF composites makes them promising in industrial application.

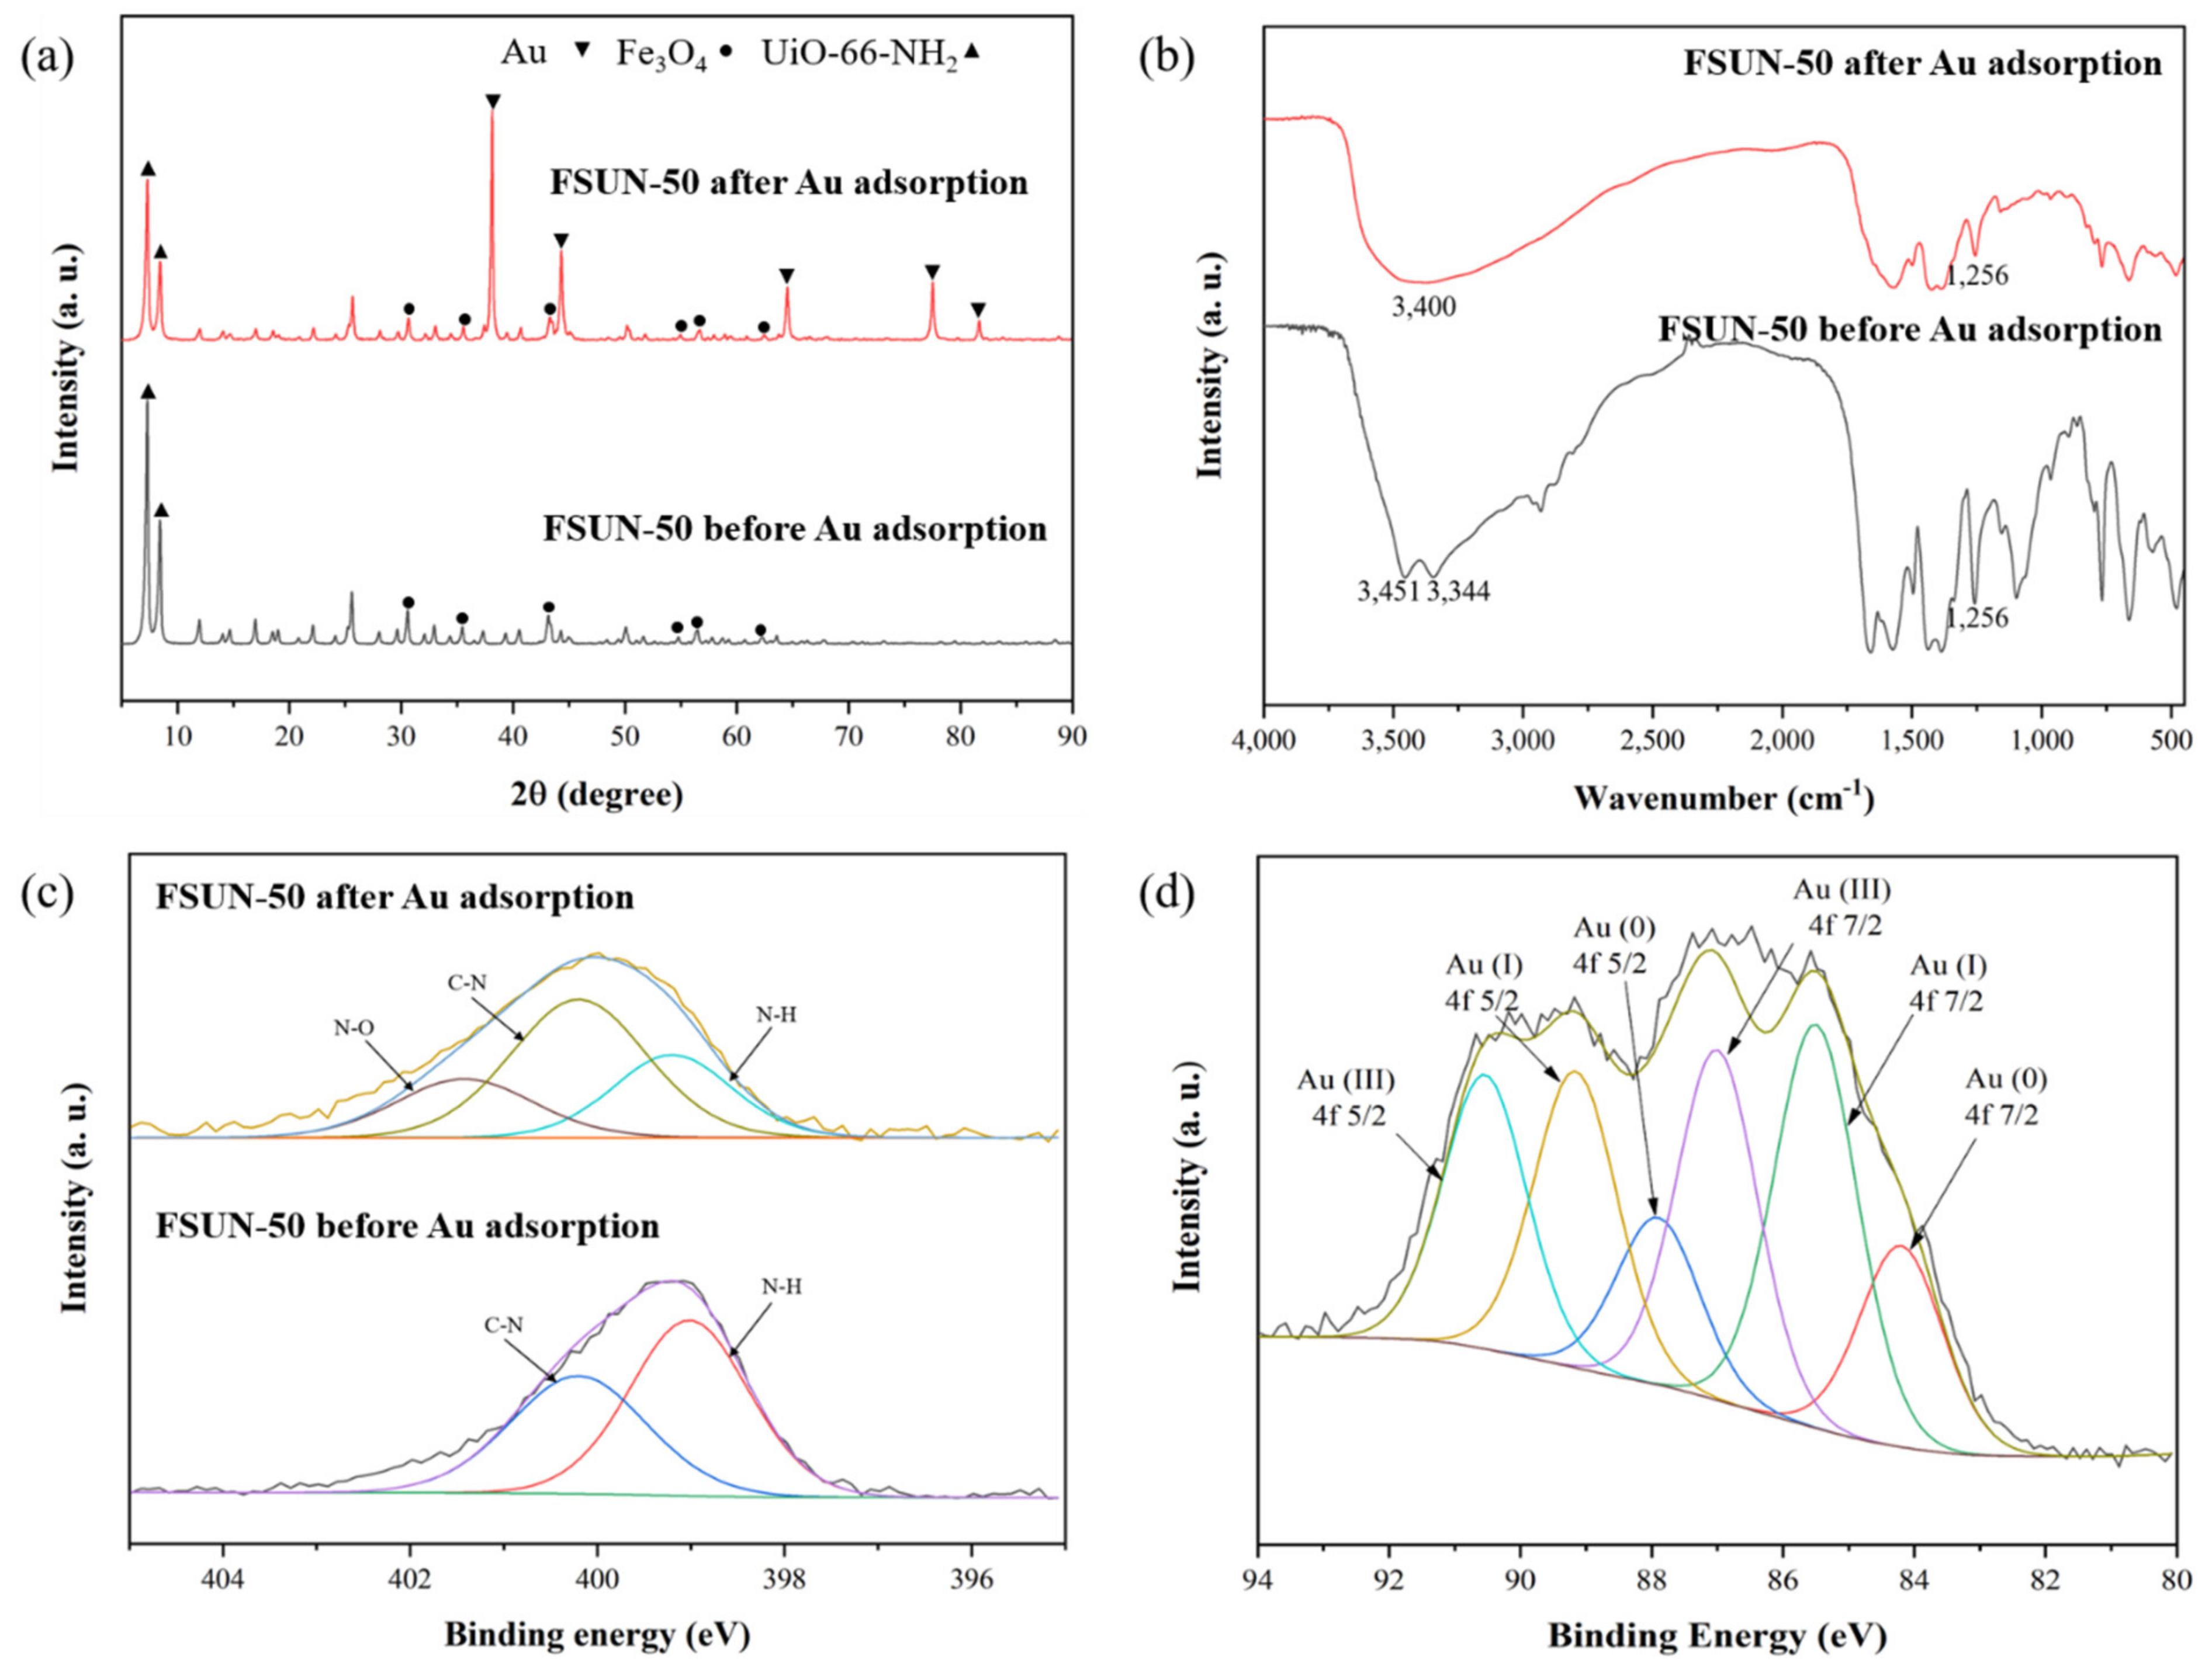
3.3. Mechanism Study

As presented above, FUSN showed excellent adsorption ability towards Au (III). Magnetic properties after Fe3O4@SiO2 functionalization rendered the composites enhanced operability indicated by easy separation. The overwhelmingly advantageous adsorption towards Au (III) can be ascribed to the inherent accessible pores in UiO–66–NH2. As FSUN–50 has balanced magnetic properties and good adsorption ability, it was selected as a more promising candidate for industrial application. Therefore, we used FSUN–50 as the model to investigate the underlying adsorption mechanism.
XRD patterns in Figure 6a show that new peaks were generated at 2θ = 38.18°, 44.39°, 64.56°, 77.55° and 81.72° after Au (III) adsorption, which were assigned to the (1 1 1), (0 0 2), (0 2 2), (1 1 3) and (2 2 2) planes of Au (0) (JCPDS #04-0784), respectively [16], indicating that Au (III) was reduced to Au (0) during the adsorption process. By comparing the IR spectra of FSUN–50 before and after Au (III) adsorption (Figure 6b), it was found that the stretching vibration of -OH and -NH at 3451 cm−1 and 3344 cm−1 merged into one wide peak at 3400 cm−1, which could be associated to the coordination of Au (III) to hydroxyl and amino groups [29]. Moreover, the stretching vibration of C-N at 1256 cm−1 decreased sharply after Au (III) adsorption, implying that amino groups was responsible for the reduction of Au (III) during adsorption due to its electron-donating property.
To further investigate the chemical interaction between Au (III) and amino groups, XPS survey scan and high-resolution scan of Au 4f and N 1s for FSUN–50 before and after Au (III) adsorption was conducted. XPS survey scan (Figure S3) results indicated that, before Au (III) adsorption, the synthesized FSUN–50 primarily consisted of elements including O, N, C, Zr and Si. Because XPS could only detect top 20 atomic layers which is roughly 10 nm, Fe located at the inner core was not found in the XPS survey scan spectra. In the meantime, after Au (III) adsorption, new peaks representing Cl 2p and Au 4f were detected by XPS survey scan, which could be ascribed to the adsorption of Au (III) chloride complex ions. In the high-resolution scan of N 1s (Figure 6c), the N 1s peak before Au (III) adsorption could be deconvoluted into peaks including N-H and C-N at 399.0 eV and 400.2 eV, respectively [39]. After Au (III) adsorption, peak representing N-H reduced significantly while a new peak emerged at 401.5 eV, which was attributed to the N-O bond. The results suggested that amino groups were oxidized during Au (III) adsorption, corresponding to the IR spectrum. Moreover, the high-resolution scan of Au 4f for FSUN–50 (Figure 6d) after adsorption showed that Au 4f peak could be further deconvoluted into peaks at 90.6 eV, 89.2 eV, 88.0 eV, 87.0 eV, 85.5 eV and 84.2 eV, corresponding to Au (III) 4f 5/2, Au (I) 4f 5/2, Au (0) 4f 5/2, Au (III) 4f 7/2, Au (I) 4f 7/2 and Au (0) 4f 7/2, respectively [40,41]. The results indicated that part of the adsorbed Au (III) was reduced to Au (I) and Au (0). By calculating the surface area of each sub-peak, the ratio of Au (0), Au (I) and Au (III) occupied 18.02%, 34.26% and 47.72, respectively. Thus, about 52.28% of Au (III) was reduced during adsorption.
With all these finding based on experimental data analysis, MDS and DFT study were performed to further study the adsorption behavior of AuCl4 on UiO–66–NH2 at the atomic and molecular level. Figure 7a shows the final configuration of the adsorption system with lowest energy. AuCl4, part of water molecules and H+ entered the UiO–66–NH2 framework, suggesting that AuCl4 could diffuse along the internal pore of UiO–66–NH2 and thus being adsorbed. Figure 7b gives the concentration profile of Au along the z axis of UiO–66–NH2 (0 0 1) plane, which could be further divided into three area, including the aqueous solution on both sides (green area, 0–8.5 Å and 49.5–58 Å) and UiO–66–NH2 in the middle (orange area, 8.5–49.5 Å). Peaks at z = 12.97 Å and 48.88 Å demonstrated that Au (III) entered into UiO–66–NH2, which agreed well with Figure 7a. To investigate the diffusion coefficient of AuCl4 along the framework of UiO–66–NH2, the mean squared displacement (MSD) of Au during the simulation process was studied and results are shown in Figure 7c. The MSD data were fitted by the linear model. According to Equation (8), the diffusion coefficient of Au (III) was determined to be 5.8 × 10⁻⁵ cm2∙s1.
Figure 7d shows the electron density difference of bonding atoms after AuCl4 adsorption on UiO–66–NH2. The red and blue color means electron acceptance and loss, respectively. N atoms from amino groups lost electrons during adsorption (area 1) while Au atoms accepted electrons (area 2), confirming that electrons transferred from amino groups to Au (III). It was verified in theory that amino groups contributed to the reduction of Au (III) to Au (I) and Au (0) during the adsorption process, which is in good correspondence with IR, XRD and XPS results.
Based on the previous findings achieved by batch adsorption test, experimental characterization and computational modelling, mechanisms underpinning Au (III) adsorption on FSUN could be summarized as follows. Initially, FSUN provides accessible pores and allows Au (III) to diffuse along its framework due to the developed pore structure and appropriate pore diameter. Then, Au (III) is adsorbed through ion exchange and is coordinated to the hydroxyl and amino groups, facilitated by the electrostatic attraction between -NH3+ and Au (III) anions. For Au (III) coordinated to amino groups, electrons transfer from amino groups to Au (III), resulting in the in-situ reduction of Au (III) to Au (I) and Au (0). Overall, the mechanism of Au (III) adsorption by FSUN incorporates diffusion, ion exchange, coordination, electrostatic interaction and reduction, and chemisorption is the rate-determining step, evidenced by the adsorption kinetics study.

3.4. Selectivity Study

Since Au (III) always coexist with impurity metal ions such as Cu2+, Ni2+, Co2+ and Zn2+ in aqueous solution after extraction of gold from e-waste through hydrometallurgy, the selectivity towards Au (III) is an important factor that must be considered in practice. In this work, to study the selectivity of magnetic MOFs, AuCl4 was mixed with Cu2+, Ni2+, Co2+ and Zn2+, and the concentration of all the metal ions was fixed at 200 mg∙L−1. Then, FSUN was incubated with the mixed solution to test the adsorption selectivity. The uptakes of Au (III) by FSUN–10 and FSUN–50 were 199.22 mg∙g−1 and 188.09 mg∙g−1, while the uptakes of Co2+, Cu2+, Ni2+ and Zn2+ by FSUN were all smaller than 50 mg∙g−1 (Figure S5), suggesting that FSUN possessed excellent adsorption priority towards Au (III) rather than impurity metal ions, which could be attributed to two reasons. At first, as shown in Figure 3b, FSUN were positively charged in the pH range of 1–5.6, preferring to adsorb AuCl4 due to electrostatic attraction, while the electrostatic repulsion between FSUN and cationic metal ions Cu2+, Ni2+, Co2+ and Zn2+ prevented the adsorption of co-existing metal ions. Secondly, as mentioned above, Au (III) was reduced to Au (I) and Au (0) by amino groups during adsorption, and the standard electrode potential of Au (III)|Au (I) and Au (III)|Au (0) was 1.50 eV and 1.41 eV, respectively, suggesting that Au (III) was prone to be reduced to Au (I) and Au (0). However, the standard electrode potential of Cu2+|Cu (0), Ni2+|Ni (0), Co2+|Co (0), Zn2+|Zn (0) was 0.34 eV, −0.25 eV, −0.28 eV, and −0.7628 eV, which was much smaller than Au (III)|Au (I) and Au (III)|Au (0). Therefore, the reduction of co-existing ions during adsorption was almost impossible. FSUN possessed high priority towards Au (III) than impurity metal ions in the adsorption process, making them ideal candidates as Au (III) adsorbent in practice.

3.5. Reusability Study

Reusability is a key factor that must be considered when assessing the availability of adsorbents in practice. In this work, the reusability of FSUN–10 and FSUN–50 was evaluated by recycling tests. As shown in Figure S6 for FSUN–10, the Au (III) uptakes decreased from 33.03 mg∙g−1 to 23.98 mg∙g−1 after five cycles, and the regenerated adsorbents retained 72.60% of the initial adsorption capacity. FSUN–50 performed better than FSUN–10 and 76.06% of initial adsorption ability remained after recycling five times. In addition, the TEM image of regenerated FSUN–50 (Figure S7) showed that no big changes happened to the micromorphology of this adsorbent, suggesting that FSUN had high stability during Au (III) adsorption. Overall, the reusability results indicated that FSUN displayed good adsorption ability towards Au (III) after multiple regeneration, commodifying the feasibility and excellent reusability of MOF composites in practice.

4. Conclusions

In this work, magnetic MOF composites were prepared to effectively adsorb Au (III) from aqueous solution and favor adsorbents retrieval. Effects of magnetic functionalization on the structural properties and adsorption performance of MOF composites, as well as the adsorption mechanisms were systematically investigated. Overall, magnetic functionalization introduced mesopores into MOF composites and enabled them to be rapidly retrieved via magnetic separation. pH was critical to Au (III) adsorption on FSUN by governing the ion exchange and electrostatic interaction between Au (III) anions and adsorbents, and the optimal adsorption capacities were achieved at pH 7. The kinetics and isotherms of Au (III) adsorption could be described by pseudo-second order kinetics model and Langmuir adsorption model, respectively. The maximum adsorption capacities of Au (III) by FSUN–10 and FSUN–50 were 611.18 mg∙g−1 and 463.85 mg∙g−1, respectively, which were slightly smaller than the pristine UiO–66–NH2 due to the reduced surface area and smaller adsorption capacity of Fe3O4@SiO2. Additionally, Au (III) uptakes increased with temperature, indicating that Au (III) adsorption on FSUN was endothermal. The thermodynamic studies indicated that the adsorption of Au (III) on FSUN was driven by the increase in system entropy. The adsorption mechanisms were investigated systematically through material characterization, MDS and DFT study. In addition to ion exchange and electrostatic interaction, Au (III) could be adsorbed via coordination to hydroxyl and amino groups and reduced to Au (I) and Au (0) by amino groups, which was verified by IR spectrum, XPS analysis and DFT study. The diffusion coefficient of AuCl4 in UiO–66–NH2 was calculated to be 5.8 × 10⁻⁵ cm2∙s−1. Moreover, FSUN showed excellent selectivity towards Au (III) and high adsorption ability after five cycles. FSUN–50, evaluated with balanced magnetic properties and adsorption capability, was considered to be a promising candidate applicable in industrial Au (III) recovery.

Supplementary Materials

The following supporting information can be downloaded at: https://www.mdpi.com/article/10.3390/ma15196531/s1, Figure S1: The initial configuration of AuCl4-, H2O, H+ and UiO–66–NH2 before adsorption dynamics simulation. The atoms of hydrogen, oxygen, nitrogen, carbon, zirconium, gold and chloride are colored as white, red, blue, grey, cyan, yellow and green; Figure S2: (a) EDX elemental mapping background of FSUN–50; (b–h): elemental distribution of C, O, Zr, Si, N of FSUN–50.; Figure S3: Magnetic separation of FSUN–10 (a) and FSUN–50 (b) by external magnet; Figure S4: XPS survey scan of FSUN–50 before and after Au (III) adsorption; Figure S5: Adsorption of Au (III), Co2+, Cu2+, Ni2+ and Zn2+ by FSUN–10 and FSUN–50; Figure S6: Au (III) uptakes by FSUN–10 and FSUN–50 as a function of recycling time (m = 30 mg, V = 10 mL, C0 = 100 mg∙L−1); Figure S7: TEM image of the regenerated FSUN–50.

Author Contributions

Conceptualization, Z.C.; Data curation, X.G. and L.Z.; Funding acquisition, Z.C. and Y.Z.; Investigation, X.G. and L.Z.; Methodology, Z.C. and J.W.; Writing—original draft, Z.C. All authors have read and agreed to the published version of the manuscript.

Funding

This work was financially supported by the National Natural Science Foundation of China (No. 52004020), Fundamental Research Funds for the Central Universities (No. 00007733), Open Foundation of State Key Laboratory of Mineral Processing (No. BGRIMM-KJSKL-2021-13).

Institutional Review Board Statement

Not applicable.

Informed Consent Statement

Not applicable.

Data Availability Statement

Not applicable.

Conflicts of Interest

The authors declare no conflict of interest.

References

  1. Wang, M.; Tan, Q.; Chiang, J.F.; Li, J. Recovery of rare and precious metals from urban mines—A review. Front. Environ. Sci. Eng. 2017, 11, 1–17. [Google Scholar] [CrossRef]
  2. Gu, F.; Summers, P.A.; Hall, P. Recovering materials from waste mobile phones: Recent technological developments. J. Clean. Prod. 2019, 237, 117657. [Google Scholar] [CrossRef]
  3. Chen, W.; Geng, Y.; Hong, J.; Dong, H.; Cui, X.; Sun, M.; Zhang, Q. Life cycle assessment of gold production in China. J. Clean. Prod. 2018, 179, 143–150. [Google Scholar] [CrossRef]
  4. Chang, Z.; Zeng, L.; Sun, C.; Zhao, P.; Wang, J.; Zhang, L.; Zhu, Y.; Qi, X. Adsorptive recovery of precious metals from aqueous solution using nanomaterials–A critical review. Co-ord. Chem. Rev. 2021, 445, 214072. [Google Scholar] [CrossRef]
  5. Ramirez-Muniz, K.; Song, S.; Berber-Mendoza, S.; Tong, S. Adsorption of the complex ion Au(CN)(2)(-) onto sulfur-impregnated activated carbon in aqueous solutions. J. Colloid Interface Sci. 2010, 349, 602–606. [Google Scholar] [CrossRef]
  6. Dong, Z.; Jiang, T.; Xu, B.; Yang, Y.; Li, Q. An eco-friendly and efficient process of low potential thiosulfate leaching-resin adsorption recovery for extracting gold from a roasted gold concentrate. J. Clean. Prod. 2019, 229, 387–398. [Google Scholar] [CrossRef]
  7. Tsuruta, T. Biosorption and recycling of gold using various microorganisms. J. Gen. Appl. Microbiol. 2004, 50, 221–228. [Google Scholar] [CrossRef]
  8. Ullman, A.M.; Brown, J.W.; Foster, M.E.; Léonard, F.; Leong, K.; Stavila, V.; Allendorf, M.D. Transforming MOFs for Energy Applications Using the Guest@MOF Concept. Inorg. Chem. 2016, 55, 7233–7249. [Google Scholar] [CrossRef]
  9. Qi, X.; Chang, Z.; Zhang, D.; Binder, K.J.; Shen, S.; Huang, Y.S.; Liu, H. Harnessing surface-functionalized metal–organic frameworks for selective tumor cell capture. Chem. Mater. 2017, 29, 8052–8056. [Google Scholar] [CrossRef]
  10. Sun, K.; Li, L.; Yu, X.; Liu, L.; Meng, Q.; Wang, F.; Zhang, R. Functionalization of mixed ligand metal-organic frameworks as the transport vehicles for drugs. J. Colloid Interface Sci. 2017, 486, 128–135. [Google Scholar] [CrossRef]
  11. Rizwan, M.; Rasool, H.; Sun, H.; Periasamy, V.; Tadé, M.O.; Wang, S. Journal of Colloid and Interface Science One-pot synthesis of binary metal organic frameworks (HKUST-1 and UiO-66) for enhanced adsorptive removal of water contaminants. J. Colloid Interface Sci. 2017, 490, 685–694. [Google Scholar] [CrossRef]
  12. He, J.; Cai, X.; Chen, K.; Li, Y.; Zhang, K.; Jin, Z.; Meng, F.; Liu, N.; Wang, X.; Kong, L.; et al. Performance of a novelly-defined zirconium metal-organic frameworks adsorption membrane in fluoride removal. J. Colloid Interface Sci. 2016, 484, 162–172. [Google Scholar] [CrossRef]
  13. Lin, J.-Y.; Lee, J.; Da Oh, W.; Kwon, E.; Tsai, Y.-C.; Lisak, G.; Phattarapattamawong, S.; Hu, C.; Lin, K.-Y.A. Hierarchical ZIF-decorated nanoflower-covered 3-dimensional foam for enhanced catalytic reduction of nitrogen-containing contaminants. J. Colloid Interface Sci. 2021, 602, 95–104. [Google Scholar] [CrossRef] [PubMed]
  14. Hu, C.; Xu, W.; Mo, X.; Li, H.; Zhou, S.; Zhang, P.; Tang, K. Efficient adsorption toward precious metal from aqueous solution by zeolitic imidazolate framework-8. Adsorption 2018, 24, 733–744. [Google Scholar] [CrossRef]
  15. Tang, J.; Zhao, J.; Wang, S.; Zhang, L.; Zhao, M.; Huang, Z.; Hu, Y. Pre-modification strategy to prepare a novel Zr-based MOF for selective adsorption of Palladium(II) from solution. Chem. Eng. J. 2020, 407, 127223. [Google Scholar] [CrossRef]
  16. Chang, Z.; Li, F.; Qi, X.; Jiang, B.; Kou, J.; Sun, C. Selective and efficient adsorption of Au (III) in aqueous solution by Zr-based metal-organic frameworks (MOFs): An unconventional way for gold recycling. J. Hazard. Mater. 2020, 391, 122175. [Google Scholar] [CrossRef]
  17. Hu, Y.; Huang, Z.; Liao, J.; Li, G. Chemical Bonding Approach for Fabrication of Hybrid Magnetic Metal–Organic Framework-5: High Efficient Adsorbents for Magnetic Enrichment of Trace Analytes. Anal. Chem. 2013, 85, 6885–6893. [Google Scholar] [CrossRef] [PubMed]
  18. Huang, L.; He, M.; Chen, B.; Hu, B. Magnetic Zr-MOFs nanocomposites for rapid removal of heavy metal ions and dyes from water. Chemosphere 2018, 199, 435–444. [Google Scholar] [CrossRef]
  19. Xiao, L.; Li, J.; Brougham, D.F.; Fox, E.K.; Feliu, N.; Bushmelev, A.; Schmidt, A.; Mertens, N.; Kiessling, F.; Valldor, M.; et al. Water-Soluble Superparamagnetic Magnetite Nanoparticles with Biocompatible Coating for Enhanced Magnetic Resonance Imaging. ACS Nano 2011, 5, 6315–6324. [Google Scholar] [CrossRef]
  20. Yang, Q.; Zhao, Q.; Ren, S.; Chen, Z.; Zheng, H. Assembly of Zr-MOF crystals onto magnetic beads as a highly adsorbent for recycling nitrophenol. Chem. Eng. J. 2017, 323, 74–83. [Google Scholar] [CrossRef]
  21. Øien SWragg, D.; Reinsch, H.; Svelle, S.; Bordiga, S.; Lamberti, C.; Lillerud, K.P. Detailed Structure Analysis of Atomic Positions and Defects in Zirconium Metal–Organic Frameworks. Cryst. Growth Des. 2014, 14, 5370–5372. [Google Scholar] [CrossRef]
  22. Abdi, N.; Abdi, Y.; Alemipour, Z.; NedaaeeOskoee, E. Chemical diffusion coefficient in dye sensitized solar cells as a function of porosity and surface roughness. Sol. Energy 2016, 135, 506–511. [Google Scholar] [CrossRef]
  23. Li, M.; Li, X.; Qi, X.; Luo, F.; He, G. Shape-Controlled Synthesis of Magnetic Iron Oxide@SiO2–Au@C Particles with Core–Shell Nanostructures. Langmuir 2015, 31, 5190–5197. [Google Scholar] [CrossRef]
  24. Wang, X.; Tu, Q.; Zhao, B.; An, Y.; Wang, J.-C.; Liu, W.; Yuan, M.-S.; Ahmed, S.M.; Xu, J.; Liu, R.; et al. Effects of poly(l-lysine)-modified Fe3O4 nanoparticles on endogenous reactive oxygen species in cancer stem cells. Biomaterials 2013, 34, 1155–1169. [Google Scholar] [CrossRef]
  25. Gao, M.; Li, W.; Dong, J.; Zhang, Z.; Yang, B. Synthesis and Characterization of Superparamagnetic Fe3O4@SiO2 Core-Shell Composite Nanoparticles. World J. Condens. Matter Phys. 2011, 1, 49–54. [Google Scholar] [CrossRef]
  26. Li, B.; Cao, H.; Shao, J.; Qu, M.; Warner, J.H. Superparamagnetic Fe3O4 nanocrystals@graphene composites for energy storage devices. J. Mater. Chem. 2011, 21, 5069–5075. [Google Scholar] [CrossRef]
  27. Jutarosaga, T.; Jeoung, J.S.; Seraphin, S. Infrared spectroscopy of Si–O bonding in low-dose low-energy separation by implanted oxygen materials. Thin Solid Films 2004, 476, 303–311. [Google Scholar] [CrossRef]
  28. Valenzano, L.; Civalleri, B.; Chavan, S.; Bordiga, S.; Nilsen, M.H.; Jakobsen, S.; Lillerud, K.P.; Lamberti, C. Disclosing the Complex Structure of UiO-66 Metal Organic Framework: A Synergic Combination of Experiment and Theory. Chem. Mater. 2011, 23, 1700–1718. [Google Scholar] [CrossRef]
  29. Lin, S.; Reddy DH, K.; Bediako, J.K.; Song, M.H.; Wei, W.; Kim, J.A.; Yun, Y.S. Effective adsorption of Pd(ii), Pt(iv) and Au(iii) by Zr(iv)-based metal–organic frameworks from strongly acidic solutions. J. Mater. Chem. A 2017, 5, 13557–13564. [Google Scholar] [CrossRef]
  30. Mironov, I.V.; Makotchenko, E.V. The Hydrolysis of AuCl 4– and the Stability of Aquachlorohydroxocomplexes of Gold(III) in Aqueous Solution. J. Solut. Chem. 2009, 38, 725–737. [Google Scholar] [CrossRef]
  31. Chassary, P.; Vincent, T.; Marcano, J.S.; Macaskie, L.E.; Guibal, E. Palladium and platinum recovery from bicomponent mixtures using chitosan derivatives. Hydrometallurgy 2005, 76, 131–147. [Google Scholar] [CrossRef]
  32. Ramesh, A.; Hasegawa, H.; Sugimoto, W.; Maki, T.; Ueda, K. Adsorption of gold(III), platinum(IV) and palladium(II) onto glycine modified crosslinked chitosan resin. Bioresour. Technol. 2008, 99, 3801–3809. [Google Scholar] [CrossRef]
  33. Ohkubo, Y.; Saito, T.; Murakami, Y.; Yokoyama, A.; Kawase, Y. Behavior of Impurities In and Cd in the LiNbO3-LiTaO3 System. Mater. Trans. 2002, 43, 1469–1474. [Google Scholar] [CrossRef]
  34. Zhang, Y.; Xu, Q.; Zhang, S.; Liu, J.; Zhou, J.; Xu, H.; Xiao, H.; Li, J. Preparation of thiol-modified Fe3O4@SiO2 nanoparticles and their application for gold recovery from dilute solution. Sep. Purif. Technol. 2013, 116, 391–397. [Google Scholar] [CrossRef]
  35. Wu, C.; Zhu, X.; Wang, Z.; Yang, J.; Li, Y.; Gu, J. Specific Recovery and In Situ Reduction of Precious Metals from Waste to Create MOF Composites with Immobilized Nanoclusters. Ind. Eng. Chem. Res. 2017, 56, 13975–13982. [Google Scholar] [CrossRef]
  36. Navarro, P.; Vargas, C.; Alonso, M.; Alguacil, F. The adsorption of gold on activated carbon from thiosulfate-ammoniacal solutions. Gold Bull. 2006, 39, 93–97. [Google Scholar] [CrossRef]
  37. Zhang, Y.-M.; Zhong, G.-Y.; Zhang, P.-Z. Chemical constituents isolated from Clematis akebioides (Maximowicz) Veitch. Biochem. Syst. Ecol. 2018, 83, 13–16. [Google Scholar] [CrossRef]
  38. Amaria, A.; Nuryono, N.; Suyanta, S. Preparation of L-Arginine-Modified Silica-Coated Magnetite Nanoparticles for Au(III) Adsorption. Orient. J. Chem. 2017, 33, 384–395. [Google Scholar] [CrossRef]
  39. Yan, X.; Xu, T.; Chen, G.; Yang, S.; Liu, H.; Xue, Q. Preparation and characterization of electrochemically deposited carbon nitride films on silicon substrate. J. Phys. D Appl. Phys. 2004, 37, 907–913. [Google Scholar] [CrossRef]
  40. Vitale, F.; Fratoddi, I.; Battocchio, C.; Piscopiello, E.; Tapfer, L.; Russo, M.V.; Polzonetti, G.; Giannini, C. Mono- and bi-functional arenethiols as surfactants for gold nanoparticles: Synthesis and characterization. Nanoscale Res. Lett. 2011, 6, 103. [Google Scholar] [CrossRef] [PubMed] [Green Version]
  41. Pramanik, G.; Humpolickova, J.; Valenta, J.; Kundu, P.; Bals, S.; Bour, P.; Dracinsky, M.; Cigler, P. Gold nanoclusters with bright near-infrared photoluminescence. Nanoscale 2018, 10, 3792–3798. [Google Scholar] [CrossRef] [PubMed] [Green Version]
Scheme 1. Synthesis of core-shell magnetic MOF composites.
Materials 15 06531 sch001
Figure 1. (a,b): TEM image and selected area electron diffraction of Fe3O4; (ce): TEM images of Fe3O4@SiO2, FSUN–10and FSUN–50; (f) the magnetization curves of FSUN–10and FSUN–50; (g) XRD patterns of Fe3O4, Fe3O4@SiO2, simulated UiO–66–NH2, FSUN–10and FSUN–50; (h) IR spectra of Fe3O4, Fe3O4@SiO2, UiO–66–NH2 and FSUN–50.
Materials 15 06531 g001
Figure 2. (a) N2 adsorption and desorption curves of FSUN–10 and FSUN–50; (b) pore size distribution of FSUN–10 and FSUN–50in the range of 5~40 Å; (c) pore size distribution of FSUN–10 and FSUN–50in the range of 75~2000 Å.
Materials 15 06531 g002
Figure 3. (a) Effect of pH on Au (III) uptakes by FSUN–10 and FSUN–50; (b) Effect of pH on the surface charge of FSUN–10 and FSUN–50.
Materials 15 06531 g003
Figure 4. (a) Effect of incubation time on Au (III) uptakes by FSUN–10 and FSUN–50; (b) Au (III) adsorption on FSUN–10 fitted by pseudo-first order and pseudo-second order kinetics model; (c) Au (III) adsorption on FSUN–50 fitted by pseudo-first order and pseudo-second order kinetics model.
Materials 15 06531 g004
Figure 5. Effect of temperature on Au (III) uptakes by FSUN–10 (a) and FSUN–50 (b); Au (III) adsorption on FSUN–10 (c) and FSUN–50 (d) fitted by Langmuir model and Freundlich model.
Materials 15 06531 g005
Figure 6. (a) XRD patterns and (b) IR spectra of FSUN–50 before and after Au (III) adsorption; high resolution scan of (c) N 1s and (d) Au 4f of FSUN–50 before and after Au (III) adsorption.
Materials 15 06531 g006
Figure 7. (a) The configuration after Au (III) adsorption with lowest energy; (b) the concentration profile of Au along the (0 0 1) plane of UiO–66–NH2; (c) the mean squared displacement and the fitted line of Au on UiO–66–NH2; (d) electron density difference of bonding motif after AuCl4 adsorption on UiO–66–NH2; the atoms of hydrogen, oxygen, nitrogen, carbon, zirconium, gold and chloride are colored as white, red, blue, grey, cyan, yellow and green, respectively.
Materials 15 06531 g007
Table 1. Kinetics parameters for Au (III) adsorption by FSUN–10 and FSUN–50.
Kinetics ModelParametersFSUN–10FSUN–50
Pseudo-first order kinetics modelqe/(mg·g−1)381.55364.79
k1/(min−1)0.090.0787
R20.99510.9729
RSS546.312806.34
Pseudo-second order kinetics modelqe/(mg·g−1)392.65379.51
k2/(g·mg−1·min−1)5.18 × 10−43.94 × 10−4
R20.99750.9962
RSS282.55391.17
Table 2. Isotherm parameters for Au (III) uptakes by FSUN–10 and FSUN–50.
T/KAdsorption Model Parameters FSUN–10FSUN–50
298 KLangmuirKL/(L·mg−1)0.08530.1213
qm/(mg·g−1)611.18463.85
R20.88130.9629
RSS41,983.886580.85
FreundlichKF209.52164.43
n6.045.90
R20.82320.8581
RSS625,272.8325,204.66
308 KLangmuirKL/(L·mg−1)0.09410.1788
qm/(mg·g−1)749.29485.97
R20.92890.8583
RSS37,860.0528,304.90
FreundlichKF230.39185.77
n5.316.29
R20.85140.8122
RSS79,124.6137,530.88
318 KLangmuirKL/(L·mg−1)0.18070.1834
qm/(mg·g−1)879.64601.56
R20.79410.7399
RSS151,483.9885,143.14
FreundlichKF306.98220.26
n5.815.67
R20.75160.6560
RSS182,795.22112,598.62
Table 3. Maximum Au (III) uptakes by nanomaterials, T = 298 K.
Nanomaterialsqmax (mg∙g−1)Ref.
UiO–66–NH2650[16]
FSUN–10611.18This work
FSUN–50463.85This work
UiO-66-TU326[35]
Activated carbon35.88[36]
Silica gel459.01[37]
Glycine modified crosslinked chitosan resin169.98[32]
Fe3O4@SiO2128.84[38]
Publisher’s Note: MDPI stays neutral with regard to jurisdictional claims in published maps and institutional affiliations.

