
Effect of Bimetallic-Activated Carbon Impregnation on Adsorption–Desorption Performance for Hydrogen Sulfide (H2S) Capture

 and
and
Abstract
:1. Introduction
2. Materials and Methods
2.1. Adsorbent Preparation
2.2. Characterization of Adsorbents
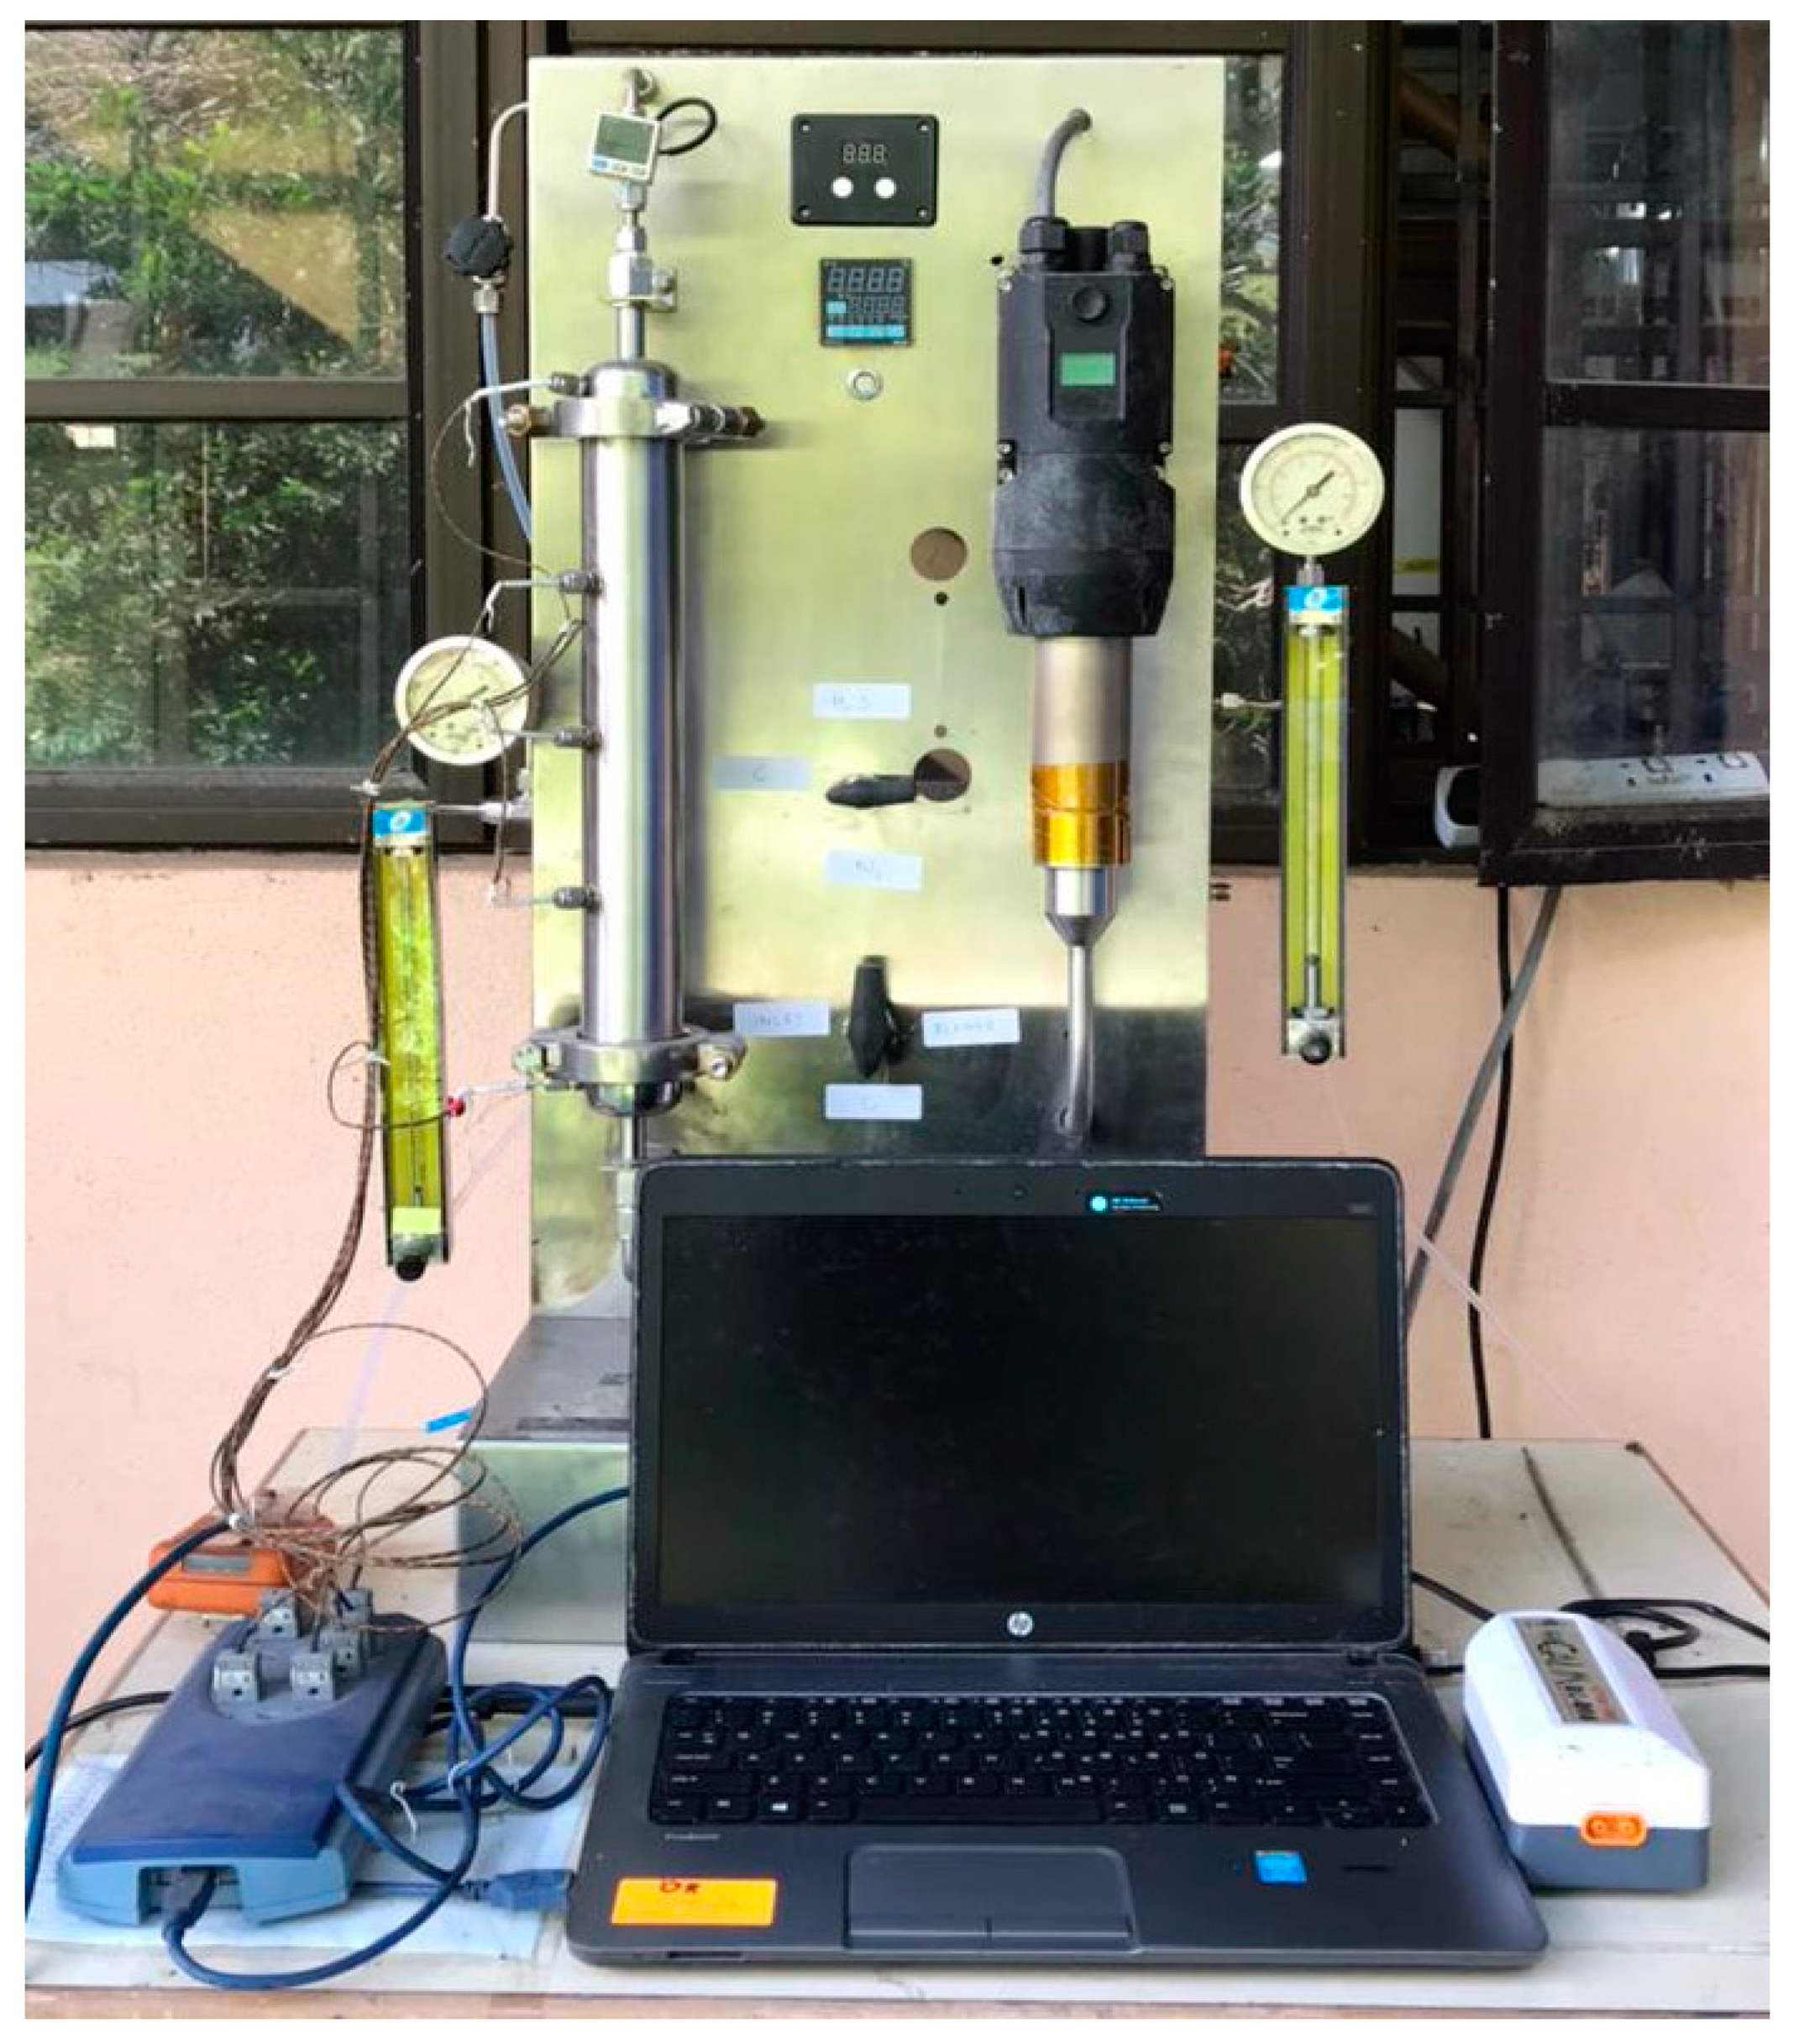
2.3. Real Test of Adsorption–Desorption of H2S Gas
3. Results and Discussion
3.1. Characterization Analysis for Fresh Adsorbent
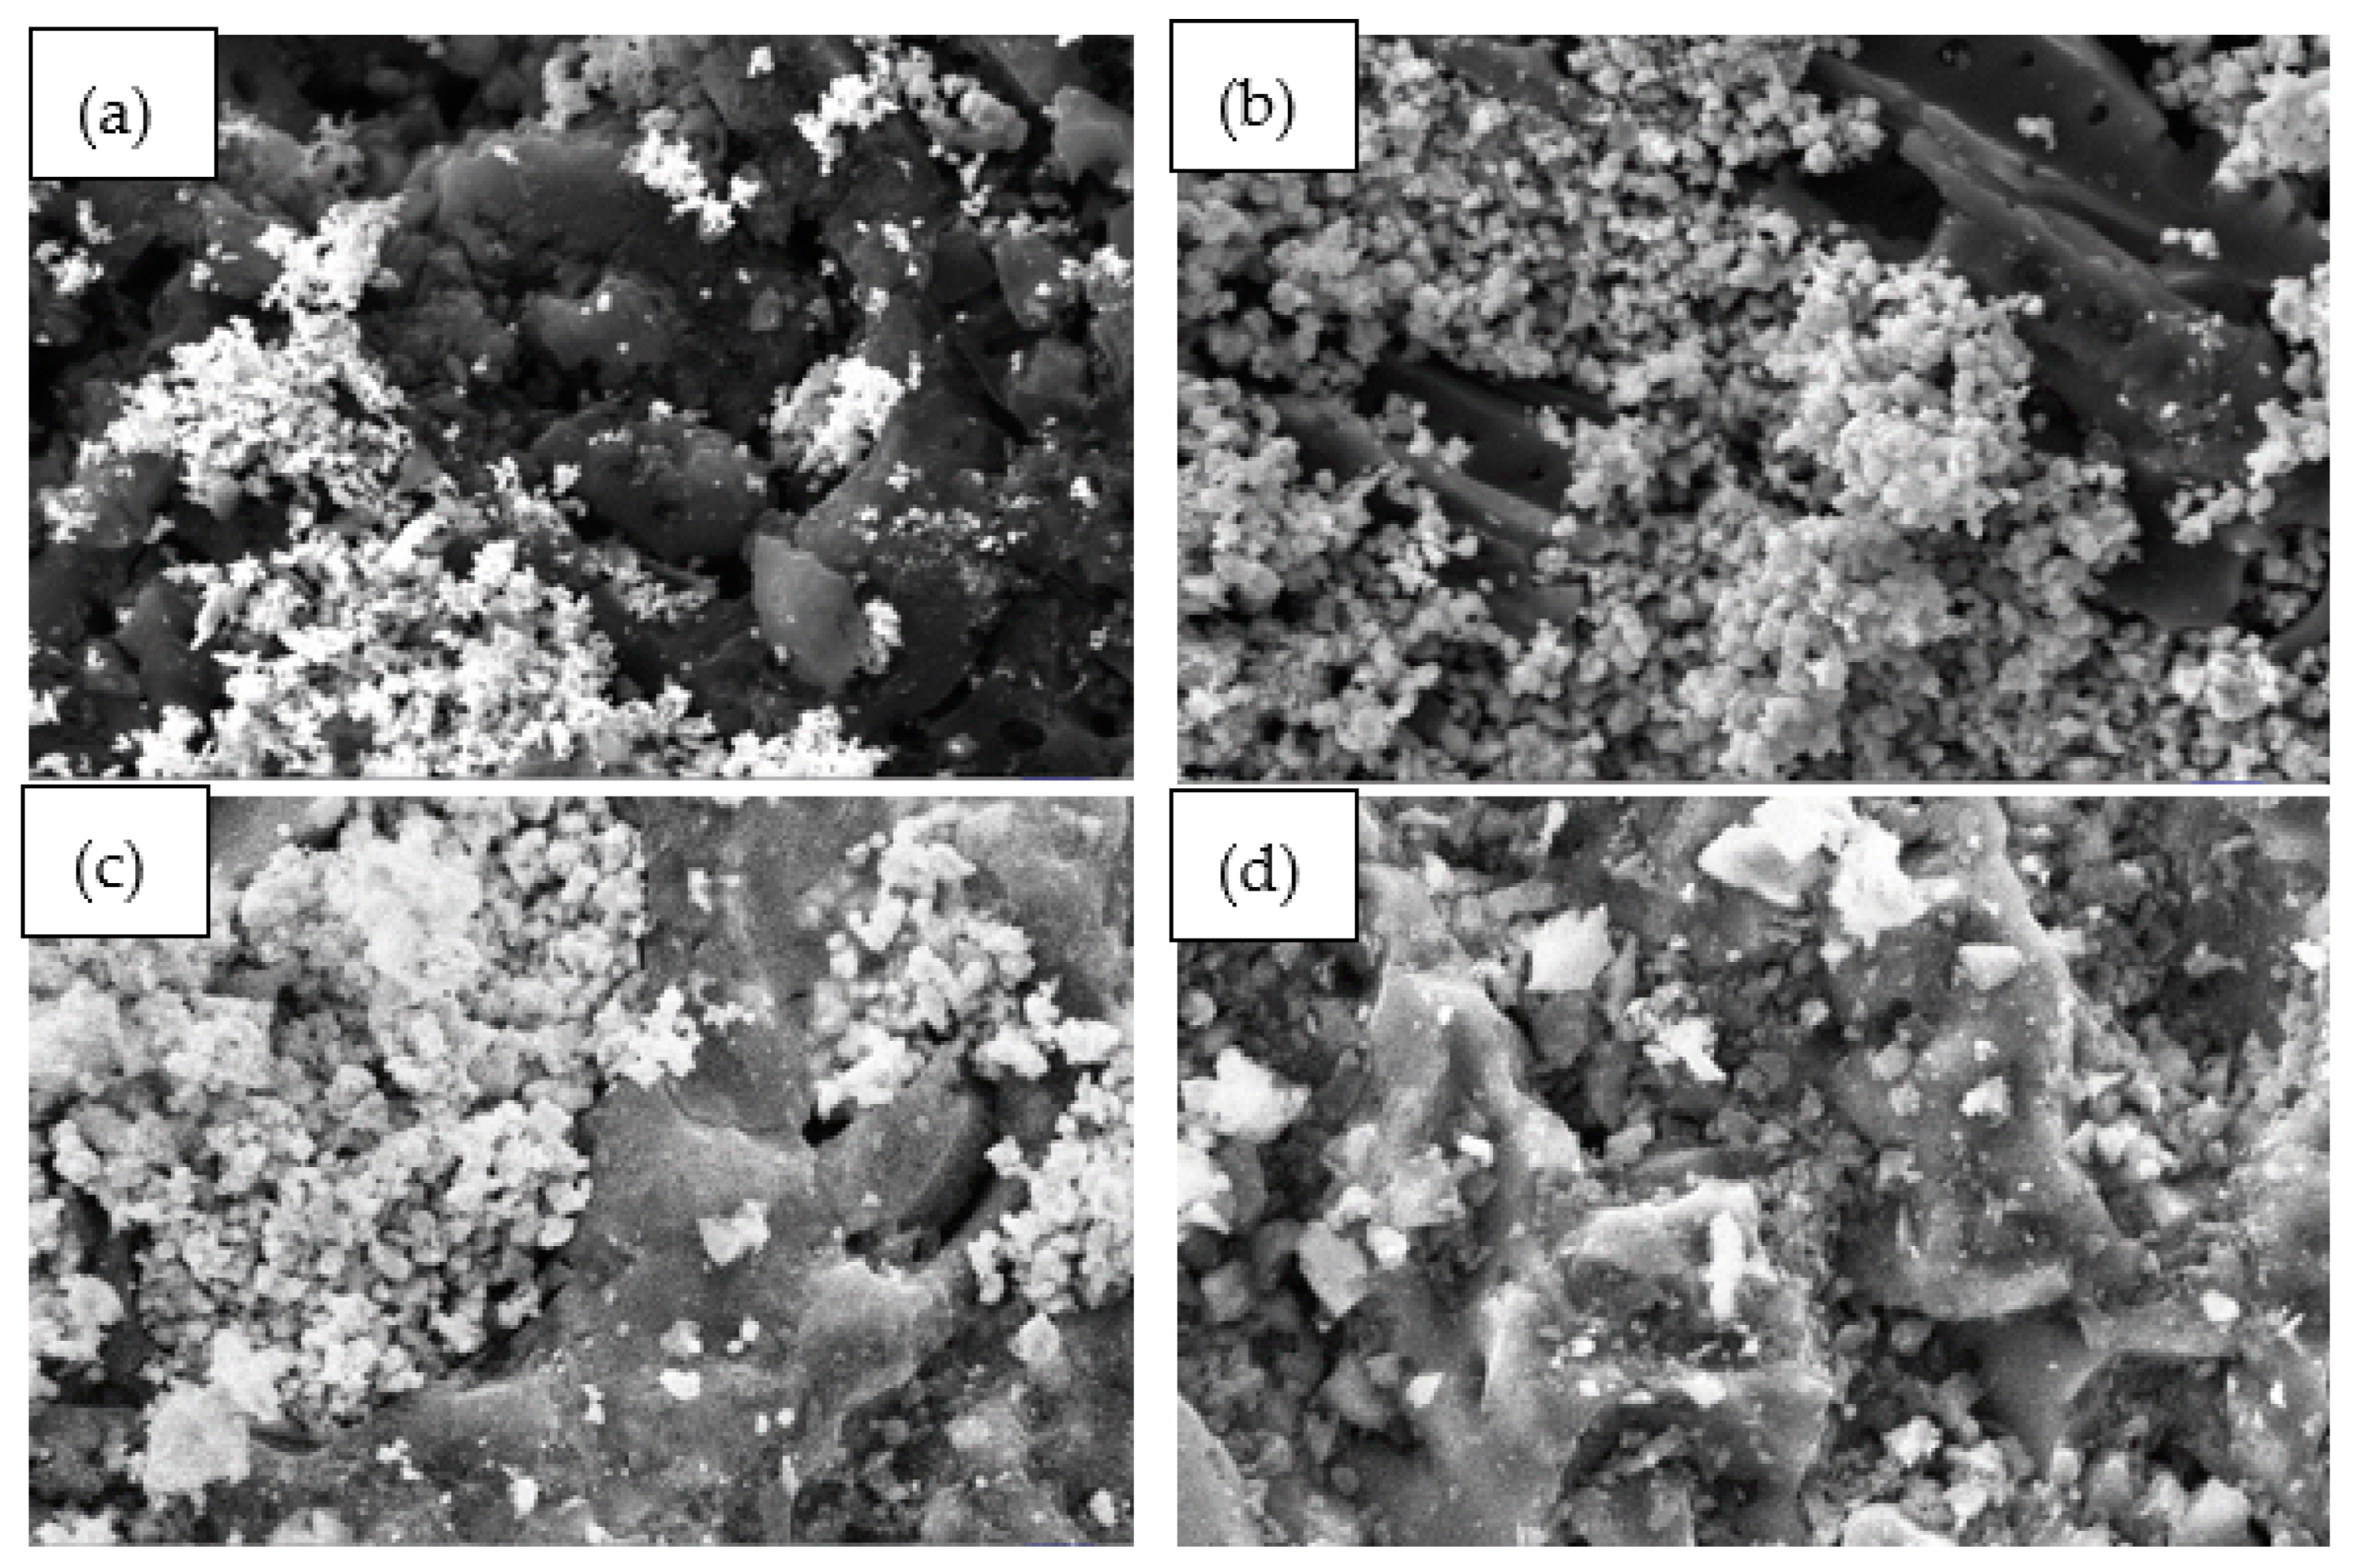
- (a)
- SEM-EDX analysis
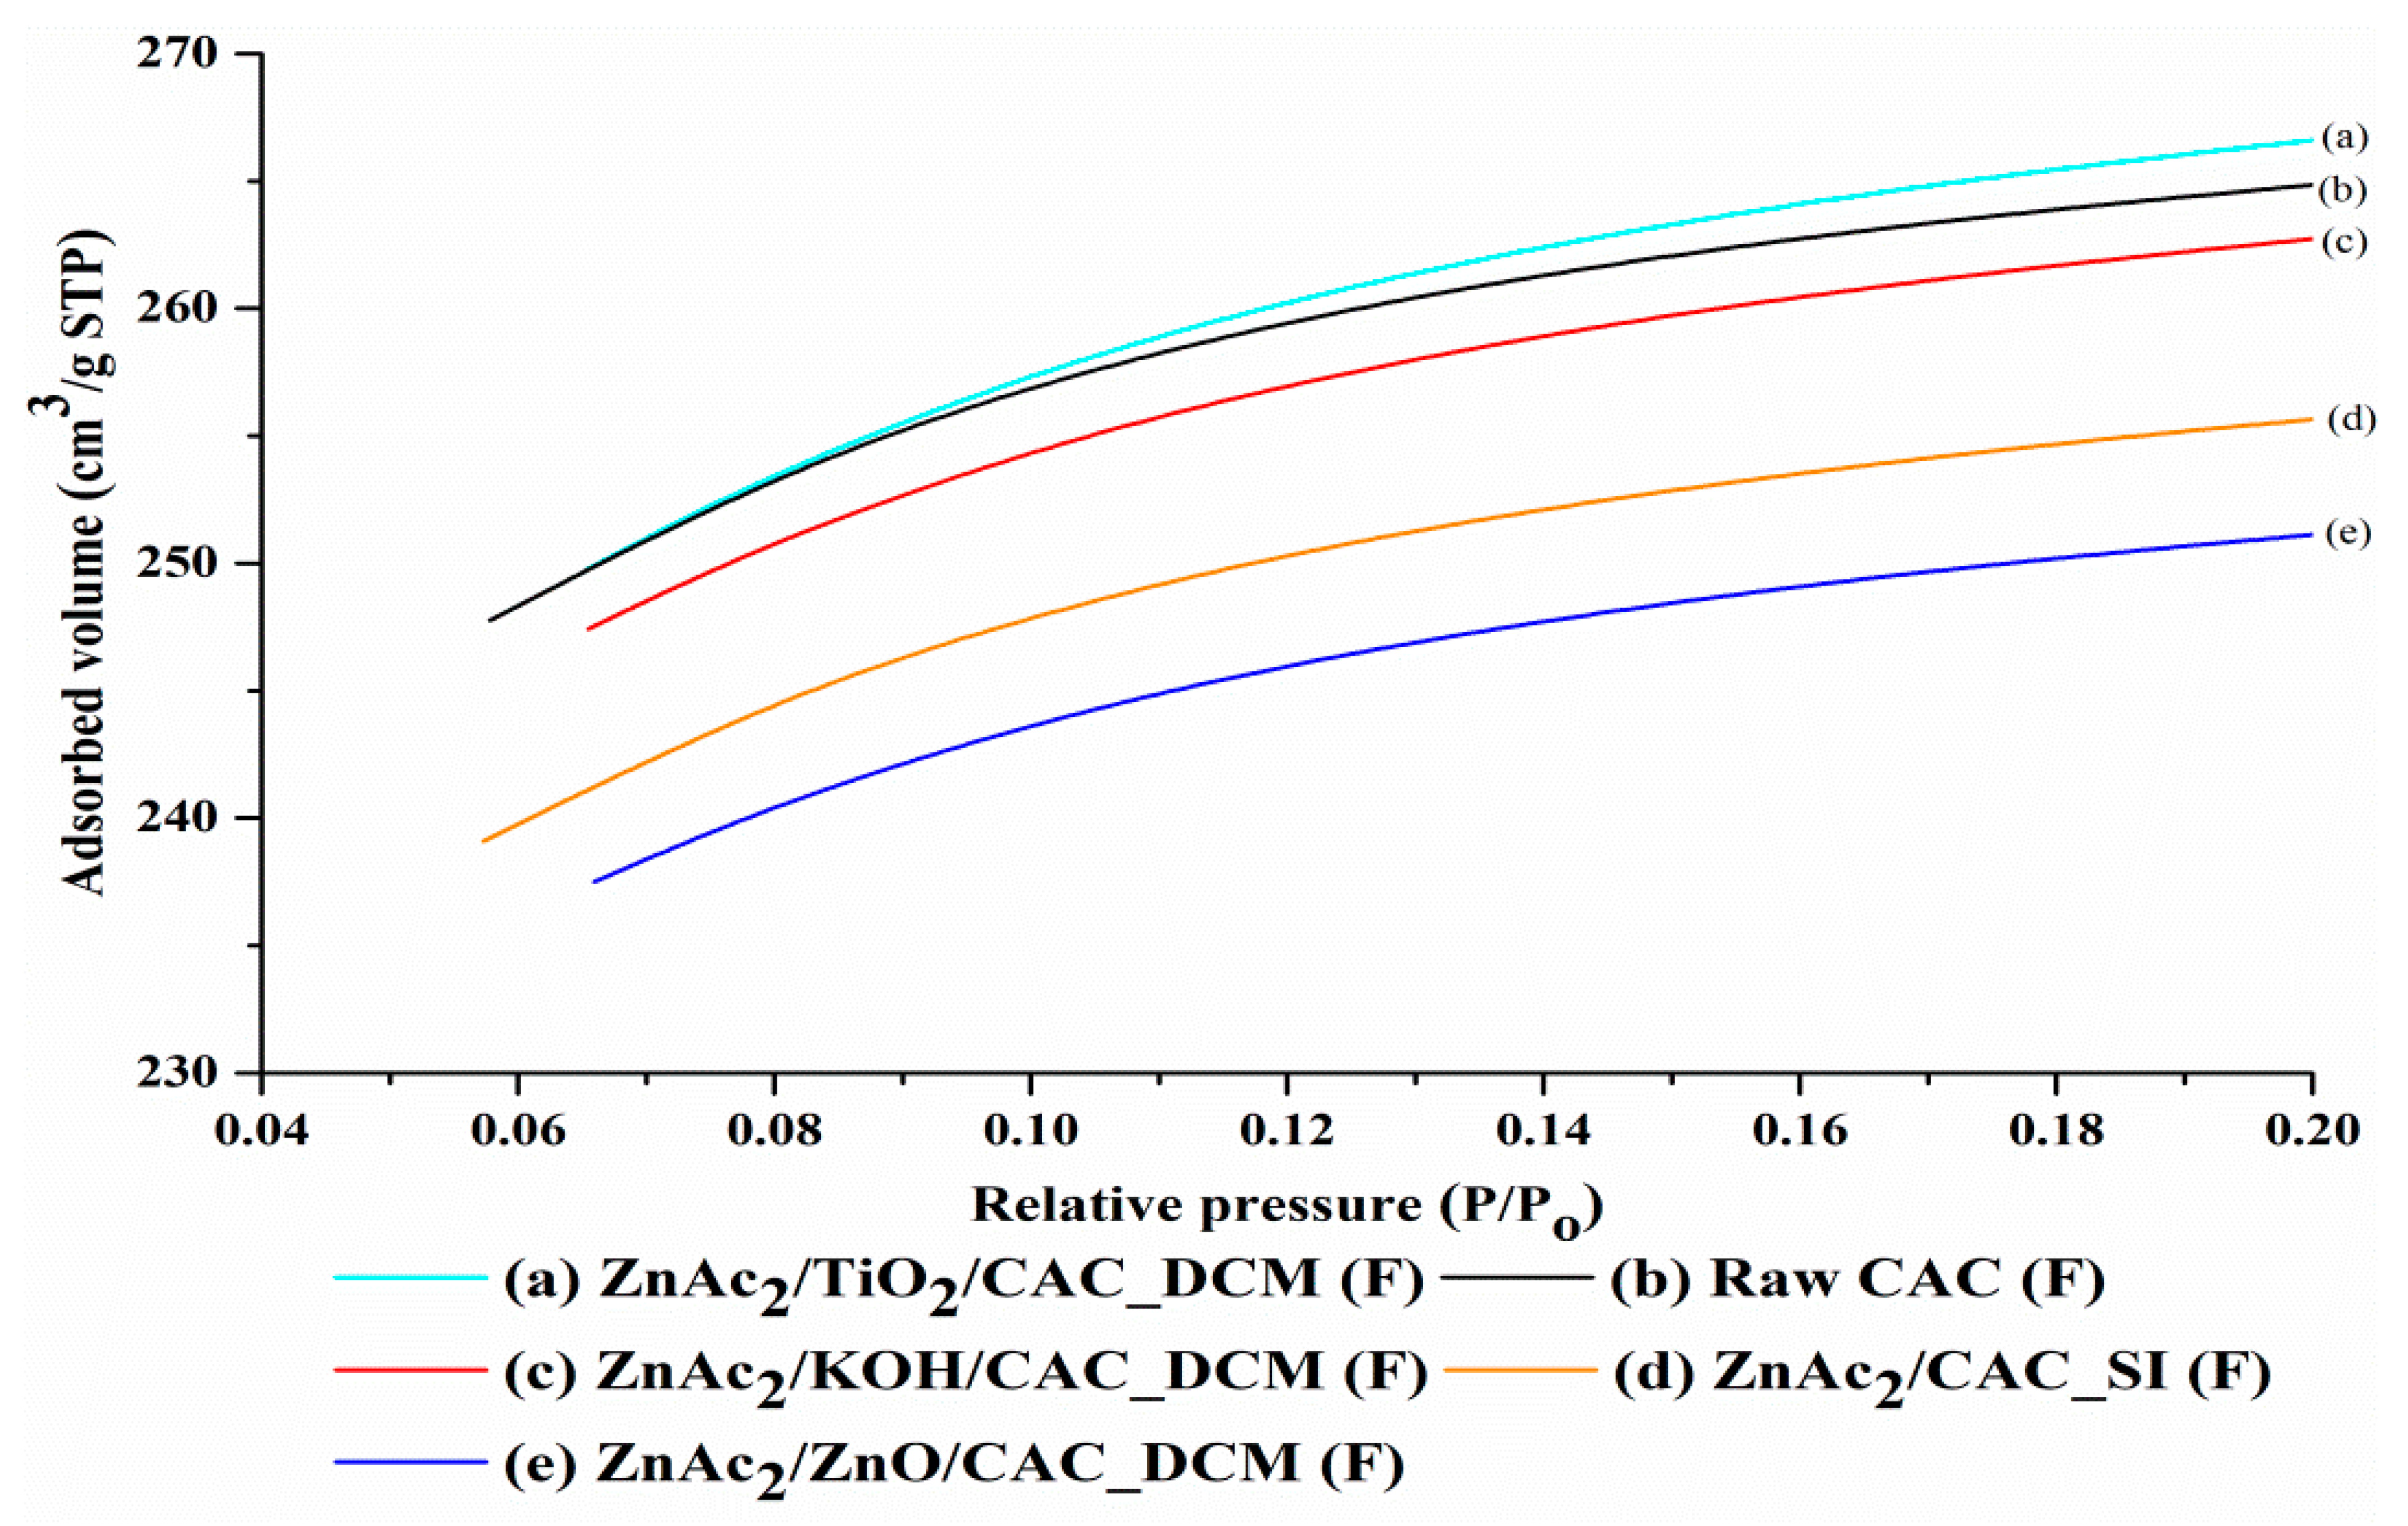
- (b)
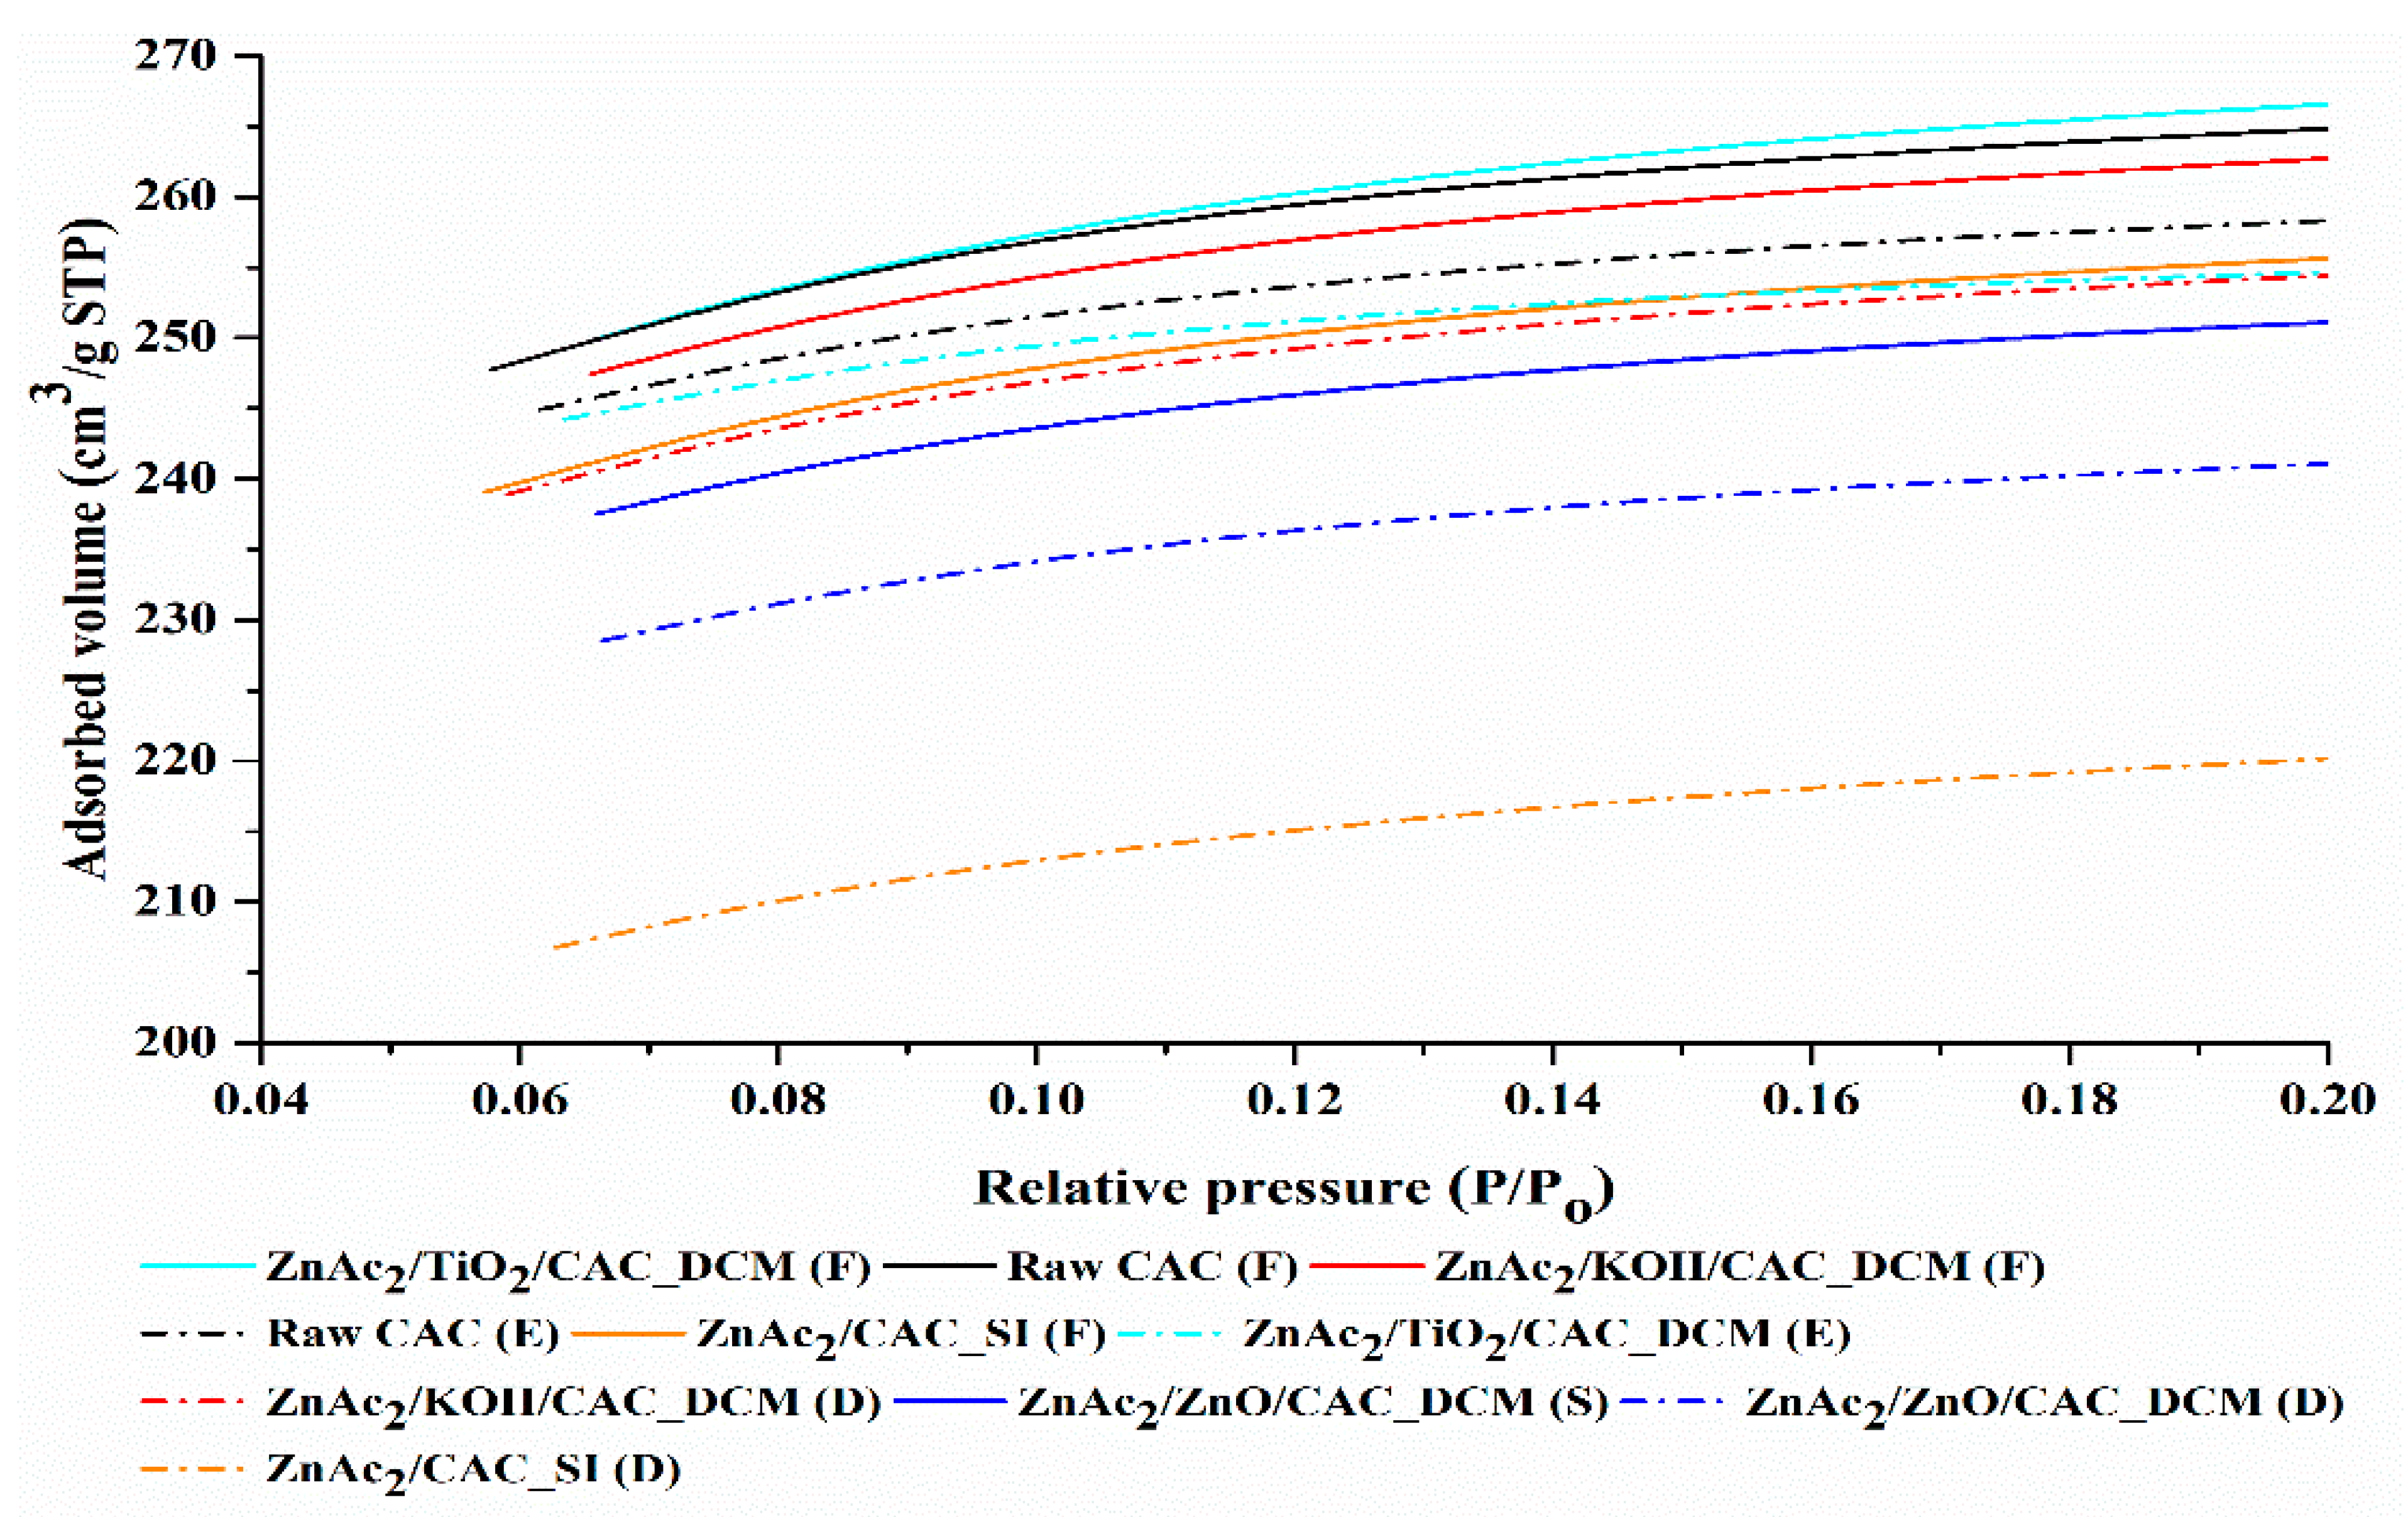
- BET analysis
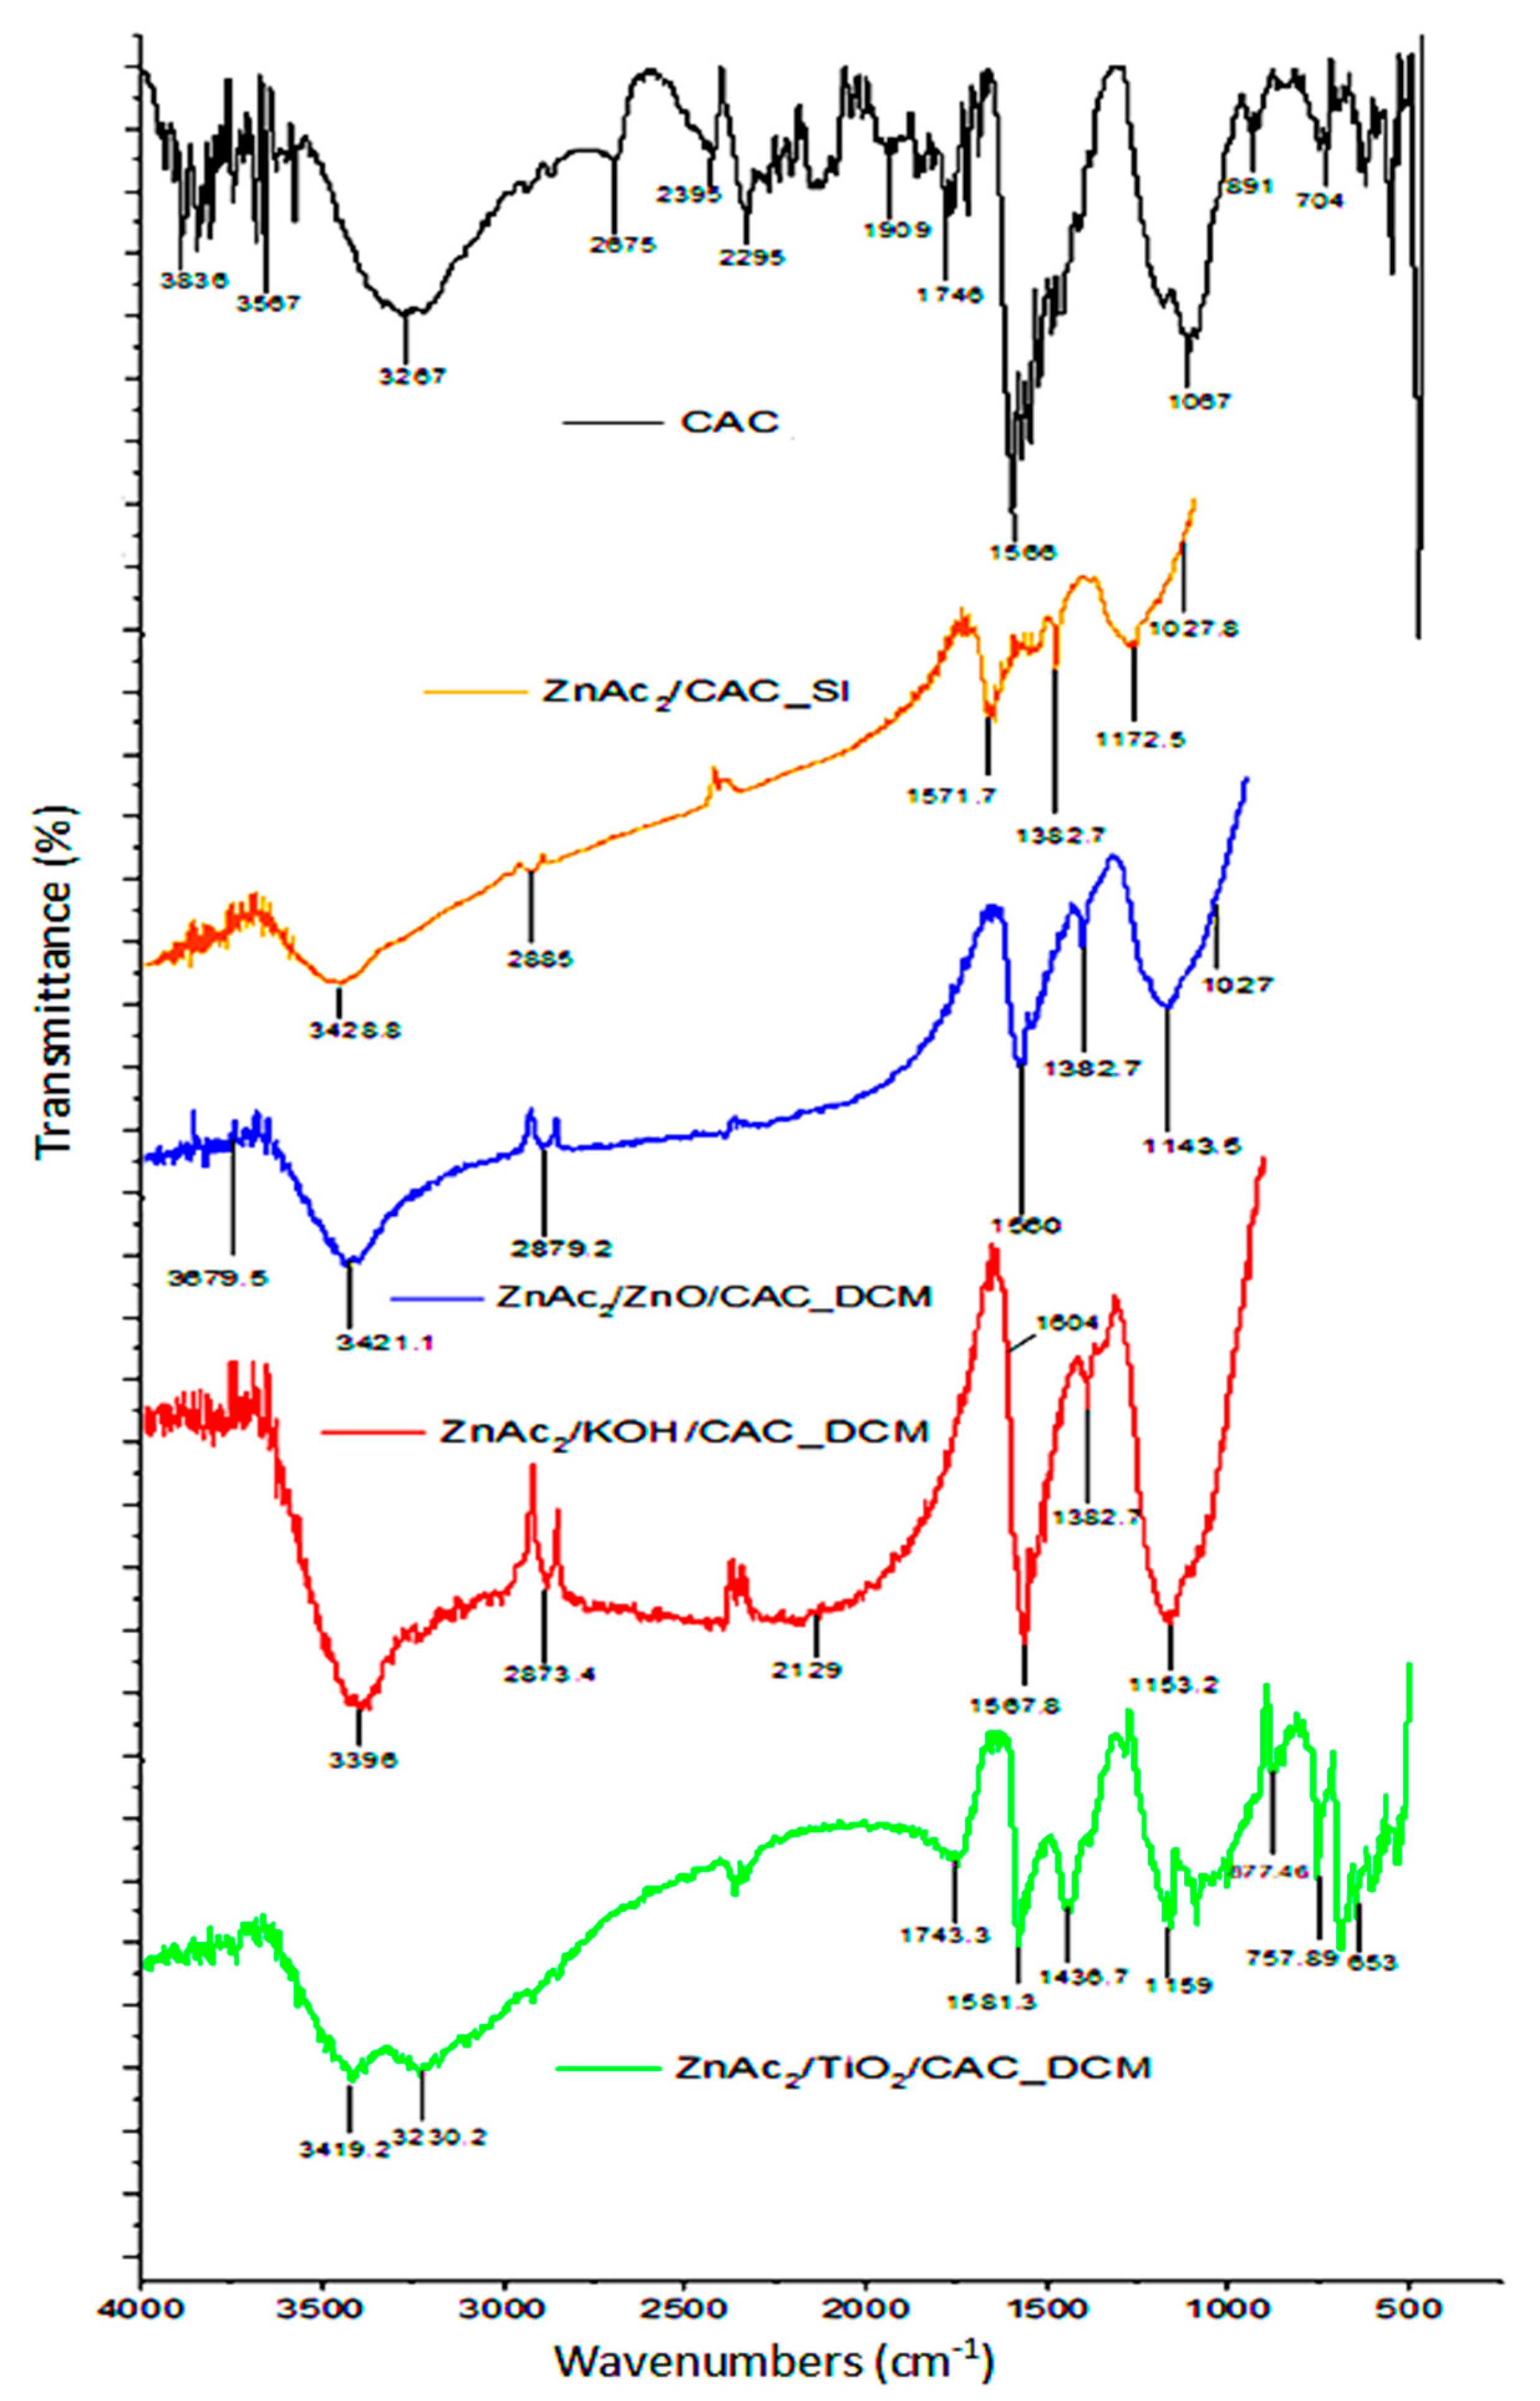
- (c)
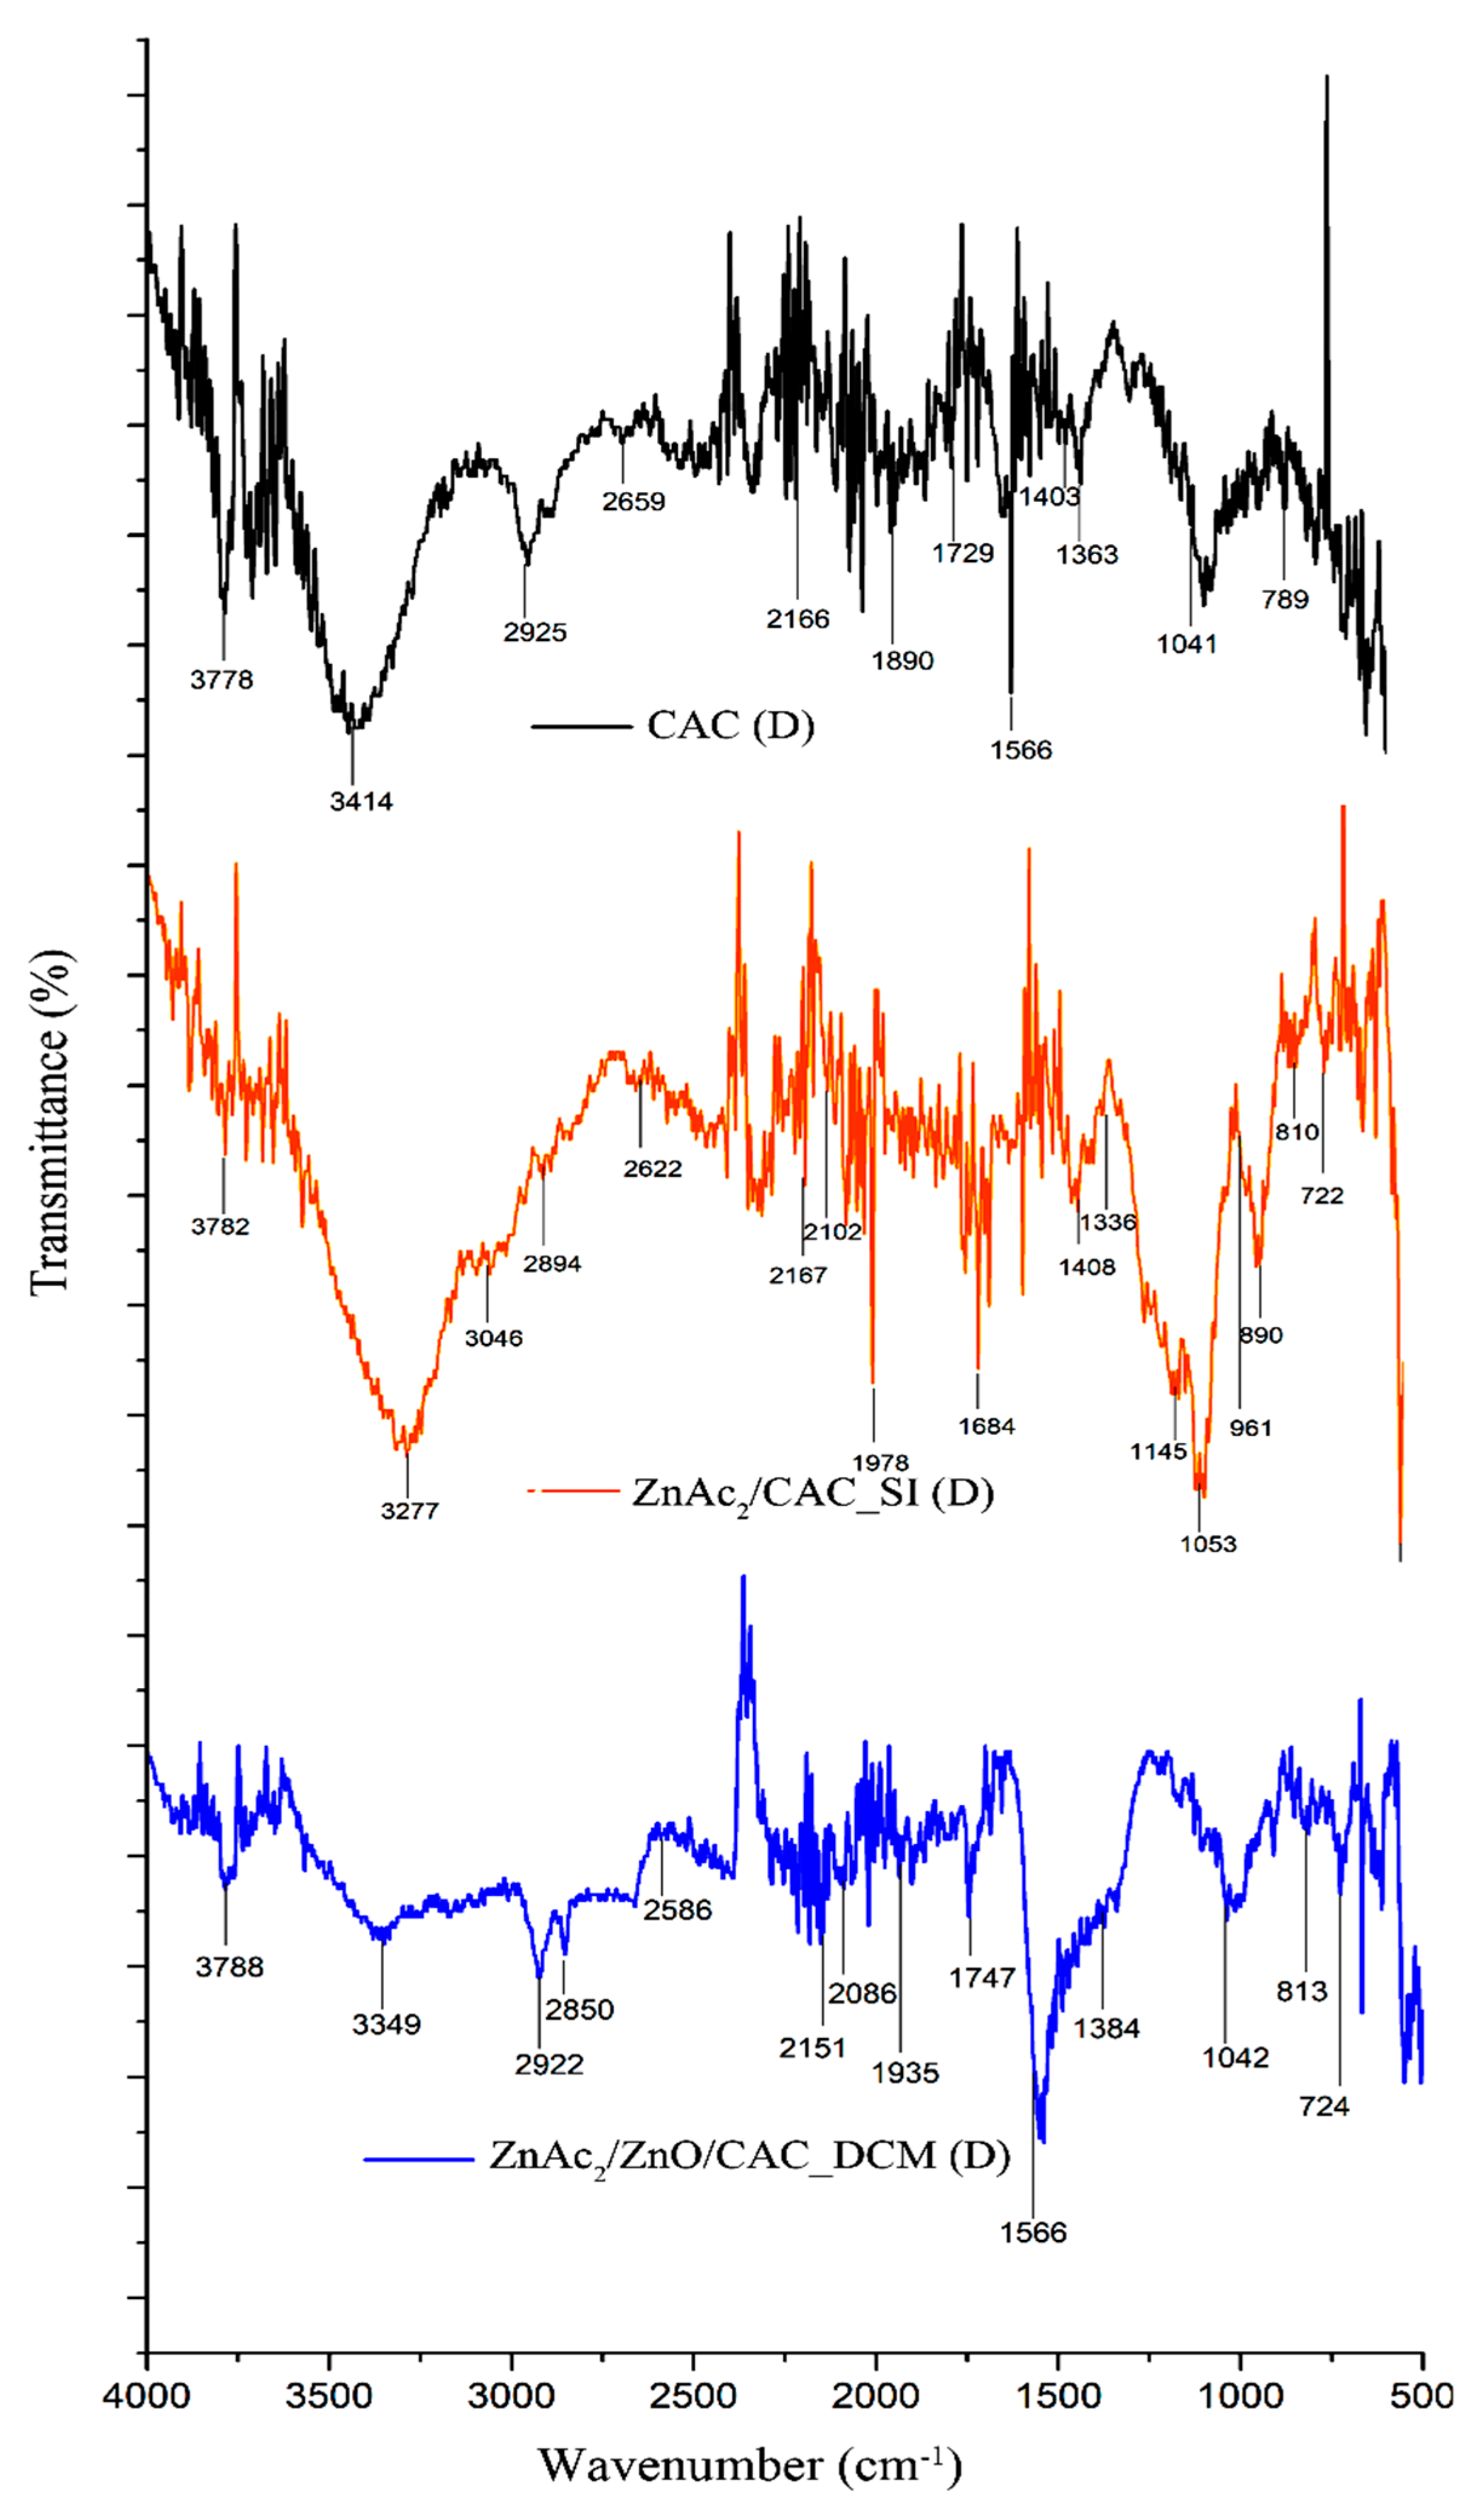
- FTIR analysis
- (d)
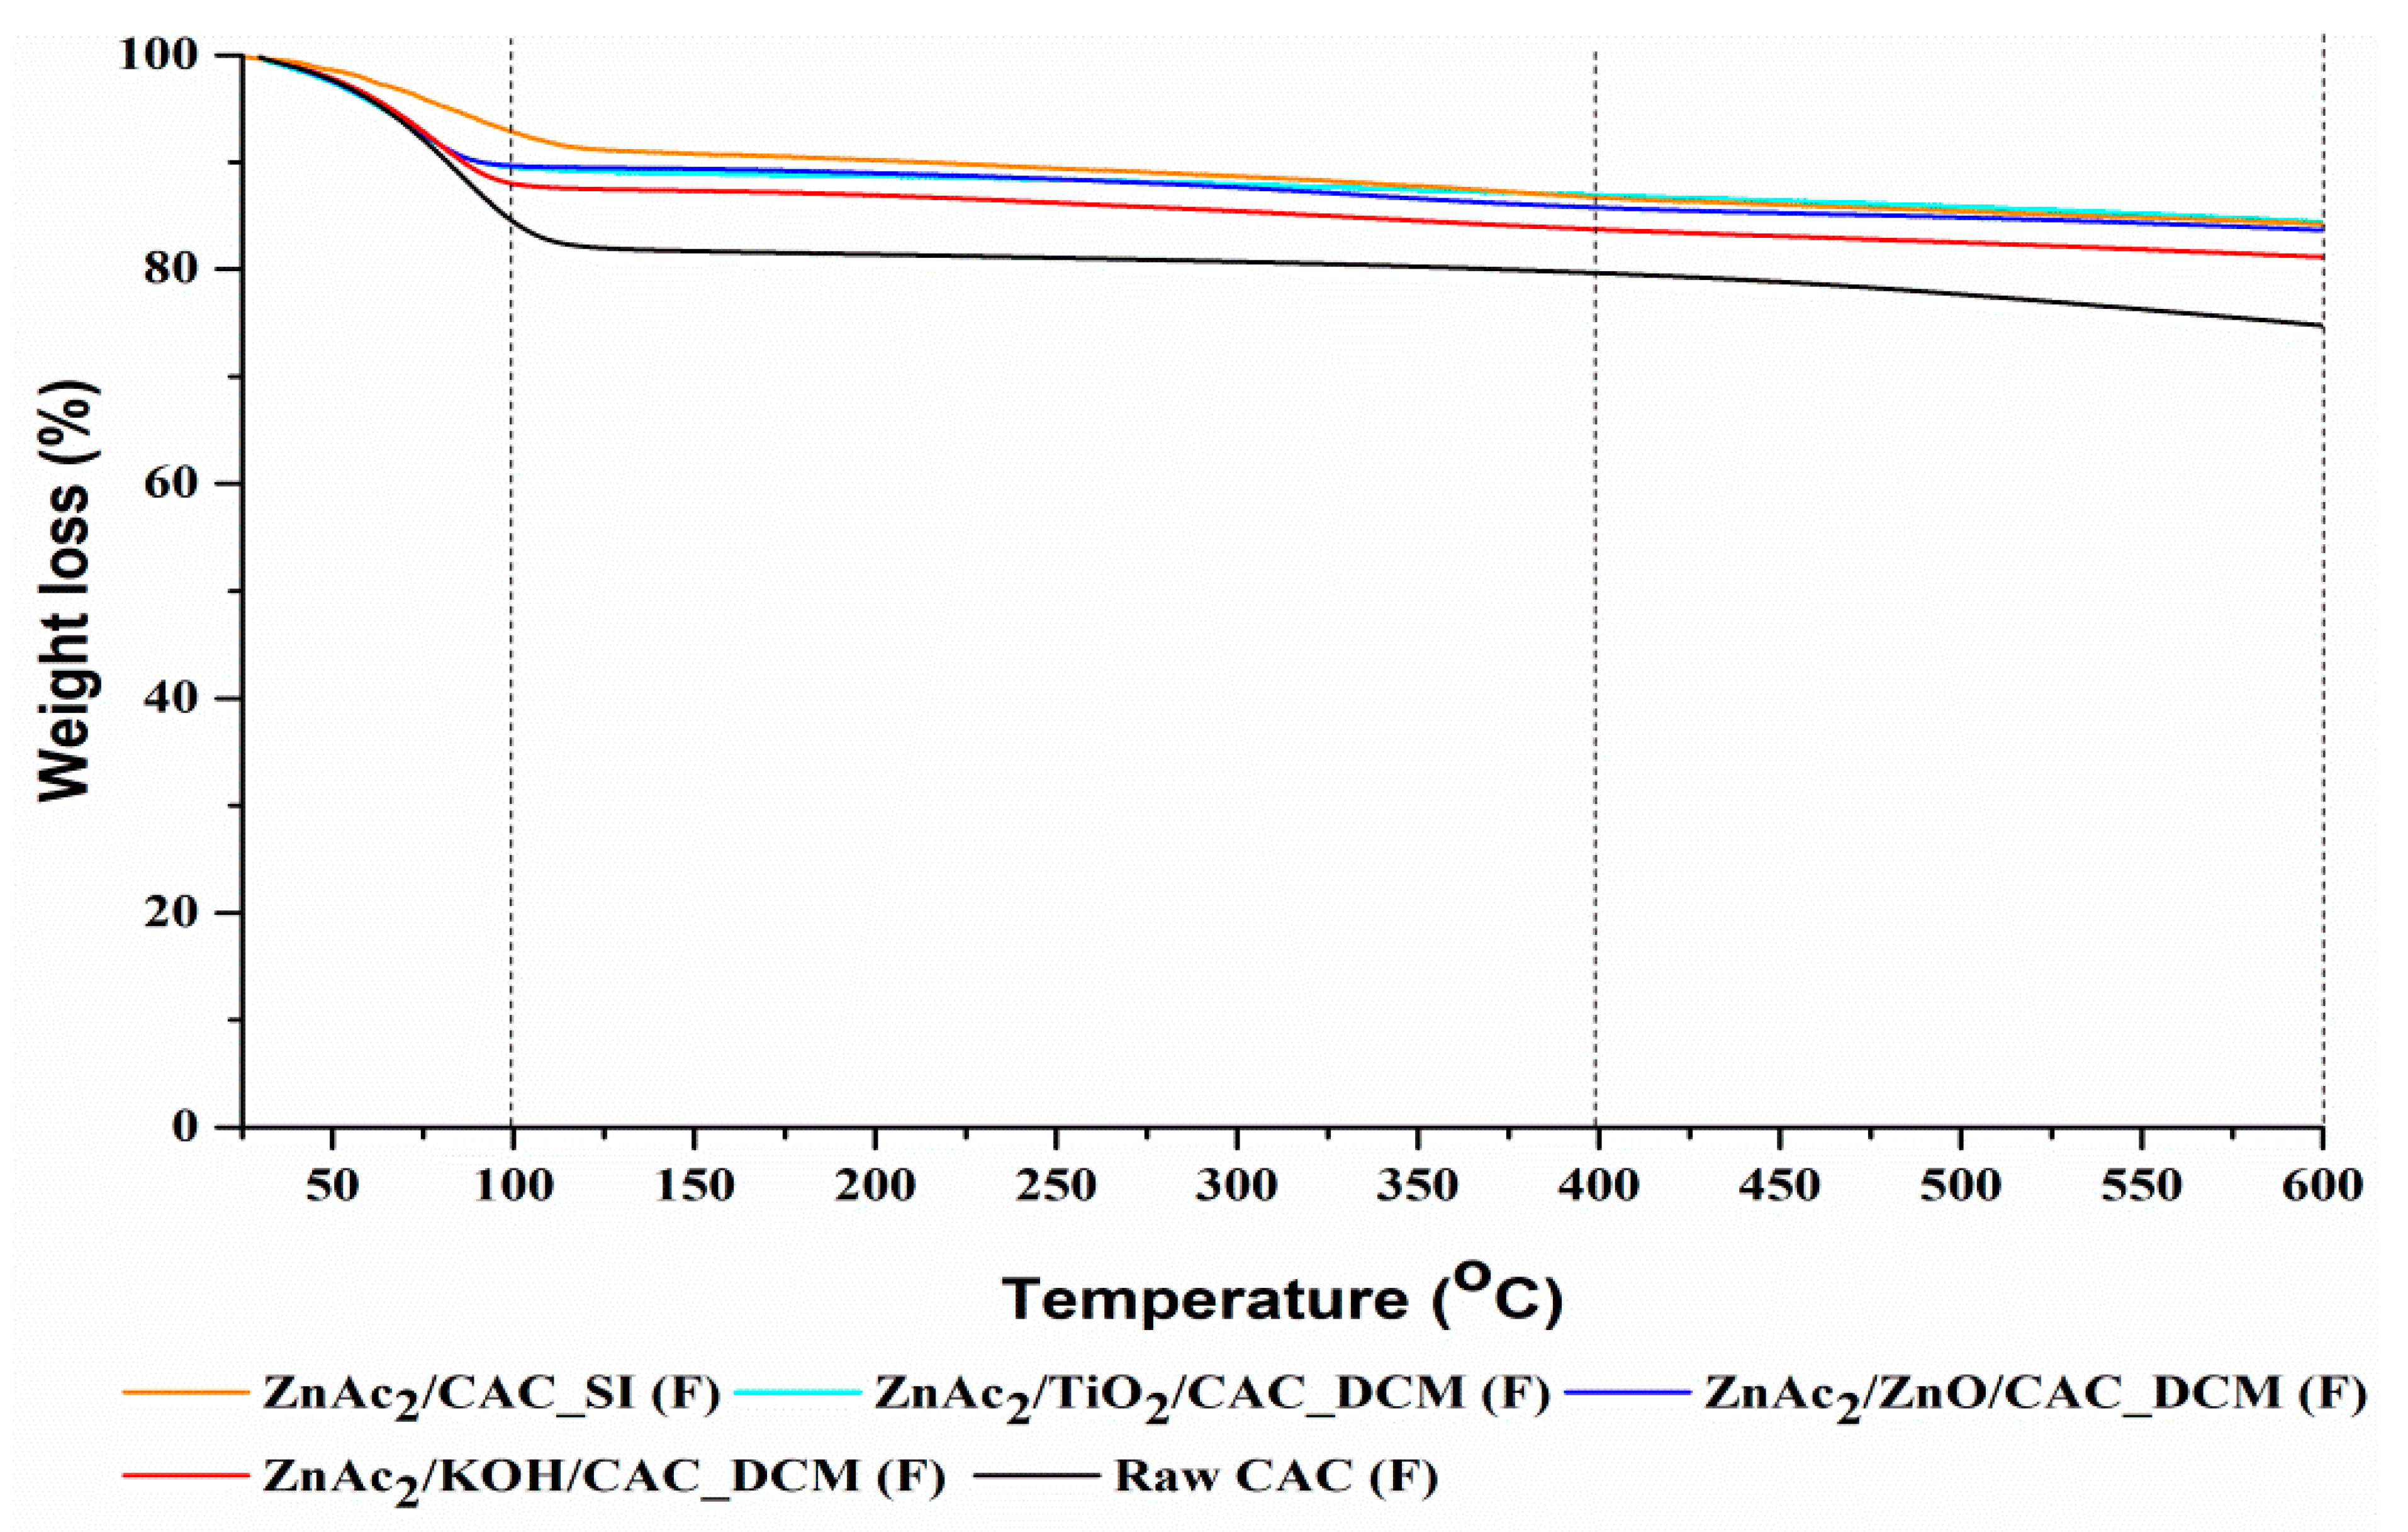
- TGA
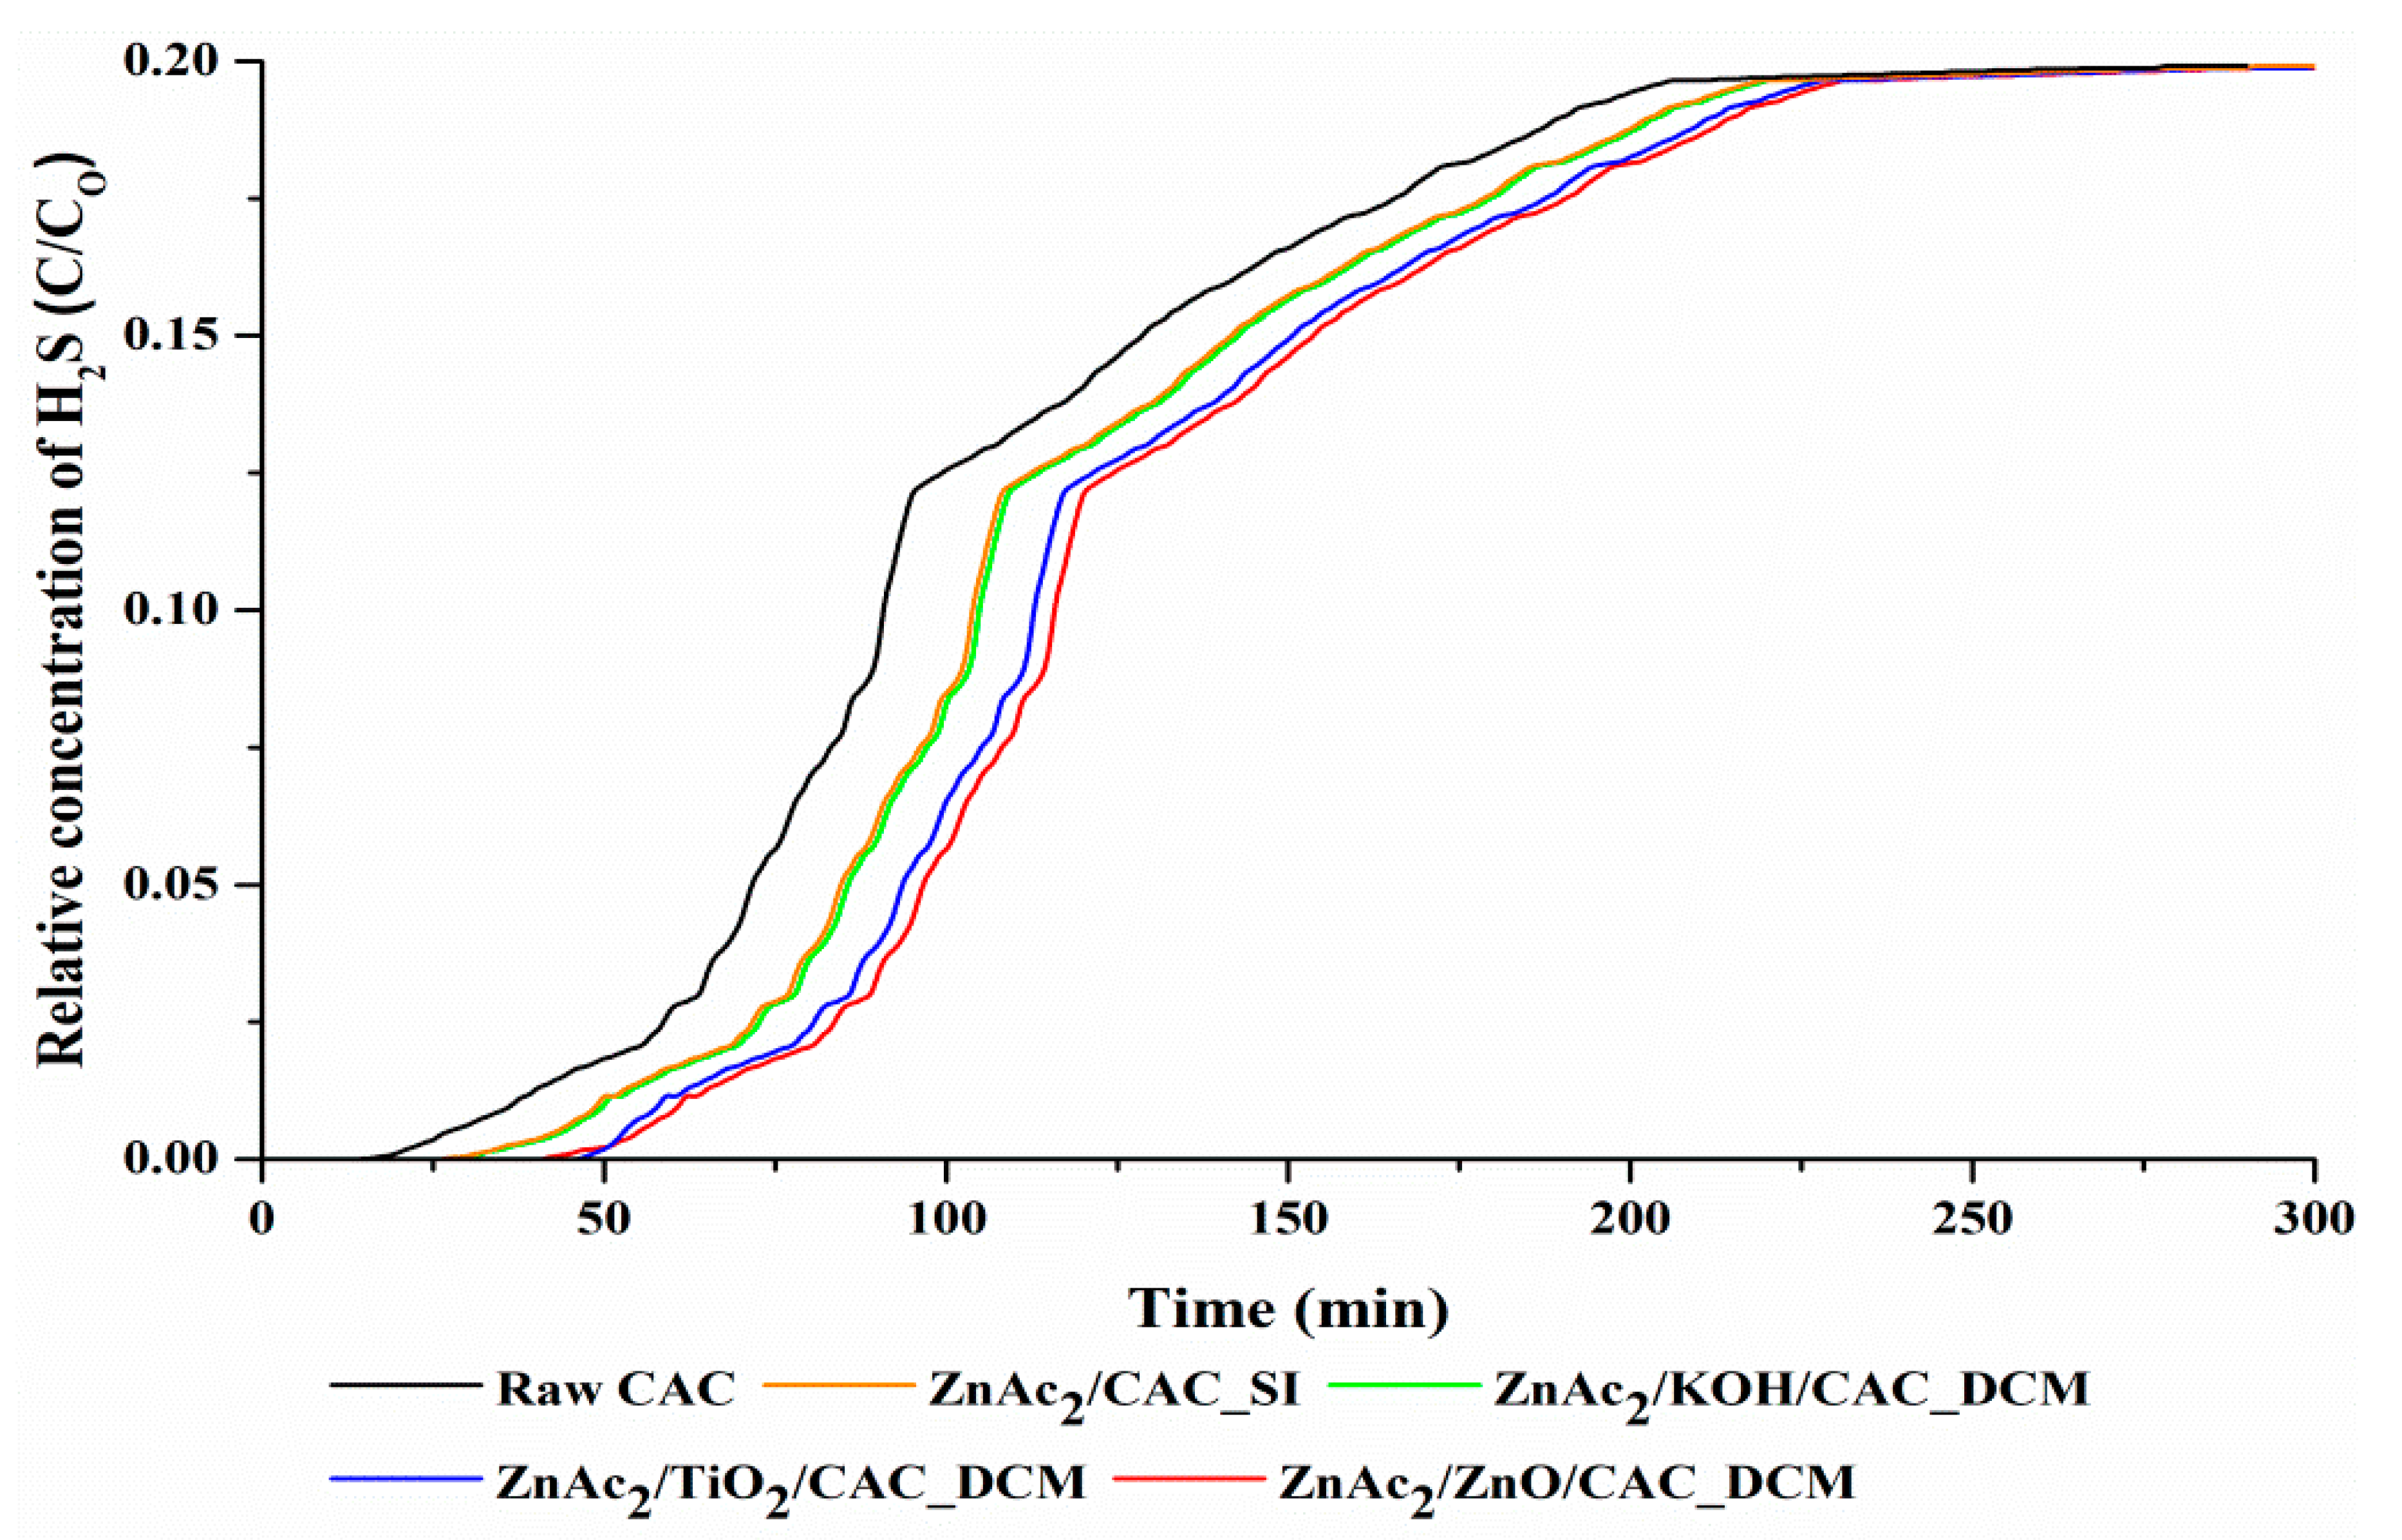
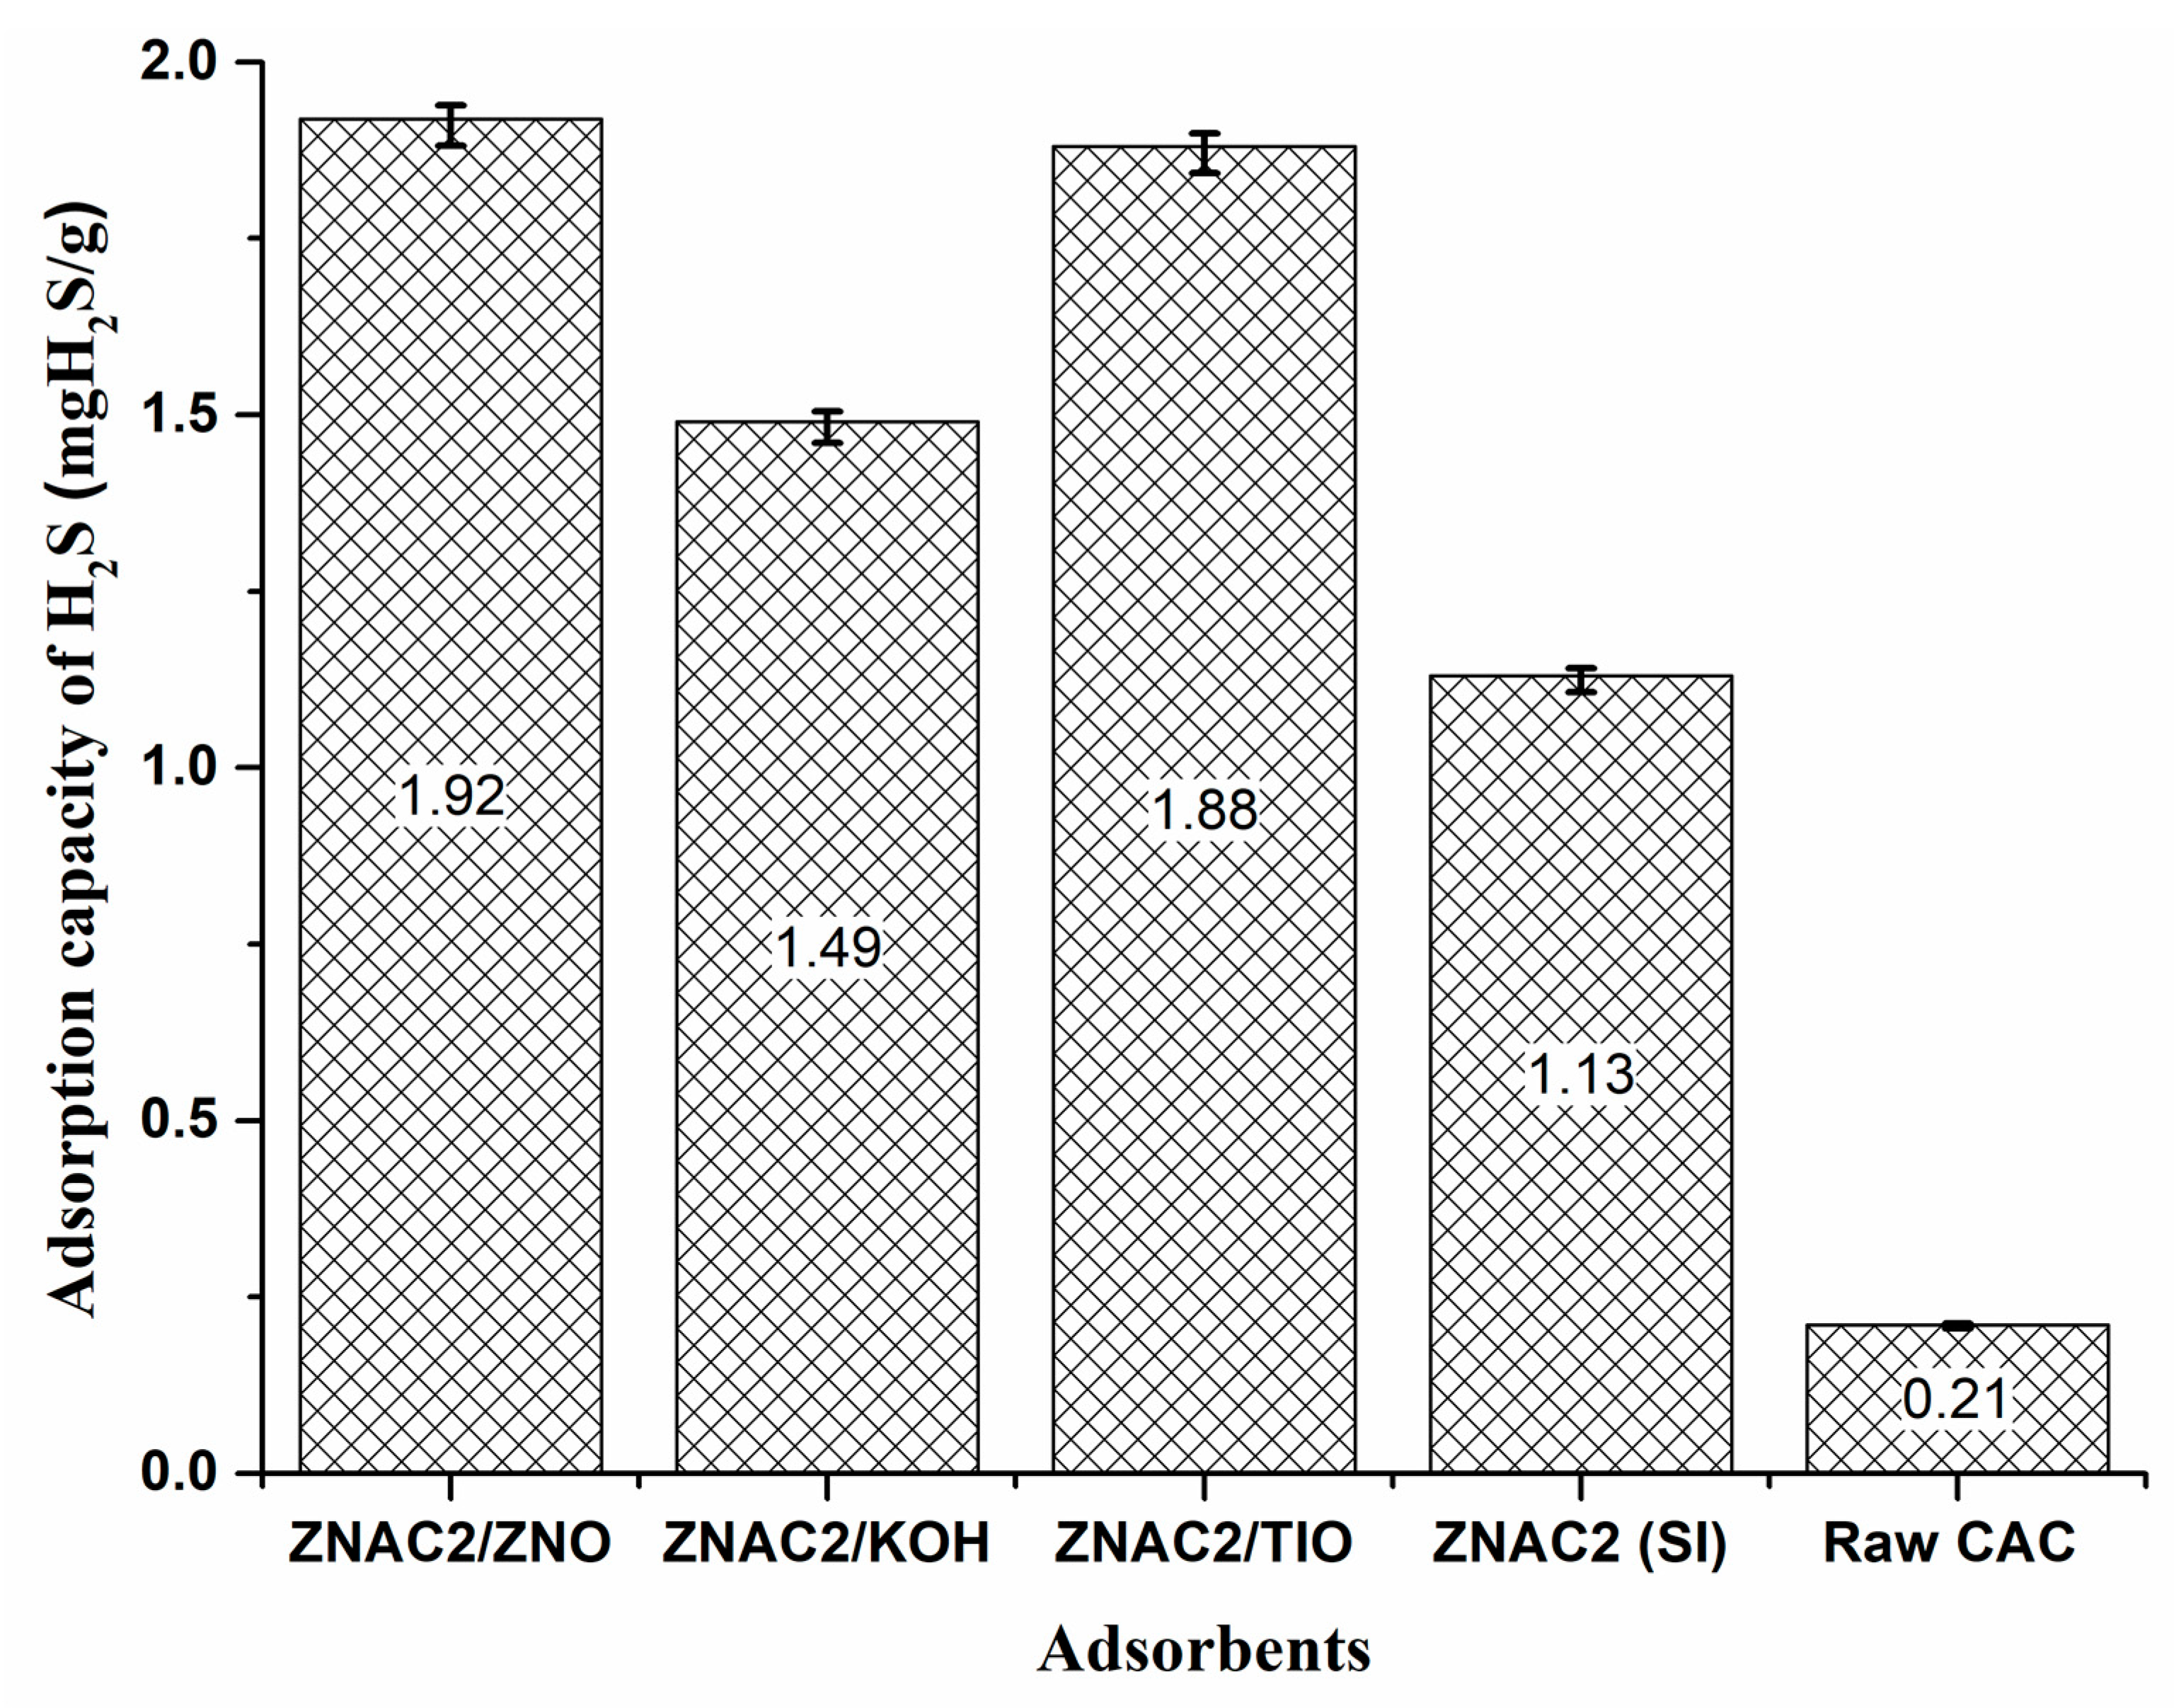
3.2. Real Test of Adsorption–Desorption of H2S
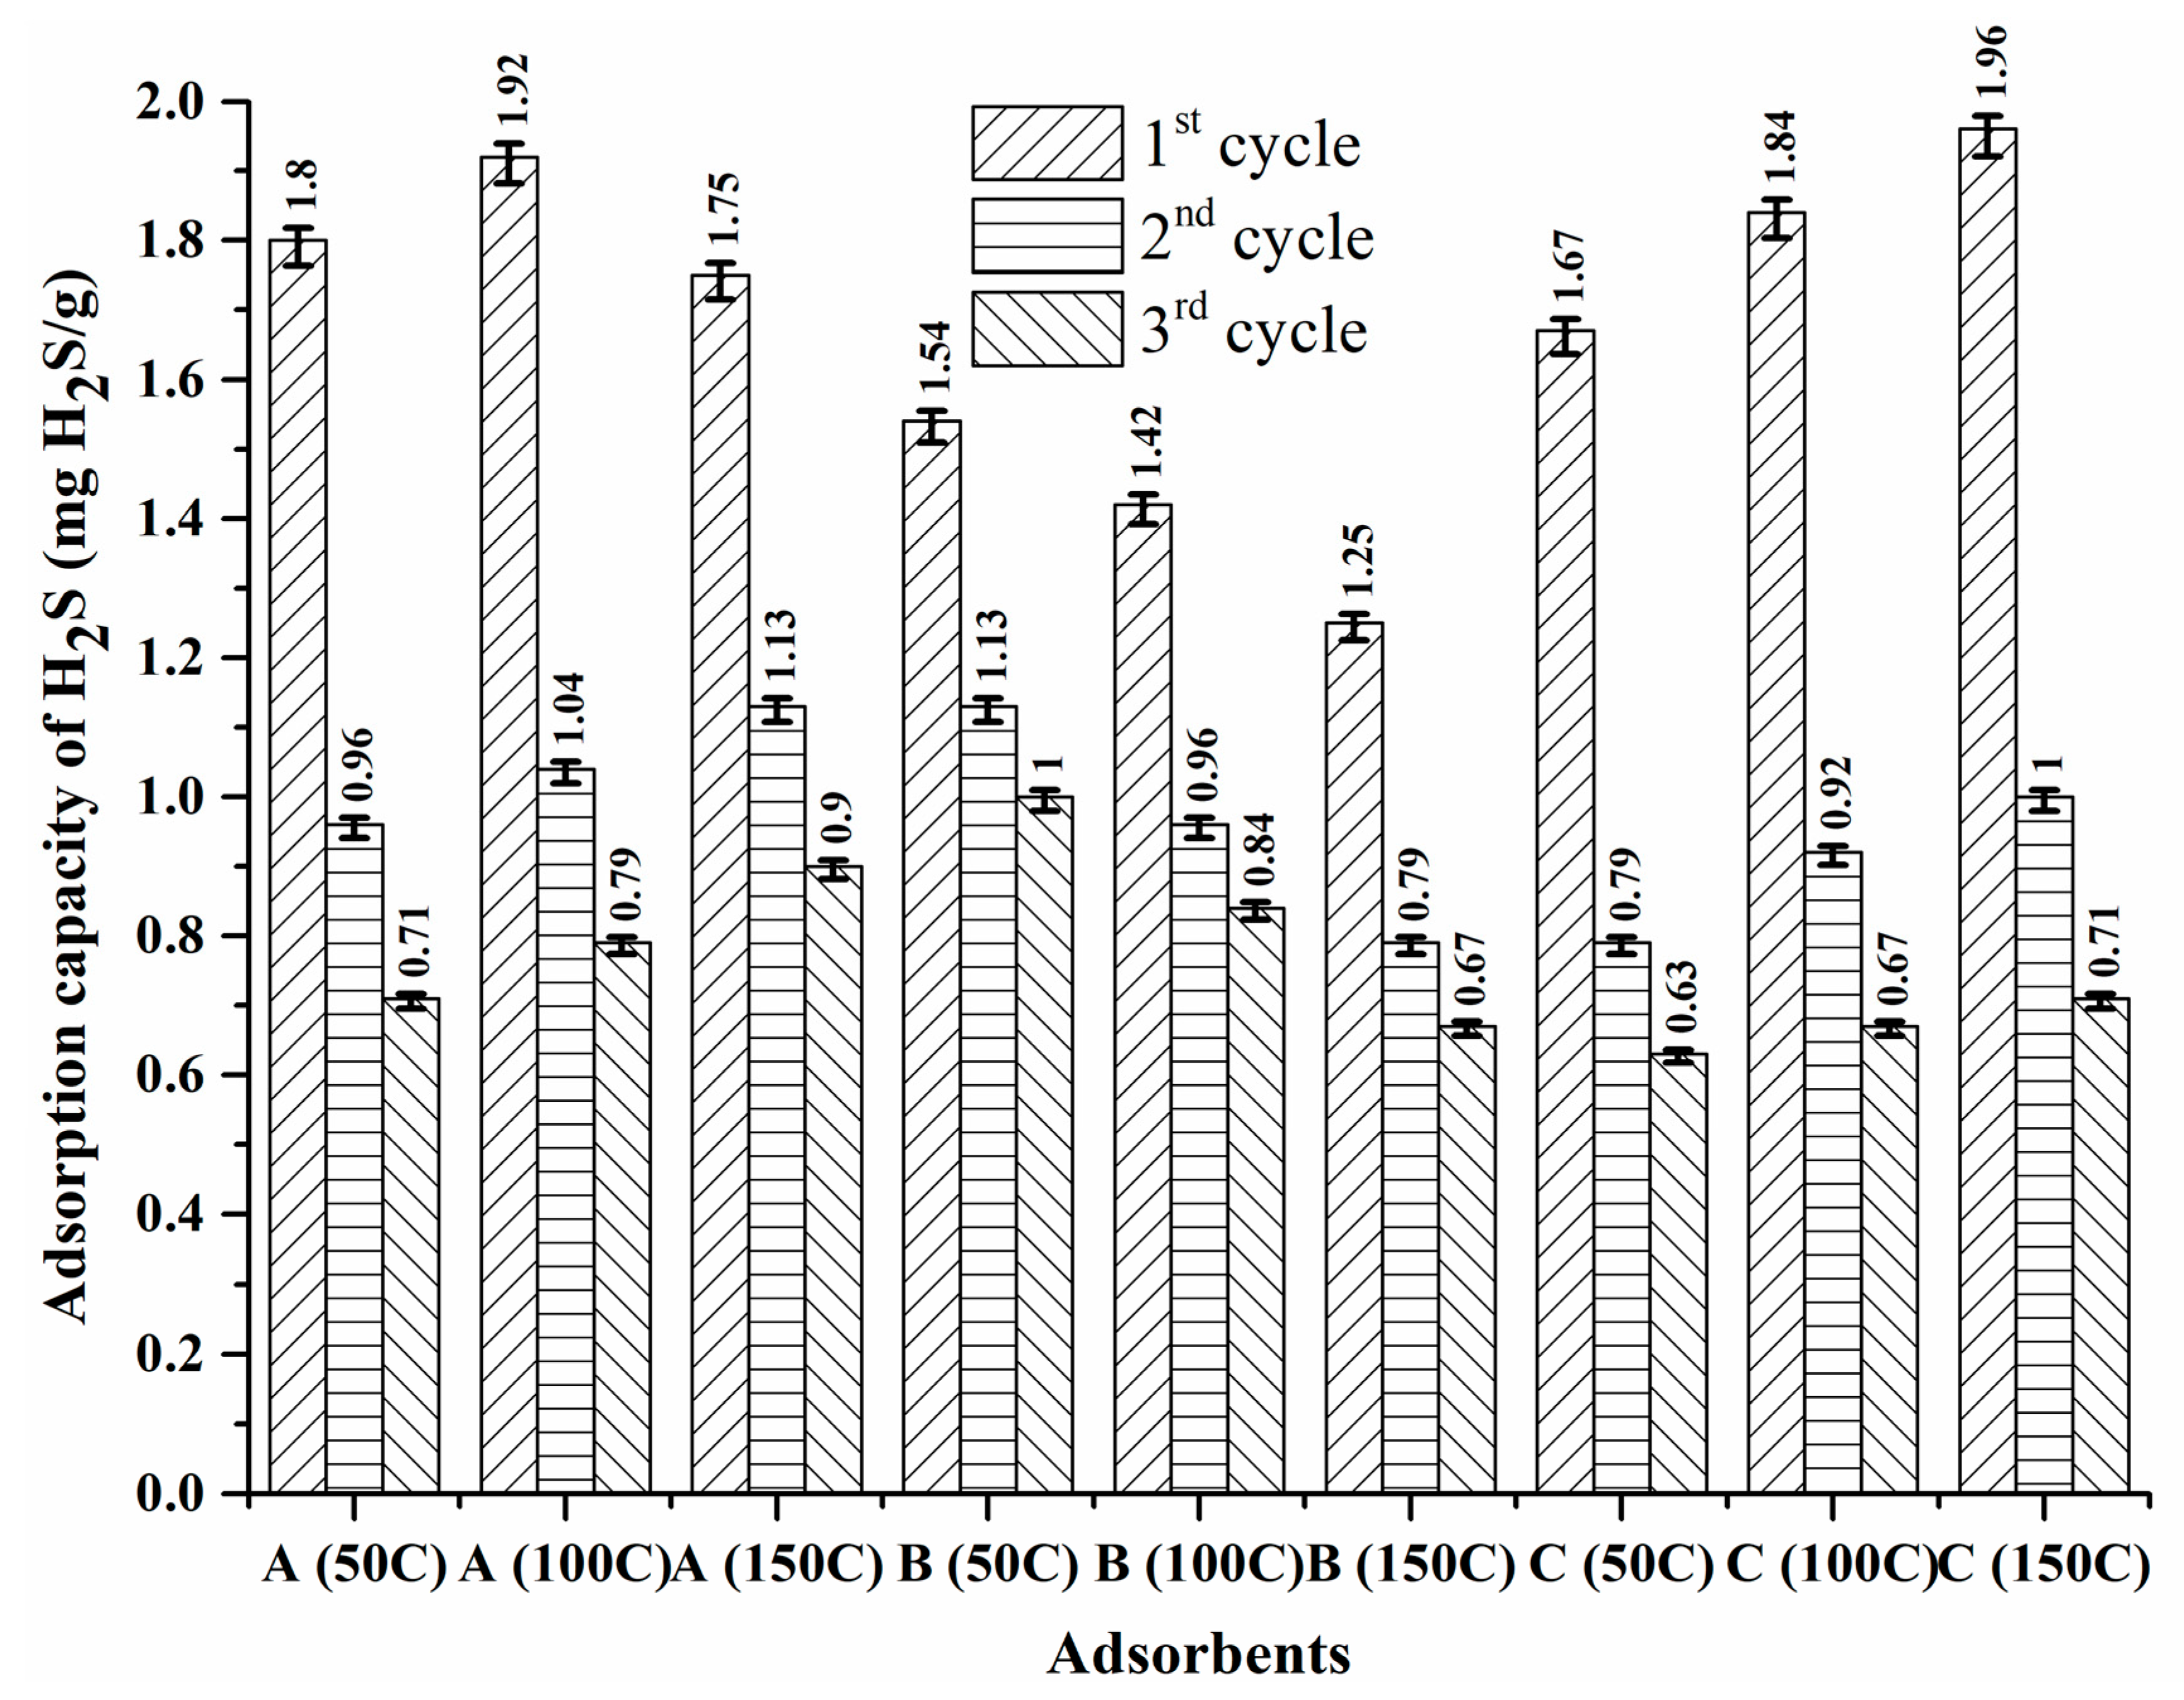
3.3. Effect of Temperature on Desorption
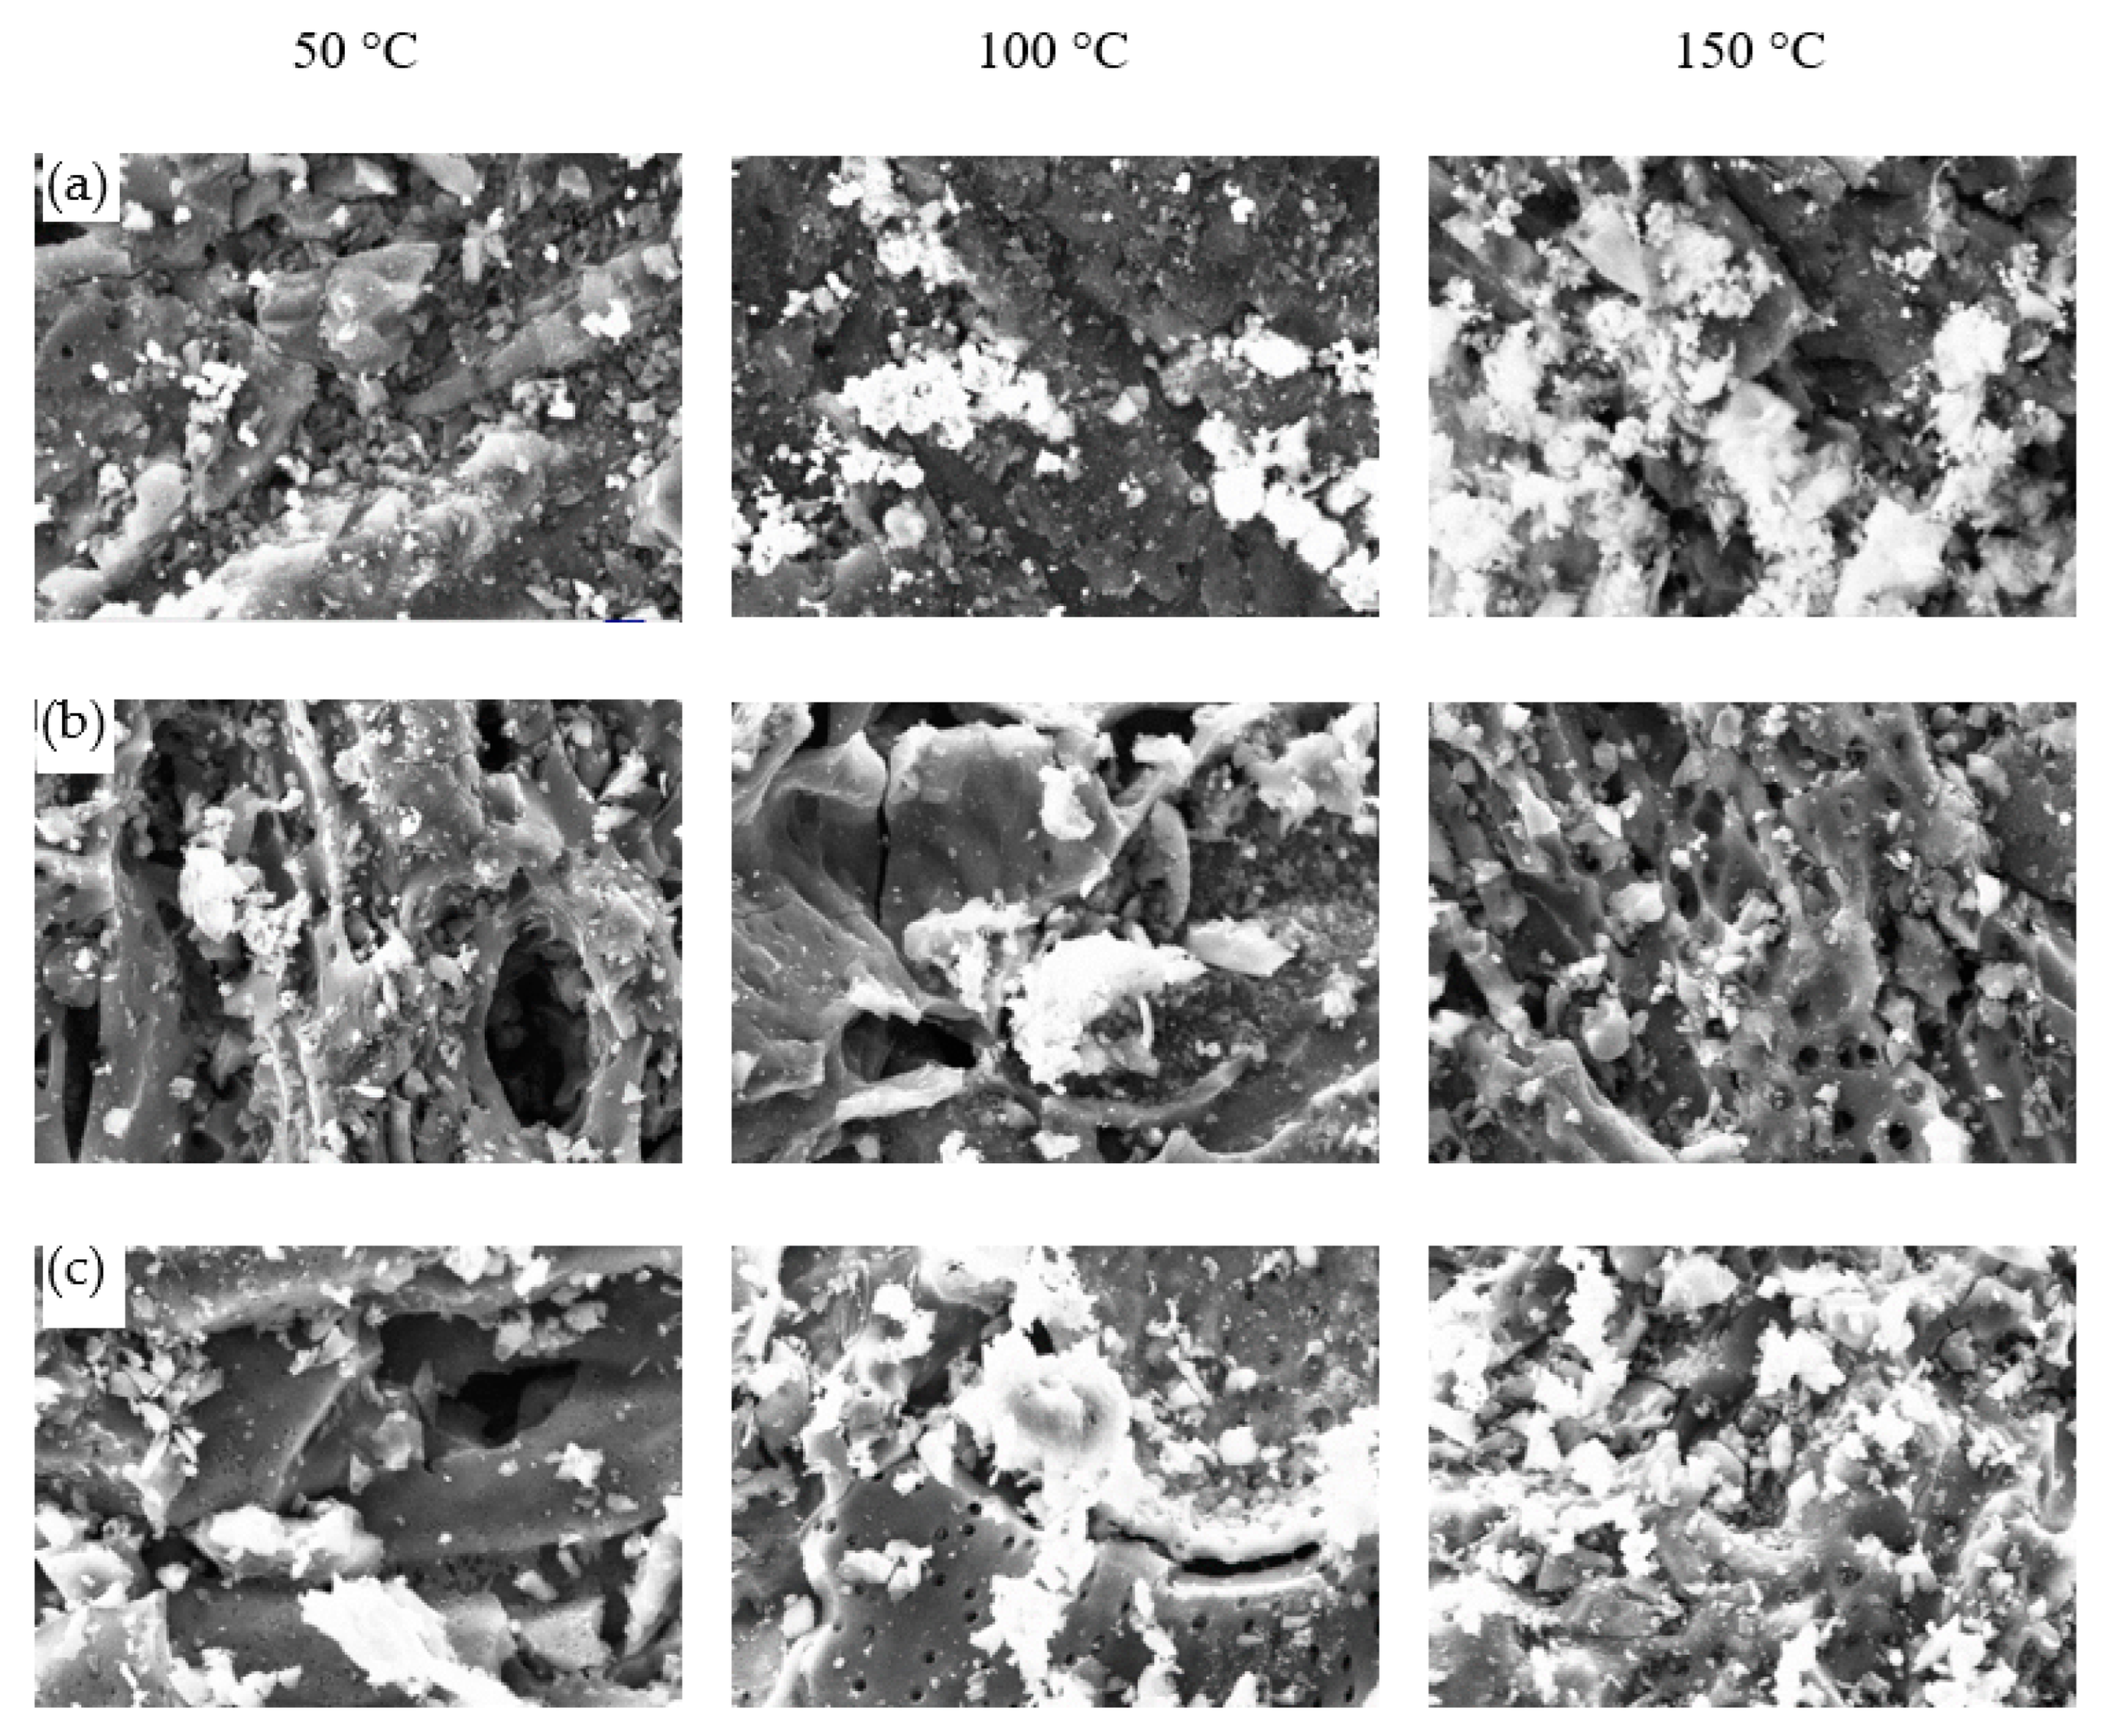
3.4. Analysis of Spent Adsorbents
- (a)
- SEM-EDX analysis
- (b)
- BET analysis
- (c)
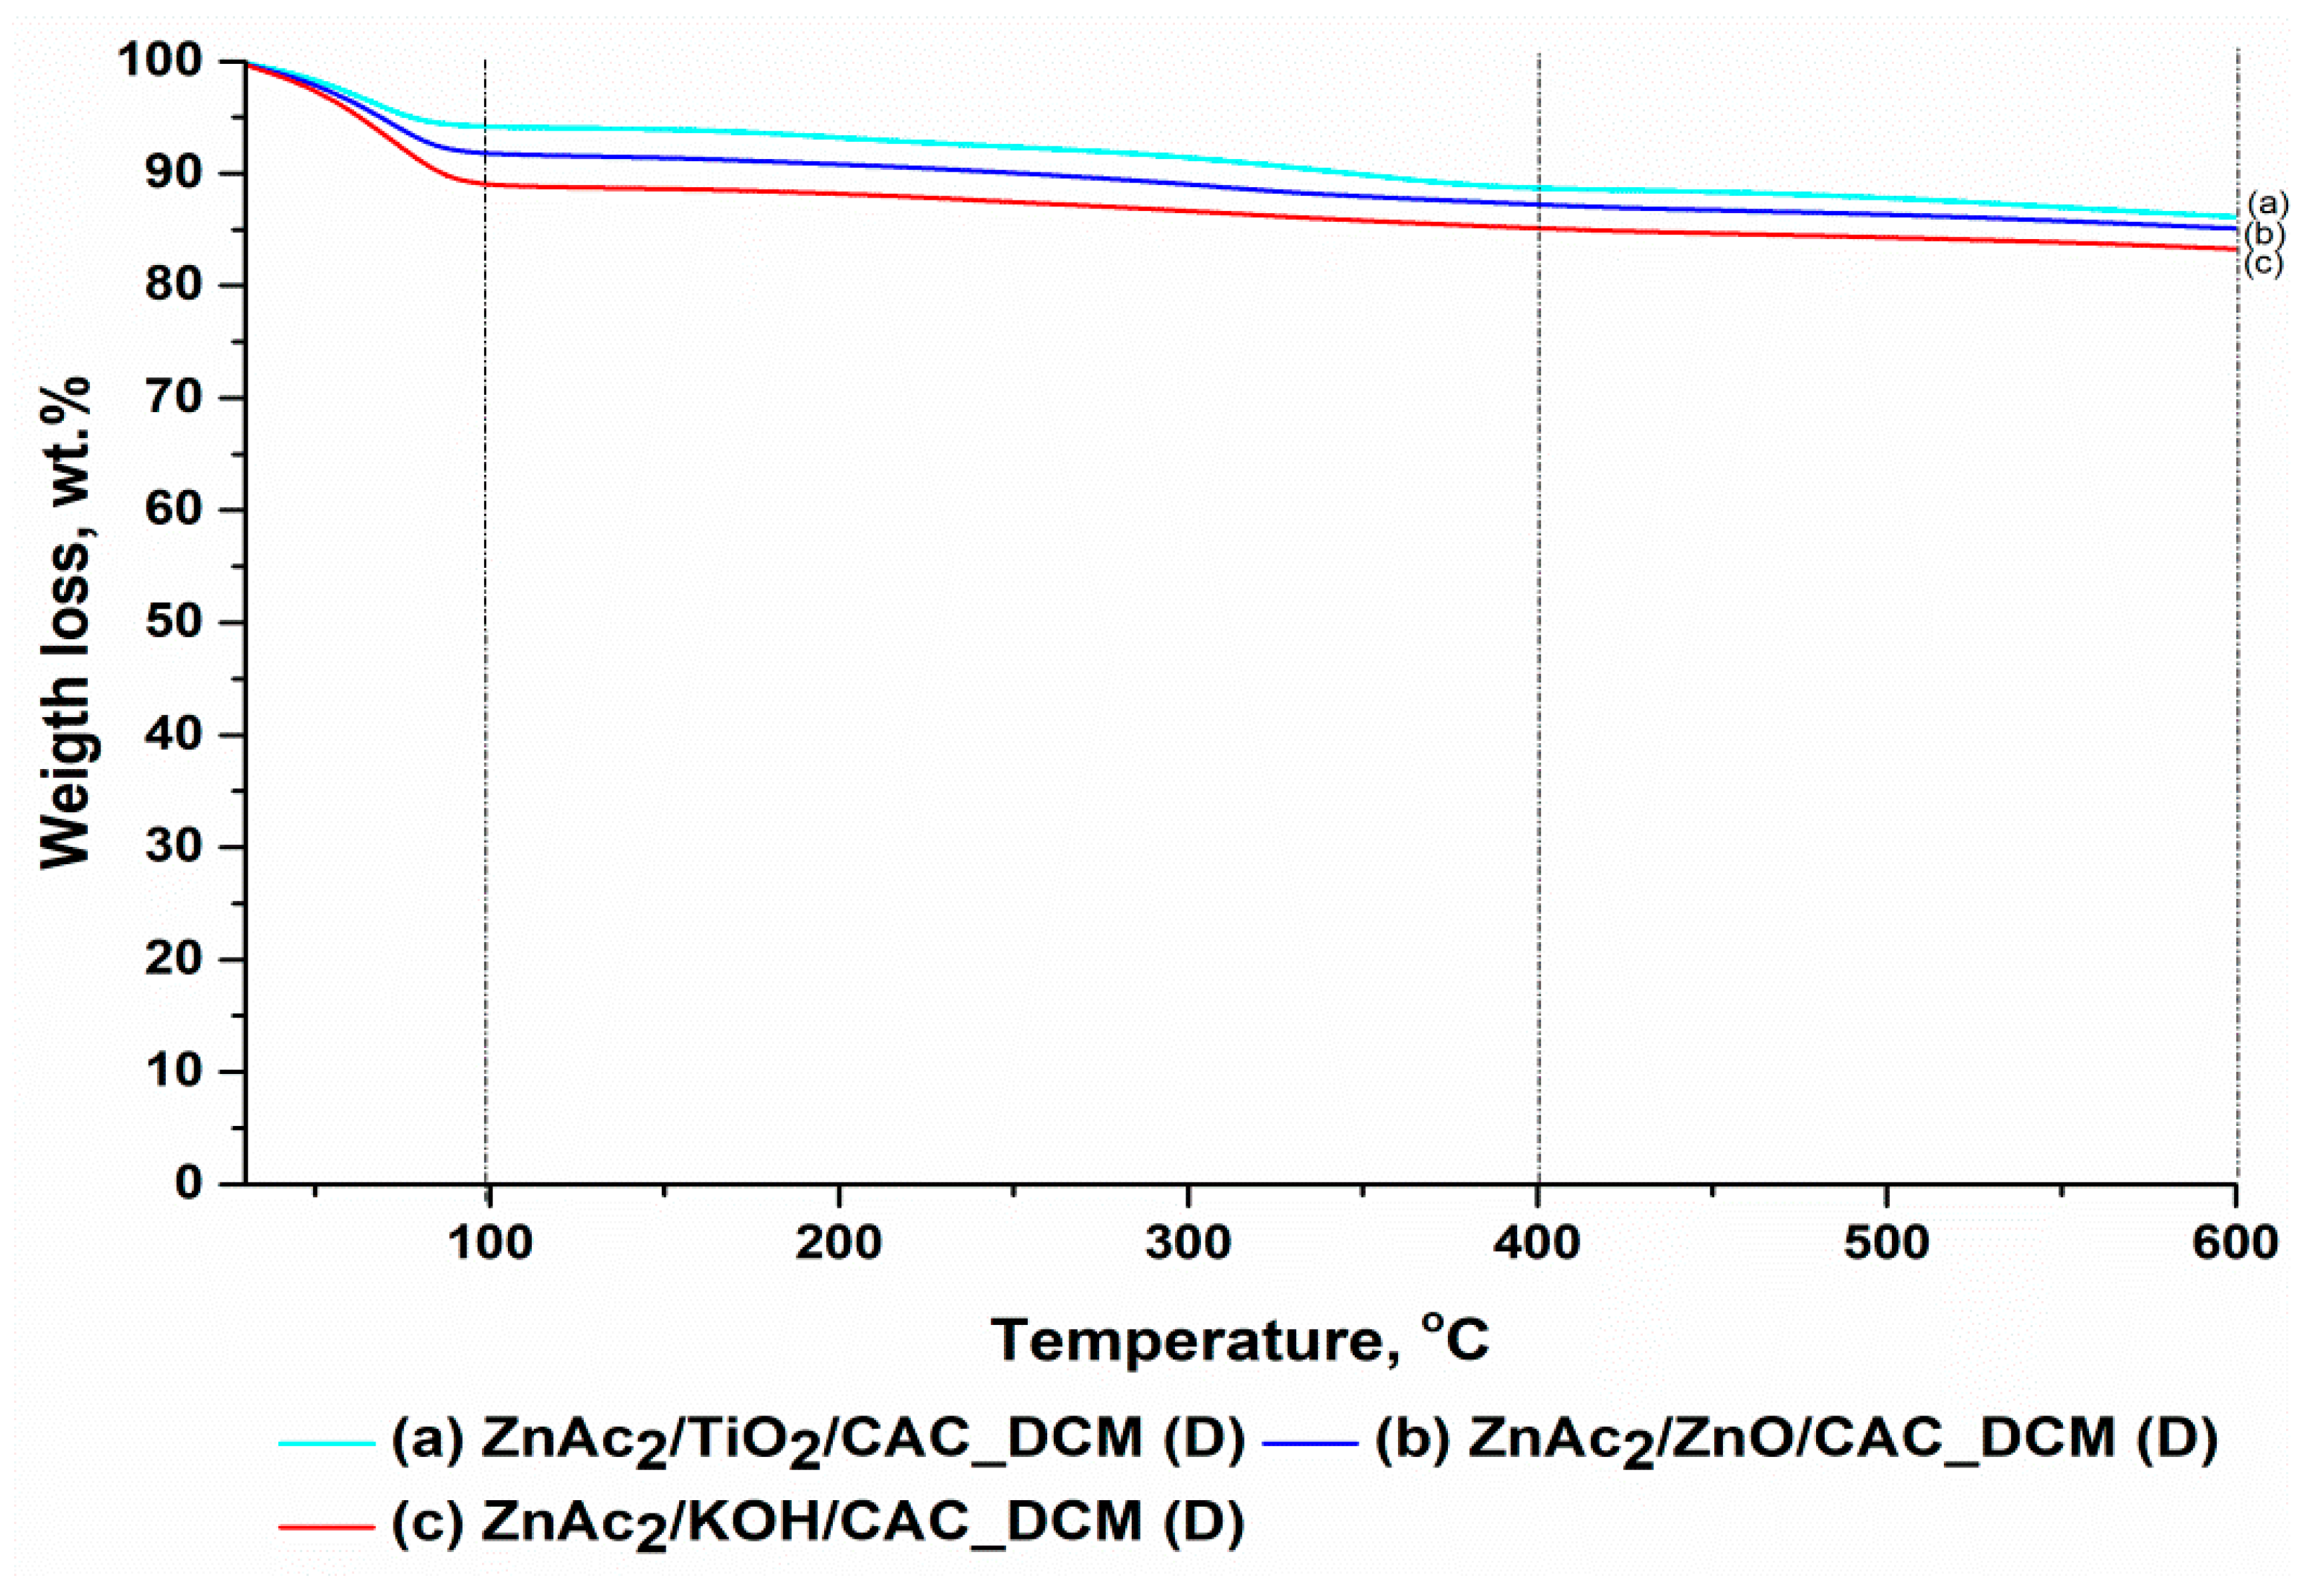
- TGA
- (d)
- FTIR
4. Conclusions
Author Contributions
Funding
Institutional Review Board Statement
Informed Consent Statement
Data Availability Statement
Conflicts of Interest
References
- Dos Santos, R.O.; Santos, L.; Prata, D.M. Simulation and optimization of a methanol synthesis process from different biogas sources. J. Clean. Prod. 2018, 186, 821–830. [Google Scholar] [CrossRef]
- Agustini, C.B.; Meyer, M.; Da Costa, M.; Gutterres, M. Biogas from anaerobic co-digestion of chrome and vegetable tannery solid waste mixture: Influence of the tanning agent and thermal pretreatment. Process. Saf. Environ. Prot. 2018, 118, 24–31. [Google Scholar] [CrossRef]
- Miltner, M.; Makaruk, A.; Harasek, M. Review on available biogas upgrading technologies and innovations towards advanced solutions. J. Clean. Prod. 2017, 161, 1329–1337. [Google Scholar] [CrossRef]
- Nemestóthy, N.; Bakonyi, P.; Szentgyörgyi, E.; Kumar, G.; Nguyen, D.D.; Chang, S. Enhancement of dark fermentative H2 production by gas separation membranes: A review. Bioresour. Technol. 2020, 302, 122828. [Google Scholar] [CrossRef]
- Moset, V.; Fontaine, D.; Møller, H. Co-digestion of cattle manure and grass harvested with different technologies. Effect on methane yield, digestate composition and energy balance. Energy 2017, 141, 451–460. [Google Scholar] [CrossRef]
- Lönnqvist, T.; Sandberg, T.; Birbuet, J.C.; Olsson, J.; Espinosa, C.; Thorin, E.; Grönkvist, S.; Gómez, M.F. Large-scale biogas generation in Bolivia—A stepwise reconfiguration. J. Clean. Prod. 2018, 180, 494–504. [Google Scholar] [CrossRef]
- Sun, L.; Pope, P.B.; Eijsink, V.G.; Schnürer, A. Characterisation of microbial community structure during continuous anaerobic digestion of straw and cow manure. Microb. Biotechnol. 2015, 8, 815–827. [Google Scholar] [CrossRef] [Green Version]
- Calbry-Muzyka, A.; Madi, H.; Rüsch-Pfund, F.; Gandiglio, M.; Biollaz, S. Biogas composition from agricultural sources and organic fraction of municipal solid waste. Renew. Energy 2022, 181, 1000–1007. [Google Scholar] [CrossRef]
- Wiheeb, A.D.; Shamsudin, I.K.; Ahmad, M.A.; Murat, M.N.; Kim, J.; Othman, M.R. Present technologies for hydrogen sulfide removal from gaseous mixtures. Rev. Chem. Eng. 2013, 29, 449–470. [Google Scholar] [CrossRef]
- Ali, G. Isothermal Modelling Based Experimental Study of Dissolved Hydrogen Sulfide Adsorption from Waste Water Using Eggshell Based Activated Carbon. Malays. J. Anal. Sci. 2017, 21, 334–345. [Google Scholar] [CrossRef]
- ATSDR. Toxicological Profile for Hydrogen Sulfide and Carbonyl Sulfide. U.S. Department of Health and Human Services Public (November). Available online: https://www.atsdr.cdc.gov/toxprofiles/tp114.pdf (accessed on 1 November 2016).
- Barbusiński, K.; Kalemba, K. Use of Biological Methods for Removal of H2S from Biogas in Wastewater Treatment Plants—A Review. Arch. Civ. Eng. Environ. 2016, 9, 103–112. [Google Scholar] [CrossRef] [Green Version]
- Zabava, B.S.; Voicu, G.; Ungureanu, N.; Dinca, M.; Paraschiv, G.; Munteanu, M.; Ferdes, M. Methods of biogas purification—A review. In Proceedings of the Acta Technica Corviniensis—Bulletin of Engineering, Hunedoara, Romania, 27 January 2019; Volume 12, pp. 65–68. [Google Scholar]
- Rasi, S.; Läntelä, J.; Rintala, J. Trace compounds affecting biogas energy utilization—A review. Energy Convers. Manag. 2011, 52, 3369–3375. [Google Scholar] [CrossRef]
- Fernández, M.; Ramírez, M.; Pérez, R.M.; Gomez, J.M.; Cantero, D. Hydrogen sulphide removal from biogas by an anoxic biotrickling filter packed with Pall rings. Chem. Eng. J. 2013, 225, 456–463. [Google Scholar] [CrossRef]
- Lewis, R.J.; Copley, G.B. Chronic low-level hydrogen sulfide exposure and potential effects on human health: A review of the epidemiological evidence. Crit. Rev. Toxicol. 2015, 45, 93–123. [Google Scholar] [CrossRef]
- Georgiadis, A.G.; Charisiou, N.D.; Goula, M.A. Removal of Hydrogen Sulfide from Various Industrial Gases: A Review of The Most Promising Adsorbing Materials. Catalysts 2020, 10, 521. [Google Scholar] [CrossRef]
- Vikrant, K.; Kailasa, S.K.; Tsang, D.C.; Lee, S.S.; Kumar, P.; Giri, B.S.; Singh, R.S.; Kim, K.-H. Biofiltration of hydrogen sulfide: Trends and challenges. J. Clean. Prod. 2018, 187, 131–147. [Google Scholar] [CrossRef]
- Carrera, L.; Springer, F.; Lipeme-Kouyi, G.; Buffiere, P. A review of sulfide emissions in sewer networks: Overall approach and systemic modelling. Water Sci. Technol. 2015, 73, 1231–1242. [Google Scholar] [CrossRef]
- Cavalli, A.; Kunze, M.; Aravind, P. Cross-influence of toluene as tar model compound and HCl on Solid Oxide Fuel Cell anodes in Integrated Biomass Gasifier SOFC Systems. Appl. Energy 2018, 231, 1–11. [Google Scholar] [CrossRef]
- Kupecki, J.; Papurello, D.; Lanzini, A.; Naumovich, Y.; Motylinski, K.; Blesznowski, M.; Santarelli, M. Numerical model of planar anode supported solid oxide fuel cell fed with fuel containing H2S operated in direct internal reforming mode (DIR-SOFC). Appl. Energy 2018, 230, 1573–1584. [Google Scholar] [CrossRef]
- Papurello, D.; Lanzini, A. SOFC single cells fed by biogas: Experimental tests with trace contaminants. Waste Manag. 2018, 72, 306–312. [Google Scholar] [CrossRef]
- Madi, H.; Lanzini, A.; Papurello, D.; Diethelm, S.; Ludwig, C.; Santarelli, M.; Van Herle, J. Solid oxide fuel cell anode degradation by the effect of hydrogen chloride in stack and single cell environments. J. Power Sources 2016, 326, 349–356. [Google Scholar] [CrossRef]
- Sidek, M.Z.; Masdar, M.S.; Nik Dir, N.M.H.; Amran, N.F.A.; Ajit Sing, S.K.D.; Wong, W.L. Integrasi Sistem Penulenan Biohidrogen dan Aplikasi Sel Fuel. J. Kejuruter. 2018, 1, 41–48. [Google Scholar]
- Ahmad, W.; Sethupathi, S.; Kanadasan, G.; Lau, L.C.; Kanthasamy, R. A review on the removal of hydrogen sulfide from biogas by adsorption using sorbents derived from waste. Rev. Chem. Eng. 2019, 37, 407–431. [Google Scholar] [CrossRef]
- Nemestothy, N.; Bakonyi, P.; Szentgyörgyi, E.; Kumar, G.; Nguyen, D.D.; Chang, S.W.; Kim, S.-H.; Bélafi-Bakó, K. Evaluation of a membrane permeation system for biogas upgrading using model and real gaseous mixtures: The effect of operating conditions on separation behaviour, methane recovery and process stability. J. Clean. Prod. 2018, 185, 44–51. [Google Scholar] [CrossRef] [Green Version]
- Bandosz, T.J. On the Adsorption/Oxidation of Hydrogen Sulfide on Activated Carbons at Ambient Temperatures. J. Colloid Interface Sci. 2002, 246, 1–20. [Google Scholar] [CrossRef]
- Sisani, E.; Cinti, G.; Discepoli, G.; Penchini, D.; Desideri, U.; Marmottini, F. Adsorptive removal of H2S in biogas conditions for high temperature fuel cell systems. Int. J. Hydrogen Energy 2014, 39, 21753–21766. [Google Scholar] [CrossRef]
- Mescia, D.; Hernández, S.; Conoci, A.; Russo, N. MSW landfill biogas desulfurization. Int. J. Hydrogen Energy 2011, 36, 7884–7890. [Google Scholar] [CrossRef]
- Muthukumaran, S.; Kumar, M.A. Structural, FTIR and photoluminescence properties of ZnS:Cu thin films by chemical bath deposition method. Mater. Lett. 2013, 93, 223–225. [Google Scholar] [CrossRef]
- Bamdad, H.; Hawboldt, K.; MacQuarrie, S. A review on common adsorbents for acid gases removal: Focus on biochar. Renew. Sustain. Energy Rev. 2018, 81, 1705–1720. [Google Scholar] [CrossRef]
- Sitthikhankaew, R.; Chadwick, D.; Assabumrungrat, S.; Laosiripojana, N. Effect of KI and KOH Impregnations over Activated Carbon on H2S Adsorption Performance at Low and High Temperatures. Sep. Sci. Technol. 2014, 49, 354–366. [Google Scholar] [CrossRef]
- Zulkefli, N.N.; Masdar, M.S.; Wan Isahak, W.N.R.; Md Jahim, J.; Md Rejab, S.A.; Chien Lye, C. Removal of hydrogen sulfide from a biogas mimic by using impregnated activated carbon adsorbent. PLoS ONE 2019, 14, e0211713. [Google Scholar] [CrossRef] [Green Version]
- Balichard, K.; Nyikeine, C.; Bezverkhyy, I. Nanocrystalline ZnCO3—A novel sorbent for low-temperature removal of H2S. J. Hazard. Mater. 2014, 264, 79–83. [Google Scholar] [CrossRef]
- Yamamoto, T.; Tayakout-Fayolle, M.; Geantet, C. Gas-phase removal of hydrogen sulfide using iron oxyhydroxide at low temperature: Measurement of breakthrough curve and modeling of sulfidation mechanism. Chem. Eng. J. 2015, 262, 702–709. [Google Scholar] [CrossRef]
- Zhao, W.; Manno, M.; Al Wahedi, Y.; Tsapatsis, M.; Stein, A. Regenerable Sorbent Pellets for the Removal of Dilute H2S from Claus Process Tail Gas. Ind. Eng. Chem. Res. 2021, 60, 18443–18451. [Google Scholar] [CrossRef]
- Zhao, W.; Vaithilingam, B.V.; Ghosh, S.; Li, X.; Geuzebroek, F.; El Nasr, A.S.; Khan, I.; Dara, S.; Mittal, N.; Daoutidis, P.; et al. High-Capacity Regenerable H2S Sorbent for Reducing Sulfur Emissions. Ind. Eng. Chem. Res. 2021, 60, 14779–14787. [Google Scholar] [CrossRef]
- Montes, D.; Tocuyo, E.; González, E.; Rodríguez, D.; Solano, R.; Atencio, R.; Moronta, A. Reactive H2S chemisorption on mesoporous silica molecular sievesupported CuO or ZnO. Microporous Mesoporous Mater. 2013, 168, 111–120. [Google Scholar] [CrossRef]
- Elyassi, B.; Al Wahedi, Y.; Rajabbeigi, N.; Kumar, P.; Jeong, J.S.; Zhang, X.; Kumar, P.; Balasubramanian, V.V.; Katsiotis, M.S.; Mkhoyan, K.A.; et al. A high-performance adsorbent for hydrogen sulfide removal. Microporous Mesoporous Mater. 2014, 190, 152–155. [Google Scholar] [CrossRef]
- Zulkefli, N.N.; Seladorai, R.; Masdar, M.S.; Sofian, N.M.; Isahak, W.N.R.W. Core Shell Nanostructure: Impregnated Activated Carbon as Adsorbent for Hydrogen Sulfide Adsorption. Molecules 2022, 27, 1145. [Google Scholar] [CrossRef]
- Zulkefli, N.N.; Masdar, M.S.; Wan Isahak, W.N.R.; Abu Bakar, S.N.H.; Abu Hasan, H.; Mohd Sofian, N. Application of Response Surface Methodology for Preparation of ZnAC2/CAC Adsorbents for Hydrogen Sulfide (H2S) Capture. Catalysts 2021, 11, 545. [Google Scholar] [CrossRef]
- Rodriguez, J.A.; Jirsak, T.; Chaturvedi, S. Reaction of H2S with MgO(100) and Cu/MgO(100) surfaces: Band-gap size and chemical reactivity. J. Chem. Phys. 1999, 111, 8077–8087. [Google Scholar] [CrossRef]
- Yang, C.; Wang, Y.; Fan, H.; de Falco, G.; Yang, S.; Shangguan, J.; Bandosz, T.J. Bifunctional ZnO-MgO/activated carbon adsorbents boost H2S room temperature adsorption and catalytic oxidation. Appl. Catal. B: Environ. 2020, 266, 118674. [Google Scholar] [CrossRef]
- Hervy, M.; Minh, D.P.; Gérente, C.; Weiss-Hortala, E.; Nzihou, A.; Villot, A.; Le Coq, L. H2S removal from syngas using wastes pyrolysis chars. Chem. Eng. J. 2018, 334, 2179–2189. [Google Scholar] [CrossRef] [Green Version]
- Primavera, A.; Trovarelli, A.; Andreussi, P.; Dolcetti, G. The effect of water in the low-temperature catalytic oxidation of hydrogen sulfide to sulfur over activated carbon. Appl. Catal. A Gen. 1998, 173, 185–192. [Google Scholar] [CrossRef]
- Bagreev, A.; Rahman, H.; Bandosz, T.J. Thermal regeneration of a spent activated carbon previously used as hydrogen sulfide adsorbent. Carbon 2001, 39, 1319–1326. [Google Scholar] [CrossRef]
- Balsamo, M.; Cimino, S.; de Falco, G.; Erto, A.; Lisi, L. ZnO-CuO supported on activated carbon for H2S removal at room temperature. Chem. Eng. J. 2016, 304, 399–407. [Google Scholar] [CrossRef]
- Gasquet, V.; Kim, B.; Sigot, L.; Benbelkacem, H. H2S Adsorption from Biogas with Thermal Treatment Residues. Waste Biomass- Valorization 2020, 11, 5363–5373. [Google Scholar] [CrossRef]
- Thommes, M.; Kaneko, K.; Neimark, A.V.; Olivier, J.P.; Rodriguez-Reinoso, F.; Rouquerol, J.; Sing, K.S.W. Physisorption of gases, with special reference to the evaluation of surface area and pore size distribution (IUPAC Technical Report). Pure Appl. Chem. 2015, 87, 1051–1069. [Google Scholar] [CrossRef] [Green Version]
- Roque-Malherbe, R.M. Adsorption and Diffusion in Nanoporous Materials; CRC Press: Boca Raton, FL, USA, 2007. [Google Scholar] [CrossRef]
- Bashkova, S.; Baker, F.S.; Wu, X.; Armstrong, T.R.; Schwartz, V. Activated carbon catalyst for selective oxidation of hydrogen sulphide: On the influence of pore structure, surface characteristics, and catalytically-active nitrogen. Carbon 2007, 45, 1354–1363. [Google Scholar] [CrossRef]
- Reshadi, M.A.M.; Bazargan, A.; McKay, G. A review of the application of adsorbents for landfill leachate treatment: Focus on magnetic adsorption. Sci. Total Environ. 2020, 731, 138863. [Google Scholar] [CrossRef]
- Bai, B.C.; Lee, C.W.; Lee, Y.-S.; Im, J.S. Metal impregnate on activated carbon fiber for SO 2 gas removal: Assessment of pore structure, Cu supporter, breakthrough, and bed utilization. Colloids Surfaces A Physicochem. Eng. Asp. 2016, 509, 73–79. [Google Scholar] [CrossRef]
- Zhang, J.J.; Wang, W.Y.; Shen, L.P.; Wang, G.J.; Song, H. Synthesis and characterization of MnxOy–ZnxOy/AC adsorbents for adsorptive removal of H2S from natural gas. Adsorpt. Sci. Technol. 2016, 34, 331–341. [Google Scholar] [CrossRef] [Green Version]
- Sethupathi, S.; Kai, Y.C.; Kong, L.L.; Munusamy, Y.; Bashir, M.J.K.; Iberahim, N. Preliminary study of sulfur dioxide removal using calcined egg shell. Malays. J. Anal. Sci. 2017, 21, 719–725. [Google Scholar] [CrossRef]
- Guo, X.; Li, M.; Liu, A.; Jiang, M.; Niu, X.; Liu, X. Adsorption Mechanisms and Characteristics of Hg2+ Removal by Different Fractions of Biochar. Water 2020, 12, 2105. [Google Scholar] [CrossRef]
- Yang, C.; Wang, J.; Fan, H.-L.; Shangguan, J.; Mi, J.; Huo, C. Contributions of tailored oxygen vacancies in ZnO/Al2O3 composites to the enhanced ability for H2S removal at room temperature. Fuel 2018, 215, 695–703. [Google Scholar] [CrossRef]
- Saleem, J.; Shahid, U.B.; Hijab, M.; Mackey, H.; McKay, G. Production and applications of activated carbons as adsorbents from olive stones. Biomass- Convers. Biorefinery 2019, 9, 775–802. [Google Scholar] [CrossRef] [Green Version]
- Feng, Y.; Dou, J.; Tahmasebi, A.; Xu, J.; Li, X.; Yu, J.; Yin, F. Regeneration of Fe–Zn–Cu Sorbents Supported on Activated Lignite Char for the Desulfurization of Coke Oven Gas. Energy Fuels 2015, 29, 7124–7134. [Google Scholar] [CrossRef]
- Mistar, E.M.; Alfatah, T.; Supardan, M.D. Synthesis and characterization of activated carbon from Bambusa vulgaris striata using two-step KOH activation. J. Mater. Res. Technol. 2020, 9, 6278–6286. [Google Scholar] [CrossRef]
- Li, X.; Ju, Y.; Hou, Q.; Li, Z.; Fan, J. FTIR and Raman Spectral Research on Metamorphism and Deformation of Coal. J. Geol. Res. 2012, 2012, 590857. [Google Scholar] [CrossRef] [Green Version]
- Xiao, Y.; Wang, S.; Wu, D.; Yuan, Q. Experimental and simulation study of hydrogen sulfide adsorption on impregnated activated carbon under anaerobic conditions. J. Hazard. Mater. 2008, 153, 1193–1200. [Google Scholar] [CrossRef]
- Vinodhini, V.; Das, N. Packed bed column studies on Cr (VI) removal from tannery wastewater by neem sawdust. Desalination 2010, 264, 9–14. [Google Scholar] [CrossRef]
- Zhao, Y.-R.; Zhang, Z.-R.; Yang, C.; Fan, H.-L.; Wang, J.; Tian, Z.; Zhang, H.-Y. Critical Role of Water on the Surface of ZnO in H2S Removal at Room Temperature. Ind. Eng. Chem. Res. 2018, 57, 45. [Google Scholar] [CrossRef]
- Jiang, D.; Su, L.; Ma, L.; Yao, N.; Xu, X.; Tang, H.; Li, X. Cu–Zn–Al mixed metal oxides derived from hydroxycarbonate precursors for H2S removal at low temperature. Appl. Surf. Sci. 2010, 256, 3216–3223. [Google Scholar] [CrossRef]
- Sitthikhankaew, R.; Predapitakkun, S.; Kiattikomol, R.; Pumhiran, S.; Assabumrungrat, S.; Laosiripojana, N. Comparative Study of Hydrogen Sulfide Adsorption by using Alkaline Impregnated Activated Carbons for Hot Fuel Gas Purification. Energy Procedia 2011, 9, 15–24. [Google Scholar] [CrossRef] [Green Version]
- Ozekmekci, M.; Salkic, G.; Fellah, M.F. Use of zeolites for the removal of H2S: A mini-review. Fuel Process. Technol. 2015, 139, 49–60. [Google Scholar] [CrossRef]
- Ling, L.; Zhang, R.; Han, P.; Wang, B. DFT study on the sulfurization mechanism during the desulfurization of H2S on the ZnO desulfurizer. Fuel Process. Technol. 2013, 106, 222–230. [Google Scholar] [CrossRef]
- Brazhnyk, D.V.; Zaitsev, Y.P.; Bacherikova, I.V.; Zazhigalov, V.A.; Stoch, J.; Kowal, A. Oxidation of H2S on activated carbon KAU and influence of the surface state. Appl. Catal. B: Environ. 2007, 70, 557–566. [Google Scholar] [CrossRef]
- Yusuf, N.; Masdar, M.; Isahak, W.; Nordin, D.; Husaini, T.; Majlan, E.; Wu, S.; Rejab, S.; Lye, C. Impregnated carbon–ionic liquid as innovative adsorbent for H2/CO2 separation from biohydrogen. Int. J. Hydrogen Energy 2018, 44, 3414–3424. [Google Scholar] [CrossRef]
- Huang, C.-C.; Chen, C.-H.; Chu, S.-M. Effect of moisture on H2S adsorption by copper impregnated activated carbon. J. Hazard. Mater. 2006, 136, 866–873. [Google Scholar] [CrossRef] [PubMed]
- Shang, G.; Li, Q.; Liu, L.; Chen, P.; Huang, X. Adsorption of hydrogen sulfide by biochars derived from pyrolysis of different agricultural/forestry wastes. J. Air Waste Manag. Assoc. 2015, 66, 8–16. [Google Scholar] [CrossRef] [PubMed] [Green Version]
- Xu, X.; Cao, X.; Zhao, L.; Sun, T. Comparison of sewage sludge- and pig manure- derived biochars for hydrogen sulfide removal. Chemosphere 2014, 111, 296–303. [Google Scholar] [CrossRef] [PubMed]
- Jurablu, S.; Farahmandjou, M.; Firoozabadi, T.P. Sol-Gel Synthesis of Zinc Oxide (ZnO) Nanoparticles: Study of Structural and Optical Properties. J. Sci. Islamic Repub. Iran 2015, 26, 281–285. [Google Scholar] [CrossRef]


| Adsorbents | C | Ca | O | K | Ti | Zn |
|---|---|---|---|---|---|---|
| ZnAc2/ZnO/CAC_DCM (F) | 37.2 | 1.31 | 33.26 | 0 | 0 | 30.14 |
| ZnAc2/TiO2/CAC_DCM (F) | 36.70 | 1.01 | 28.60 | 0 | 18.83 | 14.95 |
| ZnAc2/KOH/CAC_DCM (F) | 43.92 | 0.92 | 24.86 | 13.39 | 0 | 16.91 |
| ZnAc2/CAC_SI (F) | 86.36 | 0.43 | 6.93 | 0 | 0 | 6.28 |
| Raw CAC (F) | 96.94 | 0.73 | 2.33 | 0 | 0 | 0 |
| Adsorbents | BET Surface Area, SBET (m2/g) | Total Pore Volume (cm3/g) | Micropore Area (m2/g) | Pore Size (Å) |
|---|---|---|---|---|
| ZnAc2/ZnO/CAC_DCM (F) | 847.10 | 0.41 | 688.14 | 19.21 |
| ZnAc2/TiO2/CAC_DCM (F) | 902.25 | 0.44 | 706.03 | 19.33 |
| ZnAc2/KOH/CAC_DCM (F) | 887.54 | 0.43 | 709.92 | 19.17 |
| ZnAc2/CAC_SI (F) | 868.05 | 0.41 | 702.89 | 19.34 |
| Raw CAC (F) | 899.05 | 0.42 | 730.02 | 18.82 |
| Adsorbents | Temperature Derivative (°C) | Weight Loss (%) |
|---|---|---|
| ZnAc2/ZnO/CAC_DCM | 25–100 | 10.23 |
| 100–400 | 3.90 | |
| 400–600 | 3.76 | |
| ZnAc2/TiO2/CAC_DCM | 25–100 | 10.29 |
| 100–400 | 2.62 | |
| 400–600 | 4.55 | |
| ZnAc2/KOH/CAC_DCM | 25–100 | 11.92 |
| 100–400 | 4.27 | |
| 400–600 | 4.29 | |
| ZnAc2/CAC_SI | 25–100 | 6.9 |
| 100–400 | 6.1 | |
| 400–600 | 3.1 | |
| Raw CAC | 25–100 | 15.4 |
| 100–400 | 4.80 | |
| 400–600 | 4.90 |
| Adsorbents | Breakthrough Time (Min) | Adsorption Capacity (mg H2S/g) |
|---|---|---|
| ZnAc2/ZnO/CAC_DCM | 46 | 1.92 |
| ZnAc2/KOH/CAC_DCM | 39 | 1.49 |
| ZnAc2/TiO2/CAC_DCM | 42 | 1.88 |
| ZnAc2/CAC_SI | 25 | 1.04 |
| Raw CAC | 5 | 0.21 |
| Adsorbent | No. of Cycles | Blower Temperature (°C) | Breakthrough Time (Min) | H2S Adsorption Capacity (mg H2S/g) | Degradation Percentage (%) |
|---|---|---|---|---|---|
| ZnAc2/ZnO/CAC_DCM | 1 | 50 | 43 | 1.80 | 0 |
| 2 | 23 | 0.96 | 46.7 | ||
| 3 | 17 | 0.71 | 26.0 | ||
| 1 | 100 | 46 | 1.92 | 0 | |
| 2 | 25 | 1.04 | 45.8 | ||
| 3 | 19 | 0.79 | 24.0 | ||
| 1 | 150 | 42 | 1.65 | 0 | |
| 2 | 27 | 1.01 | 38.8 | ||
| 3 | 24 | 0.94 | 6.9 | ||
| ZnAc2/KOH/CAC_DCM | 1 | 50 | 37 | 1.54 | 0 |
| 2 | 27 | 1.13 | 26.6 | ||
| 3 | 24 | 1.0 | 11.5 | ||
| 1 | 100 | 34 | 1.42 | 0 | |
| 2 | 23 | 0.96 | 32.4 | ||
| 3 | 20 | 0.84 | 12.5 | ||
| 1 | 150 | 30 | 1.25 | 0 | |
| 2 | 19 | 0.79 | 36.8 | ||
| 3 | 16 | 0.67 | 15.2 | ||
| ZnAc2/TiO2/CAC_DCM | 1 | 50 | 40 | 1.67 | 0 |
| 2 | 19 | 0.79 | 52.7 | ||
| 3 | 15 | 0.63 | 20.3 | ||
| 1 | 100 | 44 | 1.84 | 0 | |
| 2 | 22 | 0.92 | 50.0 | ||
| 3 | 17 | 0.67 | 27.2 | ||
| 1 | 150 | 47 | 1.96 | 0 | |
| 2 | 24 | 1.0 | 49.0 | ||
| 3 | 17 | 0.71 | 29.0 | ||
| ZnAc2/CAC_SI | 1 | 50 | 26 | 1.09 | 0 |
| 2 | 12 | 0.50 | 54.1 | ||
| 3 | 9 | 0.38 | 24.0 | ||
| 1 | 100 | 24 | 1.00 | 0 | |
| 2 | 13 | 0.54 | 46.0 | ||
| 3 | 10 | 0.42 | 22.2 | ||
| 1 | 150 | 25 | 1.04 | 0 | |
| 2 | 15 | 0.63 | 39.4 | ||
| 3 | 13 | 0.54 | 14.3 | ||
| Raw CAC | 1 | 50 | 16 | 0.67 | 0 |
| 2 | 9 | 0.38 | 43.3 | ||
| 3 | 6 | 0.25 | 34.2 | ||
| 1 | 100 | 19 | 0.79 | 0 | |
| 2 | 16 | 0.67 | 15.19 | ||
| 3 | 13 | 0.54 | 19.4 | ||
| 1 | 150 | 18 | 0.75 | 0 | |
| 2 | 14 | 0.58 | 22.7 | ||
| 3 | 13 | 0.54 | 6.9 |
| Adsorbents | C | Ca | O | Zn | S |
|---|---|---|---|---|---|
| ZnAc2/ZnO/CAC_DCM (D) at 50 °C | 76.42 | 0.61 | 6.73 | 11.11 | 5.13 |
| ZnAc2/ZnO/CAC_DCM (D) at 100 °C | 76.21 | 0.23 | 8.11 | 10.68 | 4.77 |
| ZnAc2/ZnO/CAC_DCM (D) at 150 °C | 76.41 | 0.19 | 9.32 | 10.93 | 3.15 |
| ZnAc2/CAC_SI (D) at 50 °C | 83.86 | 0.69 | 3.31 | 6.71 | 5.43 |
| ZnAc2/CAC_SI (D) at 100 °C | 85.35 | 0.72 | 4.92 | 6.23 | 2.78 |
| ZnAc2/CAC_SI (D) at 150 °C | 84.97 | 0.83 | 5.70 | 6.58 | 1.92 |
| Raw CAC at 50 °C | 94.27 | 0.45 | 1.13 | 0.00 | 4.15 |
| Raw CAC at 100 °C | 94.23 | 0.43 | 2.17 | 0.00 | 3.17 |
| Raw CAC at 150 °C | 94.07 | 0.39 | 4.32 | 0.00 | 1.22 |
| Adsorbents | BET Surface Area (m2/g) | Total Pore Volume (cm3/g) | Micropore Surface Area (m2/g) | Pore Size (Å) |
|---|---|---|---|---|
| ZnAc2/ZnO/CAC_DCM (D) | 812.73 | 0.38 | 667.12 | 18.93 |
| ZnAc2/TIO2/CAC_DCM (D) | 876.61 | 0.39 | 703.88 | 18.72 |
| ZnAc2/KOH/CAC_DCM (D) | 862.14 | 0.41 | 702.70 | 18.91 |
| ZnAc2/CAC_SI (D) | 745.16 | 0.36 | 591.87 | 18.96 |
| Raw CAC (D) | 872.22 | 0.41 | 728.50 | 18.59 |
| Adsorbents | Temperature Derivative (°C) | Weight Loss (F) (%) | Weight Loss (D) (%) |
|---|---|---|---|
| ZnAc2/ZnO/CAC_DCM (D) | 29–100 | 10.23 | 8.13 |
| 100–400 | 3.90 | 12.68 | |
| 400–600 | 3.76 | 16.36 | |
| ZnAc2/TiO2/CAC_DCM (D) | 29–100 | 10.29 | 5.78 |
| 100–400 | 2.62 | 11.26 | |
| 400–600 | 4.55 | 15.83 | |
| ZnAc2/KOH/CAC_DCM (D) | 29–100 | 11.92 | 10.86 |
| 100–400 | 4.27 | 14.76 | |
| 400–600 | 4.29 | 18.35 |
Publisher’s Note: MDPI stays neutral with regard to jurisdictional claims in published maps and institutional affiliations. |
© 2022 by the authors. Licensee MDPI, Basel, Switzerland. This article is an open access article distributed under the terms and conditions of the Creative Commons Attribution (CC BY) license (https://creativecommons.org/licenses/by/4.0/).
Share and Cite
Zulkefli, N.N.; Mathuray Veeran, L.S.; Noor Azam, A.M.I.; Masdar, M.S.; Wan Isahak, W.N.R. Effect of Bimetallic-Activated Carbon Impregnation on Adsorption–Desorption Performance for Hydrogen Sulfide (H2S) Capture. Materials 2022, 15, 5409. https://doi.org/10.3390/ma15155409
Zulkefli NN, Mathuray Veeran LS, Noor Azam AMI, Masdar MS, Wan Isahak WNR. Effect of Bimetallic-Activated Carbon Impregnation on Adsorption–Desorption Performance for Hydrogen Sulfide (H2S) Capture. Materials. 2022; 15(15):5409. https://doi.org/10.3390/ma15155409
Chicago/Turabian StyleZulkefli, Nurul Noramelya, Loshinni S. Mathuray Veeran, Adam Mohd Izhan Noor Azam, Mohd Shahbudin Masdar, and Wan Nor Roslam Wan Isahak. 2022. "Effect of Bimetallic-Activated Carbon Impregnation on Adsorption–Desorption Performance for Hydrogen Sulfide (H2S) Capture" Materials 15, no. 15: 5409. https://doi.org/10.3390/ma15155409