
Study on Pyrolysis–Mechanics–Seepage Behavior of Oil Shale in a Closed System Subject to Real-Time Temperature Variations


Abstract
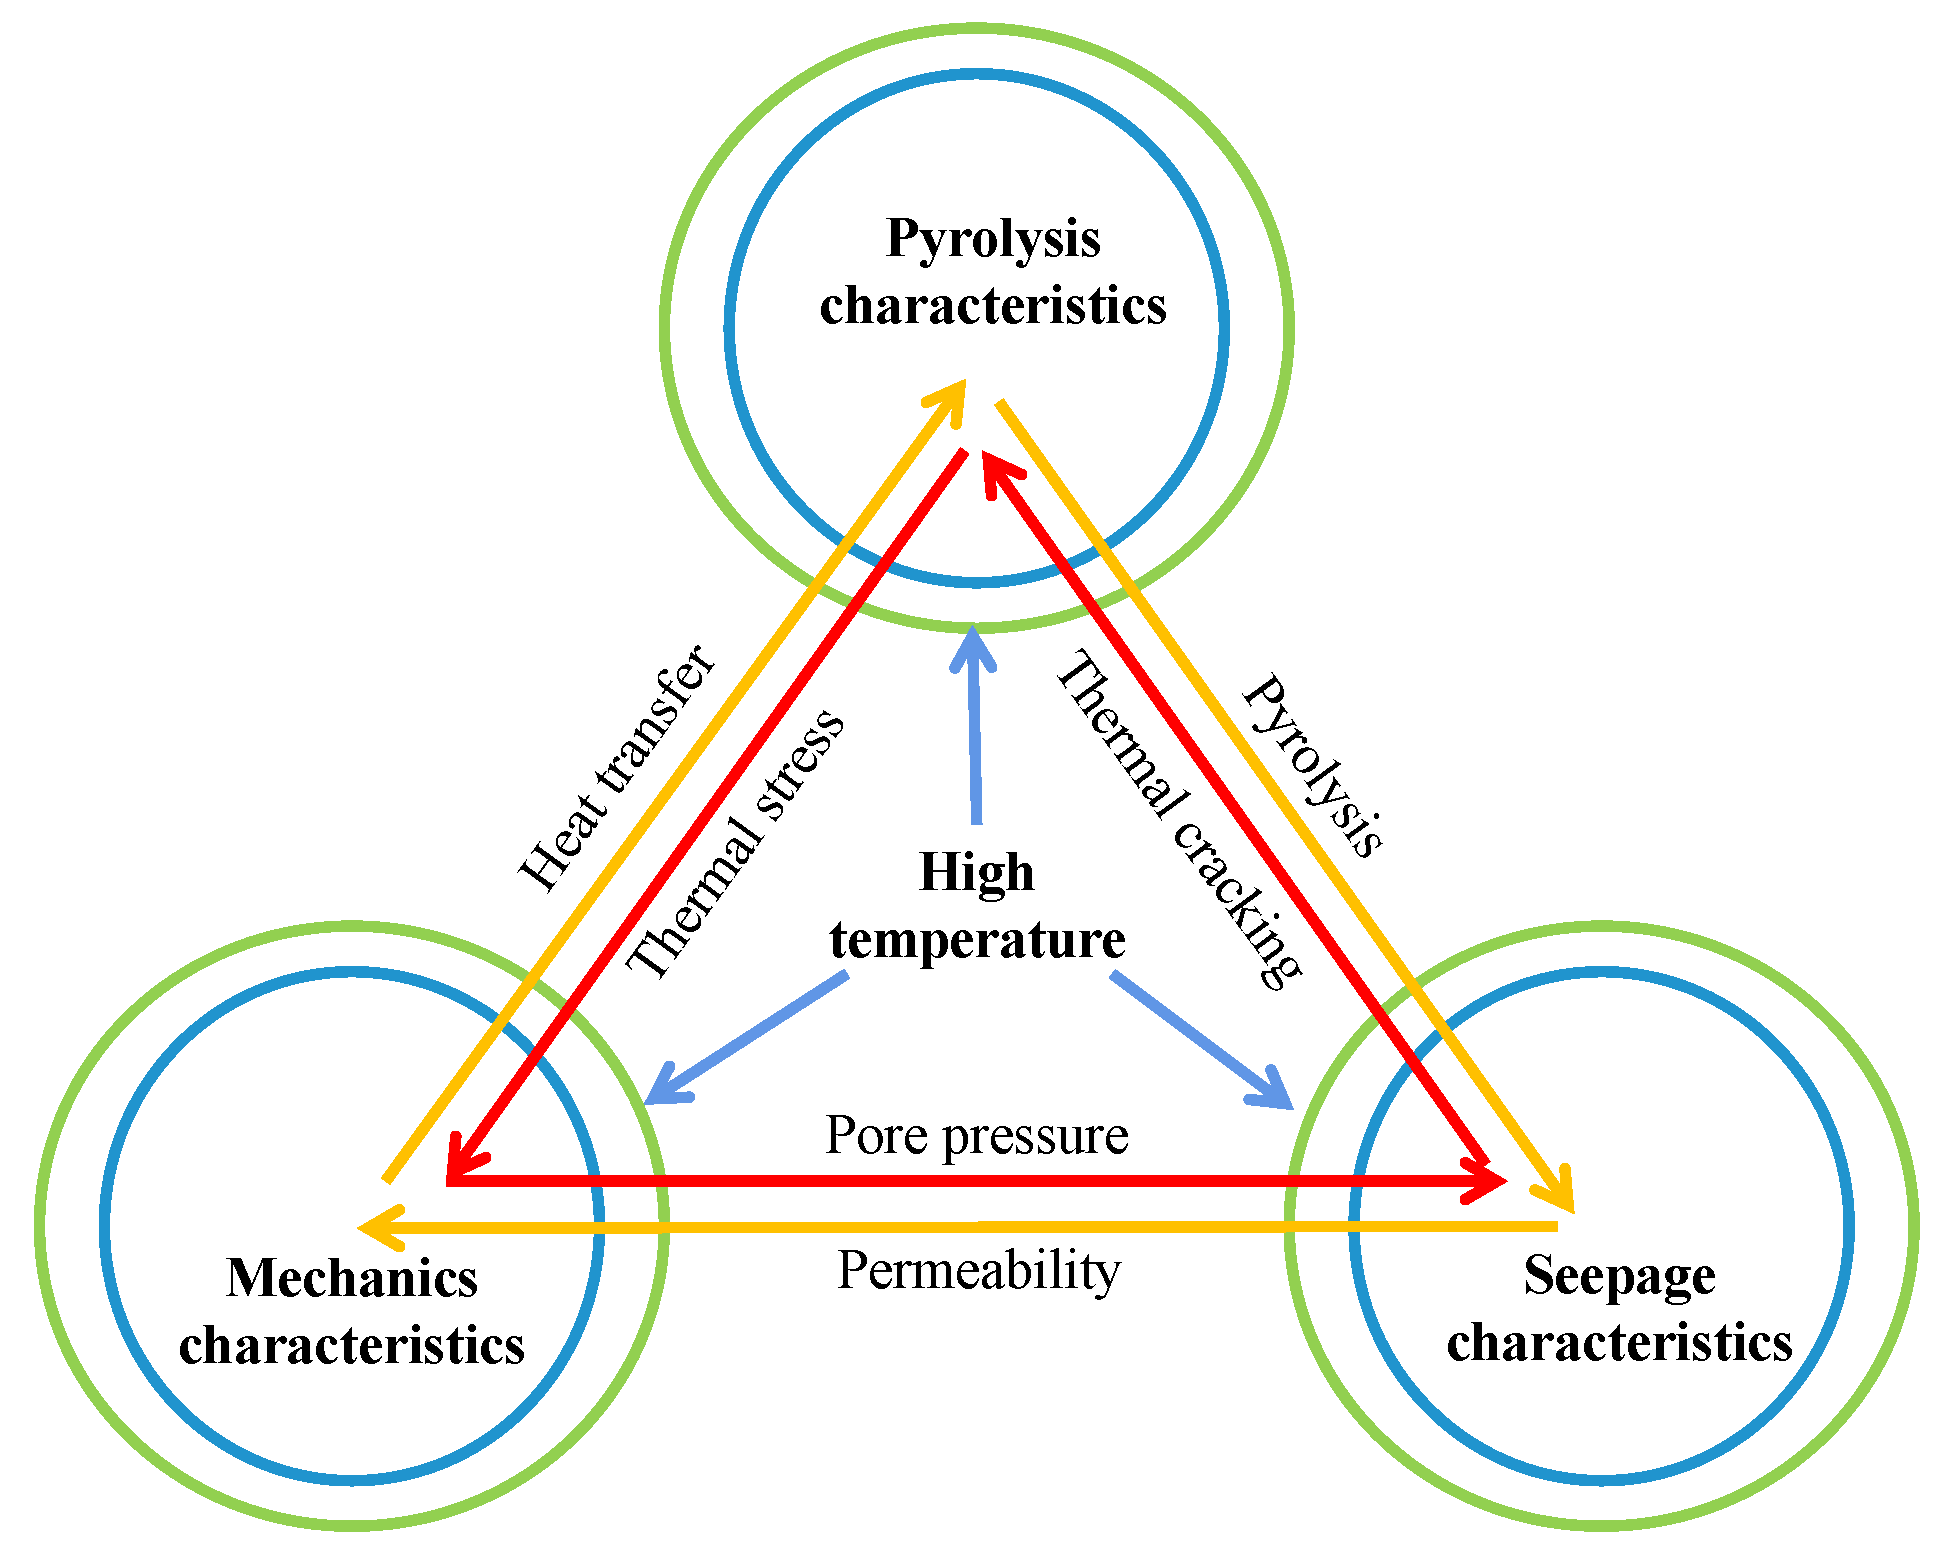
:1. Introduction
2. Methods
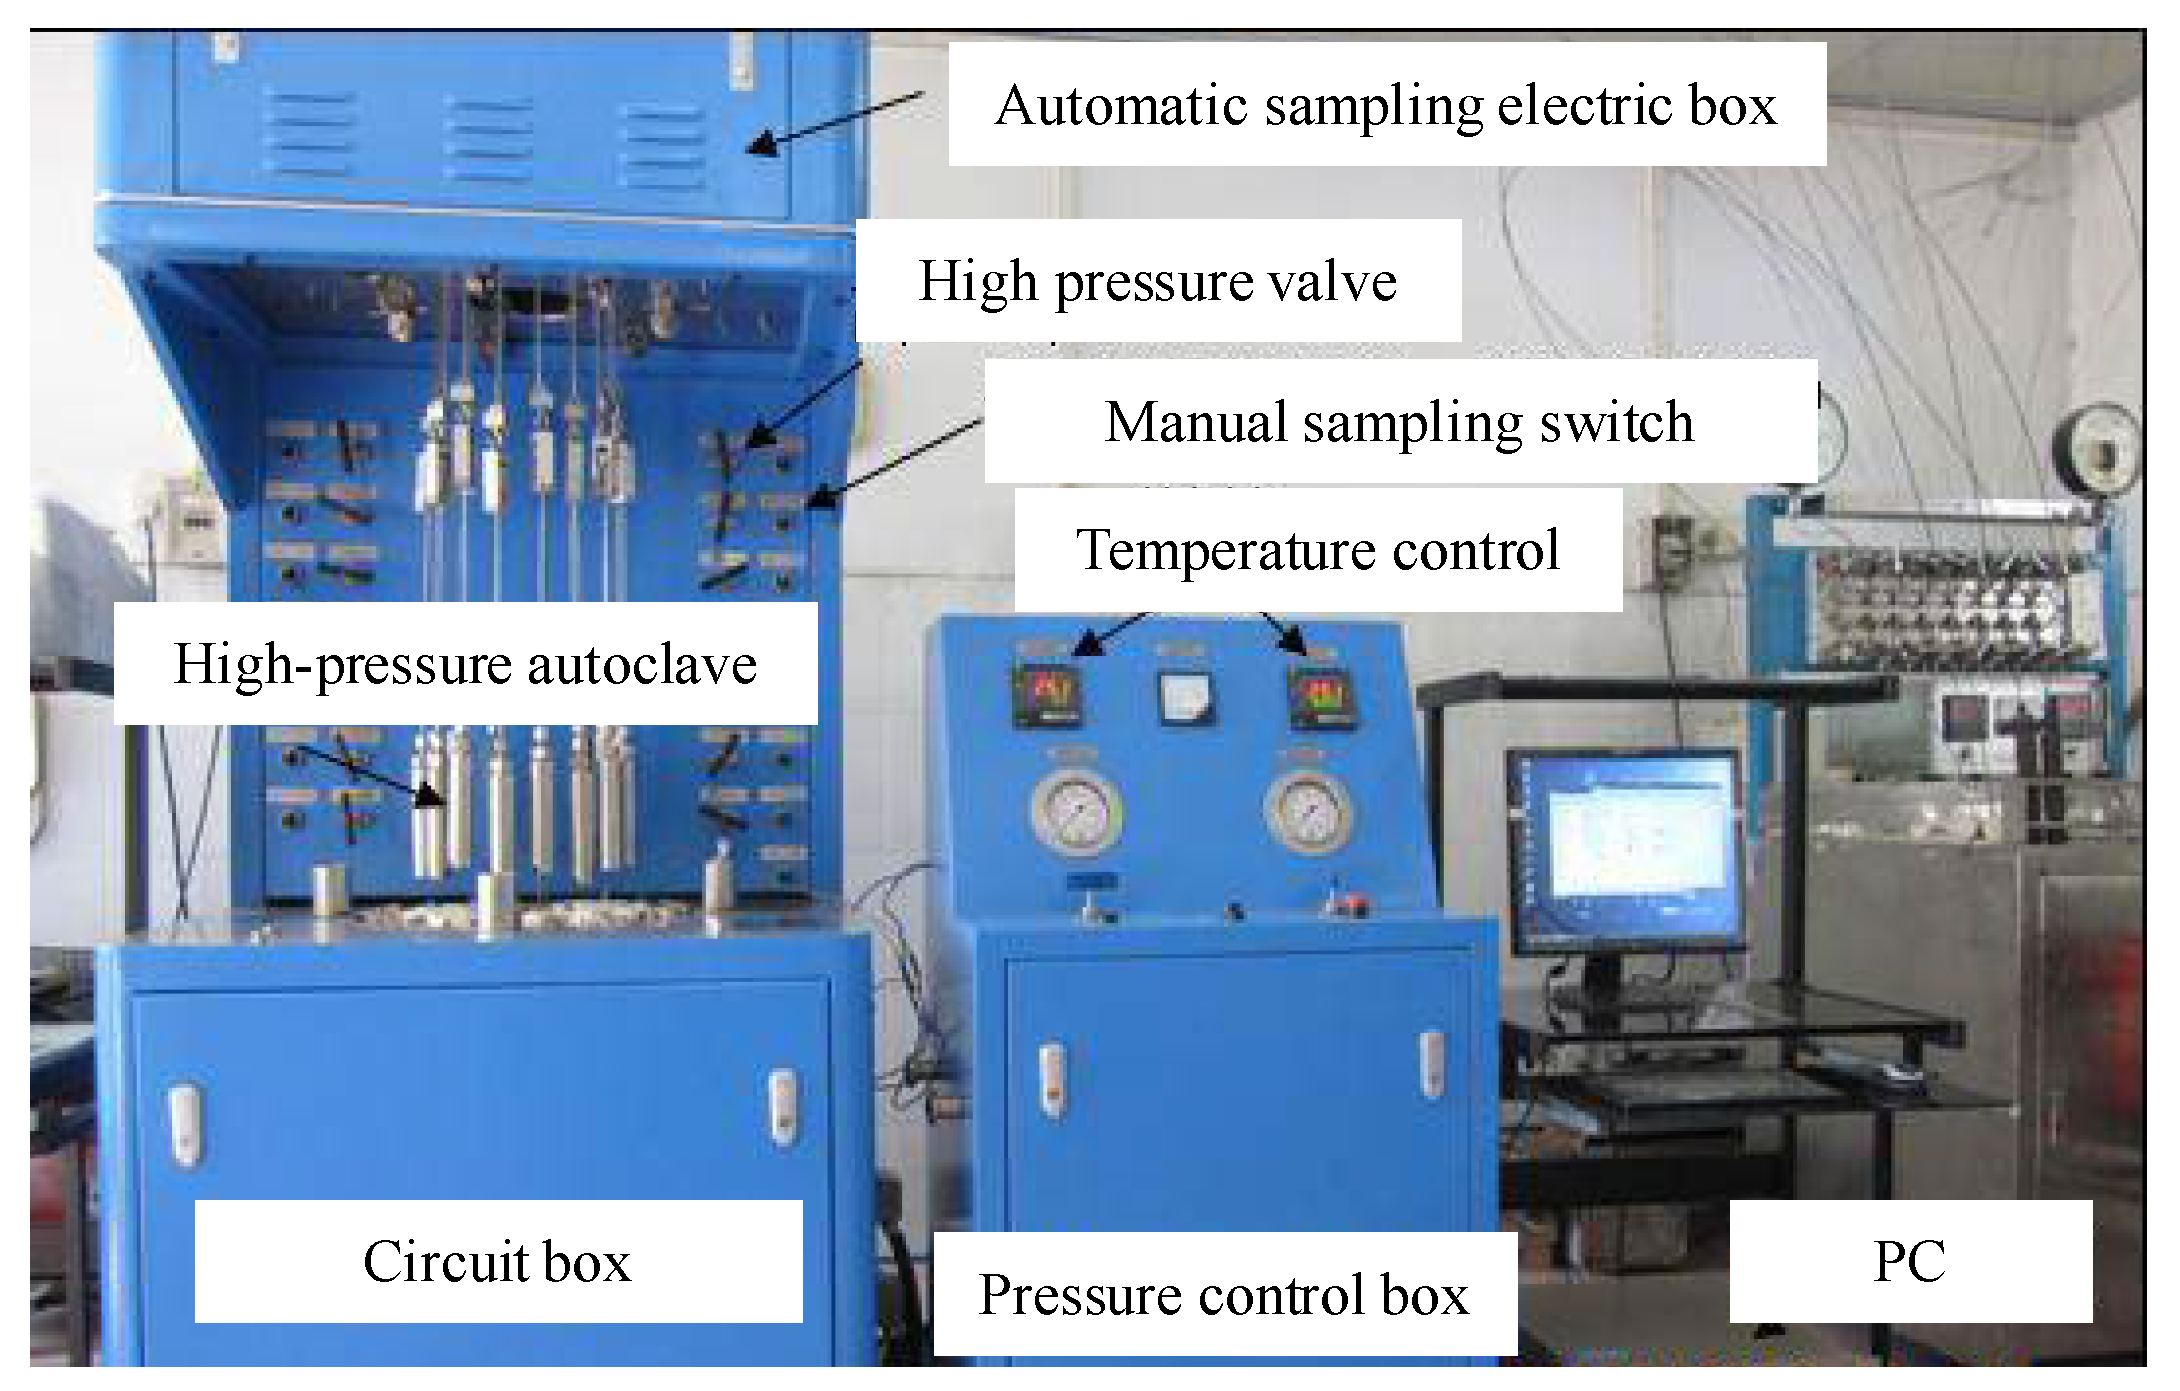
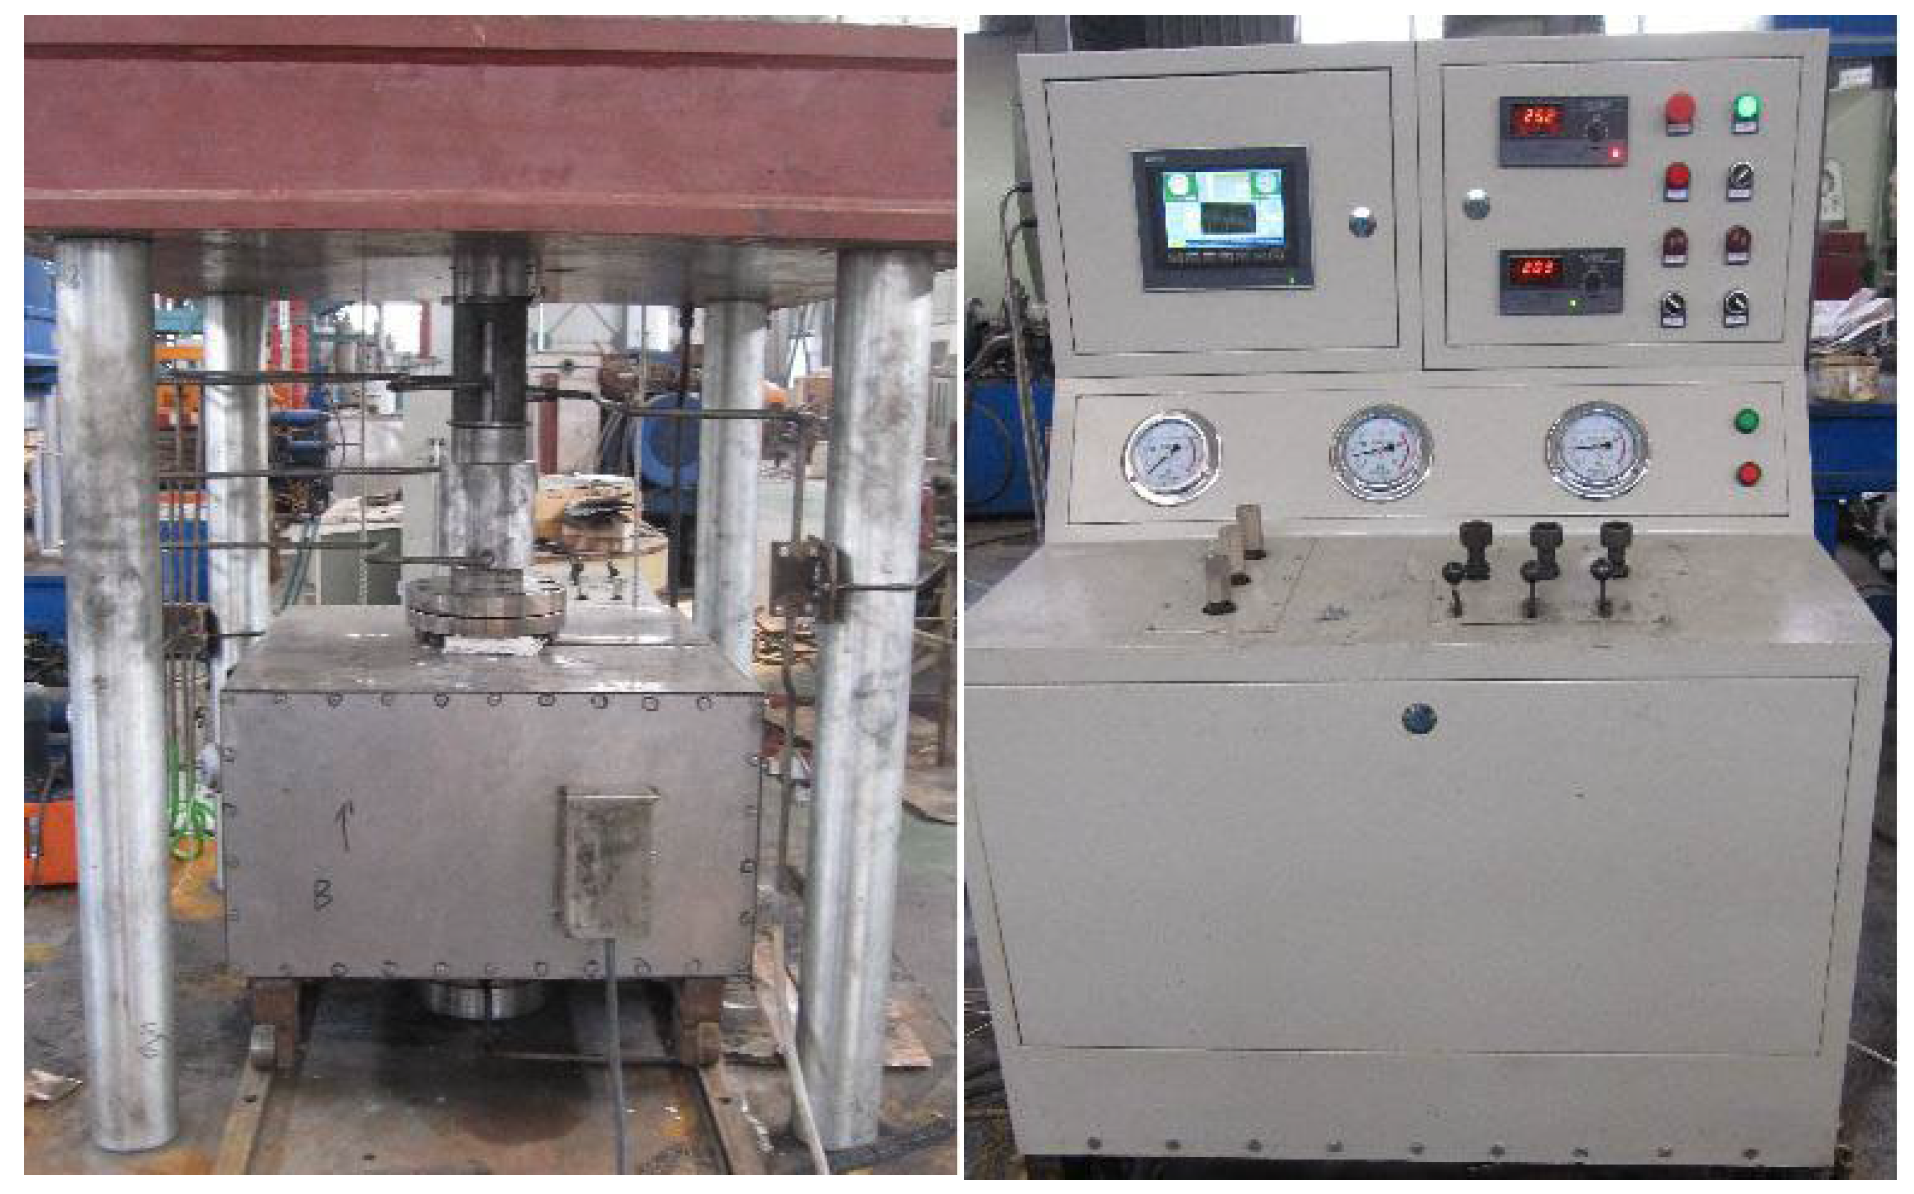
2.1. Closed, High-Temperature, and High-Pressure Thermal Simulations
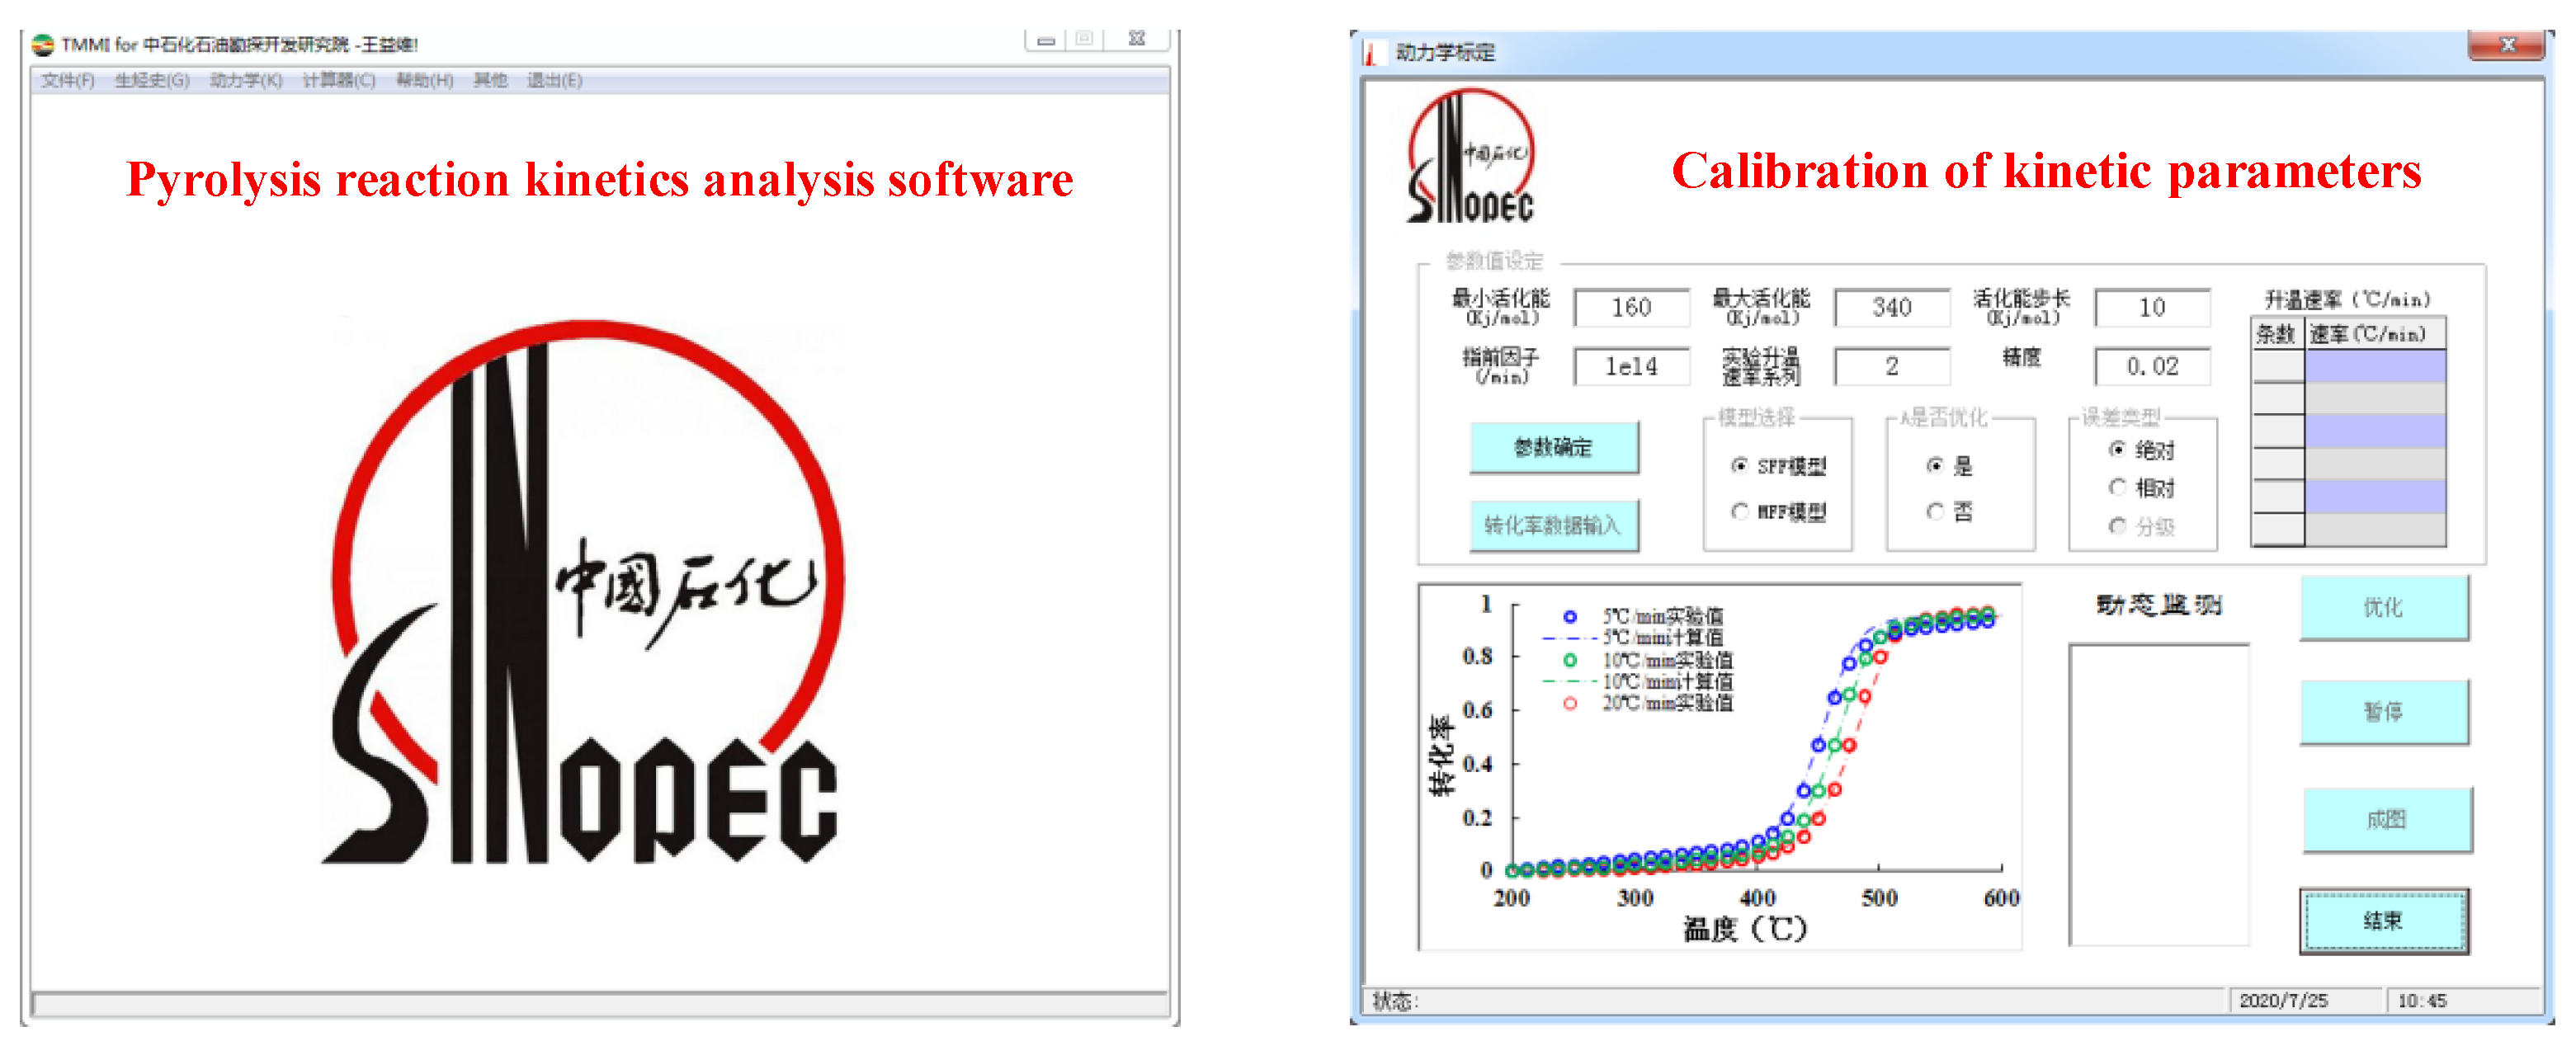
2.2. Pyrolysis Reaction Kinetics Analysis Software
2.3. Real-Time Uniaxial Compressive Strength Tests on Oil Shale at High Temperatures
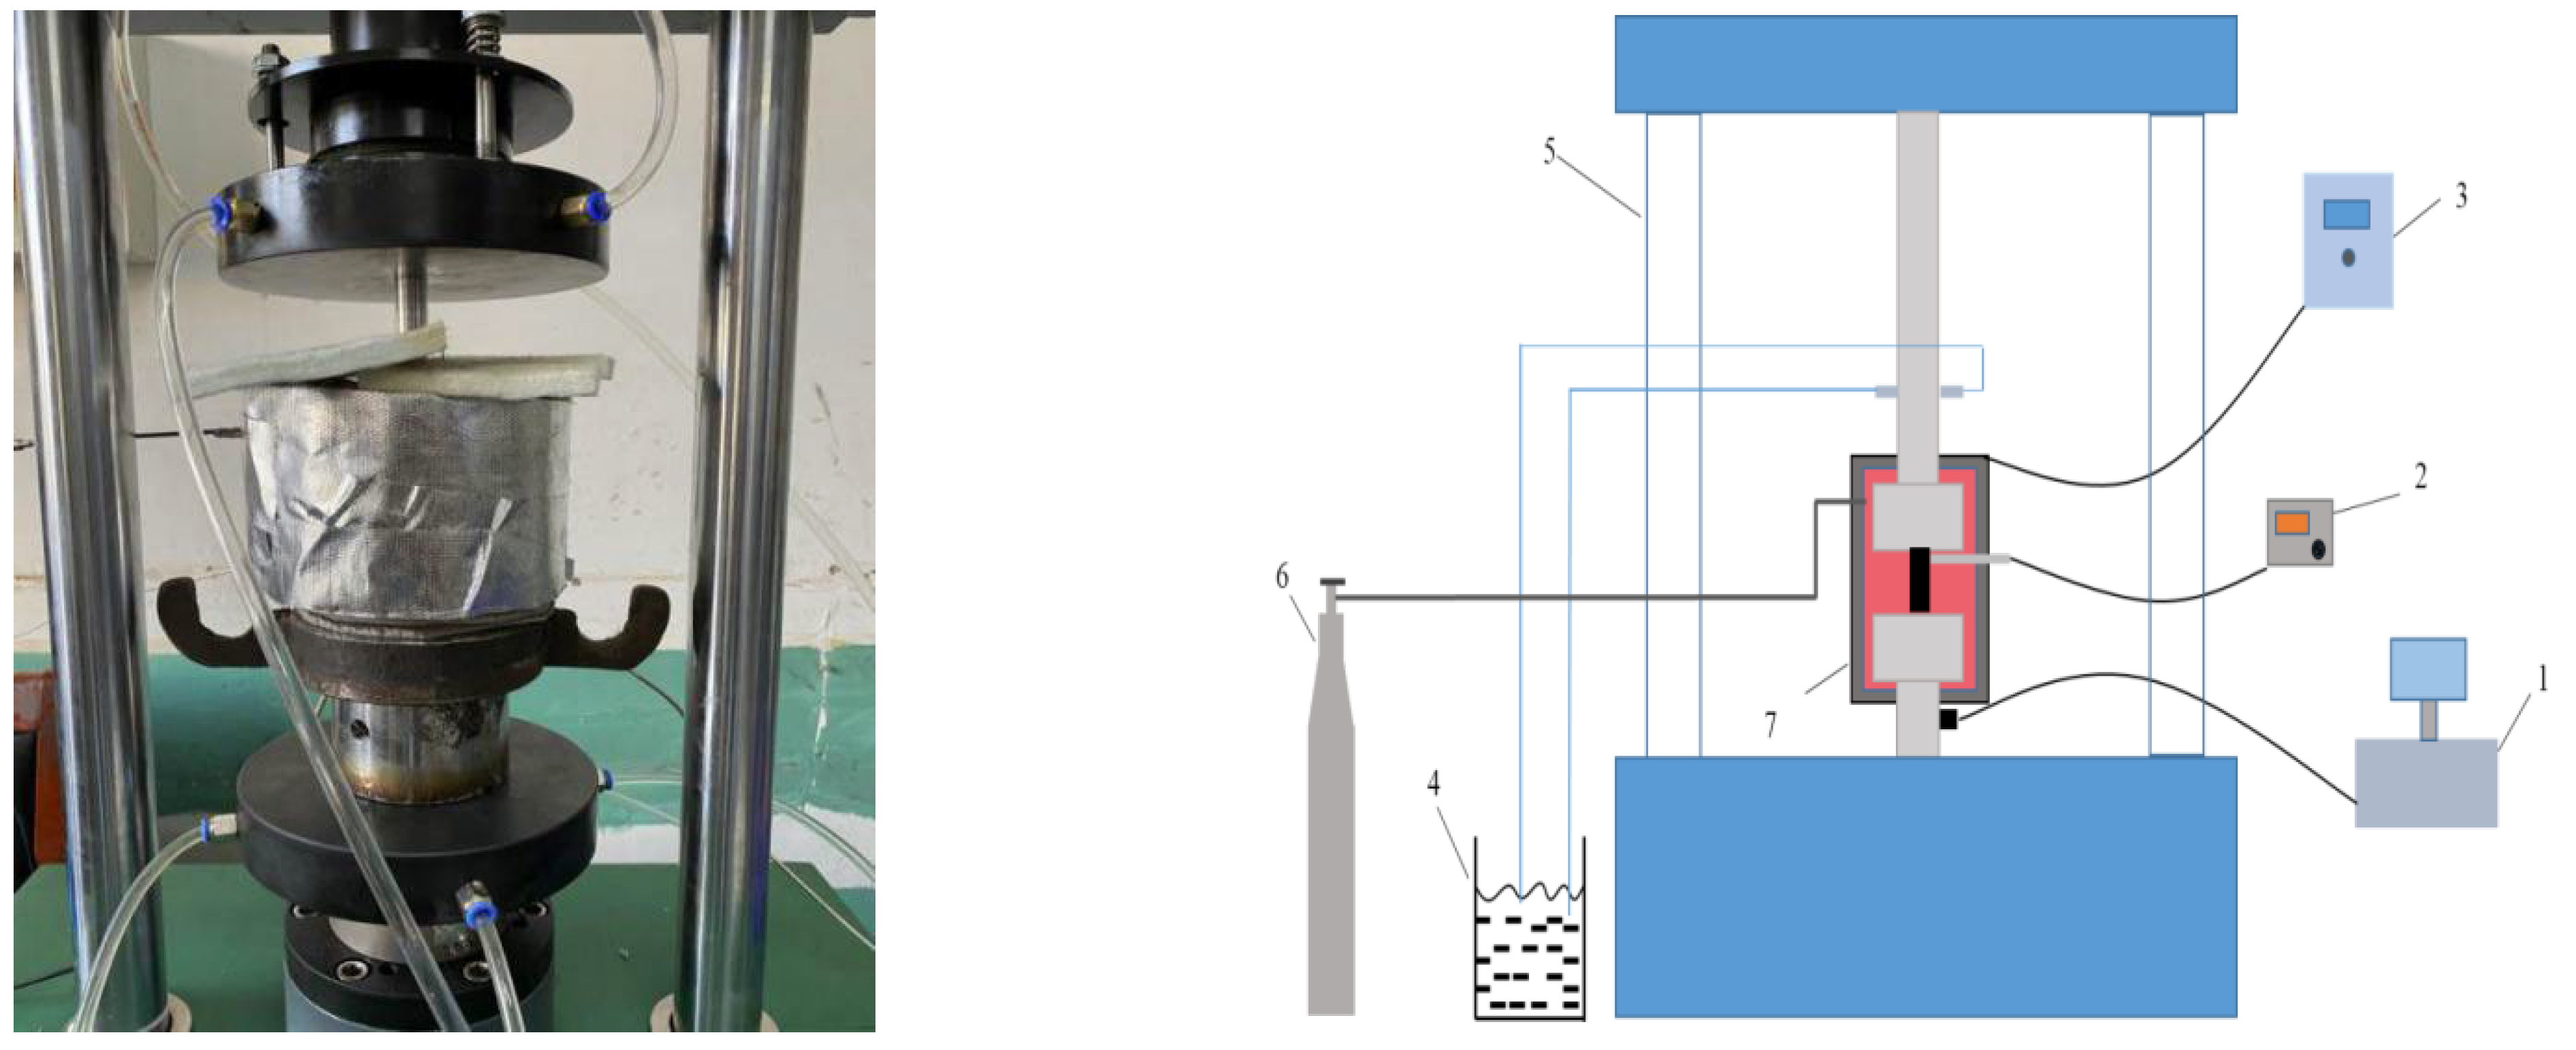
2.4. High-Temperature, Triaxial Permeability Test of Oil Shale
3. Results and Discussion
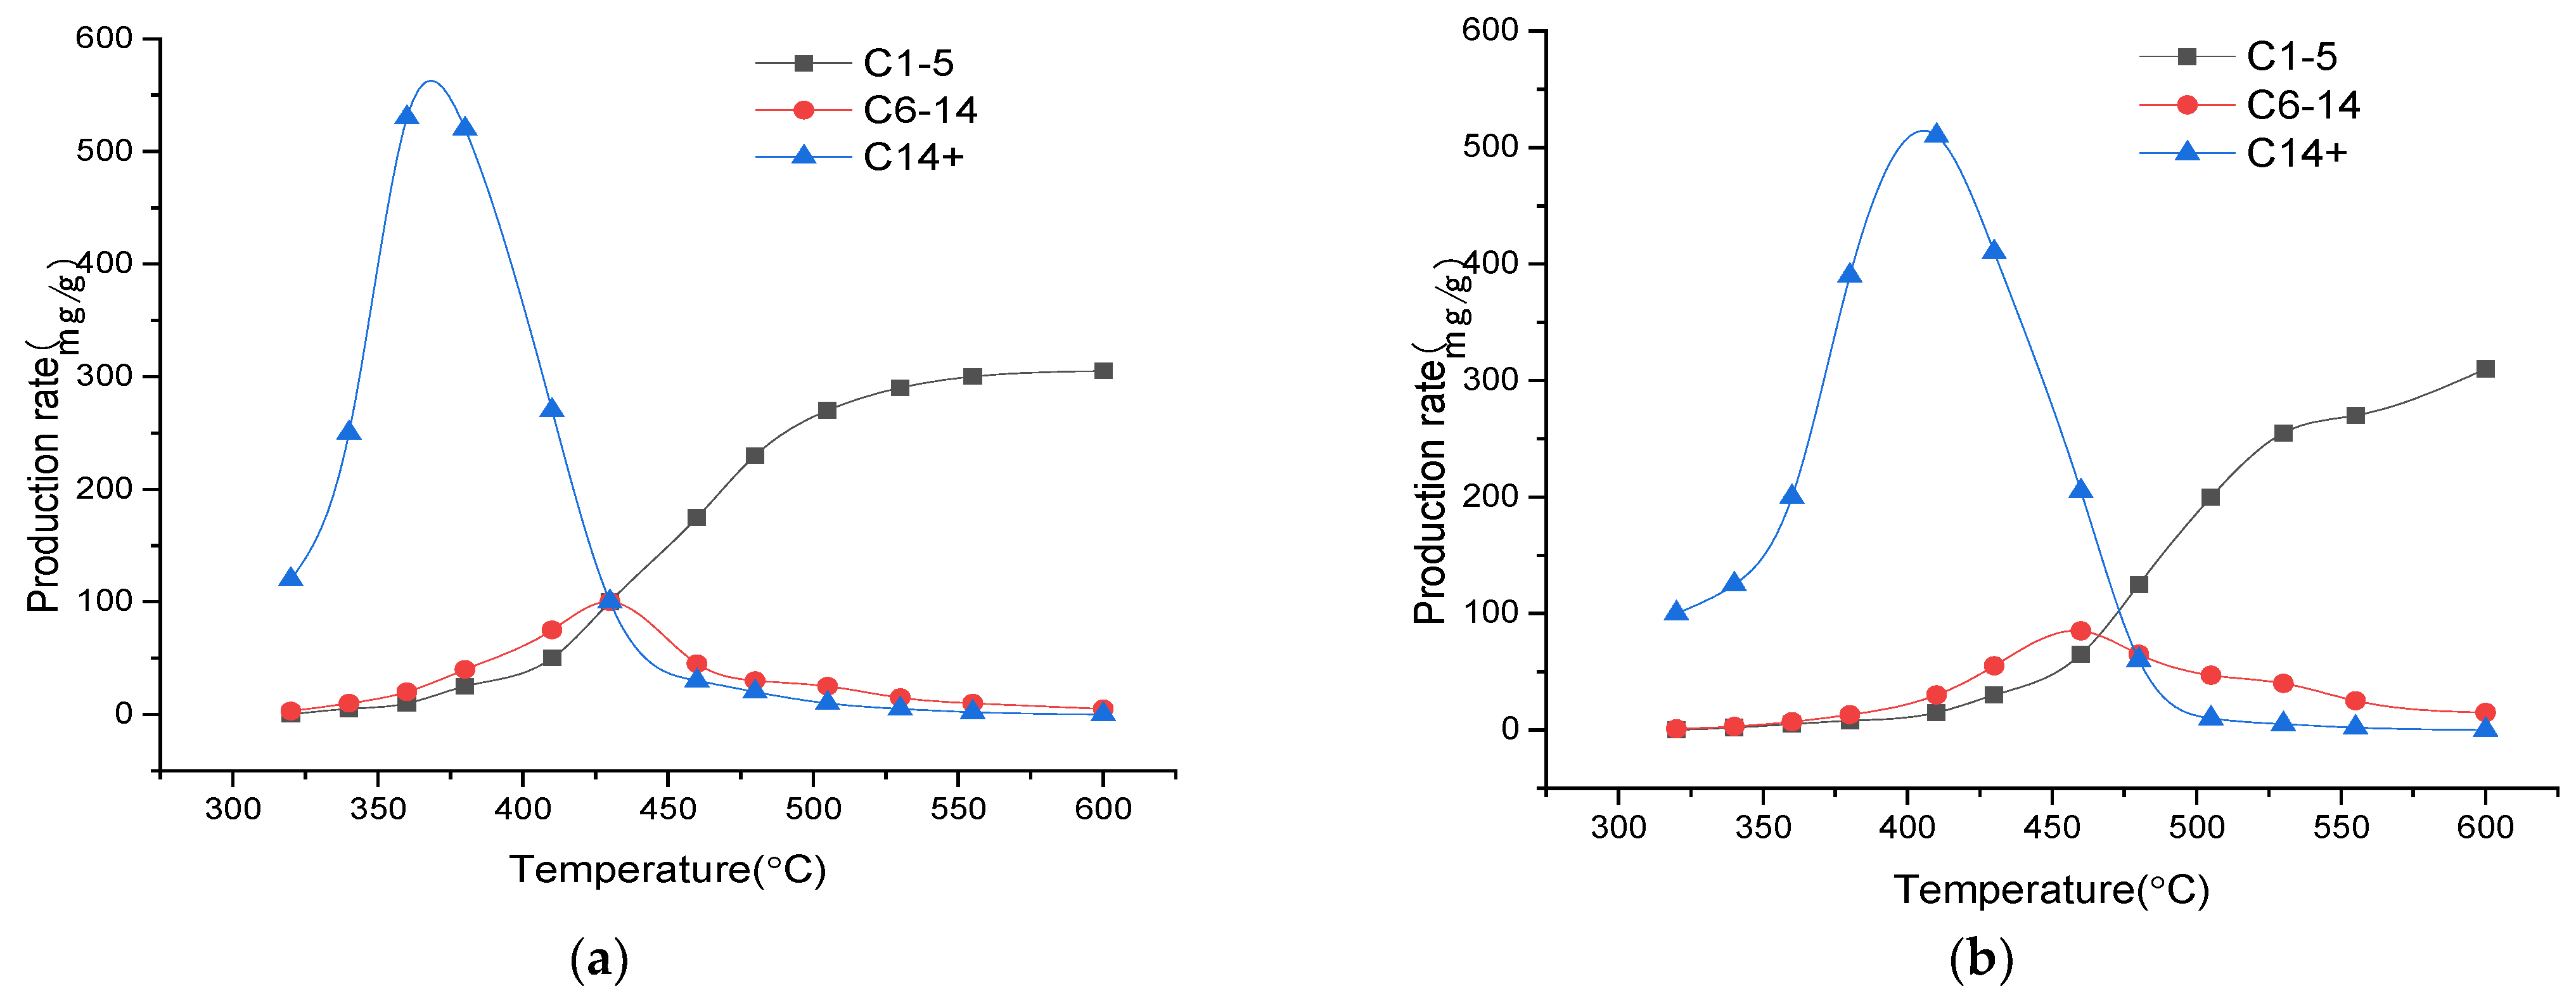
3.1. Regularity of the Formation of Hydrocarbon Products from the Pyrolysis of Oil Shale
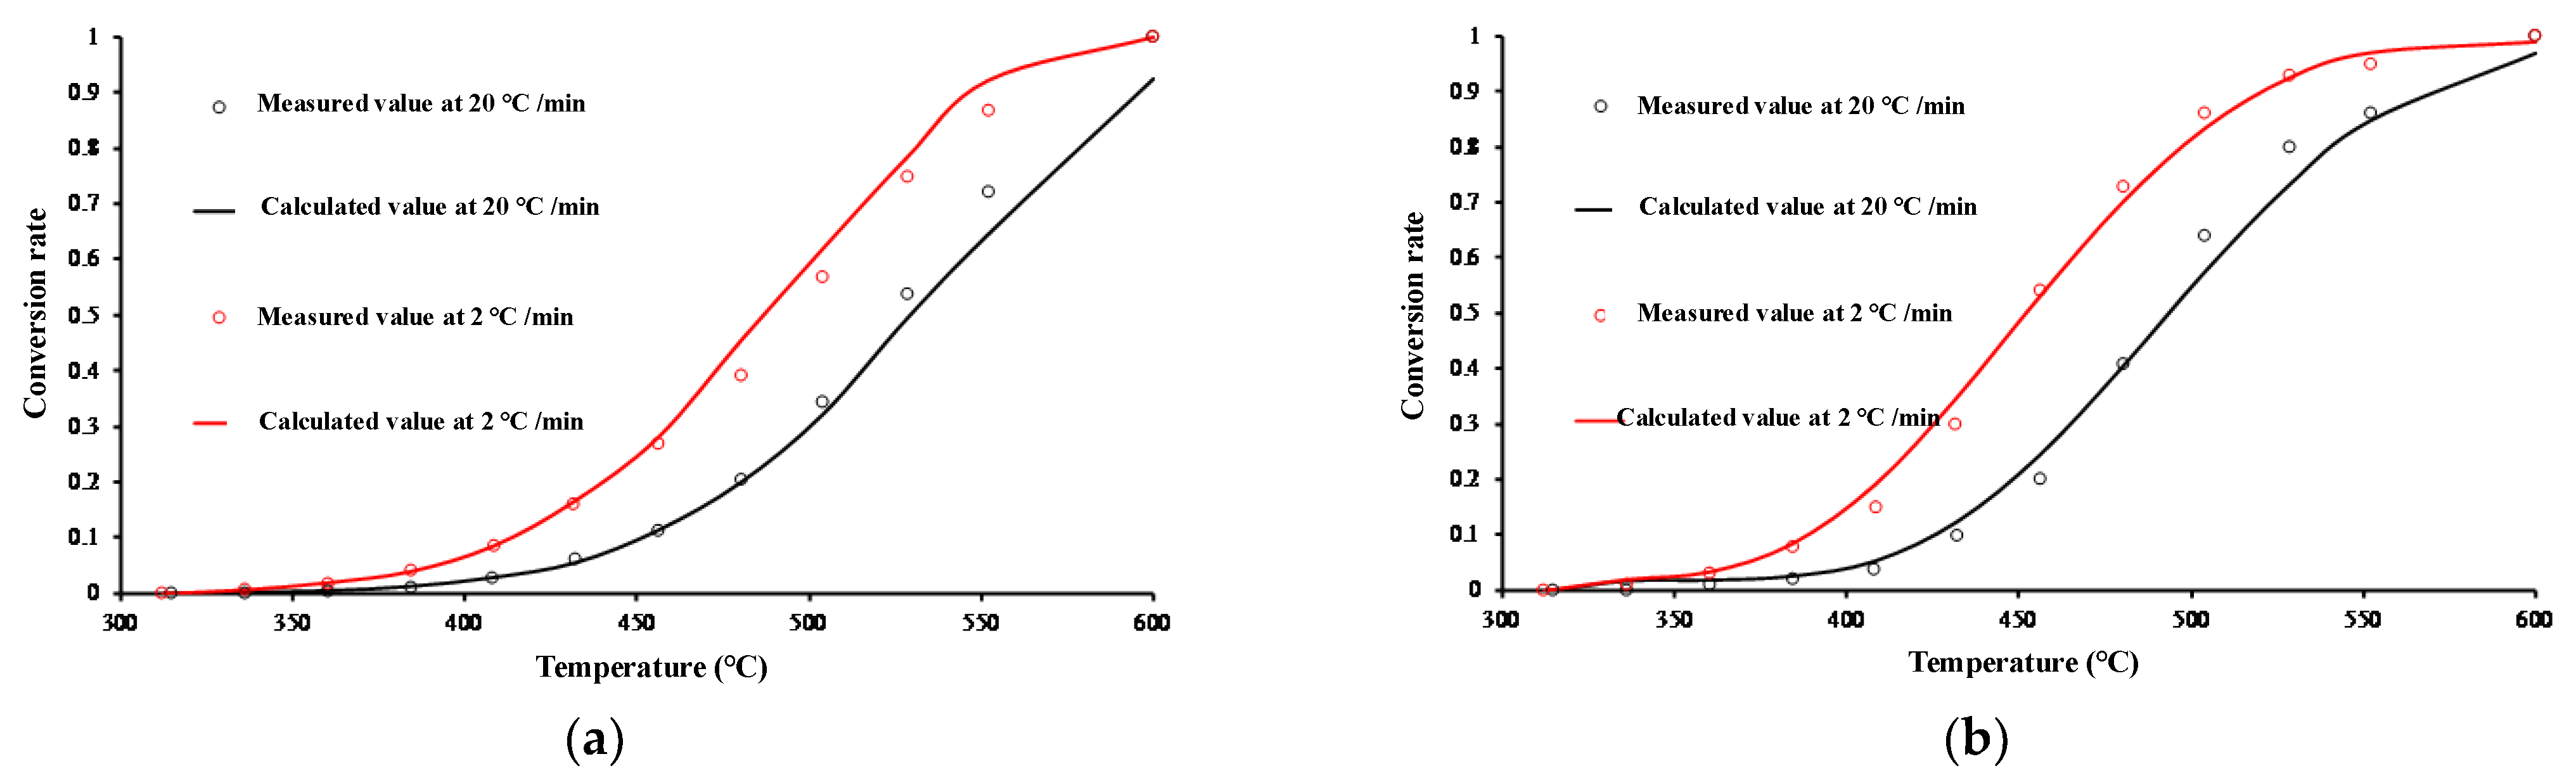
3.2. Kinetic Analysis of Hydrocarbon Generation via Oil Shale Pyrolysis
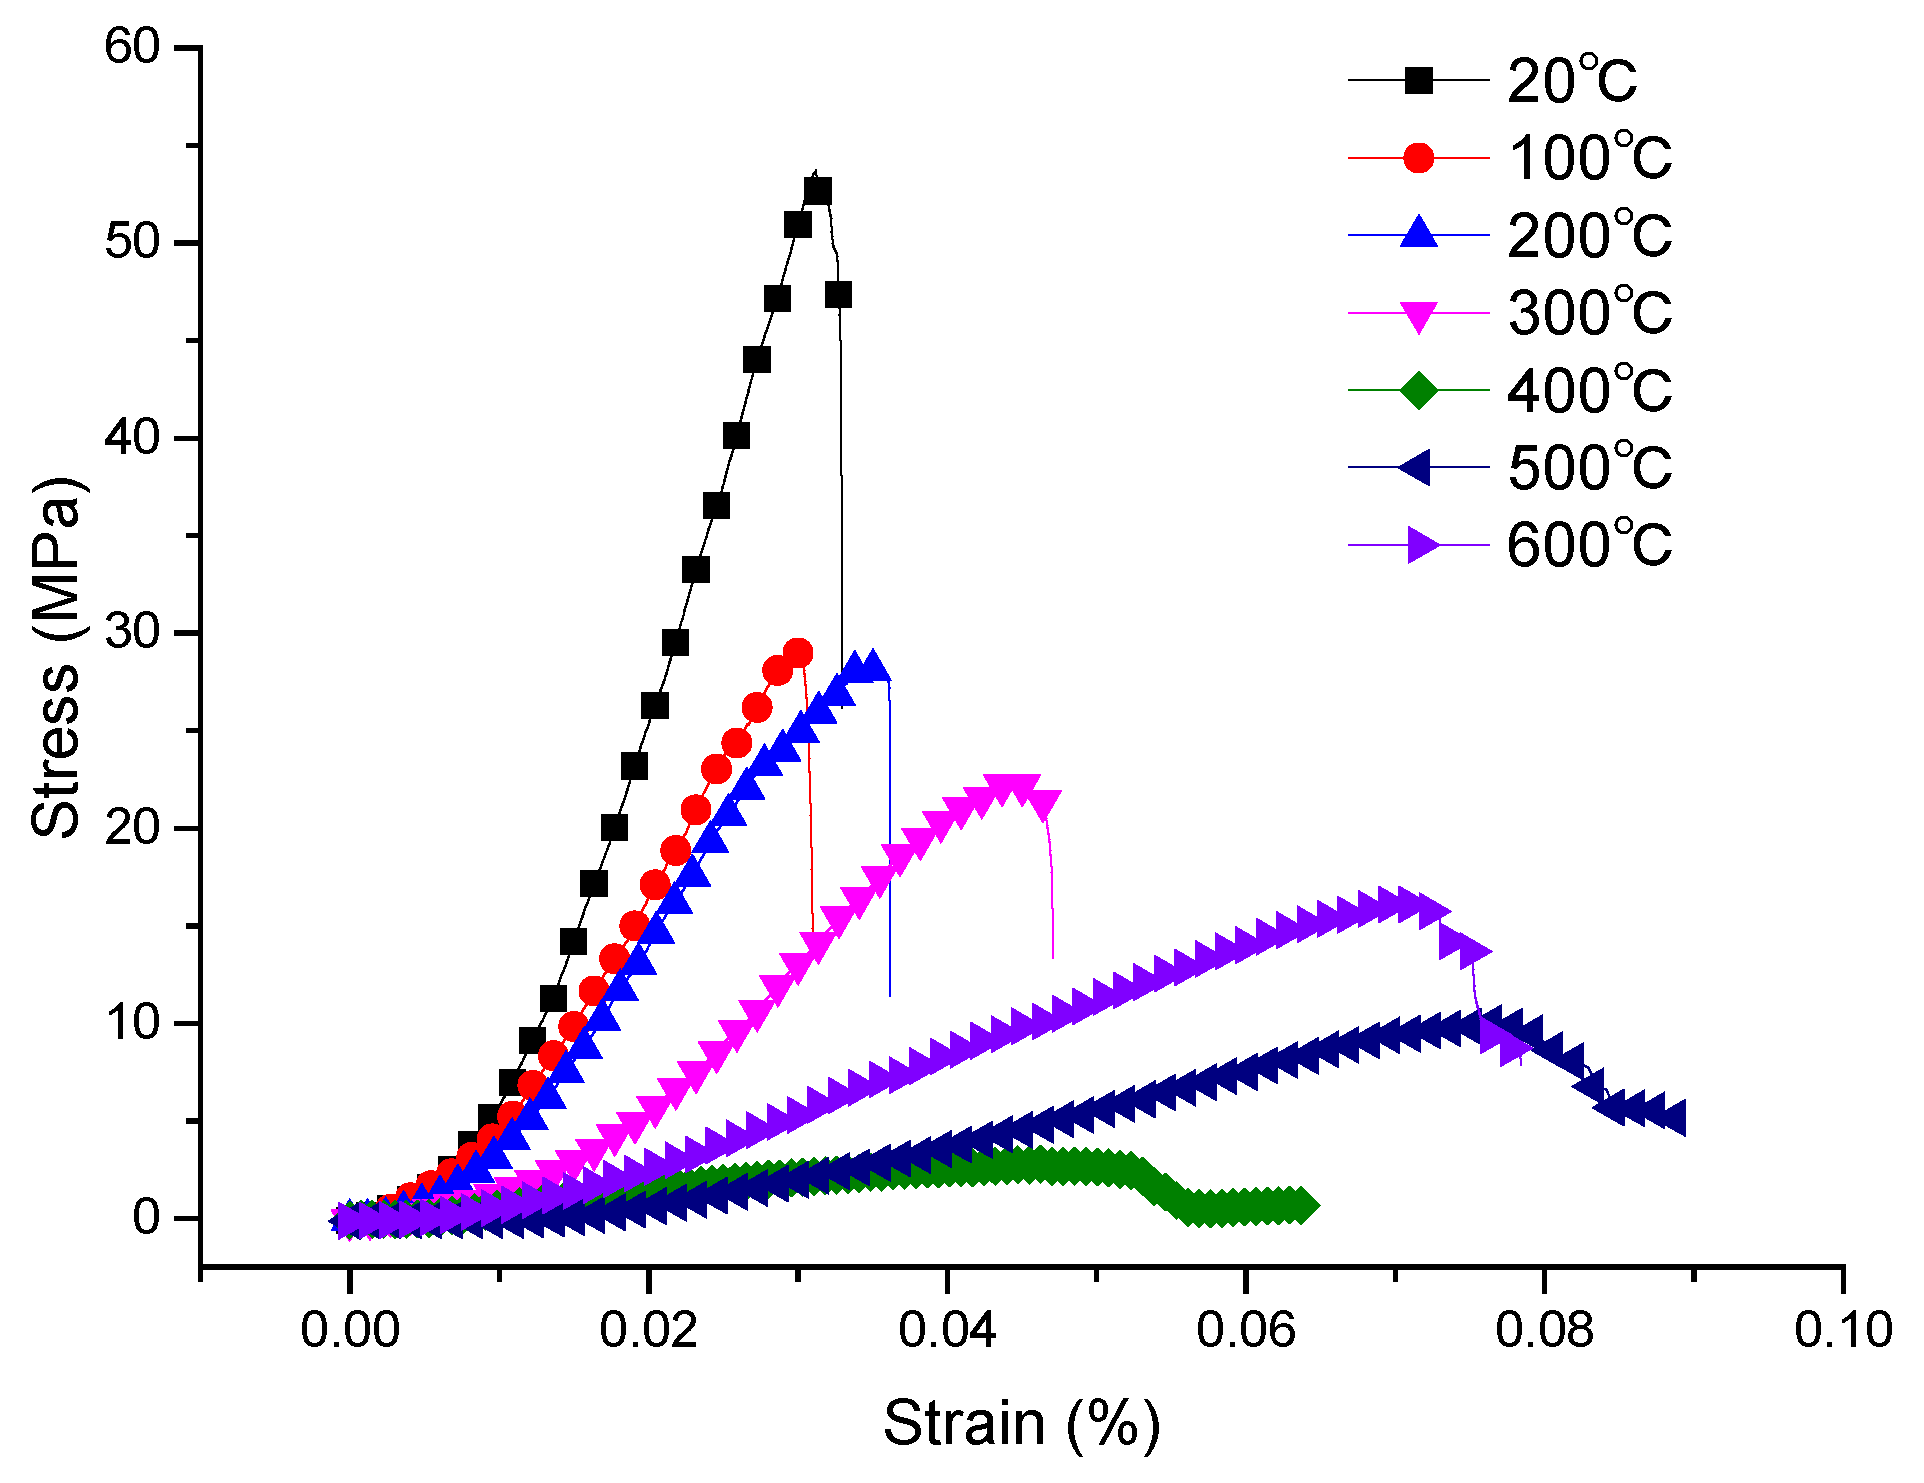
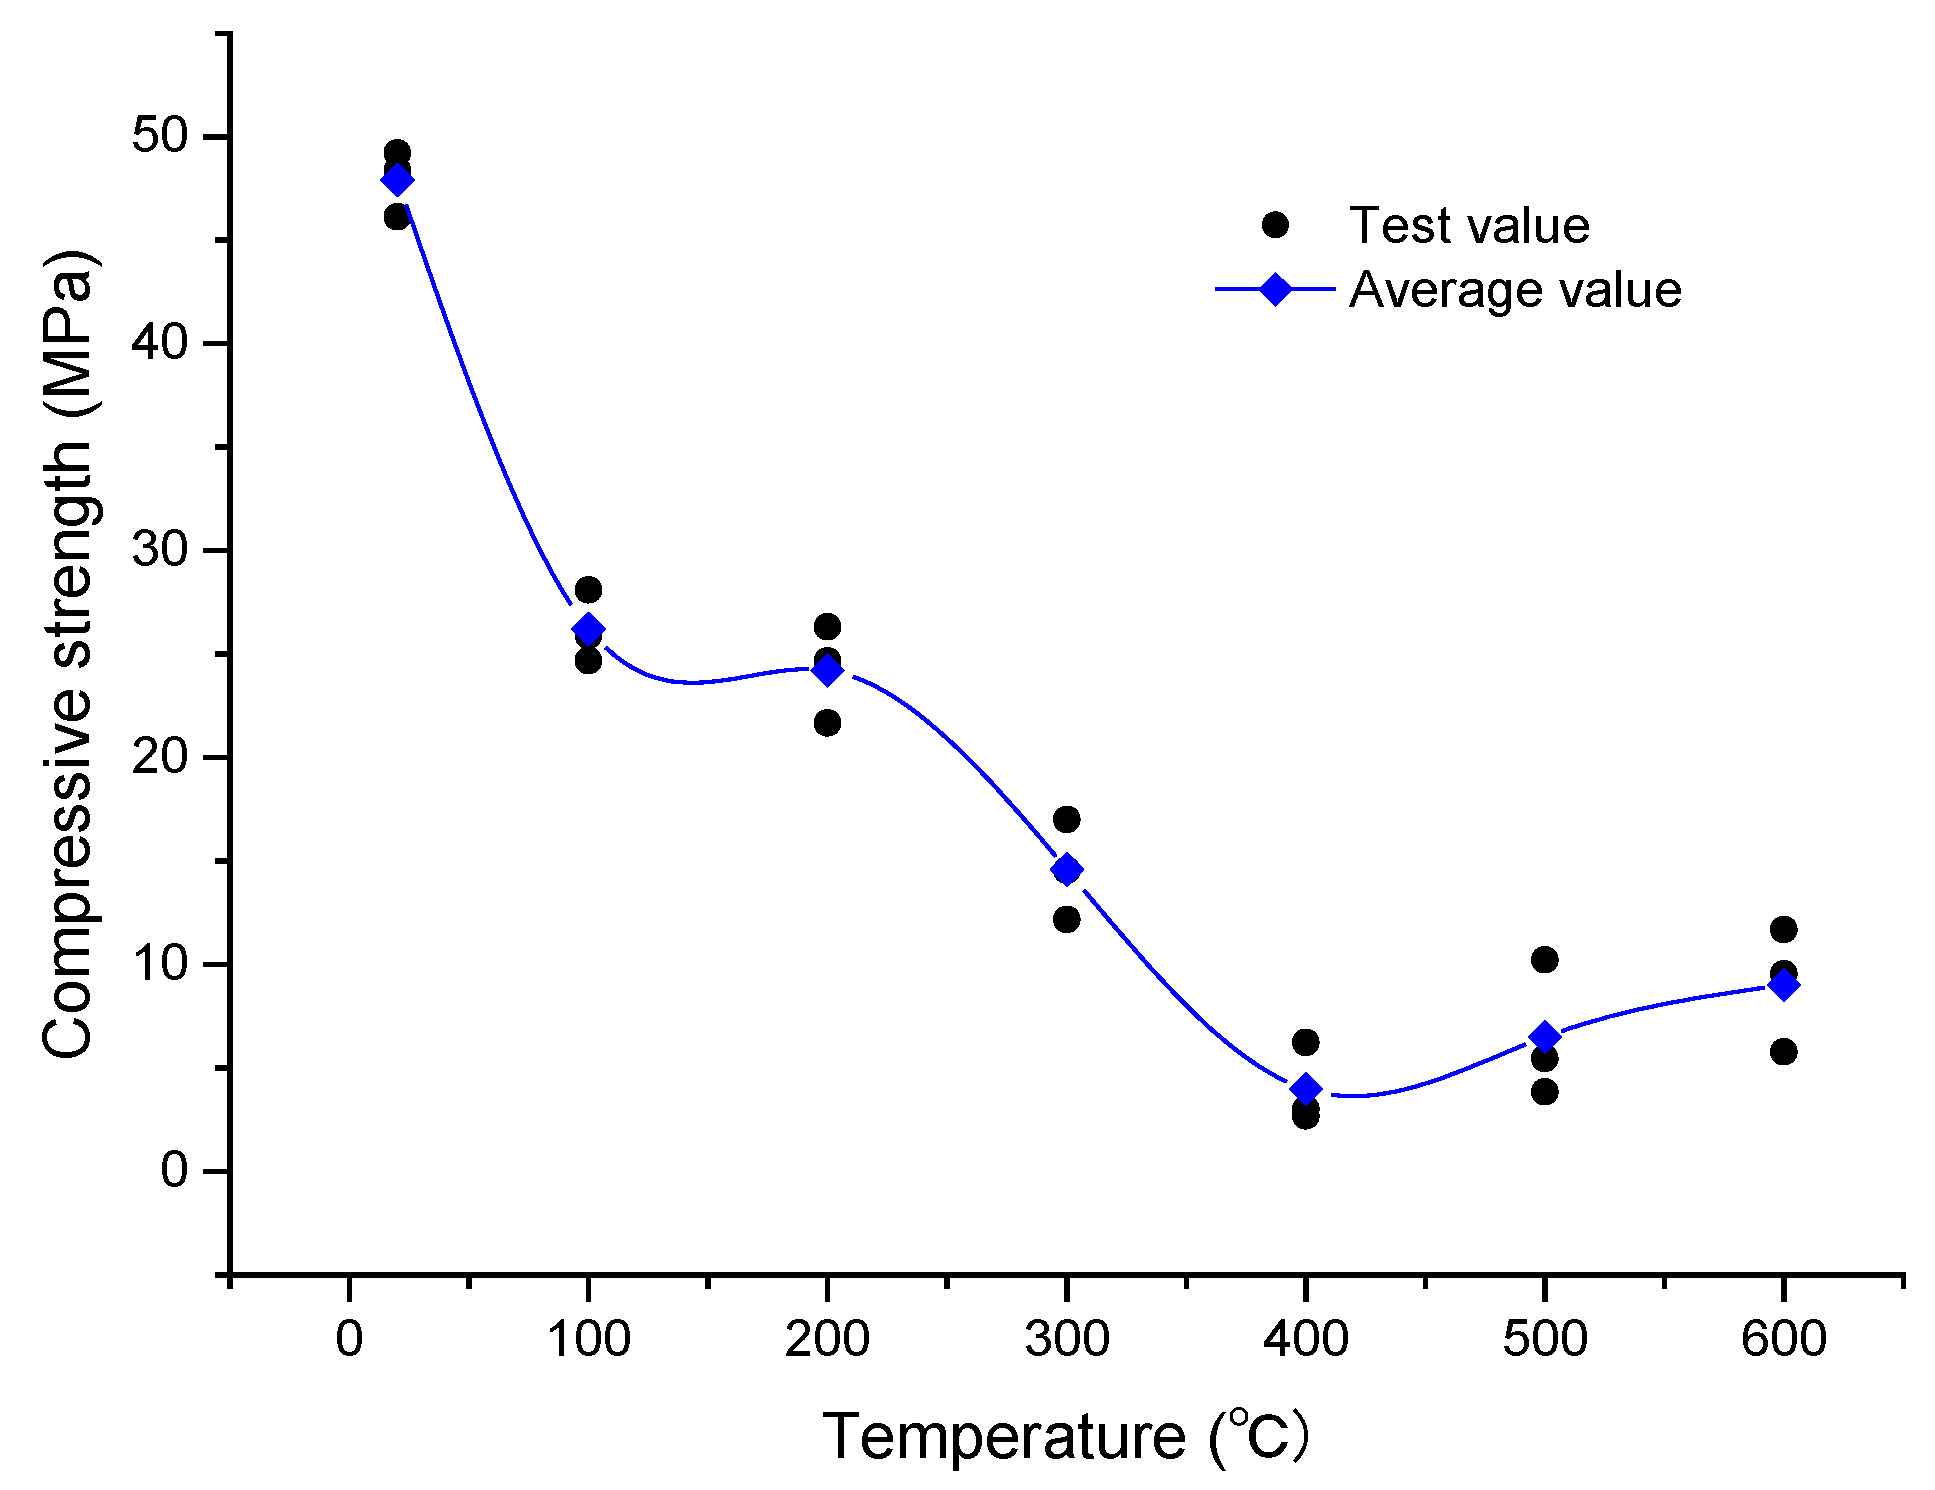
3.3. Real-Time Evolution of the Compressive Strength of Oil Shale at High Temperatures
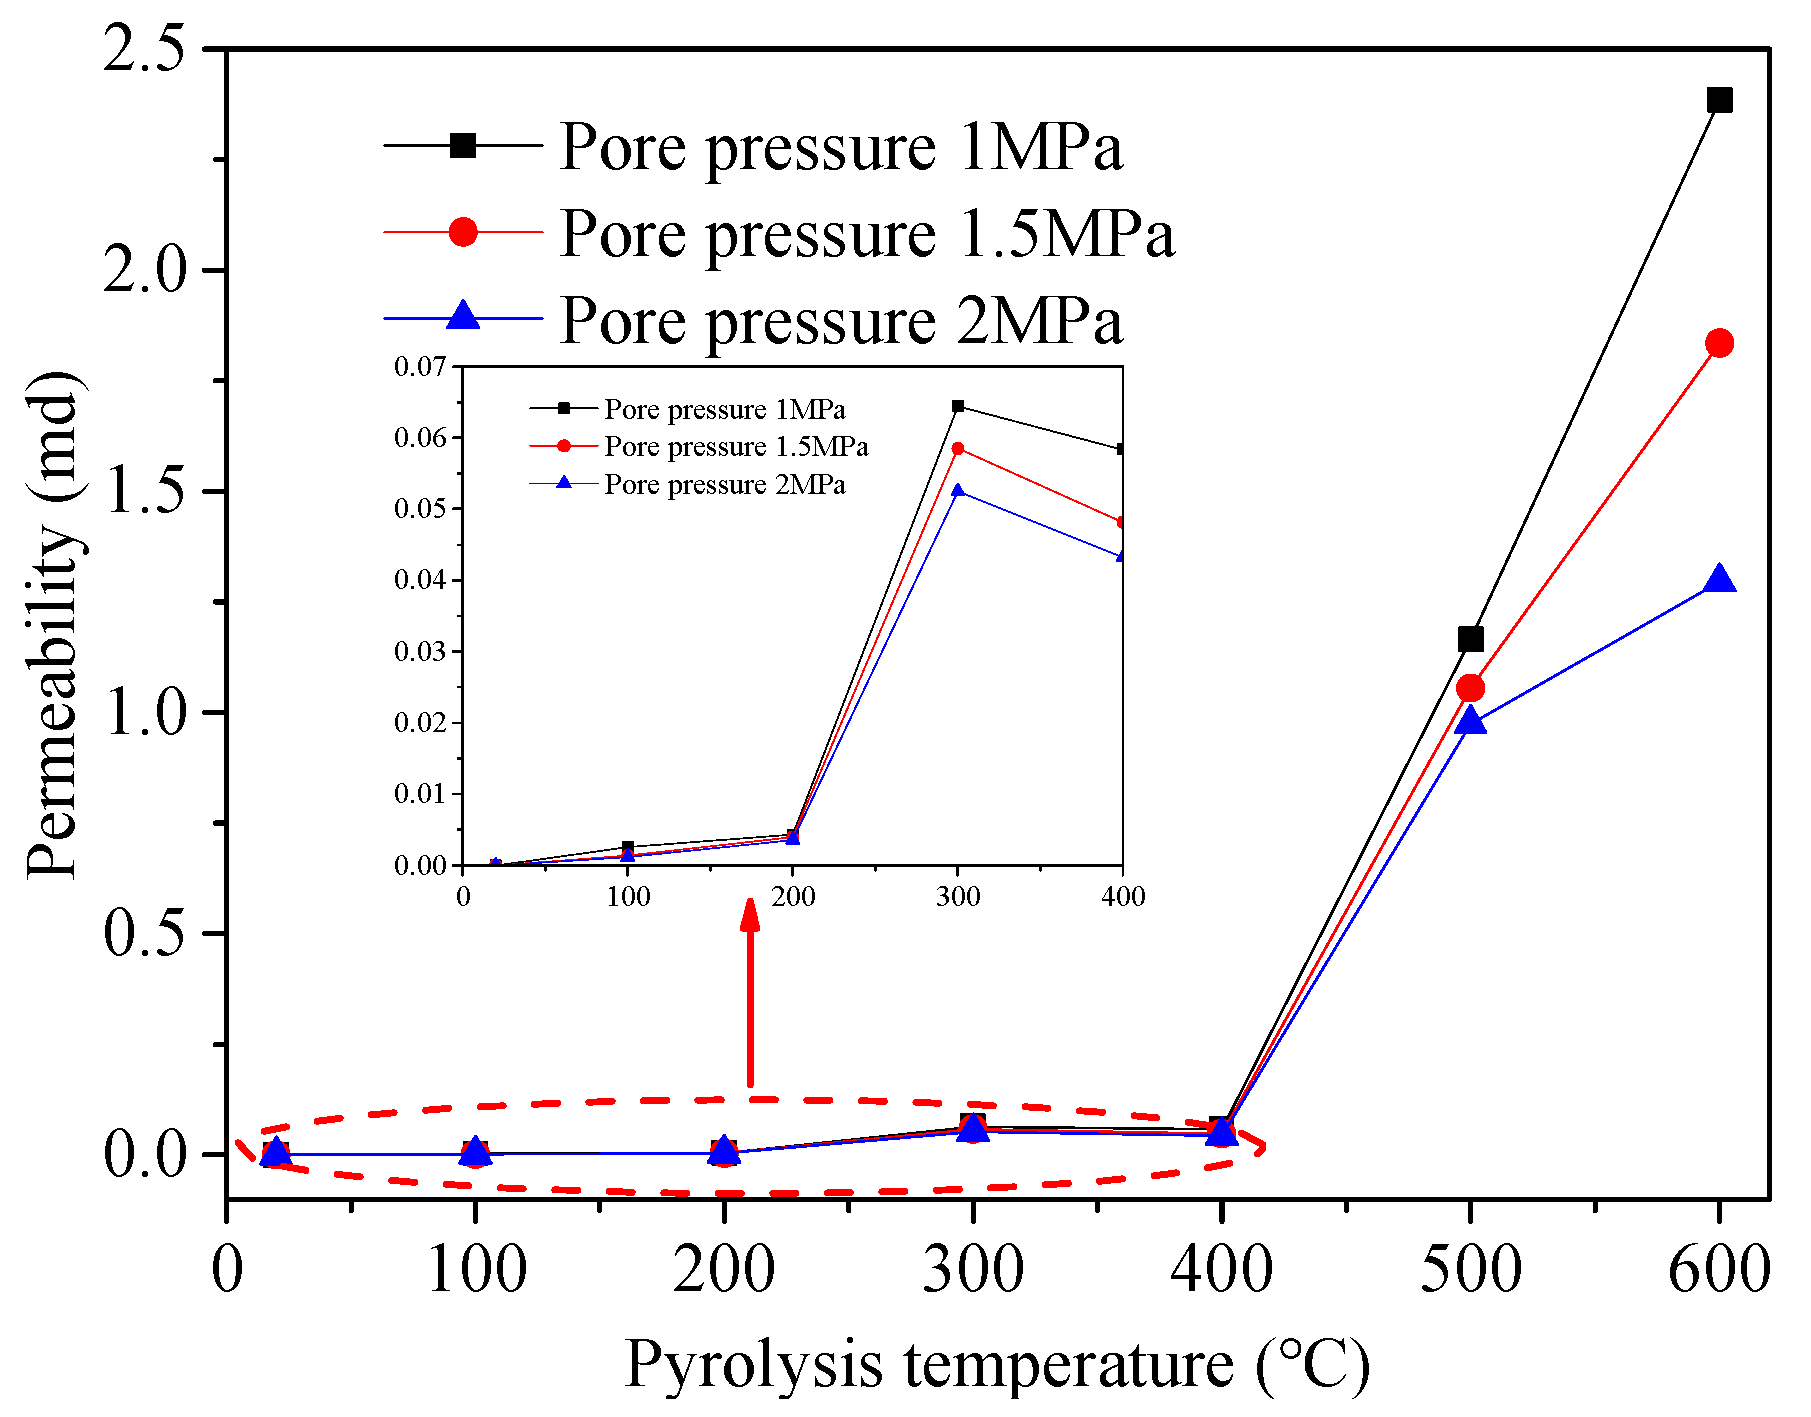
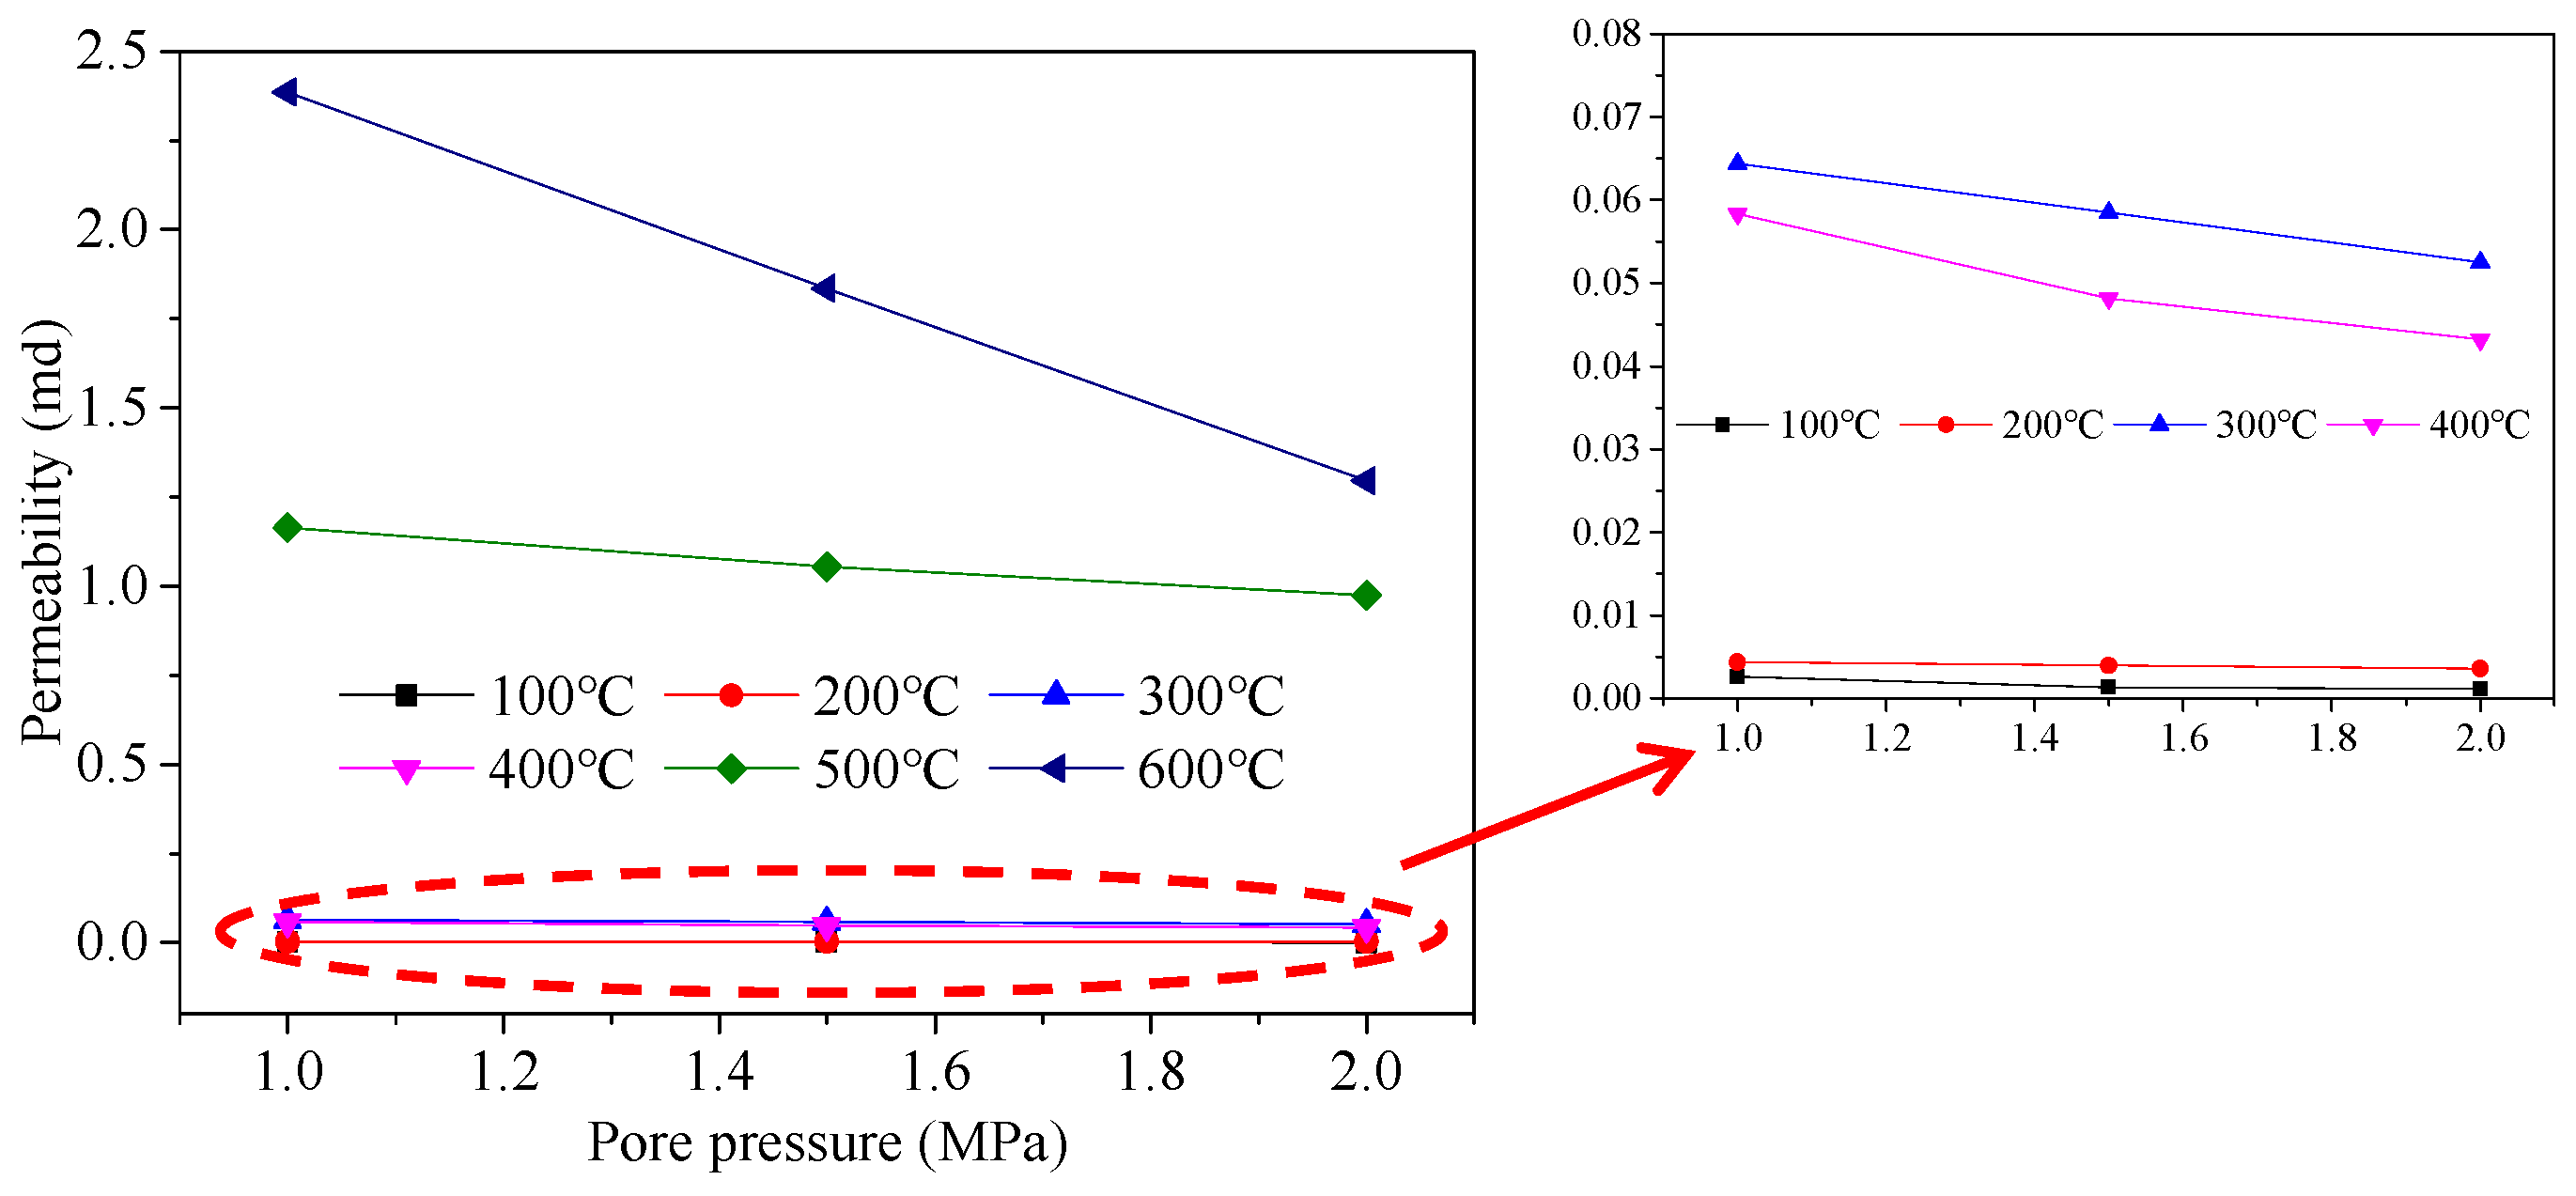
3.4. Evolution of Oil Shale Permeability with Increasing Temperatures
4. Conclusions
Author Contributions
Funding
Institutional Review Board Statement
Informed Consent Statement
Data Availability Statement
Conflicts of Interest
References
- Xu, S.C.; Liu, Z.J.; Zhang, P.; Boak, J.M.; Liu, R.; Meng, Q.T. Characterization of depositional conditions for lacustrine oil shales in the Eocene Jijuntun Formation, Fushun Basin, NE China. Int. J. Coal Geol. 2016, 167, 10–30. [Google Scholar] [CrossRef] [Green Version]
- Wang, L.; Yang, D.; Kang, Z.Q. Evolution of permeability and mesostructure of oil shale exposed to high-temperature water vapor. Fuel 2021, 290, 119786. [Google Scholar] [CrossRef]
- Bansal, V.R.; Kumar, R.; Sastry, M.I.S.; Badhe, R.M.; Kapur, G.S.; Saxena, D. Direct estimation of shale oil potential by the structural insight of Indian origin kerogen. Fuel 2019, 241, 410–416. [Google Scholar] [CrossRef]
- Li, K.X.; Li, X.L.; Du, C.Y.; Xue, H.W.; Sun, Q.; Liu, L. Experimental study on microstructure and erosion mechanisms of solid waste cemented paste backfill under the combined action of dry–wet cycles and sulphate erosion. Materials 2022, 15, 1484. [Google Scholar] [CrossRef]
- Al-Ayed, O.S.; Rasha, A. Hajarat Shale oil: Its present role in the world energy mix. Glob. J. Energy Technol. Res. Updates 2018, 5, 11–18. [Google Scholar] [CrossRef]
- Wang, Q.; Hou, Y.C.; Wu, W.Z.; Wang, Y.P.; Liu, Q.; Ren, S.H. A deep insight into the structural characteristics of Yilan oil shale kerogen through selective oxidation. Carbon Resour. Convers. 2019, 2, 182–190. [Google Scholar] [CrossRef]
- Sadiki, A.; Kaminsh, W.; Halim, H. Fluidized bed pyrolysis of Moroccan oil shales using the hamburg pyrolysis process. Anal. Appl. Prolysis 2003, 87, 427–435. [Google Scholar] [CrossRef]
- Yu, H.; Jiang, X. Study of pyrolysis property of Huadian oil shale. J. Fuel Chem. Technol. 2001, 29, 450–453. [Google Scholar]
- Lai, D.G.; Chen, Z.H.; Lin, L.X.; Zhang, Y.M.; Gao, S.Q.; Xu, G.W. Secondary cracking and upgrading of shale oil from pyrolyzing oil shale over shale ash. Energy Fuels 2015, 29, 2219–2226. [Google Scholar] [CrossRef]
- Lai, D.G.; Chen, Z.H.; Shi, Y.; Lin, L.X.; Zhan, J.H.; Gao, S.Q.; Xu, G.W. Pyrolysis of oil shale by solid heat carrier in an innovative moving bed with internals. Fuel 2015, 159, 943–951. [Google Scholar] [CrossRef]
- Wang, Q.; Zhao, W.Z.; Liu, H.P.; Jia, C.X.; Li, S.H. Interactions and kinetic analysis of oil shale semi-coke with cornstalk during co-combustion. Appl. Energy 2011, 88, 2080–2087. [Google Scholar] [CrossRef]
- Suo, Y.; Chen, Z.; Rahman, S.S. Changes in shale rock properties and wave velocity anisotropy induced by increasing temperature. Nat. Resour. Res. 2020, 29, 4073–4083. [Google Scholar] [CrossRef]
- Gautam, P.K.; Verma, A.K.; Jha, M.K.; Sarkar, K.; Singh, T.N.; Bajpai, R.K. Study of strain rate and thermal damage of Dholpur sandstone at elevated temperature. Rock Mech. Rock Eng. 2016, 49, 3805–3815. [Google Scholar] [CrossRef]
- Zhao, J.; Kang, Z.Q. Permeability of oil shale under in situ conditions: Fushun oil shale (China) experimental case study. Nat. Resour. Res. 2021, 30, 753–763. [Google Scholar] [CrossRef]
- Yang, D.; Wang, G.Y.; Kang, Z.Q.; Zhao, J.; Lv, Y.Q. Experimental investigation of anisotropic thermal deformation of oil shale under high temperature and triaxial stress based on mineral and micro-fracture characteristics. Nat. Resour. Res. 2020, 29, 3987–4002. [Google Scholar] [CrossRef]
- Behar, F.; Kressmann, S.; Rudkiewicz, J.L.; Vandenbroucke, M. Experimental simulation in a confined system and kinetic modelling of kerogen and oil cracking. Org. Geochem. 1992, 19, 173–189. [Google Scholar] [CrossRef]
- Braun, R.L.; Burnham, A.K.; Reynolds, J.G. Oil and gas evolution kinetics for oil shale and petroleum source rocks determined from pyrolysis-TQMS data at two heating rates. Energy Fuels 1992, 6, 468–474. [Google Scholar] [CrossRef]
- Pepper, A.S.; Corvi, P.J. Simple kinetic models of petroleum formation. Part I: Oil and gas generation from kerogen. Mar. Pet. Geol. 1995, 12, 291–319. [Google Scholar] [CrossRef]
- Wang, L.; Yang, D.; Kang, Z.Q.; Zhao, J.; Meng, Q.R. Experimental study on the effects of steam temperature on the pore-fracture evolution of oil shale exposed to the convection heating. J. Anal. Appl. Pyrolysis 2022, 164, 105533. [Google Scholar] [CrossRef]
- Wu, T.H.; Zhang, D.X.; Li, X. A radial differential pressure decay method with micro-plug samples for determining the apparent permeability of shale matrix. J. Nat. Gas Sci. Eng. 2020, 74, 103126. [Google Scholar] [CrossRef]
- Schoell, M. The hydrogen and carbon isotopic composition of methane from natural gases of various origins. Geochim. Cosmochim. Acta 1980, 44, 649–661. [Google Scholar] [CrossRef]
- Schoell, M. Recent advances in petroleum isotope geochemistry. Org. Geochem. 1984, 6, 645–663. [Google Scholar] [CrossRef]
- Kök, M.V.; Pamir, M.R. Comparative pyrolysis and combustion kinetics of oil shales. J. Anal. Appl. Pyrolysis 2000, 55, 185–194. [Google Scholar] [CrossRef]
- Yang, S.Q.; Yang, D.; Kang, Z.Q. Experimental investigation of the anisotropic evolution of tensile strength of oil shale under real-time high-temperature conditions. Nat. Resour. Res. 2021, 30, 2513–2528. [Google Scholar] [CrossRef]
- Rong, G.; Sha, S.; Li, B.W.; Chen, Z.H.; Zhang, Z.Y. Experimental investigation on physical and mechanical properties of granite subjected to cyclic heating and liquid nitrogen cooling. Rock Mech. Rock Eng. 2021, 54, 2383–2403. [Google Scholar] [CrossRef]
- Zhang, W.Q.; Sun, Q.; Hao, S.Q.; Geng, J.S.; Lv, C. Experimental study on the variation of physical and mechanical properties of rock after high temperature treatment. Appl. Therm. Eng. 2016, 98, 1297–1304. [Google Scholar] [CrossRef]
- Yavuz, H.; Demirdag, S.; Caran, S. Thermal effect on the physical properties of carbonate rocks. Int. J. Rock Mech. Min. Sci. 2010, 47, 94–103. [Google Scholar] [CrossRef]
- Wang, J.J.; Yu, L.; Yuan, Q.W. Experimental study on permeability in tight porous media considering gas adsorption and slippage effect. Fuel 2019, 253, 561–570. [Google Scholar] [CrossRef]
- Li, X.; Feng, Z.J.; Han, G.; Elsworth, D.; Marone, C.; Saffer, D.; Cheon, D.S. Permeability evolution of propped artificial fractures in Green River shale. Rock Mech. Rock Eng. 2017, 50, 1473–1485. [Google Scholar] [CrossRef]
- Chen, T.Y.; Feng, X.T.; Pan, Z.J. Experimental study of swelling of organic rich shale in methane. Int. J. Coal Geol. 2015, 150–151, 64–73. [Google Scholar] [CrossRef]


| Fischer Assay Analysis (wt.%, ad) | Composition (%) |
|---|---|
| Oil yield | 8.07 |
| Water yield | 1.78 |
| Residue | 86.73 |
| Gas + loss | 3.42 |
| Activation Energy (kJ/mol) | The Pre-Exponential Factor (min−1) | Reaction Fraction of Organic Matter to Methane | Reaction Fraction of Organic Matter to Gas |
|---|---|---|---|
| 150 | 1016 | 5.38 × 10⁻⁴ | 4.35 × 10⁻³ |
| 160 | 5.38 × 10⁻⁴ | 4.35 × 10⁻³ | |
| 170 | 5.38 × 10⁻⁴ | 4.35 × 10⁻³ | |
| 180 | 5.27 × 10⁻⁴ | 4.34 × 10⁻³ | |
| 190 | 6.80 × 10⁻⁴ | 5.64 × 10⁻⁵ | |
| 200 | 1.64 × 10⁻⁴ | 1.77 × 10⁻⁴ | |
| 210 | 1.75 × 10⁻² | 1.32 × 10⁻⁷ | |
| 220 | 8.57 × 10⁻³ | 6.64 × 10⁻² | |
| 230 | 8.92 × 10⁻² | 1.64 × 10⁻¹ | |
| 240 | 7.45 × 10⁻² | 2.31 × 10⁻¹ | |
| 250 | 2.68 × 10⁻¹ | 2.26 × 10⁻¹ | |
| 260 | 1.51 × 10⁻¹ | 1.64 × 10⁻¹ | |
| 270 | 2.67 × 10⁻¹ | 9.29 × 10⁻² | |
| 280 | 1.21 × 10⁻¹ | 2.71 × 10⁻² | |
| 290 | 6.89 × 10⁻⁶ | 2.89 × 10⁻⁴ | |
| 300 | 3.18 × 10⁻⁴ | 1.64 × 10⁻⁴ | |
| 310 | 2.51 × 10⁻⁵ | 2.89 × 10⁻⁴ | |
| 320 | 1.30 × 10⁻⁶ | 1.61 × 10⁻⁴ | |
| 330 | 6.13 × 10⁻⁷ | 4.90 × 10⁻³ | |
| 340 | 5.92 × 10⁻⁶ | 5.01 × 10⁻³ | |
| Average activation energy (kJ/mol) | 256.81 | 246.13 | |
Publisher’s Note: MDPI stays neutral with regard to jurisdictional claims in published maps and institutional affiliations. |
© 2022 by the authors. Licensee MDPI, Basel, Switzerland. This article is an open access article distributed under the terms and conditions of the Creative Commons Attribution (CC BY) license (https://creativecommons.org/licenses/by/4.0/).
Share and Cite
Wang, L.; Su, J.; Yang, D. Study on Pyrolysis–Mechanics–Seepage Behavior of Oil Shale in a Closed System Subject to Real-Time Temperature Variations. Materials 2022, 15, 5368. https://doi.org/10.3390/ma15155368
Wang L, Su J, Yang D. Study on Pyrolysis–Mechanics–Seepage Behavior of Oil Shale in a Closed System Subject to Real-Time Temperature Variations. Materials. 2022; 15(15):5368. https://doi.org/10.3390/ma15155368
Chicago/Turabian StyleWang, Lei, Jianzheng Su, and Dong Yang. 2022. "Study on Pyrolysis–Mechanics–Seepage Behavior of Oil Shale in a Closed System Subject to Real-Time Temperature Variations" Materials 15, no. 15: 5368. https://doi.org/10.3390/ma15155368