
The Zn1−xPbxCr2Se4—Single Crystals Obtained by Chemical Vapour Transport—Structure and Magnetic, Electrical, and Thermal Properties

 ,
,  , ,
, ,  ,
,
Abstract
:1. Introduction
2. Materials and Methods
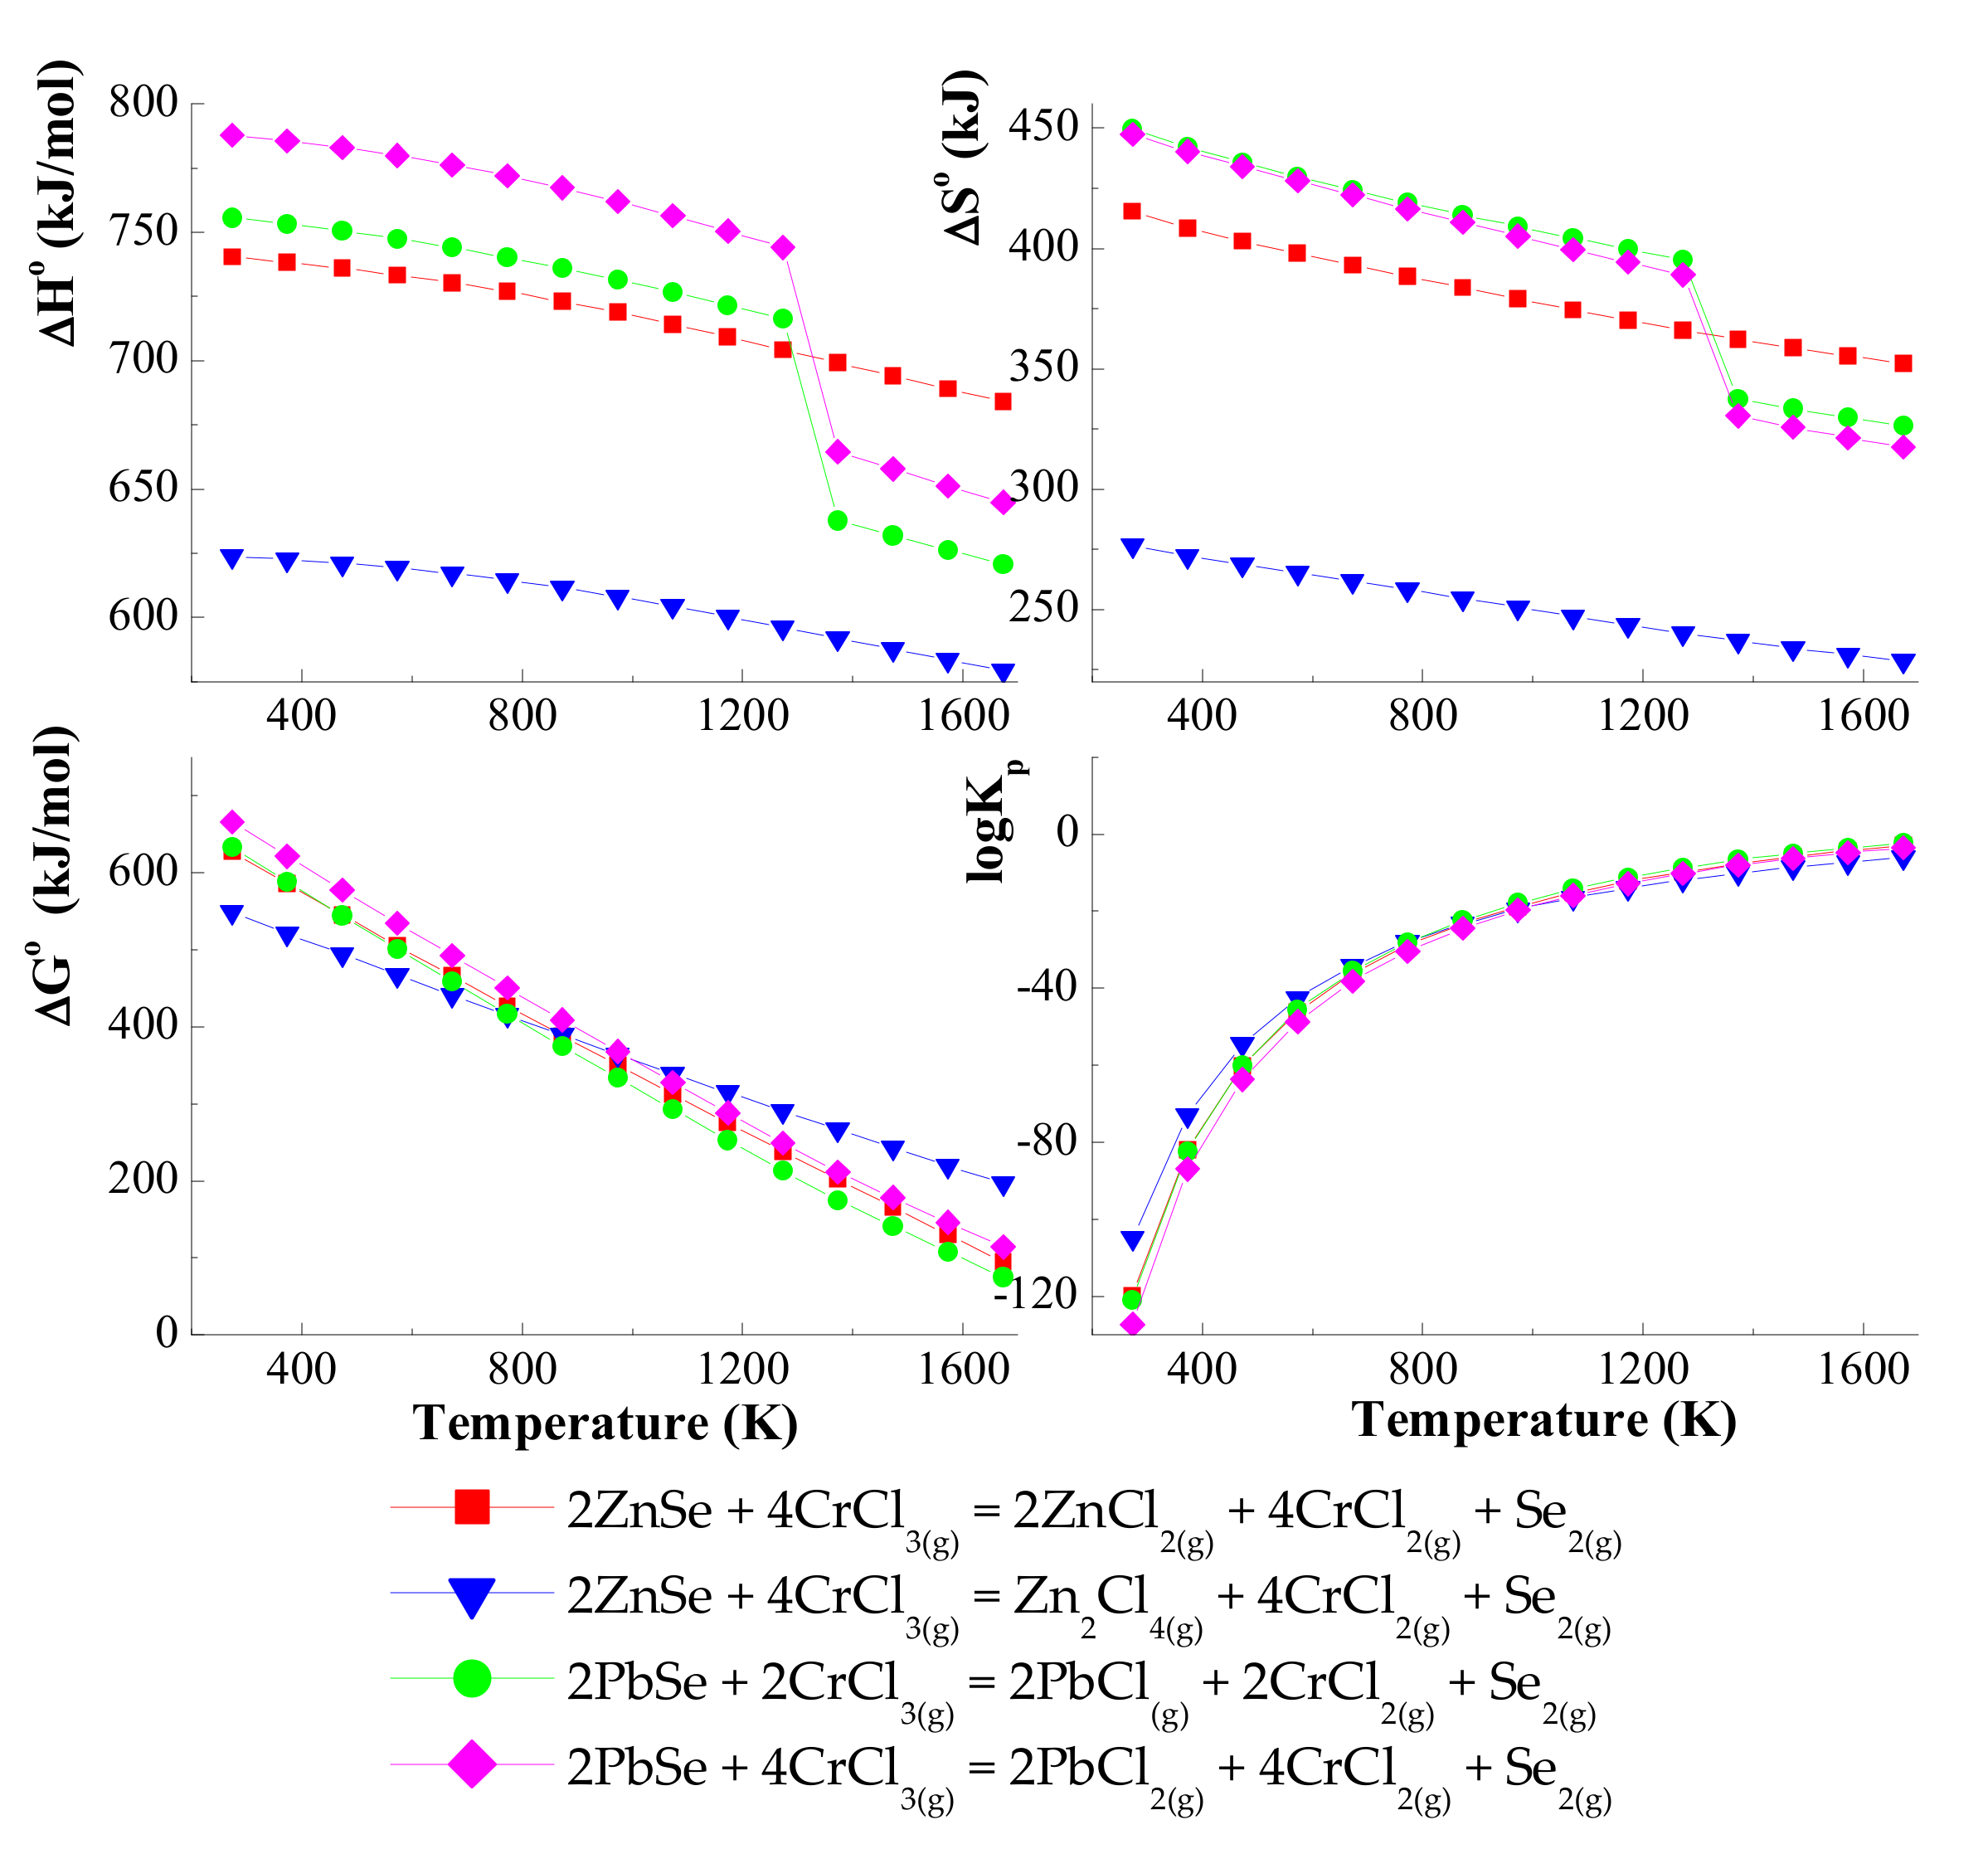
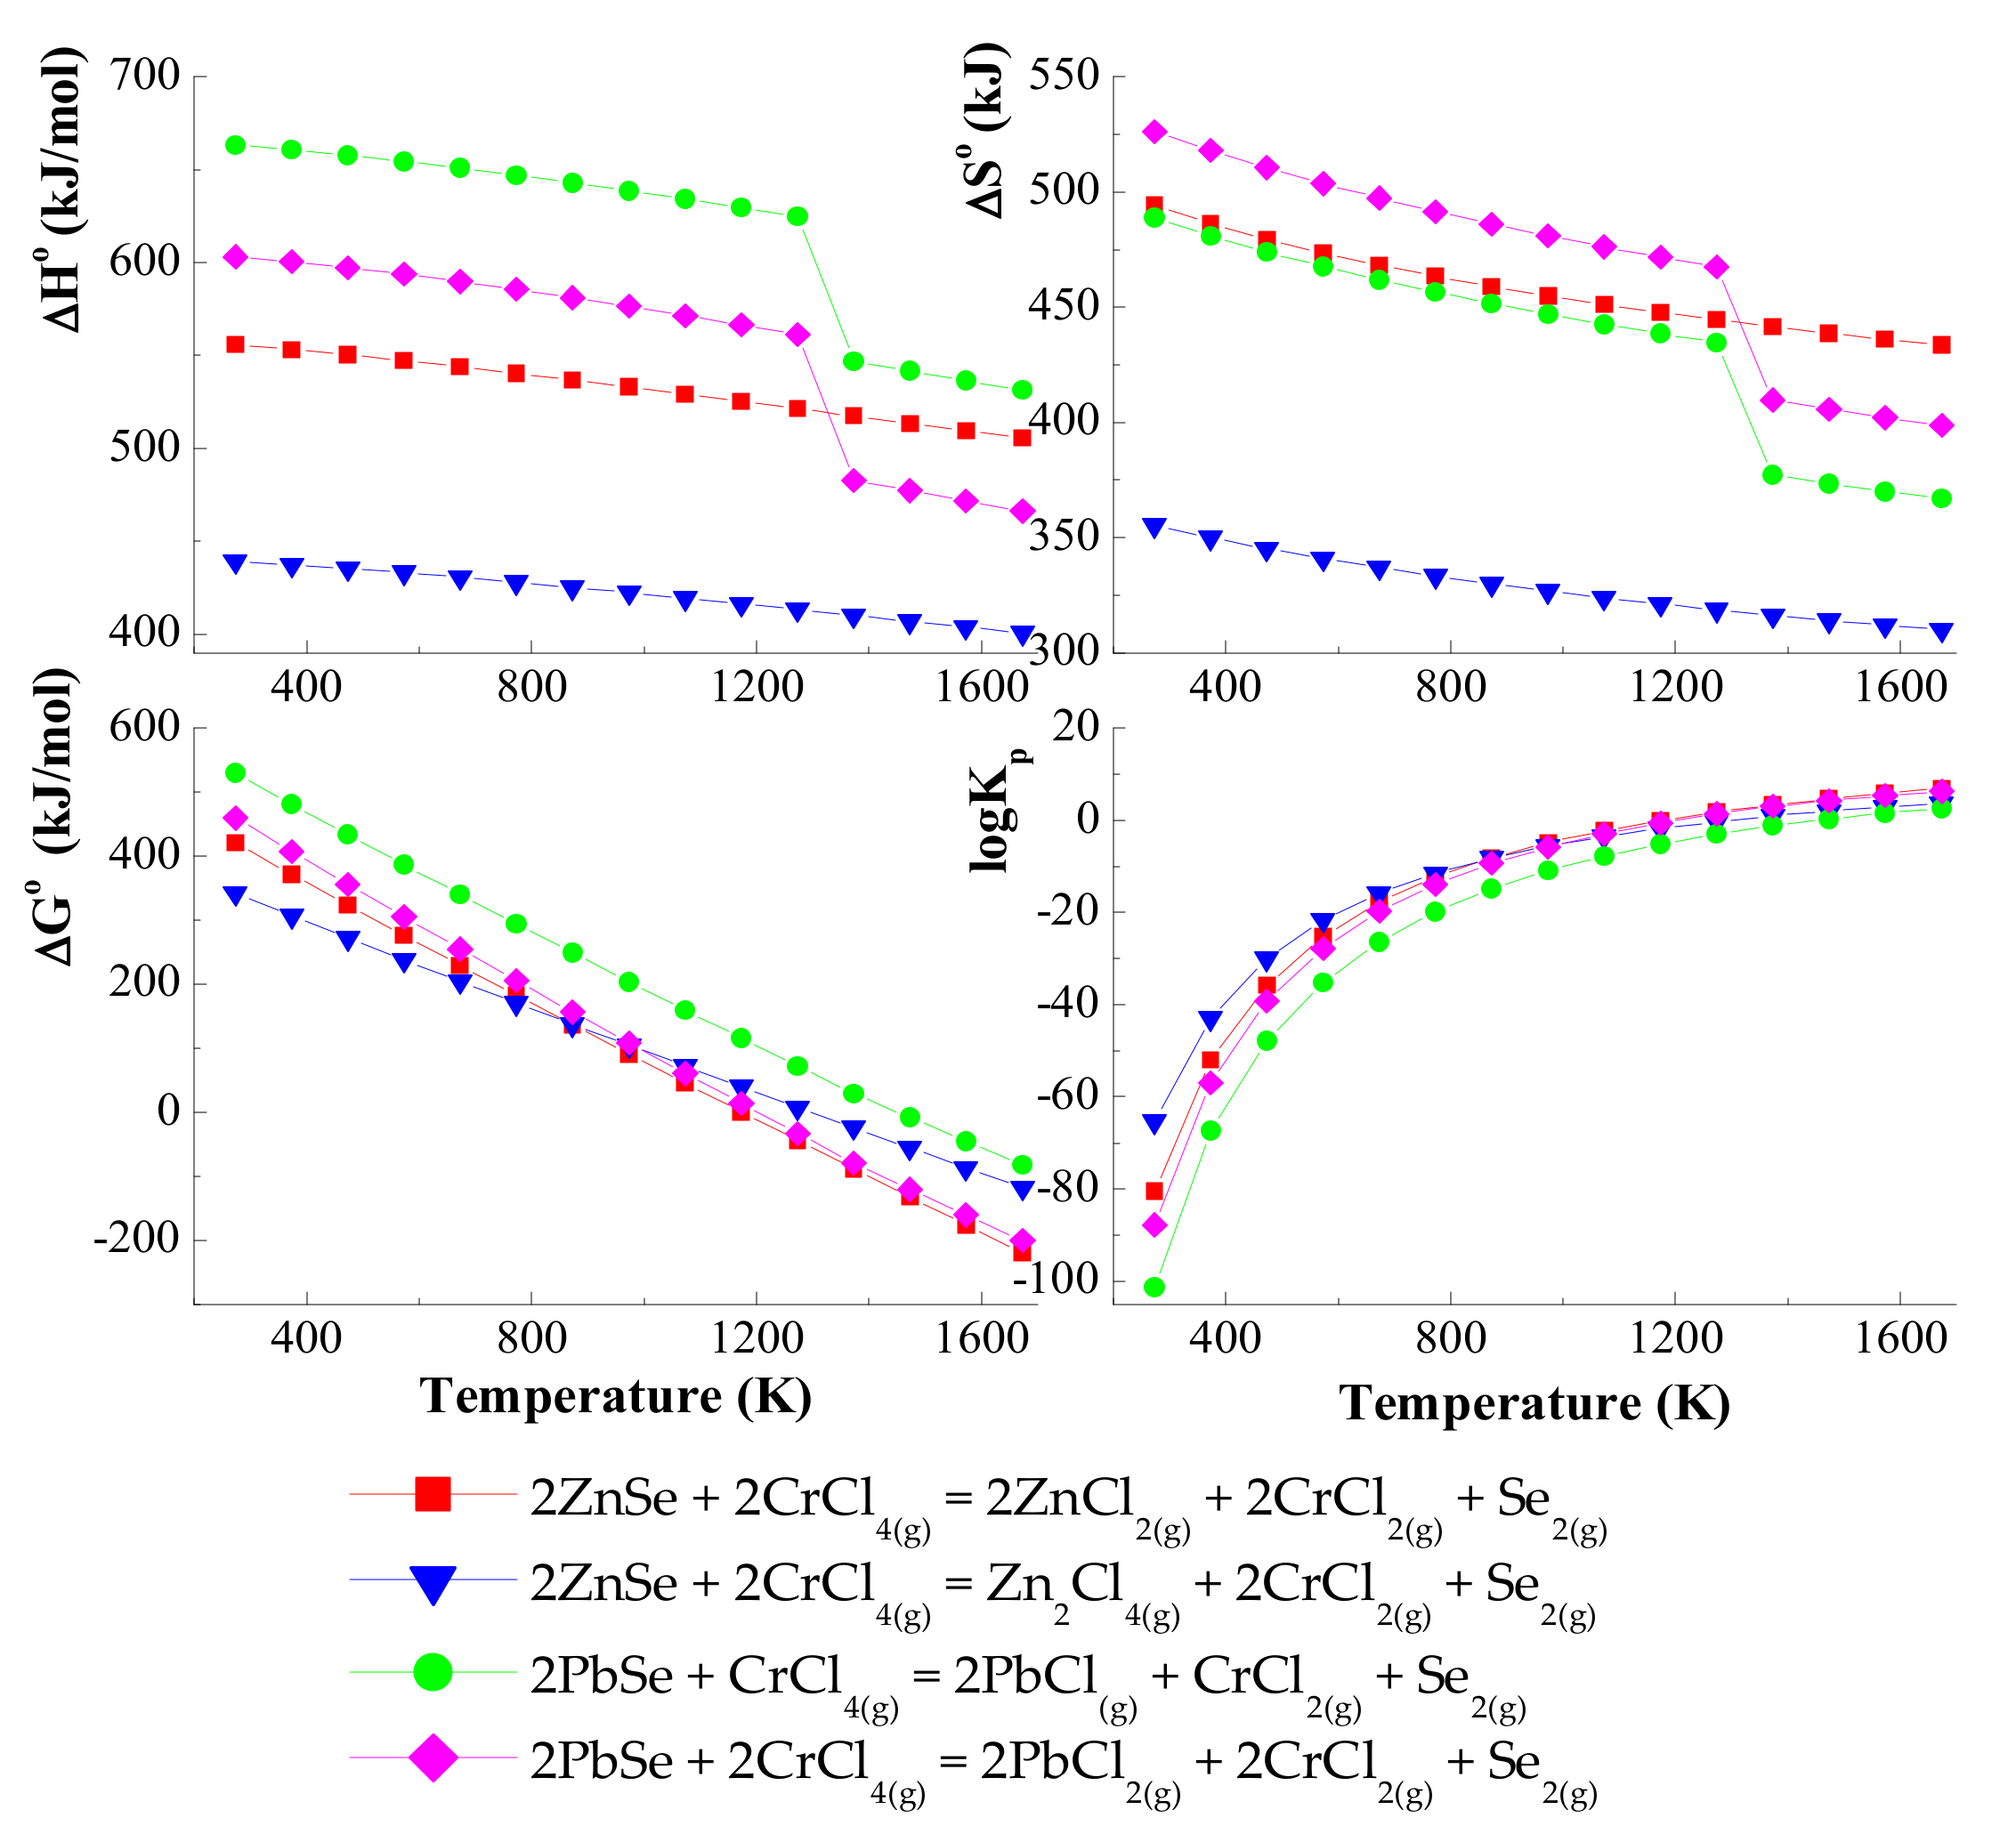
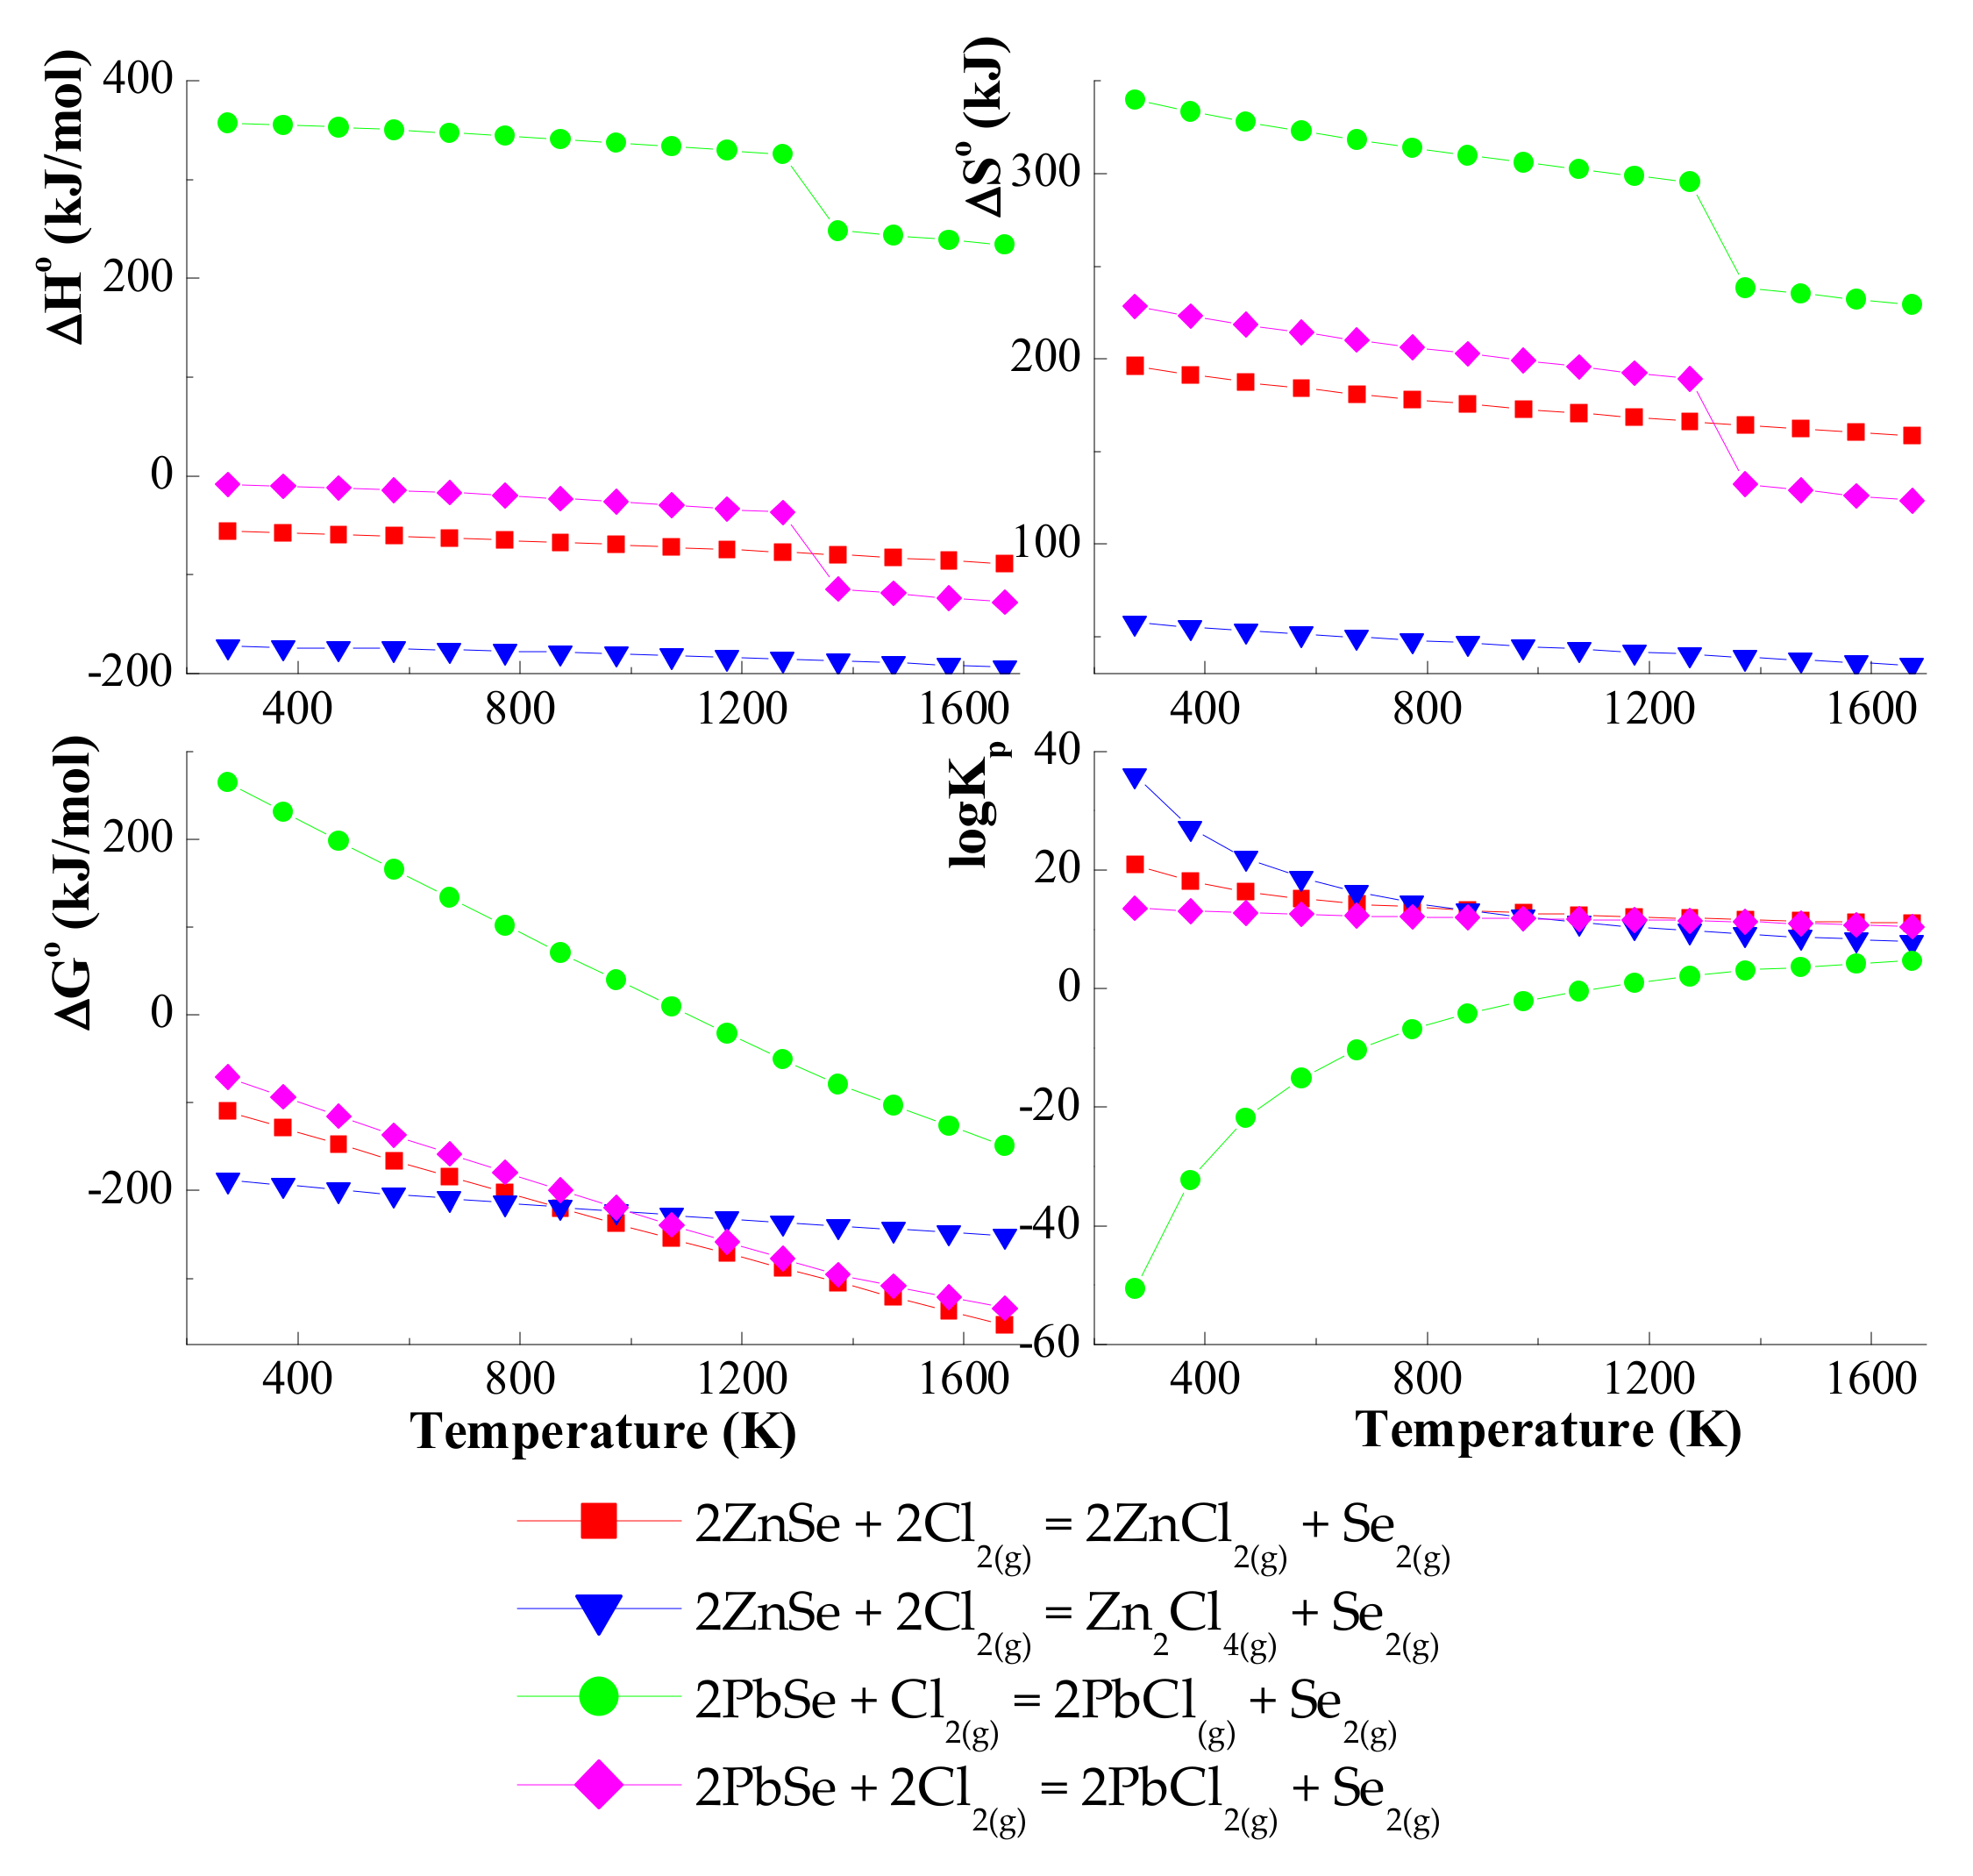
2.1. Computation of Thermodynamic Parameters for the Chemical Transport Reactions
- 2ZnSe + 4CrCl3(g) = 2ZnCl2(g) + 4CrCl2(g) + Se2(g)
- 2ZnSe + 4CrCl3(g) = Zn2Cl4(g) + 4CrCl2(g) + Se2(g)
- 2PbSe + 2CrCl3(g) = 2PbCl(g) + 2CrCl2(g) + Se2(g)
- 2PbSe + 4CrCl3(g) = 2PbCl2(g) + 4CrCl2(g) + Se2(g)
- 2ZnSe + 2CrCl4(g) = 2ZnCl2(g) + 2CrCl2(g) + Se2(g)
- 2ZnSe + 2CrCl4(g) = Zn2Cl4(g) + 2CrCl2(g) + Se2(g)
- 2PbSe + CrCl4(g) = 2PbCl(g) + CrCl2(g) + Se2(g)
- 2PbSe + 2CrCl4(g) = 2PbCl2(g) + 2CrCl2(g) + Se2(g)
- 2ZnSe + 2Cl2(g) = 2ZnCl2(g) + Se2(g)
- 2ZnSe + 2Cl2(g) = Zn2Cl4(g) + Se2(g)
- 2PbSe + Cl2(g) = 2PbCl(g) + Se2(g)
- 2PbSe + 2Cl2(g) = 2PbCl2(g) + Se2(g)
2.2. Synthesis of ZnSe and PbSe
2.3. Crystal Structure and Chemical Composition
2.4. Magnetic and Electrical Measurements
3. Results and Discussion
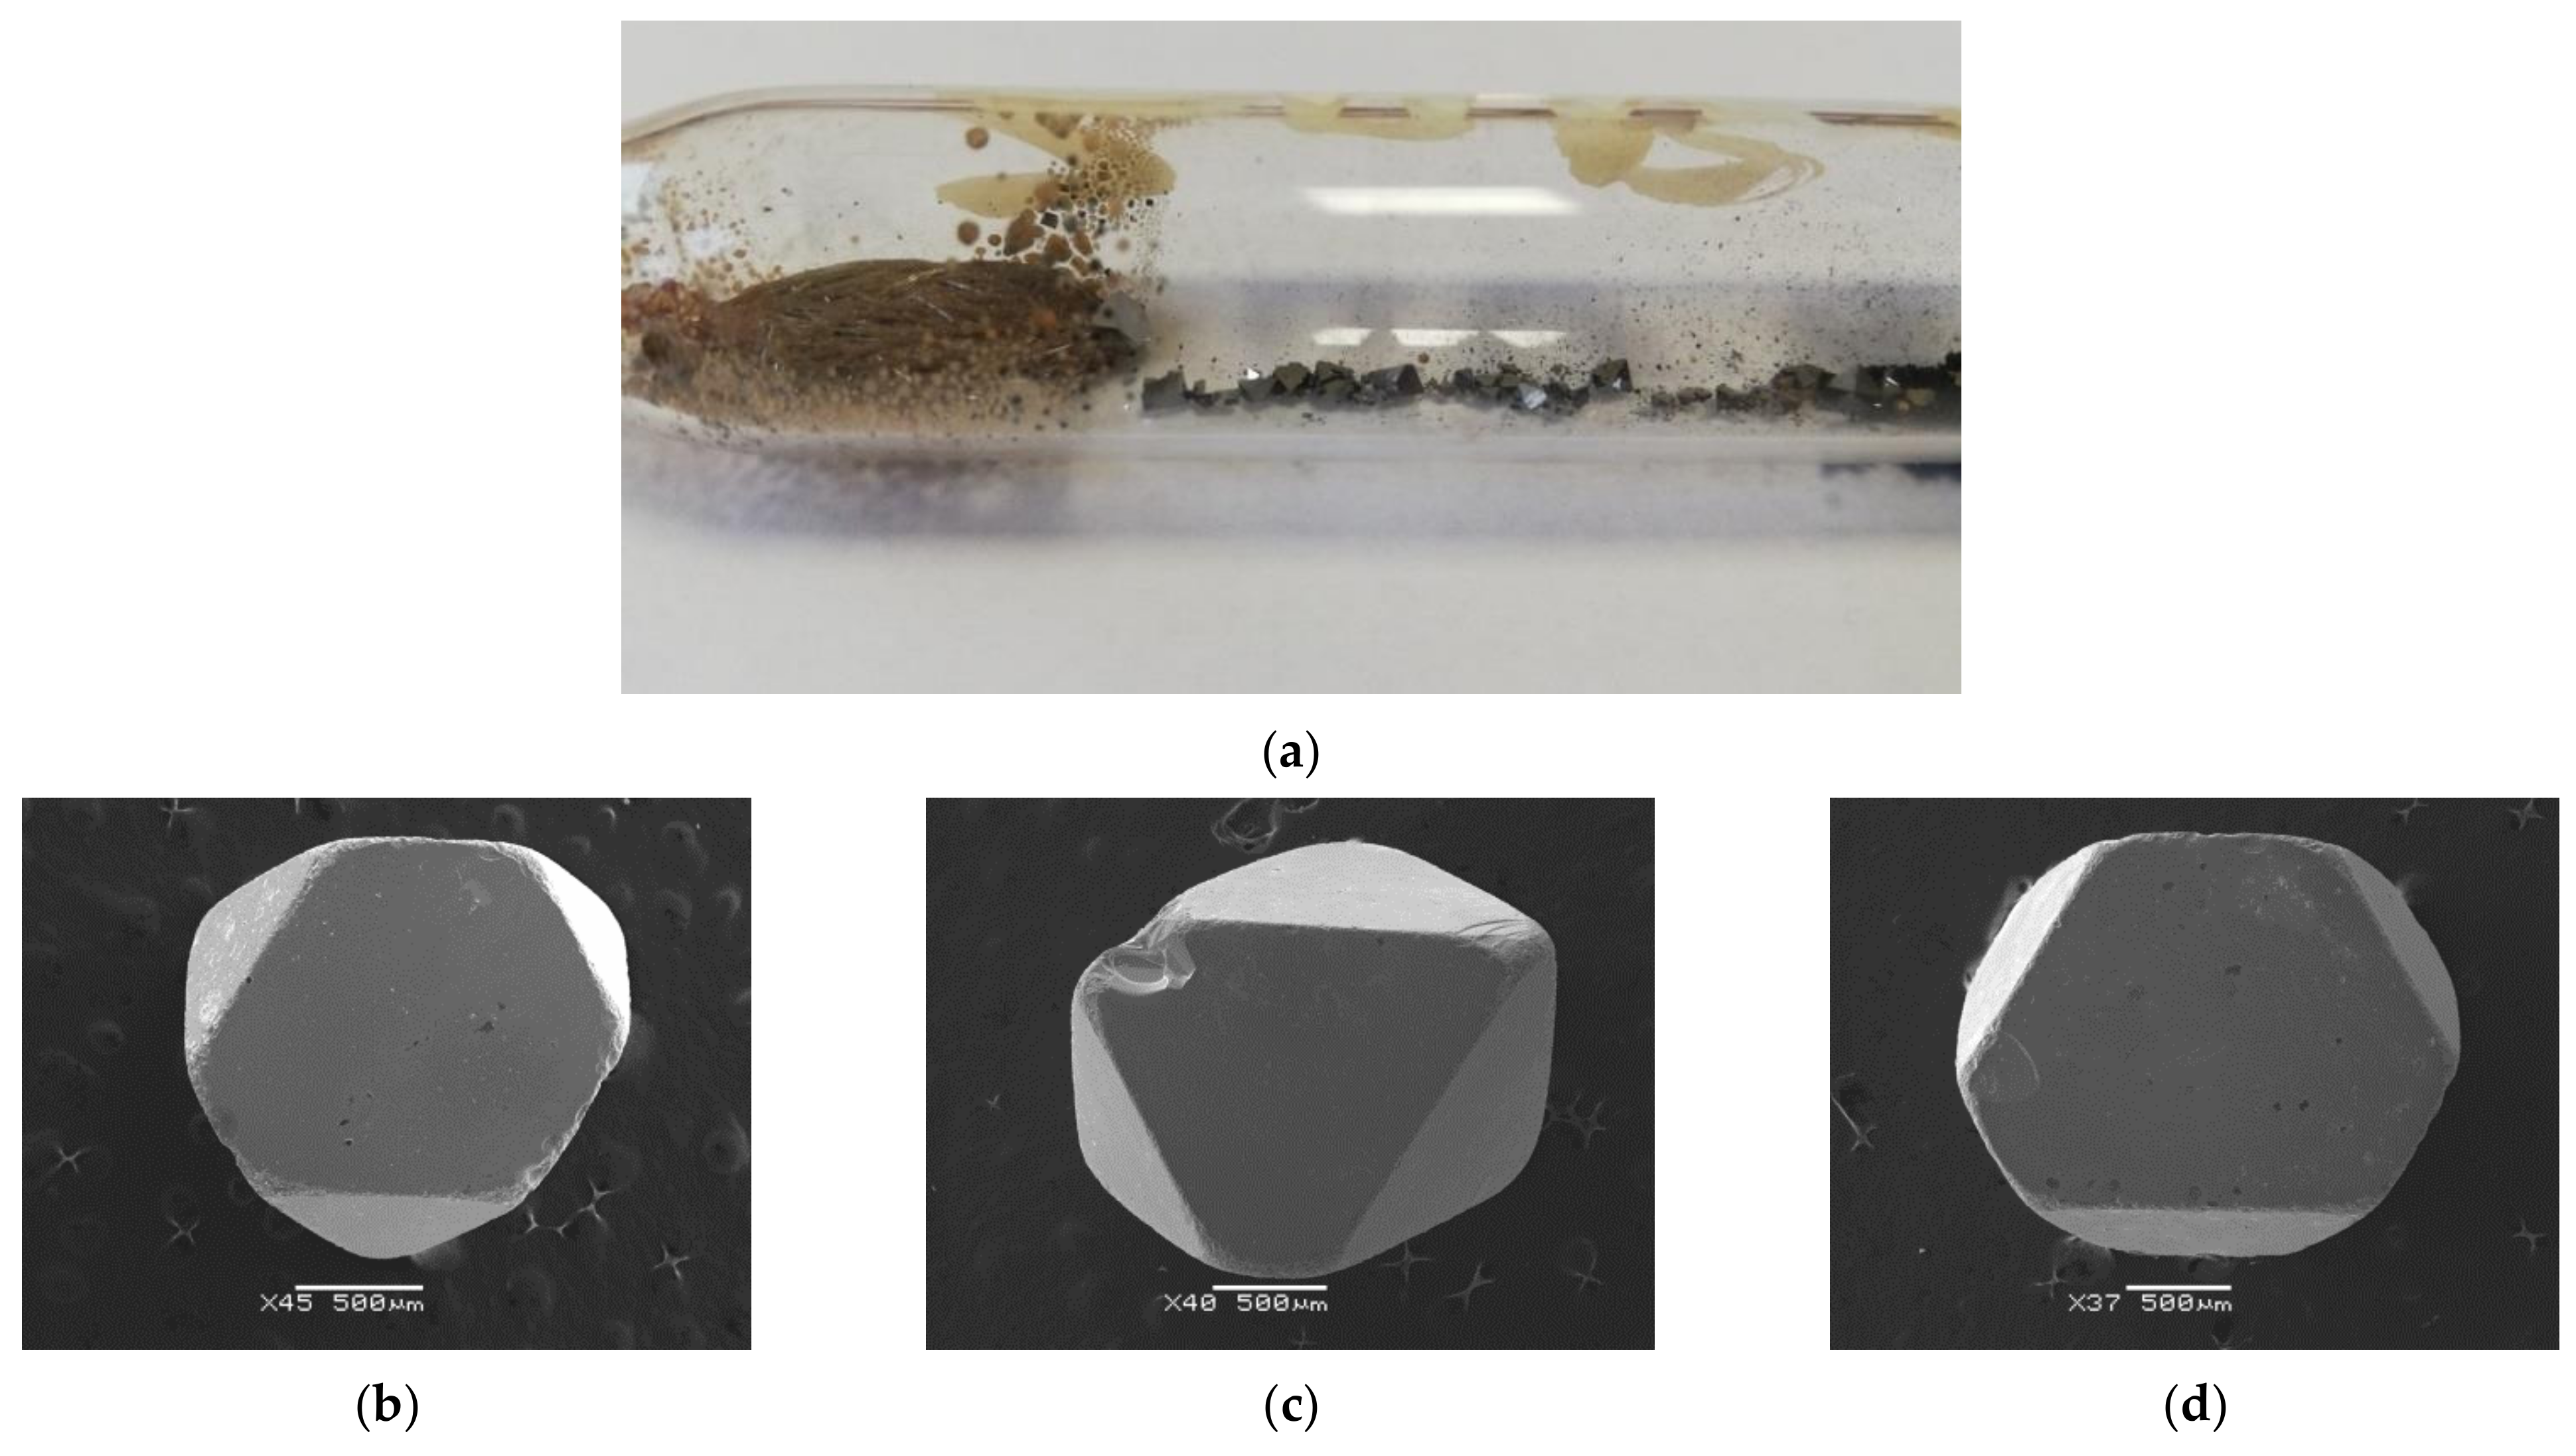
3.1. Growth of Single Crystals and Chemical Composition
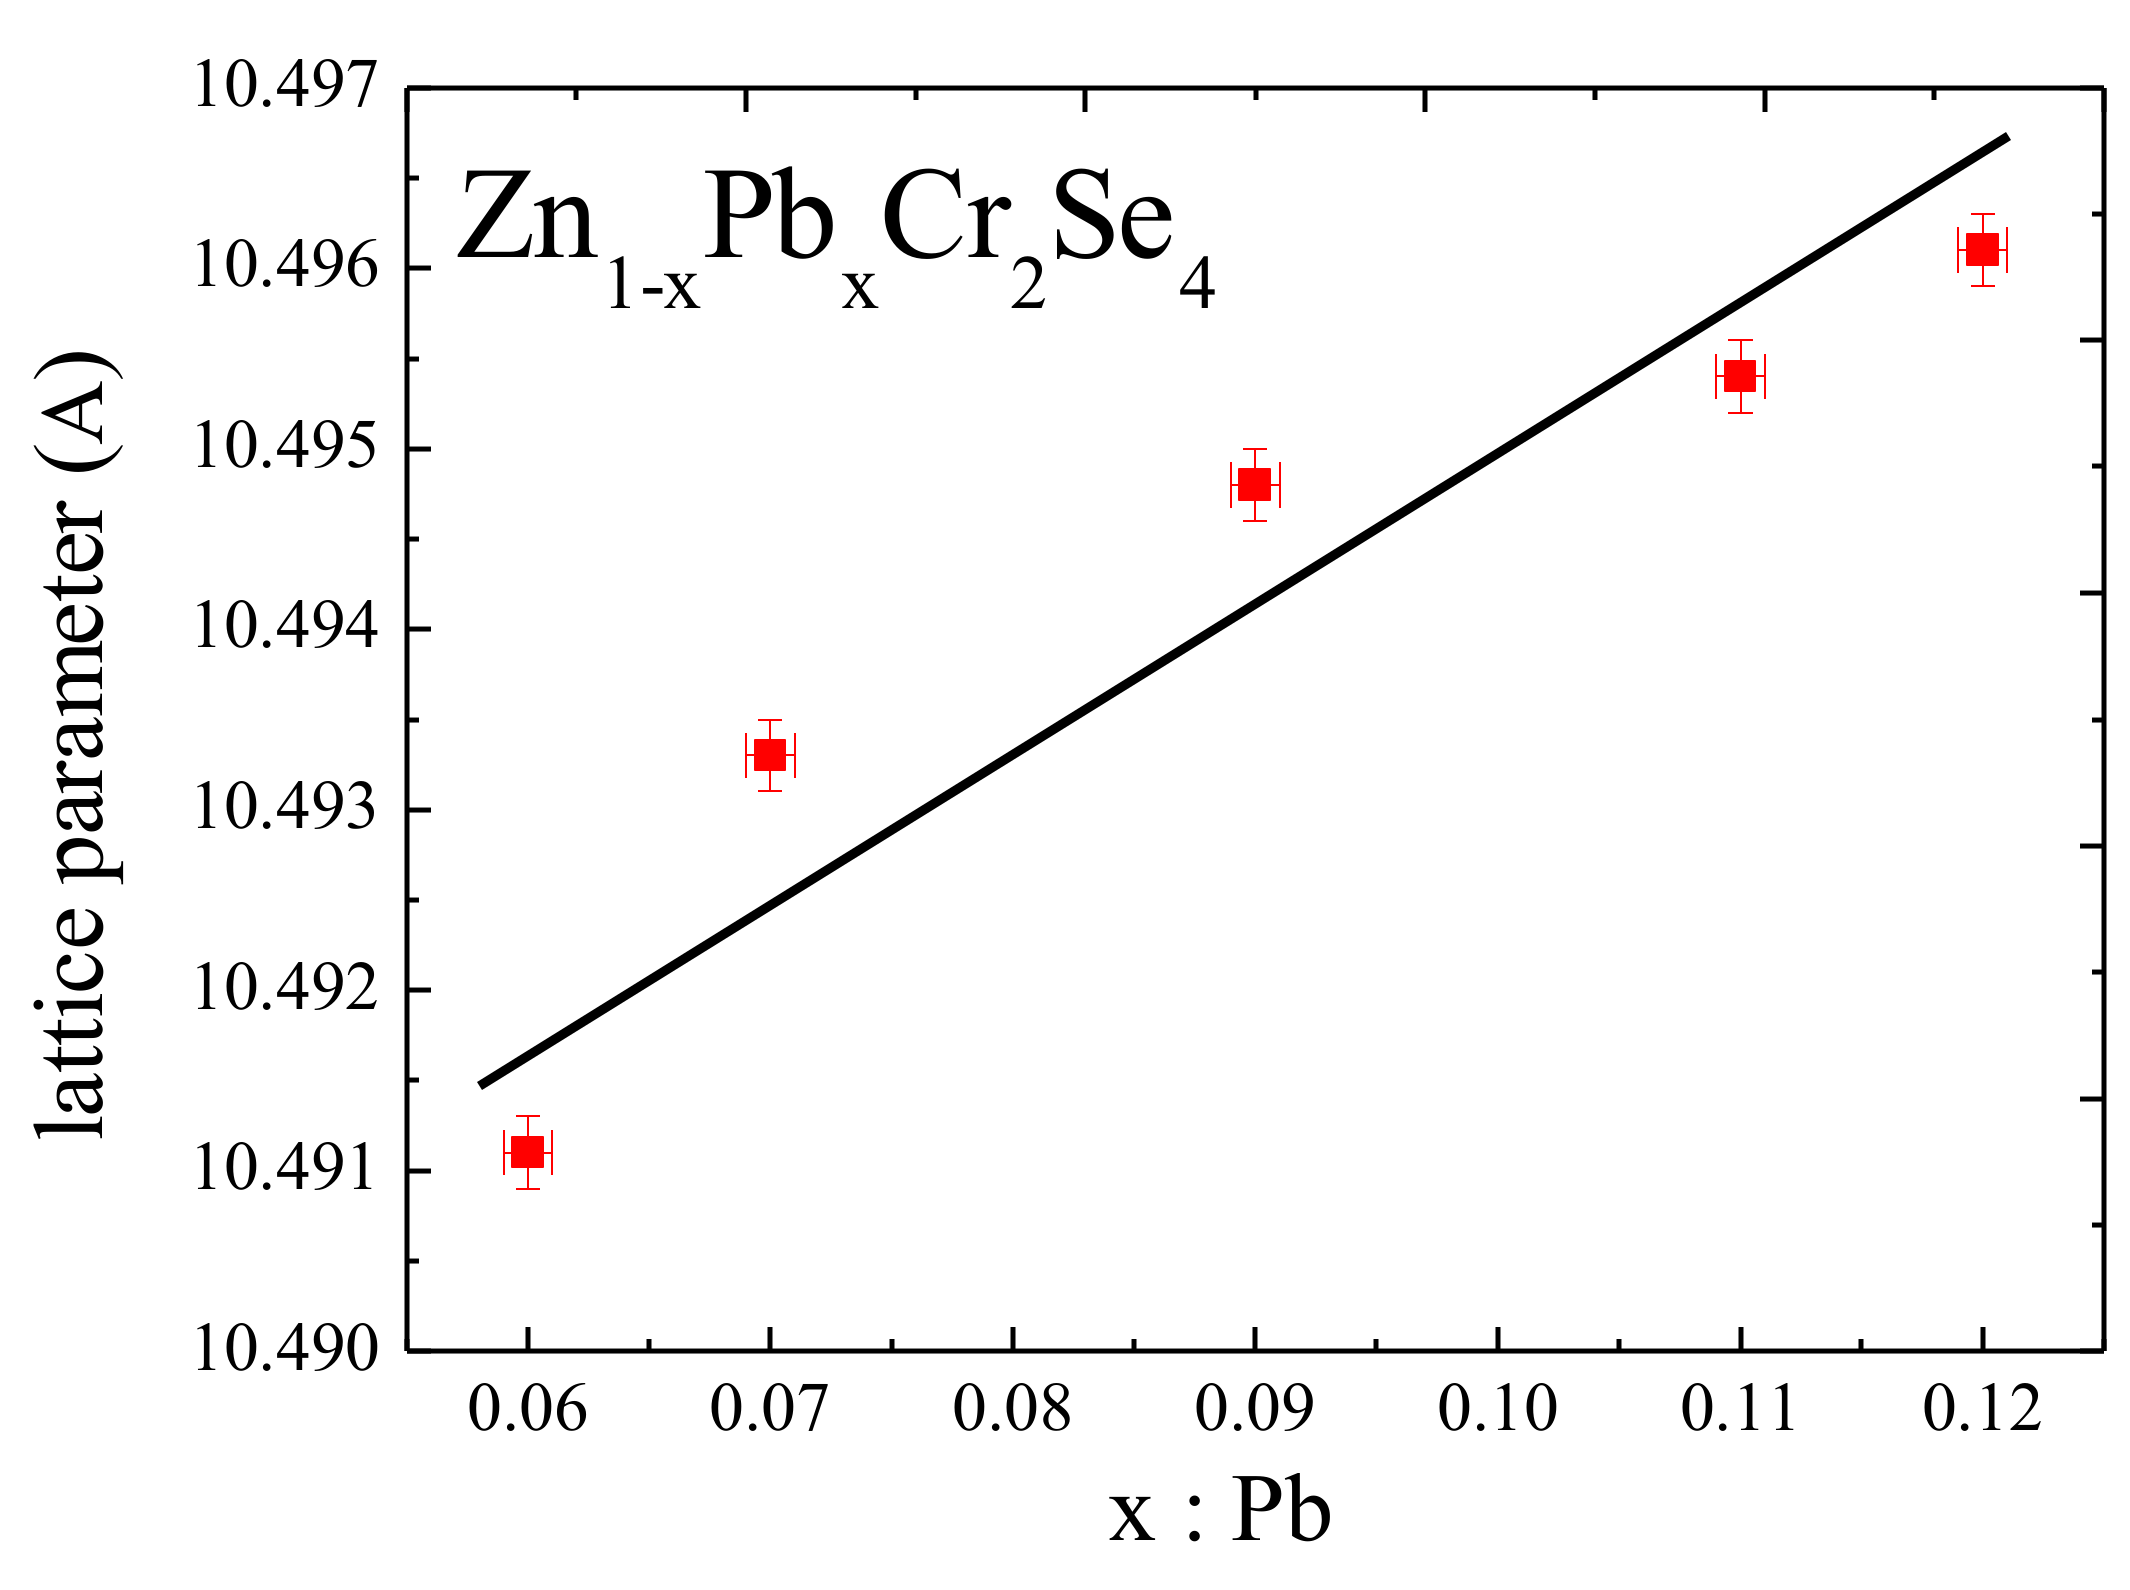
3.2. Structural Study
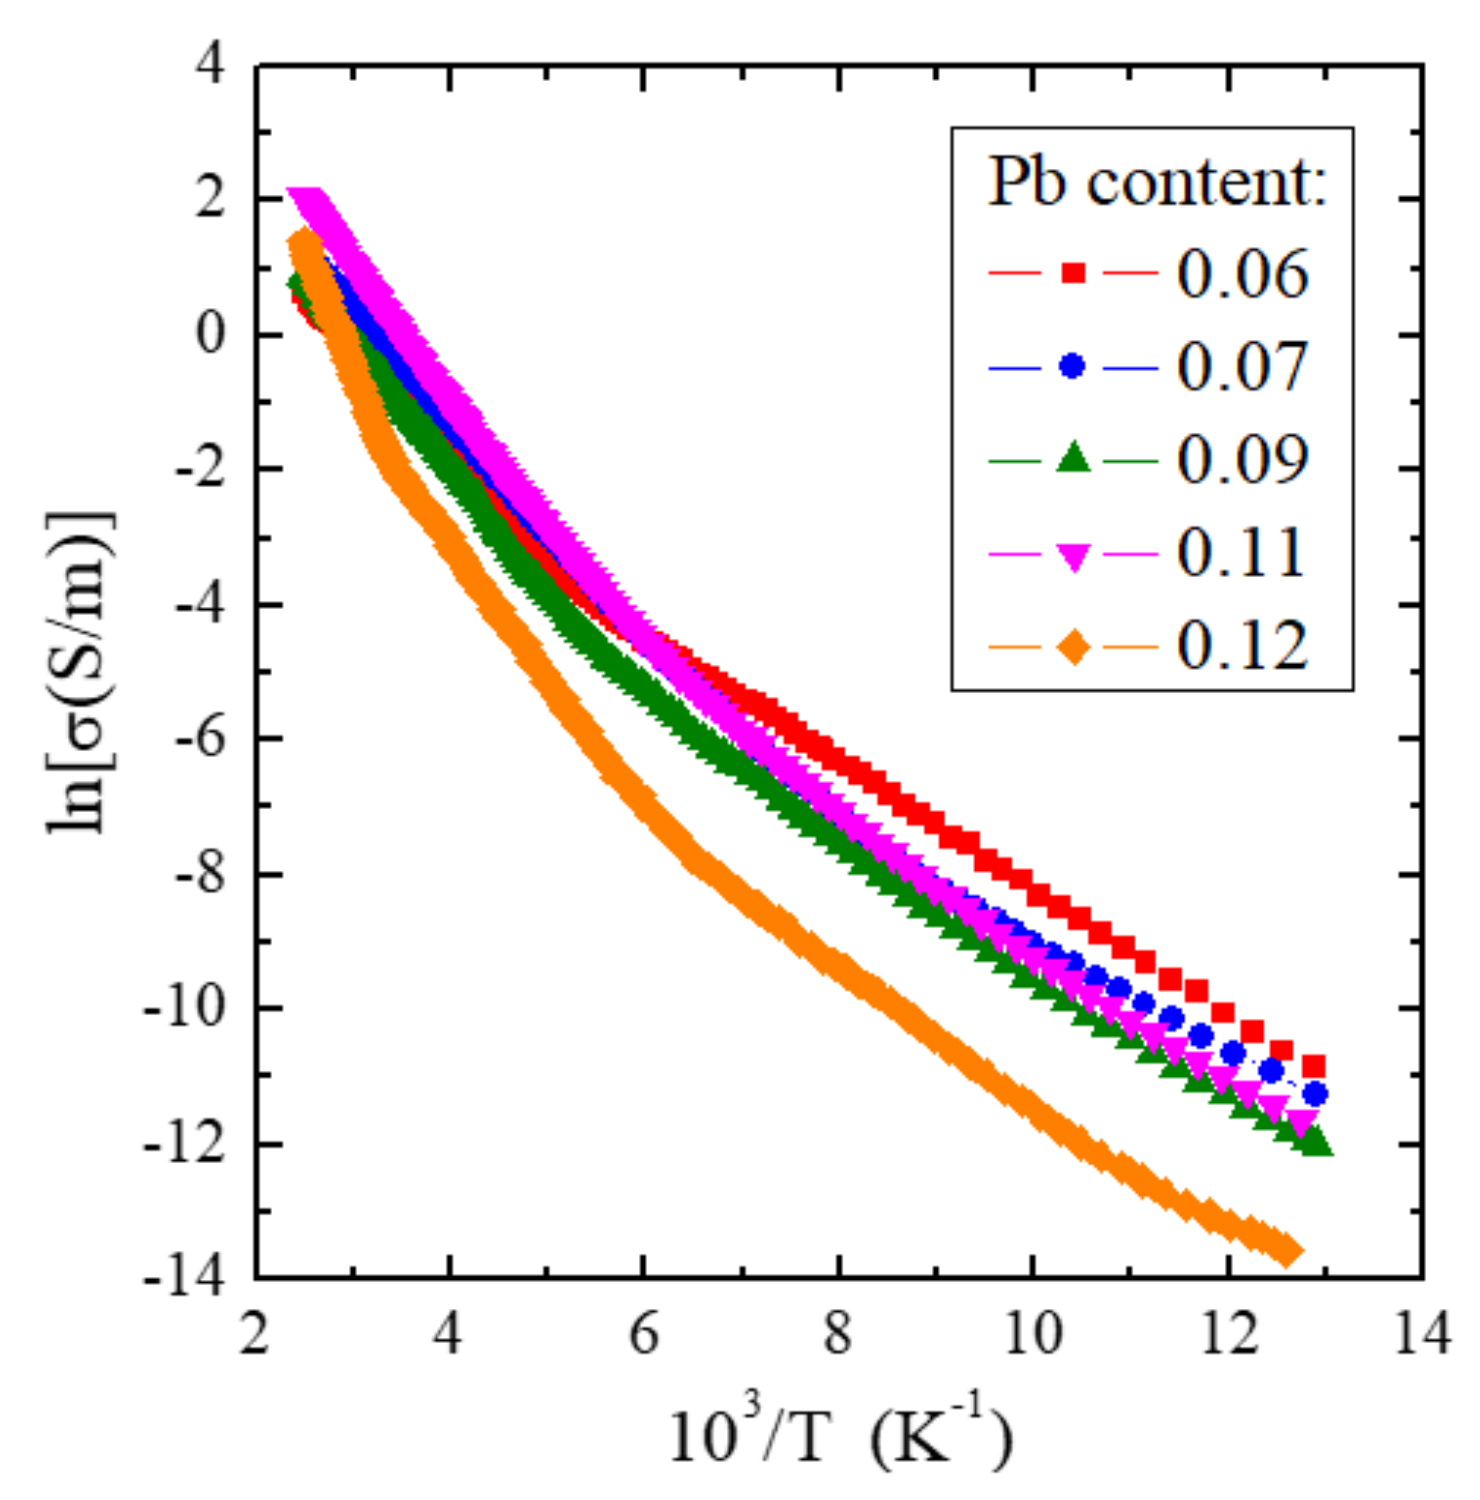
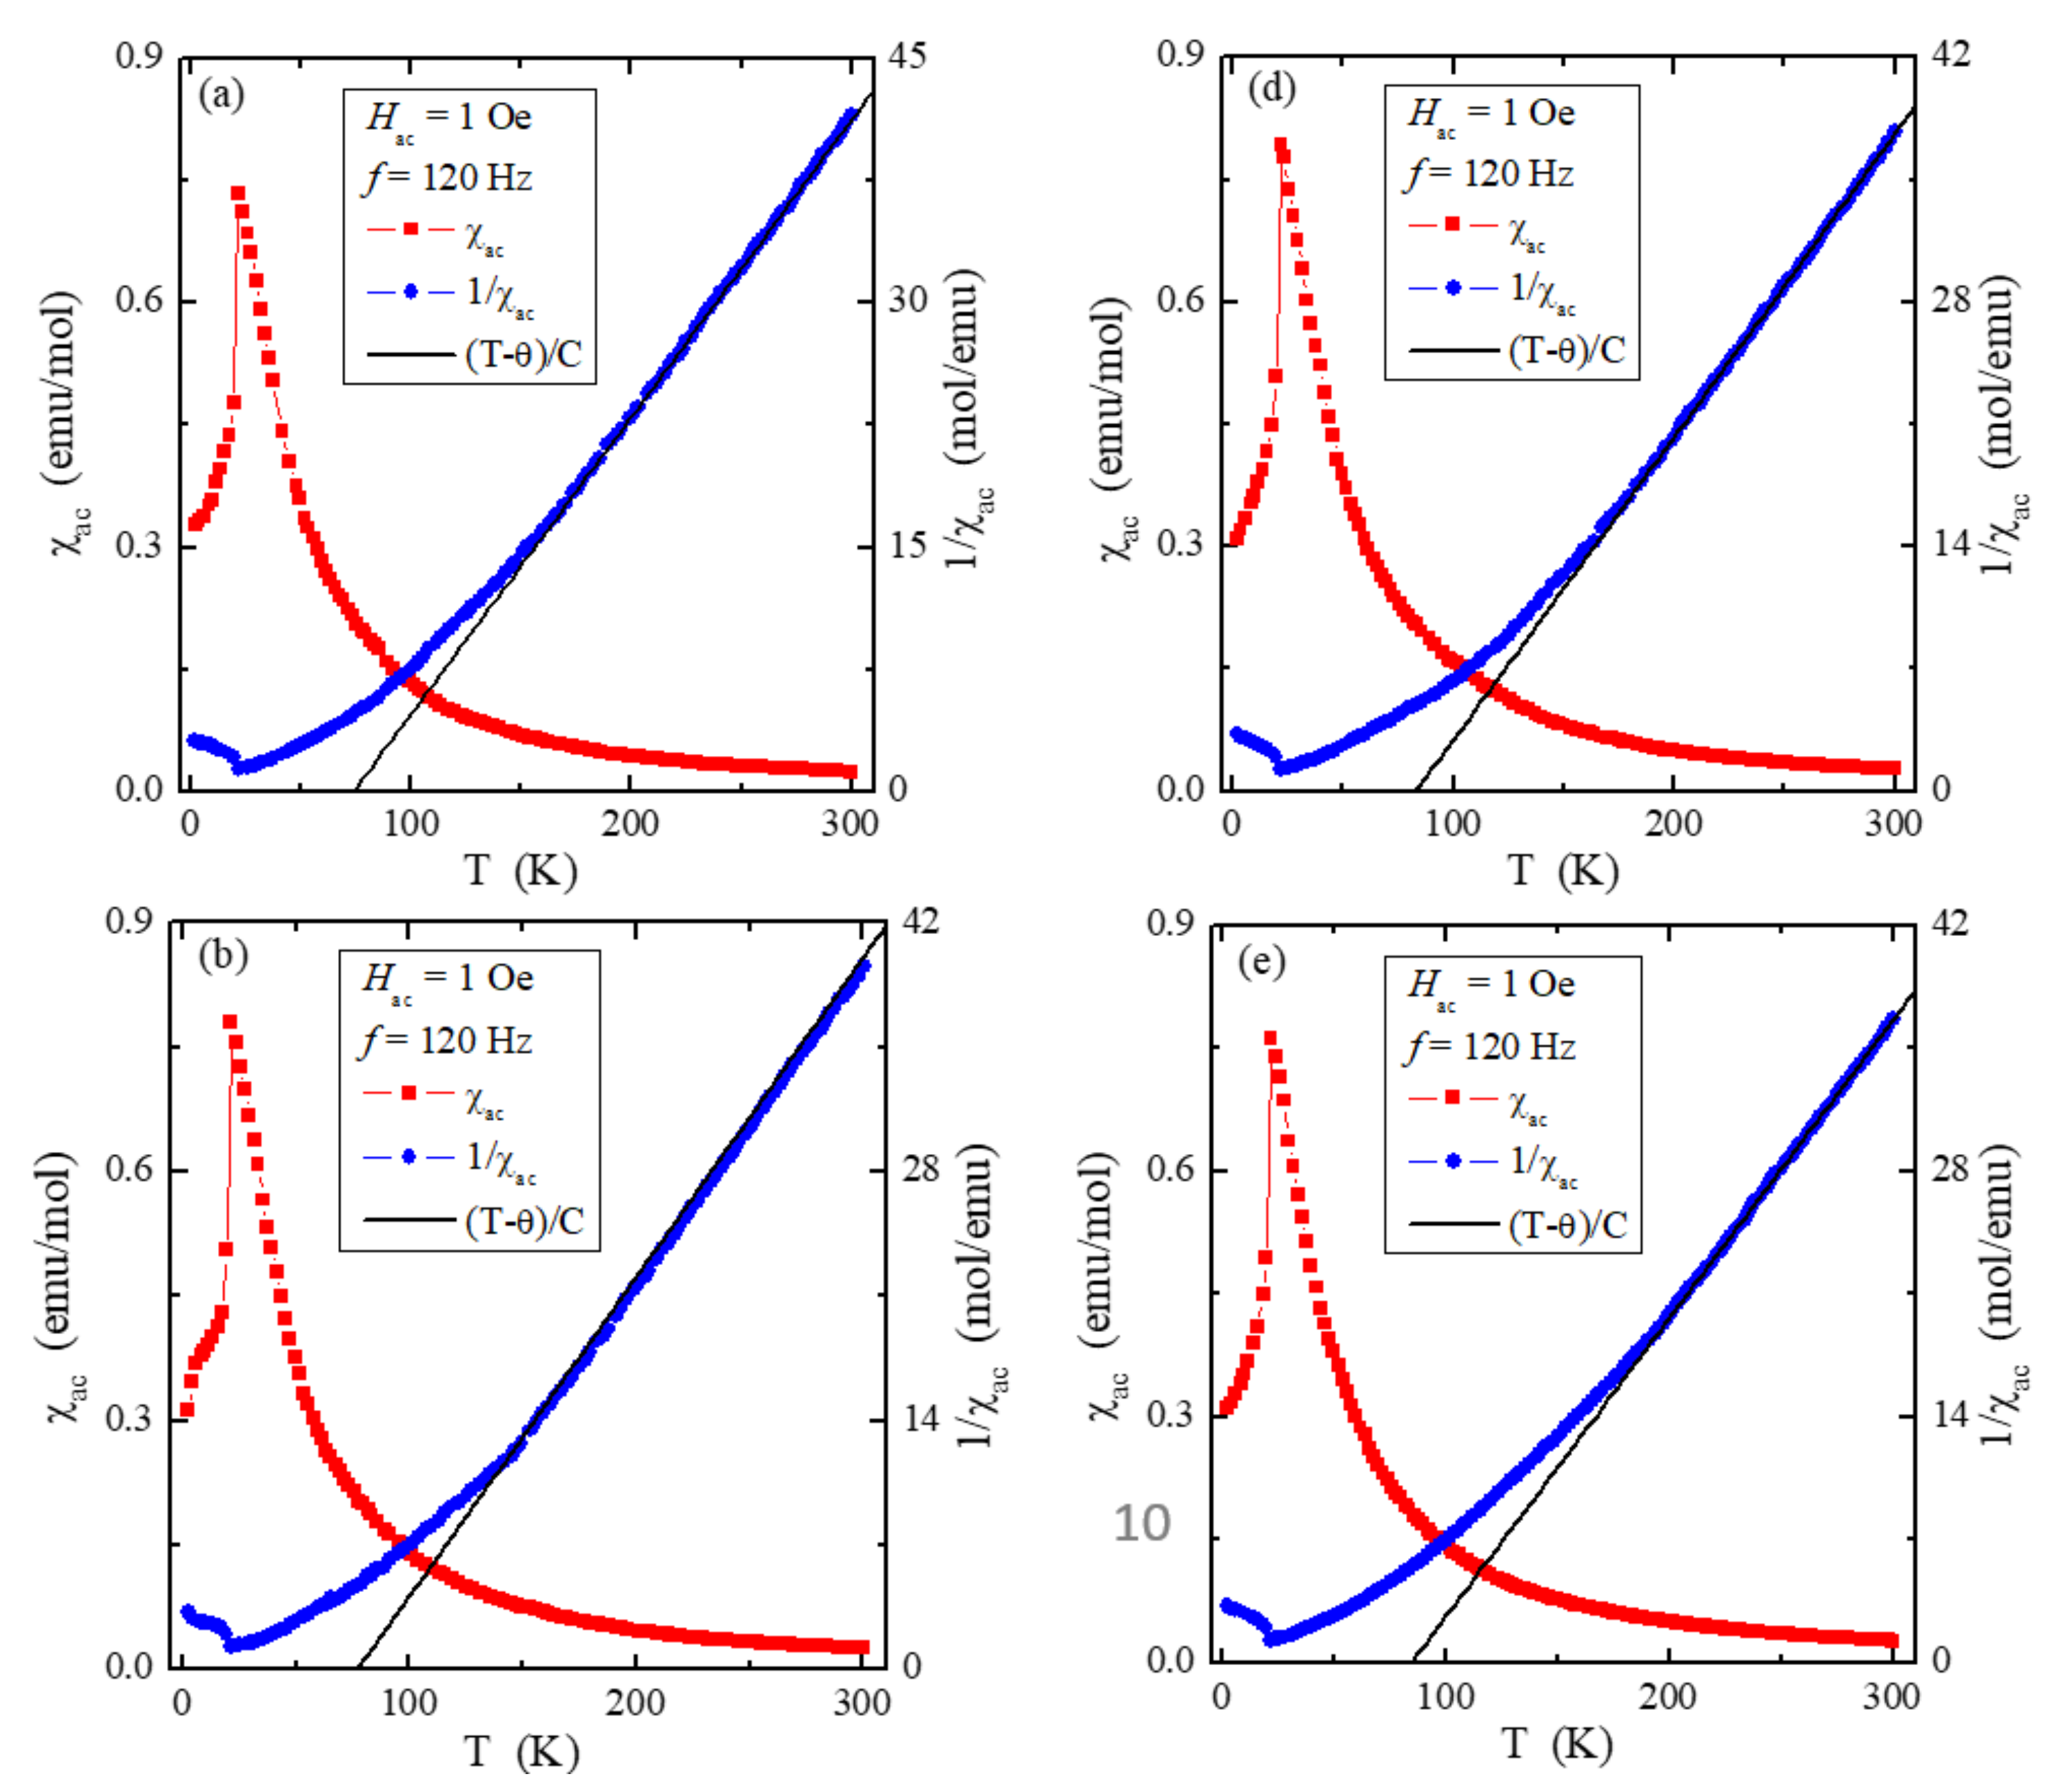
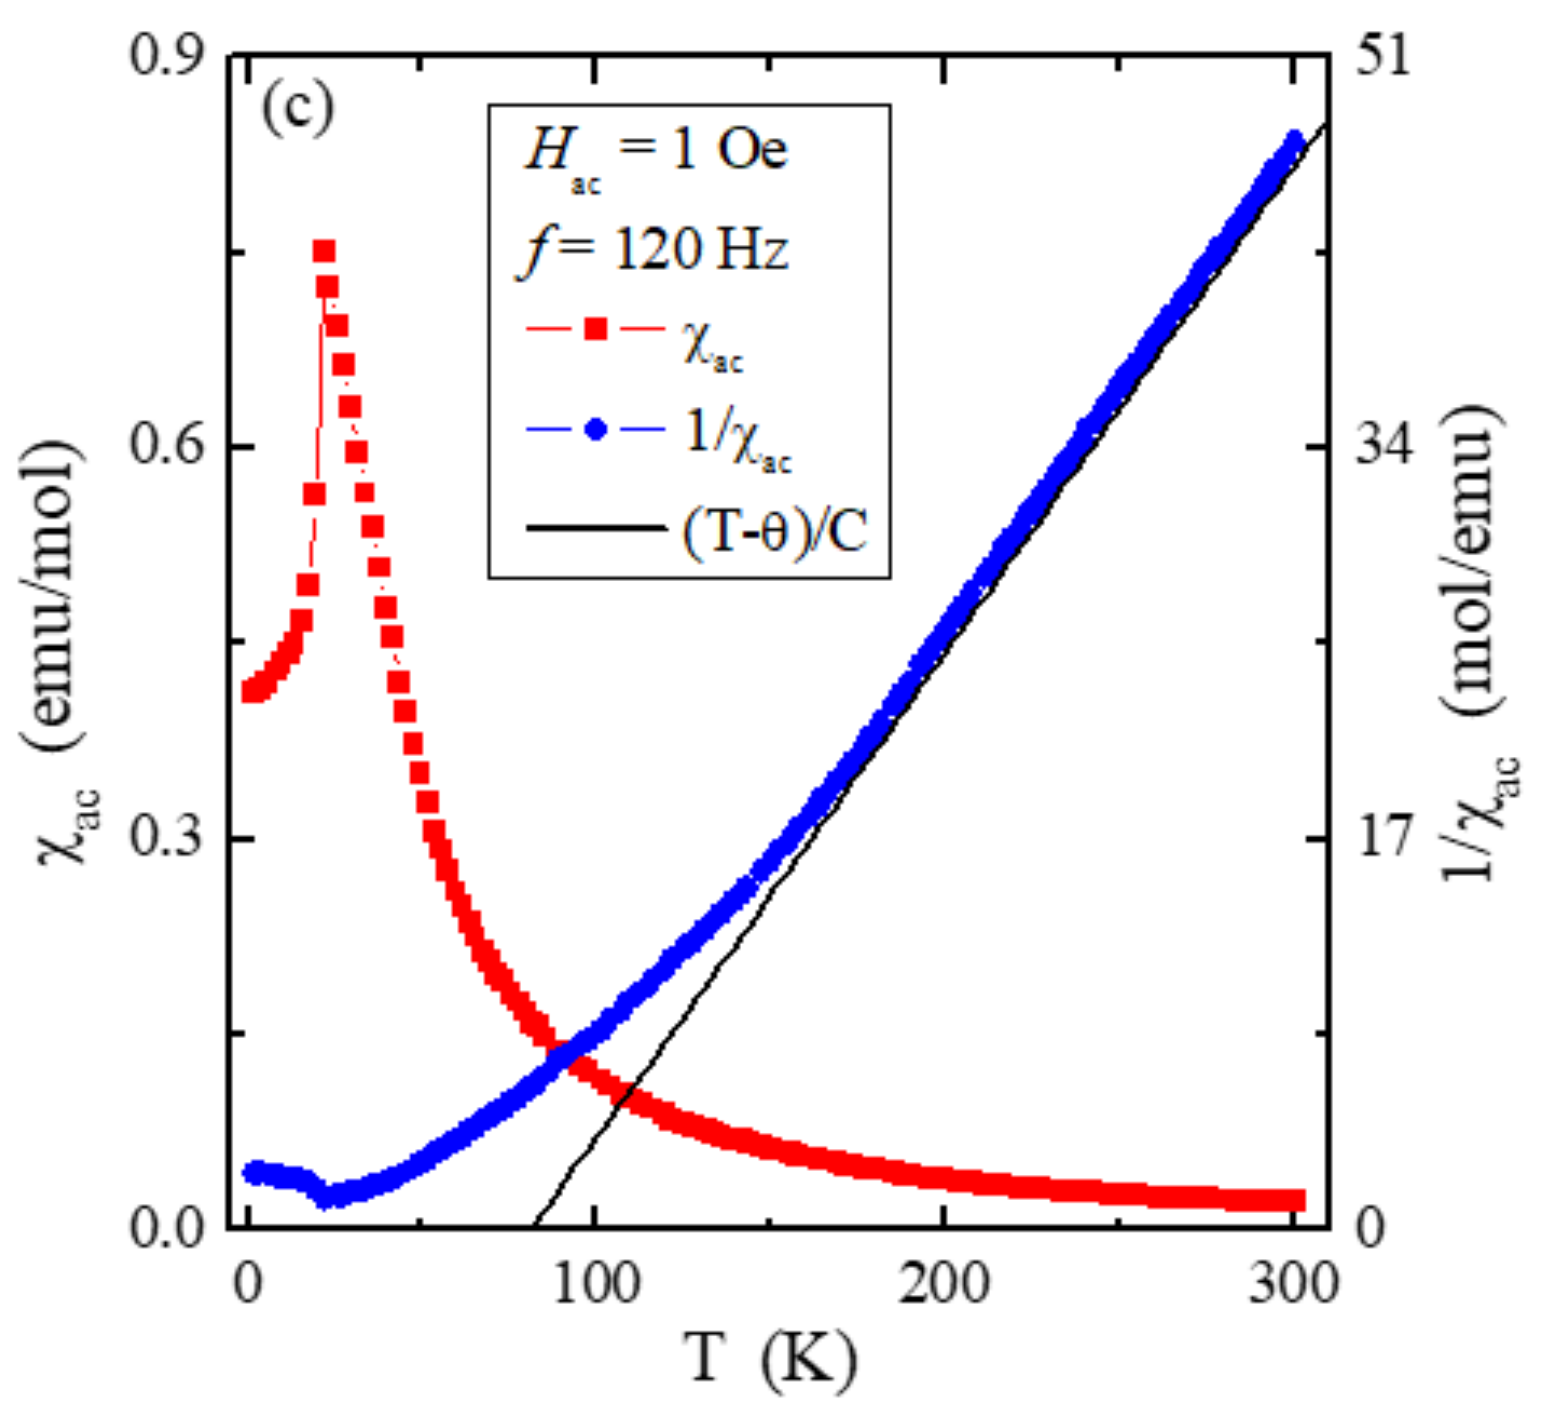
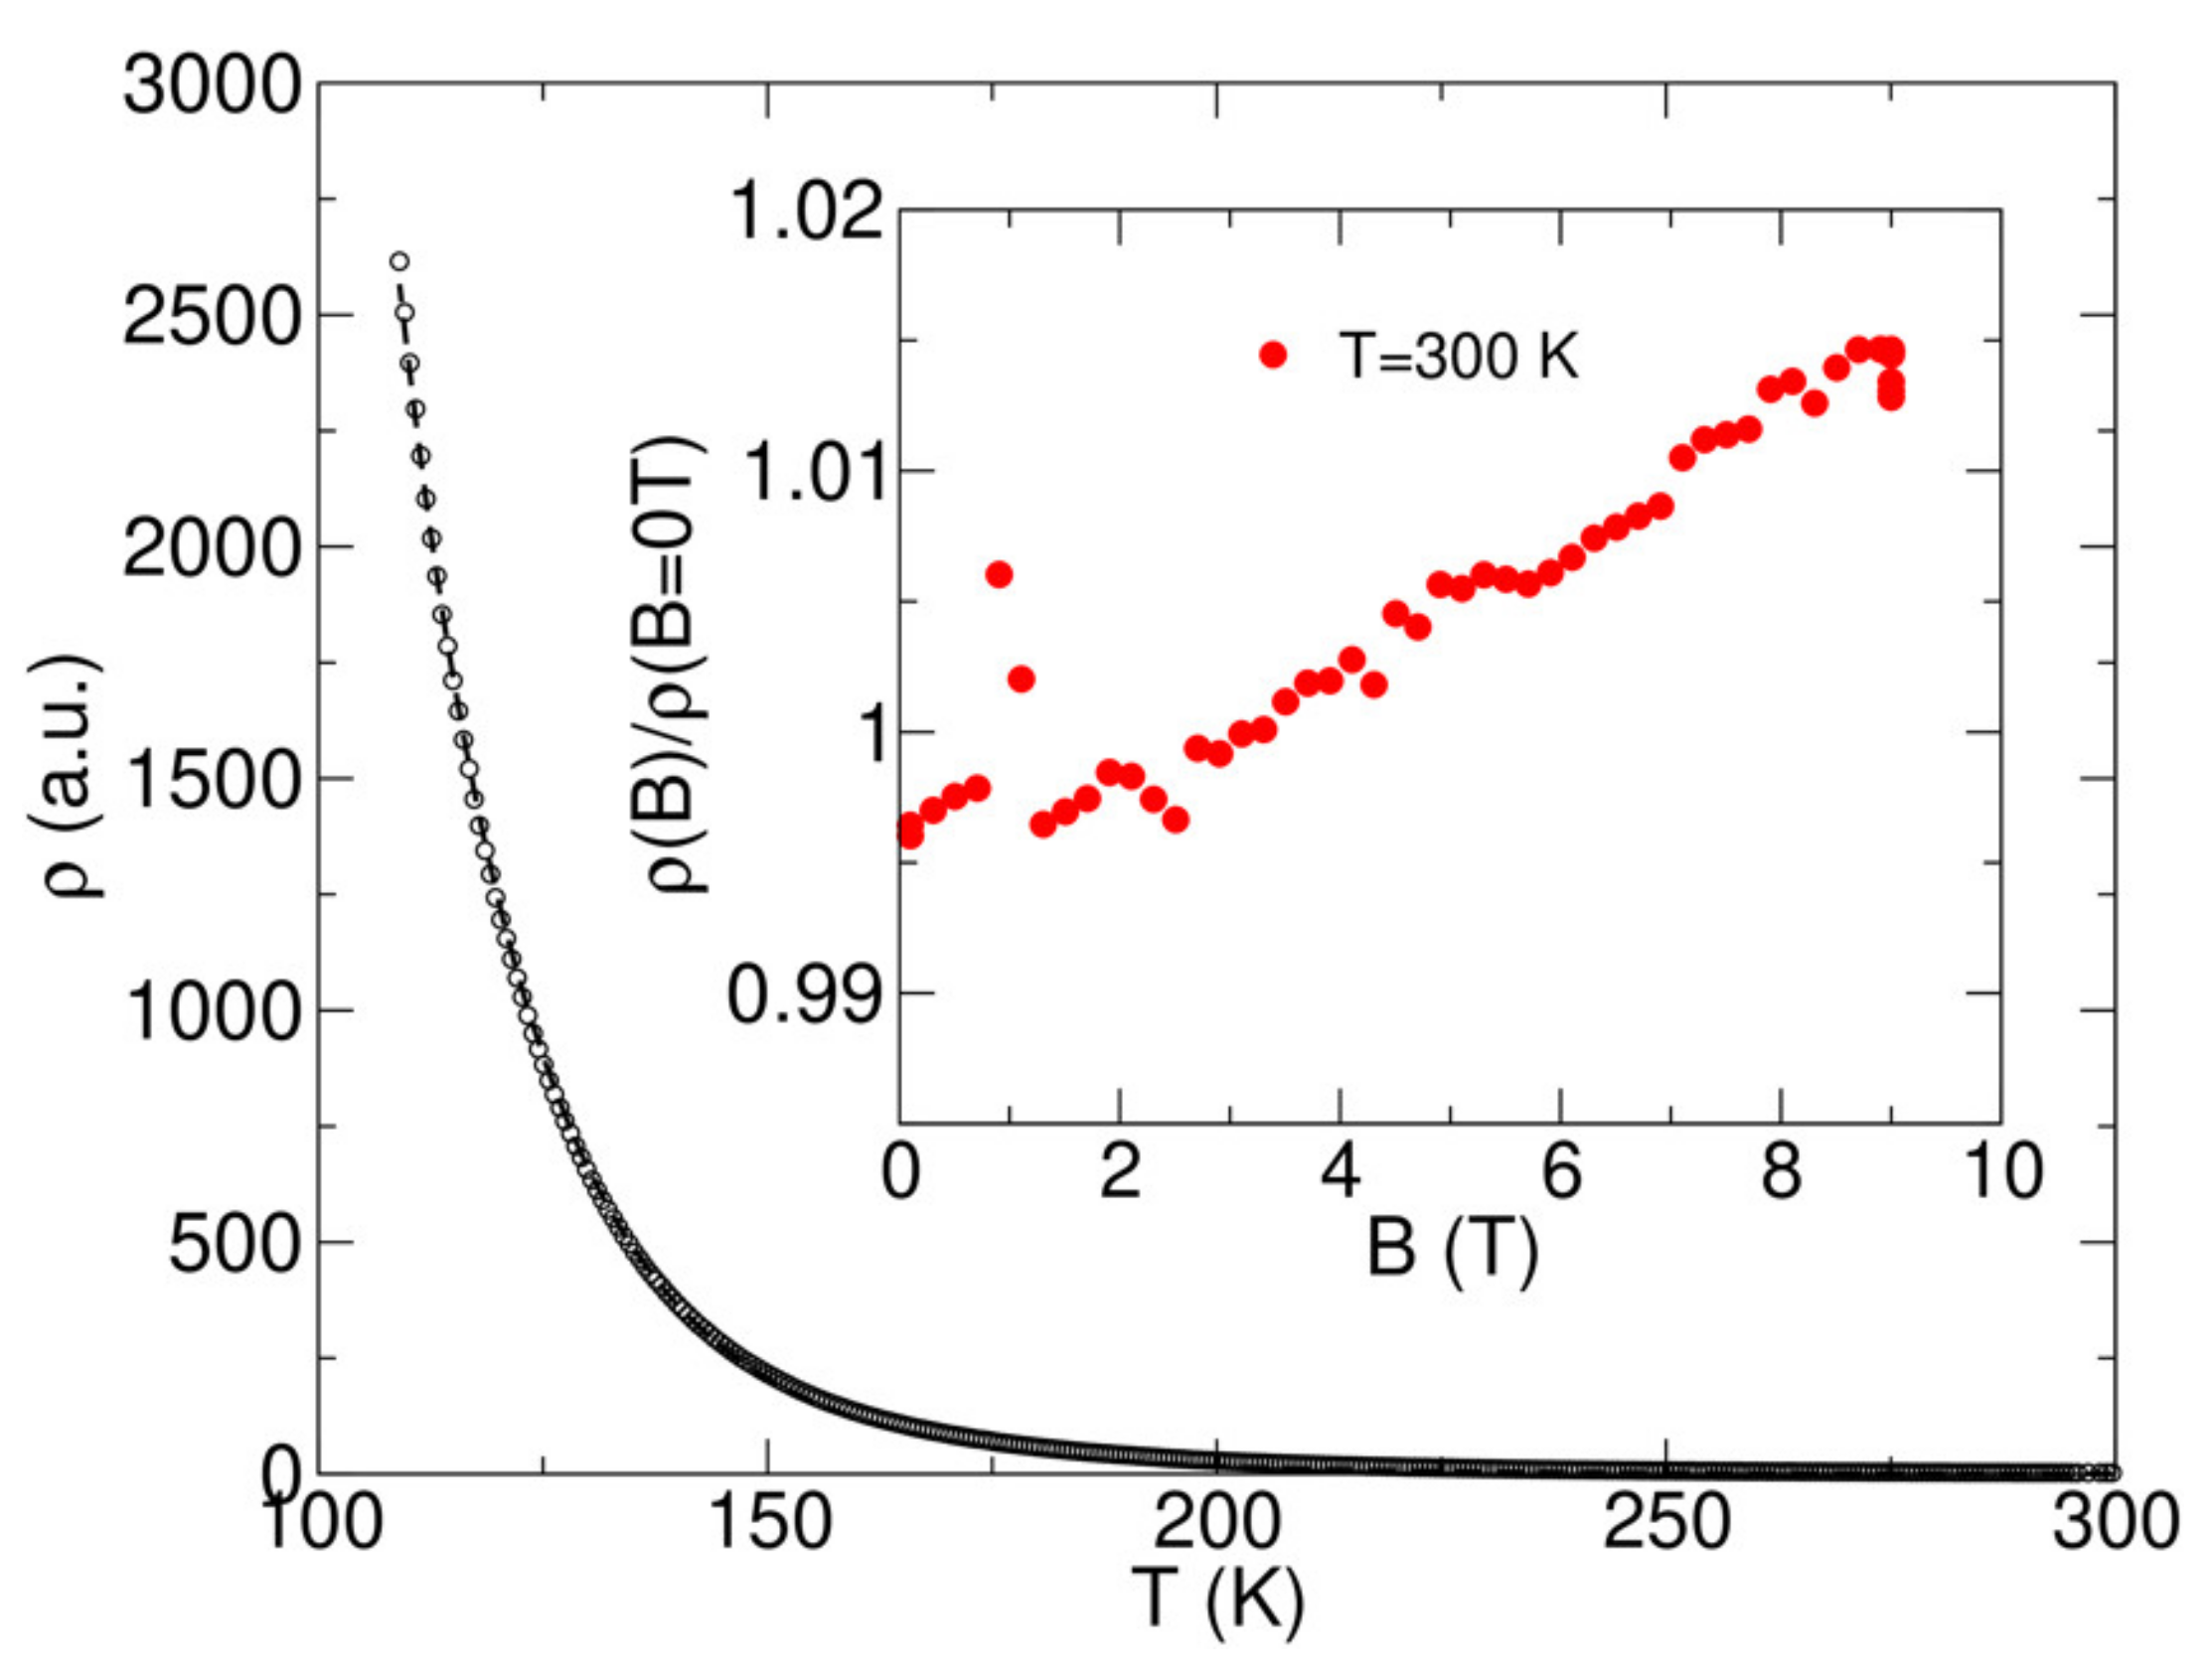
3.3. Electrical and Magnetic Properties
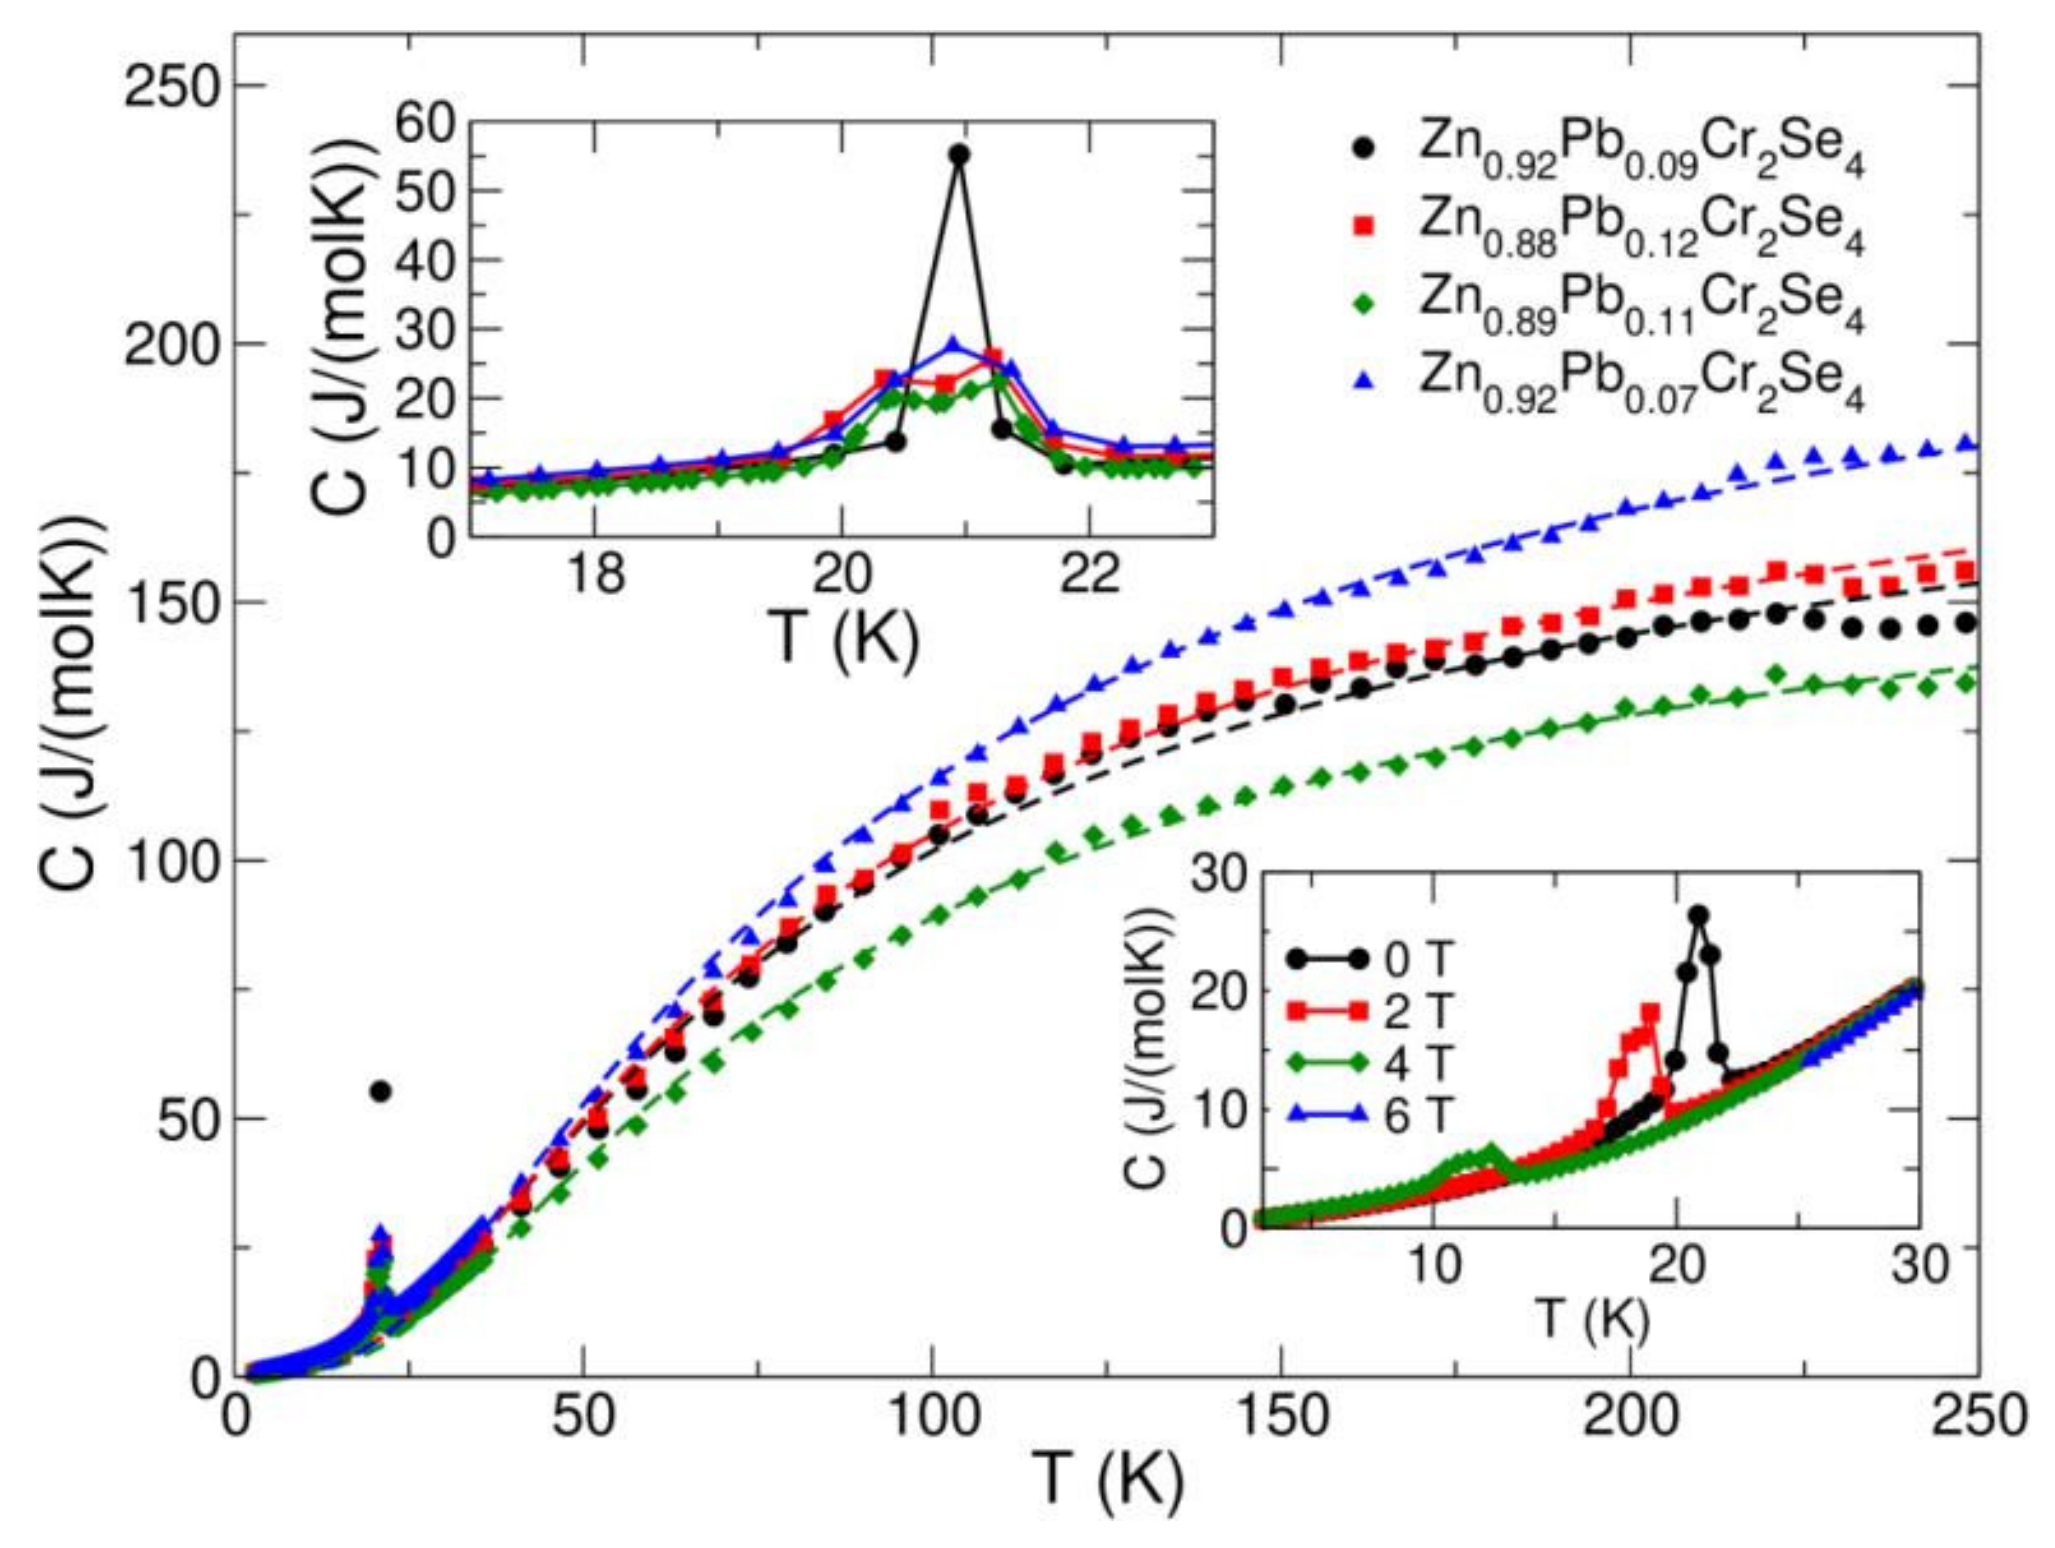
3.4. Specific Heat Studies
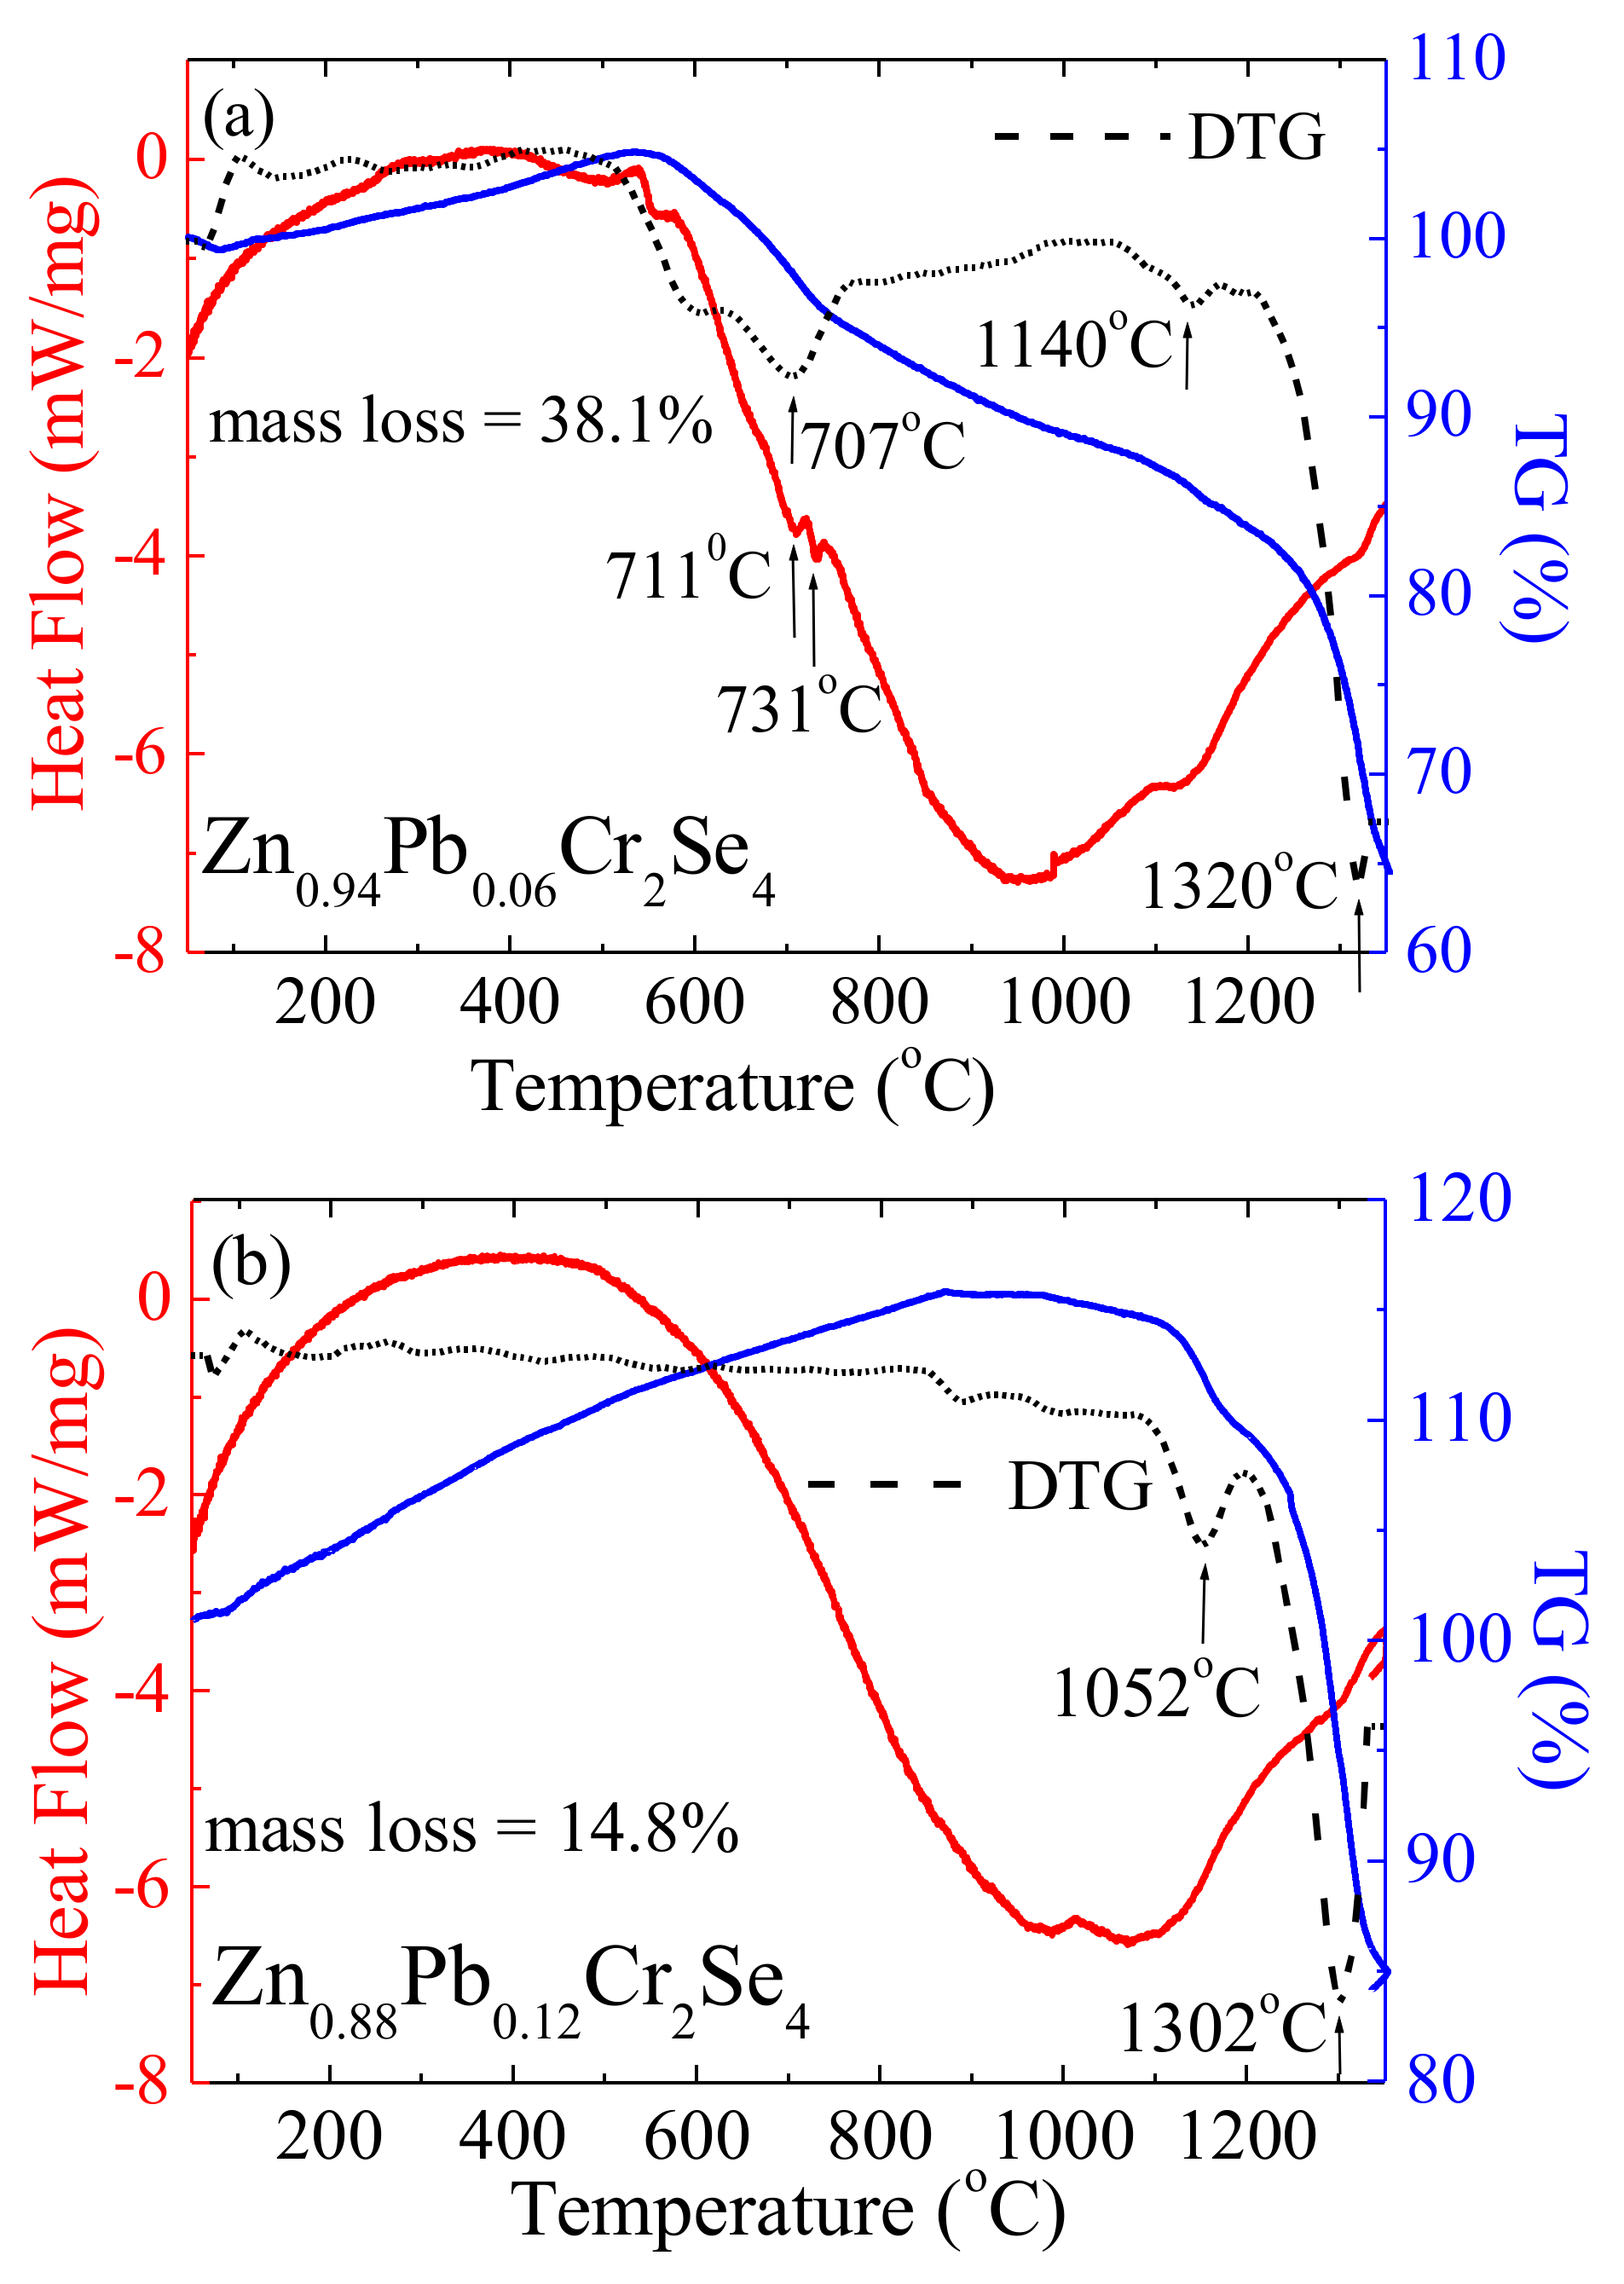
3.5. Thermal Analysis
4. Conclusions
Author Contributions
Funding
Institutional Review Board Statement
Informed Consent Statement
Data Availability Statement
Conflicts of Interest
References
- Hemberger, J.; von Nidda, H.-A.K.; Tsurkan, V.; Loidl, A. Large Magnetostriction and Negative Thermal Expansion in the Frustrated Antiferromagnet ZnCr2Se4. Phys. Rev. Lett. 2007, 98, 147203. [Google Scholar] [CrossRef] [PubMed] [Green Version]
- Kondo, S.; Johnston, D.C.; Swenson, C.A.; Borsa, F.; Mahajan, A.V.; Miller, L.L.; Gu, T.; Goldman, A.I.; Maple, M.B.; Gajewski, D.A.; et al. LiV2O4: A Heavy Fermion Transition Metal Oxide. Phys. Rev. Lett. 1997, 78, 3729–3732. [Google Scholar] [CrossRef] [Green Version]
- Krimmel, A.; Loidl, A.; Klemm, M.; Horn, S.; Schober, H. Dramatic Change of the Magnetic Response in LiV2O4: Possible Heavy Fermion to Itinerant d-Metal Transition. Phys. Rev. Lett. 1999, 82, 2919–2922. [Google Scholar] [CrossRef]
- Lee, S.-H.; Broholm, C.; Ratcliff, W.; Gasparovic, G.; Huang, Q.; Kim, T.H.; Cheong, S.-W. Emergent excitations in a geometrically frustrated magnet. Nature 2002, 418, 856–858. [Google Scholar] [CrossRef] [PubMed]
- Radaelli, P.G.; Horibe, Y.; Gutmann, M.J.; Ishibashi, H.; Chen, C.H.; Ibberson, R.M.; Koyama, Y.; Hor, Y.-S.; Kiryukhin, V.; Cheong, S.-W. Formation of isomorphic Ir3+ and Ir4+ octamers and spin dimerisation in the spinel CuIr2S4. Nature 2002, 416, 155–158. [Google Scholar] [CrossRef] [PubMed]
- Schmidt, M.; Ratcliff, W.; Radaelli, P.G., II; Refson, K.; Harrison, N.M.; Cheong, S.W. Spin Singlet Formation in MgTi2O4: Evidence of a Helical Dimerization Pattern. Phys. Rev. Lett. 2004, 92, 056402. [Google Scholar] [CrossRef] [PubMed] [Green Version]
- Fritsch, V.; Hemberger, J.; Büttgen, N.; Scheidt, E.-W.; Krug von Nidda, H.-A.; Loidl, A.; Tsurkan, V. Spin and Orbital Frustration in MnSc2S4 and FeSc2S4. Phys. Rev. Lett. 2004, 92, 116401. [Google Scholar] [CrossRef] [PubMed] [Green Version]
- Krimmel, A.; Mücksch, M.; Tsurkan, V.; Koza, M.M.; Mutka, H.; Loidl, A. Vibronic and Magnetic Excitations in the Spin-Orbital Liquid State of FeSc2S4. Phys. Rev. Lett. 2005, 94, 237402. [Google Scholar] [CrossRef]
- Fichtl, R.; Tsurkan, V.; Lunkenheimer, P.; Hemberger, J.; Fritsch, V.; Krug von Nidda, H.-A.; Scheidt, E.-W.; Loidl, A. Orbital Freezing and Orbital Glass State in FeCr2S4. Phys. Rev. Lett. 2005, 94, 027601. [Google Scholar] [CrossRef] [Green Version]
- Hemberger, J.; Lunkenheimer, P.; Fichtl, R.; Krug von Nidda, H.-A.; Tsurkan, V.; Loidl, A. Relaxor ferroelectricity and colossal magnetocapacitive coupling in ferromagnetic CdCr2S4. Nature 2005, 434, 364–367. [Google Scholar] [CrossRef] [Green Version]
- Weber, S.; Lunkenheimer, P.; Fichtl, R.; Hemberger, J.; Tsurkan, V.; Loidl, A. Colossal Magnetocapacitance and Colossal Magnetoresistance in HgCr2S4. Phys. Rev. Lett. 2006, 96, 157202. [Google Scholar] [CrossRef] [PubMed] [Green Version]
- Yamasaki, Y.; Miyasaka, S.; Kaneko, Y.; He, J.-P.; Arima, T.; Tokura, Y. Magnetic Reversal of the Ferroelectric Polarisation in a Multiferroic Spinel Oxide. Phys. Rev. Lett. 2006, 96, 207204. [Google Scholar] [CrossRef] [PubMed]
- Lee, S.-H.; Broholm, C.; Kim, T.H.; Ratcliff, W.; Cheong, S.-W., II. Local Spin Resonance and Spin-Peierls-like Phase Transition in a Geometrically Frustrated Antiferromagnet. Phys. Rev. Lett. 2000, 84, 3718. [Google Scholar] [CrossRef] [Green Version]
- Tchernyshyov, O.; Moessner, R.; Sondhi, S.L. Order by Distortion and String Modes in Pyrochlore Antiferromagnets. Phys. Rev. Lett. 2002, 88, 067203. [Google Scholar] [CrossRef] [PubMed] [Green Version]
- Yamashita, Y.; Ueda, K. Spin-Driven Jahn-Teller Distortion in a Pyrochlore System. Phys. Rev. Lett. 2000, 85, 4960. [Google Scholar] [CrossRef] [PubMed] [Green Version]
- Hemberger, J.; Rudolf, T.; Krug von Nidda, H.-A.; Mayr, F.; Pimenov, A.; Tsurkan, V.; Loidl, A. Spin-Driven Phonon Splitting in Bond-Frustrated ZnCr2S4. Phys. Rev. Lett. 2006, 97, 087204. [Google Scholar] [CrossRef] [Green Version]
- Groń, T.; Duda, H.; Warczewski, J. Influence of the valence of the substituted cations on the electrical properties of the magnetically modulated spinels Zn1-xAxCr2Se4 (A = Cu, Ga2/3). Phys. Rev. 1990, 41, 12424–12431. [Google Scholar] [CrossRef]
- Groń, T. Influence of vacancies and mixed valence on the transport processes in solid solutions with the spinel structure. Philos. Mag. B 1994, 70, 121–132. [Google Scholar] [CrossRef]
- Groń, T.; Wolff, J.; Hehenkamp, T.; Bärner, K.; Okońska-Kozłowska, I.; Jendrzejewska, I.; Malicka, E. Positron annihilation studies in single and polycrystals of Zn1-xCuxCr2Se4 spinel series. Radiat. Eff. Defects Solids 1996, 139, 97–107. [Google Scholar] [CrossRef]
- Parker, D.R.; Green, M.A.; Bramwell, S.T.; Wills, A.S.; Gardner, J.S.; Neumann, D.A. Crossover from Positive to Negative Magnetoresistance in a Spinel. J. Am. Chem. Soc. 2004, 126, 2710–2711. [Google Scholar] [CrossRef]
- Lotgering, F.K. Ferromagnetic interactions in sulphides, selenides and tellurides with spinel structure. In Proceedings of the International Conference on Magnetism, Nottingham, UK, 7–11 September 1964; Institute of Physics and the Physical Society London: London, UK, 1965; p. 533. [Google Scholar]
- Plumier, R. Étude par diffraction de neutrons de l’antiferromagnétisme hélicoïdal du spinelle ZnCr2Se4 en présence d’un champ magnétique. J. Phys. 1966, 27, 213–219. [Google Scholar] [CrossRef]
- Park, S.; Kwon, S.; Lee, S.; Khim, S.; Bhoi, D.; Park, C.B.; Kim, K.H. Interactions in the bond-frustrated helimagnet ZnCr2Se4 investigated by NMR. Sci. Rep. 2019, 9, 16627. [Google Scholar] [CrossRef] [PubMed]
- Kleinberger, R.; de Kouchkovsky, C.R. Étude radiocrystallographique à basse temperature du spinelle ZnCr2Se4. Acad. Sci. Paris Ser. B 1966, 262, 628–630. [Google Scholar]
- Yokaichiya, F.; Krimmel, A.; Tsurkan, V.; Margiolaki, I.; Thompson, P.; Bordallo, H.N.; Buchsteiner, A.; Stußer, N.; Argyriou, D.N.; Loidl, A. Spin-driven phase transitions in ZnCr2Se4 and ZnCr2S4 probed by high-resolution synchrotron X-ray and neutron powder diffraction. Phys. Rev. B 2009, 79, 064423. [Google Scholar] [CrossRef] [Green Version]
- Malicka, E.; Groń, T.; Pacyna, A.W.; Maciążek, E.; Duda, H.; Pawełczyk, M.; Zawisza, B.; Sitko, R. Influence of temperature on the critical fields in ZnCr2-xAlxSe4 antiferromagnets. J. Alloys Compd. 2009, 480, 67–69. [Google Scholar] [CrossRef]
- Groń, T.; Malicka, E.; Duda, H.; Pacyna, A.W.; Mydlarz, T.; Sitko, R.; Pawełczyk, M. Spin-glass-like behavior in ZnxCryAlzSe4. J. Phys. Chem. Sol. 2009, 70, 1175–1180. [Google Scholar] [CrossRef]
- Malicka, E.; Groń, T.; Ślebarski, A.; Pacyna, A.W.; Goraus, J.; Fijałkowski, M.; Heimann, J. Specific heat and magnetic susceptibility of single-crystalline ZnCr2-xAlxSe4 (x = 0.15, 0.23). J. Phys. Chem. Sol. 2011, 72, 974–979. [Google Scholar] [CrossRef] [Green Version]
- Groń, T.; Jendrzejewska, I.; Gołąbek, S.; Duda, H.; Krajewski, A.; Bärner, K. The thermoelectric power of ferromagnetically ordered ZnxCuyCrzSe4 single crystals. Phys. B 2003, 327, 88–95. [Google Scholar] [CrossRef]
- Mazur, S.; Groń, T.; Jendrzejewska, I. Influence of spin arrangement on thermopower in ZnxCuyCrzSe4 spinels. J. Alloys Compd. 2009, 480, 19–22. [Google Scholar] [CrossRef]
- Okońska-Kozłowska, I.; Lutz, H.D.; Groń, T.; Krok, J.; Mydlarz, T. Darstellung, elektrische und magnetische Eingenschaften von-Zn1-xGa0.667xCr2Se4-Spinell-Einkristallen. Mater. Res. Bull. 1984, 19, 1–5. [Google Scholar] [CrossRef]
- Groń, T.; Duda, H.; Warczewski, J. Transport phenomena in the antiferromagnetic spinels Zn1-xGa2x/3Cr2Se4 (where 0.0 < x < 0.5). J. Mag. Mag. Mater. 1990, 83, 487–489. [Google Scholar]
- Malicka, E.; Groń, T.; Ślebarski, A.; Gągor, A.; Pacyna, A.W.; Sitko, R.; Goraus, J.; Mydlarz, T.; Heimann, J. Specific heat and magnetic susceptibility of single-crystalline ZnCr2Se4 spinels doped with Ga, In and Ce. Mater. Chem. Phys. 2011, 131, 142–150. [Google Scholar] [CrossRef]
- Groń, T.; Kopyczok, J.; Okońska-Kozłowska, I.; Warczewski, J. Seebeck effect in the antiferromagnetic single crystals of ZnCr2-xInxSe4 (0.0 < x < 0.15). J. Mag. Mag. Mater. 1992, 111, 53–55. [Google Scholar]
- Jendrzejewska, I.; Groń, T.; Kusz, J.; Żelechower, M.; Maciążek, E.; Ślebarski, A.; Fijałkowski, M. Spin-glass-like behaviour in tin doped ZnCr2Se4 single crystals. J. Alloys Compd. 2015, 635, 238–244. [Google Scholar] [CrossRef]
- Jendrzejewska, I.; Mroziński, J.; Groń, T.; Duda, H.; Zajdel, P.; Pacyna, A.W.; Maciążek, E.; Hanc, A. Effect of cation substitution on Fermi level of n-type ZnxSnyCrzSe4 spinels. J. Alloys Compd. 2009, 480, 63–66. [Google Scholar] [CrossRef]
- Jendrzejewska, I.; Groń, T.; Kwapuliński, P.; Kusz, J.; Pietrasik, E.; Goryczka, T.; Sawicki, B.; Ślebarski, A.; Fijałkowski, M.; Jampilek, J.; et al. Study of the structure, magnetic, thermal and electrical characterisation of ZnCr2Se4:Ta single crystals obtained by chemical vapour transport. Materials 2021, 14, 2749. [Google Scholar] [CrossRef]
- Jendrzejewska, I.; Groń, T.; Knizek, K.; Pilch, M.; Ślebarski, A.; Goraus, J.; Zajdel, P.; Stokłosa, Z.; Pietrasik, E.; Goryczka, T.; et al. Preparation, structure and magnetic, electronic and thermal properties of Dy3+-doped ZnCr2Se4 with unique geometric type spin-glass. J. Sol. State Chem. 2021, 298, 122114. [Google Scholar] [CrossRef]
- Jendrzejewska, I.; Groń, T.; Maciążek, E.; Duda, H.; Kubisztal, M.; Ślebarski, A.; Pietrasik, E.; Fijałkowski, M. Specific heat and magnetic properties of single-crystalline ZnxDyyCrzSe4 spinels. J. Mag. Mag. Mater. 2016, 407, 122–128. [Google Scholar] [CrossRef]
- Maciążek, E.; Karolus, M.; Kubisztal, M.; Jendrzejewska, I.; Sitko, R.; Groń, T.; Ślebarski, A.; Fijałkowski, M. Magnetic and specific heat properties of a new Gd-doped ZnCr2Se4. Mater. Chem. Phys. 2015, 168, 187–192. [Google Scholar] [CrossRef]
- Jendrzejewska, I.; Groń, T.; Kusz, J.; Goraus, J.; Barsova, Z.; Pietrasik, E.; Czerniewski, J.; Goryczka, T.; Kubisztal, M. Growth, structure and physico-chemical properties of monocrystalline ZnCr2Se4:Ho prepared by chemical vapour transport. J. Sol. State Chem. 2020, 281, 121024. [Google Scholar] [CrossRef]
- Jendrzejewska, I.; Groń, T.; Goraus, J.; Pilch, M.; Pietrasik, E.; Barsova, Z.; Czerniewski, J.; Goryczka, T.; Witkowska-Kita, B.; Bienko, A.; et al. Synthesis and structural, magnetic, thermal and electronic properties of Mn-doped ZnCr2Se4. Mater. Chem. Phys. 2019, 238, 121901. [Google Scholar] [CrossRef]
- Jendrzejewska, I.; Zajdel, P.; Heimann, J.; Krok-Kowalski, J.; Mydlarz, T.; Mrzigod, J. Influence of manganese on magnetic and electronic properties of ZnCr2Se4 single Crystals. Mater. Res. Bull. 2012, 47, 1881–1886. [Google Scholar] [CrossRef]
- Jendrzejewska, I.; Groń, T.; Kusz, J.; Barsova, Z.; Pietrasik, E.; Goryczka, T.; Sawicki, B.; Ślebarski, A.; Fijałkowski, M.; Jampilek, J.; et al. Synthesis, crystal structure and characterization of monocrystalline ZnCr2Se4 doped with neodymium. J. Sol. State Chem. 2020, 292, 121661. [Google Scholar] [CrossRef]
- Jendrzejewska, I.; Waśkowska, A.; Mydlarz, T. Influence of nickel substitution on the cation distribution and magnetic properties of ZnCr2Se4. J. Alloys Compd. 2001, 327, 73–77. [Google Scholar] [CrossRef]
- Lenz, M.; Gruehn, R. Developments in Measuring and Calculating Chemical Vapor Transport Phenomena Demonstrated on Cr, Mo, W and Their Compounds. Chem. Rev. 1997, 97, 2967–2994. [Google Scholar] [CrossRef]
- Plies, V. Massenspektrometrische Untersuchungen der Gasphase über CrCl3 und CrCl3/Cl2. Z. Anorg. Allg. Chem. 1988, 556, 120–128. [Google Scholar] [CrossRef]
- Sheldrick, G.M. Crystal structure refinement with SHELXL. Acta Cryst. 2015, C71, 3–8. [Google Scholar]
- Morrish, A.H. Physical Principles of Magnetism; John Wiley & Sons, Inc.: New York, NY, USA, 1965. [Google Scholar]
- Holland, W.E.; Brown, H.A. Application of the Weiss molecular field theory to the B-site spinel. Phys. Status Solidi 1972, 10, 249–253. [Google Scholar] [CrossRef]
- Shannon, R.D. Revised Effective Ionic Radii and Systematic Studies of Interatomic Distances in Halides and Chalcogenides. Acta Cryst. 1976, A32, 751–767. [Google Scholar] [CrossRef]


| No | Amounts of Substrates (mmol) | Td (K) | Tc (K) | ΔT (K) | % Weight | Chemical Formula | ||||
|---|---|---|---|---|---|---|---|---|---|---|
| nZnSe | nPbSe | Zn | Pb | Cr | Se | |||||
| (1) | 14.4 | 1.6 | 1223 | 1163 | 60 | 12.31 ± 0.09 | 3.23 ± 0.06 | 20.66 ± 0.01 | 63.71 ± 0.04 | Zn0.94Pb0.06Cr2Se4 |
| (2) | 14.4 | 1.6 | 1133 | 1083 | 50 | 12.25 ± 0.08 | 2.95 ± 0.07 | 20.45 ± 0.02 | 64.54 ± 0.05 | Zn0.92Pb0.07Cr2Se4 |
| (3) | 12.8 | 3.2 | 1203 | 1153 | 50 | 12.05 ± 0.06 | 3.43 ± 0.06 | 20.49 ± 0.05 | 64.10 ± 0.03 | Zn0.92Pb0.09Cr2Se4 |
| (4) | 12.8 | 3.2 | 1203 | 1143 | 60 | 11.63 ± 0.02 | 4.51 ± 0.04 | 20.30 ± 0.06 | 63.56 ± 0.03 | Zn0.89Pb0.11Cr2Se4 |
| (5) | 11.2 | 4.8 | 1203 | 1153 | 50 | 11.42 ± 0.03 | 4.98 ± 0.05 | 20.15 ± 0.03 | 63.42 ± 0.03 | Zn0.88Pb0.12Cr2Se4 |
| Chemical Formula | Lattice Parameter (Å) | Volume (Å3) | Density Calc. (Mg/m3) | Absorption Coeff. (mm−1) | Goodness of Fit on F2 | R Parameters | |
|---|---|---|---|---|---|---|---|
| R1 | wR2 | ||||||
| Zn0.94Pb0.06Cr2Se4 | 10.4910(3) | 1154.65(2) | 5.682 | 32.837 | 1.150 | 0.0223 | 0.0662 |
| Zn0.92Pb0.07Cr2Se4 | 10.4933(2) | 1155.41(3) | 5.689 | 32.883 | 1.205 | 0.0333 | 0.1114 |
| Zn0.92Pb0.09Cr2Se4 | 10.4946(4) | 1155.84(1) | 5.709 | 32.856 | 1.175 | 0.0261 | 0.0839 |
| Zn0.89Pb0.11Cr2Se4 | 10.4954(2) | 1156.10(2) | 5.757 | 33.841 | 1.196 | 0.0333 | 0.1114 |
| Zn0.88Pb0.12Cr2Se4 | 10.4959(1) | 1156.27(3) | 5.772 | 33.852 | 1.191 | 0.0311 | 0.1012 |
| Spinel | Anion Parameter u | Site Occupation | Uiso (Å × 103) | |||
|---|---|---|---|---|---|---|
| (A) | (B) | Zn/Pb | Cr | Se | ||
| (Zn0.94Pb0.06)[Cr2]Se4 | 0.2595(1) | 0.94(1):0.06(1) | 1.0 | 13(1) | 7(1) | 7(1) |
| (Zn0.92Pb0.07)[Cr2]Se4 | 0.2595(1) | 0.92(2):0.07(1) | 1.0 | 14(1) | 6(1) | 6(1) |
| (Zn0.92Pb0.09)[Cr2]Se4 | 0.2595(1) | 0.92(1):0.09(1) | 1.0 | 13(1) | 7(1) | 6(1) |
| (Zn0.89Pb0.11)[Cr2]Se4 | 0.2595(1) | 0.89(2):0.11(2) | 1.0 | 14(1) | 5(1) | 5(1) |
| (Zn0.88Pb0.12)[Cr2]Se4 | 0.2595(1) | 0.87(1):0.13(2) | 1.0 | 14(1) | 5(1) | 6(1) |
| Spinel | Bond Distances | Bond Angles | ||
|---|---|---|---|---|
| Zn/Pb–Se | Cr–Se | Se–Zn/Pb–Se | Se–Cr–Se | |
| (Zn0.94Pb0.06)[Cr2]Se4 | 2.4451(5) | 2.5282(3) | 109.5(0) × 6 | 180.0(0) × 3 94.61(13) × 6 85.39(13) × 6 |
| (Zn0.92Pb0.07)[Cr2]Se4 | 2.4442(7) | 2.5269(4) | 109.5(0) × 6 | 180.0(0) × 3 94.61(2) × 6 85.39(2) × 6 |
| (Zn0.92Pb0.09)[Cr2]Se4 | 2.4453(5) | 2.5274(3) | 109.5(0) × 6 | 180.0(0) × 3 94.62(14) × 6 85.38(14) × 6 |
| (Zn0.89Pb0.11)[Cr2]Se4 | 2.4453(8) | 2.5279(4) | 109.5(0) × 6 | 180.0(0) × 3 94.62(2) × 6 82.38(2) × 6 |
| (Zn0.88Pb0.12)[Cr2]Se4 | 2.4453(7) | 2.5280(4) | 109.5(0) × 6 | 180.0(0) × 3 94.61(2) × 6 85.39(2) × 6 |
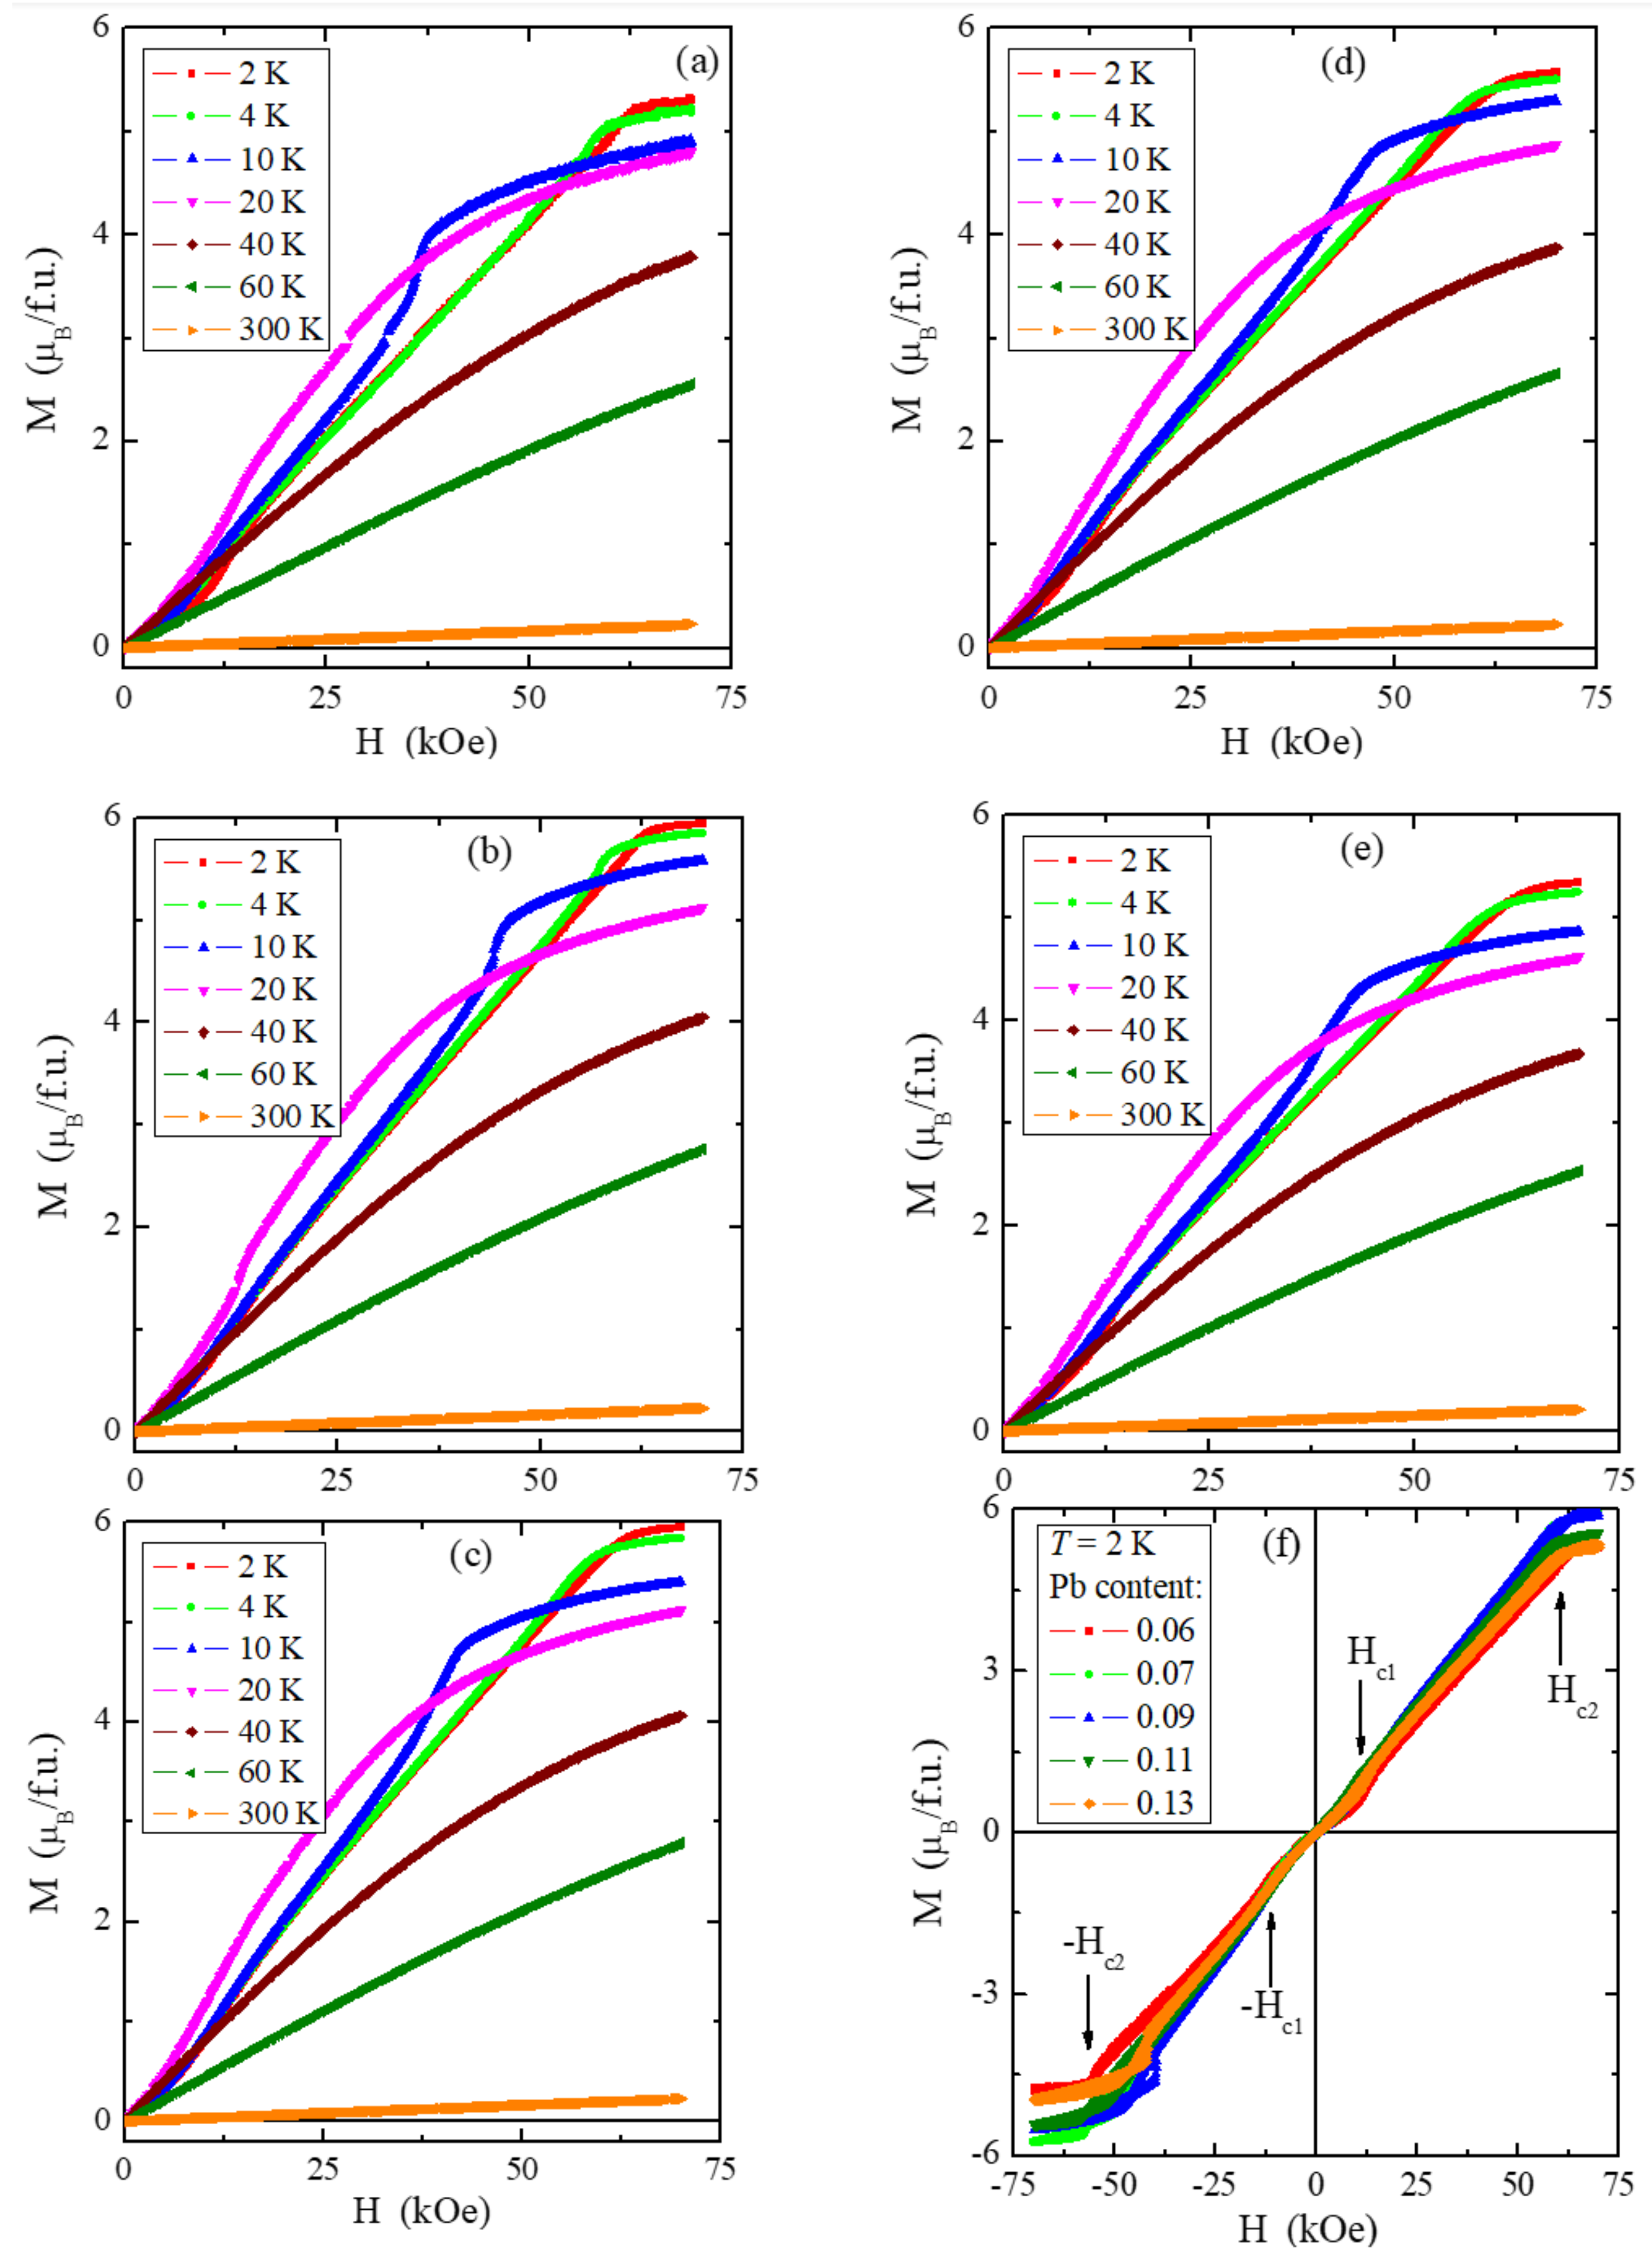
| Spinel | C | TN | θ | µeff | Ms(2K) | J1 | J2 | Hc1 | Hc2 | Ea |
|---|---|---|---|---|---|---|---|---|---|---|
| (emu·K/mol) | (K) | (K) | (µB/f.u.) | (µB/f.u.) | (K) | (K) | (kOe) | (kOe) | (eV) | |
| ZnCr2Se4 | 4.082 | 21 | 90 | 5.714 | 6.0 | −1.65 | 1.28 | 10.0 | 65.0 | 0.135 |
| Zn0.94Pb0.06Cr2Se4 | 5.477 | 22 | 74 | 6.618 | 5.325 | −2.07 | 1.17 | 12.0 | 55.0 | 0.138 |
| Zn0.92Pb0.07Cr2Se4 | 5.568 | 22 | 77 | 6.673 | 5.964 | −1.95 | 1.23 | 12.0 | 56.0 | 0.161 |
| Zn0.92Pb0.09Cr2Se4 | 4.727 | 22 | 81 | 6.149 | 5.960 | −2.02 | 1.19 | 12.0 | 61.0 | 0.146 |
| Zn0.89Pb0.11Cr2Se4 | 5.768 | 22 | 83 | 6.792 | 5.486 | −1.92 | 1.24 | 12.0 | 55.0 | 0.177 |
| Zn0.88Pb0.12Cr2Se4 | 5.898 | 22 | 84 | 6.868 | 5.251 | −1.90 | 1.25 | 12.0 | 57.0 | 0.315 |
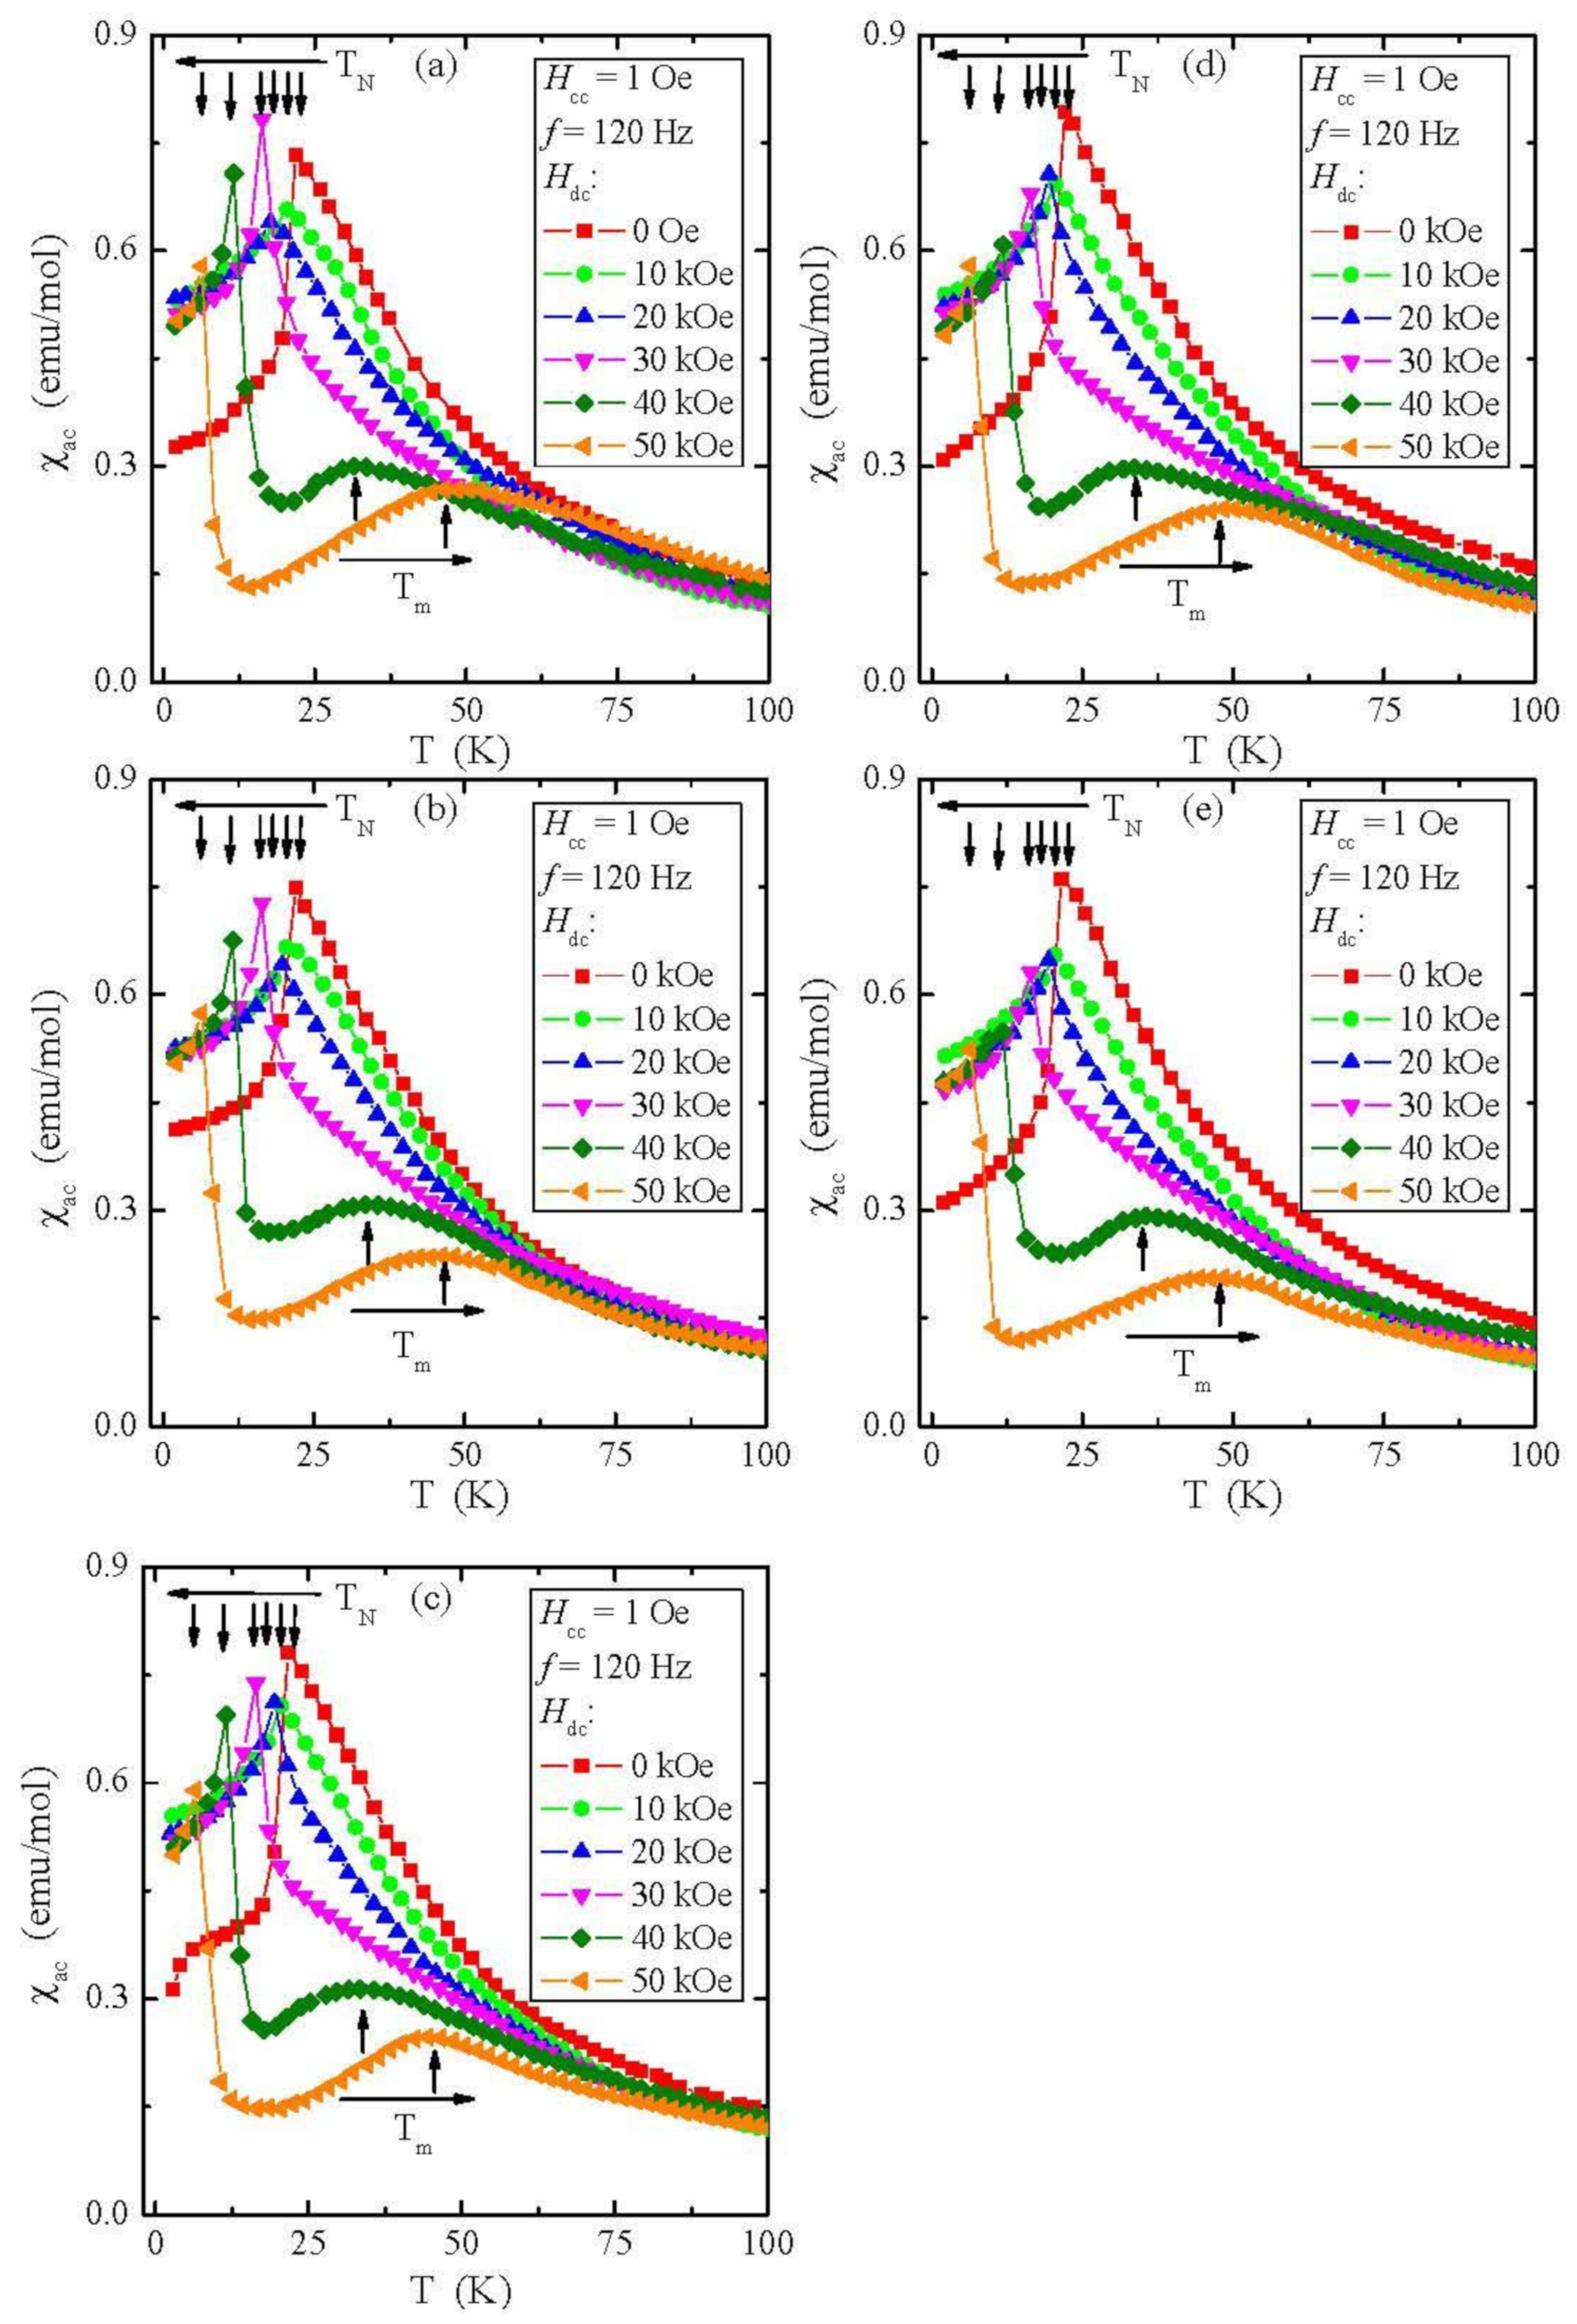
| Spinel | Hdc | C | TN | θ | Tm | µeff | J1 | J2 |
|---|---|---|---|---|---|---|---|---|
| (kOe) | (emu·K/mol) | (K) | (K) | (K) | (µB/f.u.) | (K) | (K) | |
| Zn0.94Pb0.06Cr2Se4 | 0 | 5.477 | 22 | 74 | - | 6.618 | −2.07 | 1.17 |
| 10 | 4.211 | 22 | 76 | - | 5.803 | −1.73 | 1.13 | |
| 20 | 4.086 | 18 | 79 | - | 5.716 | −1.38 | 1.11 | |
| 30 | 3.986 | 16 | 82 | - | 5.646 | −1.03 | 1.08 | |
| 40 | 3.948 | 12 | 95 | 31.5 | 5.619 | 0.22 | 1.09 | |
| 50 | 3.863 | 6 | 108 | 46 | 5.558 | 0.90 | 1.05 | |
| Zn0.92Pb0.07Cr2Se4 | 0 | 5.568 | 22 | 77 | - | 6.673 | −1.95 | 1.23 |
| 10 | 4.182 | 20 | 78 | - | 5.783 | −1.6 | 1.18 | |
| 20 | 4.102 | 19 | 81 | - | 5.728 | −1.45 | 1.18 | |
| 30 | 4.003 | 16 | 84 | - | 5.658 | −0.9 | 1.11 | |
| 40 | 3.988 | 12 | 96 | 33 | 5.648 | −0.18 | 1.11 | |
| 50 | 3.976 | 7 | 99 | 44 | 5.639 | 0.60 | 1.00 | |
| Zn0.92Pb0.09Cr2Se4 | 0 | 4.727 | 22 | 81 | - | 6.149 | −2.02 | 1.19 |
| 10 | 3.922 | 21 | 82 | - | 5.601 | −1.85 | 1.18 | |
| 20 | 3.711 | 20 | 84 | - | 5.448 | −1.65 | 1.17 | |
| 30 | 3.681 | 16 | 85 | - | 5.426 | −1.00 | 1.10 | |
| 40 | 3.602 | 12 | 97 | 33.5 | 5.367 | −0.20 | 1.10 | |
| 50 | 3.639 | 6 | 108 | 46 | 5.369 | 0.90 | 1.05 | |
| Zn0.89Pb0.11Cr2Se4 | 0 | 5.768 | 22 | 83 | - | 6.792 | −1.92 | 1.24 |
| 10 | 4.293 | 20 | 84 | - | 5.859 | −1.60 | 1.20 | |
| 20 | 4.182 | 19 | 85 | - | 5.783 | −1.4 | 1.18 | |
| 30 | 4.101 | 16 | 86 | - | 5.727 | −0.97 | 1.12 | |
| 40 | 4.056 | 12 | 91 | 34 | 5.695 | −0.28 | 1.06 | |
| 50 | 4.002 | 6 | 97 | 48 | 5.657 | 0.72 | 0.96 | |
| Zn0.88Pb0.12Cr2Se4 | 0 | 5.898 | 22 | 84 | - | 6.868 | −1.90 | 1.25 |
| 10 | 3.794 | 20 | 86 | - | 5.508 | −1.57 | 1.22 | |
| 20 | 3.781 | 19 | 88 | - | 5.499 | −1.38 | 1.21 | |
| 30 | 3.762 | 16 | 90 | - | 5.485 | −0.90 | 1.15 | |
| 40 | 3.703 | 12 | 94 | 36 | 5.442 | −0.23 | 1.08 | |
| 50 | 3.689 | 6 | 98 | 48 | 5.432 | 0.73 | 0.97 |
Publisher’s Note: MDPI stays neutral with regard to jurisdictional claims in published maps and institutional affiliations. |
© 2022 by the authors. Licensee MDPI, Basel, Switzerland. This article is an open access article distributed under the terms and conditions of the Creative Commons Attribution (CC BY) license (https://creativecommons.org/licenses/by/4.0/).
Share and Cite
Jendrzejewska, I.; Groń, T.; Kusz, J.; Stokłosa, Z.; Pietrasik, E.; Goryczka, T.; Sawicki, B.; Goraus, J.; Jampilek, J.; Duda, H.; et al. The Zn1−xPbxCr2Se4—Single Crystals Obtained by Chemical Vapour Transport—Structure and Magnetic, Electrical, and Thermal Properties. Materials 2022, 15, 5289. https://doi.org/10.3390/ma15155289
Jendrzejewska I, Groń T, Kusz J, Stokłosa Z, Pietrasik E, Goryczka T, Sawicki B, Goraus J, Jampilek J, Duda H, et al. The Zn1−xPbxCr2Se4—Single Crystals Obtained by Chemical Vapour Transport—Structure and Magnetic, Electrical, and Thermal Properties. Materials. 2022; 15(15):5289. https://doi.org/10.3390/ma15155289
Chicago/Turabian StyleJendrzejewska, Izabela, Tadeusz Groń, Joachim Kusz, Zbigniew Stokłosa, Ewa Pietrasik, Tomasz Goryczka, Bogdan Sawicki, Jerzy Goraus, Josef Jampilek, Henryk Duda, and et al. 2022. "The Zn1−xPbxCr2Se4—Single Crystals Obtained by Chemical Vapour Transport—Structure and Magnetic, Electrical, and Thermal Properties" Materials 15, no. 15: 5289. https://doi.org/10.3390/ma15155289