
Study on Axial Tensile Strain Rate Effect on Concrete Based on Experimental Investigation and Numerical Simulation


Abstract
:1. Introduction
2. Axial Tension Test
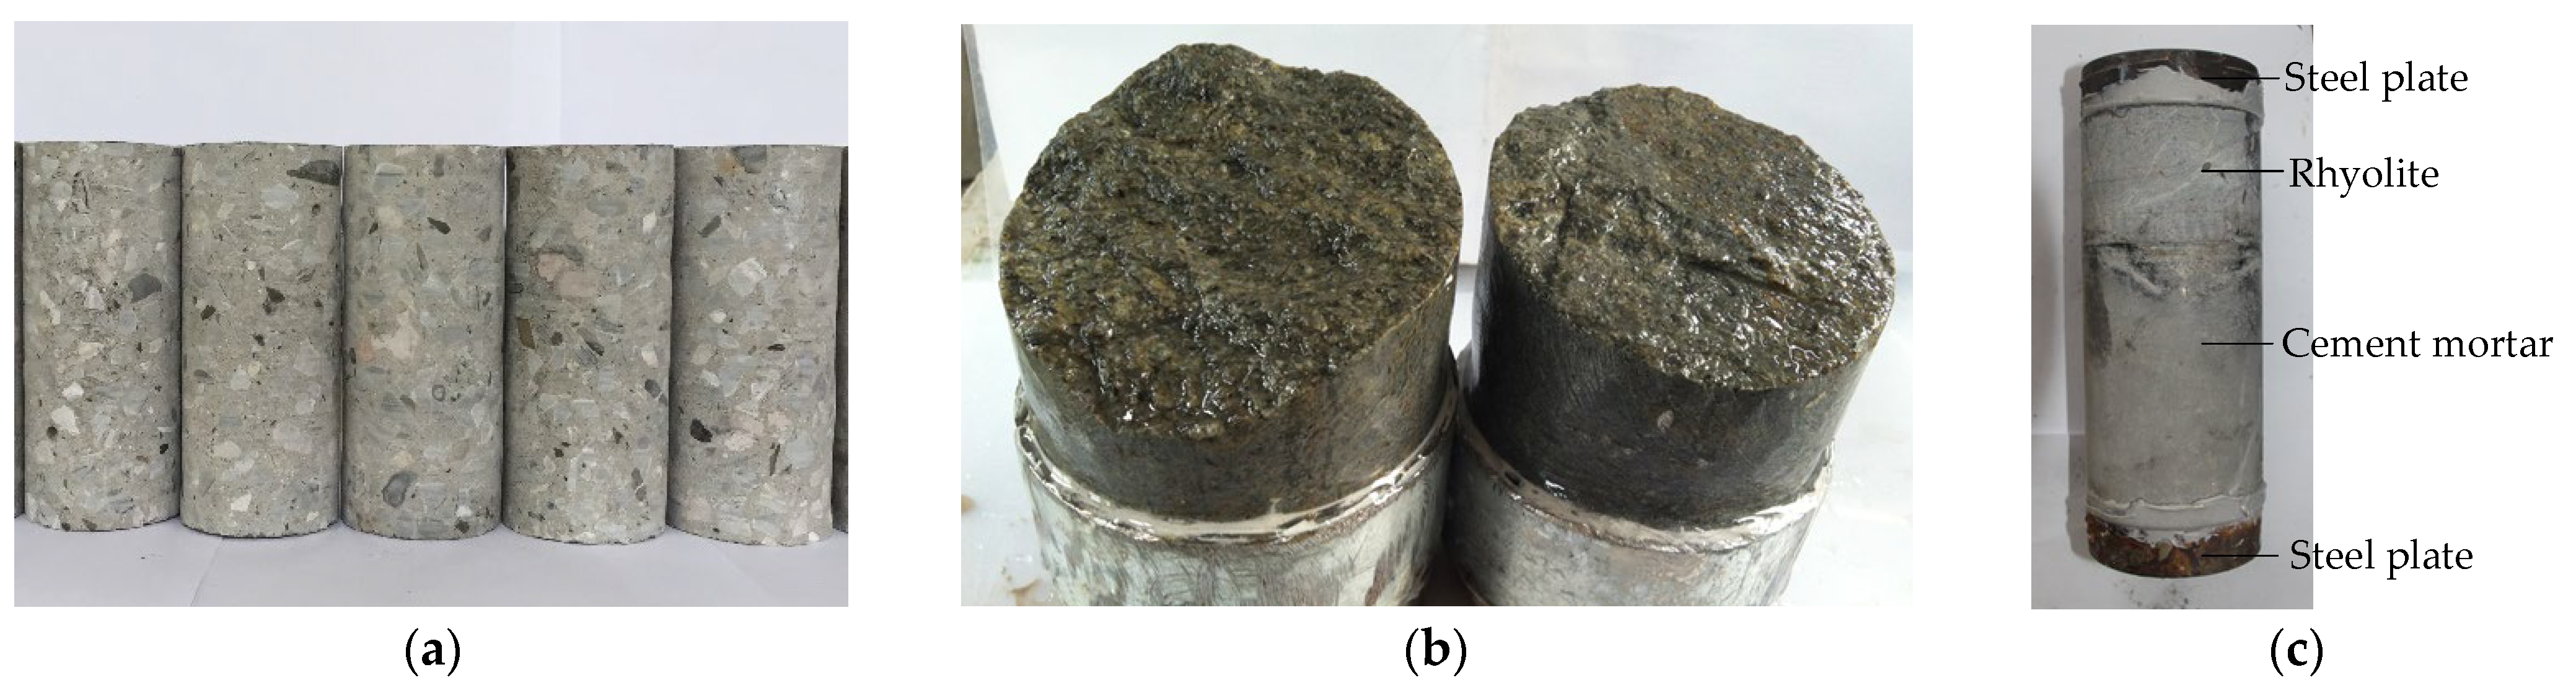
2.1. Specimens
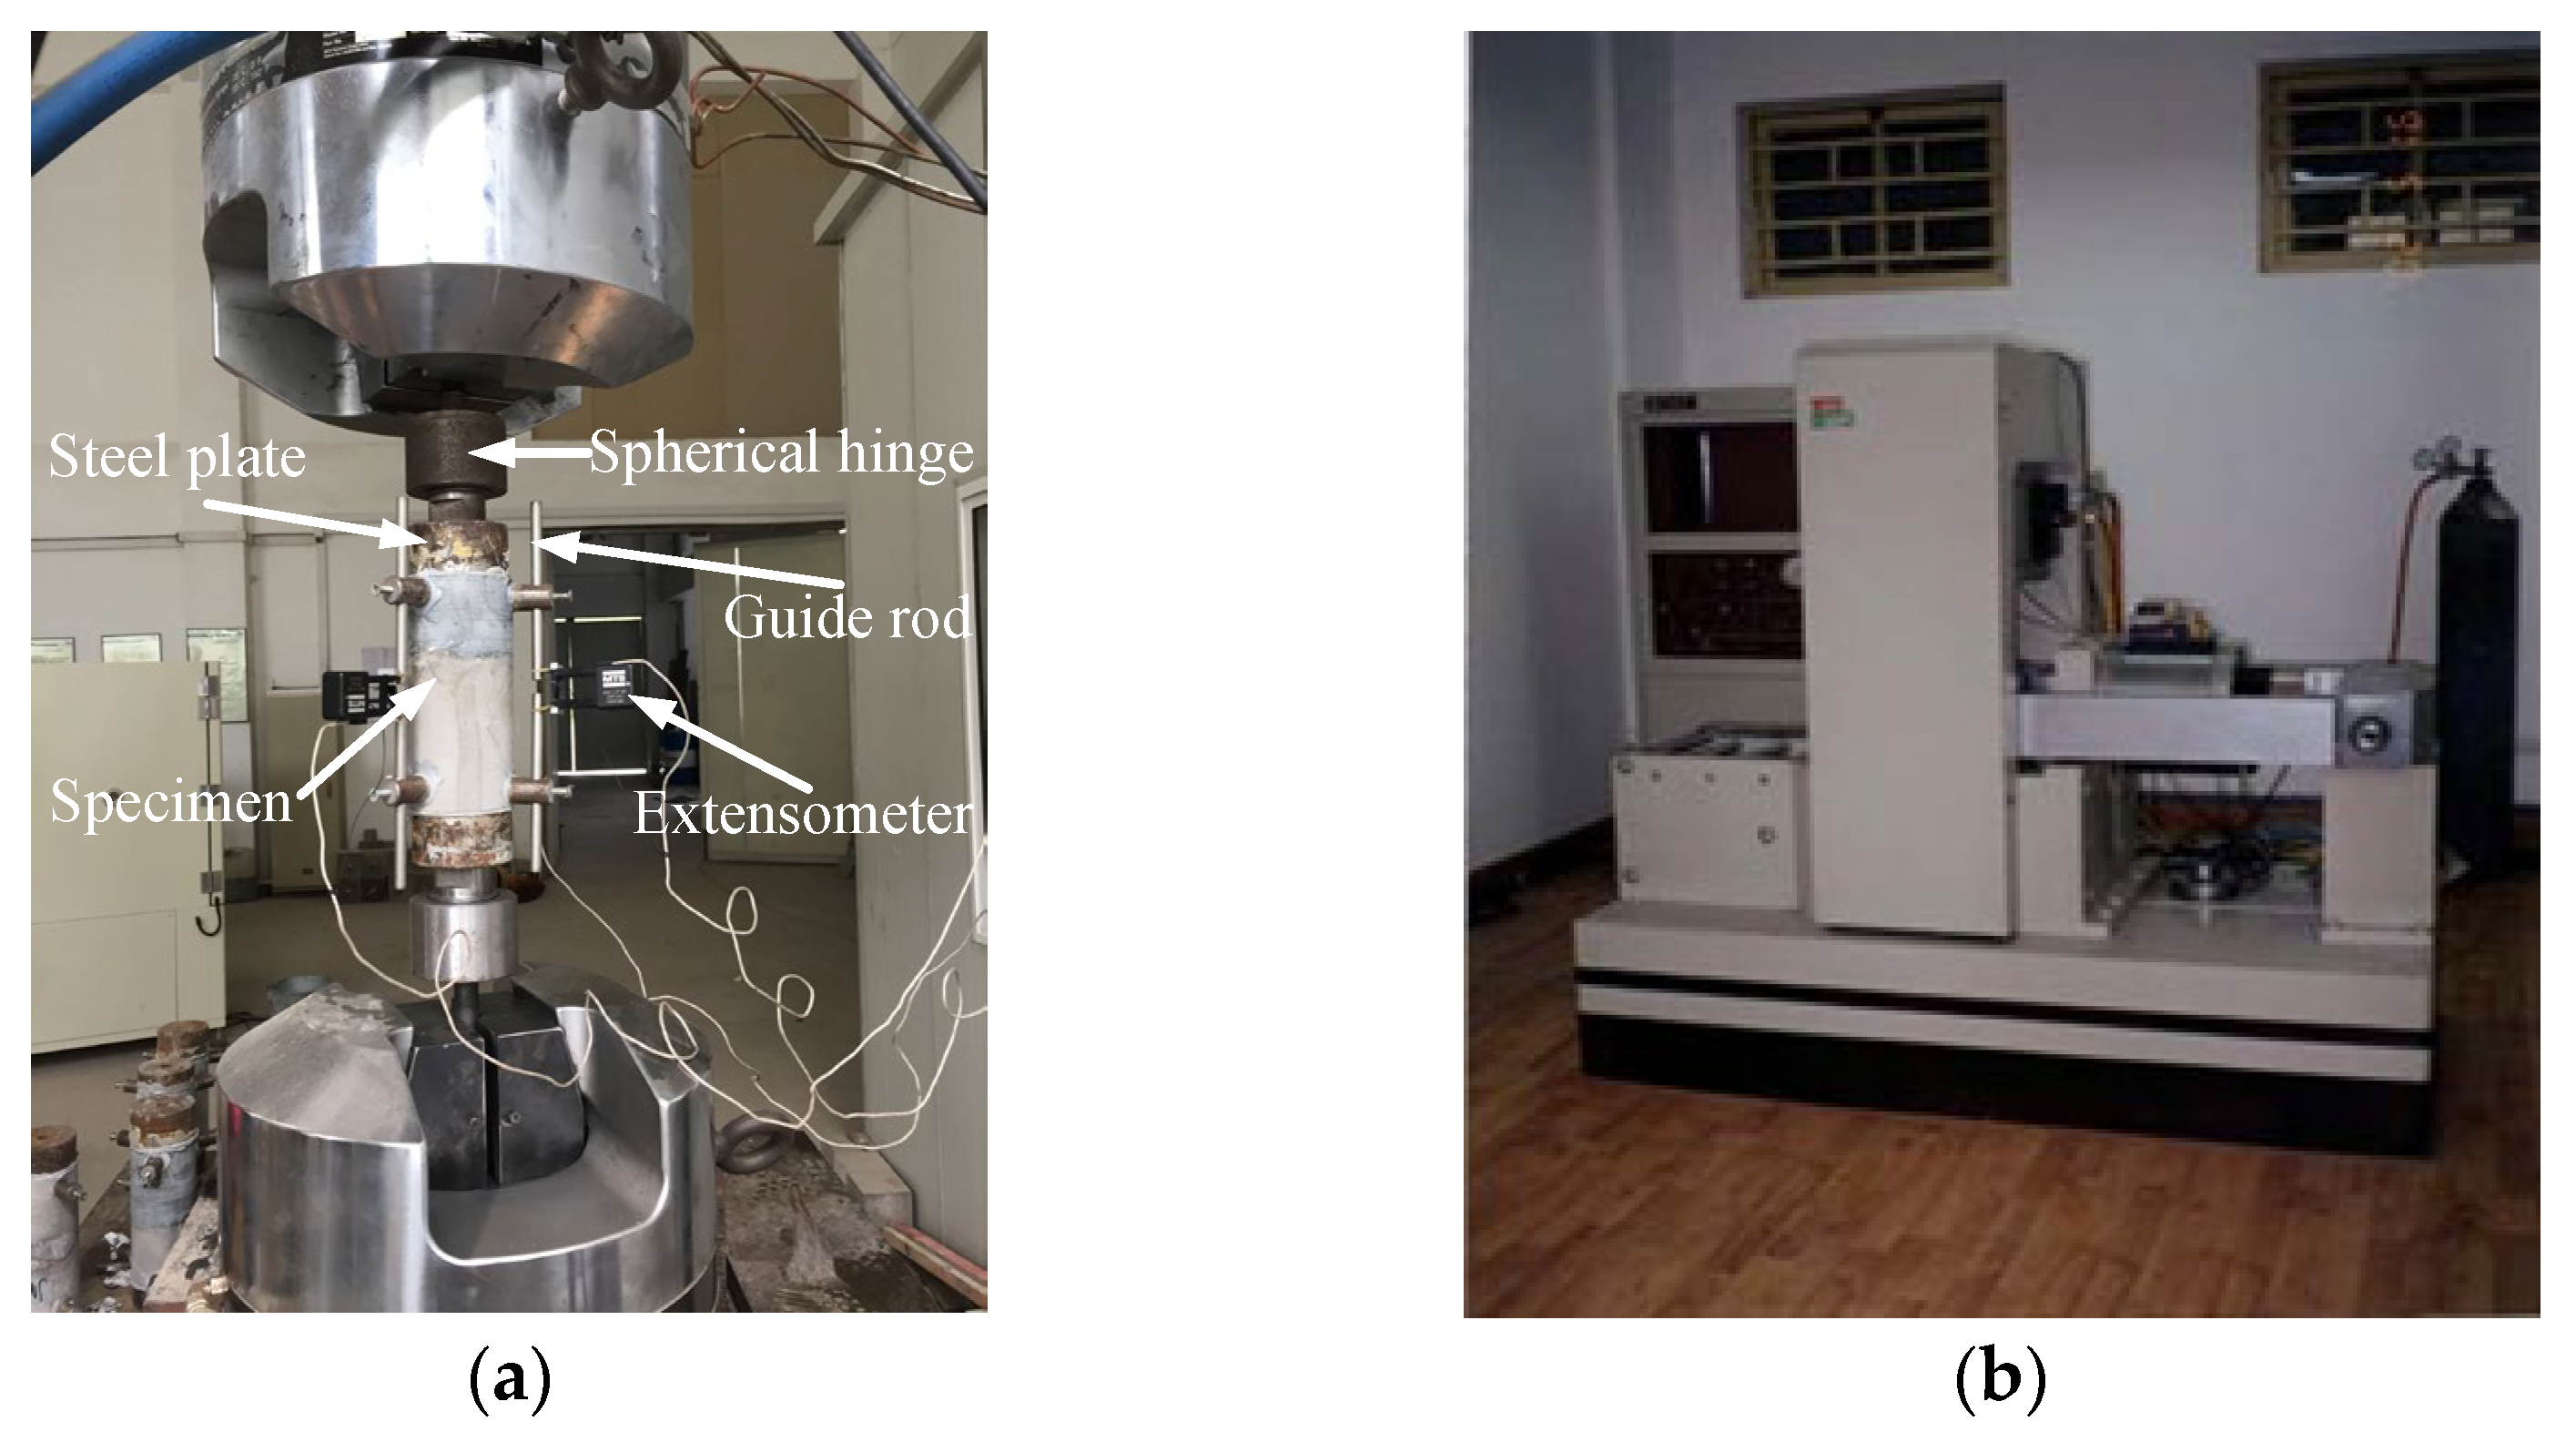
2.2. Test Equipment
2.3. Effect of Strain Rate on Tensile Strength
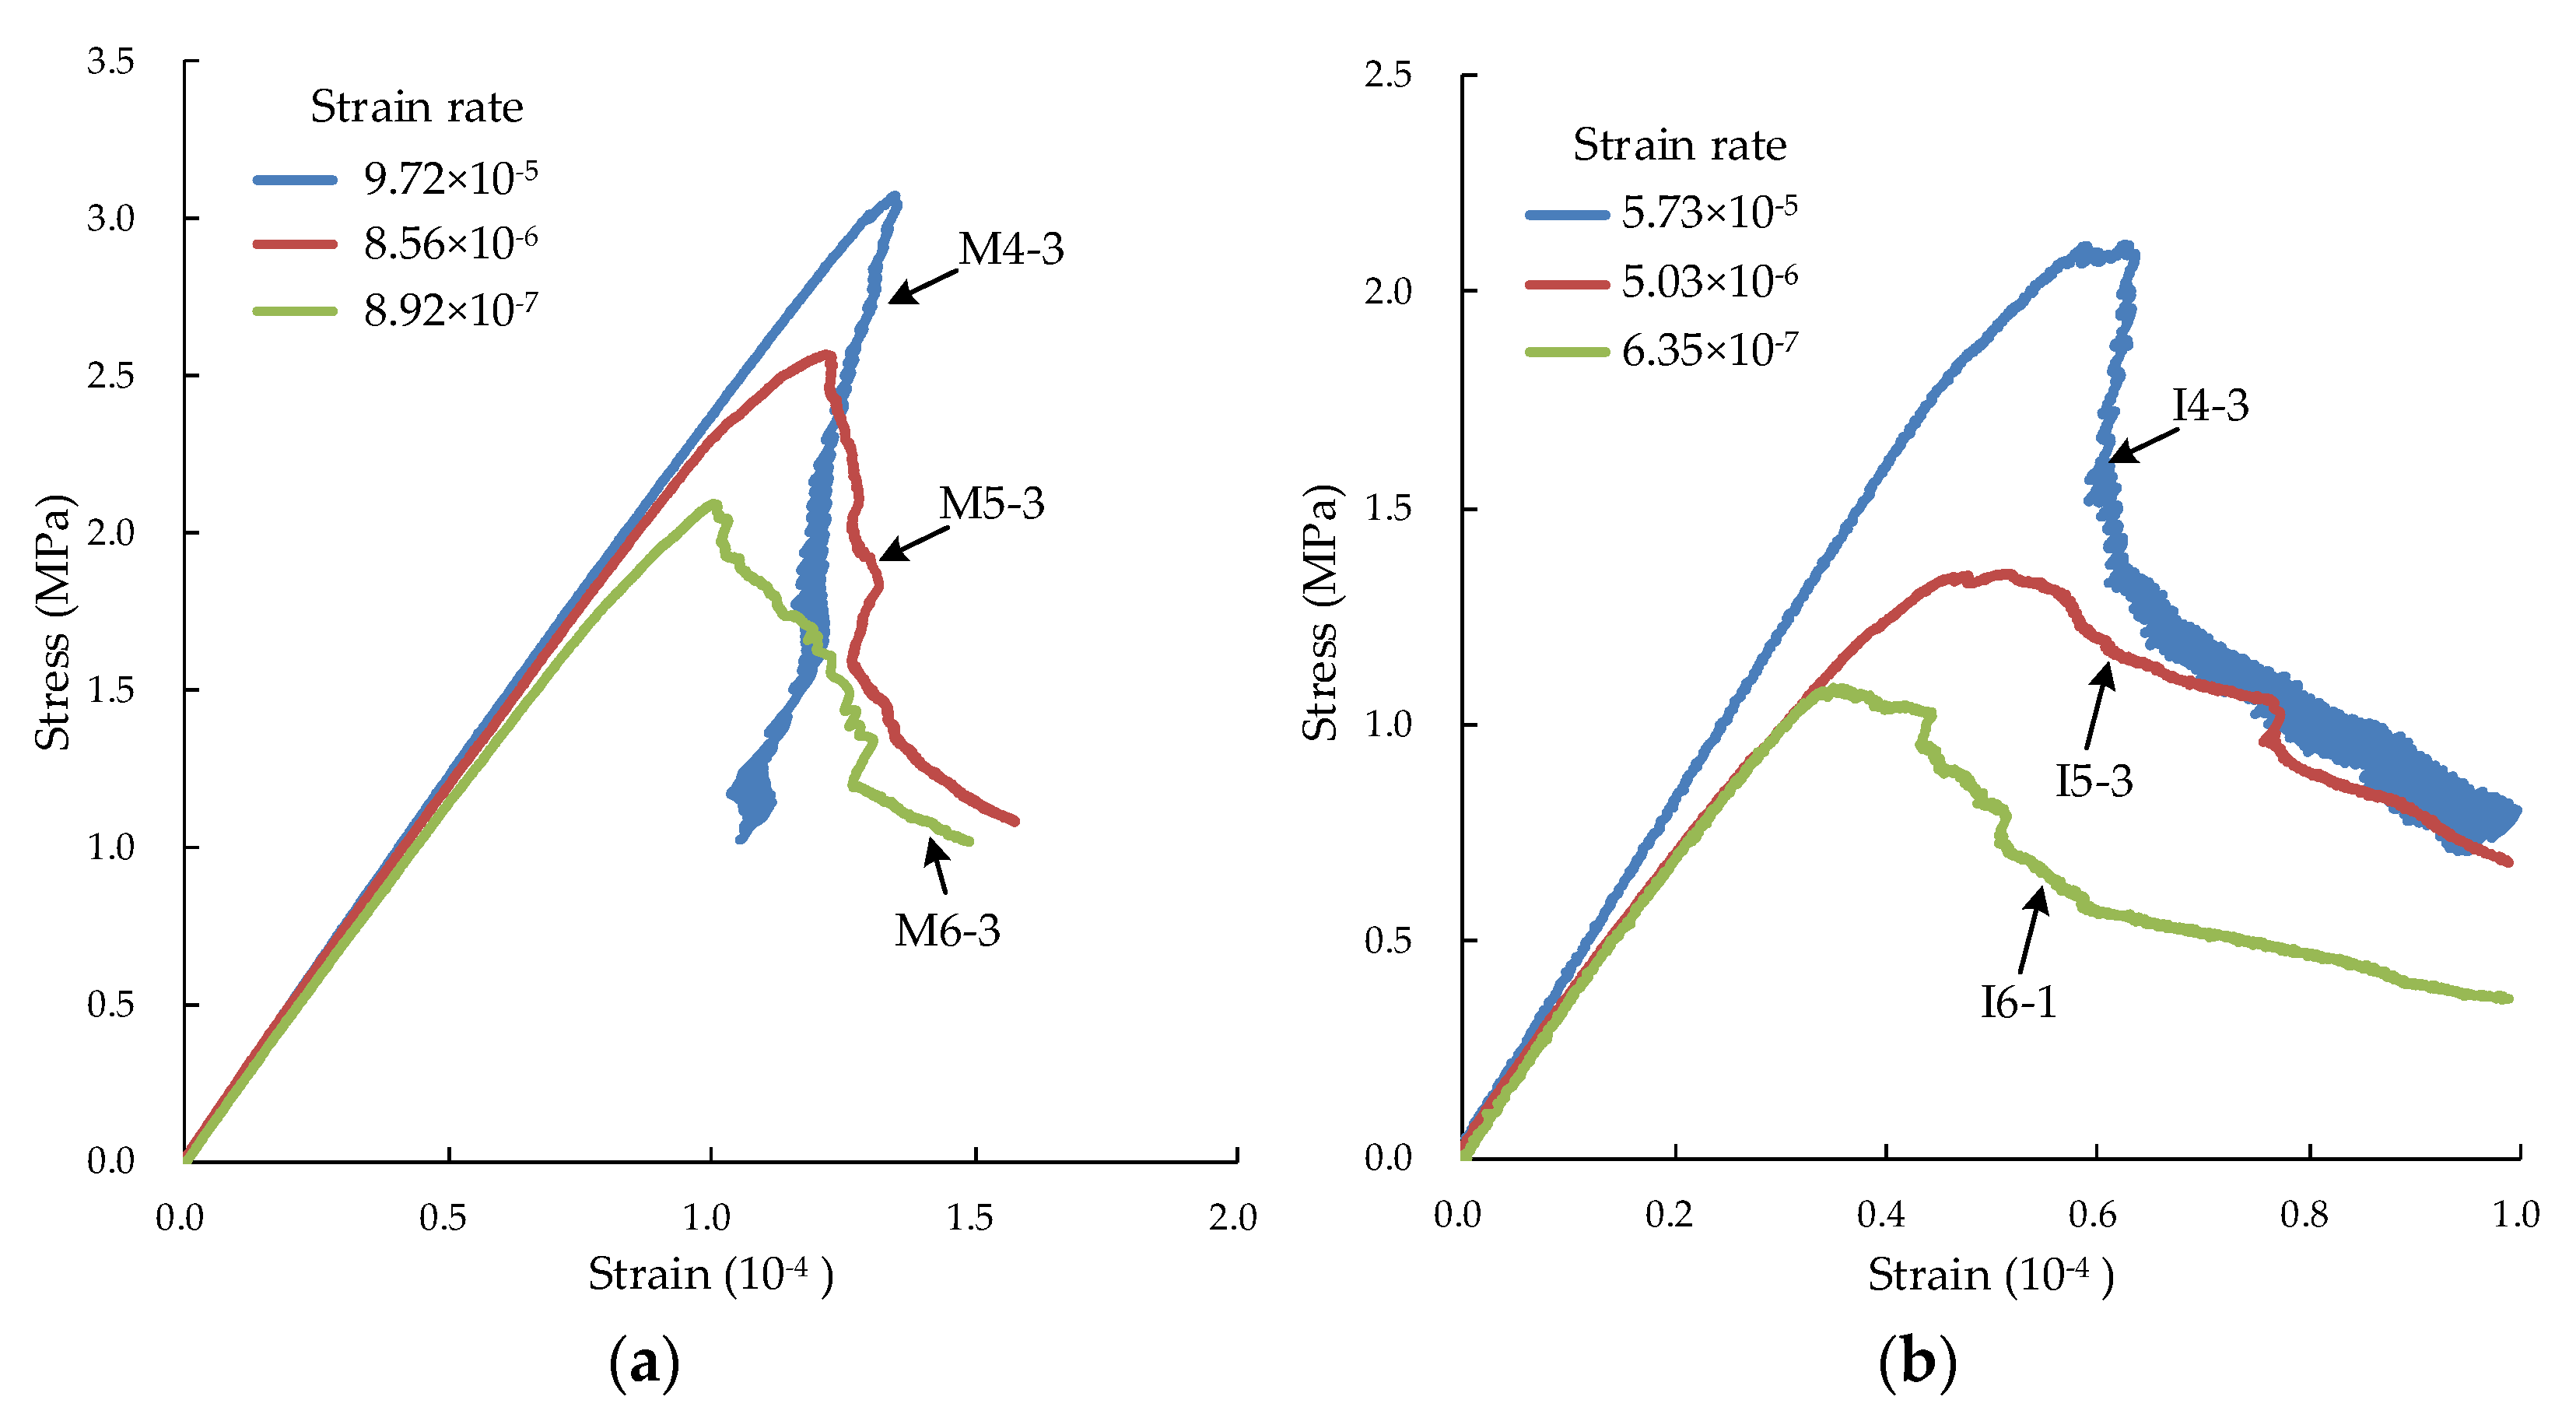
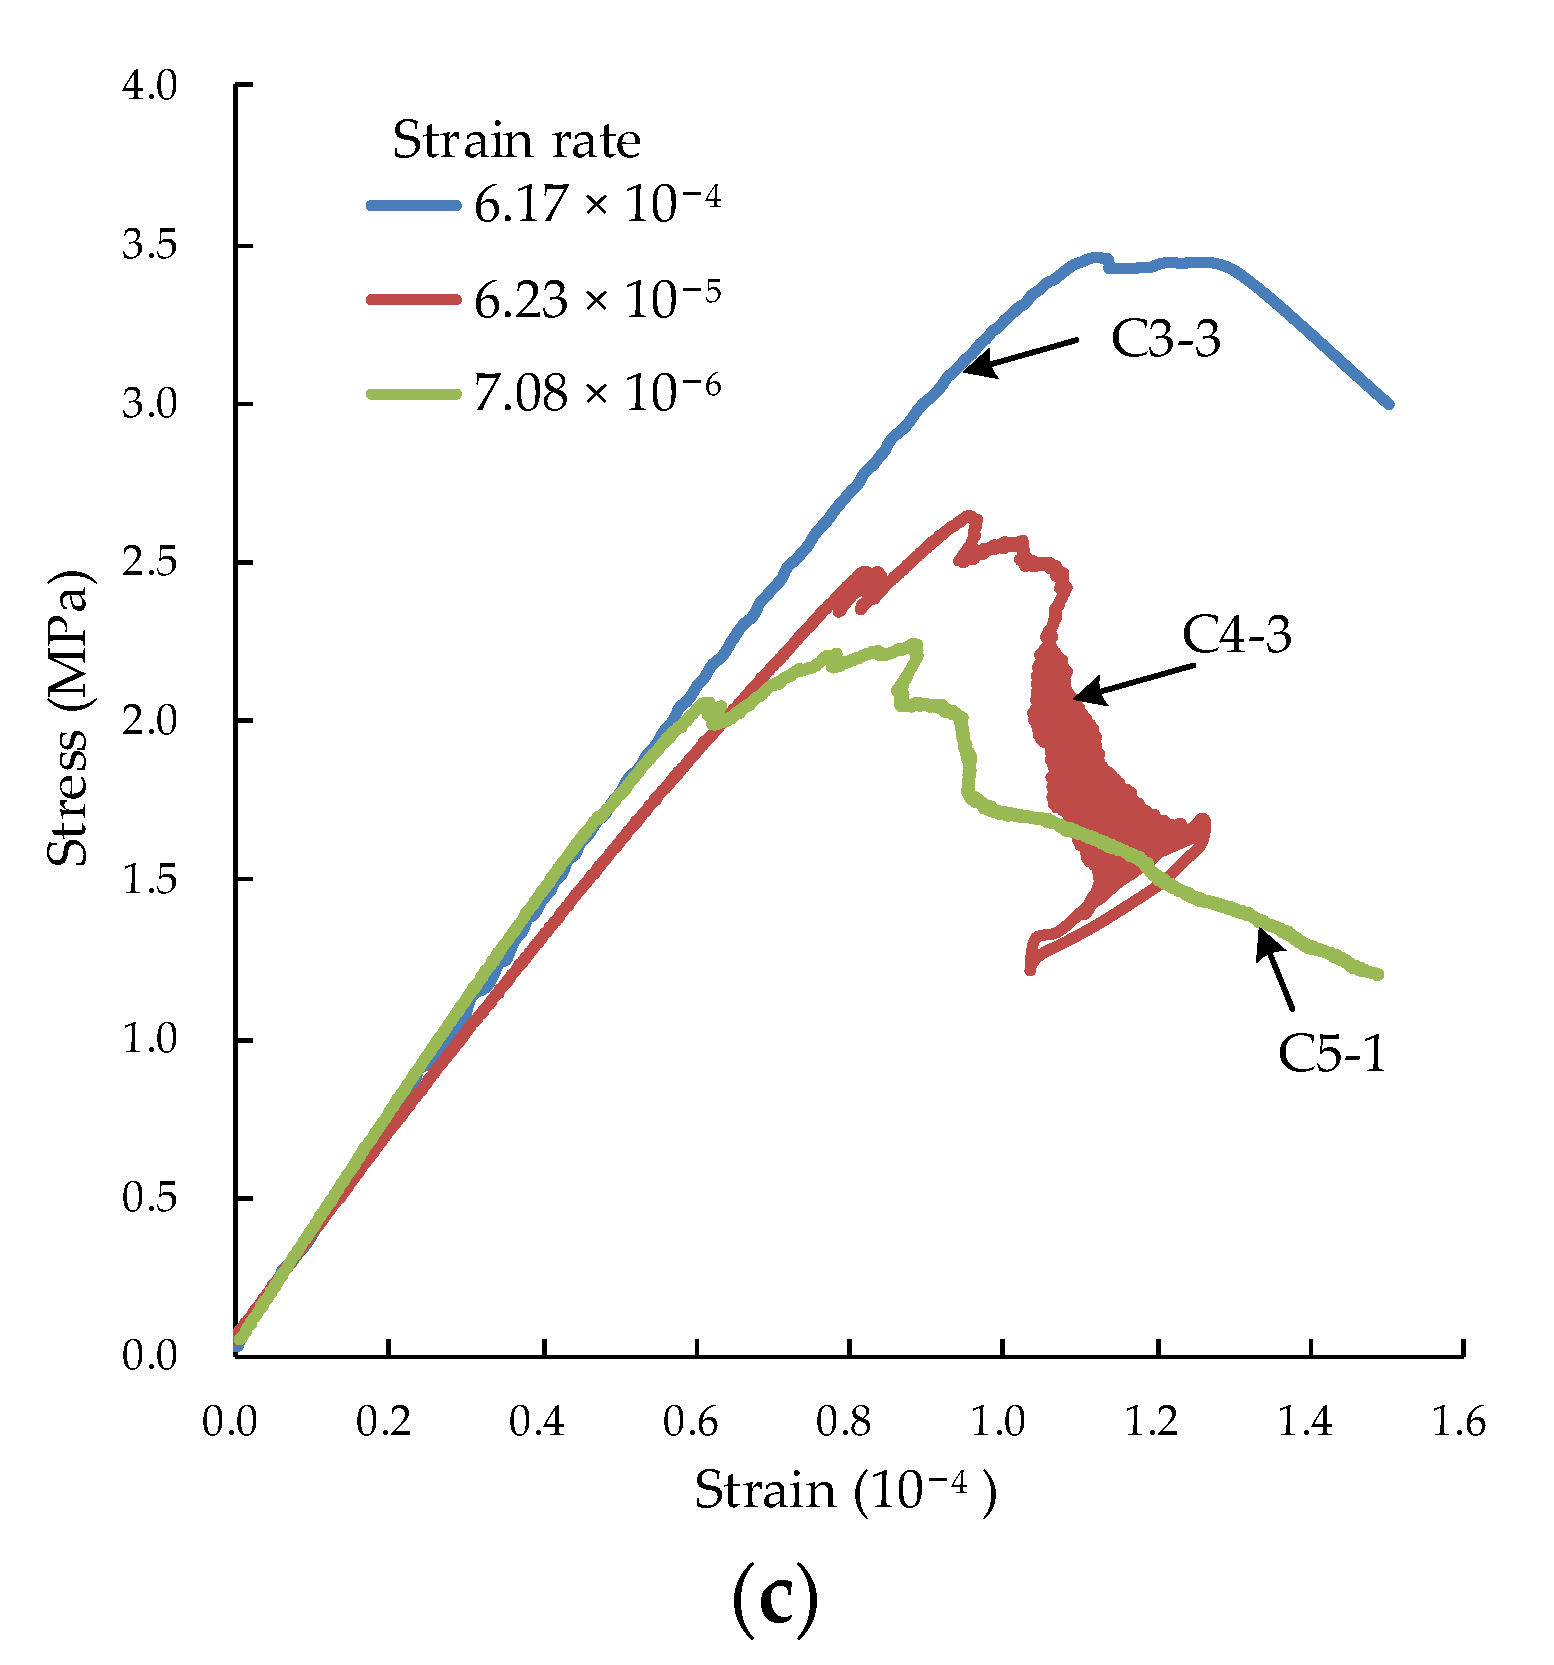
2.4. Effect of Strain Rate on the Stress-Strain Curves
3. Numerical Modeling and Parameter Calibration
3.1. Contact Model
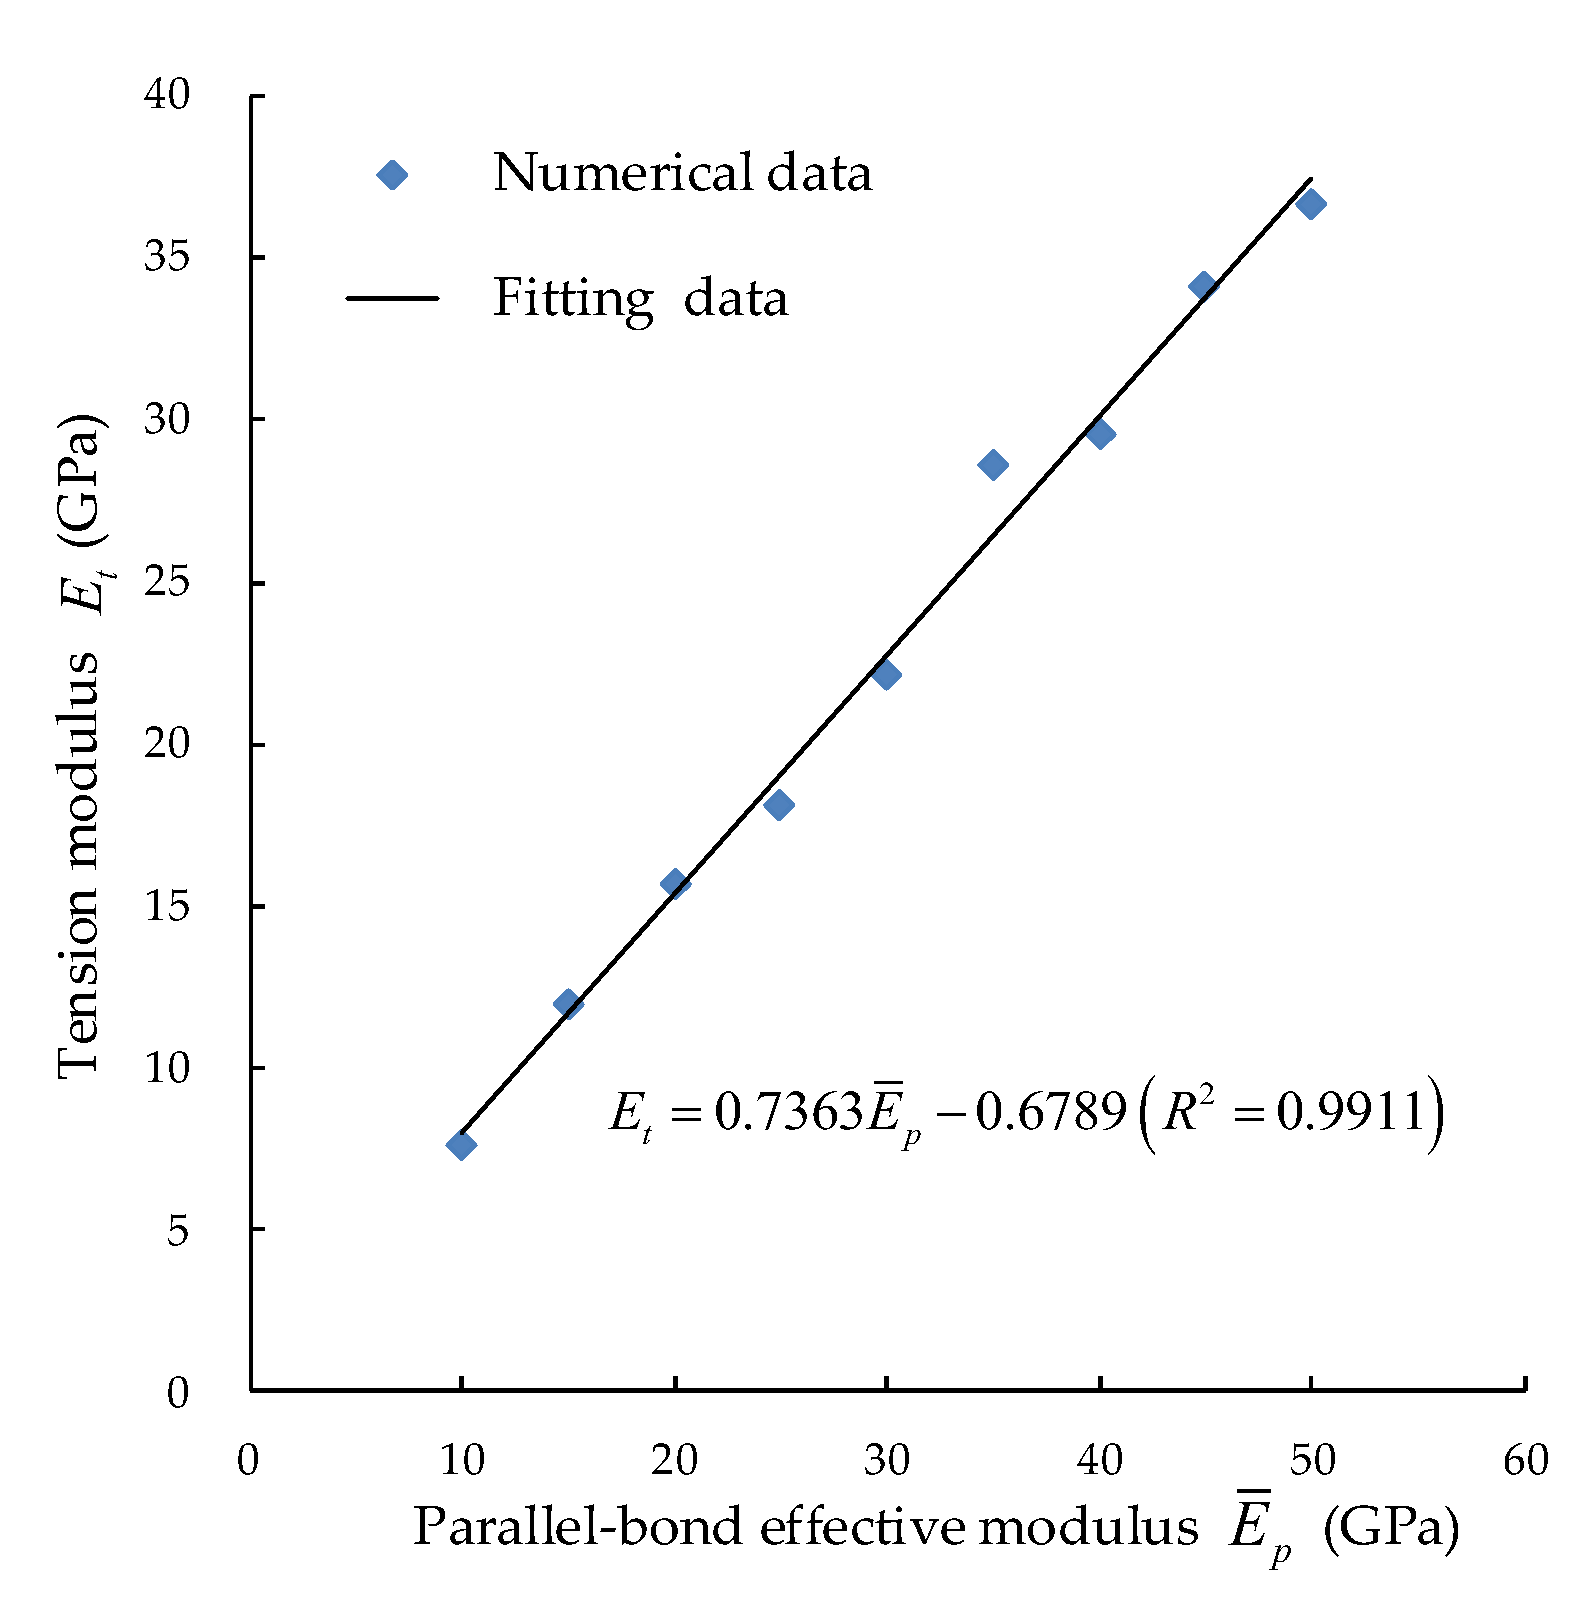
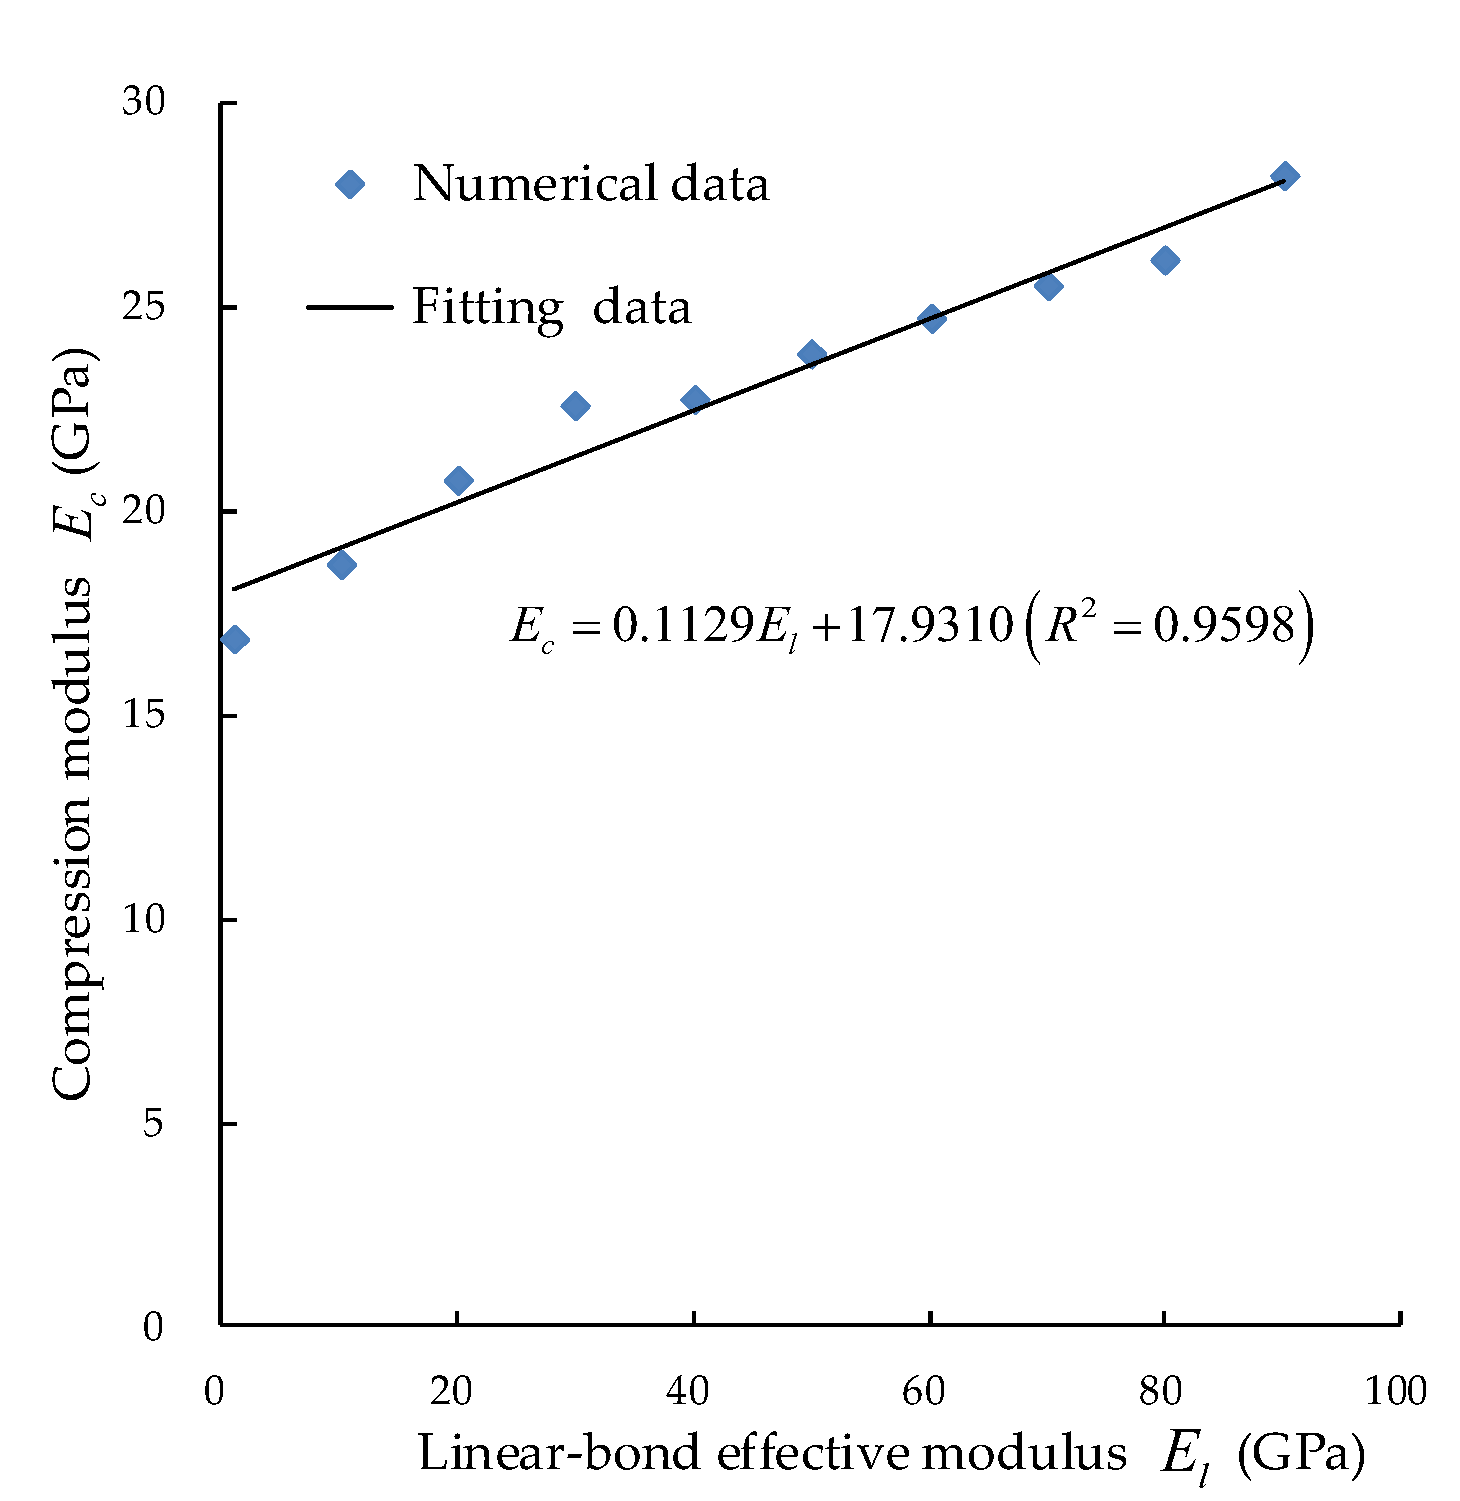
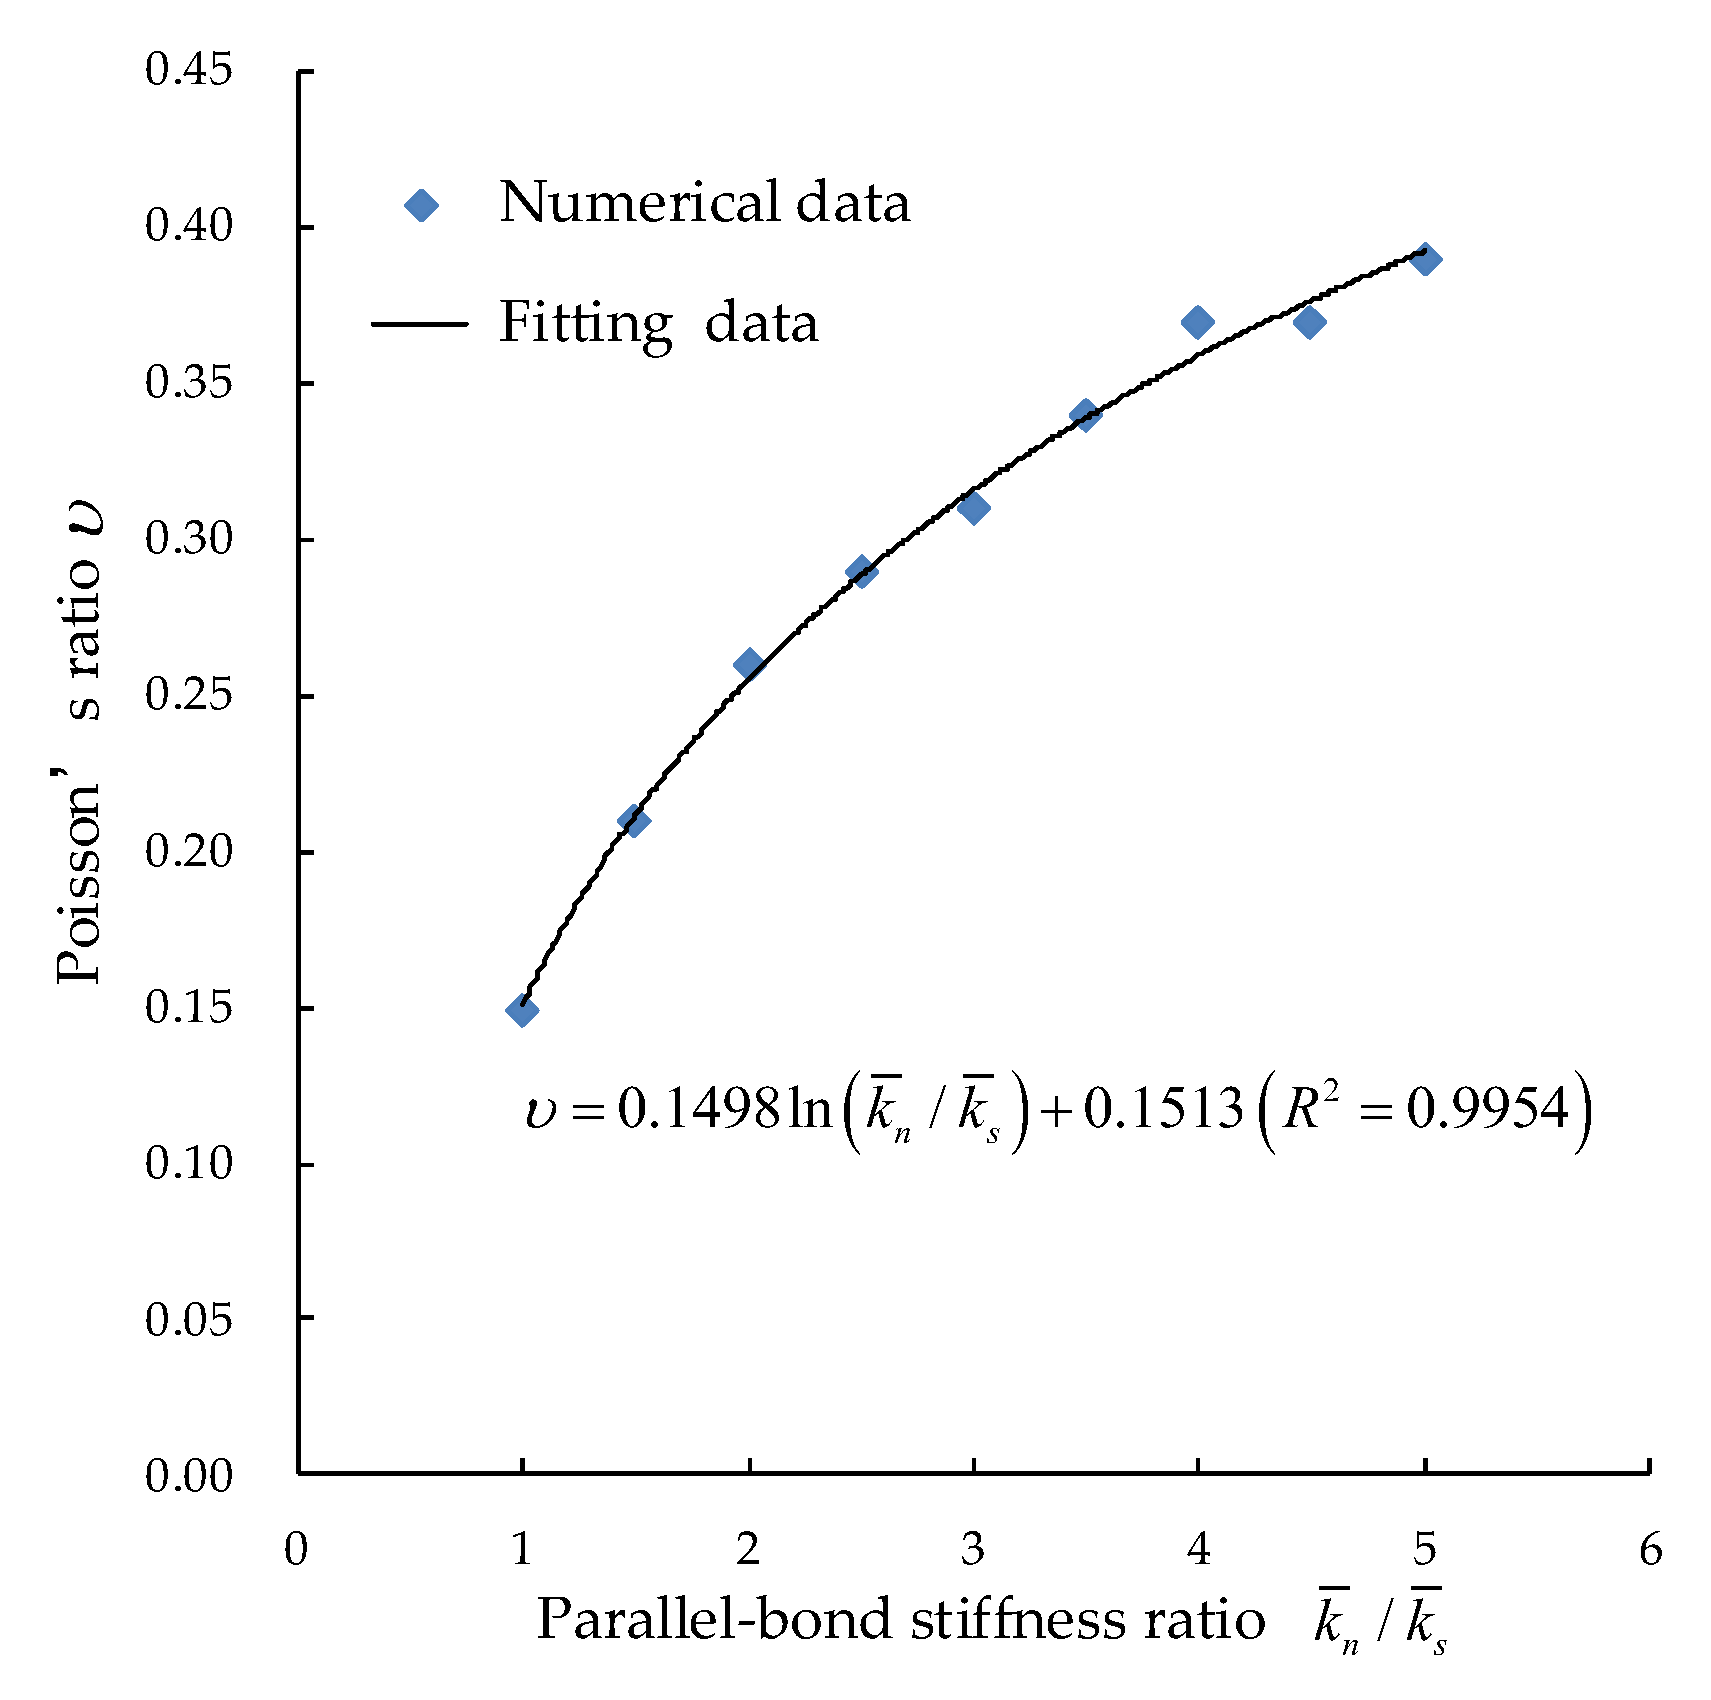
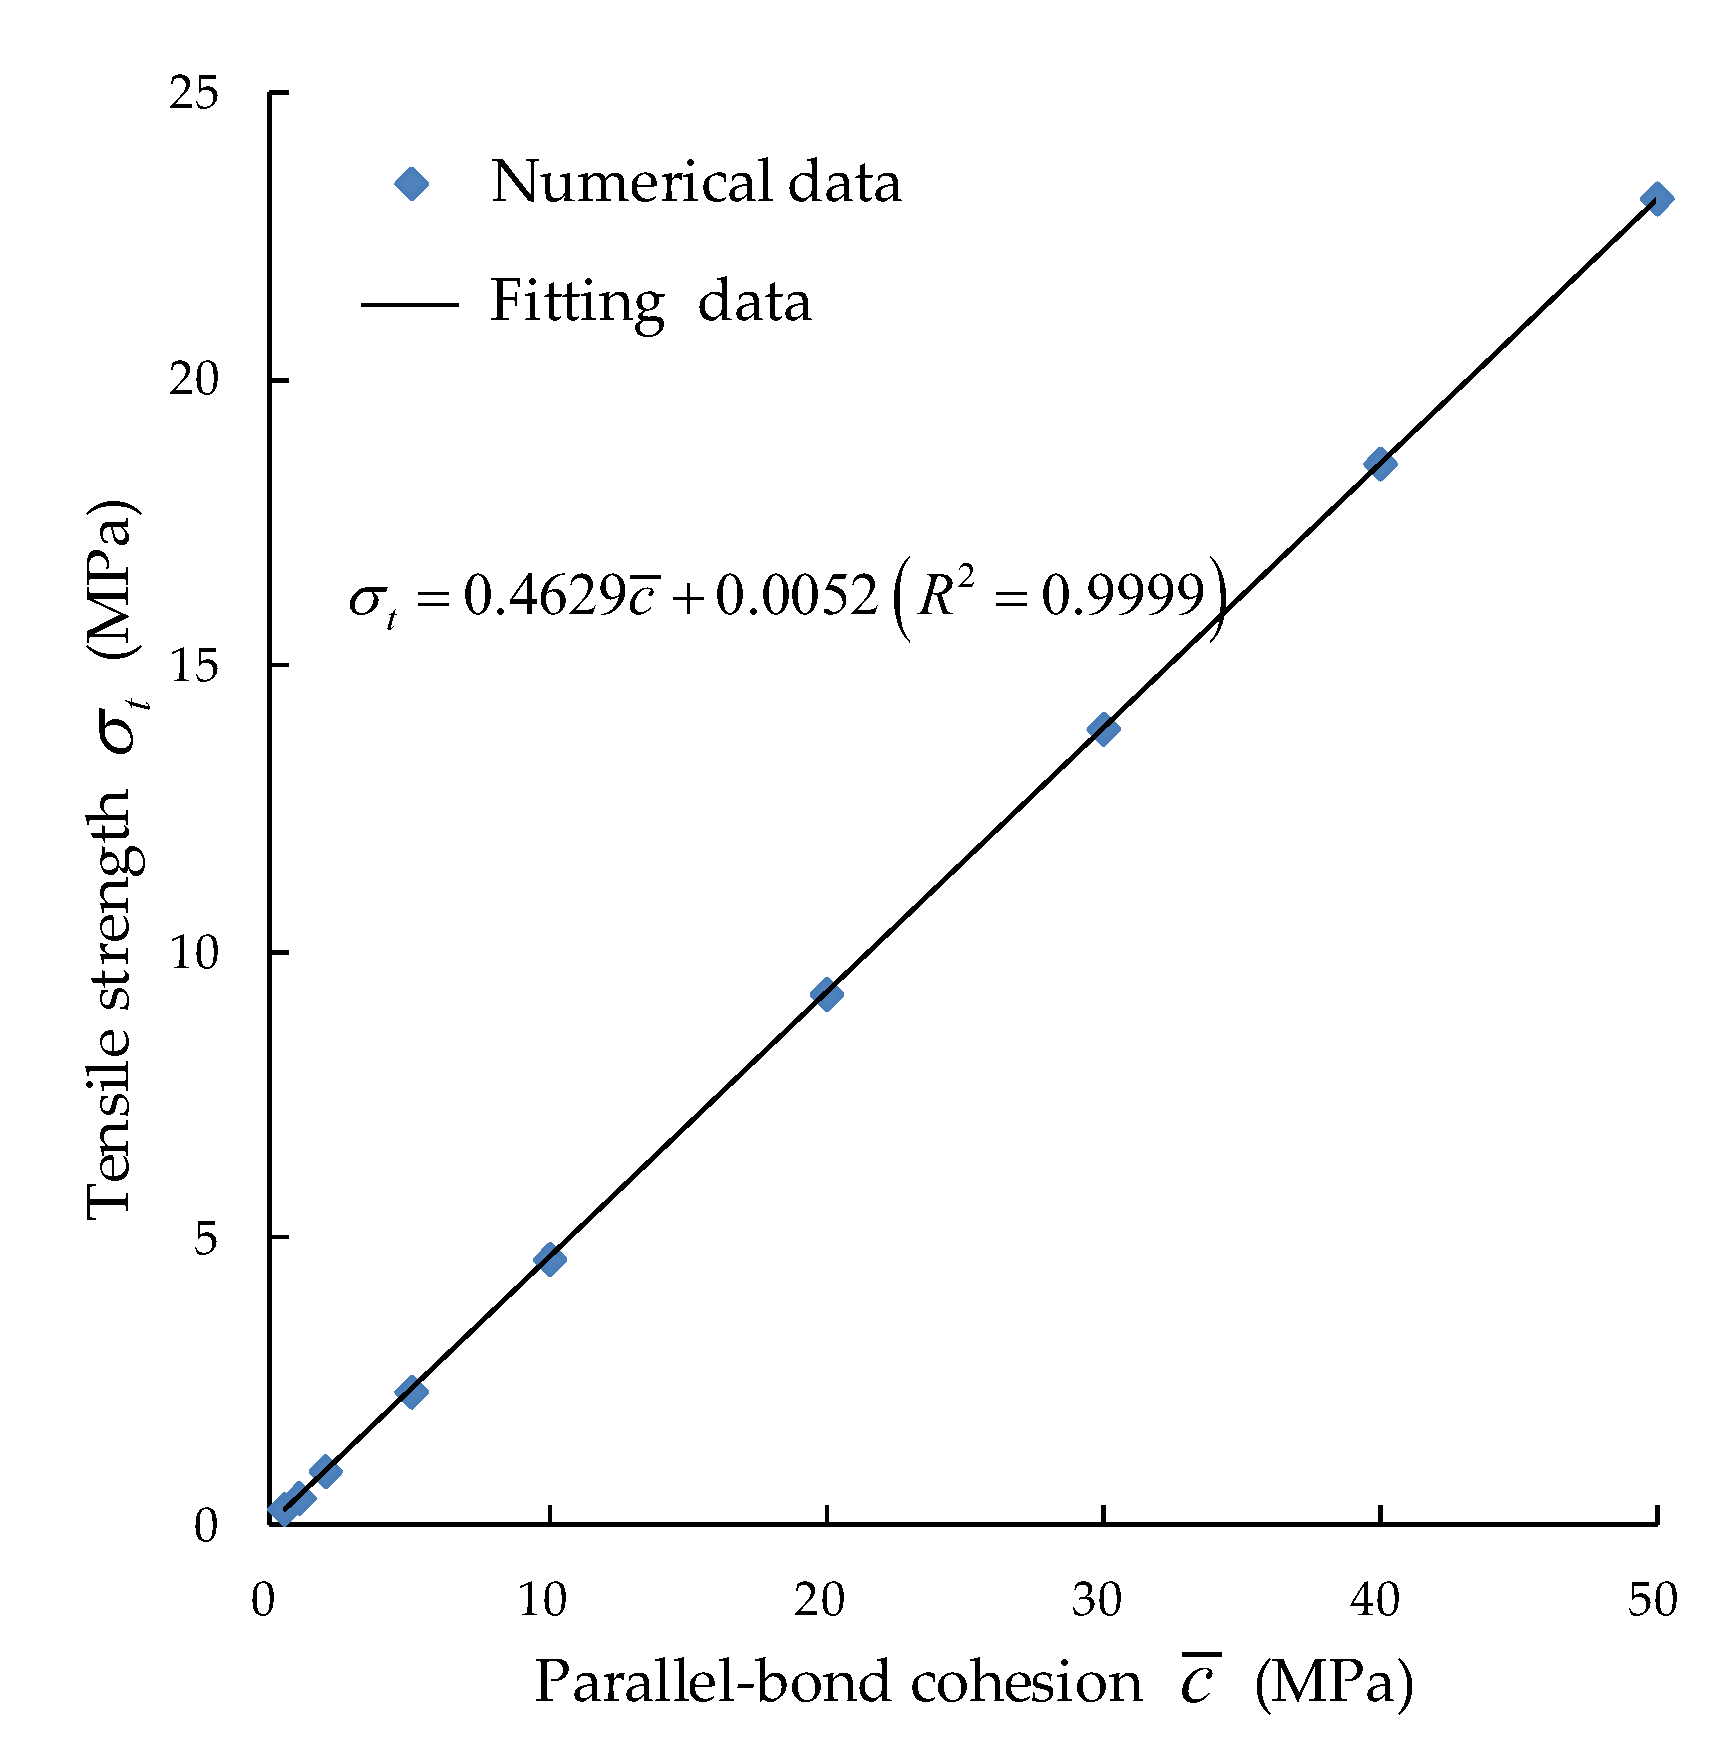
3.2. Parameter Calibration of Mortar
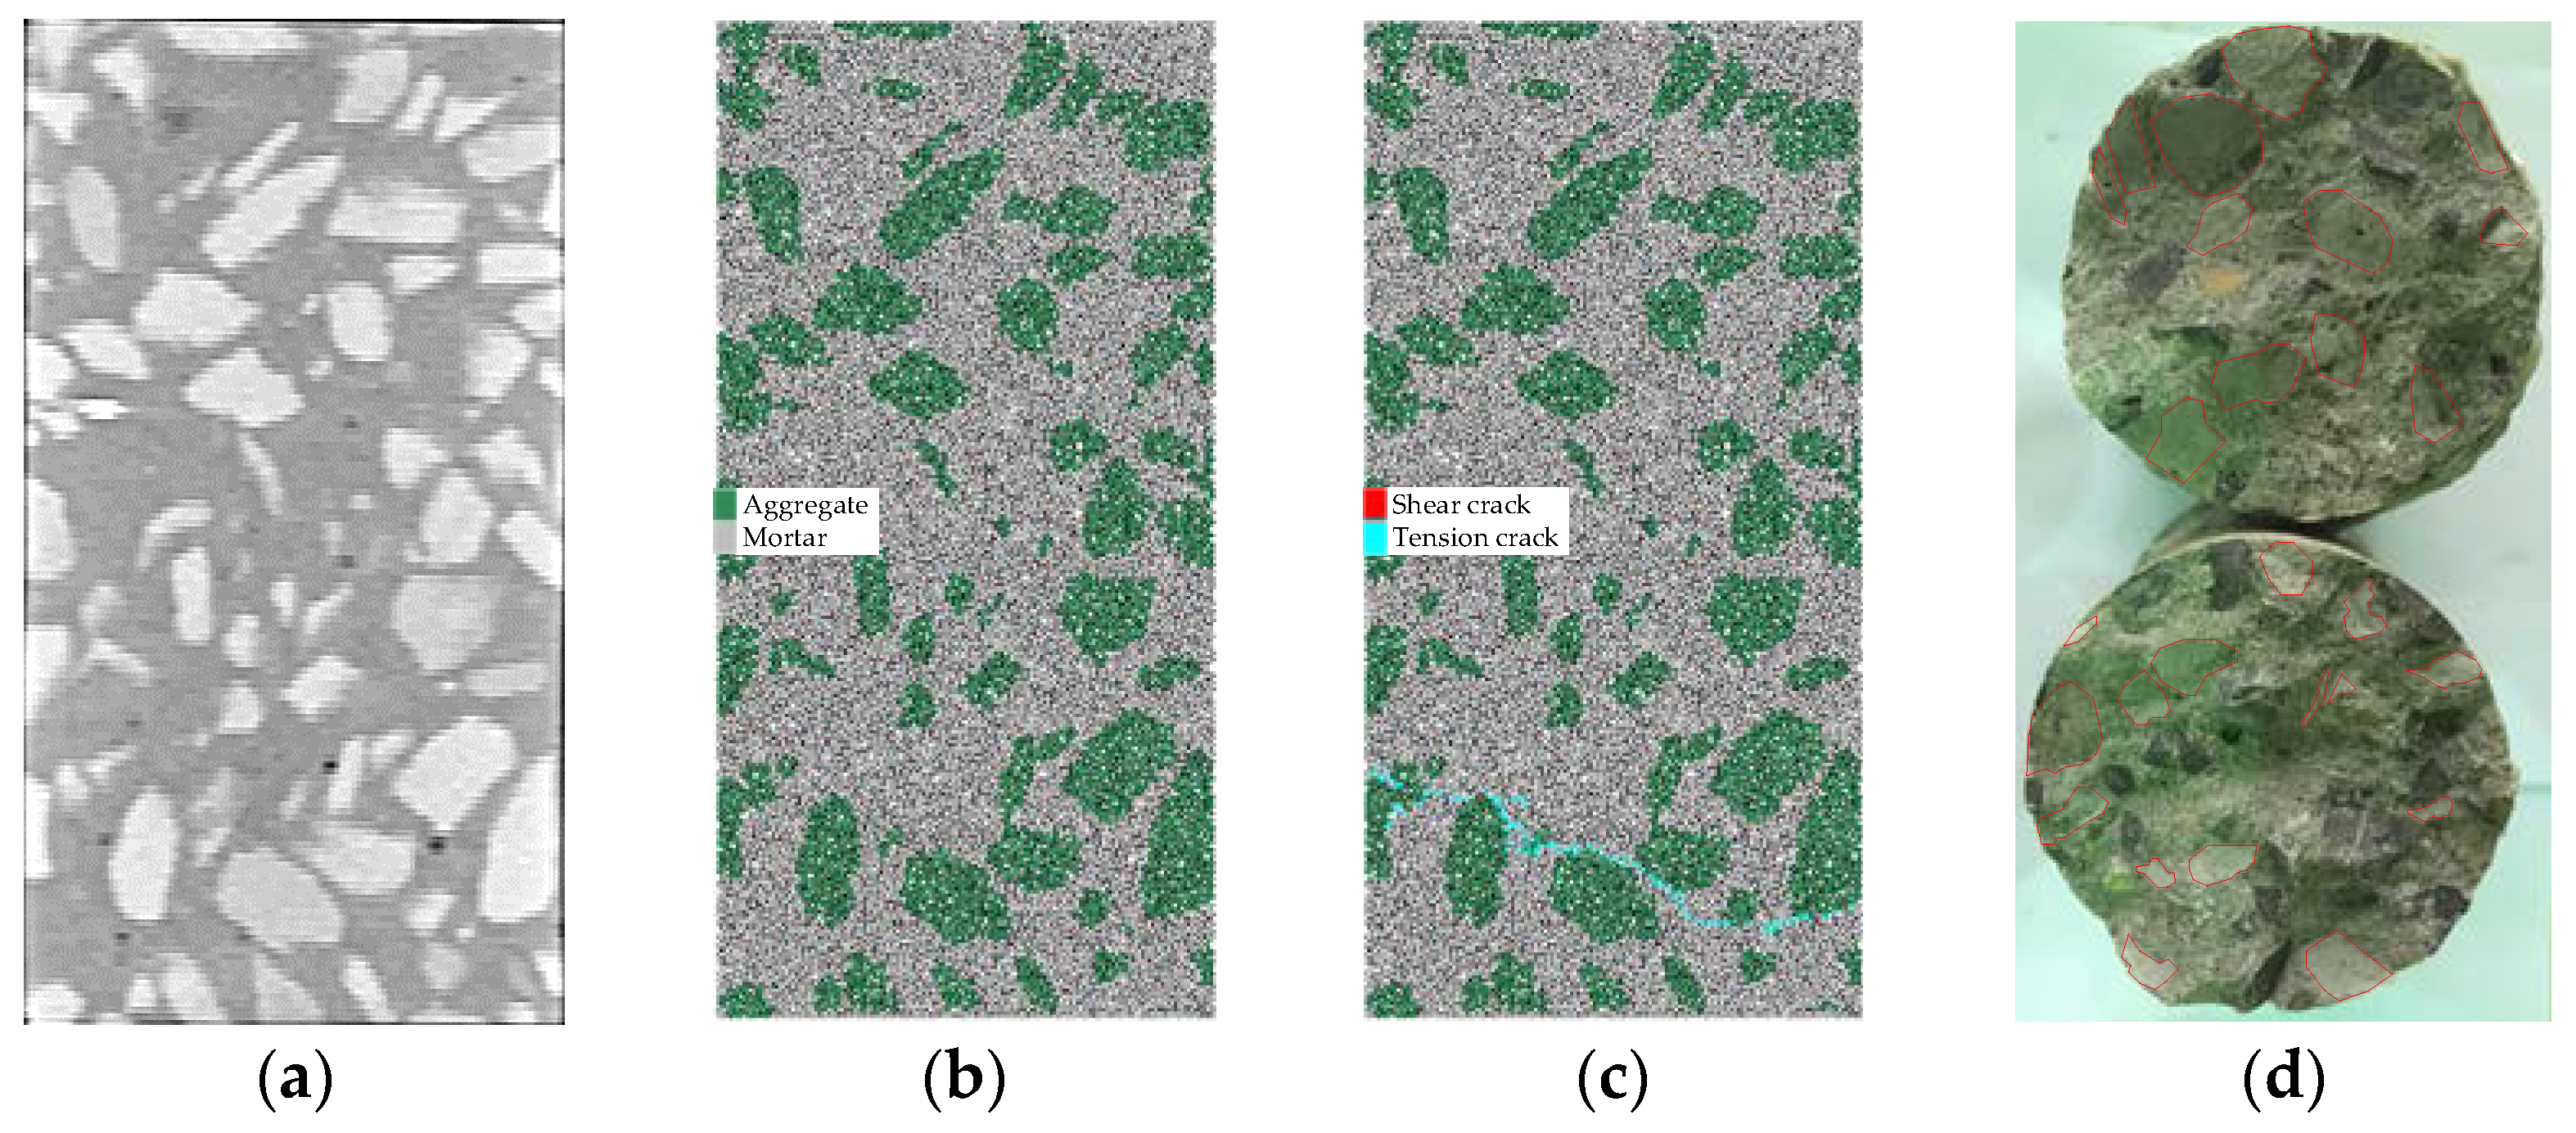
3.3. Parameter Calibration of Concrete
4. Meso-Mechanical Analysis of Concrete under Different Strain Rates
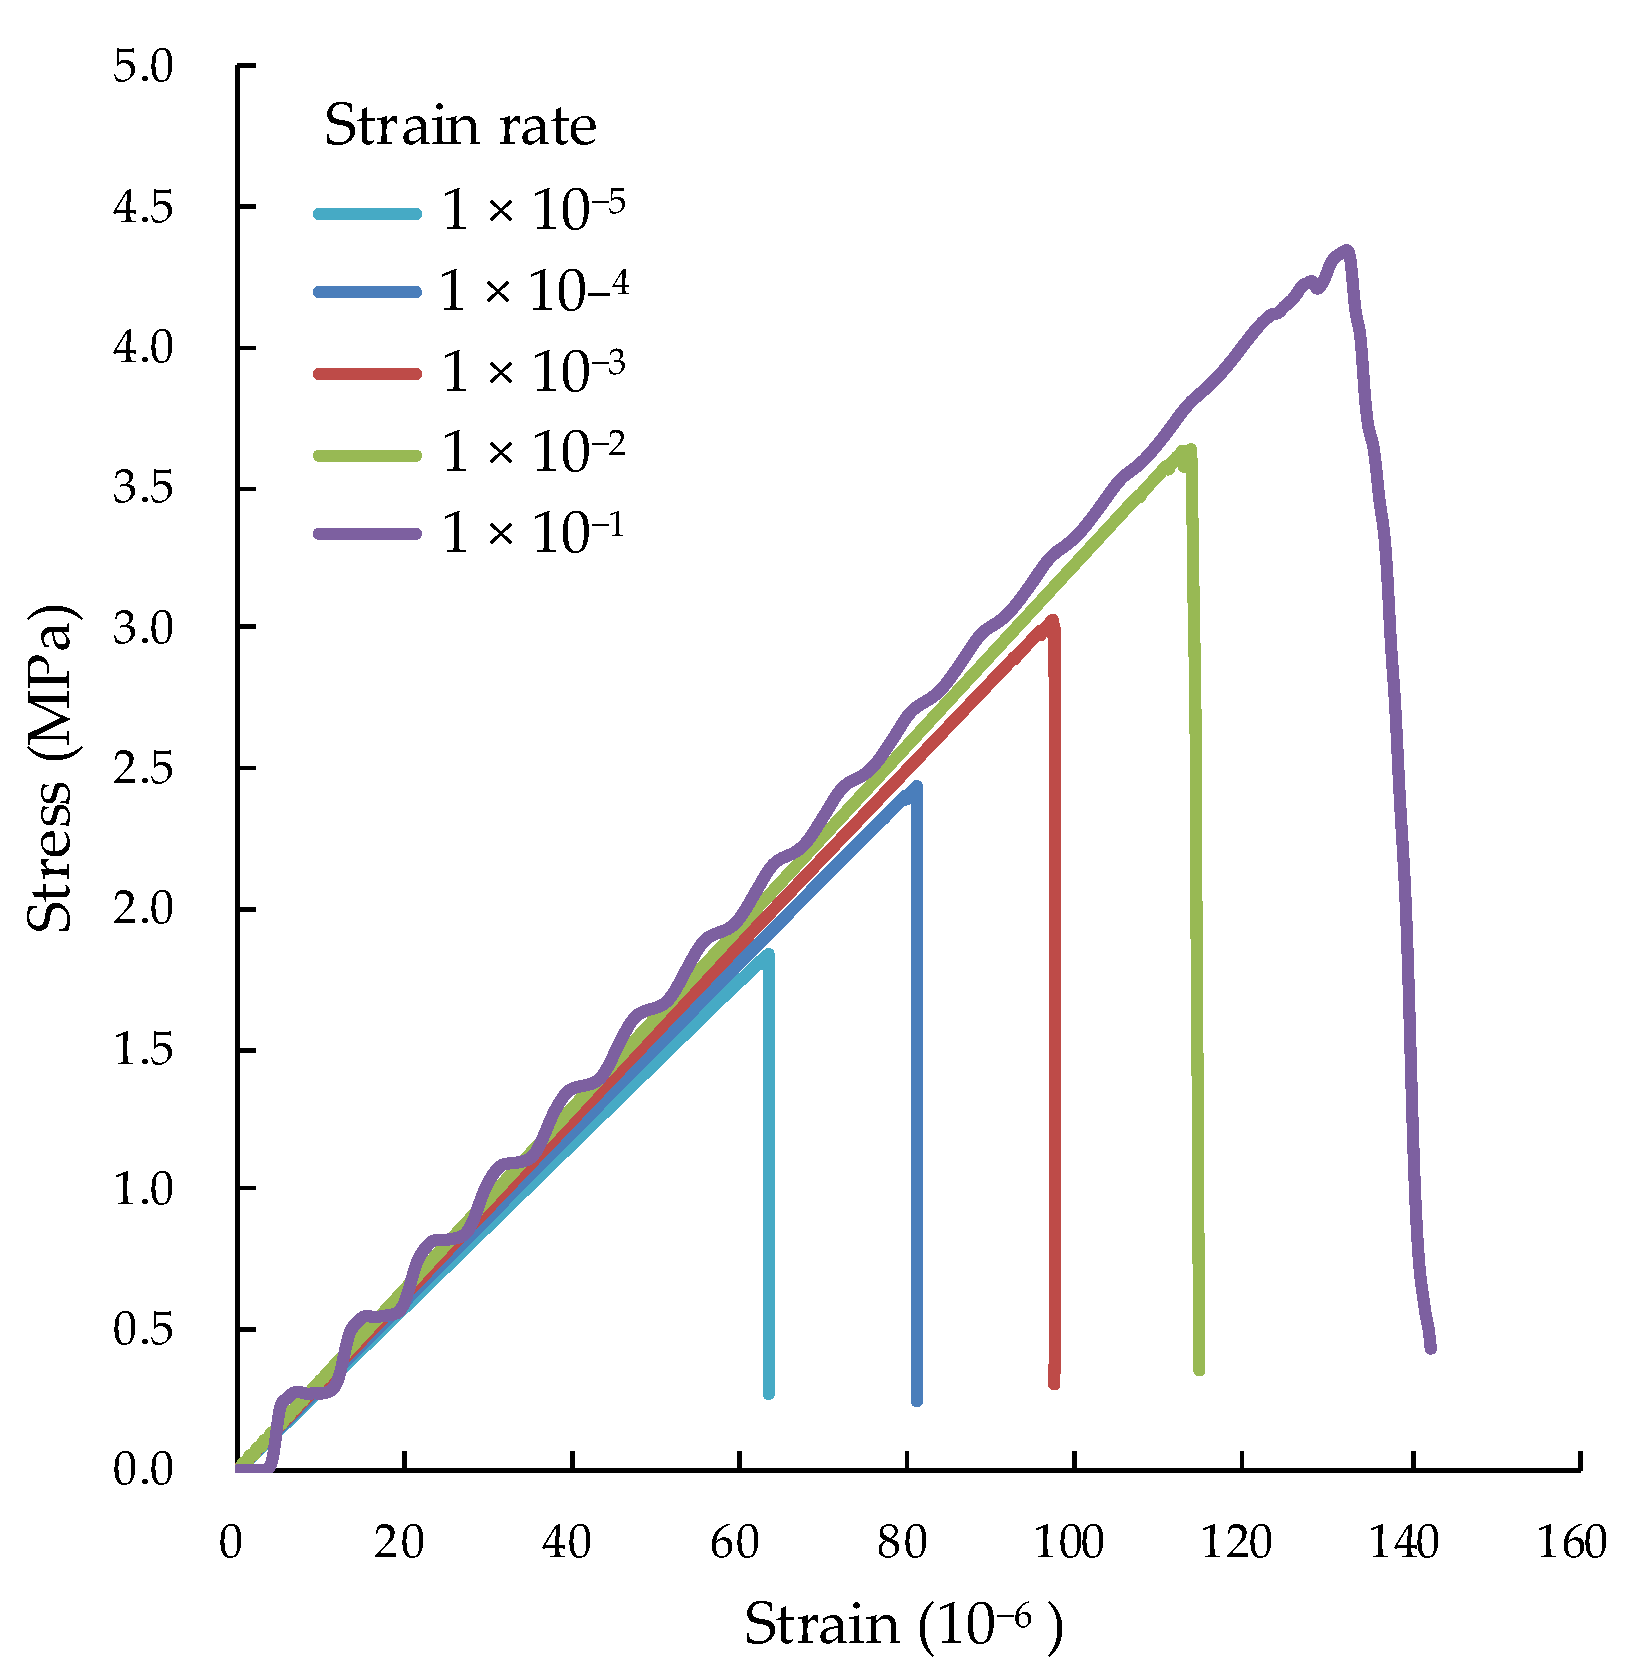
4.1. Stress–Strain Curve
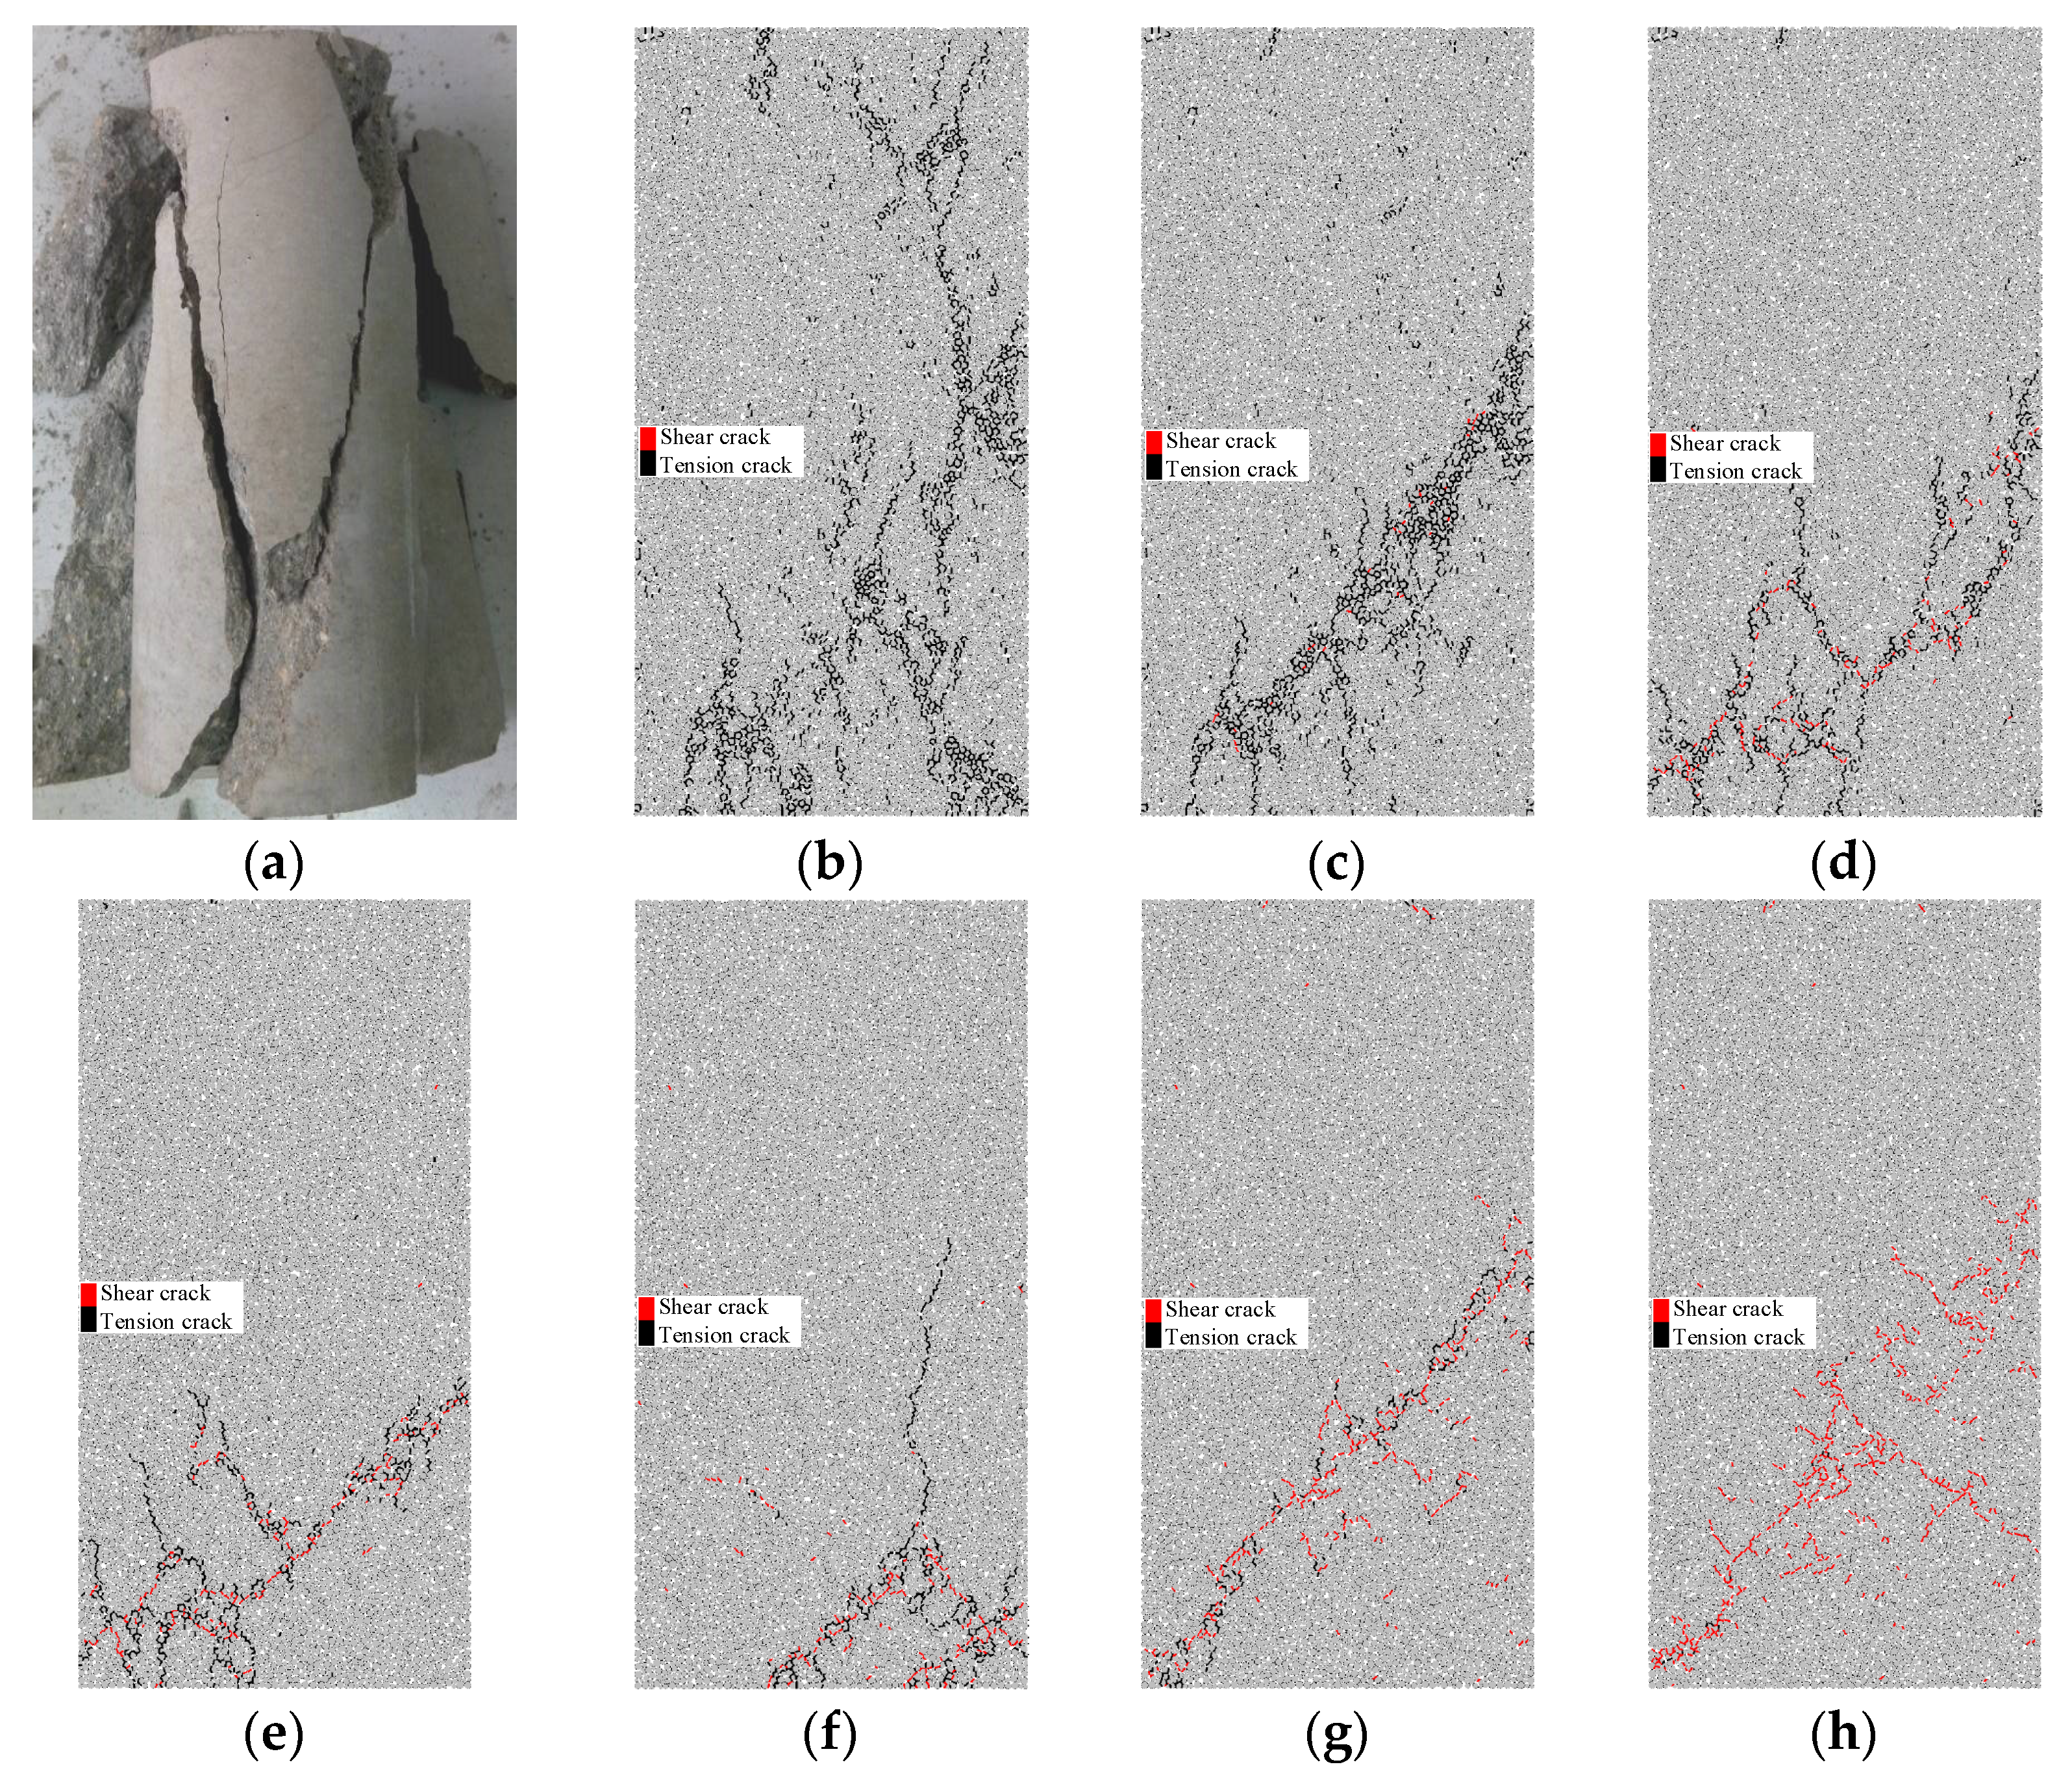
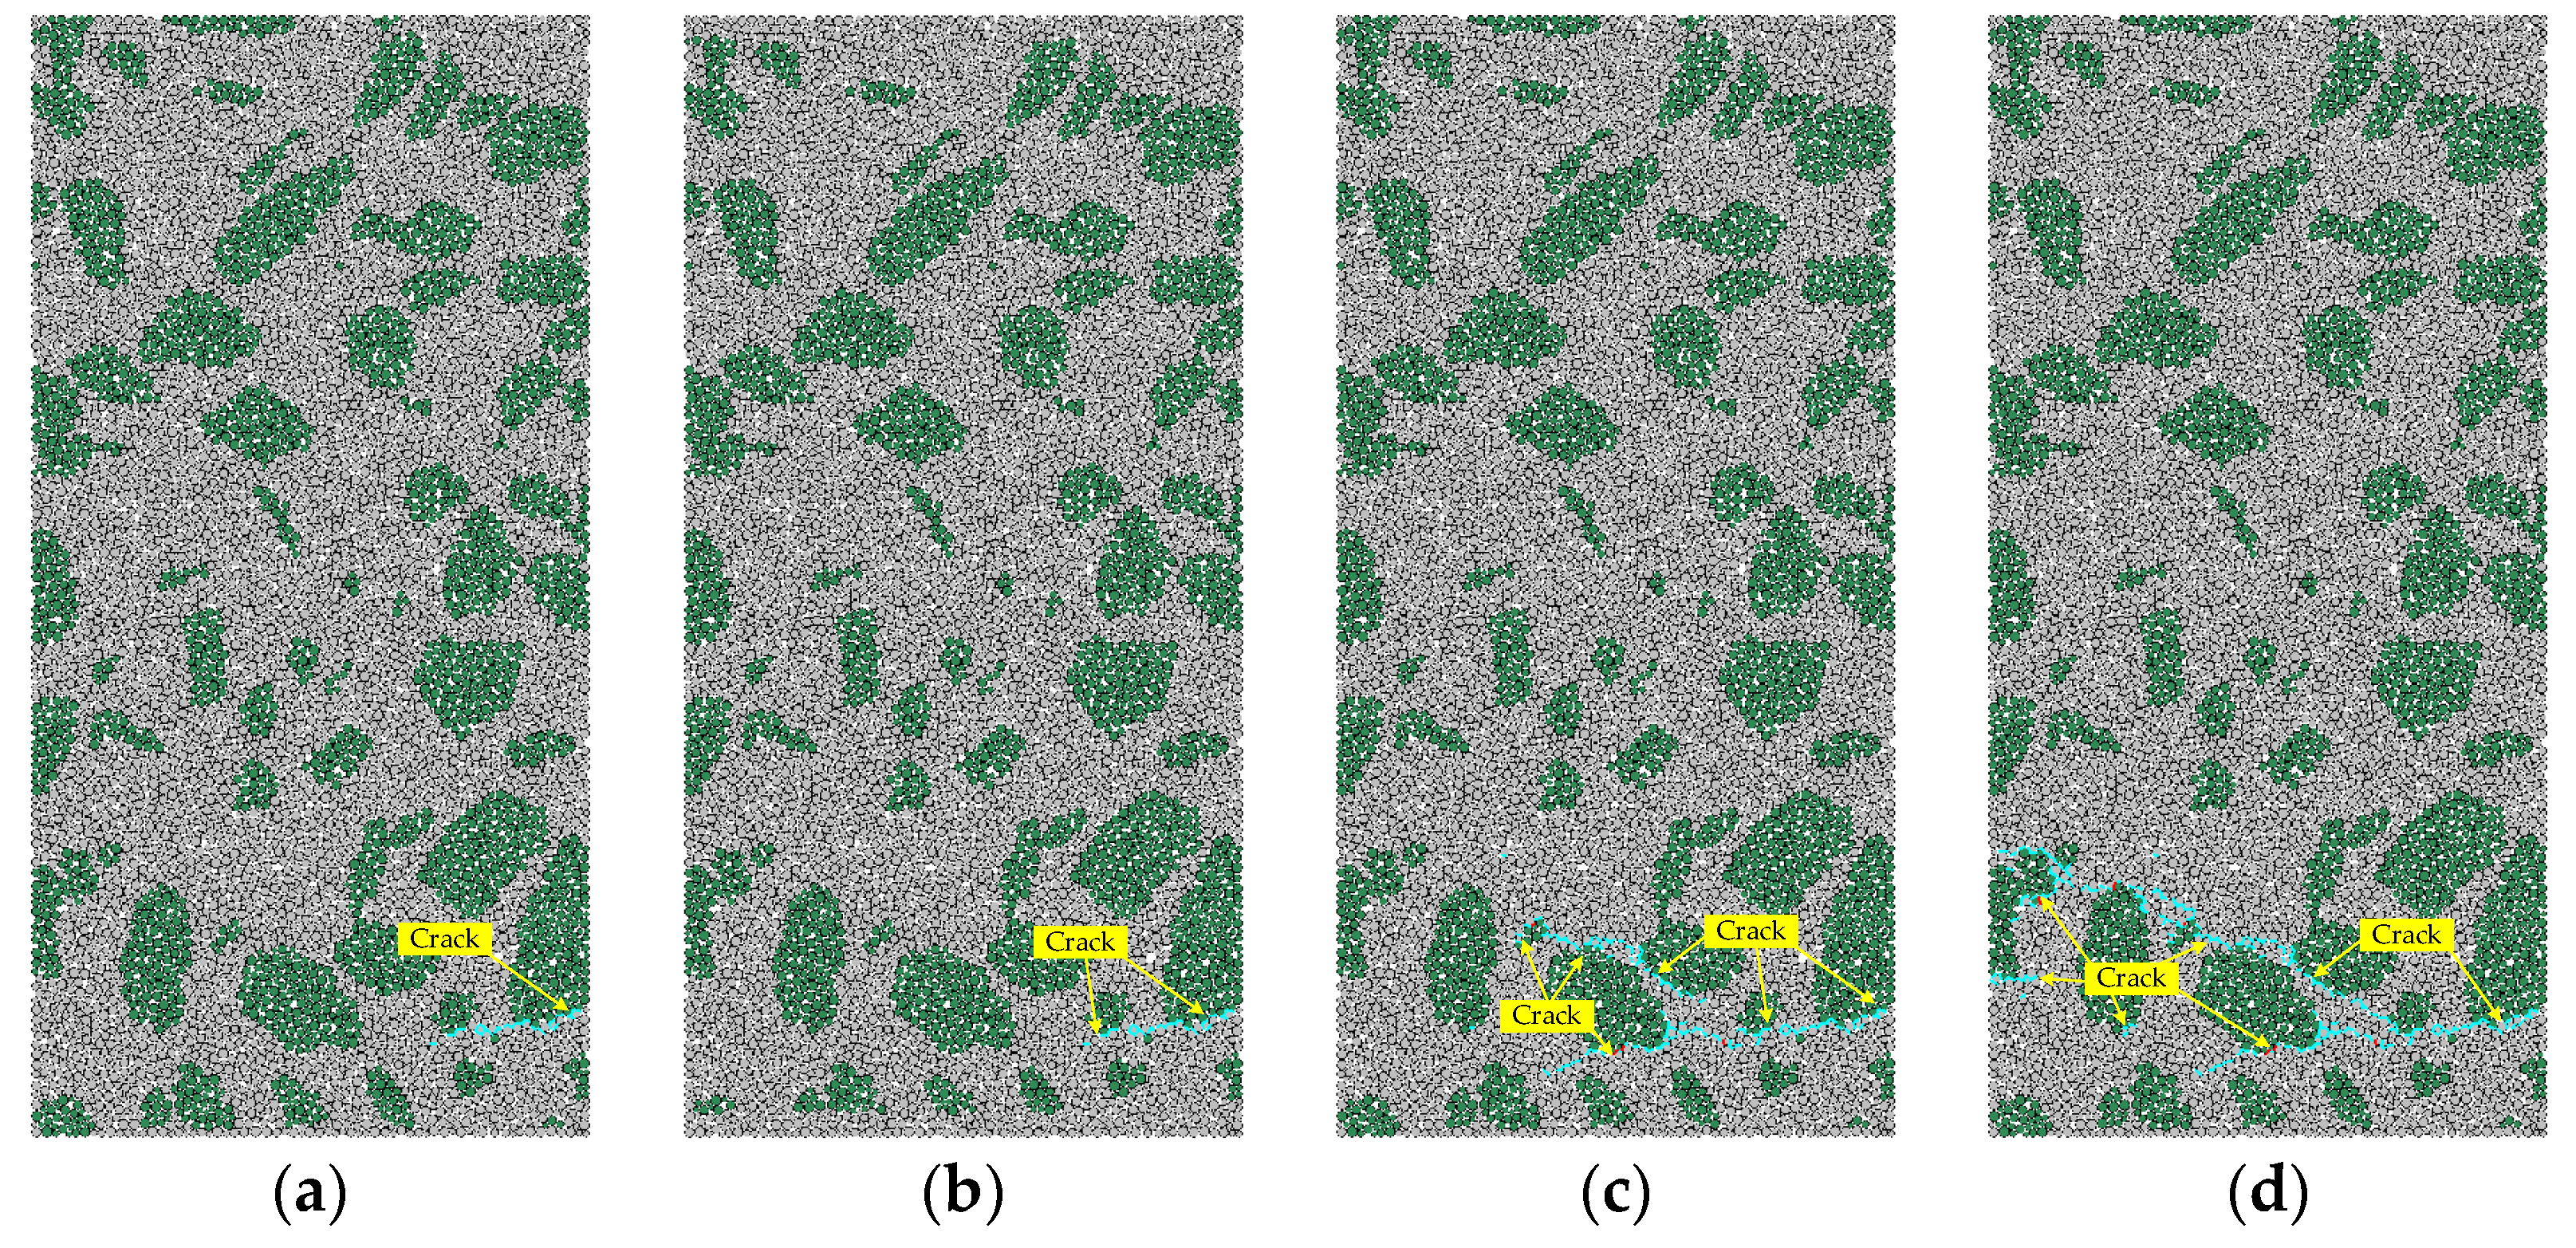
4.2. Development of Micro-Crack
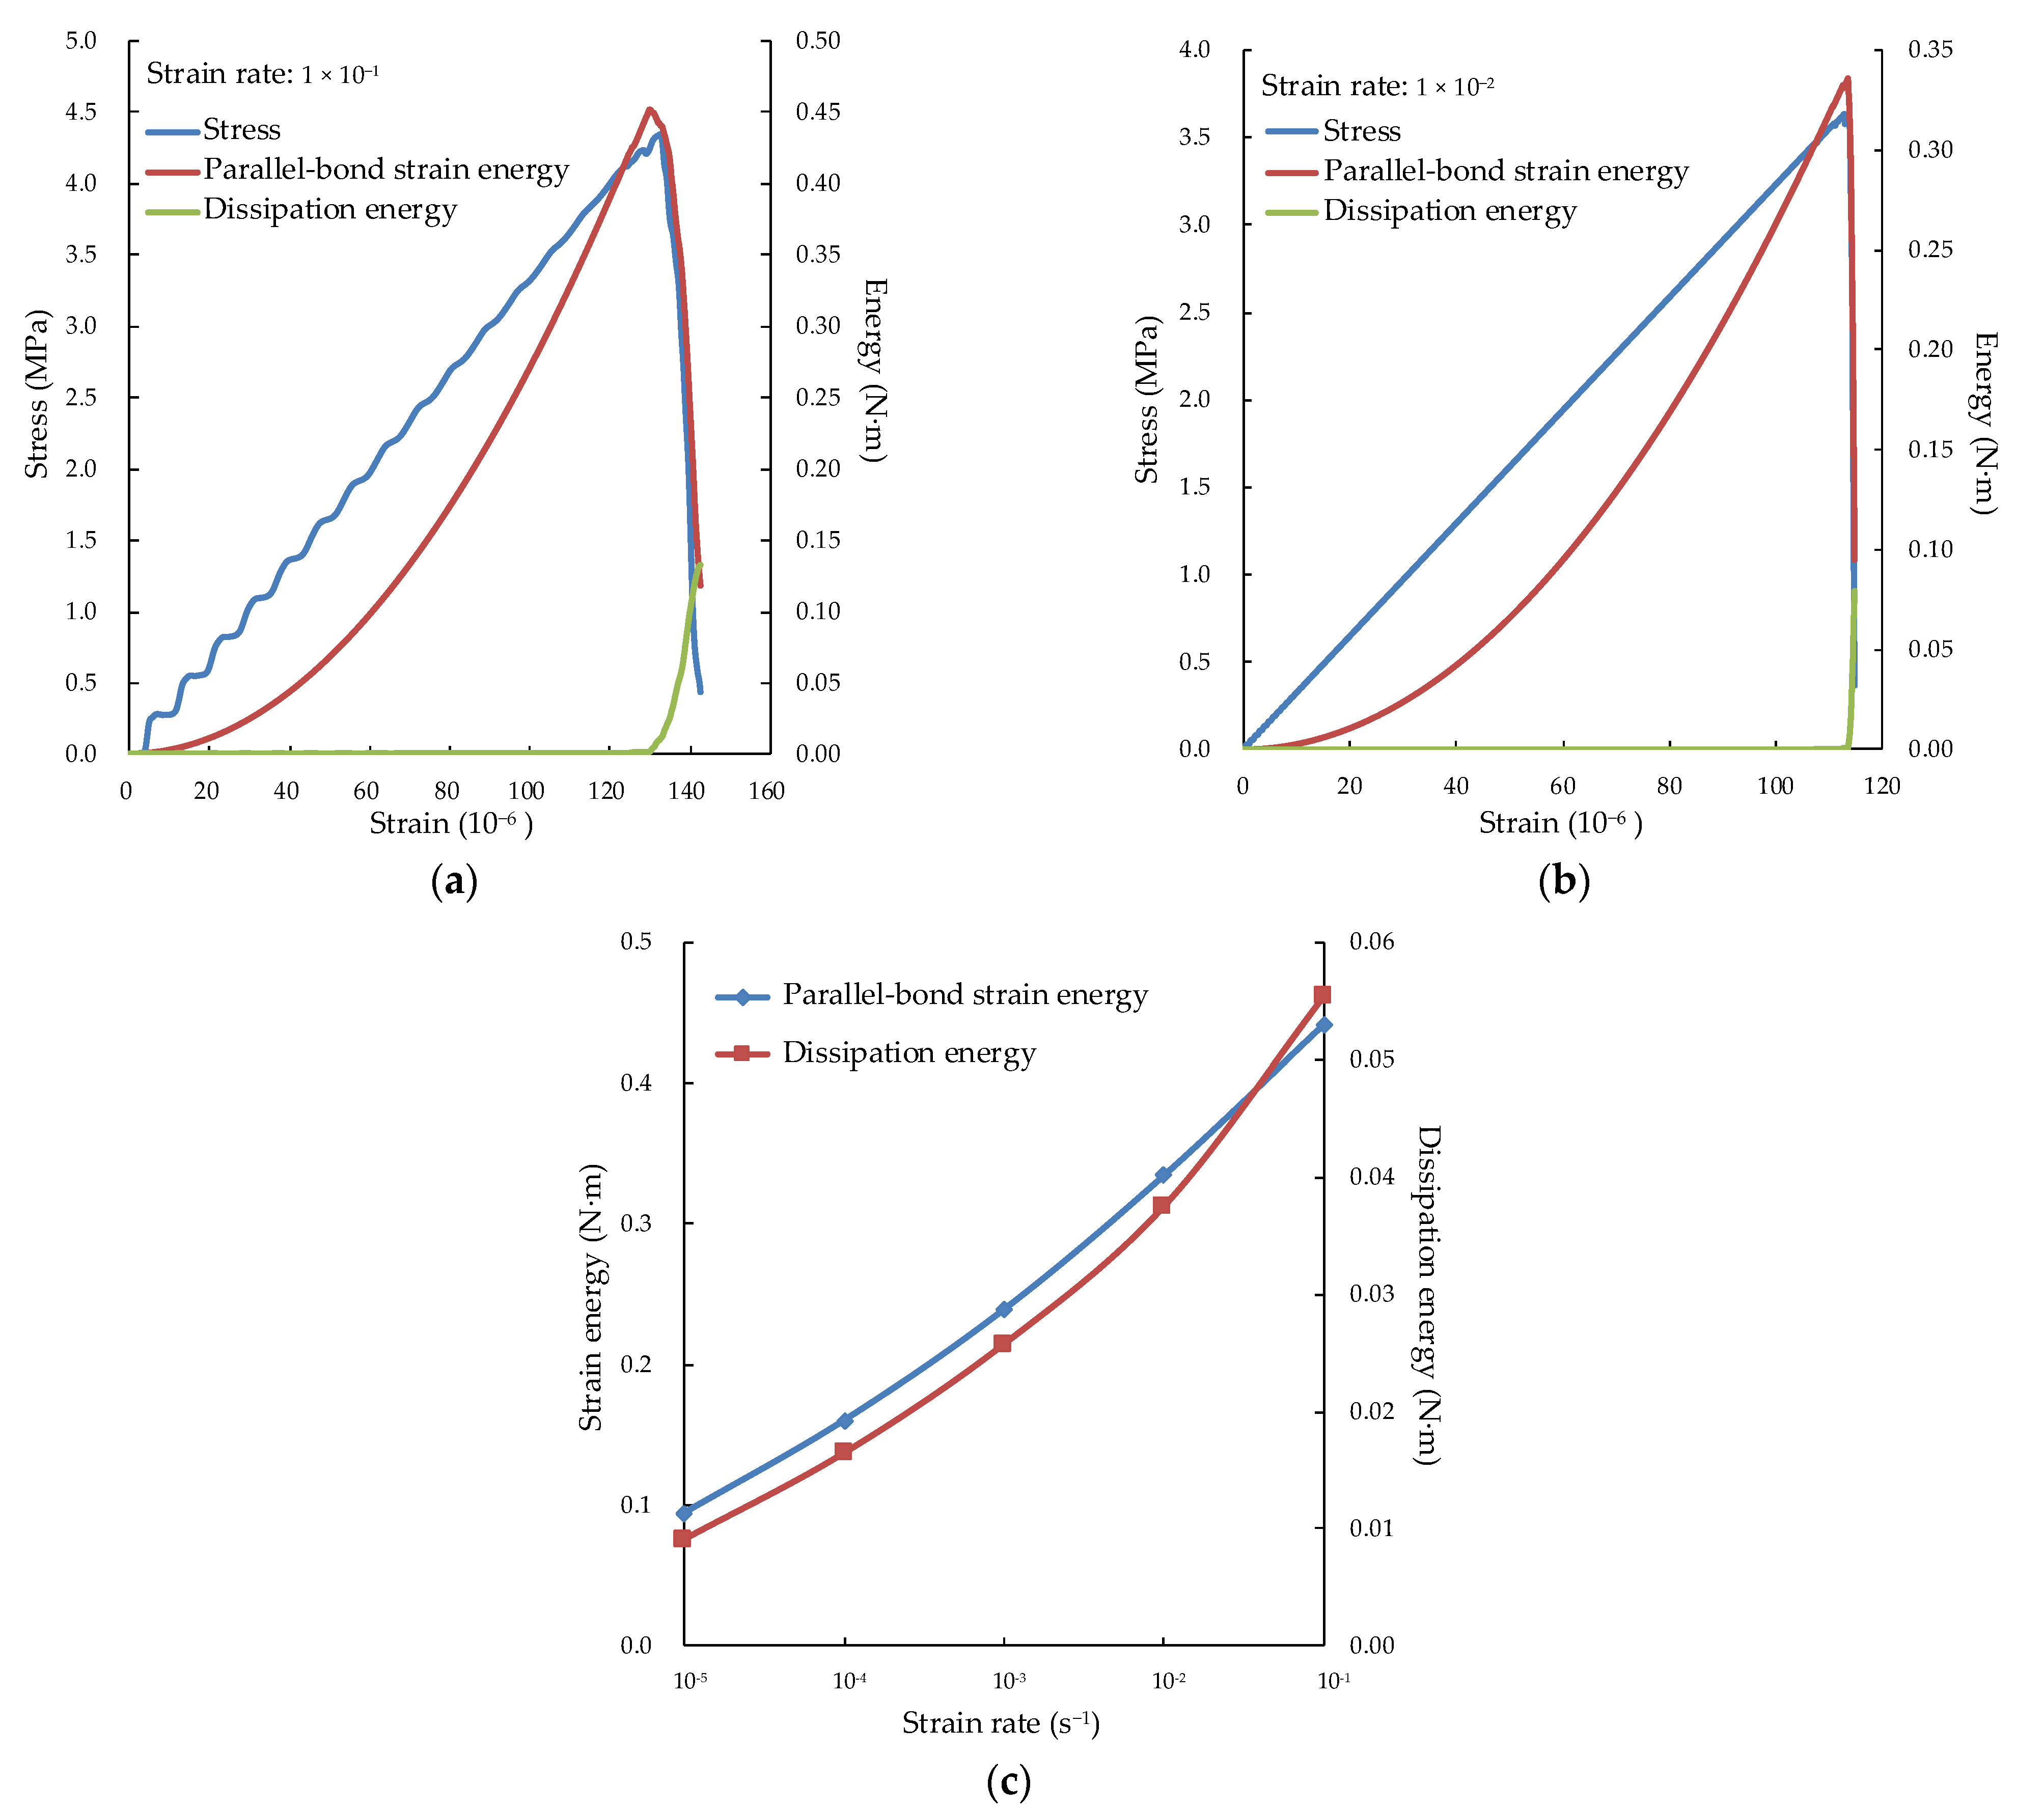
4.3. Evolution of Energy
5. Discussion
6. Conclusions
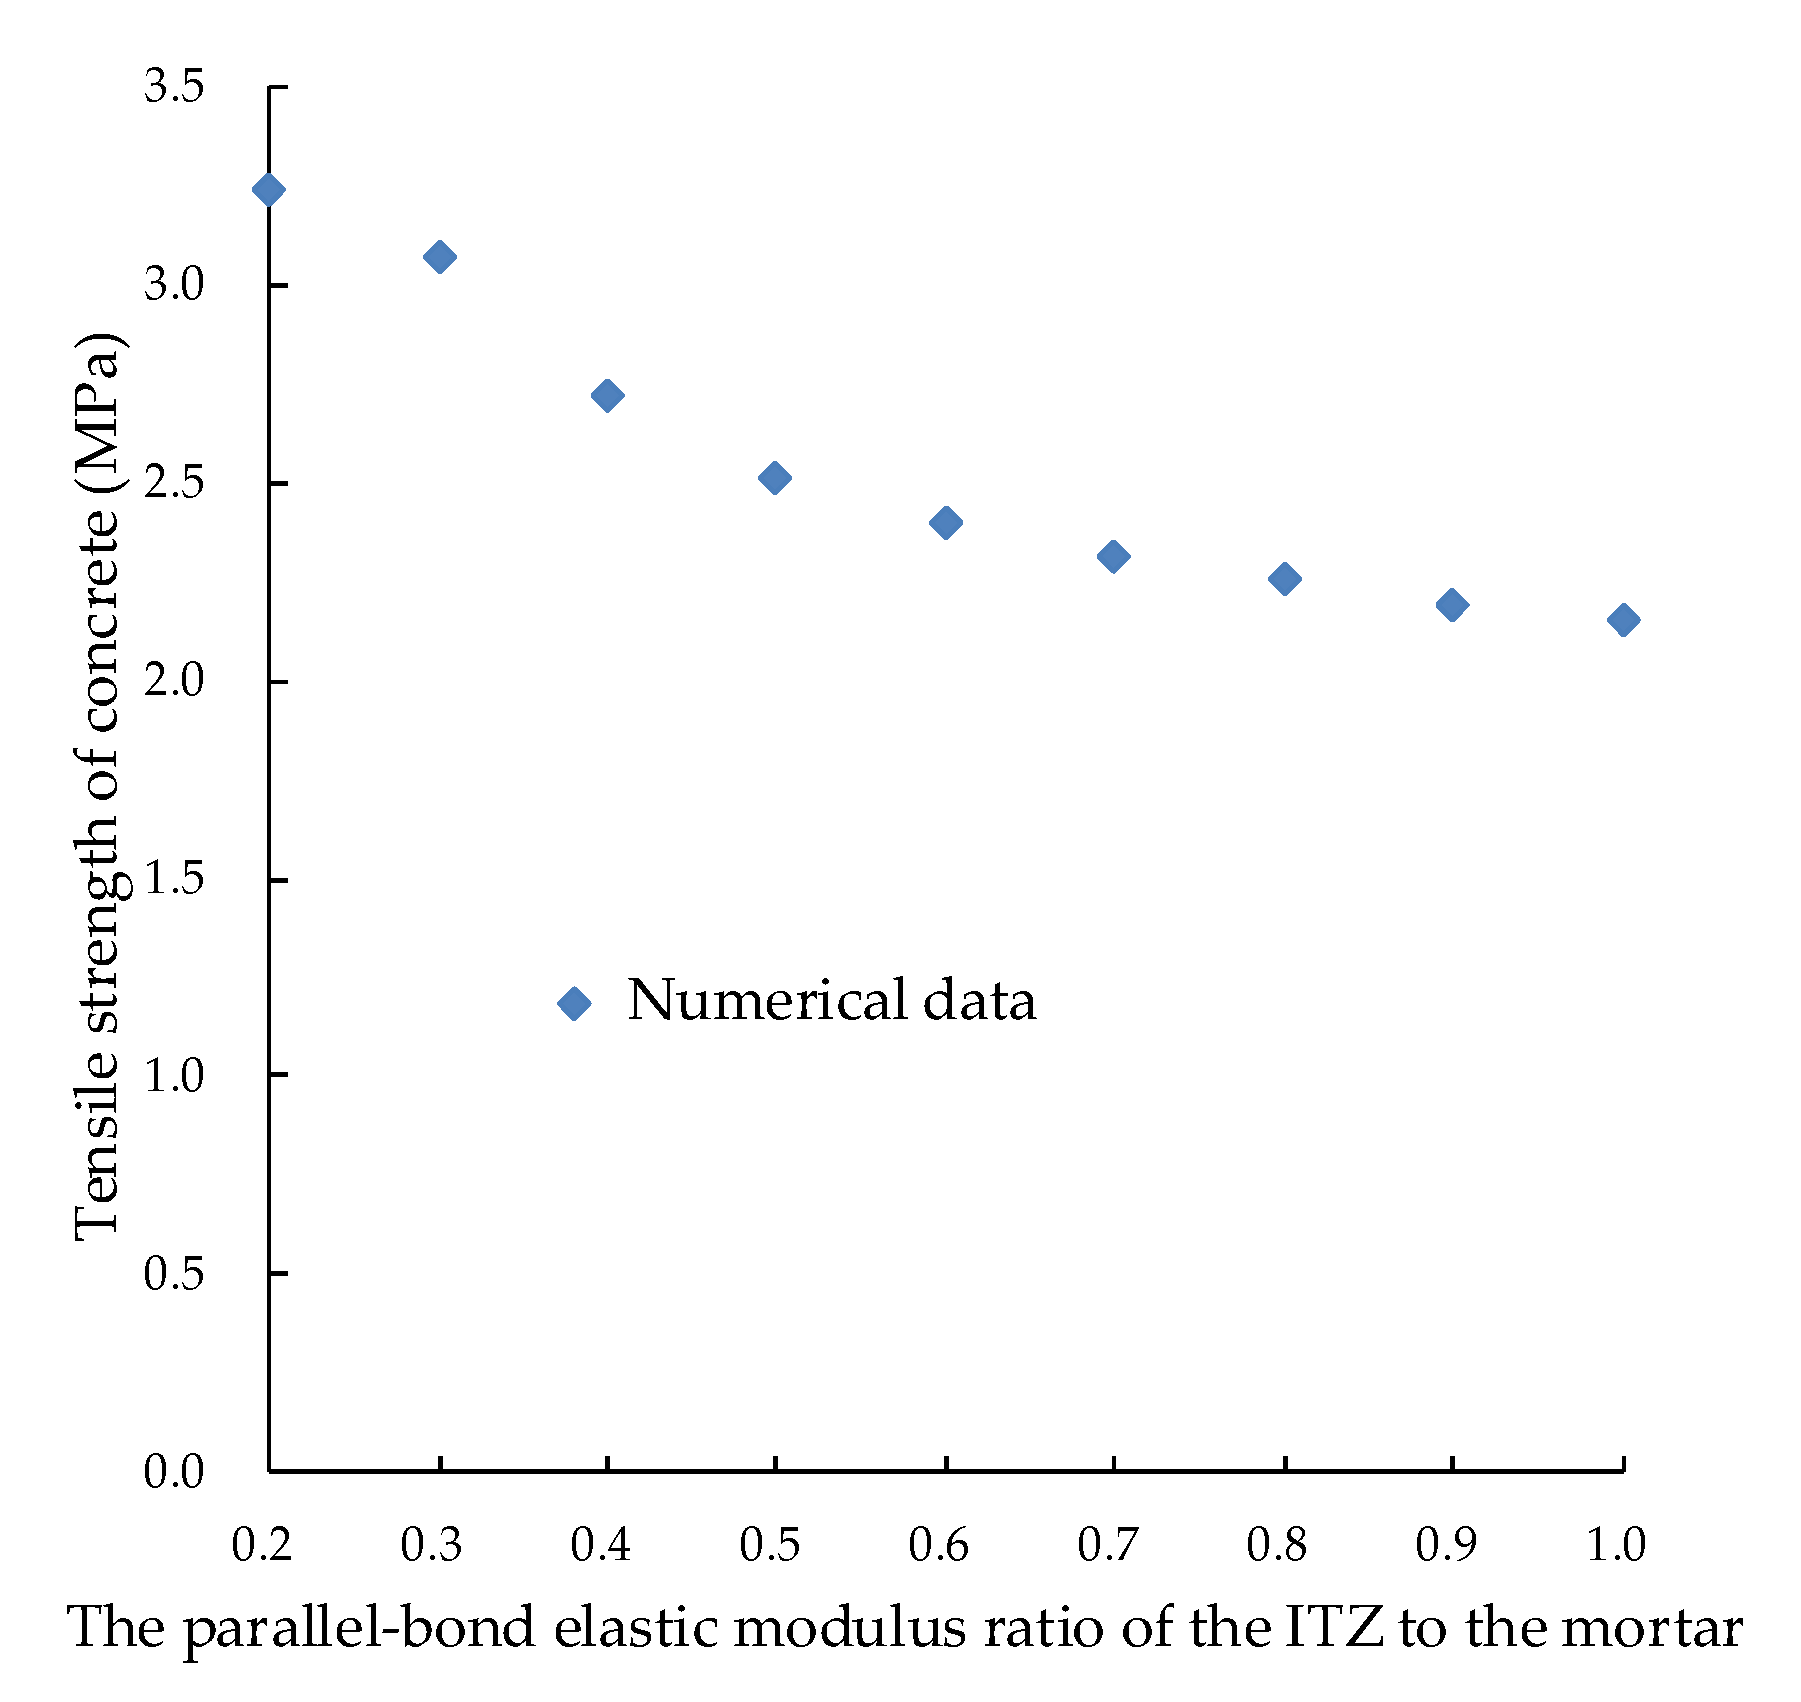
- According to the direct tension test, the strain rate sensitivity of the interface specimen is the strongest, and that of concrete specimen is the weakest. With the increase of strain rate, the influence of ITZ on concrete strength decreases, while the influence of mortar on concrete strength increases. At the same time, the peak stress and the elastic modulus of the specimens also increase.
- With the increase of strain rate, the tensile strength and elastic modulus of concrete specimens become larger and larger, and the role of ITZ becomes smaller and smaller when the strain rate is in the range of 10−5–10−1 s−1.
- The low tensile strength of the ITZ results in the initial failure of the ITZ in concrete, which reduces the tensile strength of concrete. The parallel bond strain energy and dissipated energy of specimens increase with the strain rate. When the strain rate is higher (greater than 1 × 10⁻²), the increase rate of dissipated energy is greater than that of the parallel bond strain energy.
Author Contributions
Funding
Institutional Review Board Statement
Informed Consent Statement
Data Availability Statement
Conflicts of Interest
References
- Aquino, M. Mechanical Properties of the Aggregate and Cement Interface. Adv. Cem. Based Mater. 1995, 2, 211–223. [Google Scholar] [CrossRef]
- Tasong, W.A.; Lynsdale, C.J.; Cripps, J.C. Aggregate-cement paste interface: Part I. Influence of aggregate geochemistry. Cem. Concr. Res. 1999, 29, 1019–1025. [Google Scholar] [CrossRef]
- Snozzi, L.; Caballero, A.; Molinari, J.F. Influence of the meso-structure in dynamic fracture simulation of concrete under tensile loading. Cem. Concr. Res. 2011, 41, 1130–1142. [Google Scholar] [CrossRef] [Green Version]
- Han, Z.; Li, D.; Li, X. Experimental study on the dynamic behavior of sandstone with coplanar elliptical flaws from macro, meso, and micro viewpoints. Theor. Appl. Fract. Mech. 2022, 120, 103400. [Google Scholar] [CrossRef]
- Torrence, C.E.; Trageser, J.E.; Jones, R.E.; Rimsza, J.M. Sensitivity of the strength and toughness of concrete to the properties of the interfacial transition zone. Constr. Build. Mater. 2022, 336, 126875. [Google Scholar] [CrossRef]
- Pan, J.; Shen, Y.; Yang, G.; Zhang, H.; Yang, H.; Zhou, Z. Debonding behaviors and micro-mechanism of the interface transition zone in sandstone-concrete interface in response to freeze-thaw conditions. Cold Reg. Sci. Technol. 2021, 191, 103359. [Google Scholar] [CrossRef]
- Feng, S.; Xiao, H.; Liu, R.; Dong, X.; Liu, Z.; Liu, H. The influence of different bond primers on the bond strength of concrete overlays and the microstructure of the overlays transition zone. Cem. Concr. Comp. 2021, 119, 104023. [Google Scholar] [CrossRef]
- Yang, X.; Shen, A.; Guo, Y.; Zhou, S.; He, T. Deterioration mechanism of interface transition zone of concrete pavement under fatigue load and freeze-thaw coupling in cold climatic areas. Constr. Build. Mater. 2018, 160, 588–597. [Google Scholar] [CrossRef]
- Rao, G.A.; Prasad, B. Influence of type of aggregate and surface roughness on the interface fracture properties. Mater. Struct. 2004, 37, 328–334. [Google Scholar] [CrossRef]
- Rao, G.A.; Prasad, B.K.R. Influence of the roughness of aggregate surface on the interface bond strength. Cem. Concr. Res. 2002, 32, 253–257. [Google Scholar] [CrossRef]
- Hong, L.; Gu, X.; Lin, F. Influence of aggregate surface roughness on mechanical properties of interface and concrete. Constr. Build. Mater. 2014, 65, 338–349. [Google Scholar] [CrossRef]
- Xie, Y.; Corr, D.J.; Jin, F.; Zhou, H.; Shah, S.P. Experimental study of the interfacial transition zone (ITZ) of model rock-filled concrete (RFC). Cem. Concr. Comp. 2015, 55, 223–231. [Google Scholar] [CrossRef]
- Liu, X.S.; Tan, Y.L.; Ning, J.G.; Lu, Y.W.; Gu, Q.H. Mechanical properties and damage constitutive model of coal in coal-rock combined body. Int. J. Rock Mech. Min. Sci. 2018, 110, 140–150. [Google Scholar] [CrossRef]
- Tan, Y.L.; Liu, X.S.; Shen, B.; Ning, J.G.; Gu, Q.H. New approaches to testing and evaluating the impact capability of coal seam with hard roof and/or floor in coal mines. Geomech. Eng. 2018, 14, 367–376. [Google Scholar]
- Li, M.; Hao, H.; Shi, Y.; Hao, Y. Specimen shape and size effects on the concrete compressive strength under static and dynamic tests. Constr. Build. Mater. 2018, 161, 84–93. [Google Scholar] [CrossRef]
- Ping, Y.; Sun, B.; Zhu, Z.; Jiang, Z.; He, Y. Study on Shear Strength of Cement Face Between Rock and Concrete. Geotech. Geol. Eng. 2021, 39, 3829–3841. [Google Scholar] [CrossRef]
- Wu, N.; Zhu, Z.; He, Z. Experimental Study on the Tensile Properties of Rock-Mortar Interface under Different Strain Rates. Adv. Mater. Sci. Eng. 2018, 2018, 5241848. [Google Scholar] [CrossRef] [Green Version]
- Chen, M.; Zang, C.W.; Ding, Z.W.; Zhou, G.L.; Jiang, B.Y.; Zhang, G.C.; Zhang, C.P. Effects of confining pressure on deformation failure behavior of jointed rock. J. Cent. South Univ. 2022, 29, 1305–1319. [Google Scholar] [CrossRef]
- Chen, M.; Yang, S.; Pathegama Gamage, R.; Yang, W.; Yin, P.; Zhang, Y.; Zhang, Q. Fracture processes of rock-Like specimens containing nonpersistent fissures under uniaxial compression. Energies 2019, 12, 79. [Google Scholar] [CrossRef] [Green Version]
- Zhang, L.; Zhang, Y.; Liu, C.; Liu, L.; Tang, K. Study on microstructure and bond strength of interfacial transition zone between cement paste and high-performance lightweight aggregates prepared from ferrochromium slag. Constr. Build. Mater. 2017, 142, 31–41. [Google Scholar] [CrossRef]
- Jebli, M.; Jamin, F.; Malachanne, E.; Garcia-Diaz, E.; El Youssoufi, M.S. Experimental characterization of mechanical properties of the cement-aggregate interface in concrete. Constr. Build. Mater. 2018, 161, 16–25. [Google Scholar] [CrossRef] [Green Version]
- Xi, X.; Yin, Z.; Yang, S.; Li, C. Using artificial neural network to predict the fracture properties of the interfacial transition zone of concrete at the meso-scale. Eng. Fract. Mech. 2021, 242, 107488. [Google Scholar] [CrossRef]
- Wu, K.; Luo, S.; Zheng, J.; Yan, J.; Xiao, J. Influence of carbonation treatment on the properties of multiple interface transition zones and recycled aggregate concrete. Cem. Concr. Comp. 2022, 127, 104402. [Google Scholar] [CrossRef]
- Song, H.; Yao, J.; Xiang, J. The role of aggregate and cement paste in the deterioration of the transitional interface zone of pervious concrete during freeze-thaw cycles. Case Stud. Constr. Mat. 2022, 16, e01086. [Google Scholar] [CrossRef]
- Ramaniraka, M.; Rakotonarivo, S.; Payan, C.; Garnier, V. Effect of the interfacial transition zone on ultrasonic wave attenuation and velocity in concrete. Cem. Concr. Res. 2019, 124, 105809. [Google Scholar] [CrossRef]
- Königsberger, M.; Hlobil, M.; Delsaute, B.; Staquet, S.; Hellmich, C.; Pichler, B. Hydrate failure in ITZ governs concrete strength: A micro-to-macro validated engineering mechanics model. Cem. Concr. Res. 2018, 103, 77–94. [Google Scholar] [CrossRef]
- Trawiński, W.; Bobiński, J.; Tejchman, J. Two-dimensional simulations of concrete fracture at aggregate level with cohesive elements based on X-ray μCT images. Eng. Fract. Mech. 2016, 168, 204–226. [Google Scholar] [CrossRef]
- Skarżyński, Ł.; Nitka, M.; Tejchman, J. Modelling of concrete fracture at aggregate level using FEM and DEM based on X-ray μCT images of internal structure. Eng. Fract. Mech. 2015, 147, 13–35. [Google Scholar] [CrossRef]
- Zhou, X.; Xie, Y.; Long, G.; Zeng, X.; Li, J.; Yao, L.; Jiang, W.; Pan, Z. DEM analysis of the effect of interface transition zone on dynamic splitting tensile behavior of high-strength concrete based on multi-phase model. Cem. Concr. Res. 2021, 149, 106577. [Google Scholar] [CrossRef]
- Zhou, X.; Xie, Y.; Long, G.; Li, J. Effect of surface characteristics of aggregates on the compressive damage of high-strength concrete based on 3D discrete element method. Constr. Build. Mater. 2021, 301, 124101. [Google Scholar] [CrossRef]
- Zhao, H.; Wu, Z.; Liu, A.; Zhang, L. Numerical insights into the effect of ITZ and aggregate strength on concrete properties. Theor. Appl. Fract. Mech. 2022, 120, 103415. [Google Scholar] [CrossRef]
- Cundall, P.A.; Strack, O.D.L. A discrete numerical model for granular assemblies. Geotechnique 1979, 29, 47–65. [Google Scholar] [CrossRef]
- Zhang, S.; Zhang, C.; Liao, L.; Wang, C. Numerical study of the effect of ITZ on the failure behaviour of concrete by using particle element modelling. Constr. Build. Mater. 2018, 170, 776–789. [Google Scholar] [CrossRef]
- Gong, J.; Nie, Z.; Zhu, Y.; Liang, Z.; Wang, X. Exploring the effects of particle shape and content of fines on the shear behavior of sand-fines mixtures via the DEM. Comput. Struct. 2019, 106, 161–176. [Google Scholar] [CrossRef]
- Nie, Z.; Wang, X.; Liang, Z.; Gong, J. Quantitative analysis of the three-dimensional roundness of granular particles. Powder Technol. 2018, 336, 584–593. [Google Scholar] [CrossRef]
- Wang, X.; Liang, Z.; Nie, Z.; Gong, J. Stochastic numerical model of stone-based materials with realistic stone-inclusion features. Constr. Build. Mater. 2019, 197, 830–848. [Google Scholar] [CrossRef]
- Zhang, J.; Li, J.; Yao, Y.; Zheng, J.; Gu, F. Geometric anisotropy modeling and shear behavior evaluation of graded crushed rocks. Constr. Build. Mater. 2018, 183, 346–355. [Google Scholar] [CrossRef]
- Sun, B.; Chen, R.; Ping, Y.; Zhu, Z.; Wu, N.; He, Y. Dynamic Response of Rock-like Materials Based on SHPB Pulse Waveform Characteristics. Materials 2022, 15, 210. [Google Scholar] [CrossRef]
- Liu, B.; Gao, Y.; Jin, A.; Wang, X. Influence of water loss on mechanical properties of superfine tailing–blast-furnace slag backfill. Constr. Build. Mater. 2020, 246, 118482. [Google Scholar] [CrossRef]
- Qiu, J.; Li, D.; Li, X.; Zhou, Z. Dynamic Fracturing Behavior of Layered Rock with Different Inclination Angles in SHPB Tests. Shock Vib. 2017, 2017, 7687802. [Google Scholar] [CrossRef] [Green Version]
- Wu, S.; Chen, X.; Zhou, J. Tensile strength of concrete under static and intermediate strain rates: Correlated results from different testing methods. Nucl. Eng. Des. 2012, 250, 173–183. [Google Scholar] [CrossRef]
- Wu, S.; Chen, X.; Zhou, J. Influence of strain rate and water content on mechanical behavior of dam concrete. Constr. Build. Mater. 2012, 36, 448–457. [Google Scholar] [CrossRef]
- Lu, D.; Wang, G.; Du, X.; Wang, Y. A nonlinear dynamic uniaxial strength criterion that considers the ultimate dynamic strength of concrete. Int. J. Impact Eng. 2017, 103, 124–137. [Google Scholar] [CrossRef]
- Luo, Z.; Li, X.; Zhao, F. Complete splitting process of steel fiber reinforced concrete at intermediate strain rate. J. Cent. South Univ. Technol. 2008, 15, 569–573. [Google Scholar] [CrossRef]
- Cho, N.; Martin, C.D.; Sego, D.C. A clumped particle model for rock. Int. J. Rock Mech. Min. 2007, 44, 997–1010. [Google Scholar] [CrossRef]
- Yang, S.; Tian, W.; Huang, Y.; Ranjith, P.G.; Ju, Y. An Experimental and Numerical Study on Cracking Behavior of Brittle Sandstone Containing Two Non-coplanar Fissures Under Uniaxial Compression. Rock Mech. Rock Eng. 2016, 49, 1497–1515. [Google Scholar] [CrossRef]
- Itasca Consulting Group, Inc. PFC2D/3D (Particle Flow Code in 2/3 Dimensions); Version 5.0 [Documentation]; ICG: Minneapolis, MN, USA, 2016. [Google Scholar]
- Potyondy, D.O.; Cundall, P.A. A bonded-particle model for rock. Int. J. Rock Mech Min. 2004, 41, 1329–1364. [Google Scholar] [CrossRef]
- Masson, S.; Martinez, J. Micromechanical Analysis of the Shear Behavior of a Granular Material. J. Eng. Mech. 2001, 127, 1007–1016. [Google Scholar] [CrossRef]
- Mishra, B.K.; Murty, C.V.R. On the determination of contact parameters for realistic DEM simulations of ball mills. Powder Technol. 2001, 115, 290–297. [Google Scholar] [CrossRef]
- Masson, S.; Martinez, J. Effect of particle mechanical properties on silo flow and stresses from distinct element simulations. Powder Technol. 2000, 109, 164–178. [Google Scholar] [CrossRef]
- Qin, C.; Zhang, C. Numerical study of dynamic behavior of concrete by meso-scale particle element modeling. Int. J. Impact Eng. 2011, 38, 1011–1021. [Google Scholar] [CrossRef]


| Specimen | Number | Loading Rate (m/s) | Strain Rate (s−1) | Average Strain Rate (s−1) | Tensile Strength (MPa) | Average Tensile Strength (MPa) | Strain at Peak Strength (10−6) | Elastic Modulus (GPa) |
|---|---|---|---|---|---|---|---|---|
| Mortar | M4-1 | 1.00 × 10⁻⁴ | 9.49 × 10⁻⁵ | 8.60 × 10⁻⁵ | 4.45 | 3.19 | 189.1 | 24.44 |
| M4-2 | 6.60 × 10⁻⁵ | 2.03 | 103.8 | 21.44 | ||||
| M4-3 | 9.72 × 10⁻⁵ | 3.08 | 150.4 | 23.53 | ||||
| M5-1 | 1.00 × 10⁻⁵ | 8.62 × 10⁻⁶ | 9.06 × 10⁻⁶ | 2.13 | 2.84 | 101.6 | 21.9 | |
| M5-2 | 1.00 × 10⁻⁵ | 3.82 | 180.2 | 22.34 | ||||
| M5-3 | 8.56 × 10⁻⁶ | 2.56 | 123.7 | 23.02 | ||||
| M6-1 | 1.00 × 10⁻⁶ | 8.92 × 10⁻⁷ | 8.46 × 10⁻⁷ | 2.09 | 2.19 | 100.9 | 23.53 | |
| M6-2 | 8.54 × 10⁻⁷ | 2.35 | 113.2 | 22.99 | ||||
| M6-3 | 7.93 × 10⁻⁷ | 2.14 | 111.3 | 21.78 | ||||
| Interface | I4-1 | 1.0 × 10⁻⁴ | 4.63 × 10⁻⁵ | 4.66 × 10⁻⁵ | 3.10 | 2.13 | 90.9 | 44.72 |
| I4-2 | 3.63 × 10⁻⁵ | 1.18 | 50.5 | 37.36 | ||||
| I4-3 | 5.73 × 10⁻⁵ | 2.11 | 62.7 | 37.25 | ||||
| I5-1 | 1.0 × 10⁻⁵ | 6.95 × 10⁻⁶ | 5.90 × 10⁻⁶ | 1.56 | 1.37 | 46.5 | 34.12 | |
| I5-2 | 5.71 × 10⁻⁶ | 1.19 | 40.1 | 31.68 | ||||
| I5-3 | 5.03 × 10⁻⁶ | 1.35 | 50.6 | 30.40 | ||||
| I6-1 | 1.0 × 10⁻⁶ | 6.35 × 10⁻⁷ | 6.10 × 10⁻⁷ | 1.08 | 1.01 | 35.7 | 31.77 | |
| I6-2 | 7.26 × 10⁻⁷ | 1.27 | 43.2 | 36.61 | ||||
| I6-3 | 4.70 × 10⁻⁷ | 0.67 | 25.5 | 38.68 | ||||
| Concrete | C3-1 | 1.0 × 10⁻³ | 5.70 × 10⁻⁴ | 6.17 × 10⁻⁴ | 3.22 | 3.34 | 104.26 | 35.1 |
| C3-2 | 6.30 × 10⁻⁴ | 3.35 | 105.22 | 34.3 | ||||
| C3-3 | 6.50 × 10⁻⁴ | 3.46 | 111.28 | 33.1 | ||||
| C4-1 | 1.0 × 10⁻⁴ | 5.80 × 10⁻⁵ | 6.23 × 10⁻⁵ | 2.28 | 2.59 | 77.98 | 30.2 | |
| C4-2 | 6.40 × 10⁻⁵ | 2.84 | 80.13 | 30.1 | ||||
| C4-3 | 6.50 × 10⁻⁵ | 2.64 | 96.25 | 29.9 | ||||
| C5-1 | 1.0 × 10⁻⁵ | 5.50 × 10⁻⁶ | 7.08 × 10⁻⁶ | 2.24 | 2.34 | 88.61 | 36.5 | |
| C5-2 | 5.65 × 10⁻⁶ | 2.03 | 87.77 | 33.7 | ||||
| C5-3 | 1.01 × 10⁻⁵ | 2.76 | 102.27 | 30.9 |
| Strain Rate (s−1) | Macro Strength of Mortar (MPa) | Meso Cohesion of Interface (MPa) | Elastic Modulus of Mortar (GPa) | |||
|---|---|---|---|---|---|---|
| Macro | Meso | Macro | Meso | Macro | Meso | |
| 1 × 10⁻⁵ | 2.76 | 5.95 | 1.67 | 3.6 | 22.84 | 31.94 |
| 1 × 10⁻⁴ | 3.28 | 7.07 | 2.22 | 4.78 | 23.7 | 33.11 |
| 1 × 10⁻³ | 3.8 | 8.19 | 2.76 | 5.95 | 24.57 | 34.29 |
| 1 × 10⁻² | 4.31 | 9.31 | 3.3 | 7.12 | 25.43 | 35.46 |
| 1 × 10⁻¹ | 4.83 | 10.43 | 3.84 | 8.29 | 26.30 | 36.64 |
| Strain Rate (s−1) | Tensile Strength (MPa) | Elastic Modulus (GPa) | ||||||
|---|---|---|---|---|---|---|---|---|
| Fitting Value | Numerical Value | Root Mean Square Error | Margin of Deviation | Fitting Value | Numerical Value | Root Mean Square Error | Margin of Deviation | |
| 1 × 10⁻⁵ | 1.95 | 1.84 | 0.11 | 0.19 | 29.33 | 29.45 | 0.12 | 0.29 |
| 1 × 10⁻⁴ | 2.41 | 2.44 | 0.03 | 0.24 | 30.47 | 30.53 | 0.05 | 0.30 |
| 1 × 10⁻³ | 2.88 | 3.03 | 0.15 | 0.28 | 31.62 | 31.47 | 0.15 | 0.31 |
| 1 × 10⁻² | 3.34 | 3.64 | 0.30 | 0.33 | 32.76 | 32.67 | 0.10 | 0.32 |
| 1 × 10⁻¹ | 3.81 | 4.35 | 0.54 | 0.38 | 33.91 | 33.66 | 0.25 | 0.33 |
Publisher’s Note: MDPI stays neutral with regard to jurisdictional claims in published maps and institutional affiliations. |
© 2022 by the authors. Licensee MDPI, Basel, Switzerland. This article is an open access article distributed under the terms and conditions of the Creative Commons Attribution (CC BY) license (https://creativecommons.org/licenses/by/4.0/).
Share and Cite
Sun, B.; Chen, R.; Ping, Y.; Zhu, Z.; Wu, N. Study on Axial Tensile Strain Rate Effect on Concrete Based on Experimental Investigation and Numerical Simulation. Materials 2022, 15, 5164. https://doi.org/10.3390/ma15155164
Sun B, Chen R, Ping Y, Zhu Z, Wu N. Study on Axial Tensile Strain Rate Effect on Concrete Based on Experimental Investigation and Numerical Simulation. Materials. 2022; 15(15):5164. https://doi.org/10.3390/ma15155164
Chicago/Turabian StyleSun, Bi, Rui Chen, Yang Ping, Zhende Zhu, and Nan Wu. 2022. "Study on Axial Tensile Strain Rate Effect on Concrete Based on Experimental Investigation and Numerical Simulation" Materials 15, no. 15: 5164. https://doi.org/10.3390/ma15155164