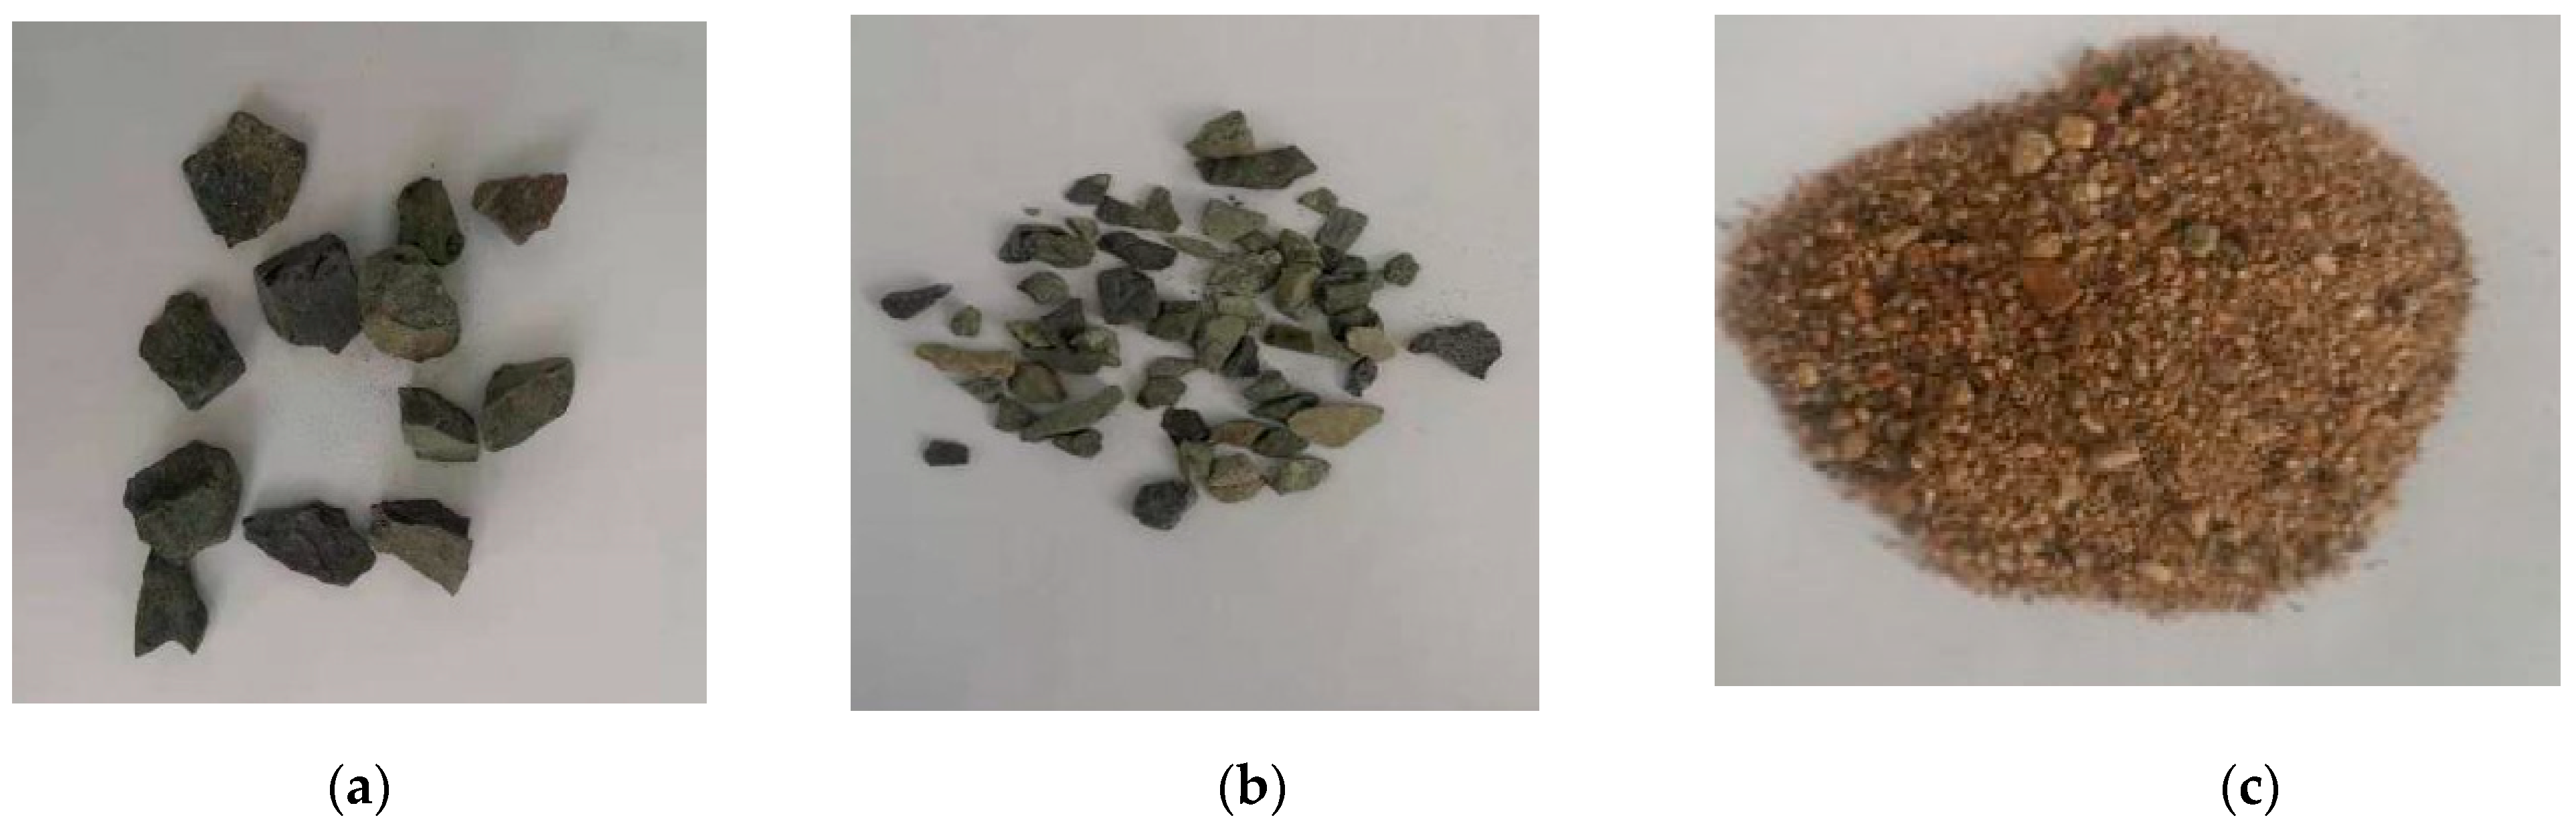
3.1. Microscopic Morphological Analysis
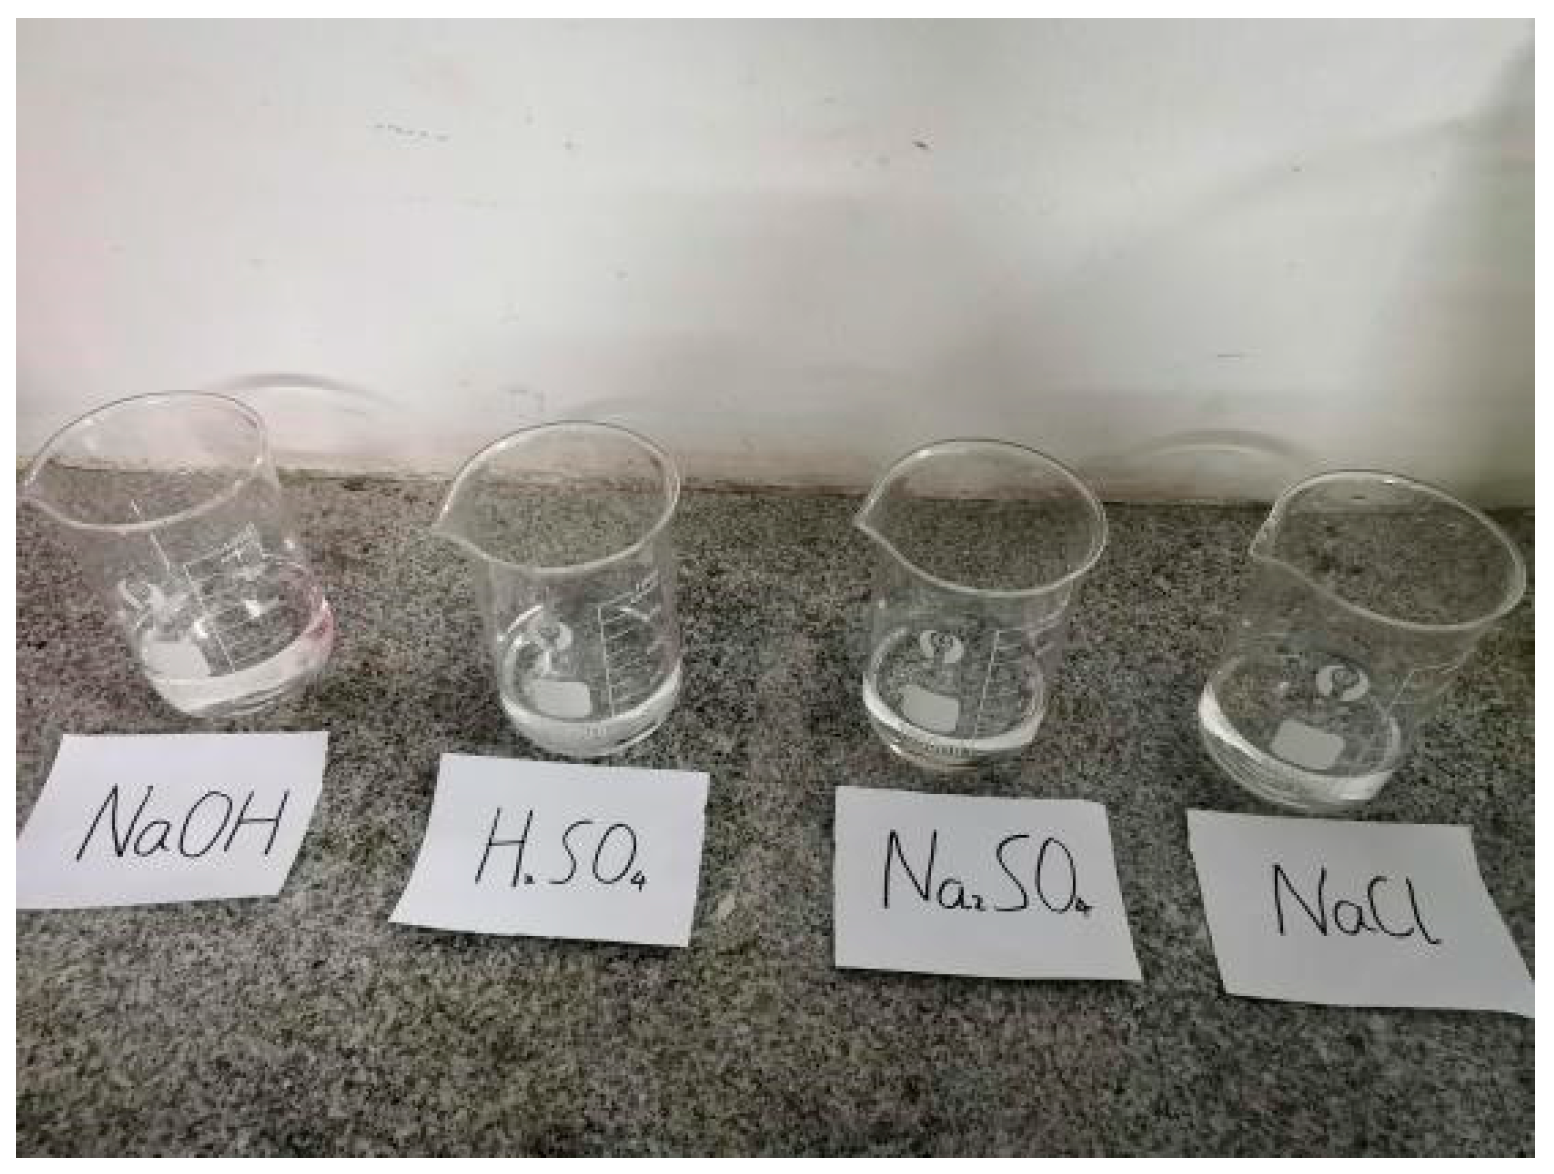
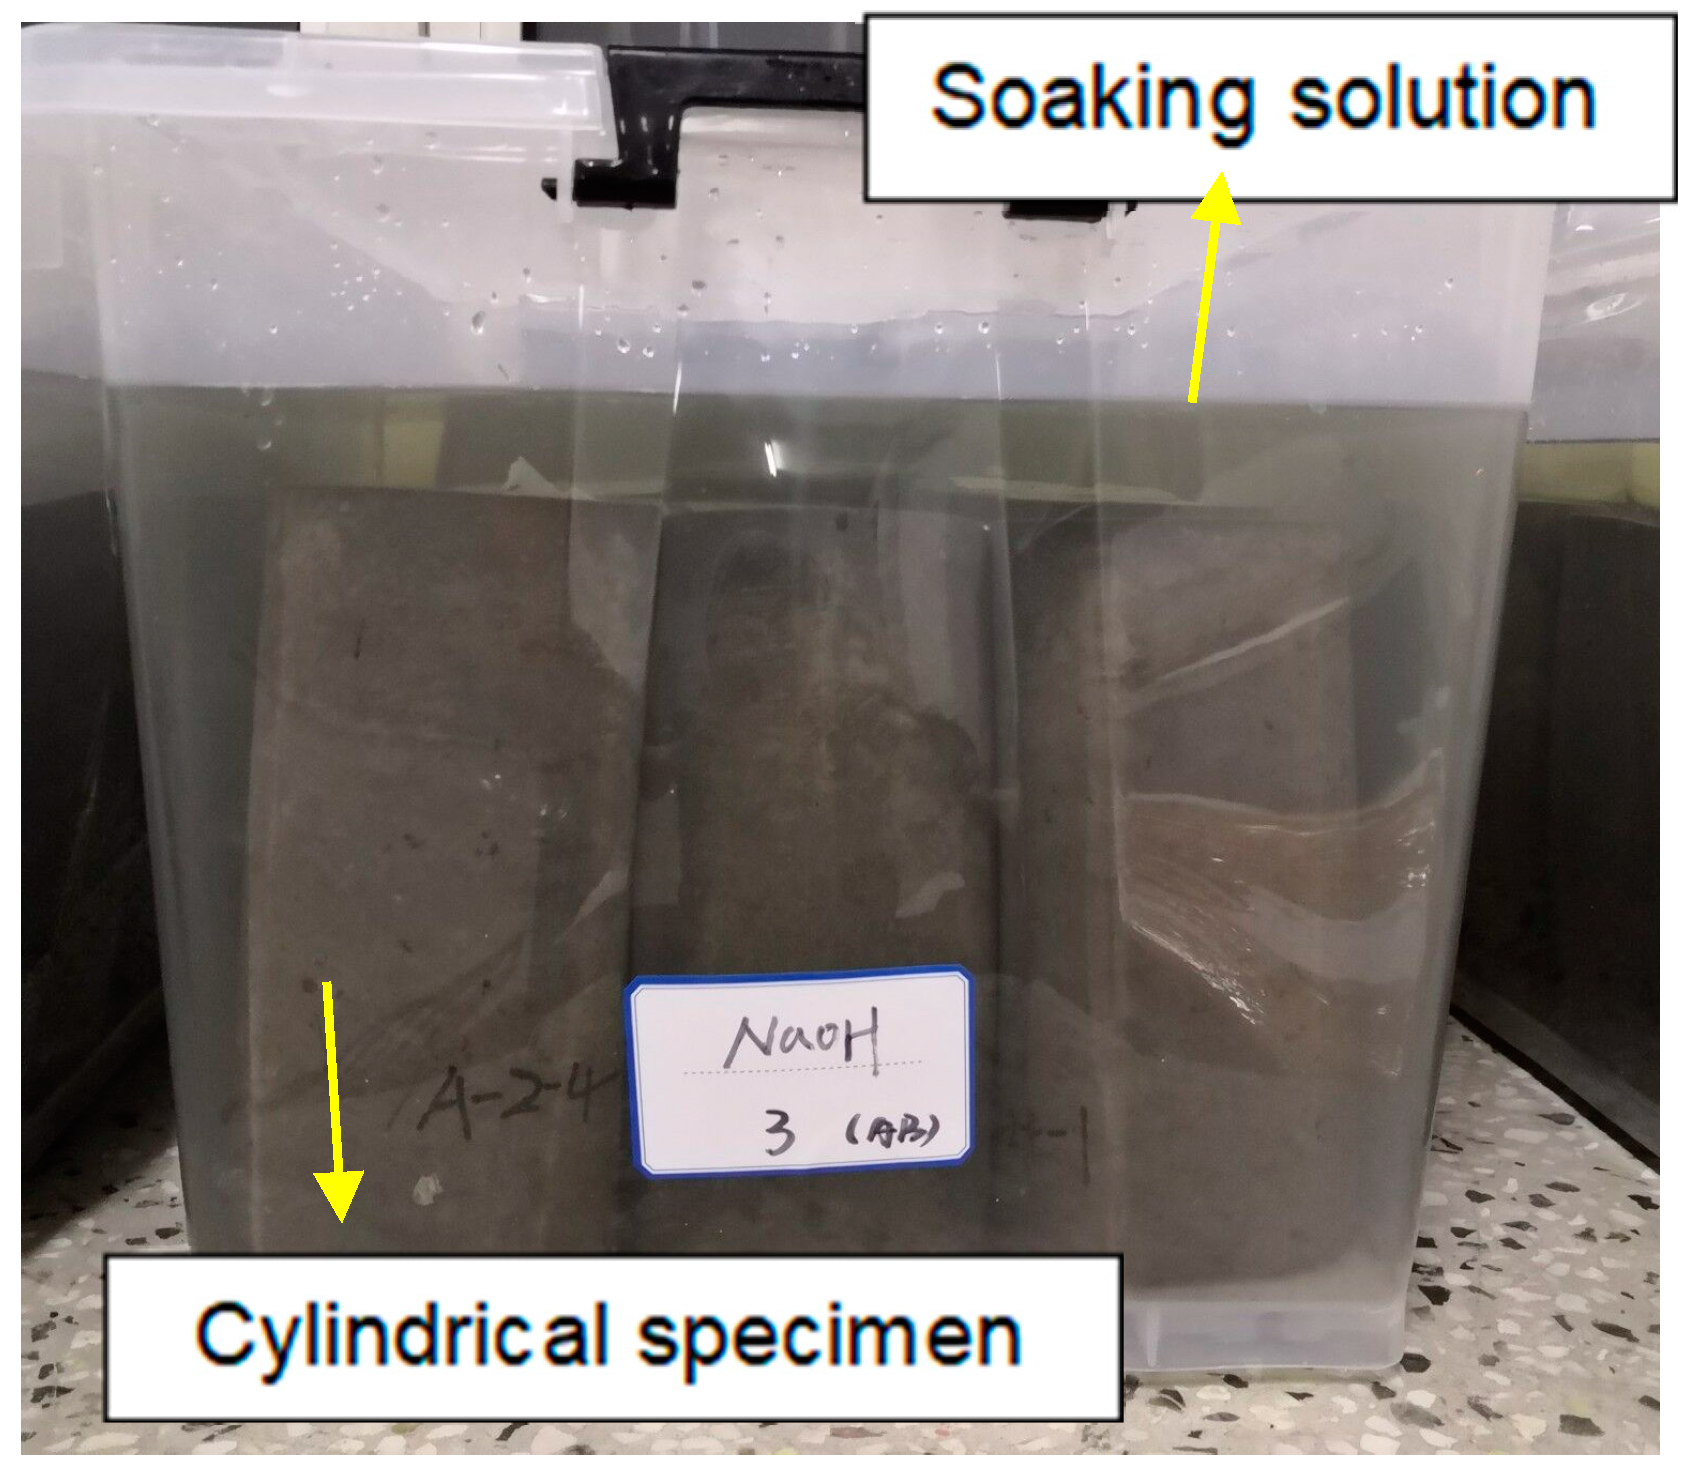
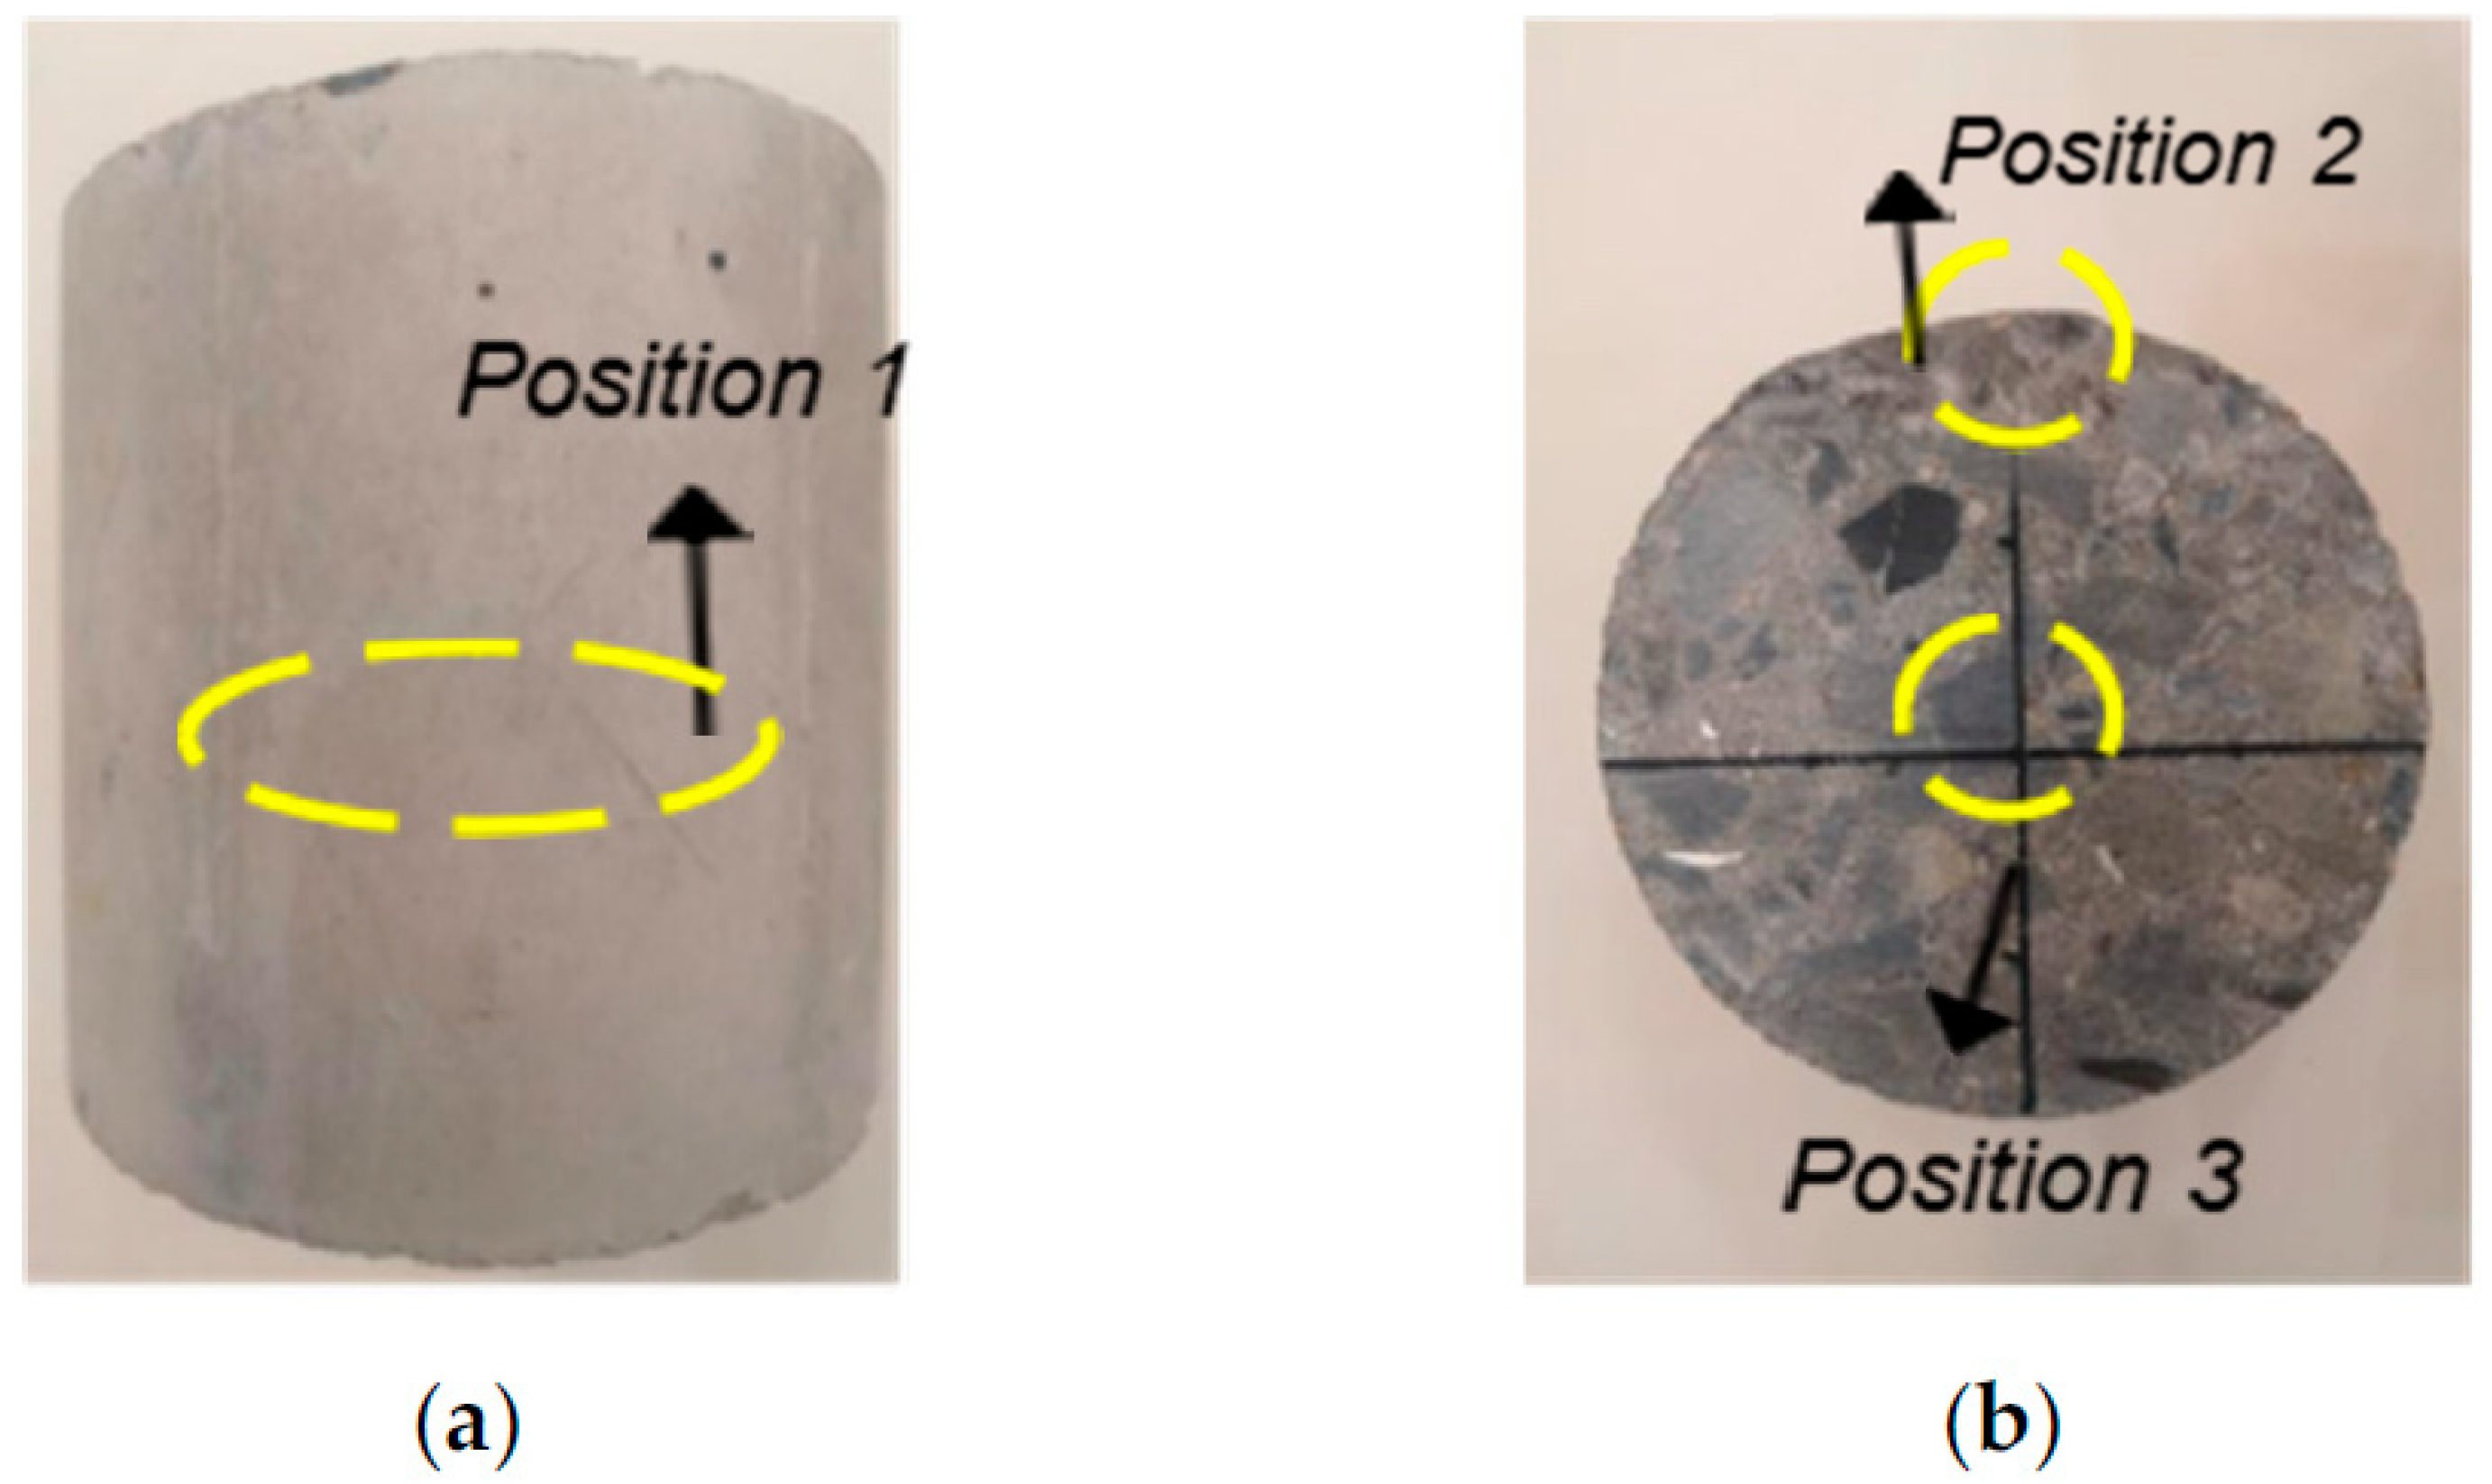
After 100 freeze-thaw cycles, soaking in sodium chloride solution, sodium sulfate solution, sulfuric acid solution, and sodium hydroxide solution for 28 days. The surface (position 1) and cross-section (position 2, position 3) of three kinds of specimens with different fiber contents were observed microscopically, and 100 times magnification was selected to compare the influence degree of different environments on the specimens.
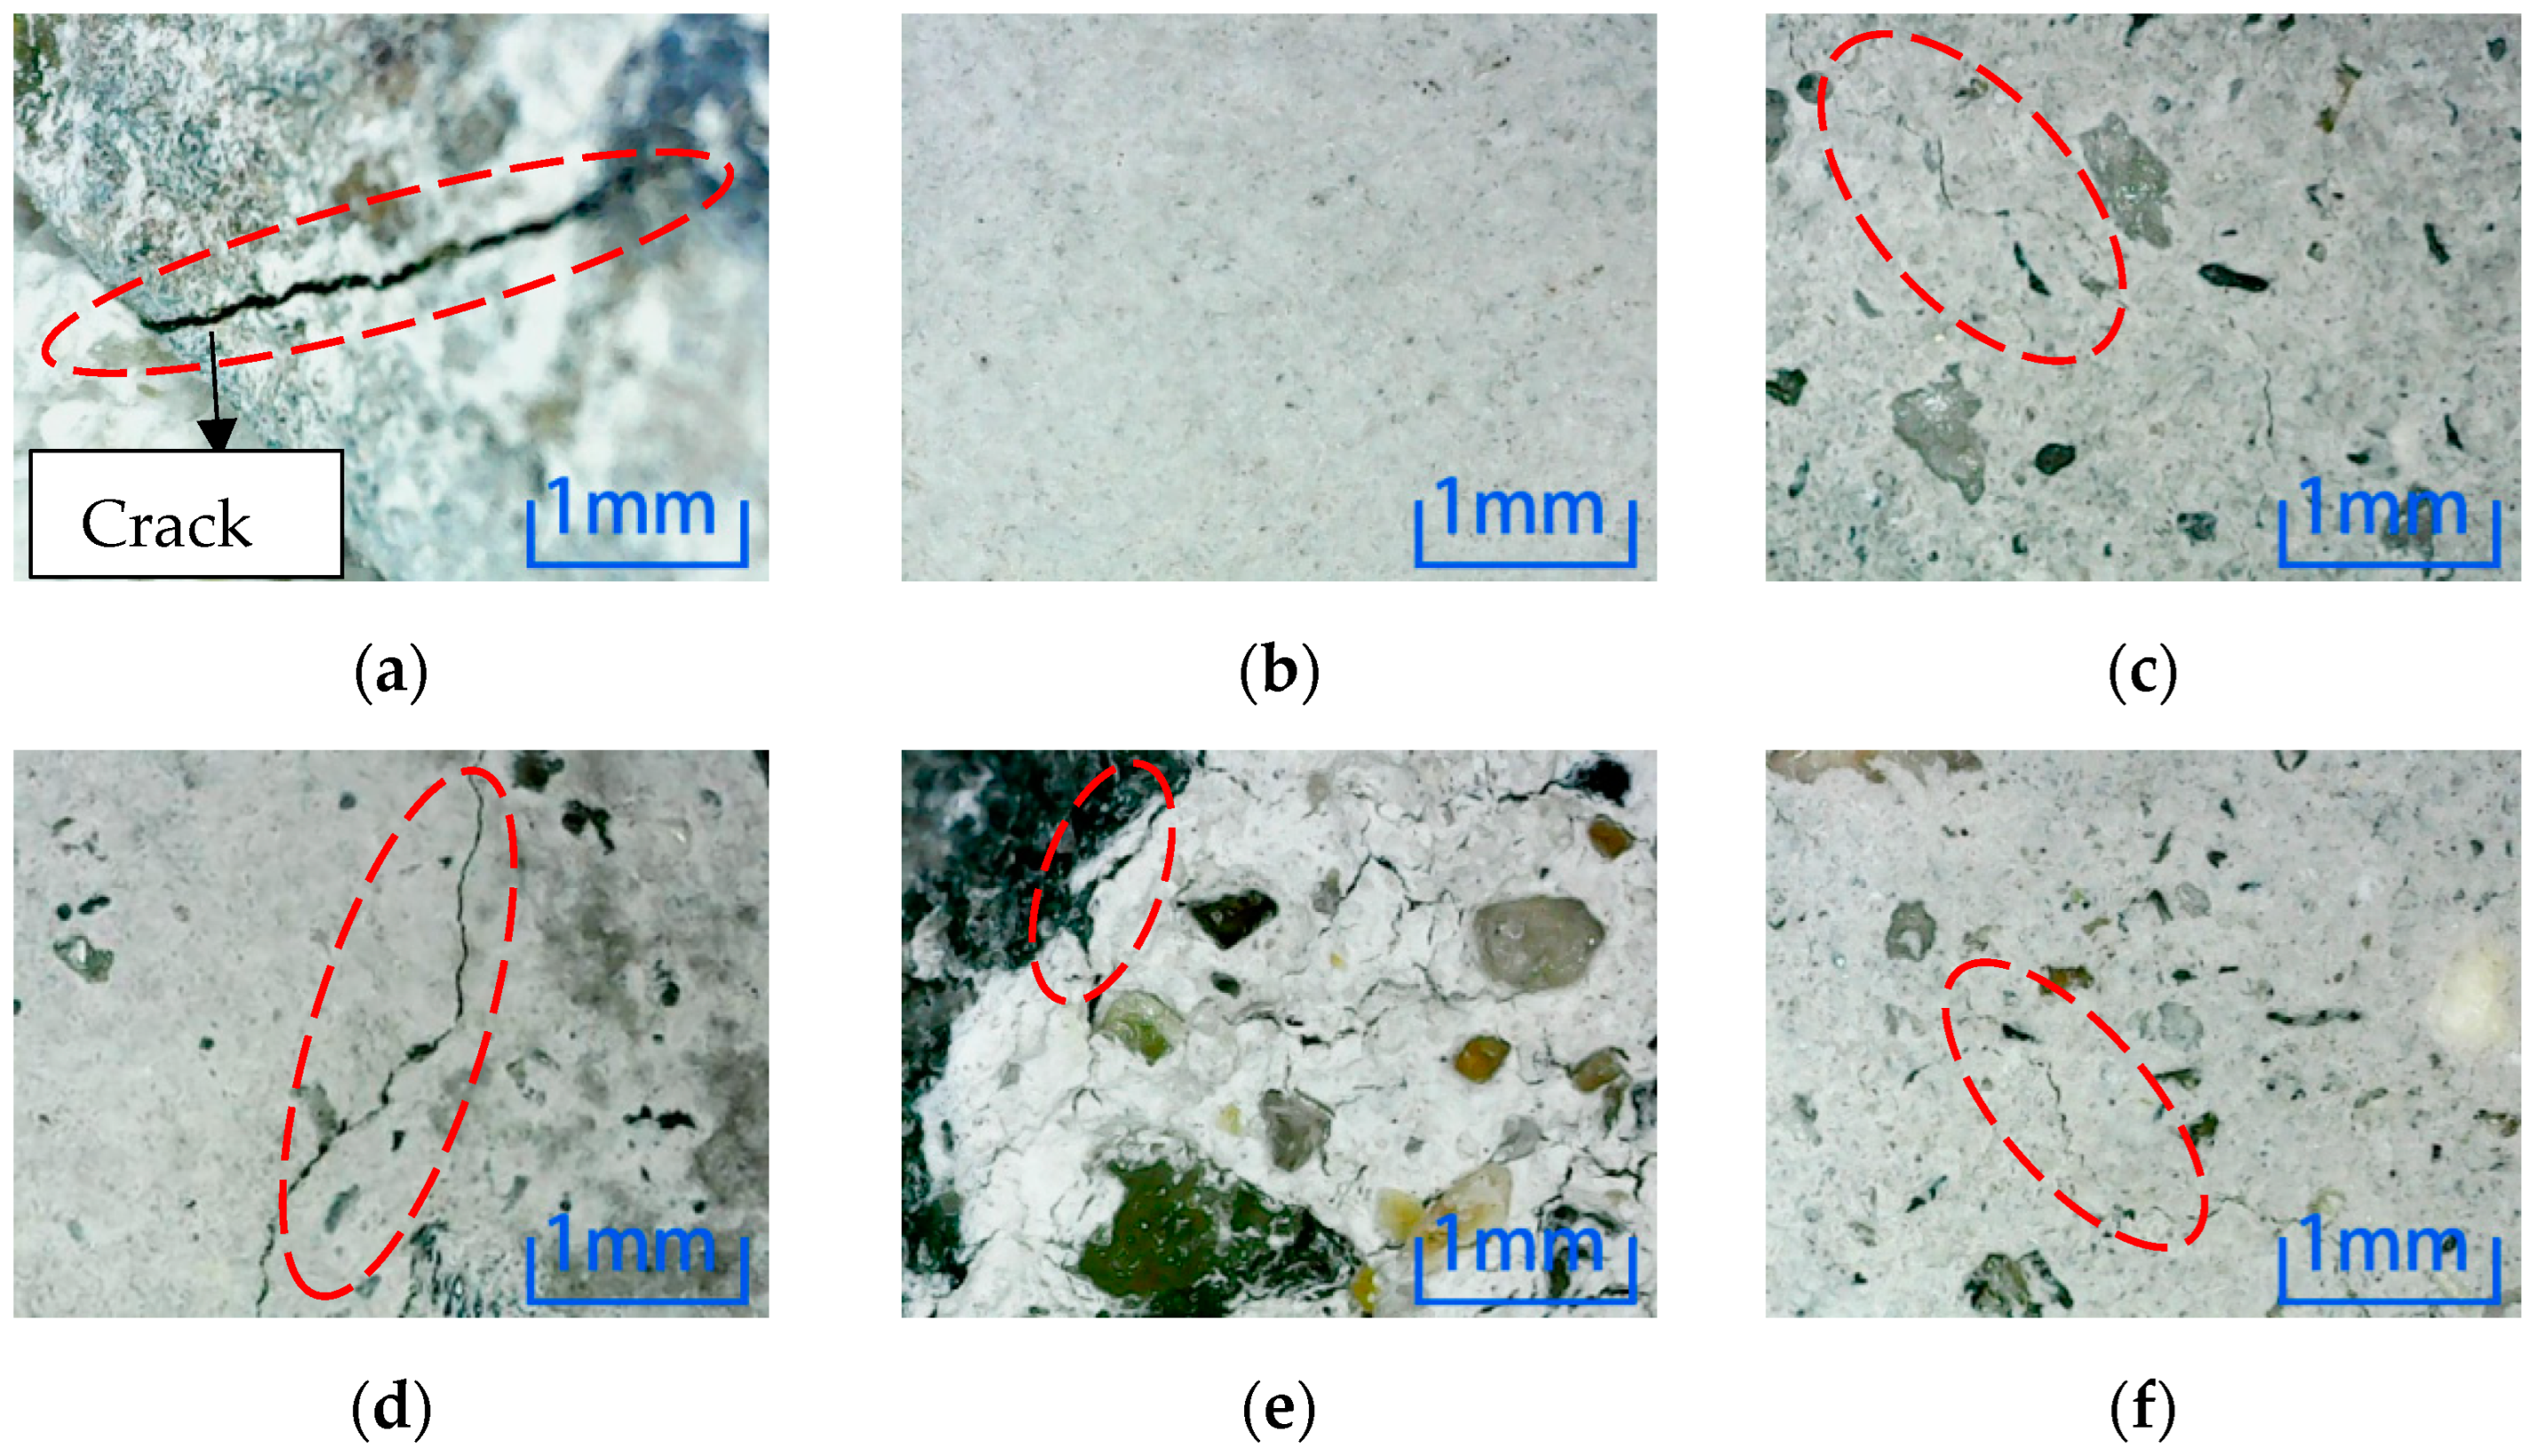
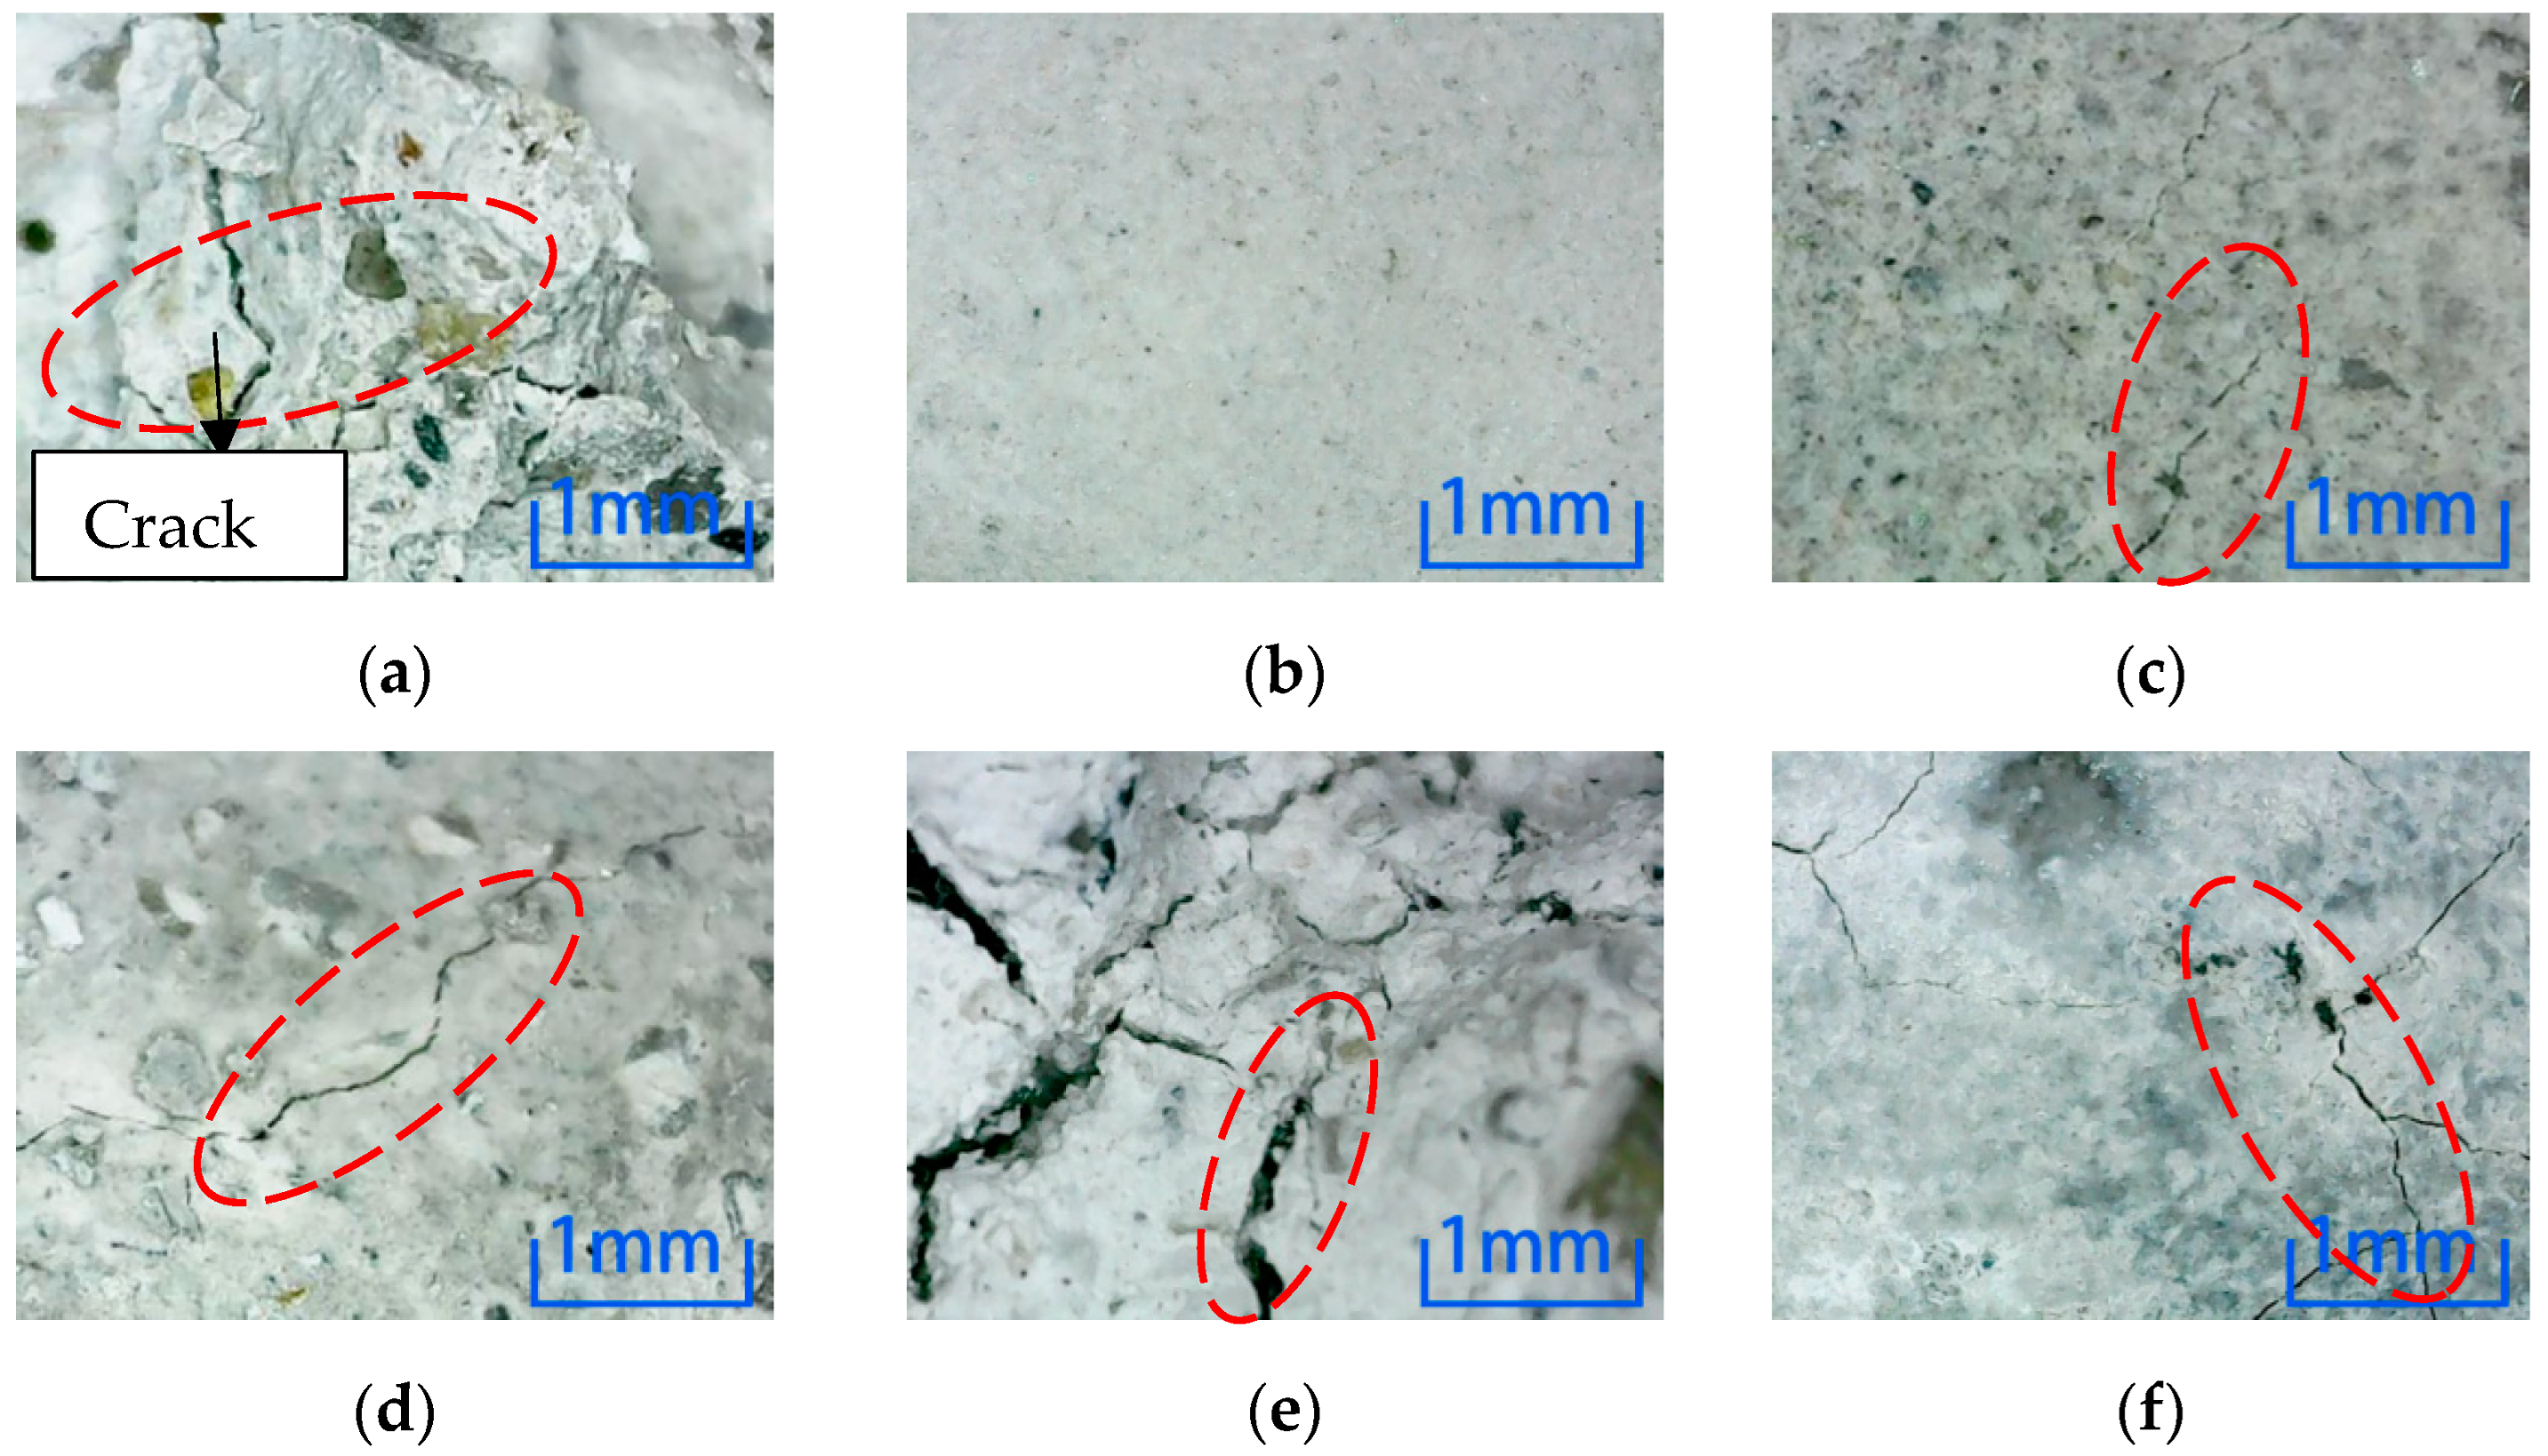
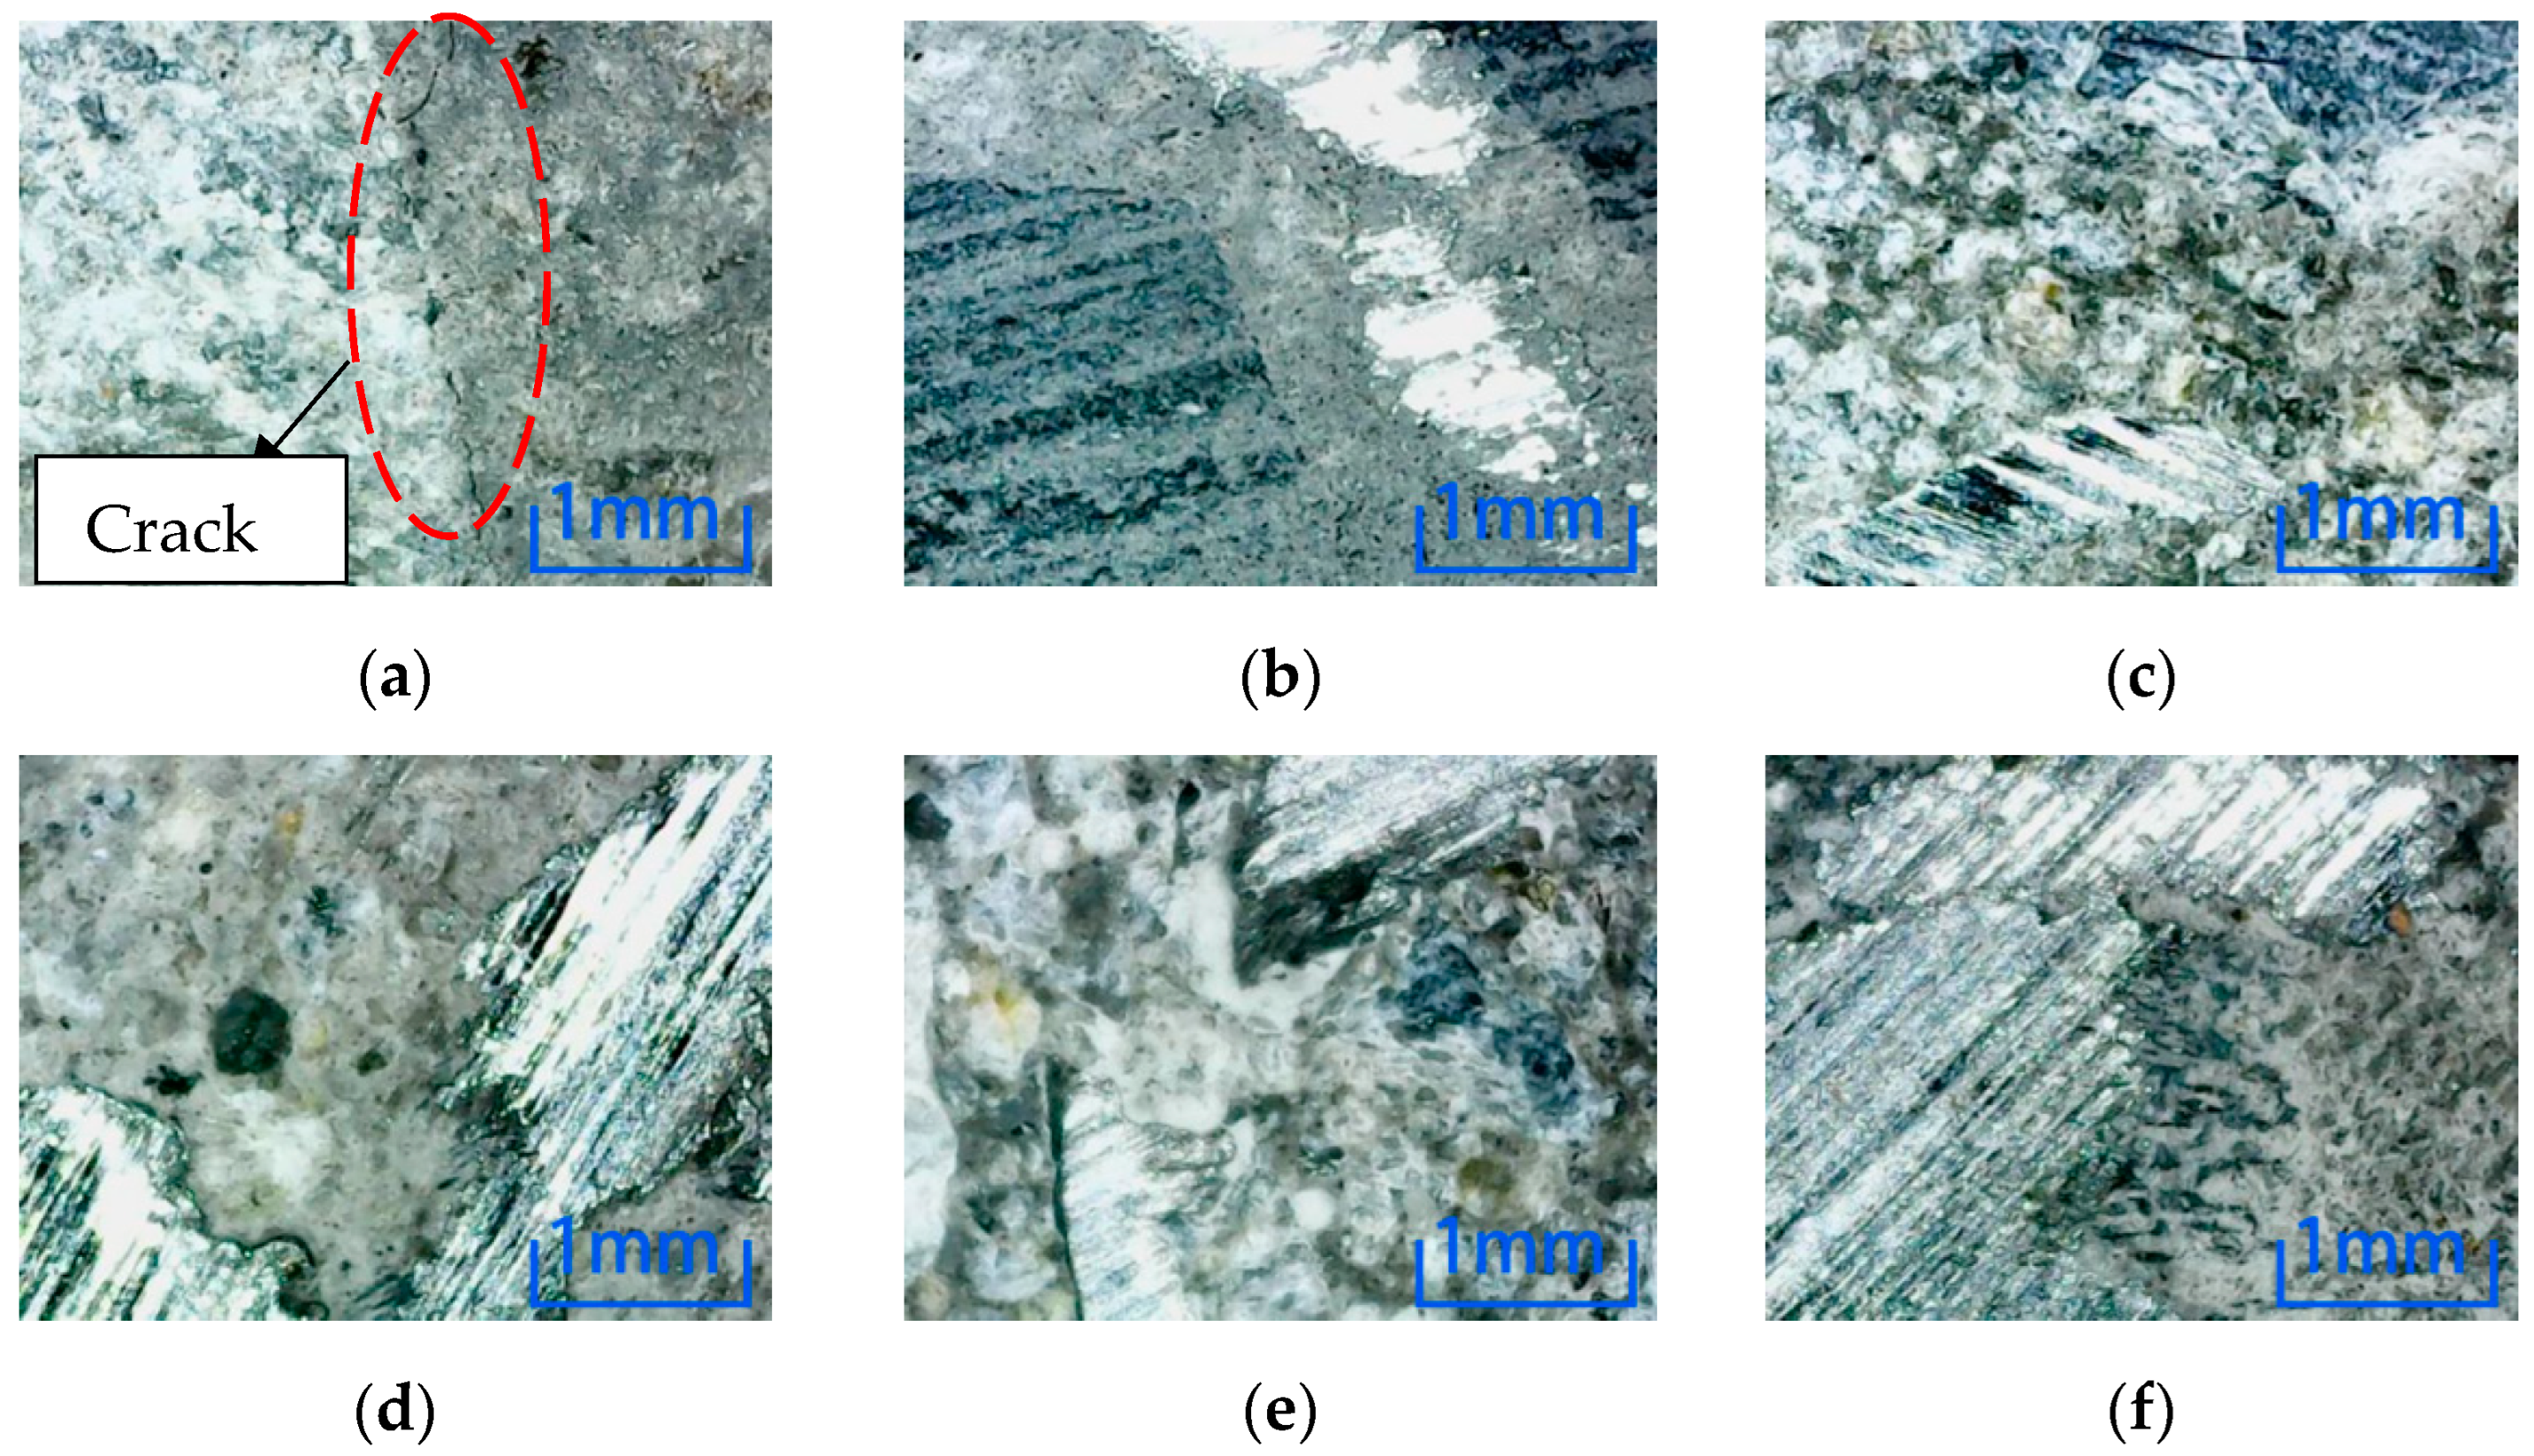
Figure 7 shows position 1 after six kinds of environmental erosion when the steel fiber content is 0%. The microscopic observation results show that the surface crack of the specimen in a freeze-thaw cycle environment is the largest when the fiber is not added. However, there is no crack on the surface after water immersion, and the degree of damage to the specimen in water immersion is the smallest. All the specimens in other environments were damaged, but the degree is less than the freeze-thaw cycle.
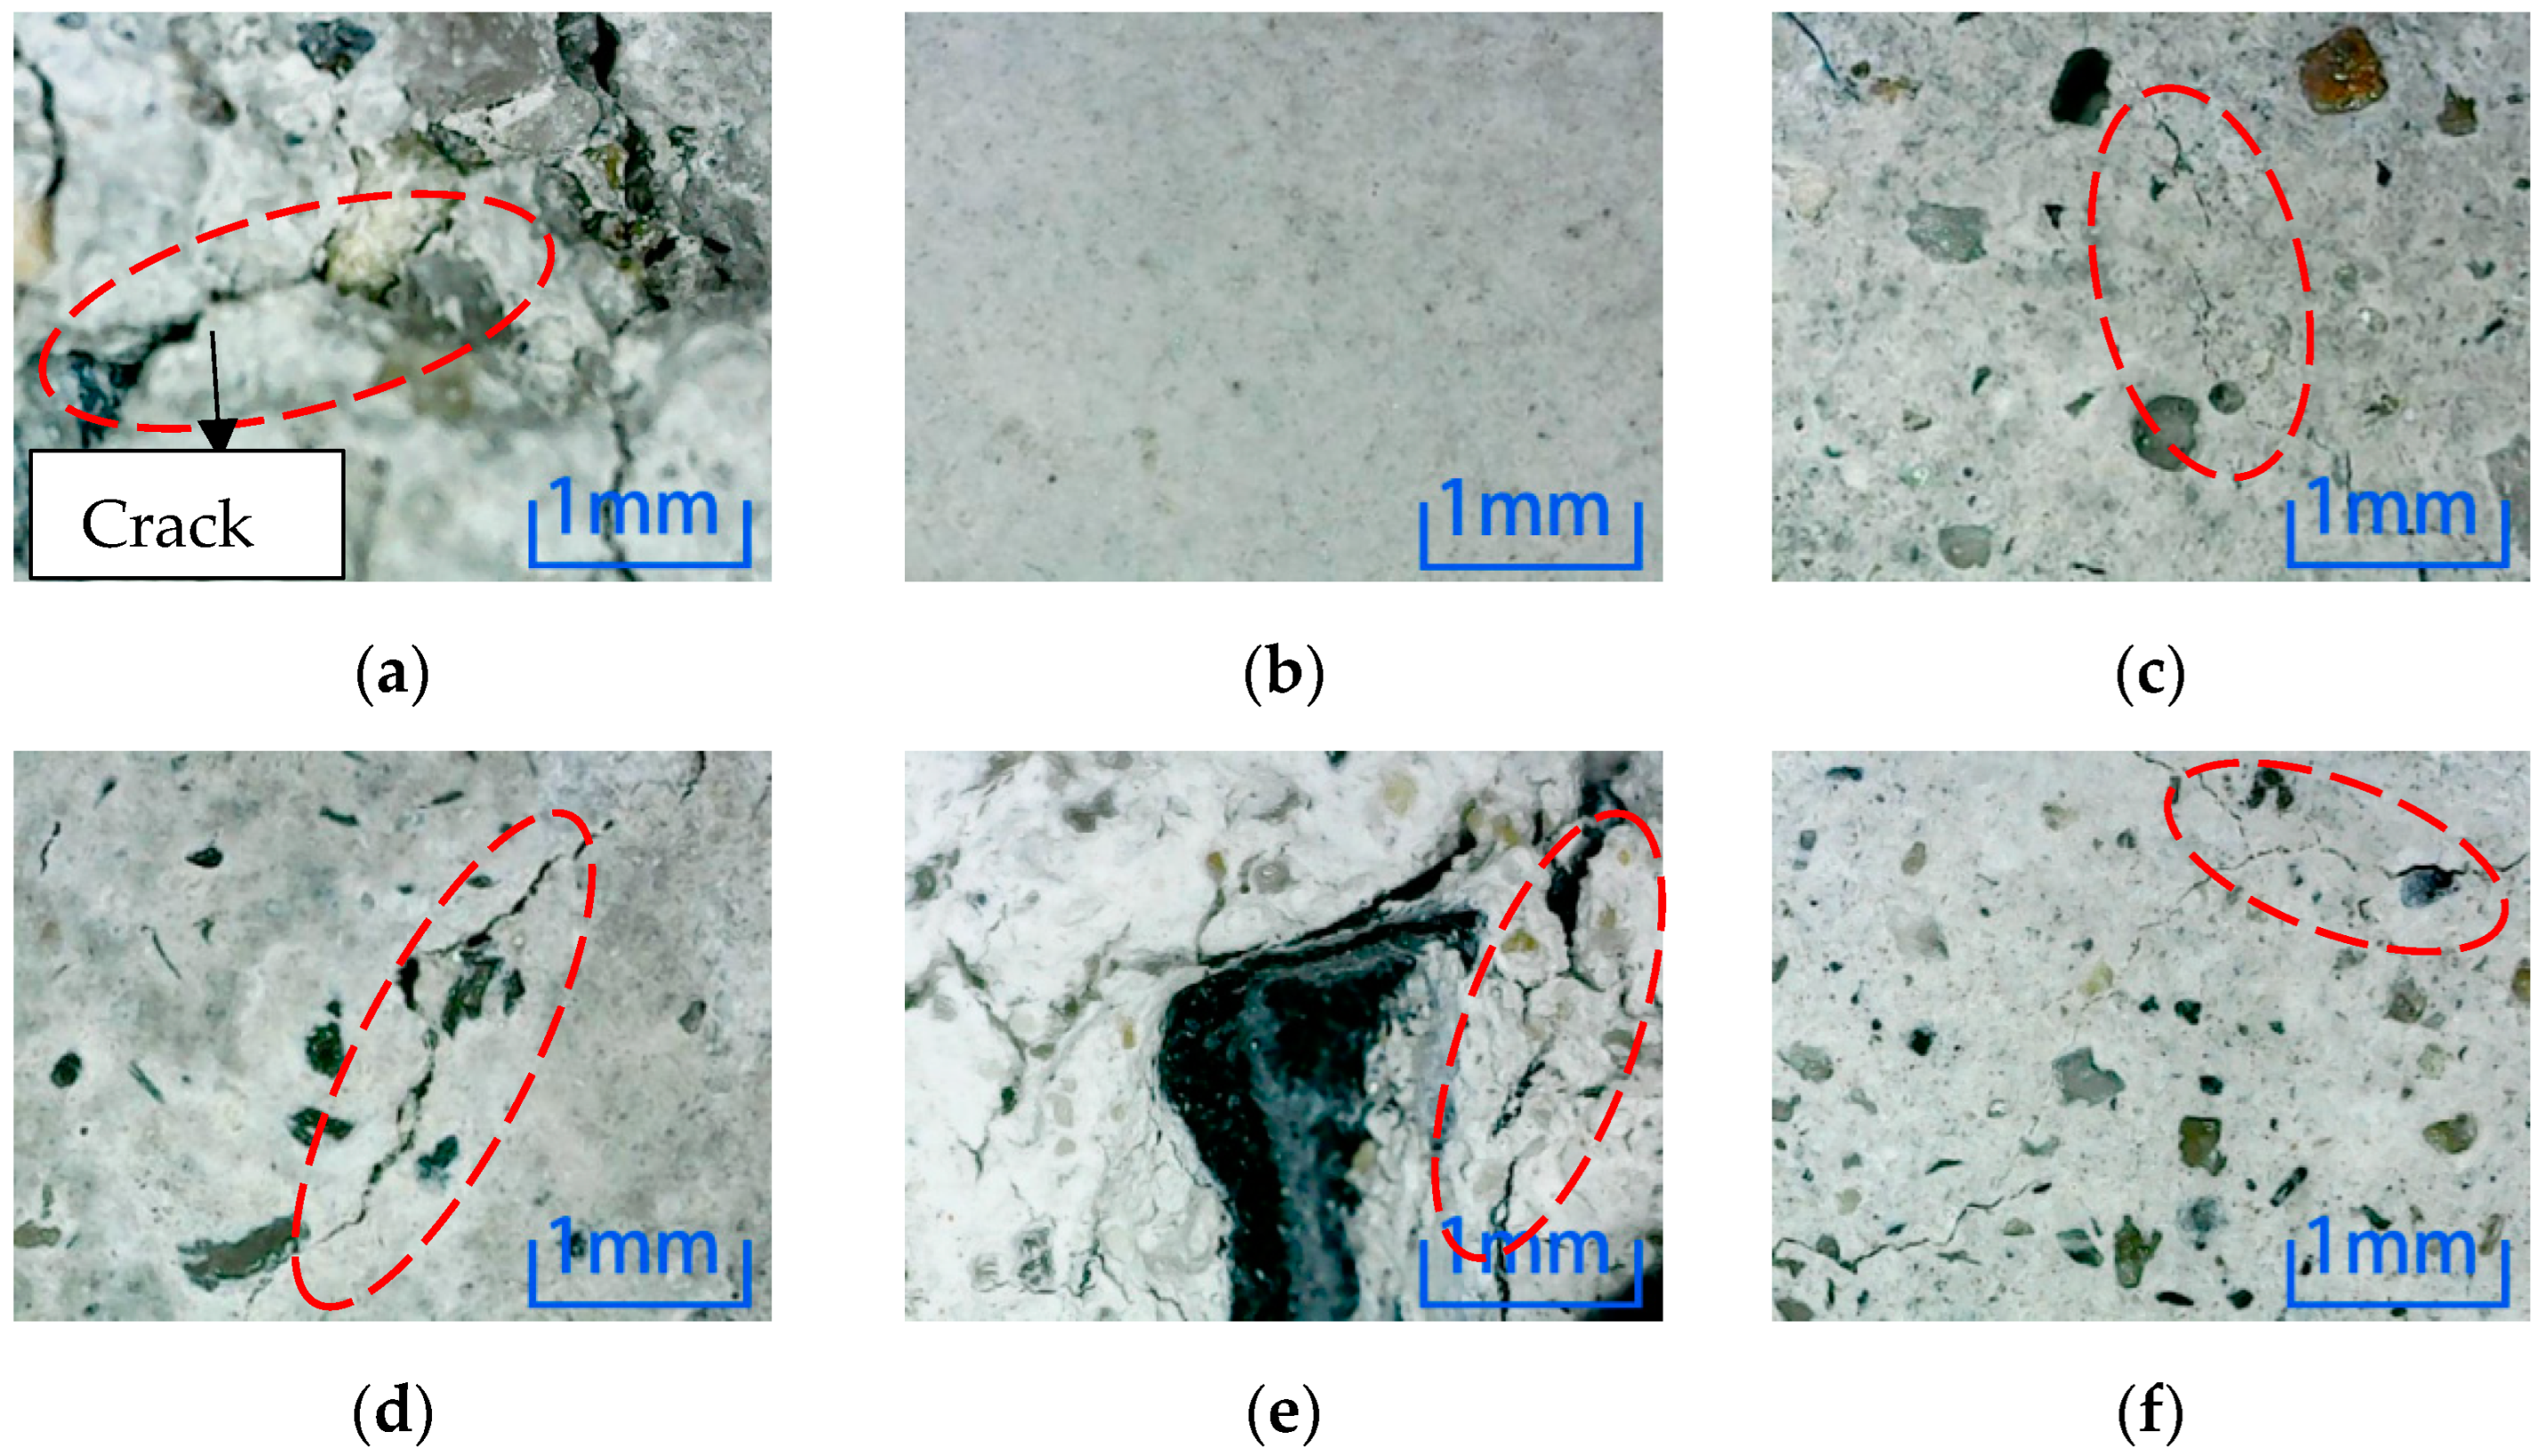
Figure 8 shows position 1 after six kinds of environmental erosion when the steel fiber content is 1%. After adding 1% steel fiber into the specimen, compared with the six environments, there are more cracks in the microscopic pictures of the freeze-thaw cycle and sulfuric acid immersion, which have the most significant impact on the specimen. No cracks appear after water immersion; cracks appear after immersion in other environments, but the number of cracks is small.
Figure 9 shows position 1 after six kinds of environmental erosion when the steel fiber content is 2%. After adding 2% steel fiber into the specimen, it can be concluded that the freeze-thaw cycle and sulfuric acid environment have more apparent damage to the specimen, followed by other environments, and the damage after water immersion is the least obvious.
After different kinds of environmental erosion, except water immersion, cracks appeared on the surfaces of different kinds of micro-concrete specimens under the action of other environments. From the microscopic results, comparing the number and depth of cracks, adding steel fiber did not inhibit the cracks on the surfaces of specimens. Compared with six kinds of erosion environments, the freeze-thaw cycle and sulfuric acid environment have the most decisive influence on the surface cracks for the three kinds of specimens. In contrast, water has a minor influence on the cracks.
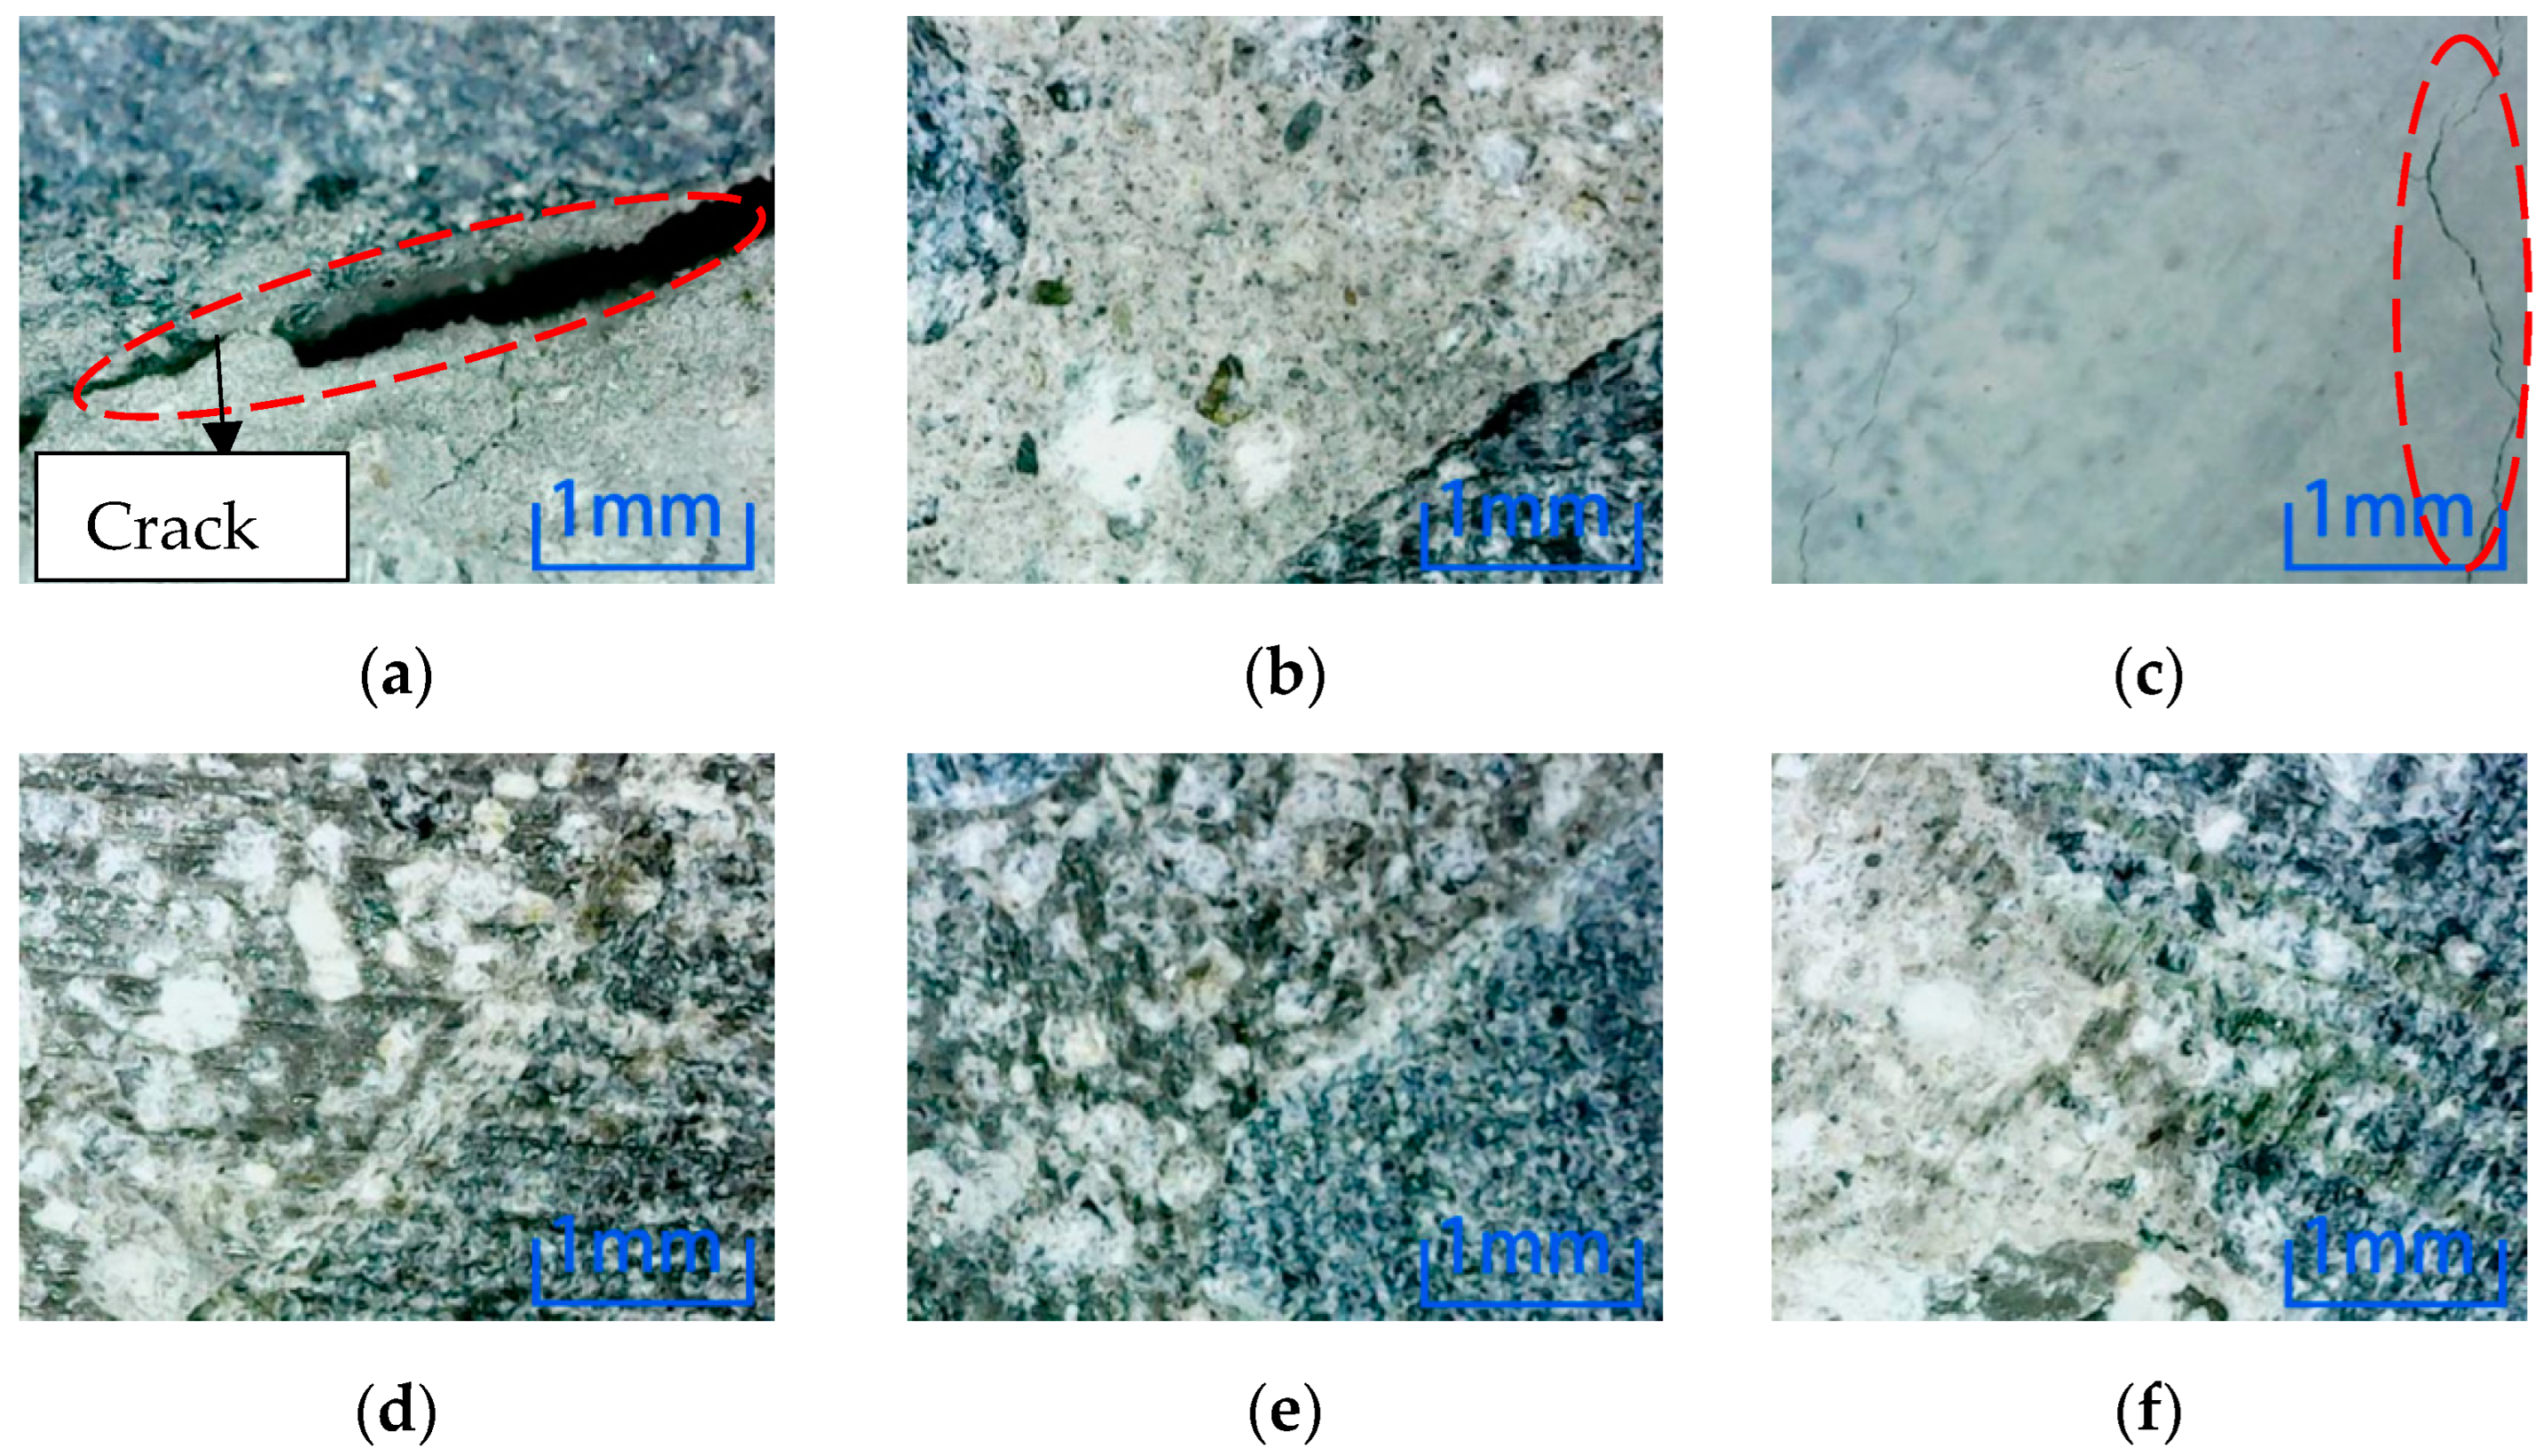
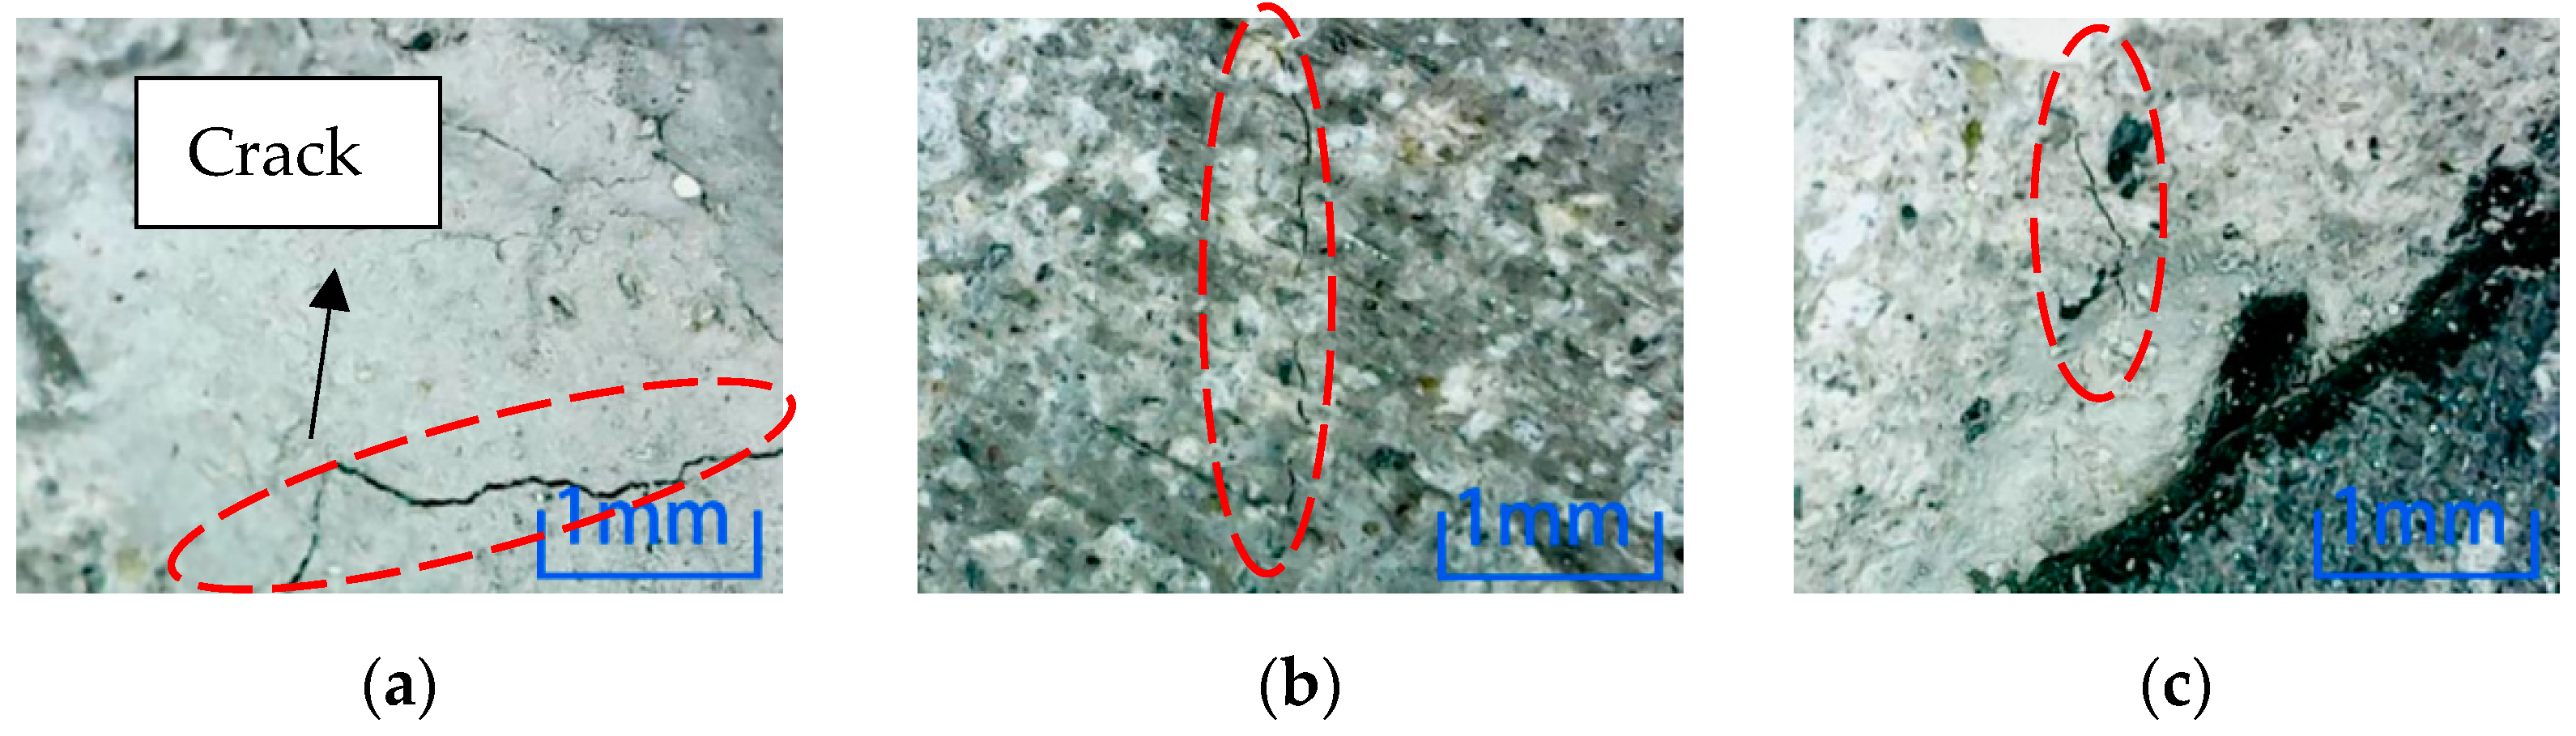
Microscopic observation of position 2 after environmental erosion shows that the magnification is 100 times.
Figure 10 shows the observation results of six kinds of environmental erosion when the steel fiber content is 0%. Cracks appear on the specimen’s cross-section after the freezing-thawing cycle and NaCl environment erosion. However, no cracks appear after other environmental erosion, which indicates that the freezing-thawing cycle and NaCl environment greatly influence concrete damage, while other environments have little influence.
Microscopic observation of position 2 after environmental erosion shows that the magnification is 100 times.
Figure 11 shows the observation results of six kinds of environmental erosion when the steel fiber content is 1%. After adding 1% steel fiber, only the specimen’s cross-section is cracked after the freeze-thaw cycle environment erosion. However, no cracks are found after other environments’ erosion, which shows that the freeze-thaw cycle damage to the specimen is more severe than in other environments.
Microscopic observation of position 2 after environmental erosion shows that the magnification is 100 times.
Figure 12 shows the observation results of six kinds of environmental erosion when the steel fiber content is 2%. The microscopic results of the specimen’s cross-section are similar to those of the specimen with 1% steel fiber content, except that the crack occurs at position 2 of the specimen’s cross-section after the freeze-thaw cycle. However, the difference is that the crack of the concrete specimen with 2% steel fiber content is minor.
Comparing the microscopic observation results of position 2, the concrete without steel fiber is cracked after the freeze-thaw cycle and NaCl environmental erosion. However, only the freeze-thaw cycle environmental erosion causes cracks in the specimen after adding steel fiber. Comparing the two dosages, the concrete cracks with 2% content are minor, which shows that steel fiber can inhibit the internal cracks of concrete, thus reducing the environmental damage to concrete. Adding 2% concrete is more effective than 1% concrete. It can be known that the freeze-thaw cycle has the most significant influence on the damage to concrete specimens in the six erosion environments. Comparing the microscopic results of position 3, as shown in
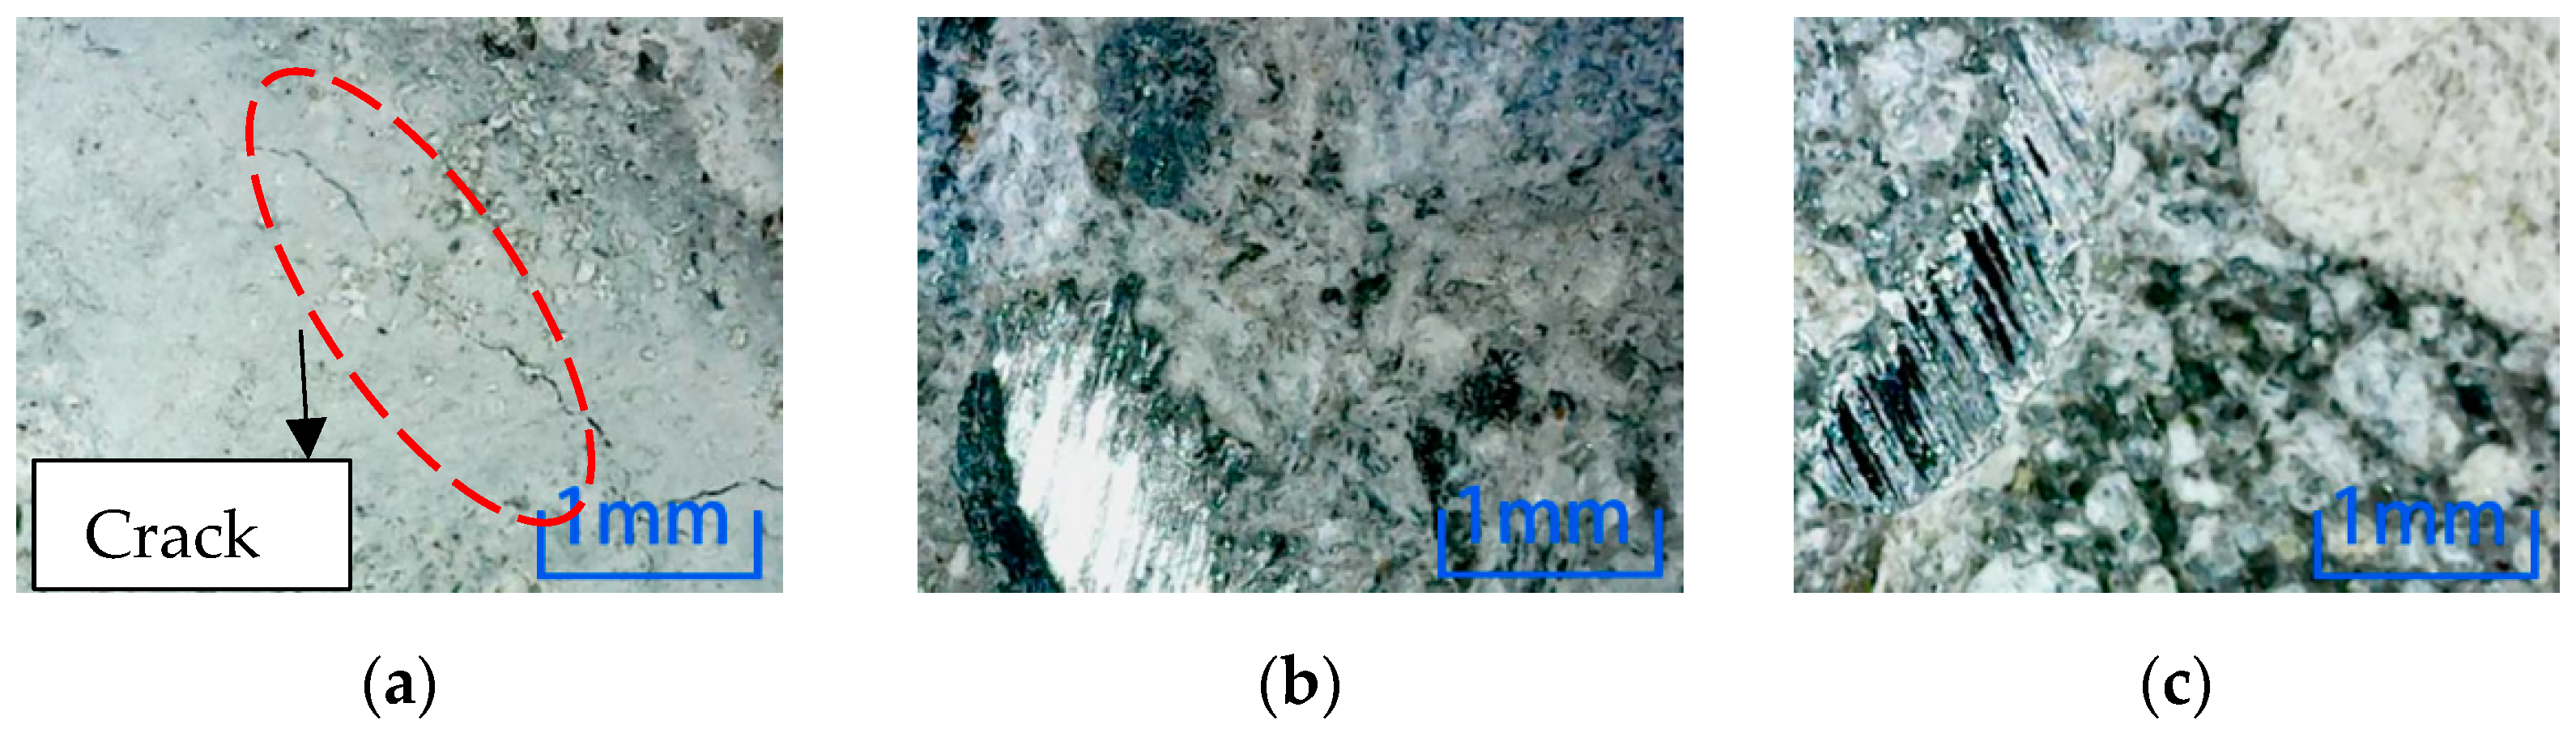
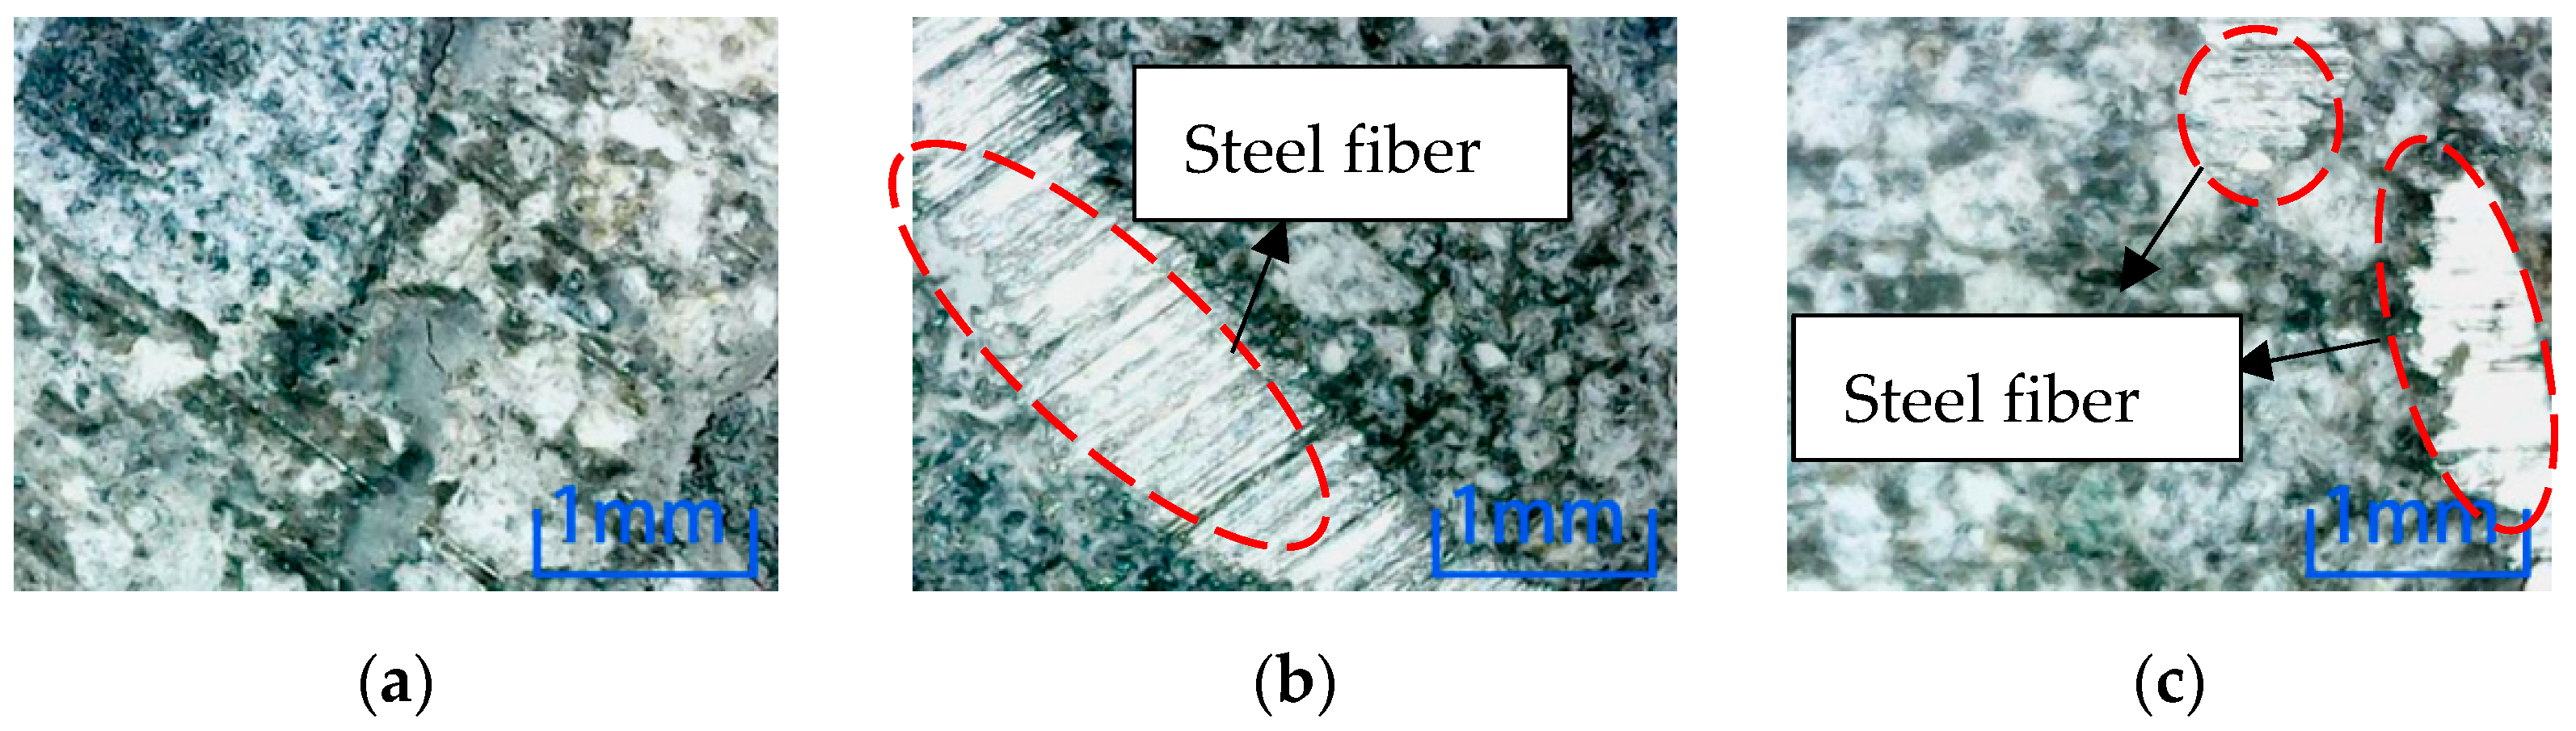
Figure 13, cracks are produced in specimens with different fiber contents after the freeze-thaw cycle environment erosion. The width and length of cracks decrease with the increase in steel fiber content.
There is no crack in the center of the concrete cross-section with different fiber content in the other five environments. In this paper, after soaking in NaCl solution, as shown in
Figure 14, no crack is found in the specimens with each of the three fiber contents.
Comparing the three locations, except for the water environment, all the specimens with three dosages have cracks on their surfaces in location 1. Similarly, except for the cracks caused by the freeze-thaw cycle, only the cracks were caused by plain concrete after soaking in NaCl solution in location 2. Therefore, the environmental erosion on the specimen surface is more significant than inside, indicating environmental damage is from outside to inside. Compared with positions 2 and 3, the same point is that freeze-thaw cycles have destroyed concrete specimens under six kinds of environmental erosion. The length and width of cracks decrease with the increase of steel fiber. This observation shows that the freeze-thaw cycle has the most significant influence on the damage to concrete, and adding steel fiber can inhibit the development of cracks in concrete specimens. That is, it can inhibit the damage to concrete.
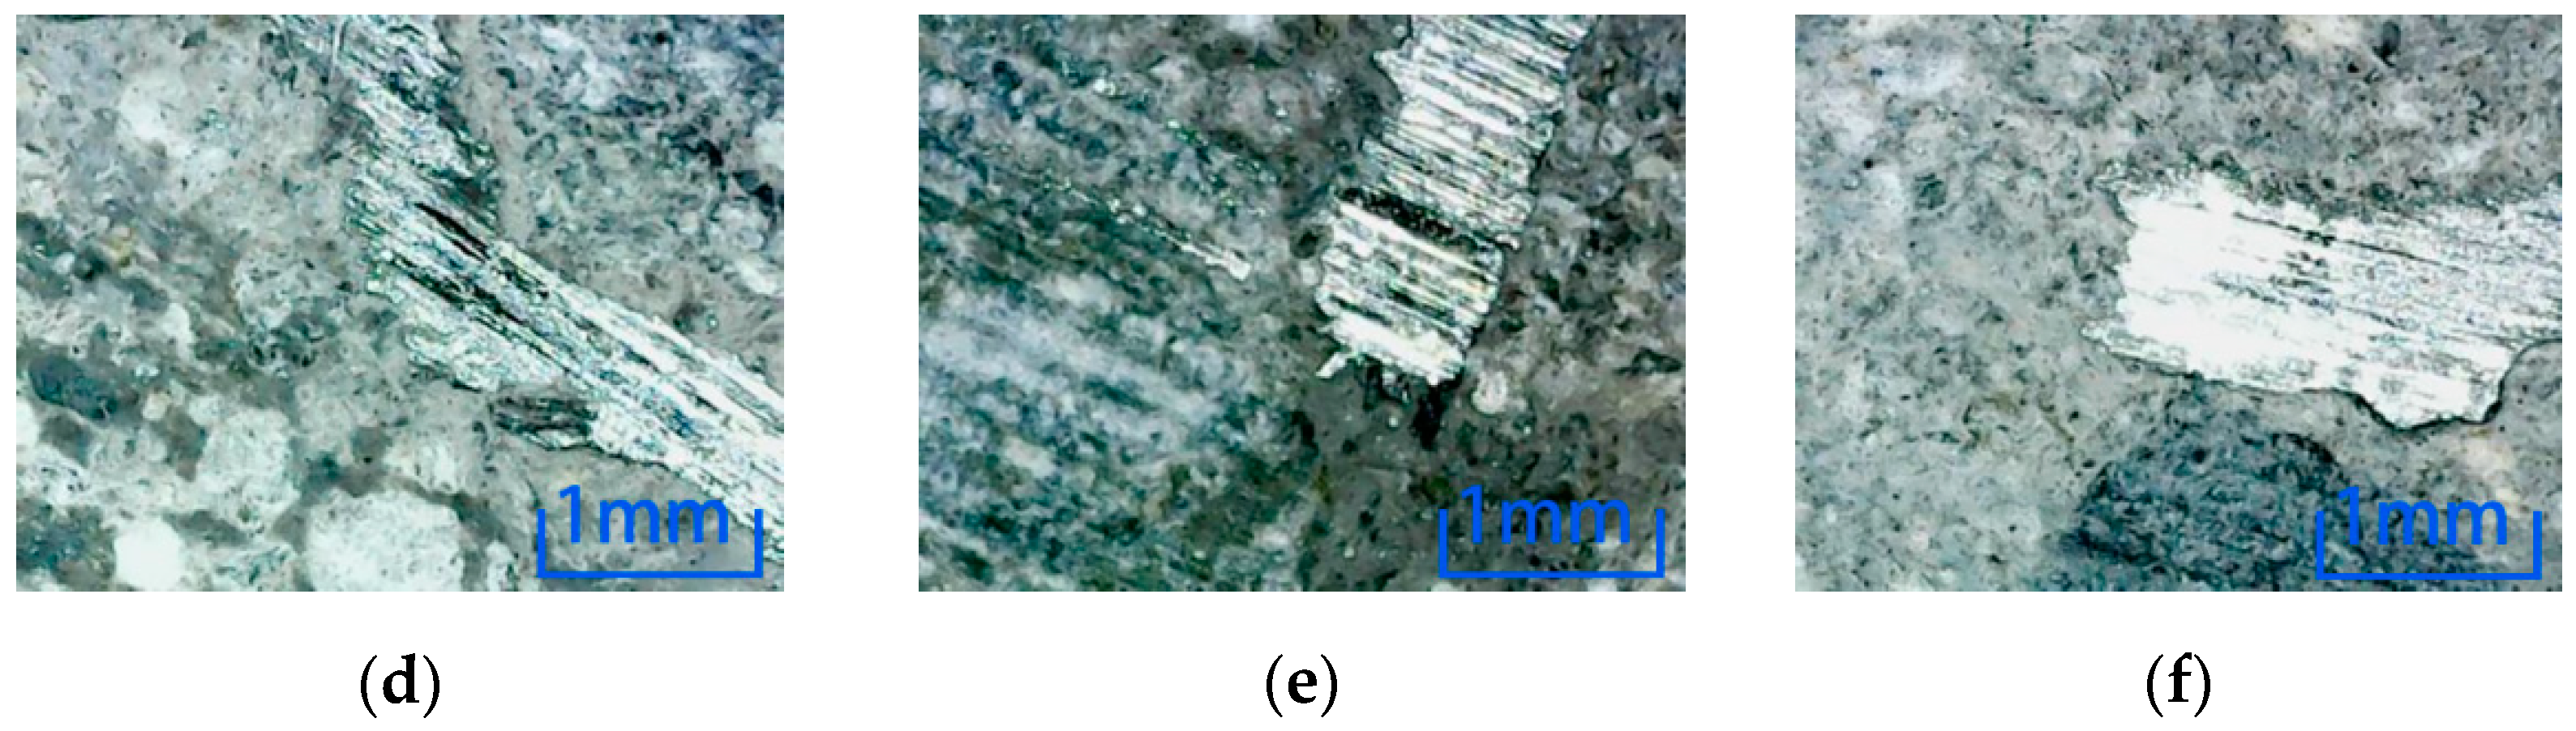
3.2. Analysis of Mechanical Deterioration Performance of SFRC
The concrete cubic compressive test is set up in
Figure 15, and the test results are shown in
Table 3.
The test shows that the increase in steel fiber content has a positive effect on the compressive strength of SFRC. When the fiber content is 1% and 2%, the compressive strength increases by 11.4% and 30.6%, respectively. The addition of steel fiber can inhibit the transverse deformation of concrete and improve the compressive strength of concrete. However, due to the existence of steel fibers, a harmful interface is formed between the concrete and steel fiber. The interface area is suddenly destroyed when the compression load reaches a specific value.
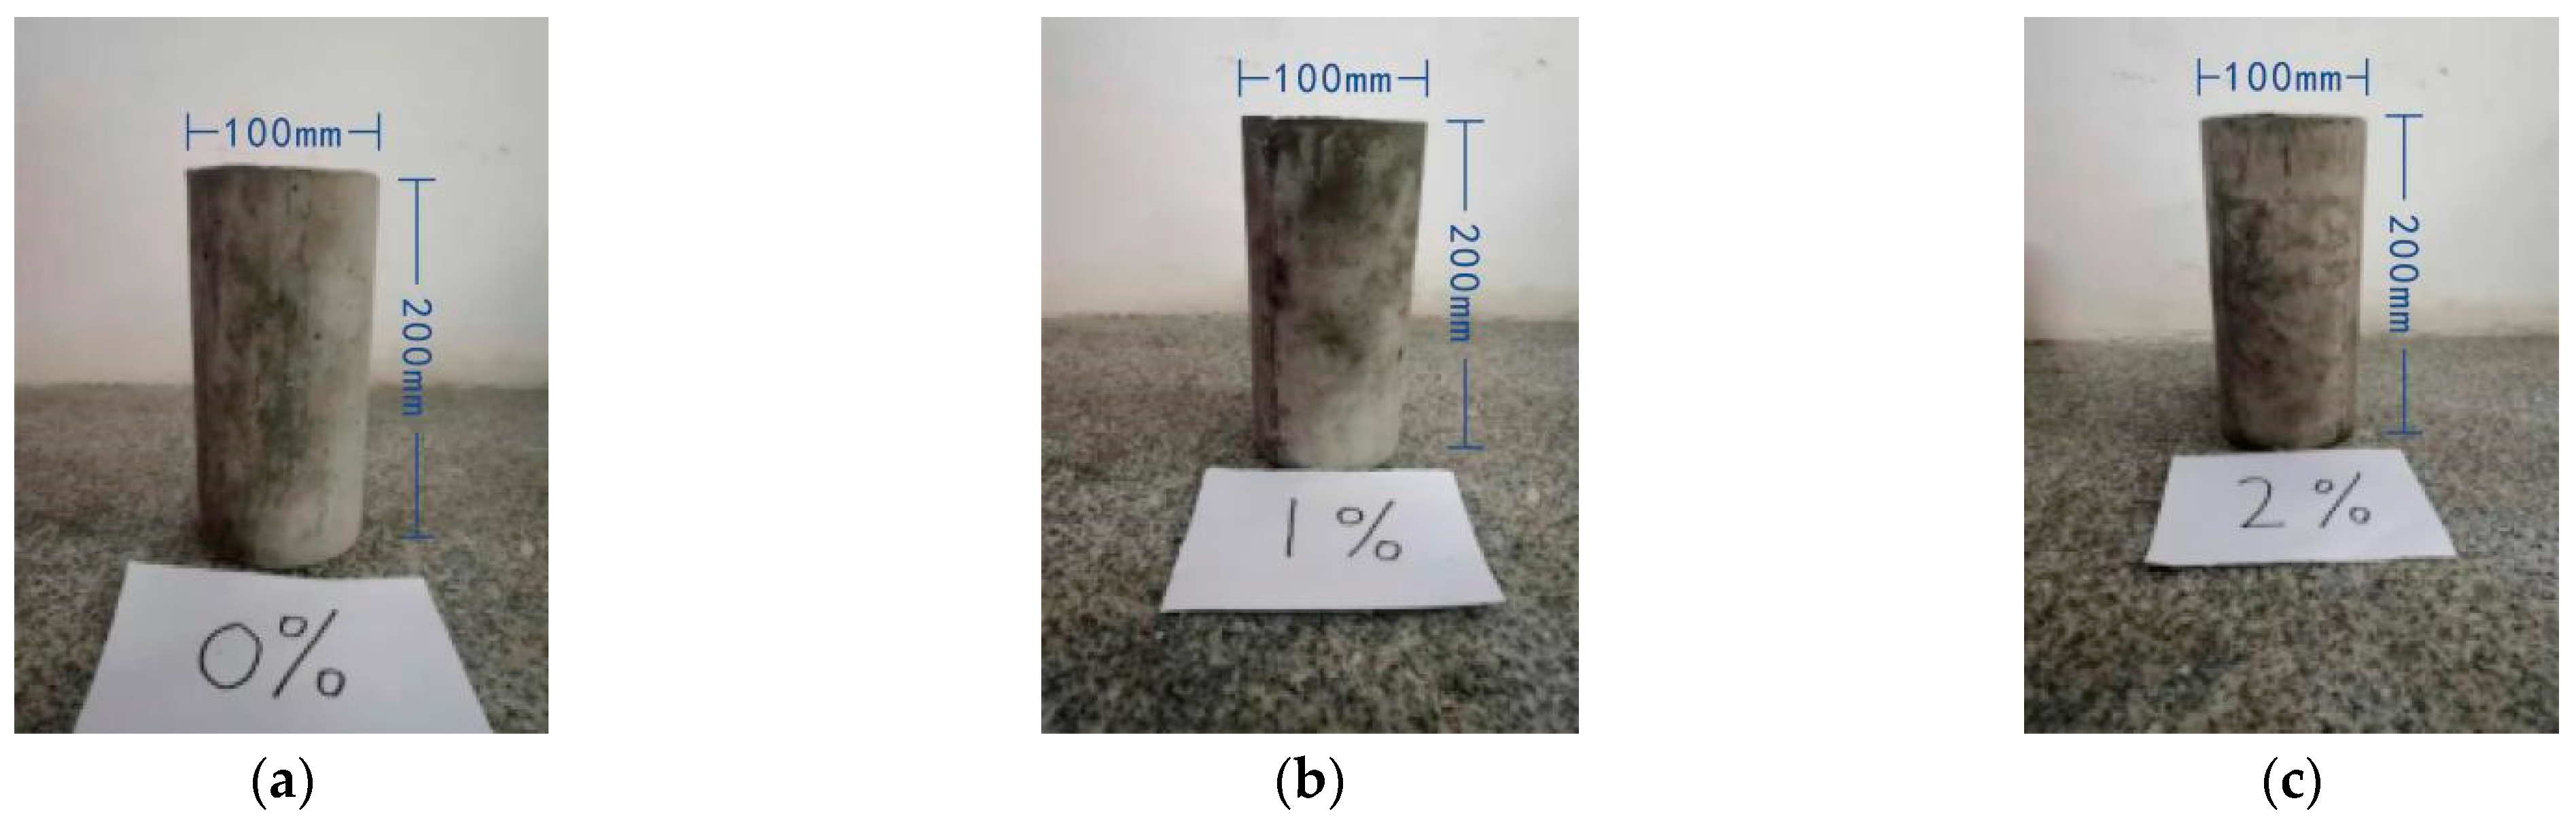
Cylindrical concrete specimens with a steel fiber content of 0%, 1%, and 2% were subjected to an axial compression test after 100 freeze-thaw cycles and 28 days in different solutions. An axial compression test is carried out on cylinder specimens before erosion, and the test results are shown in
Table 4.
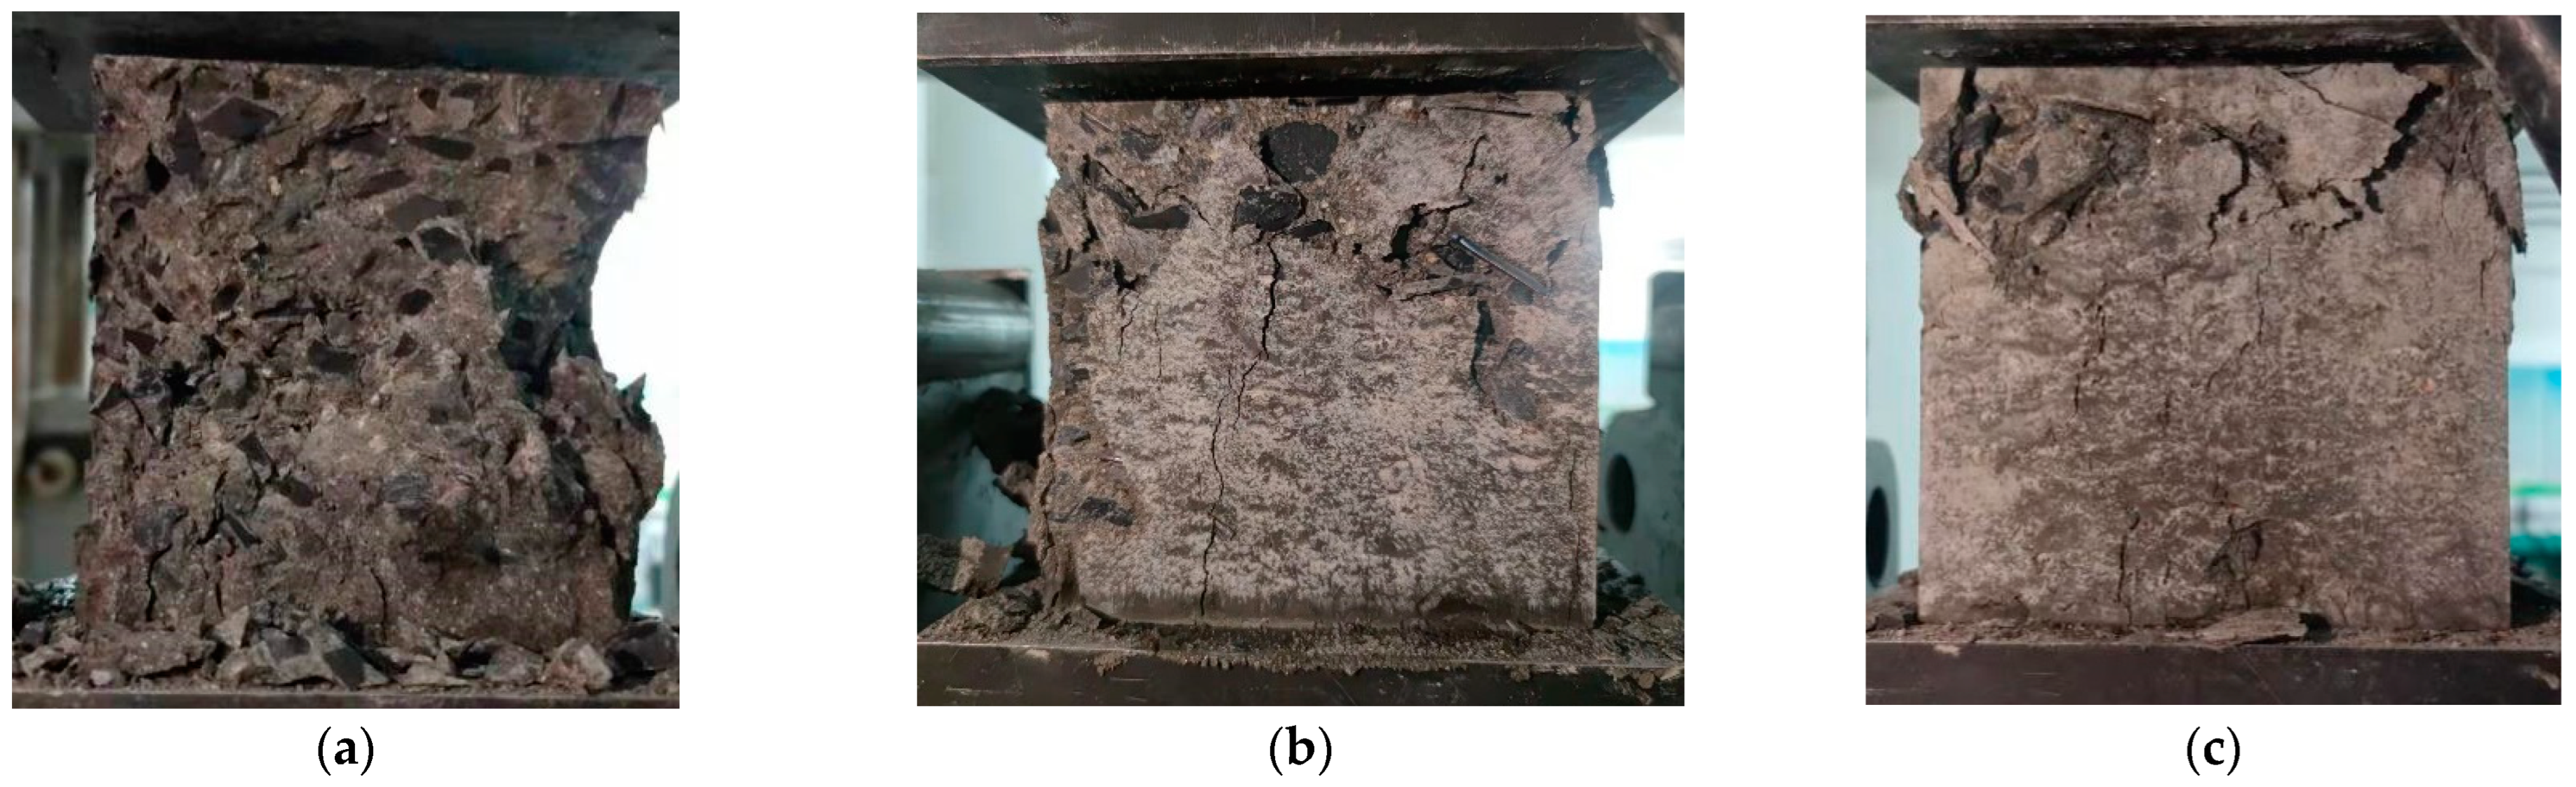
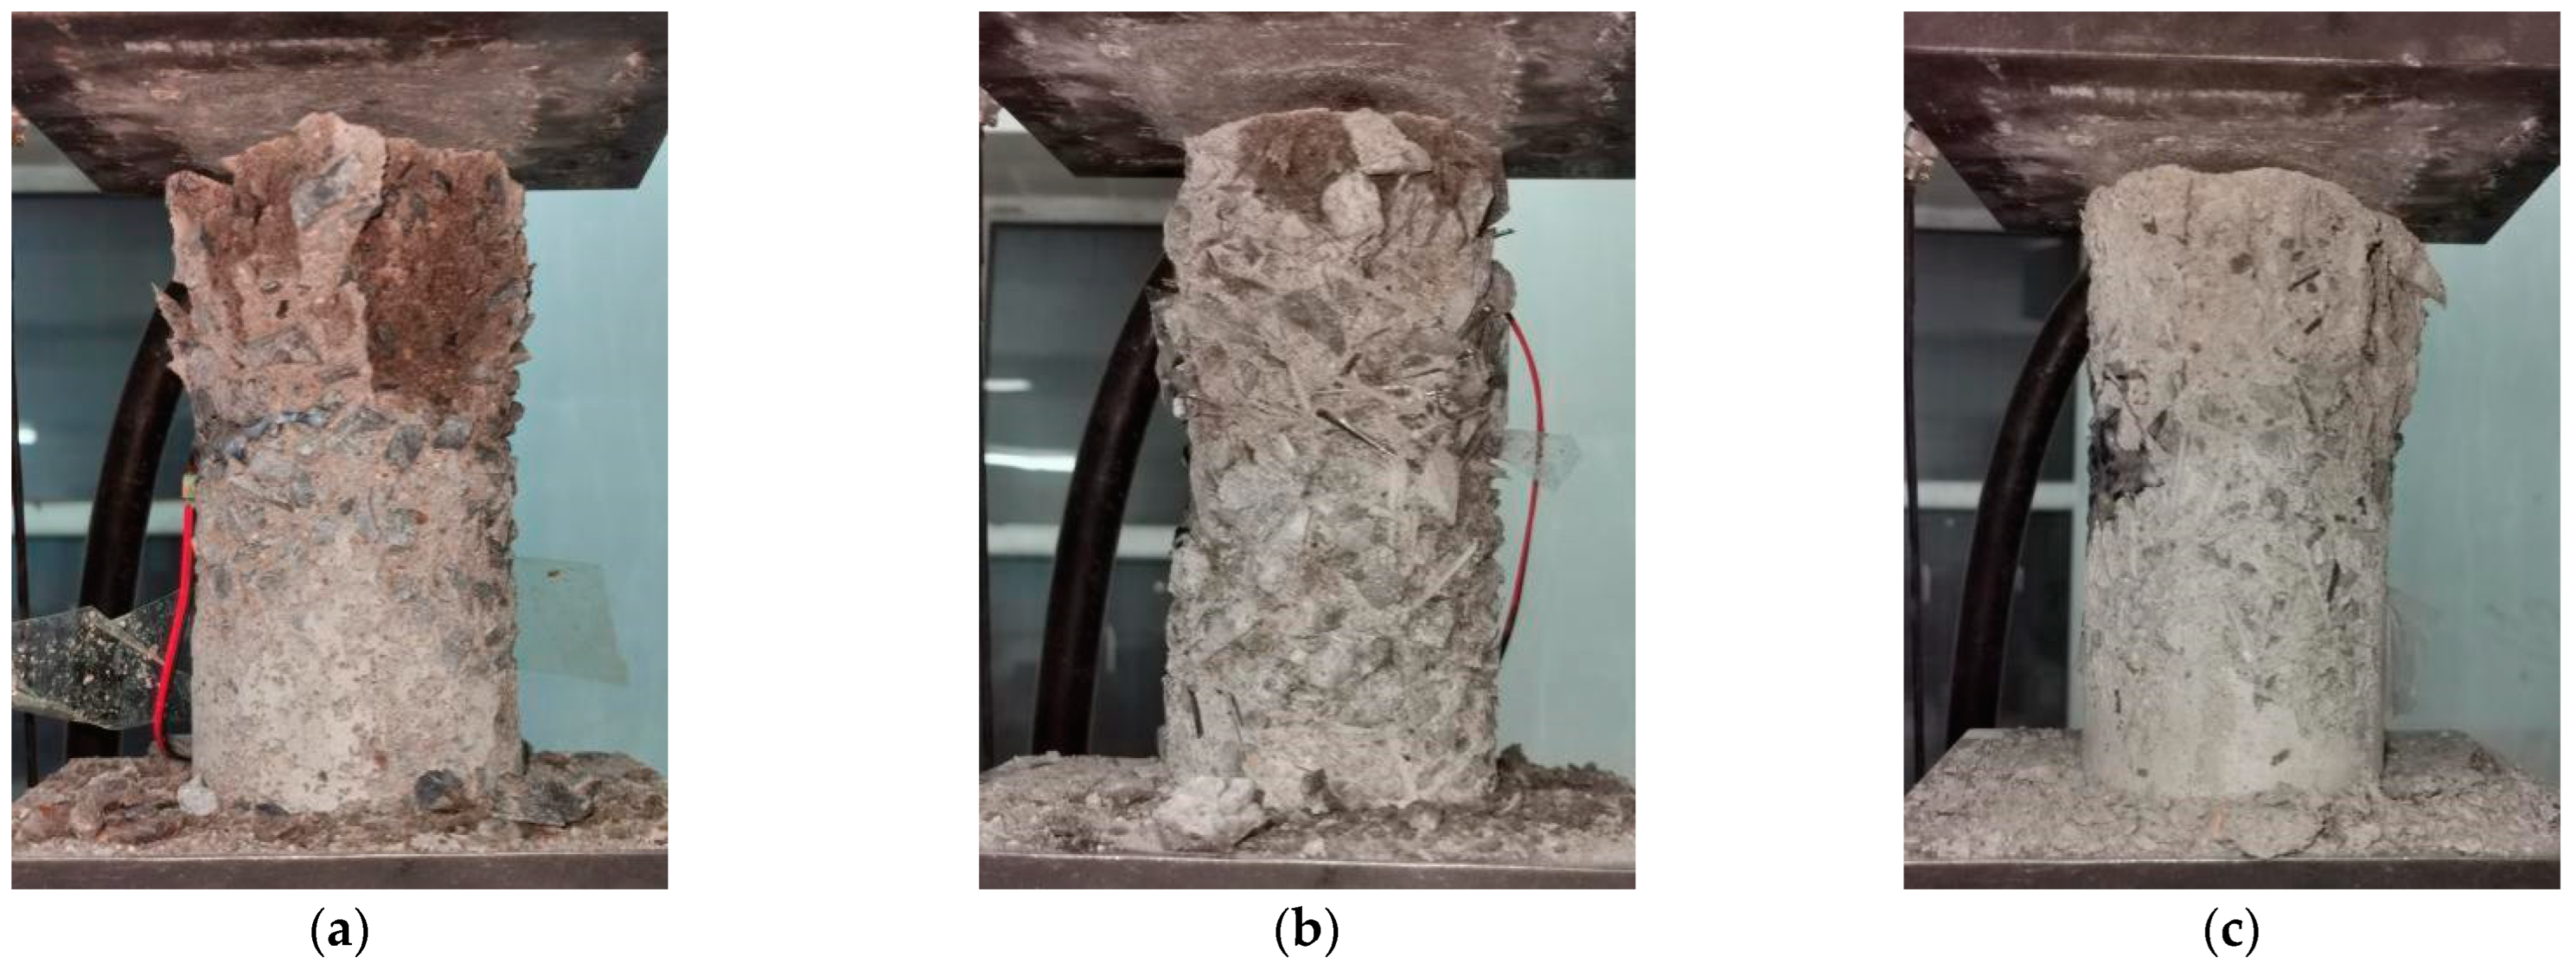
A schematic diagram of the axial compression test of specimens with other volume content of steel fiber is shown in
Figure 16. The more steel fiber content, the less noticeable the surface failure of the specimen, and the better the specimen’s integrity after failure, the less the surface mortar falls off.
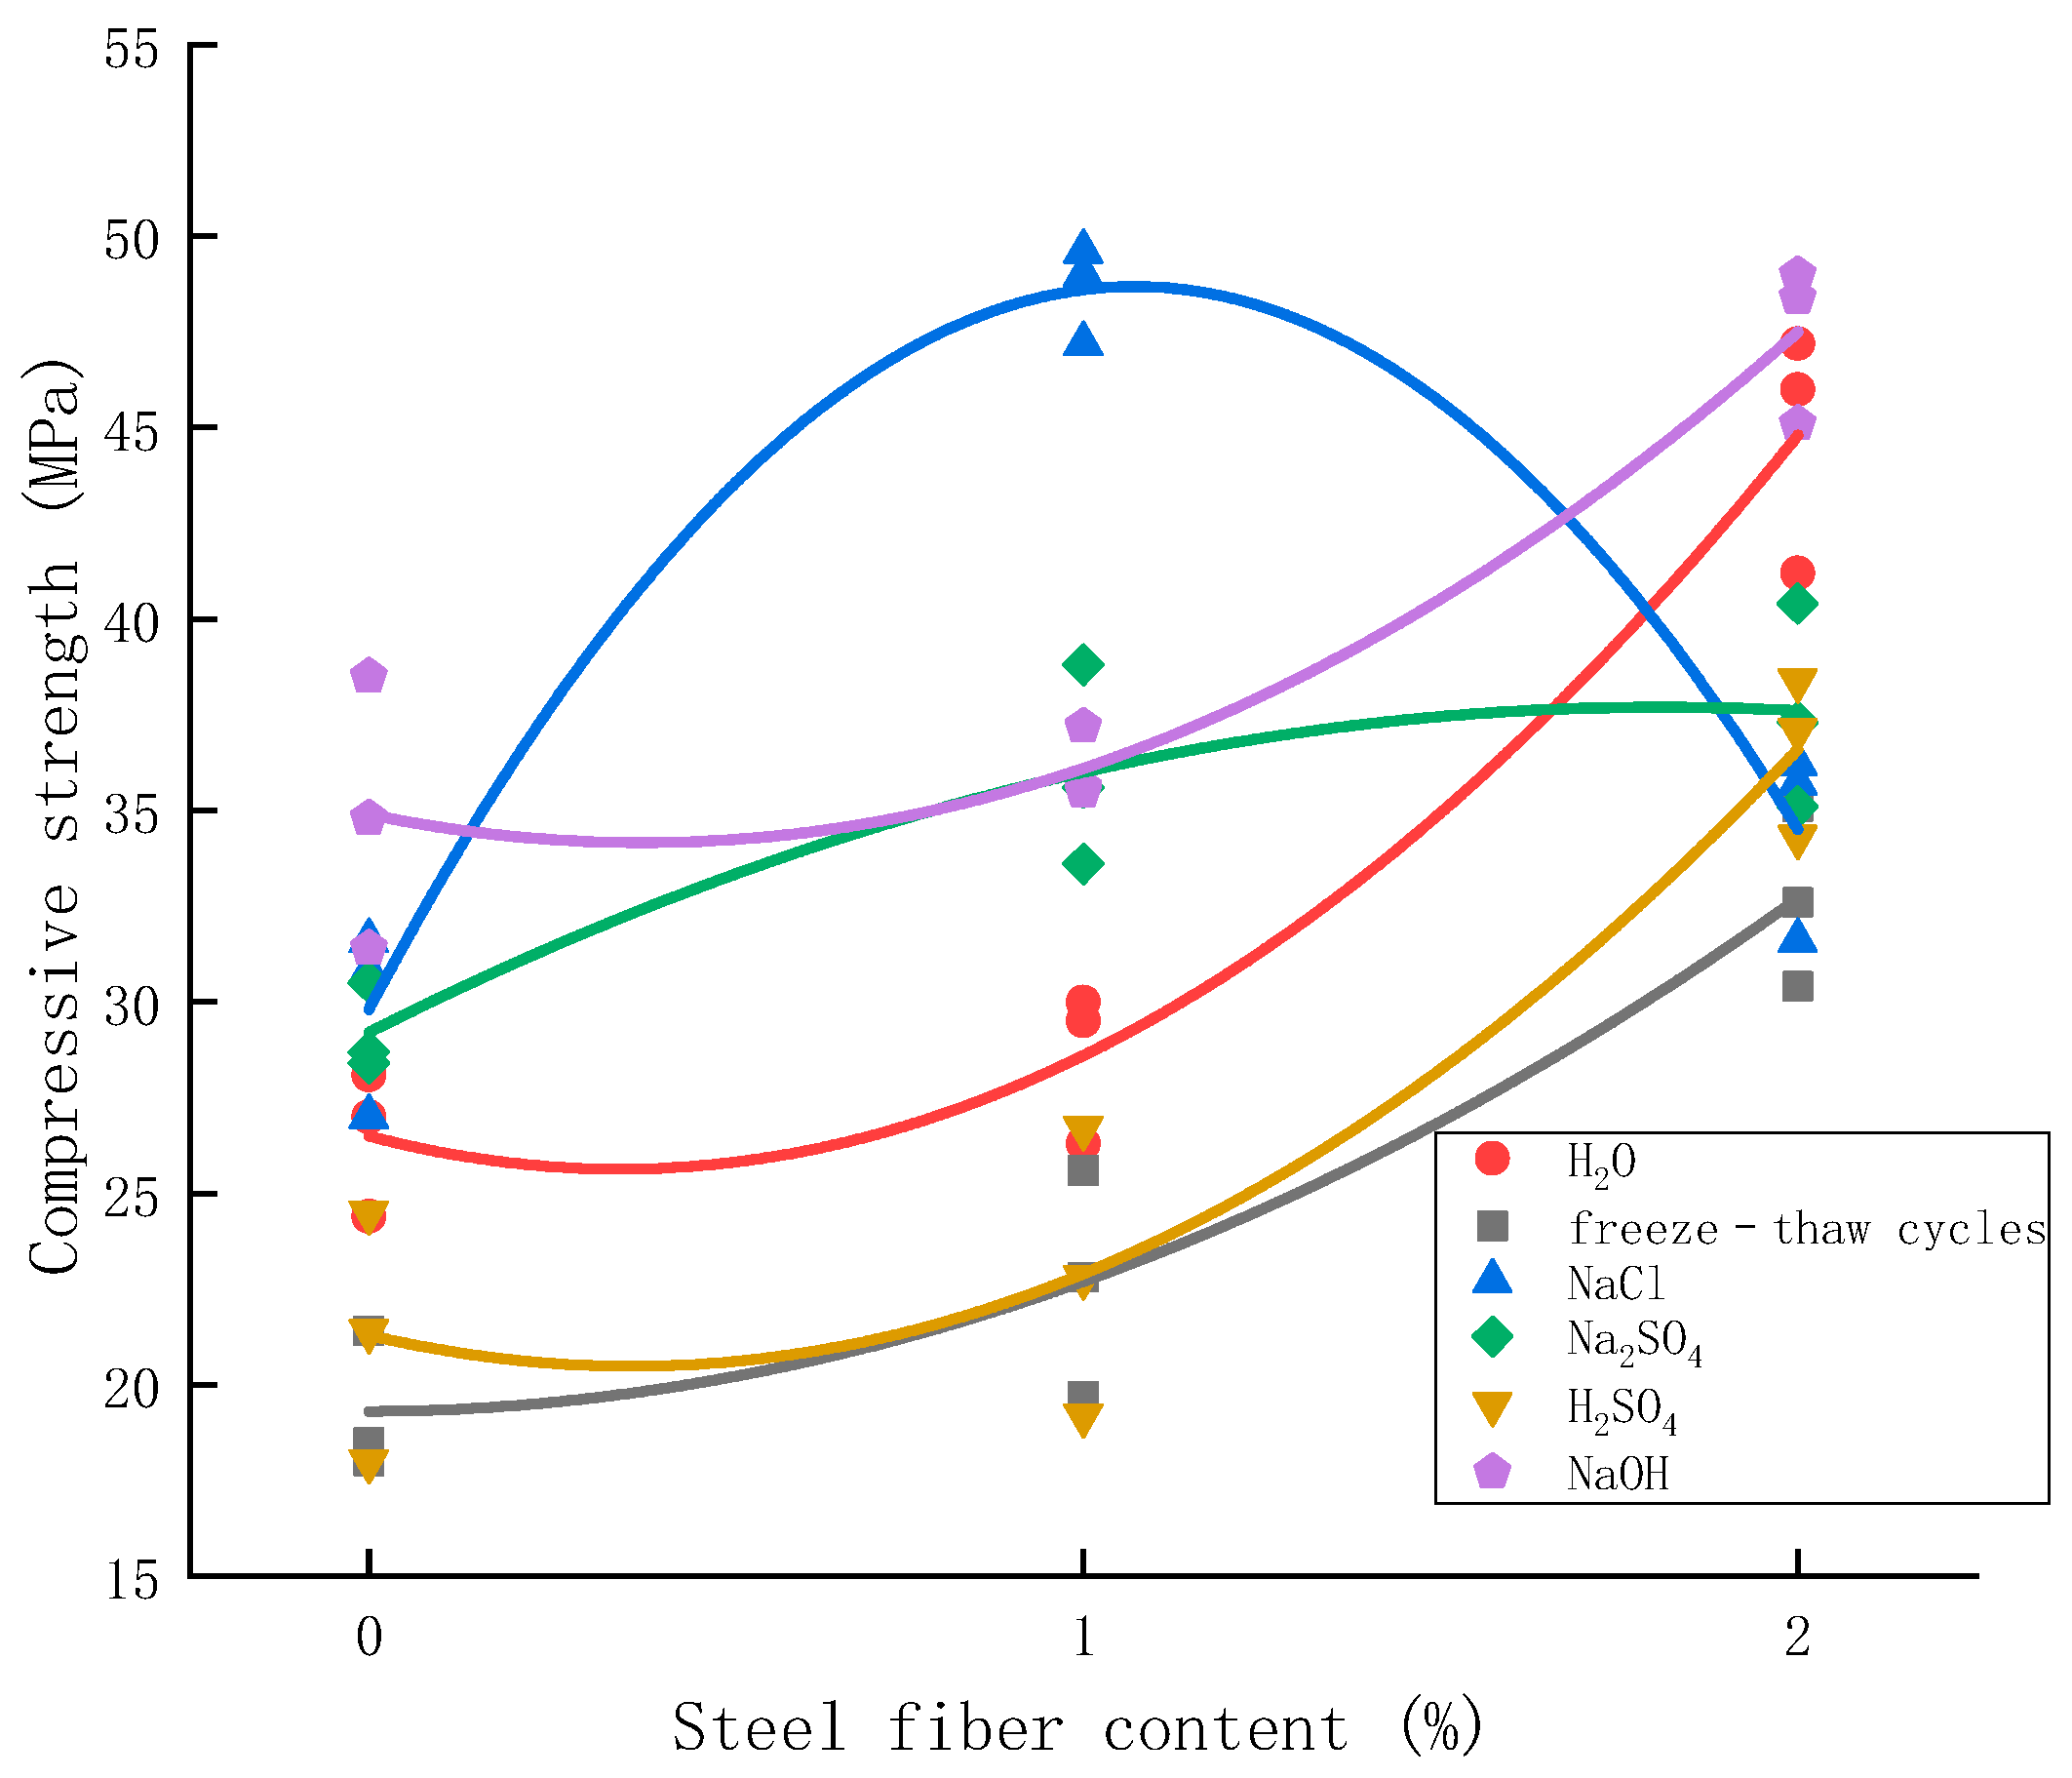
The axial compression test results of cylindrical specimens are shown in
Table 5.
The table can show that the intensity changes are different under different erosion environments. After adding steel fiber into concrete, the compressive strength of concrete in various environments mainly increases with the increase in steel fiber. Compared with ordinary concrete, the compressive load of the steel-fiber concrete is improved. When the pressure direction of fiber in the member is oriented vertically, it can effectively stop the transverse deformation and show the best reinforcement effect. With the increase in soaking time, the soaked water specimens are considered the control group. The axial compressive strength of the specimens soaked in other solutions decreased, indicating that various adverse environments have large or small destructive effects on the concrete specimens. The steel fiber can effectively prevent the corrosion of the chemical environment on the concrete. Generally speaking, the more steel fiber is added, the higher the strength of the specimen. However, with the decrease in erosion failure strength, the strength of the specimen with the same fiber volume content is different in different erosion environments. The influence of different environments on the strength of steel fiber-reinforced concrete needs further study.
The experimental data show that adding steel fiber in different erosion environments is beneficial. Adding more steel fiber in most environments will have better mechanical properties, effectively resisting the damage of adverse environments. However, in the NaCl and Na2SO4 environment, adding 2% steel fiber is worse than adding 1% steel fiber, and it also reduces the mechanical properties of concrete. After adding 2% steel fiber, the mechanical properties of specimens are less than those of plain concrete, which makes the addition of fiber negatively correlated with compressive strength, so it is not always the case that adding more steel fiber will achieve better results. Therefore, it is essential to carry out experimental research before steel fiber is applied to practical construction projects, which can avoid the waste of material resources and the adverse effects caused by improper mix proportions.
Adding excessive steel fiber in the environment of sodium chloride and sodium sulfate not only causes material waste, but also adversely affects the performance of building structures.
According to the microscopic observation results, it can be seen that freeze-thaw cycles have the greatest impact on the concrete specimen. According to the strength changes before and after 100 freeze-thaw cycles, the strength loss rate is calculated, which is the ratio of the change before and after erosion to the compressive strength before erosion. The strength increase rate is the ratio of the strength after erosion to the compressive strength before erosion of the plain concrete. After 100 freeze-thaw cycles, the compressive strength of the specimens with 0%, 1% and 2% content lost 35.0%, 33.7% and 34.5% respectively. The compressive strength of steel fiber reinforced concrete specimens with 1% and 2% content increased by 17.6% and 69.2% respectively. From the calculated value, it can be concluded that adding steel fiber can effectively inhibit the damage of concrete caused by freeze-thaw cycle, and the effect of adding 2% steel fiber is better than that of adding 1% volume fraction steel fiber.
3.4. Grey Correlation Analysis
Grey relational analysis is a statistical analysis technique that originates from the grey system theory in the system science theory. It is suitable for the quantitative analysis of the dynamic development process, and there will be no discrepancy between the quantitative and qualitative results.
Compared with traditional analysis methods, such as variance analysis or regression analysis, which only take a single index as the measurement standard, the grey correlation degree analysis can comprehensively and genuinely reflect the changes of comprehensive factors by comparing multiple traits. As a result, its comprehensive evaluation results are more scientific and accurate [
40,
41,
42].
Grey correlation analysis theory is an integral part of grey system theory, and correlation is the correlation between the reference and influencing factors. The greater the correlation, the greater the correlation value, and the more sensitive the influencing factors are to comparative factors. This study divides the grey correlation analysis into six steps [
43,
44].
Step 1: Select the reference sequence X0 = (x01, x02, x03, x04, x05, x06, x07), Compare the sequence Xi = (xi1, xi2, xi3, xi4, xi5, xi6, xi7), where i = 1, 2, 3…, n. The data sequence that reflects the characteristics of system behavior is called the reference sequence. A data sequence composed of factors that affect system behavior is called a comparative sequence.
This paper takes the axial compressive strength of concrete specimens soaked in water as the reference sequence X
0. The axial compressive data sequences of concrete specimens soaked in sodium chloride solution, sodium sulfate solution, dilute sulfuric acid solution, and sodium hydroxide solution and the frozen-thawed cycle is taken as the comparison sequences. From the numerical simulation analysis, it can be seen that the optimal content of steel fiber is different in different environments. However, considering the economy and applicability, the data of 1% volume content of steel fiber is selected in the grey correlation analysis, and the data of reference sequence and comparison sequence are shown in
Table 7.
Step 2: Dimensionless processing of variables. Due to the different physical meanings of the factors in the system, the data dimensions are not necessarily the same, which makes it inconvenient to compare or difficult to obtain a correct conclusion when comparing. Therefore, dimensionless data processing is generally required when analyzing the grey correlation degree. Common methods include the initial value method and the average value method. Here, the initial value method is used to obtain X’
i = X
i/xi1 = (x’i1, x’i2, …, x’in), i = 0, 1, 2, 3…, m. The above
Table 5 is dimensionless by the initial value method, and
Table 8 is obtained.
Step 3: Find the business trip sequence, maximum and minimum difference.
Sequence difference is Δ0i(k) = |x’0(k) − x’i(k)|, k = 1, 2, …, n.
The maximum difference of n is: M = Maxi Maxk Δi (k), and the minimum difference is: m = Mini Mink Δi(k).
The difference sequence values are calculated from
Table 6, and as shown in
Table 9, the difference sequence values are Δ01 = (0, 0.057, 0.586), Δ02 = (0, 0.624, 0.216), Δ03 = (0, 0.068, 0.168), Δ04 = (0, 0.075, 0.219) and Δ05 = (0, 0.039, 0.172)
Step 4: Calculate the correlation coefficient. The degree of correlation is essentially the difference in geometric shapes between curves. Therefore, the difference between curves can be used to measure the correlation degree.
r(x0(k), xi(k)) = (m + §M)/(Δ0i(k) + §M), § ∈ (0, 1). k = 1, 2, …, n. i = 0, 1, 2, …, m. Where § is the resolution coefficient, which is often taken as 0.5.
The maximum difference between two poles M = 0.624, the minimum difference between two poles m = 0, and the resolution = 0.5, respectively, can be used to obtain the grey correlation coefficient and grey correlation degree (see
Table 10).
Step 5: Find the correlation degree. Because the correlation coefficient is the correlation degree value between the comparison series and the reference series at each moment (each point in the curve), it has more than one number. The information is too scattered to make an overall comparison. Therefore, it is necessary to concentrate the correlation coefficient of each moment (each point in the curve) into one value, that is, to find its average value, which can be used as a quantitative expression of the correlation degree between the comparison series and the reference series.
According to the above results, we can know that r(x0, x1) = 0.567, r(x0, x2) = 0.642, r(x0, x3) = 0.824, r(x0, x4) = 0.798, r(x0, x5) = 0.845.
Step 6: Analyze the results. If r(x0, xi) > r(x0, xj) > r(x0, xk) > … > r(x0, xz), it means that xi is better than xj, xj is better than xk, and so on. xi > xj > xk > … > xz. xi > xj indicates that the grey correlation degree of factor xi to reference sequence x0 is greater than xj. The greater the correlation, the stronger the closeness between this group of factors and parent factors.
The influence of environment on the axial compressive strength of steel fiber-reinforced concrete can be explained by the coefficient from large to small, followed by freeze-thaw cycles, dilute sulfuric acid, sodium hydroxide, sodium sulfate and sodium chloride.
This shows that the freeze-thaw cycle environment has the closest relationship with the axial compressive strength of the specimen. It has the most significant influence on the mechanical properties of the specimen, followed by sulfuric acid environment, sodium hydroxide, sodium sulfate environment, and sodium chloride environment. The gray correlation coefficient between the axial compressive strength of steel fiber-reinforced concrete and freeze-thaw cycle erosion is the largest. It is the most severely damaged by freeze-thaw. Concrete’s overall axial compressive strength is improved after adding steel fiber, so we can continue to study adding fiber materials to concrete or improving the concrete formula to weaken the impact of this erosion.
Similarly, the sulfuric acid environment significantly impacts concrete, and its correlation is slightly less than that of the freeze-thaw cycle. However, it still plays an essential role in concrete damage. Therefore, to avoid this kind of damage in the actual design, exposure time to a sulfuric acid environment needs to be reduced.
The results of grey correlation analysis verify the microscopic observation results, and the freeze-thaw cycle has the most significant influence on the failure of concrete specimens.


