
Compressive Strength of Steel Fiber-Reinforced Concrete Employing Supervised Machine Learning Techniques


 ,
,  ,
,  ,
,
Abstract
:1. Introduction
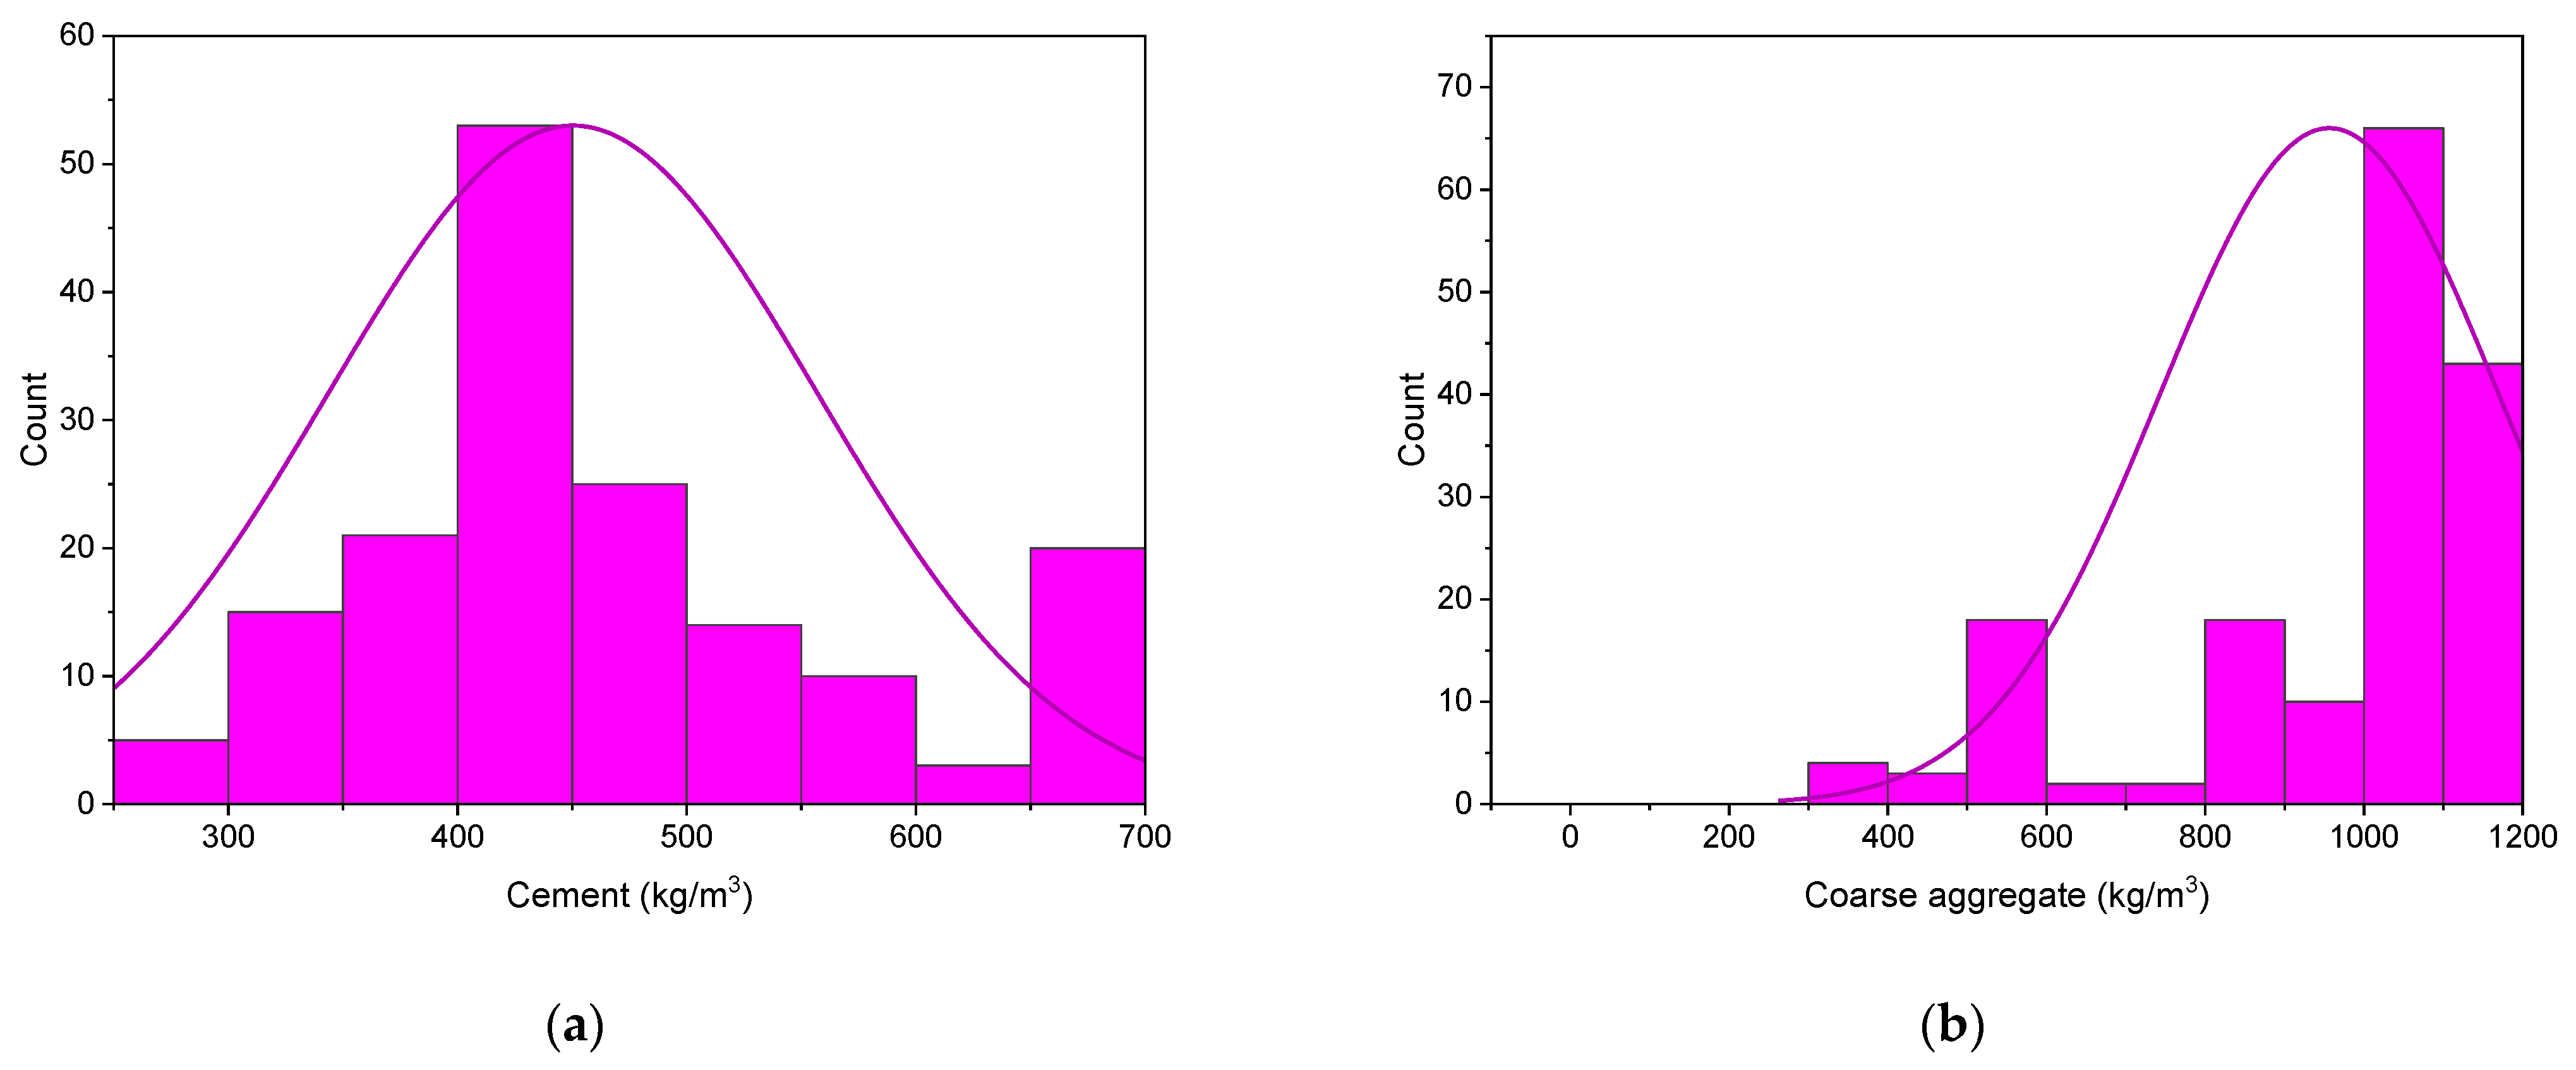
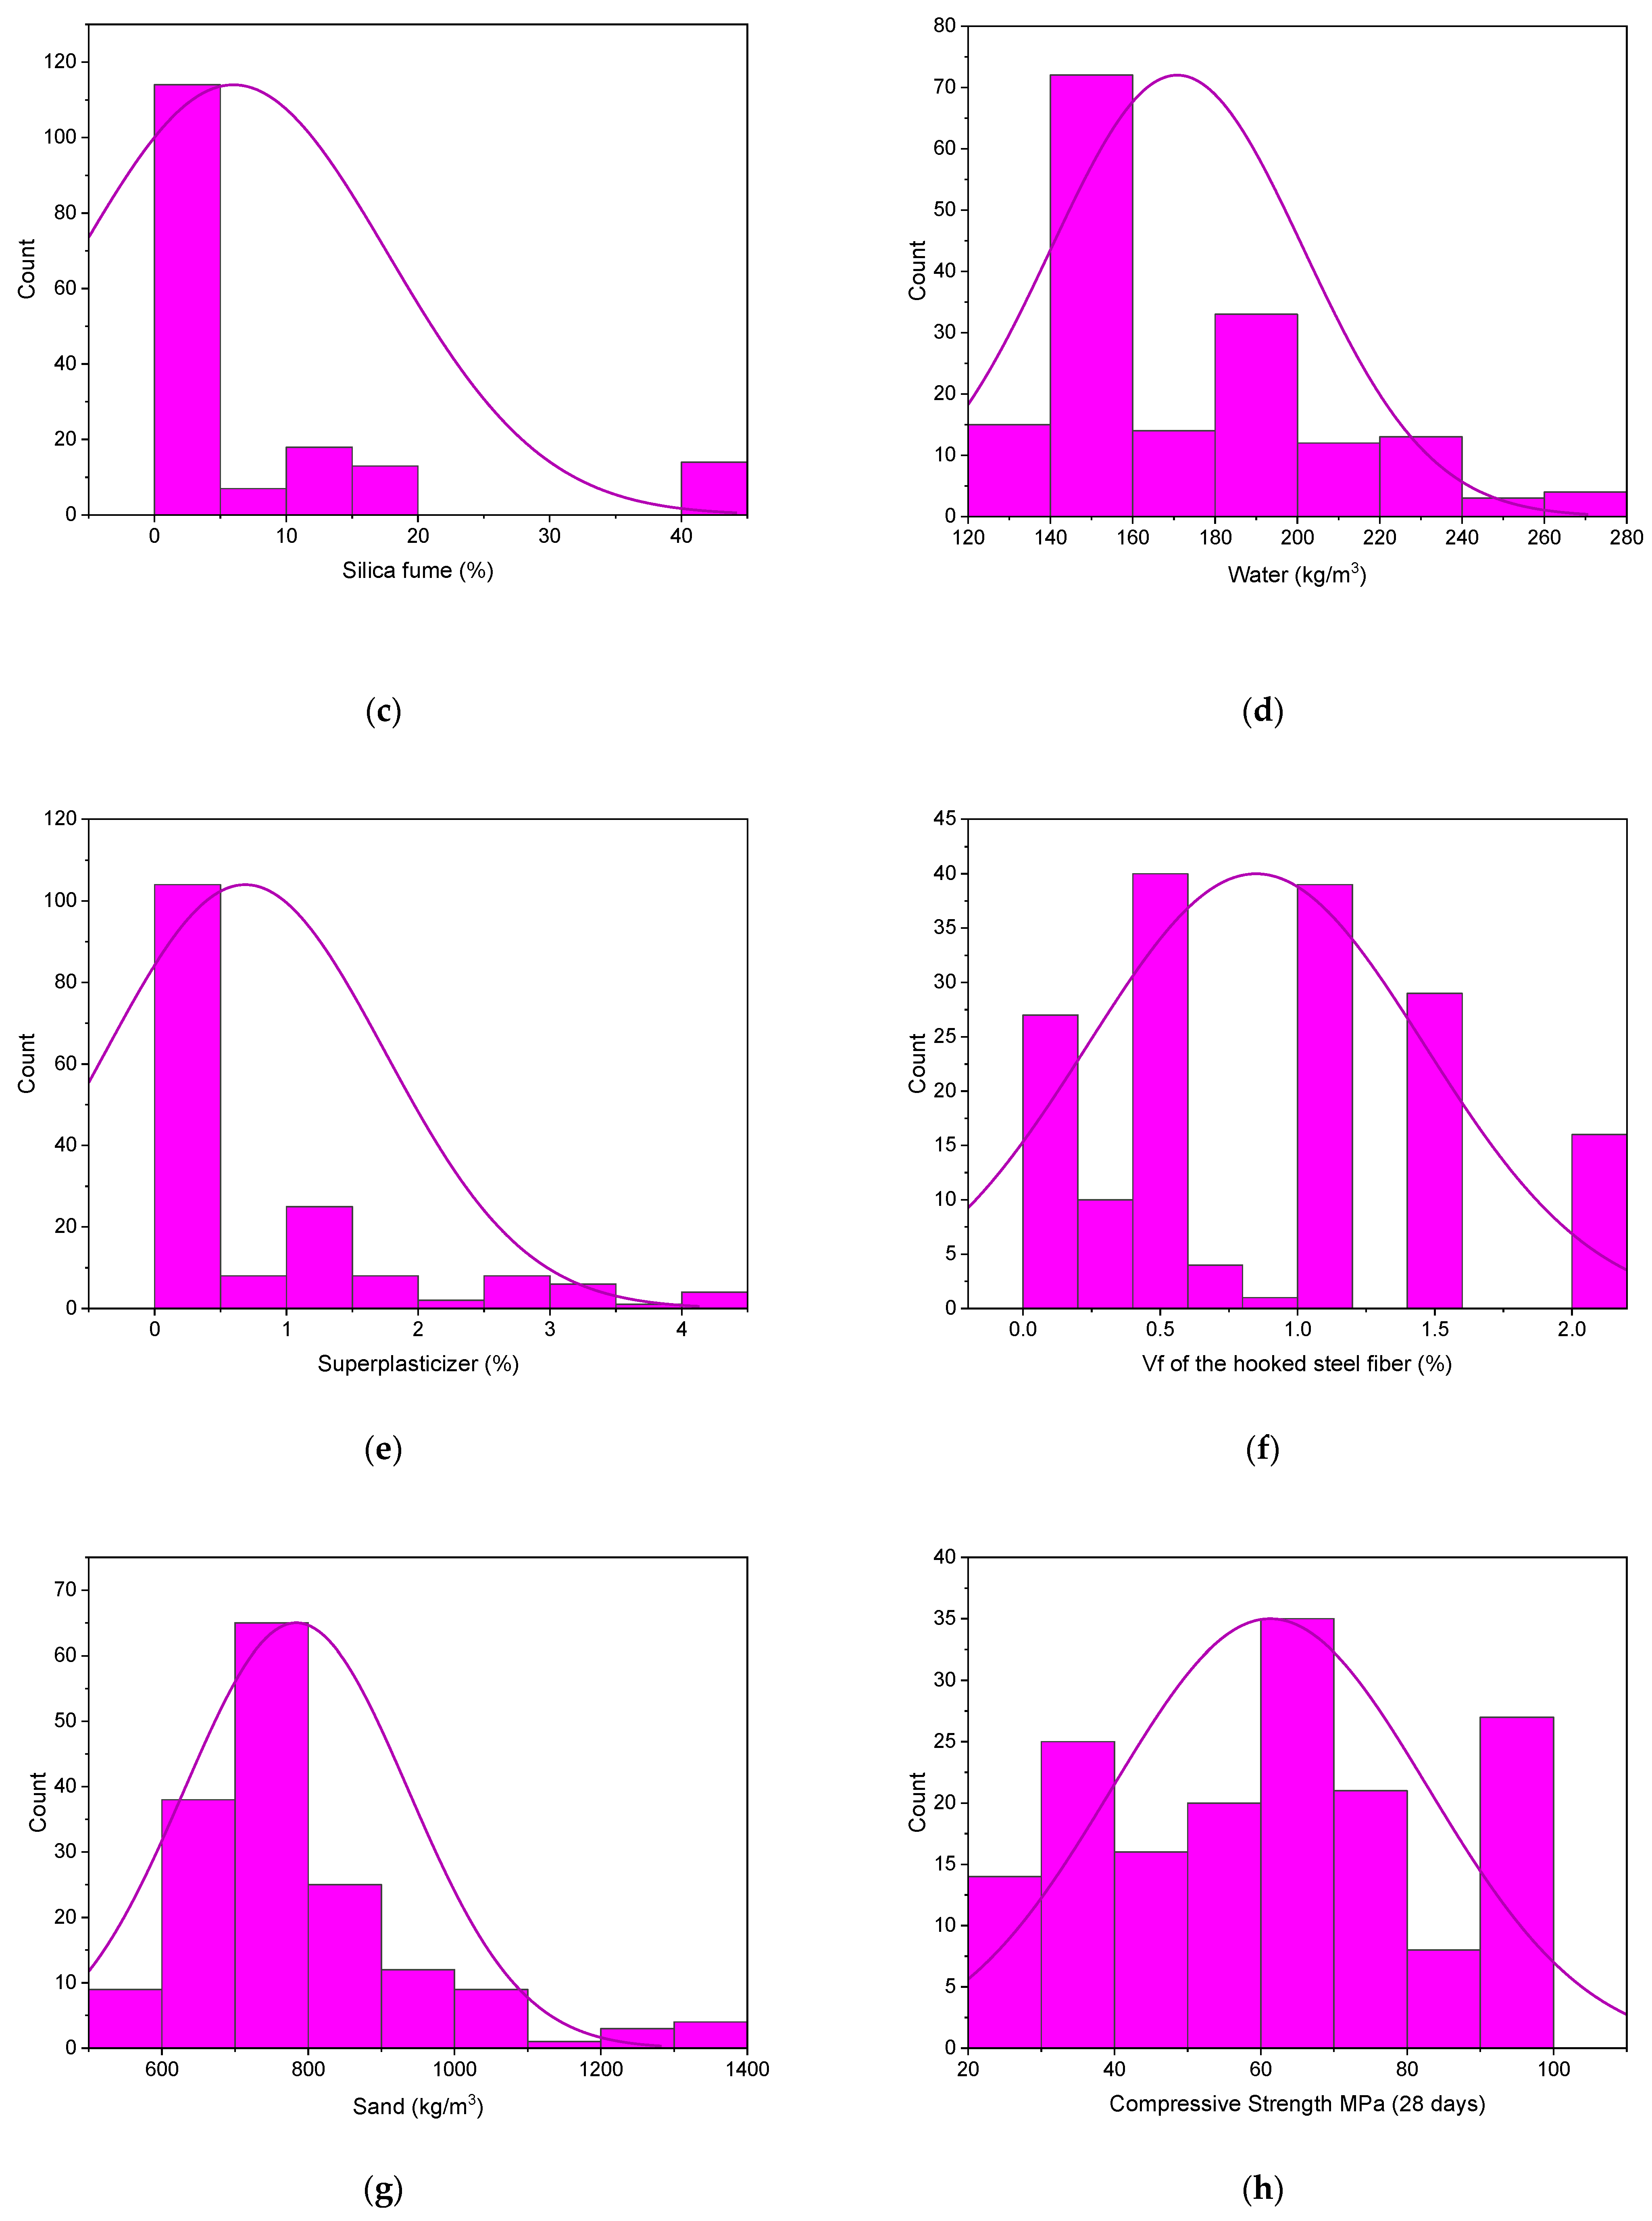
2. Data Description
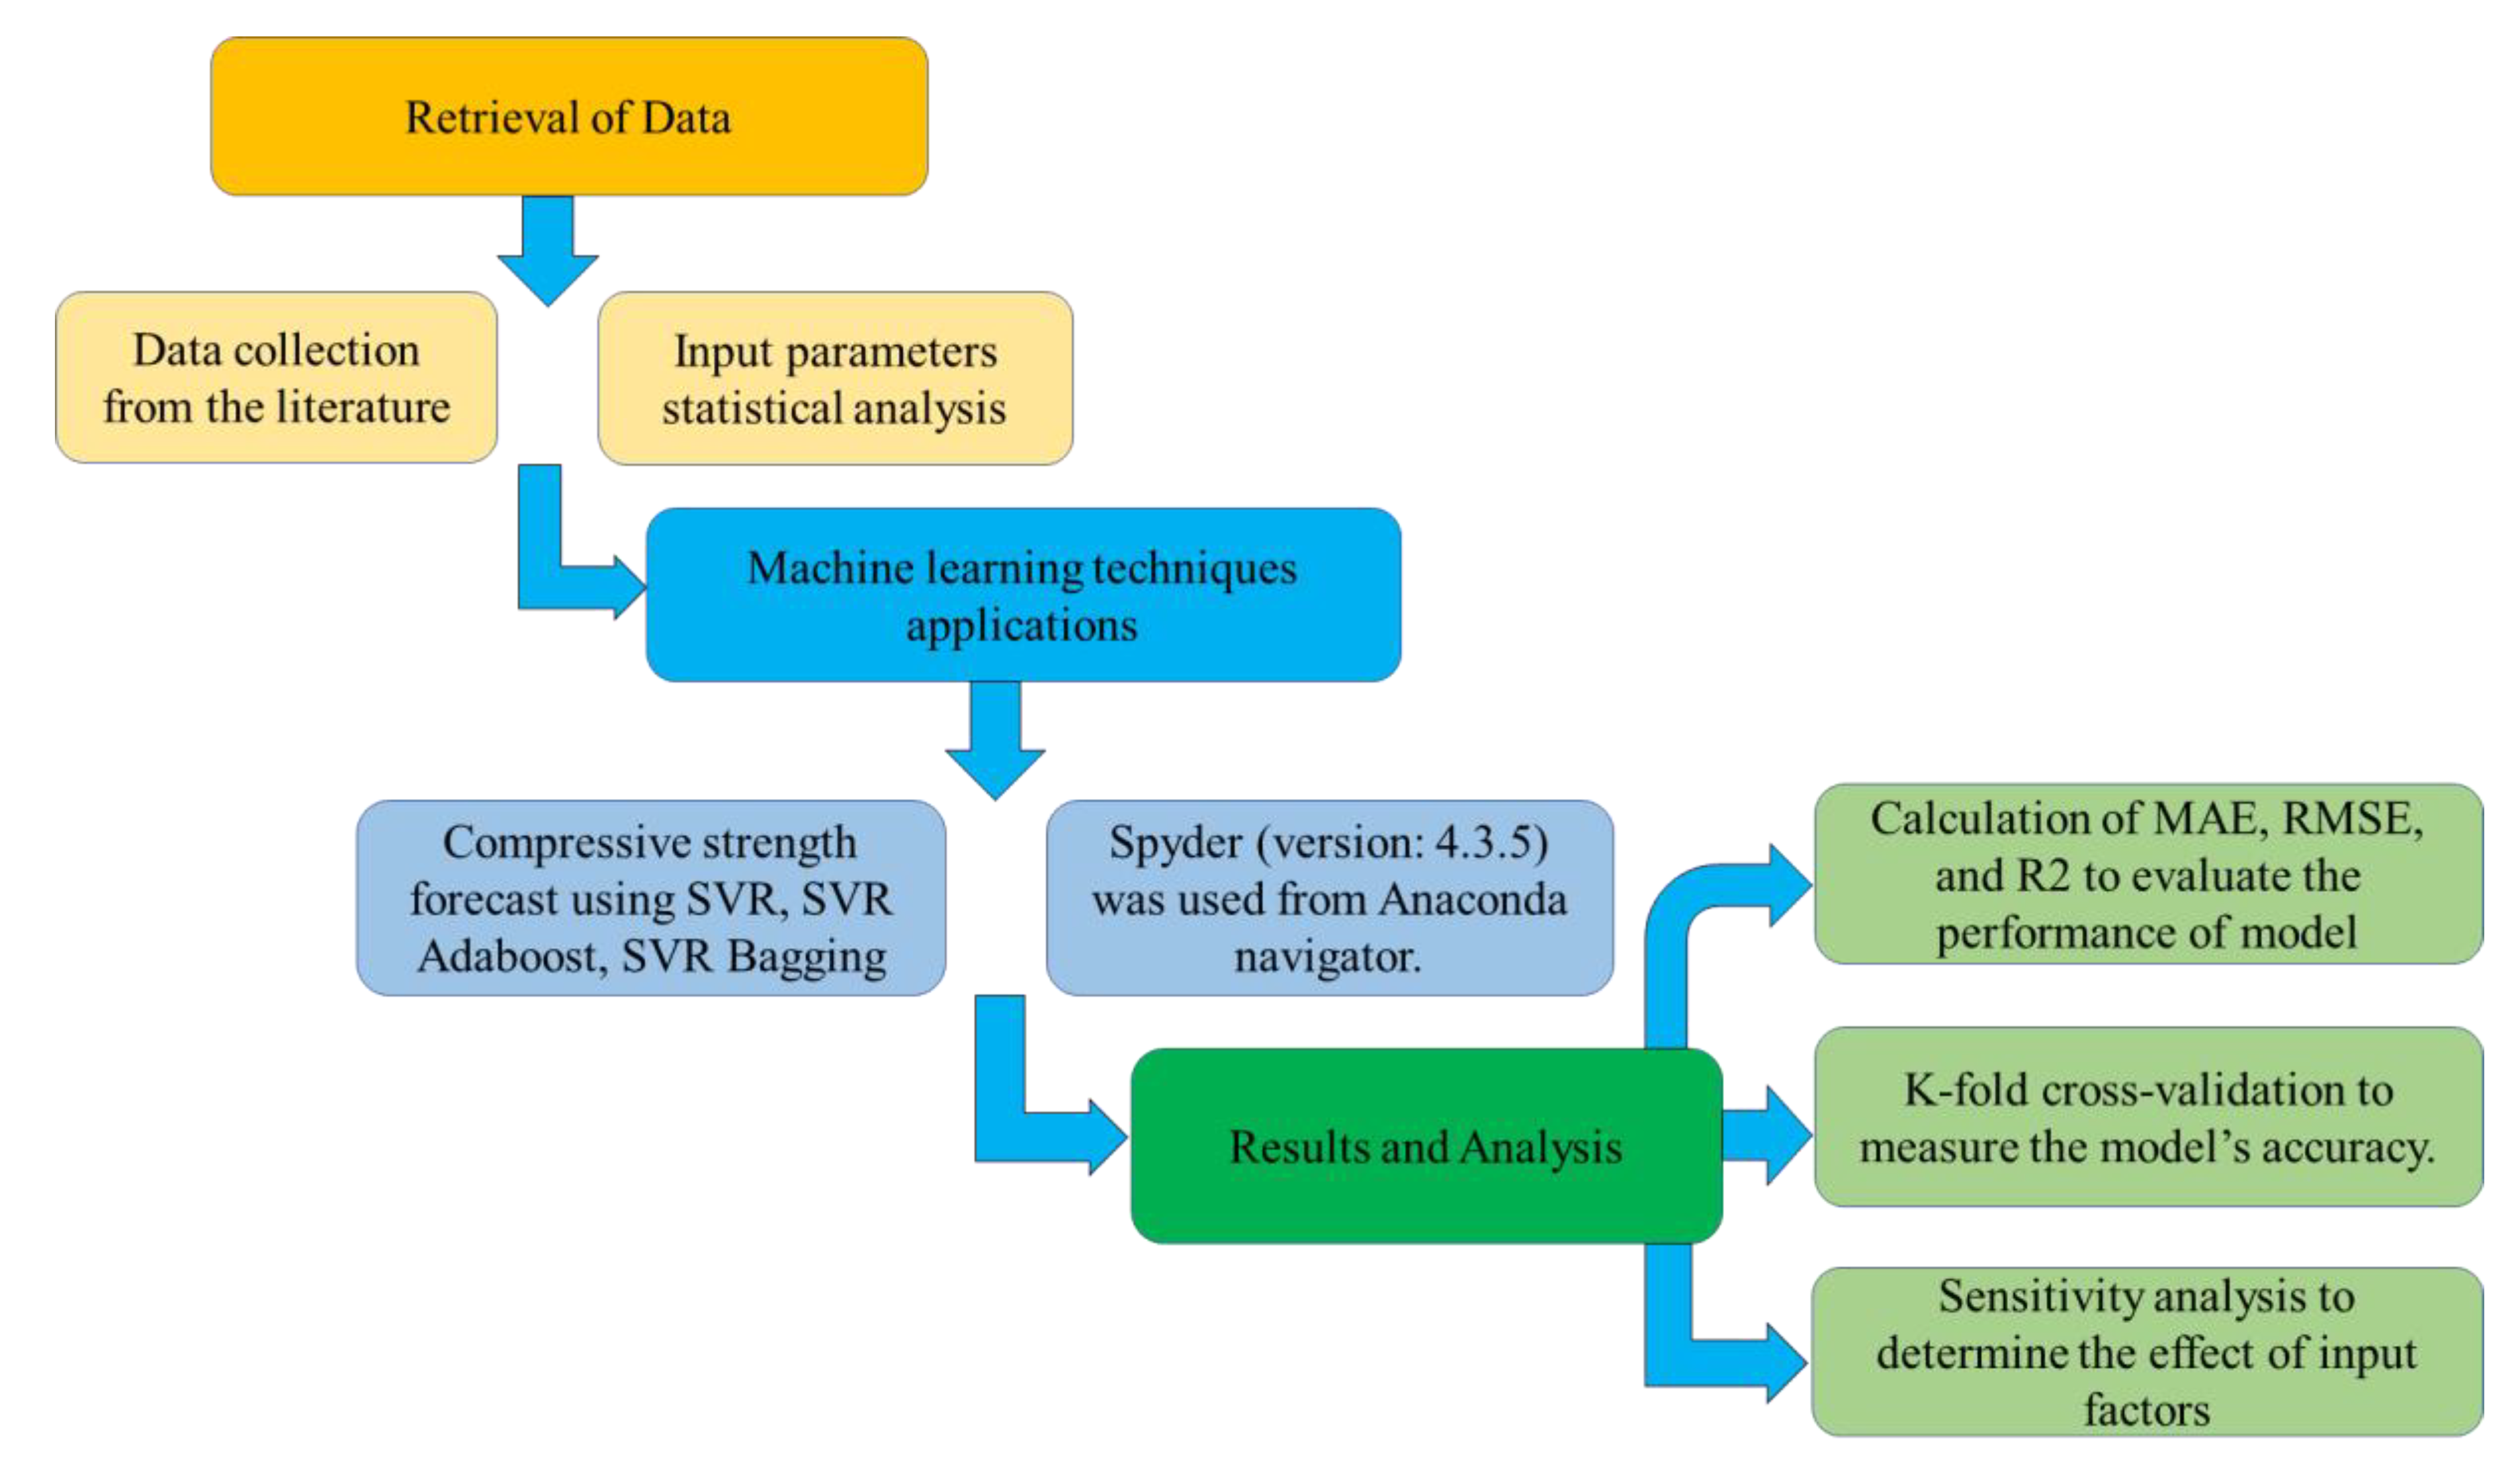
3. Research Strategy
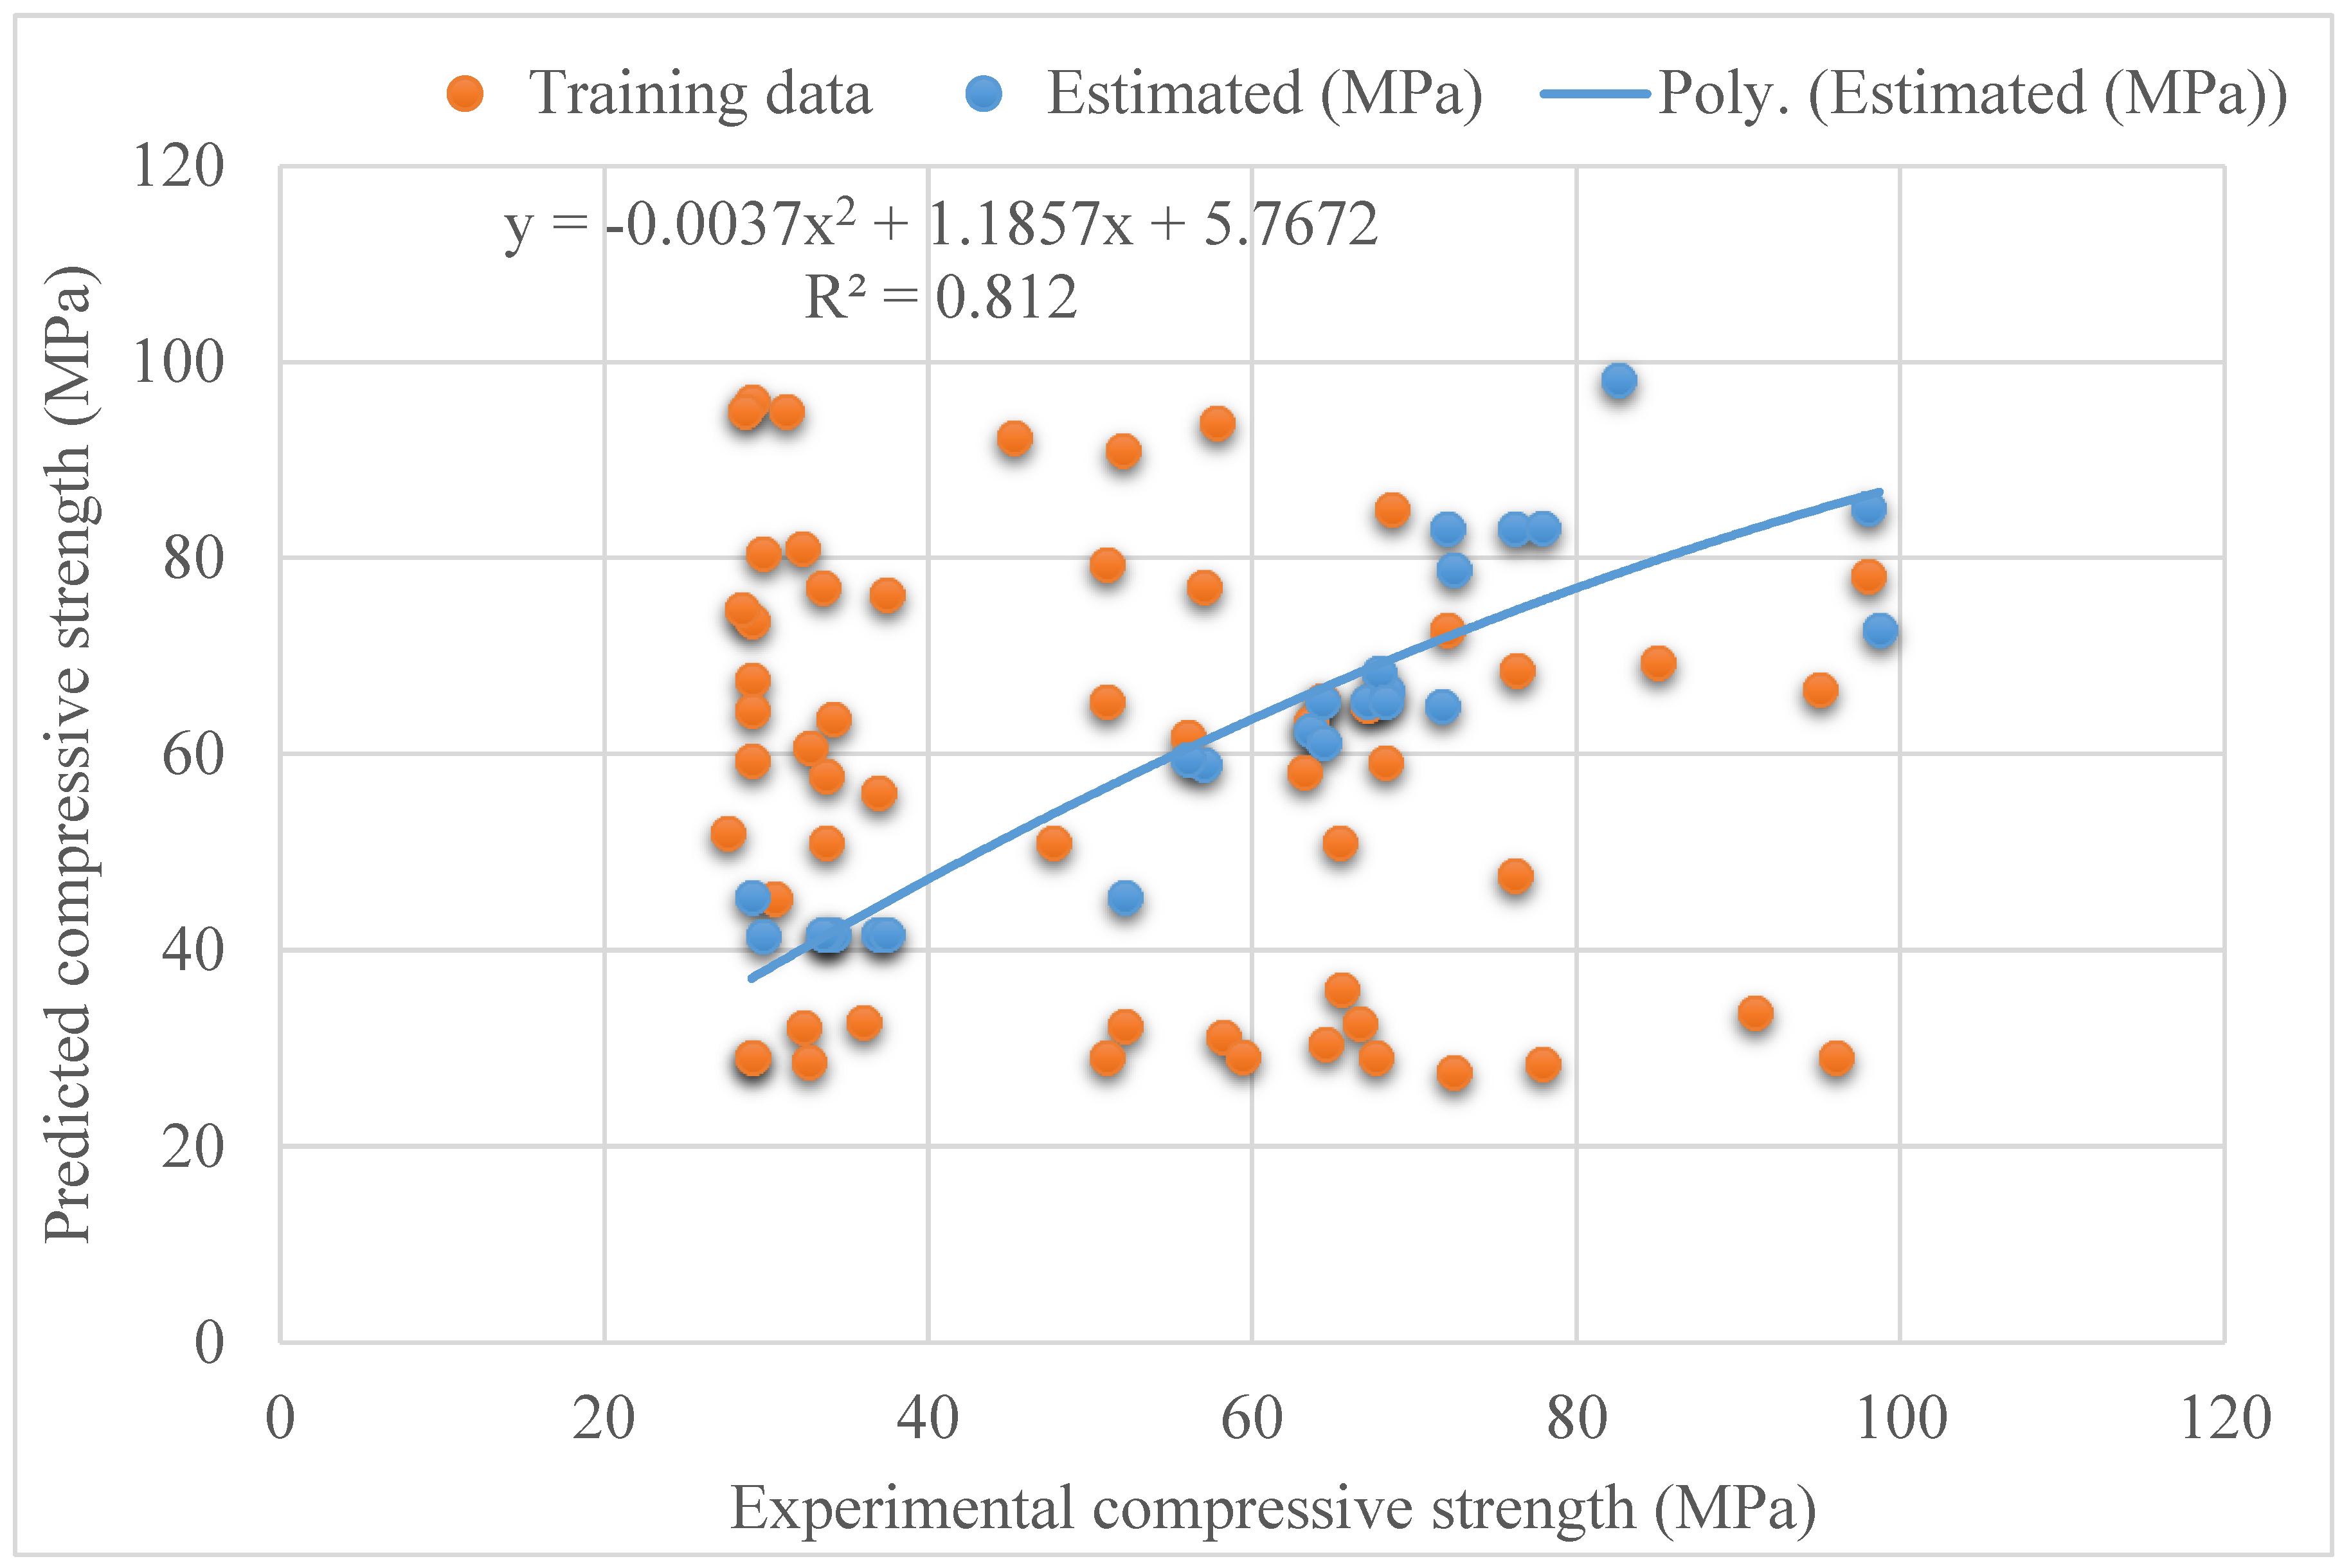
4. Results and Discussions
4.1. Statistical Analysis Explanation
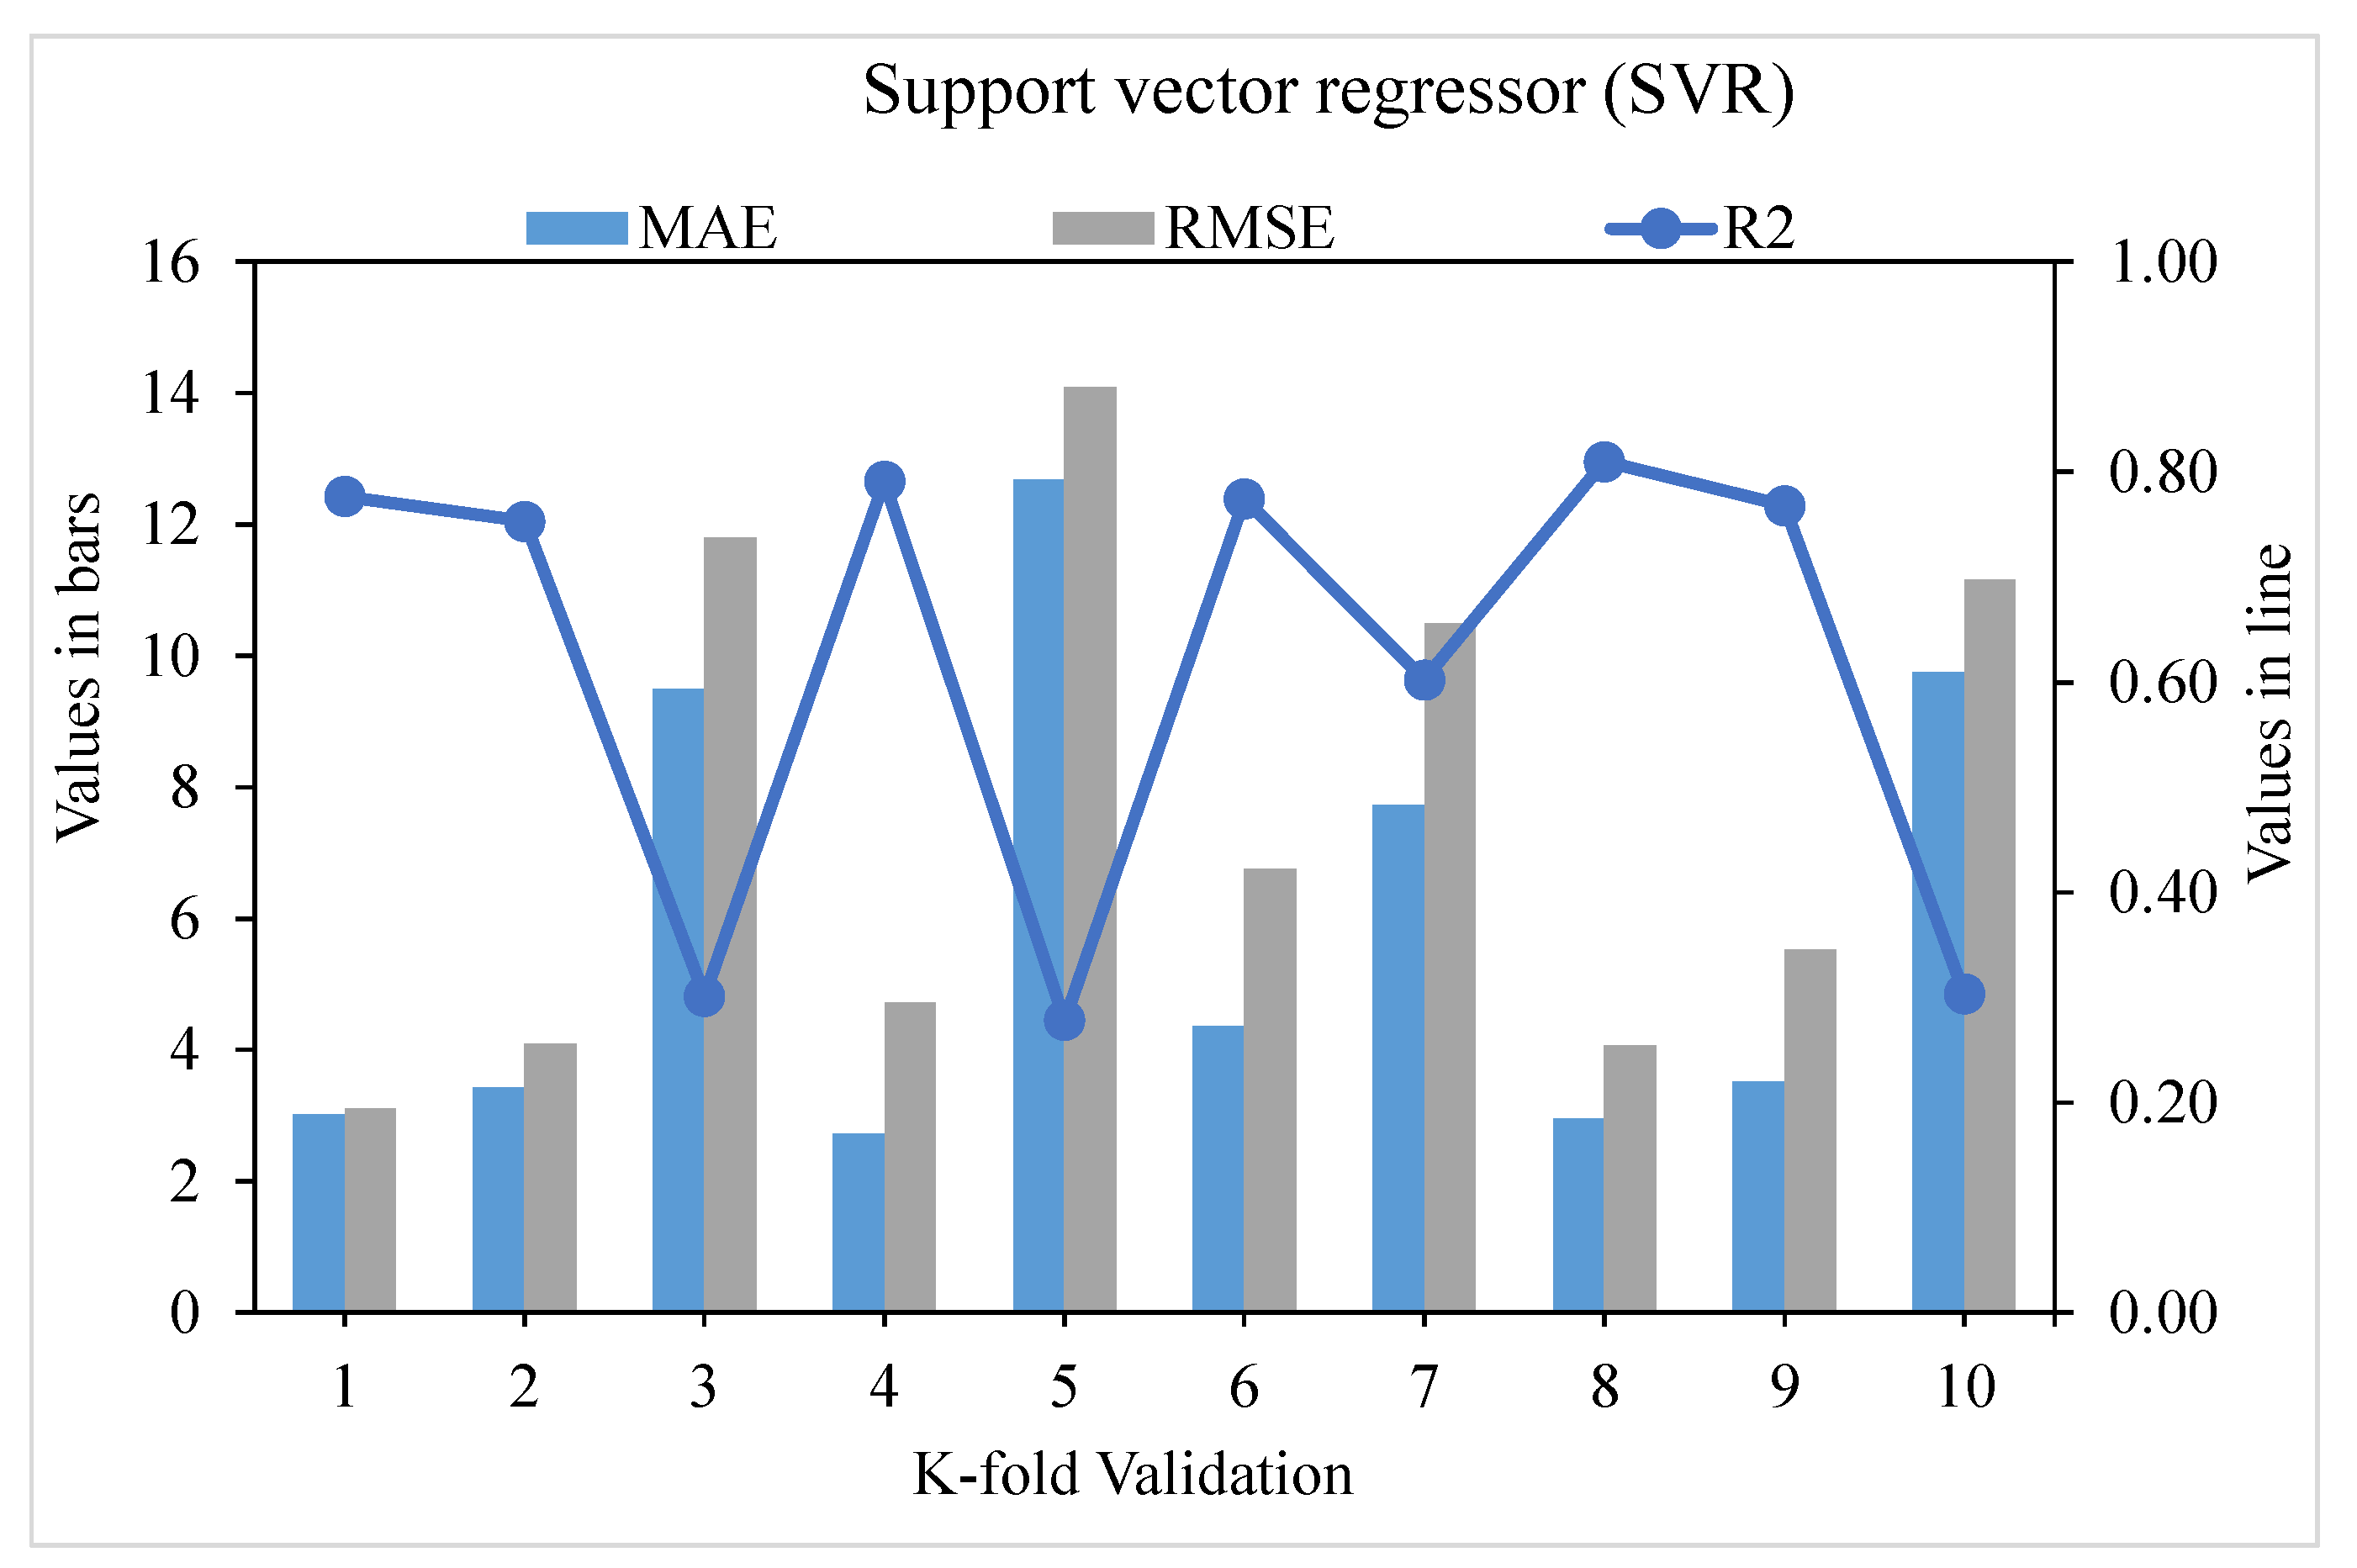
4.2. Cross-Validation Using the K-Fold Scale
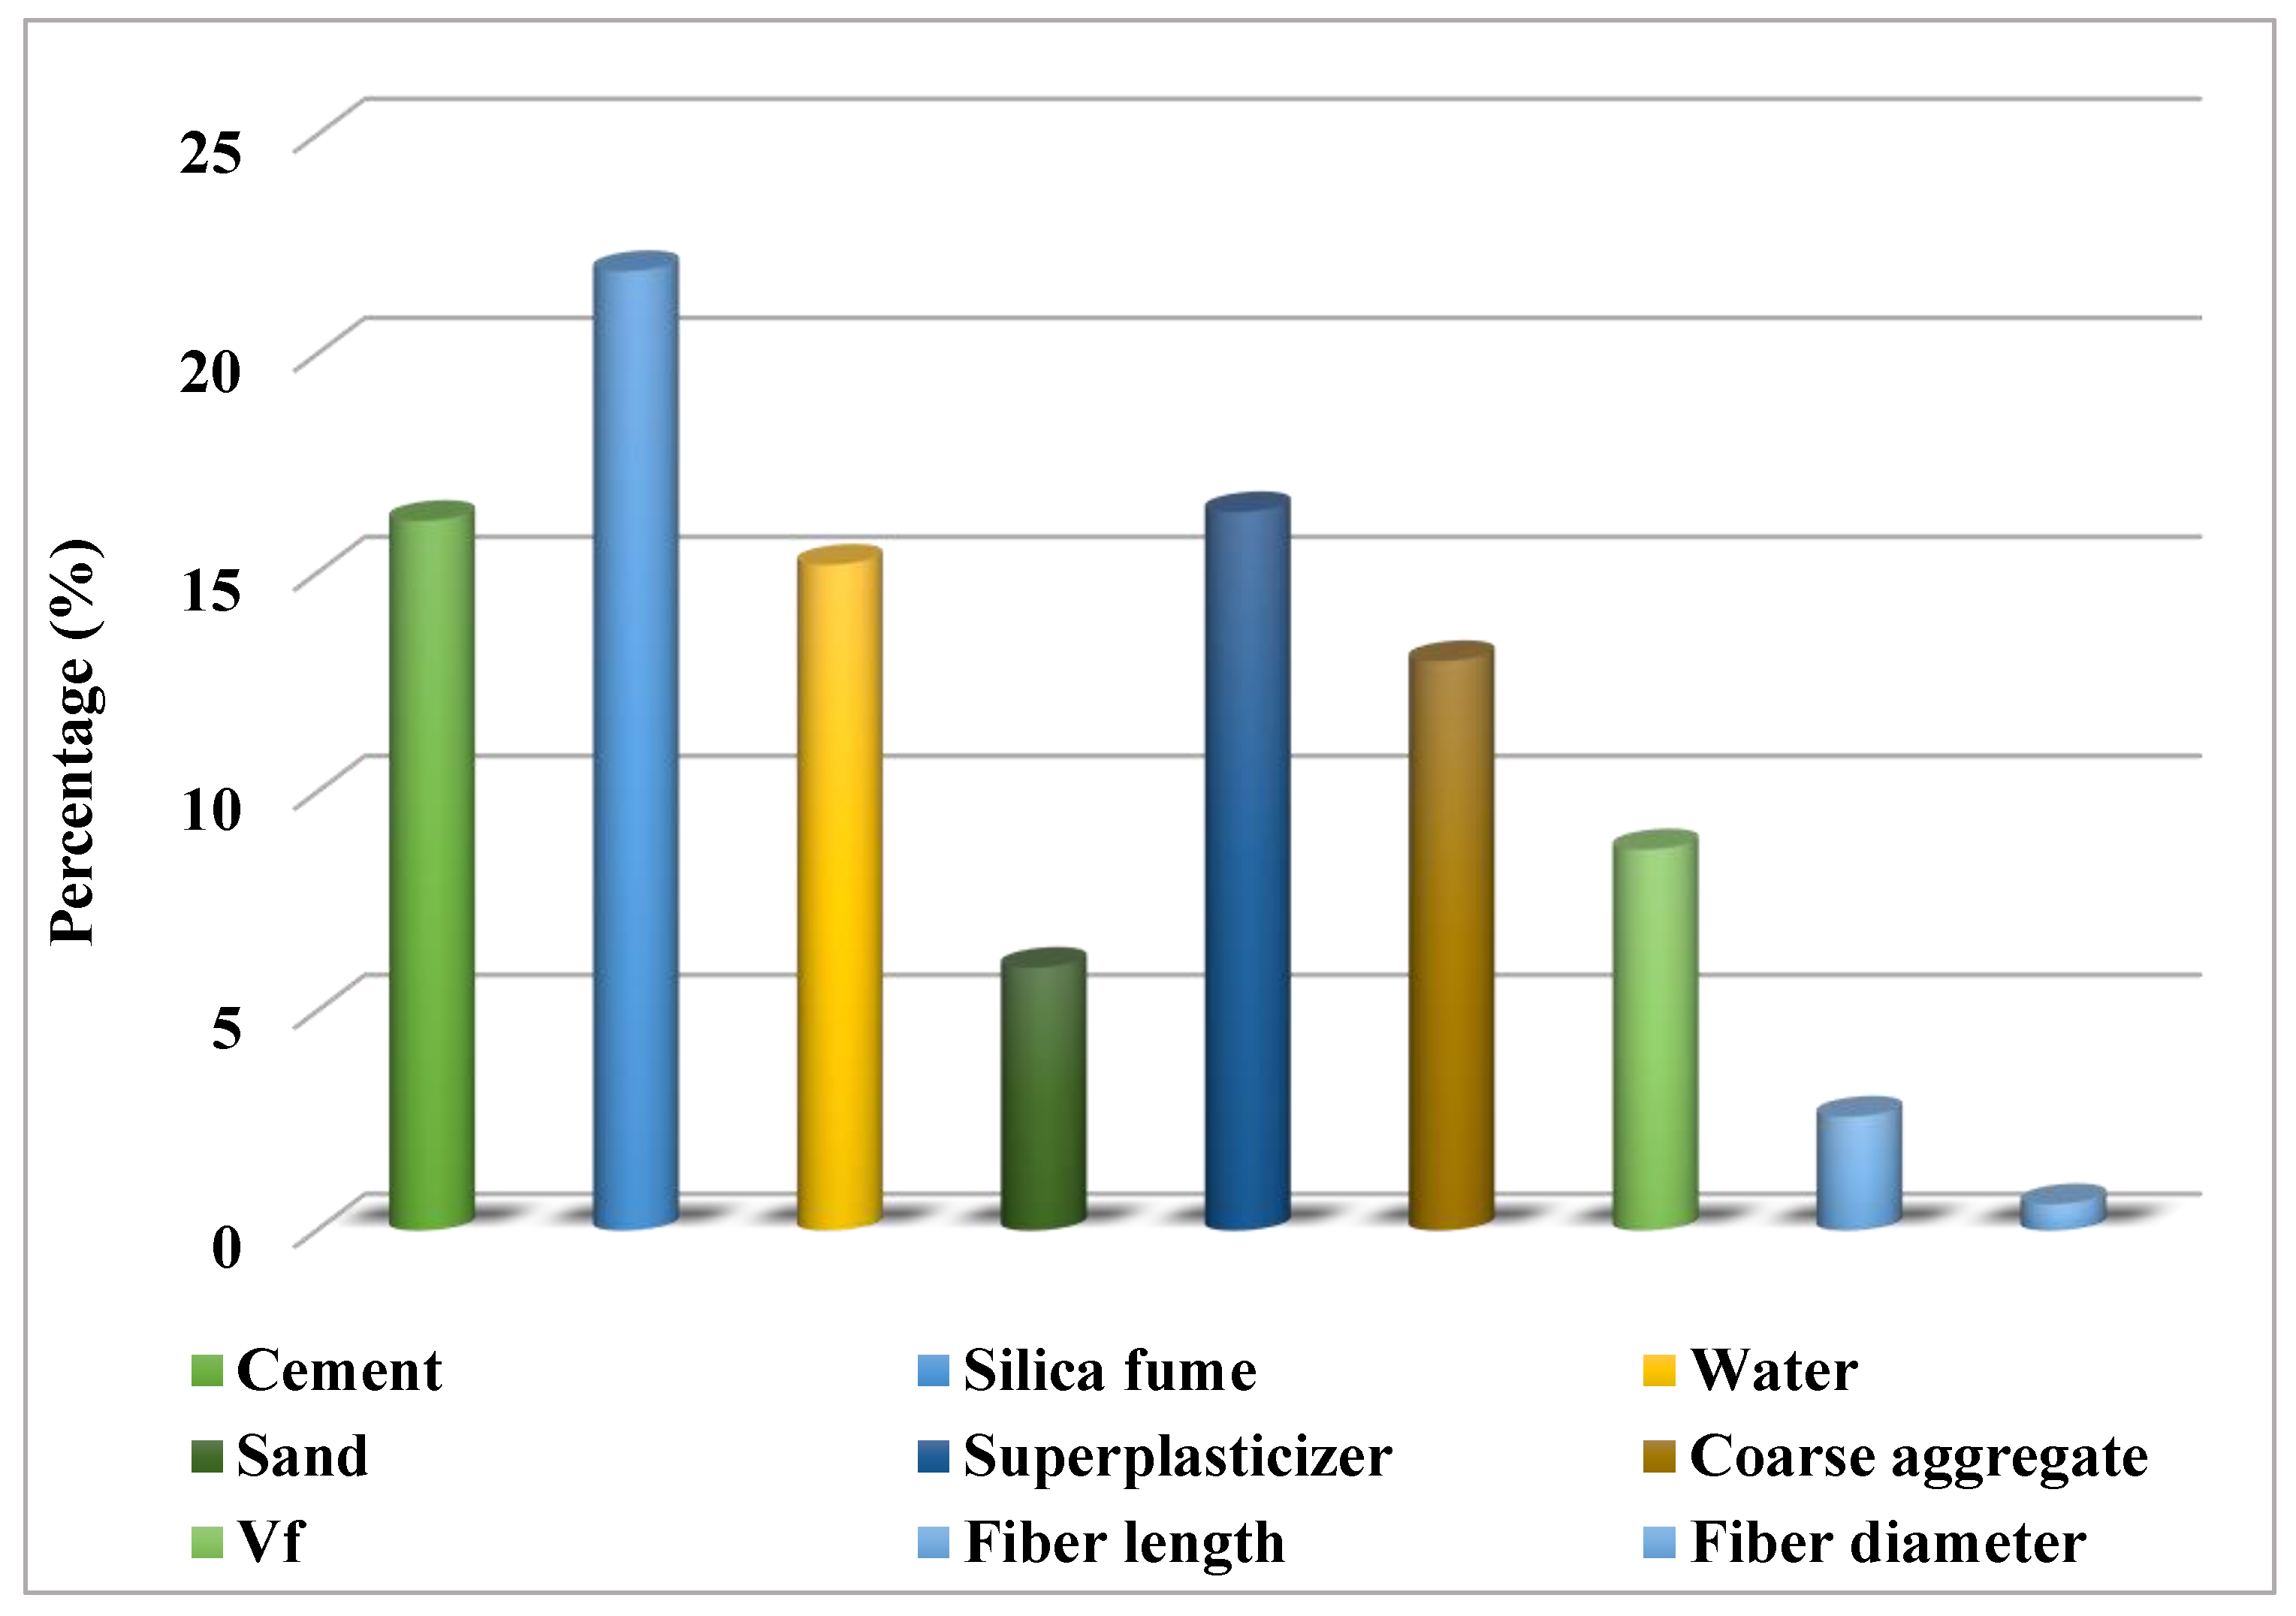
4.3. Sensitivity Analysis
5. Discussion
6. Conclusions
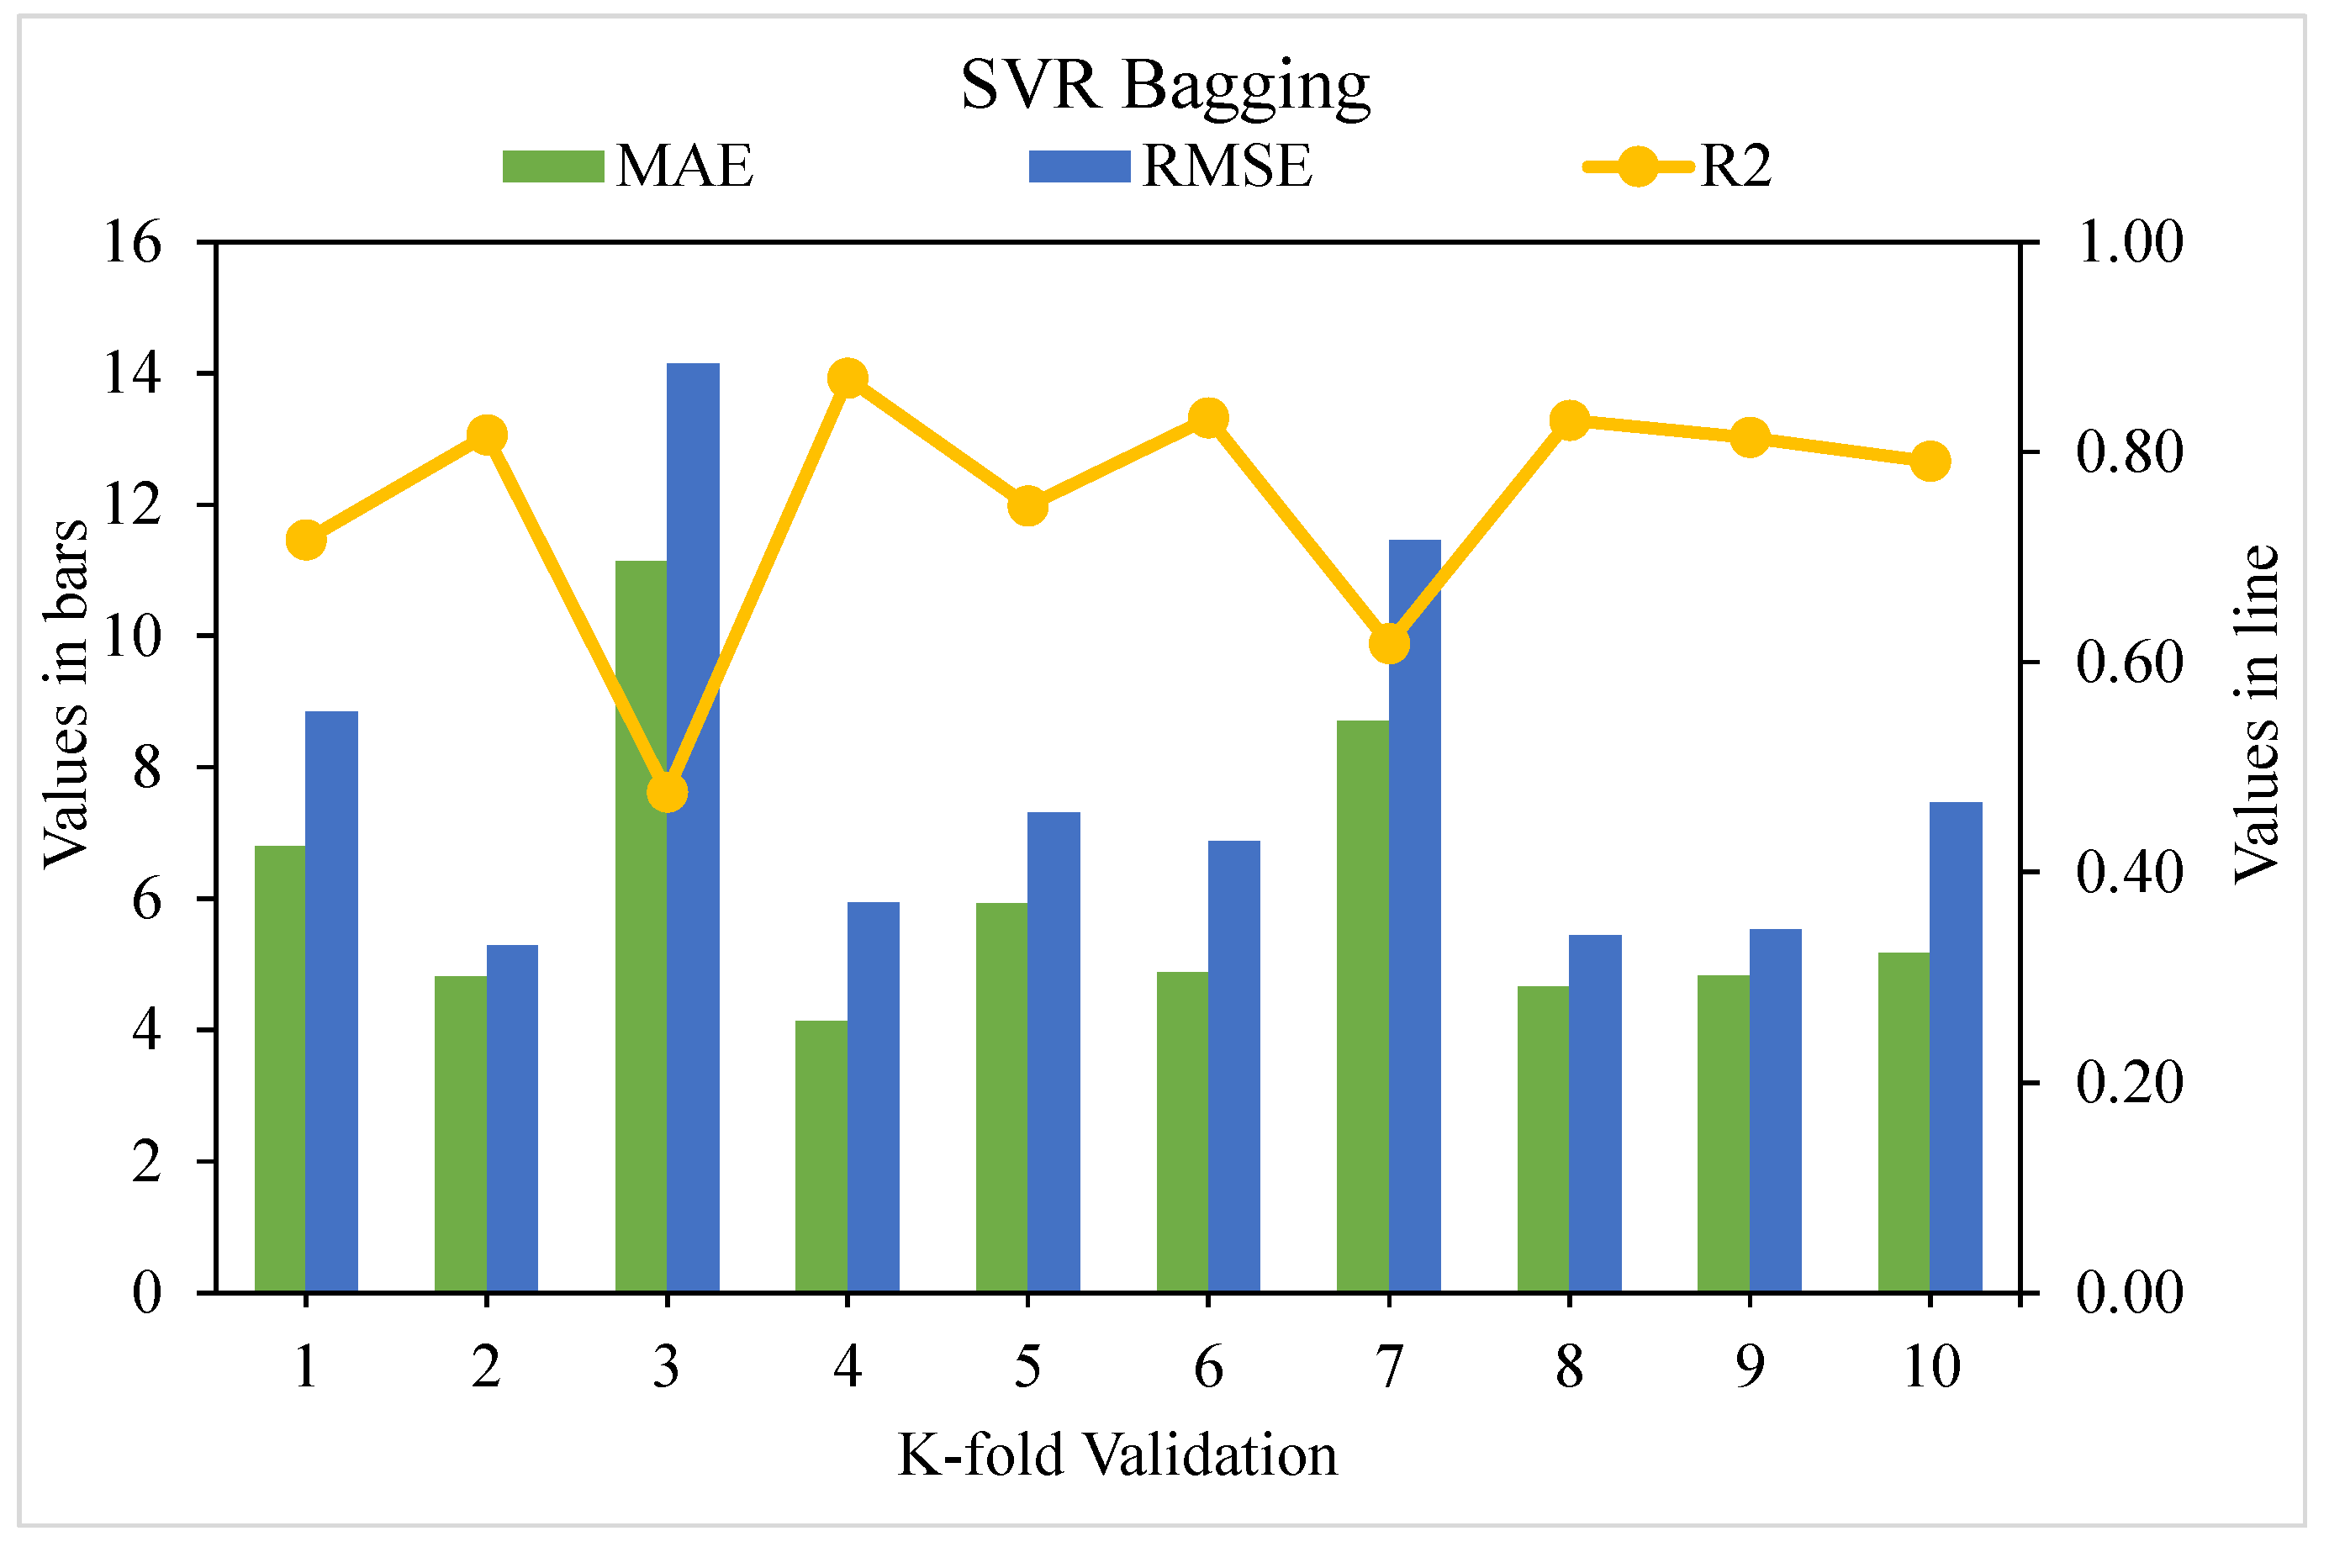
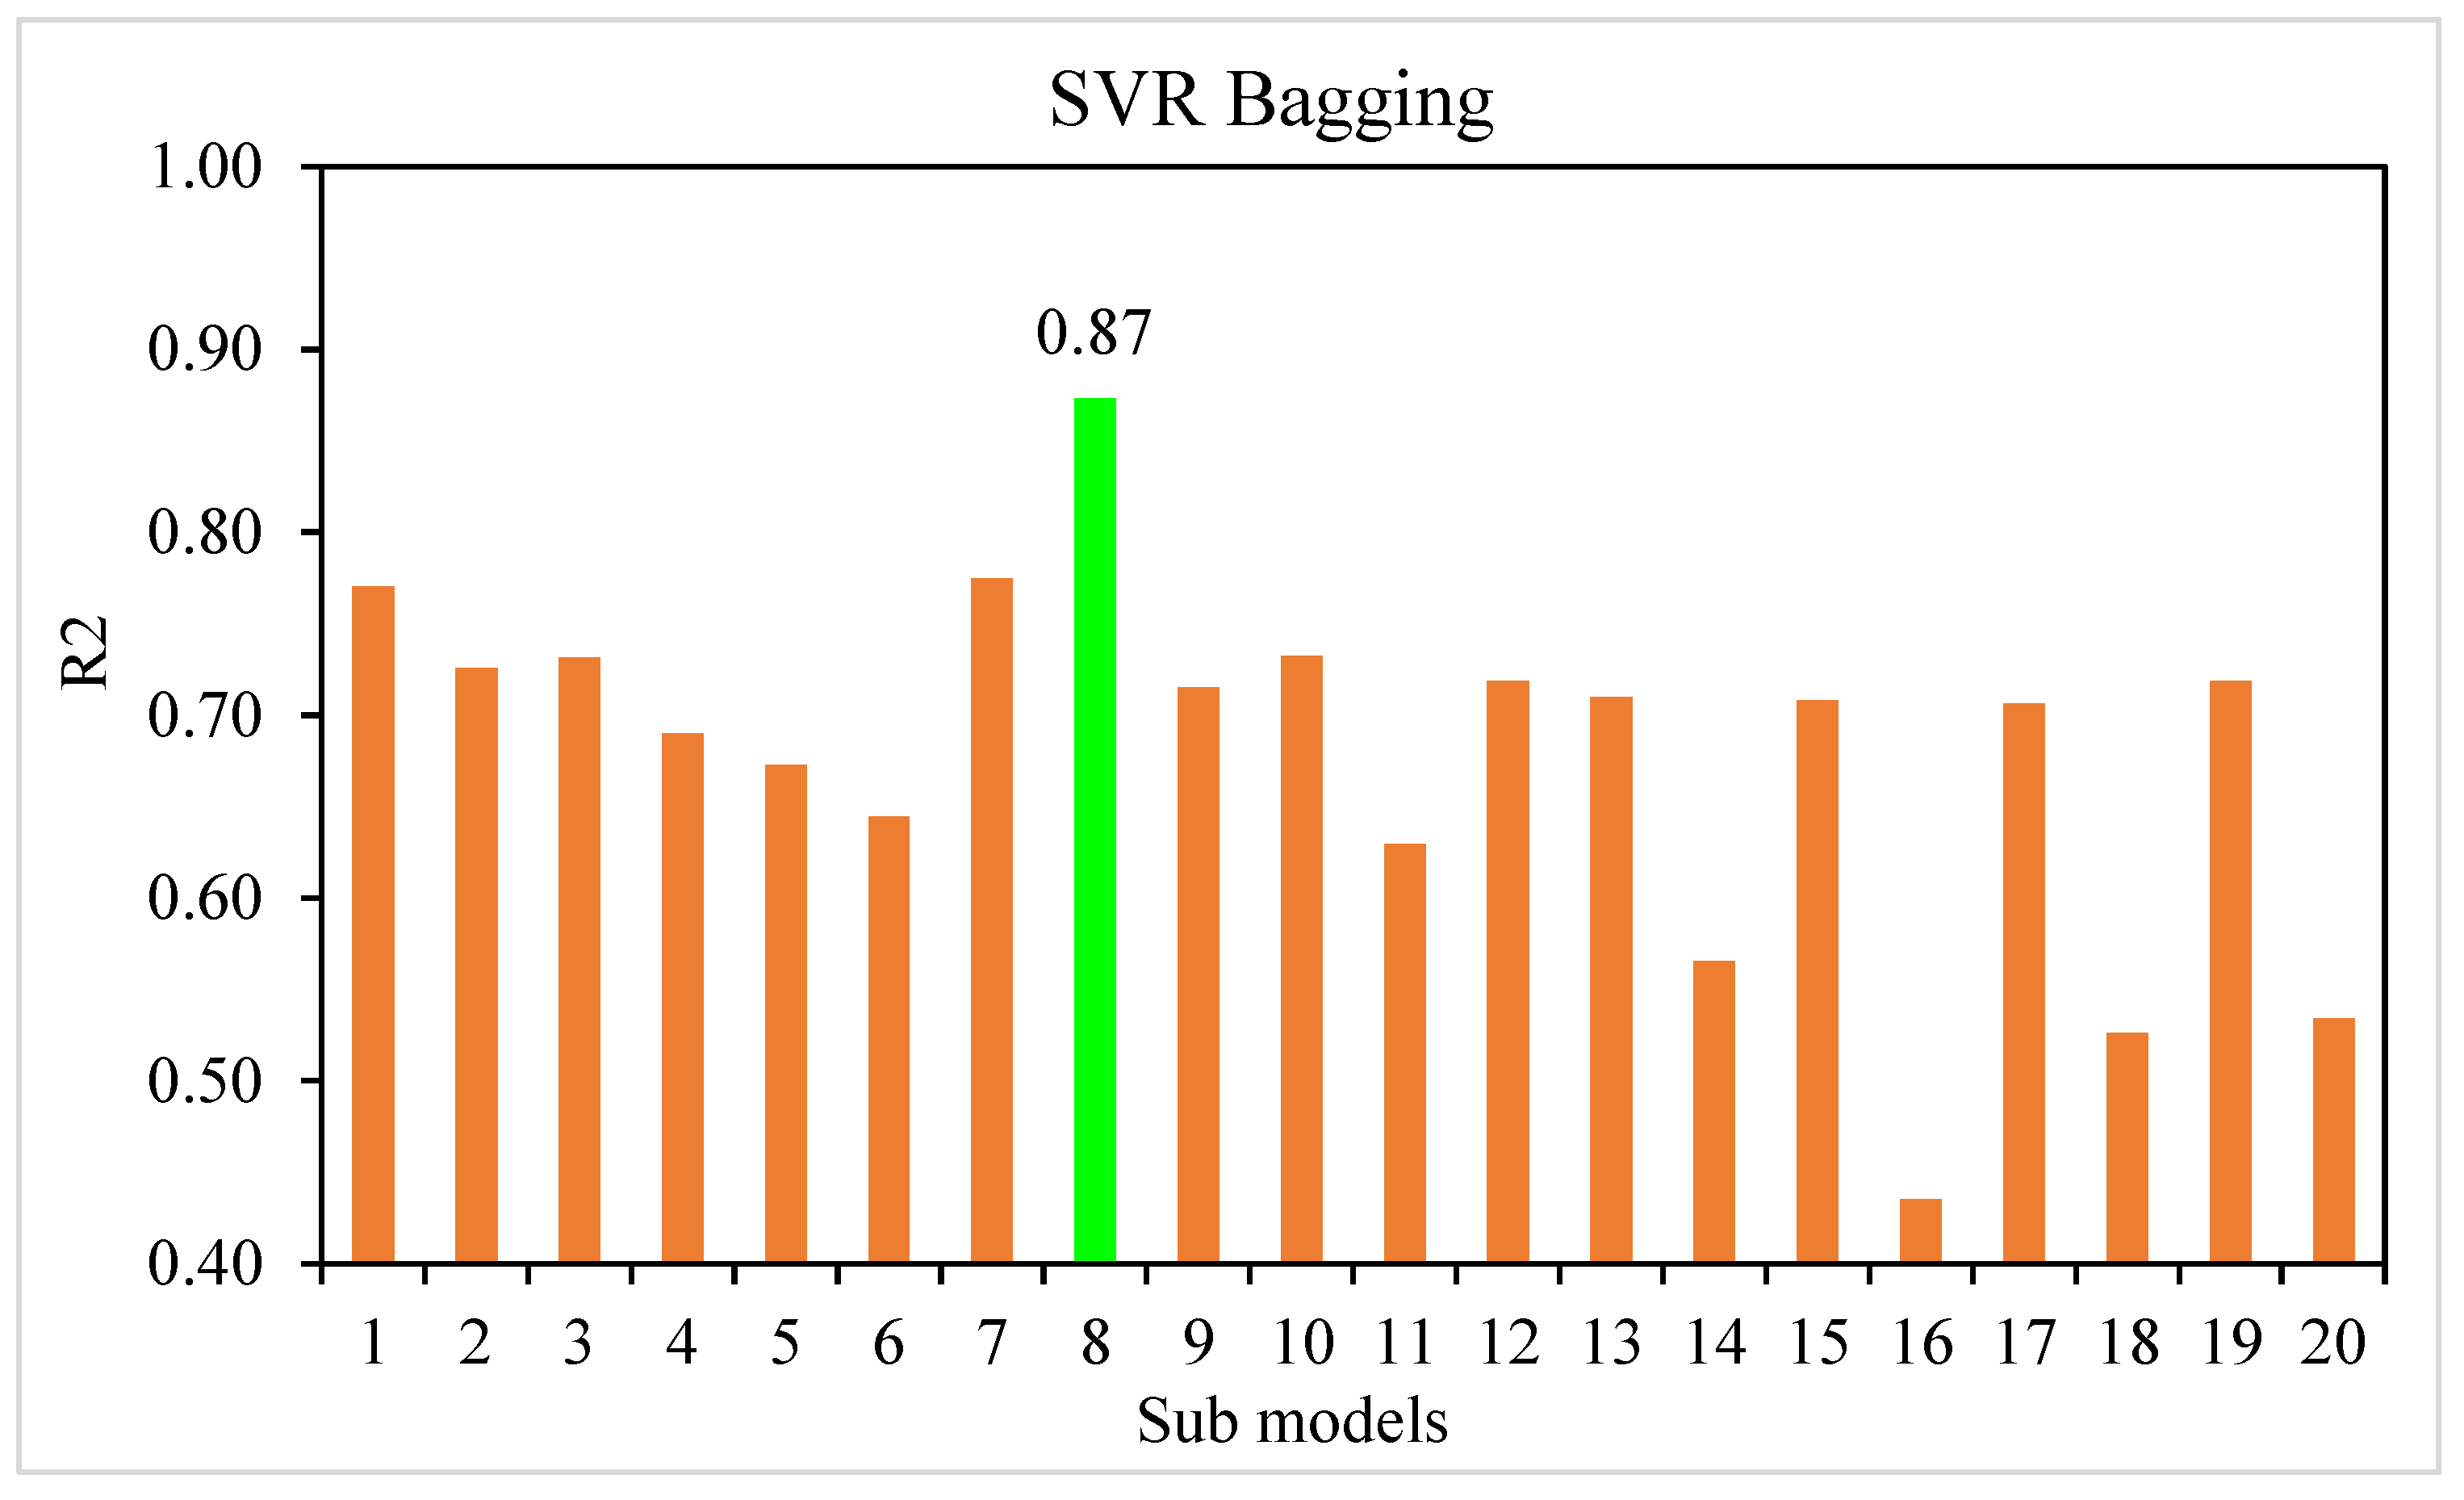
- Individual approaches were less accurate than EML procedures in forecasting SFRC’s compressive strength, while the SVR bagging model displayed the highest accuracy.
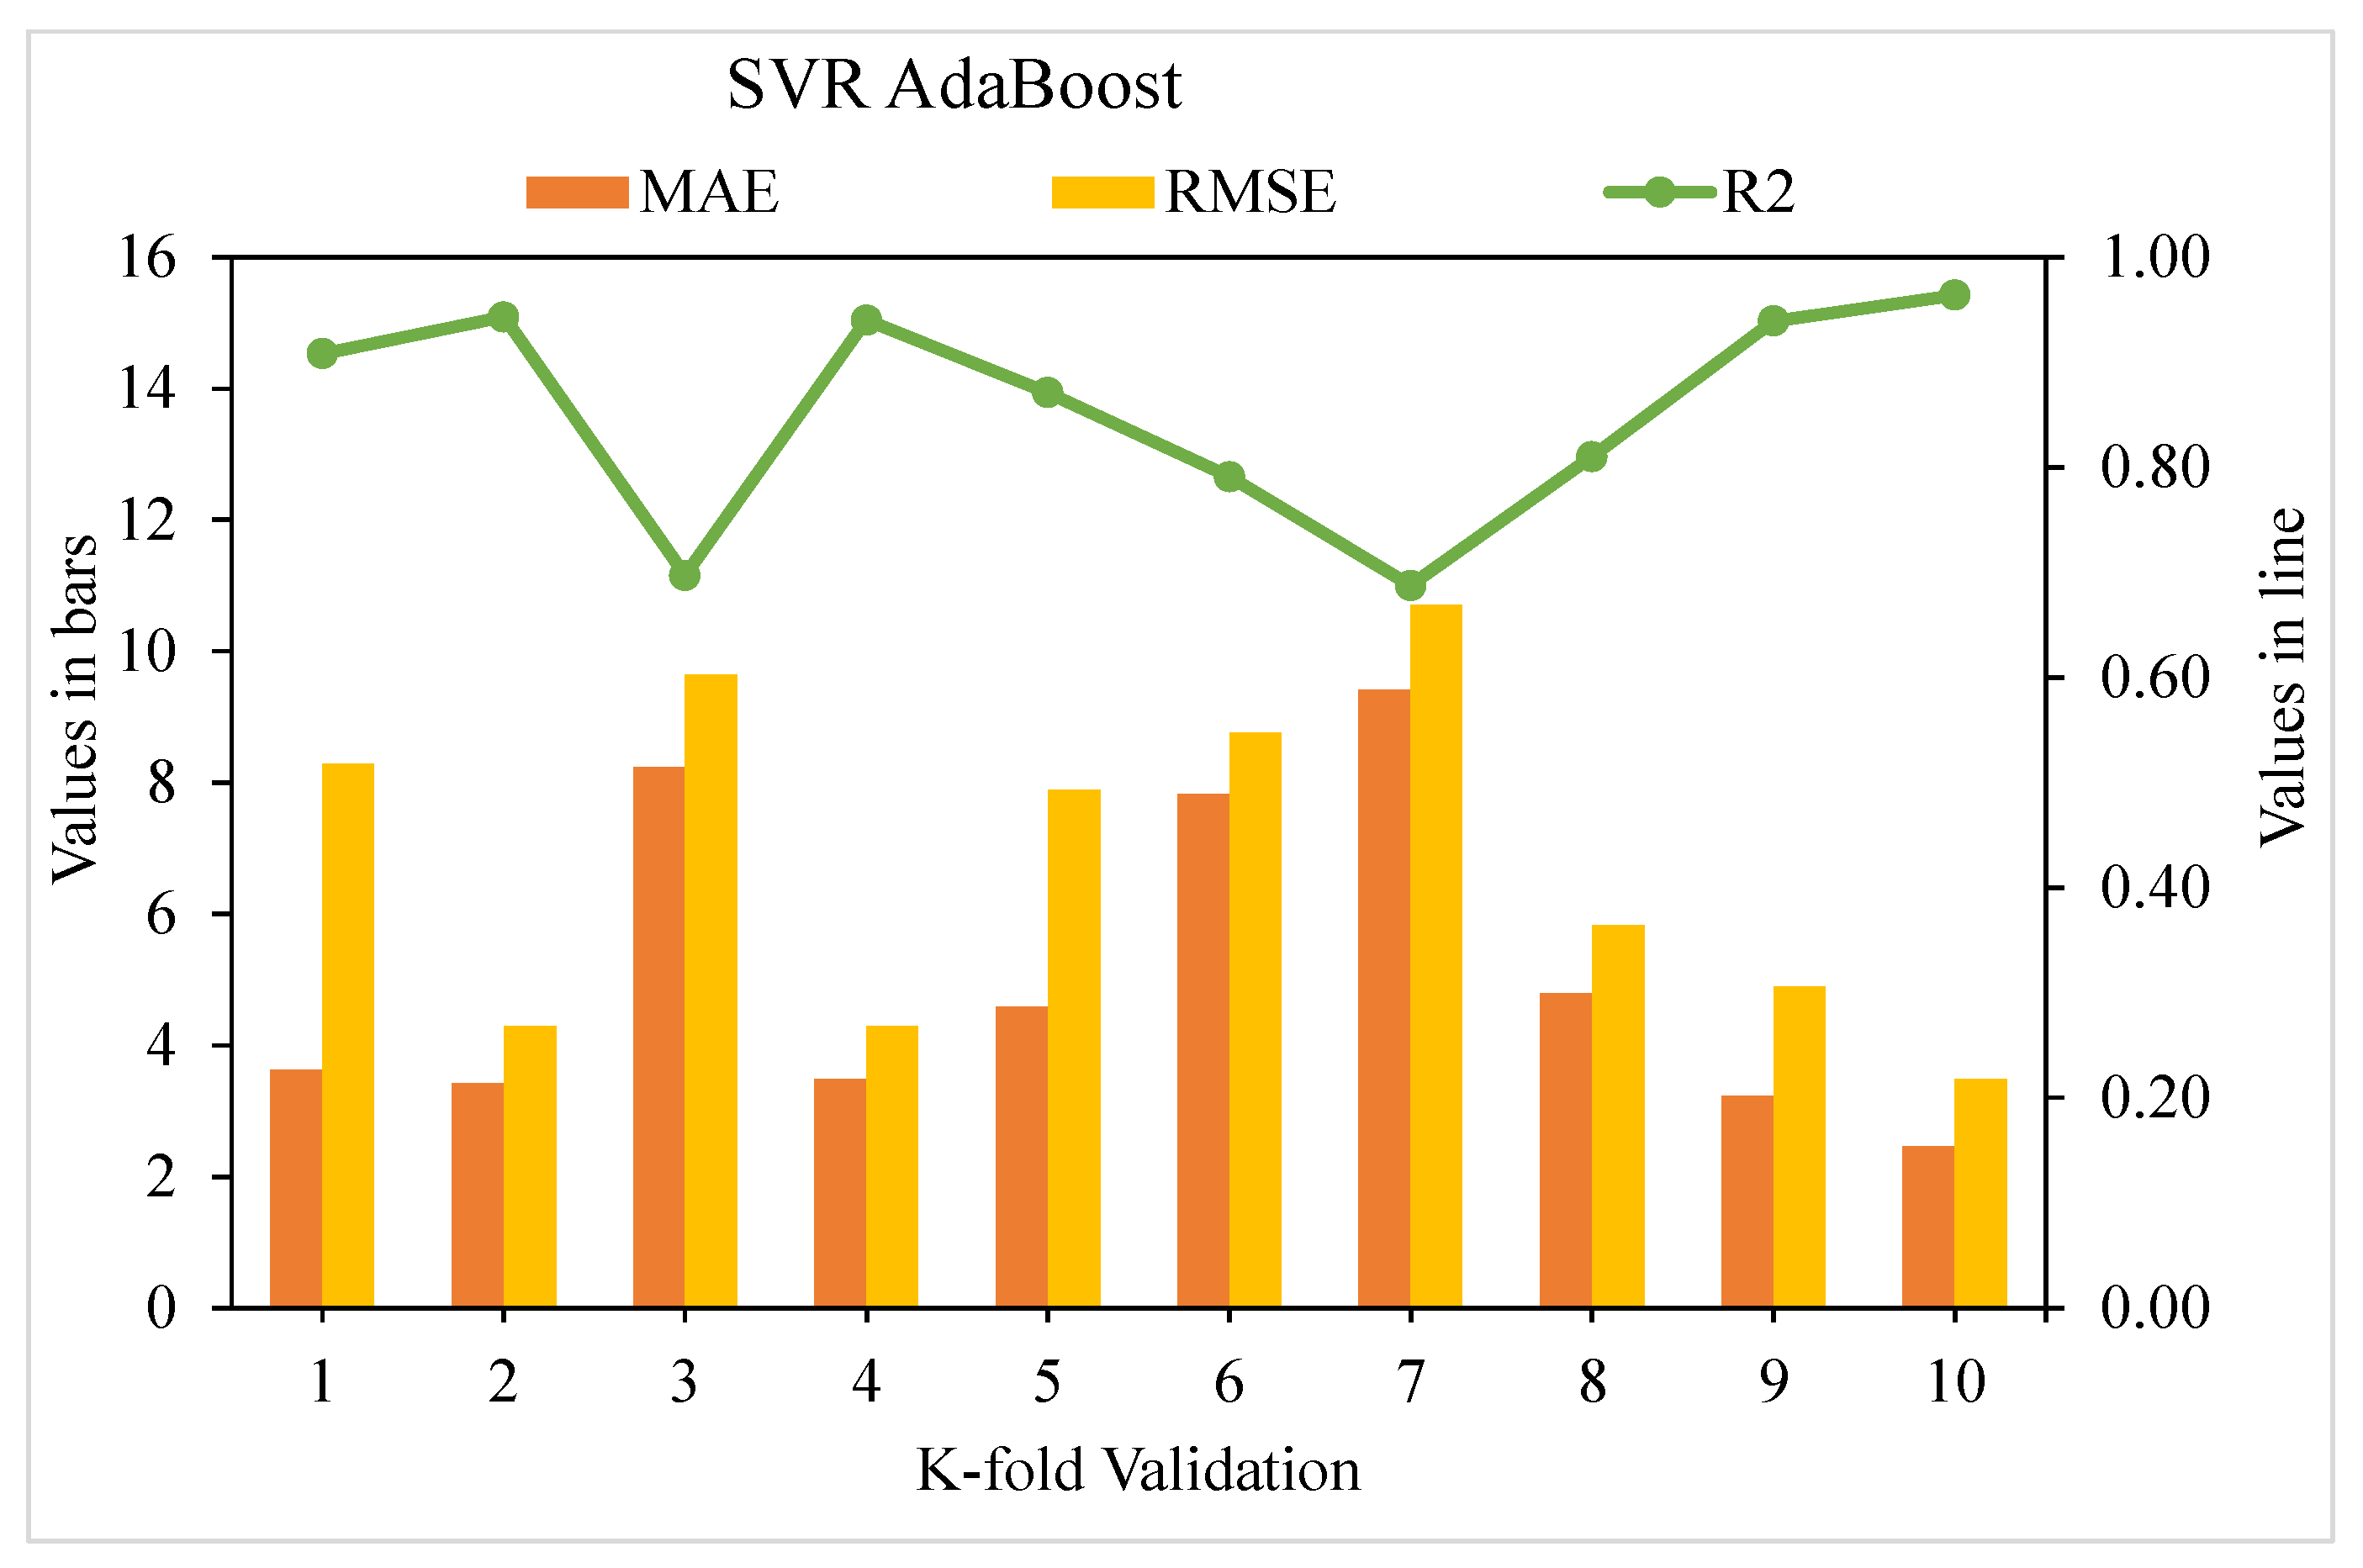
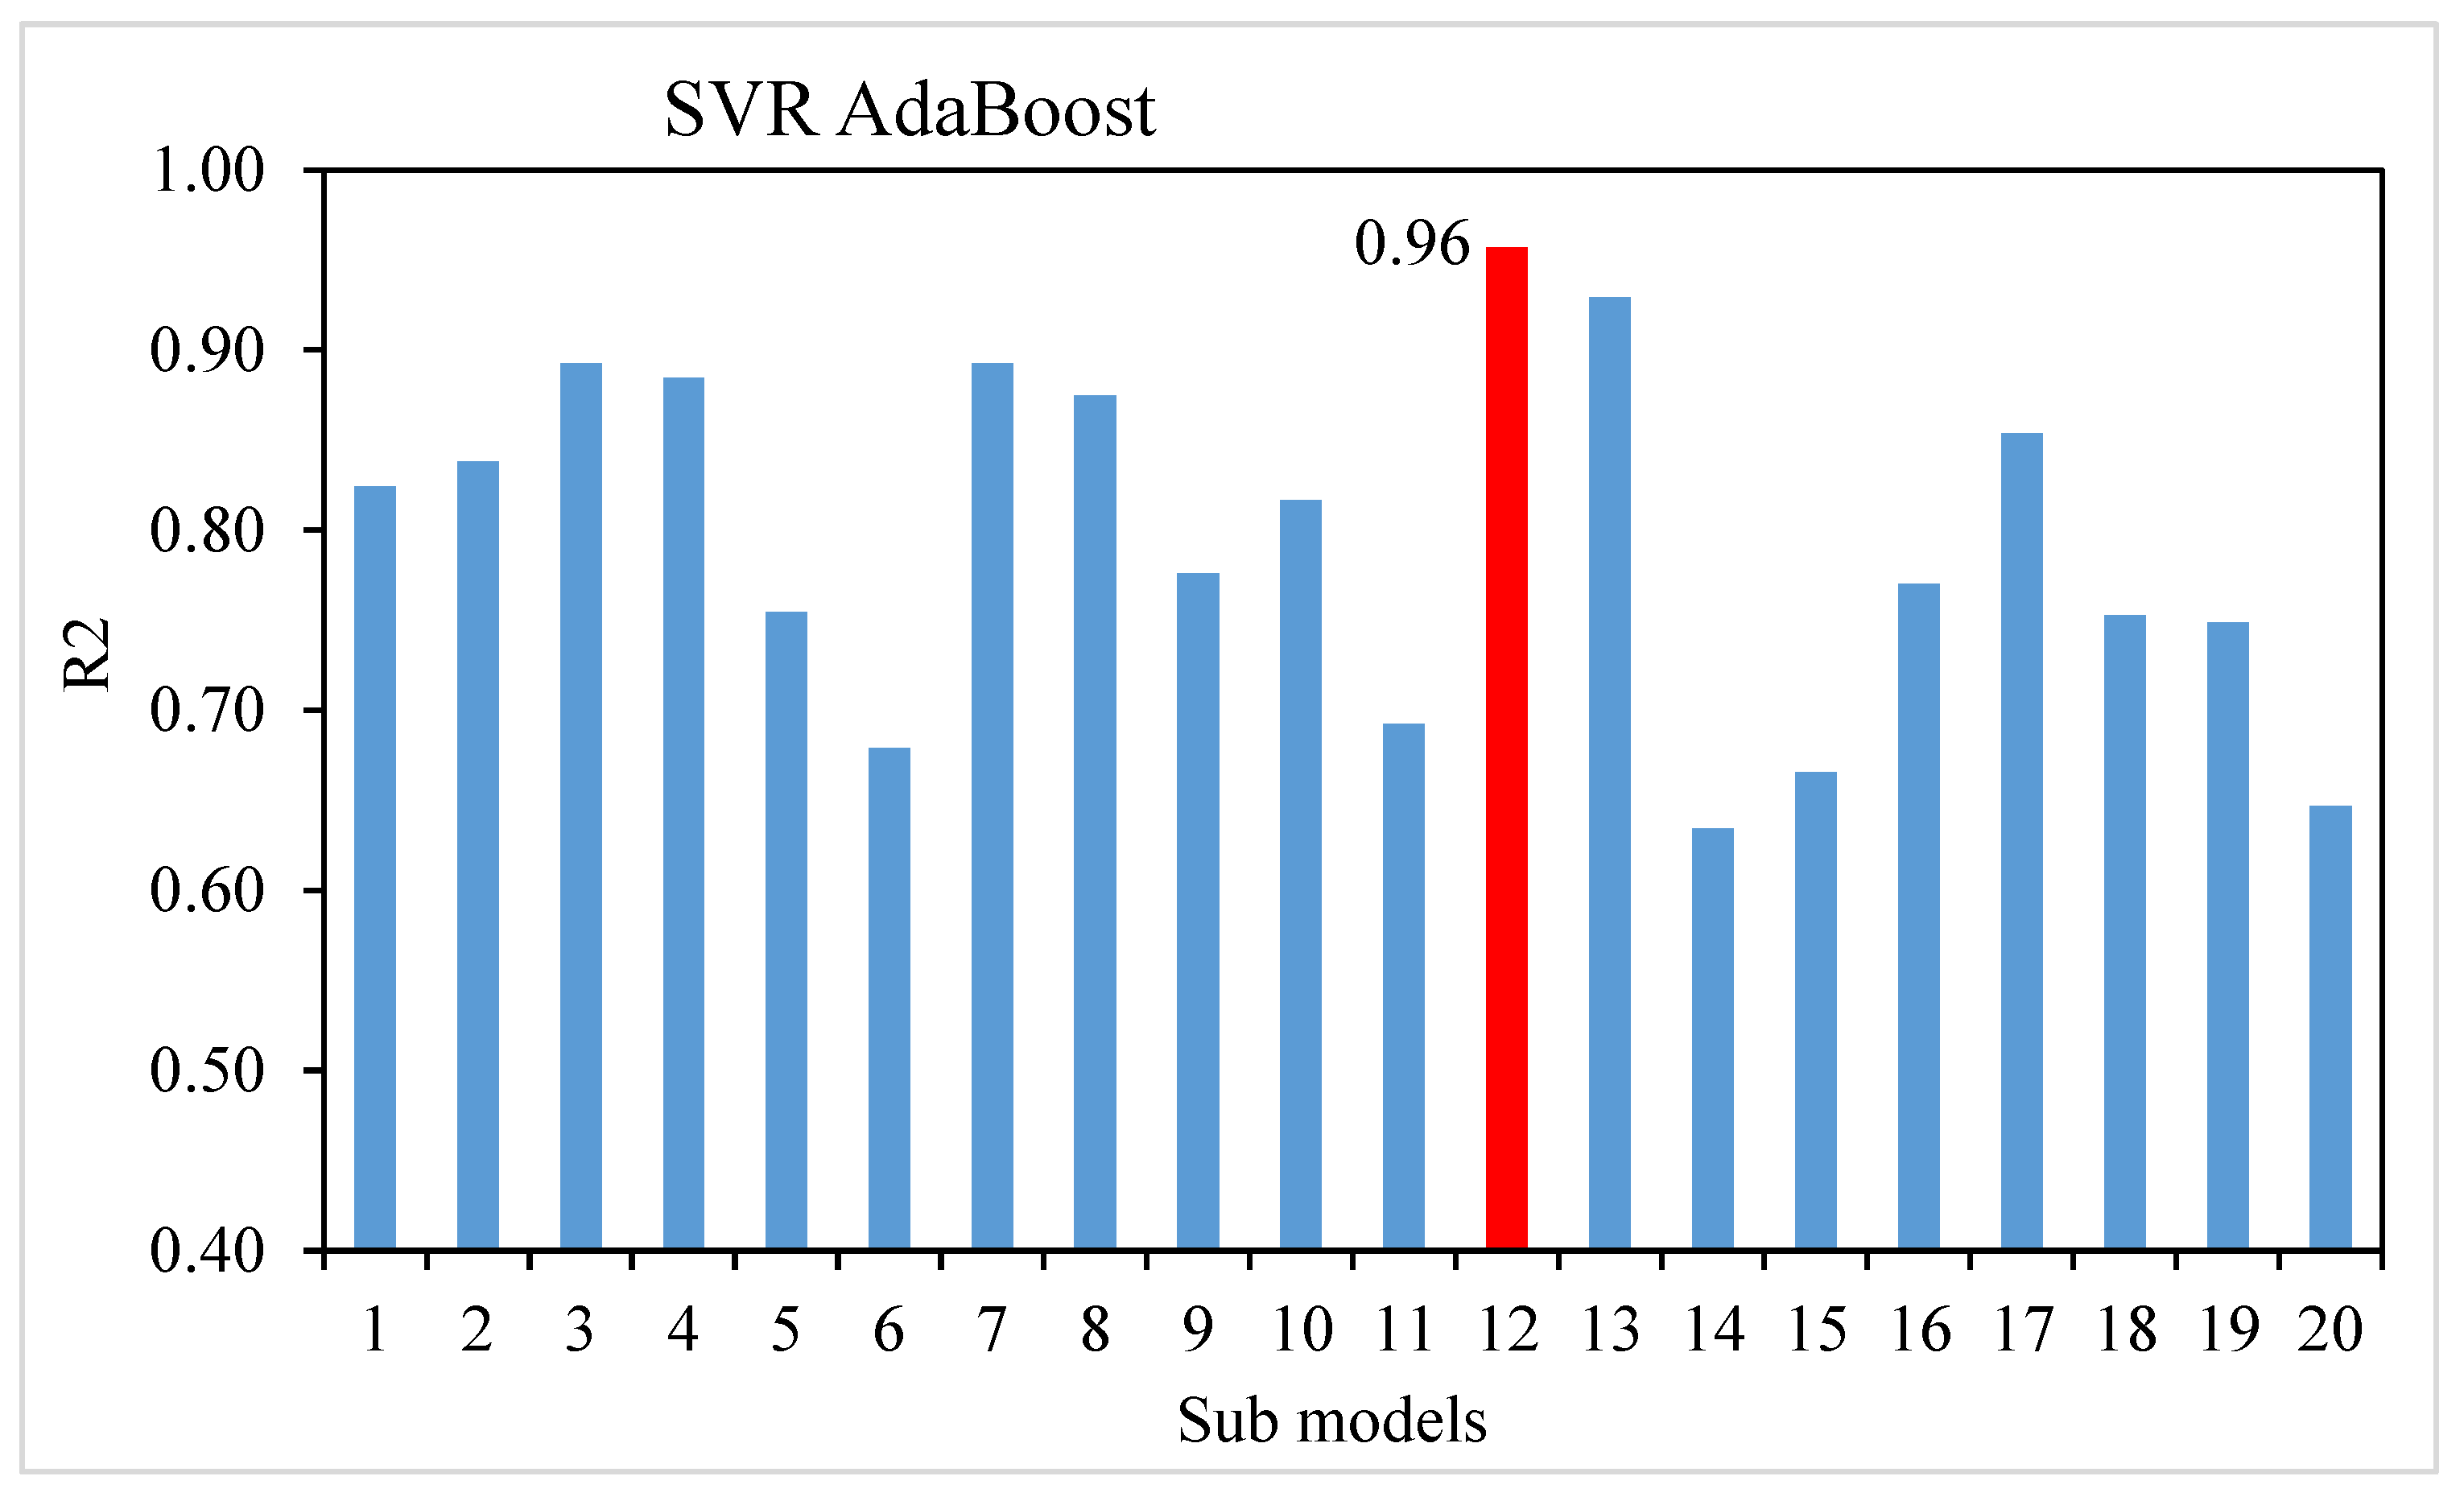
- The SVR bagging model outperformed the SVR AdaBoost ensembled machine learning technique in the forecasting of the 28-day compressive strength of SFRC.
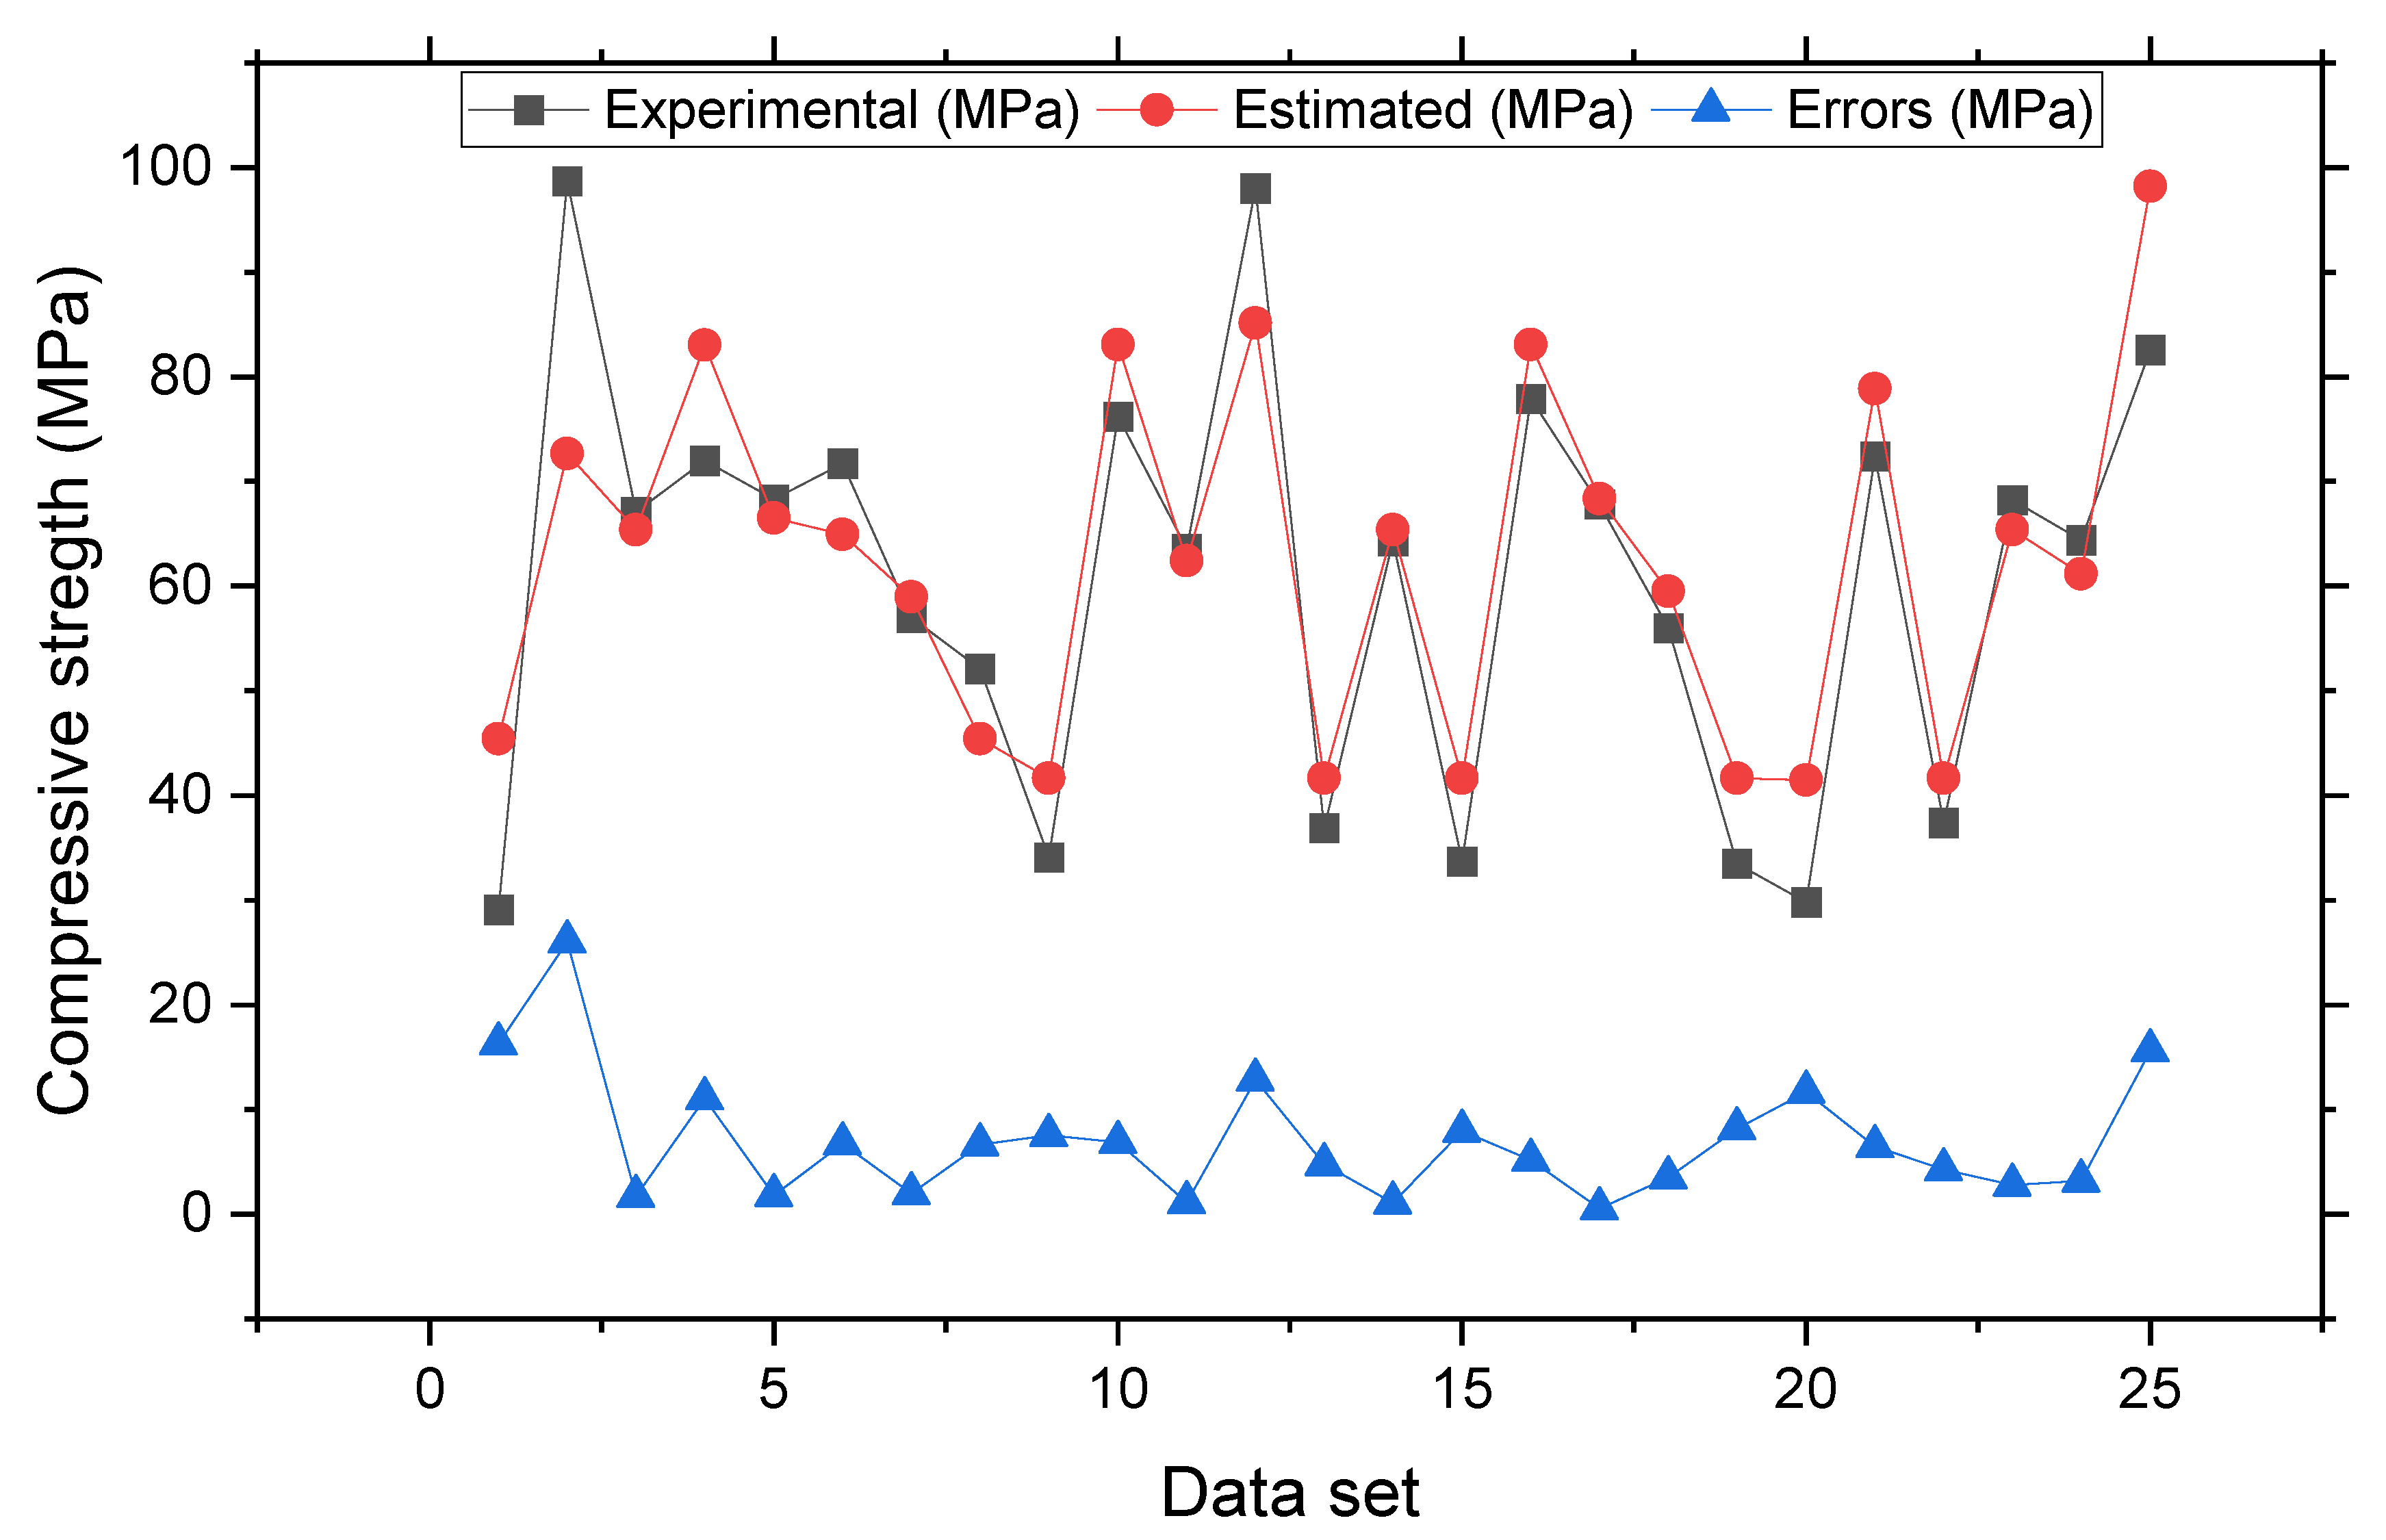
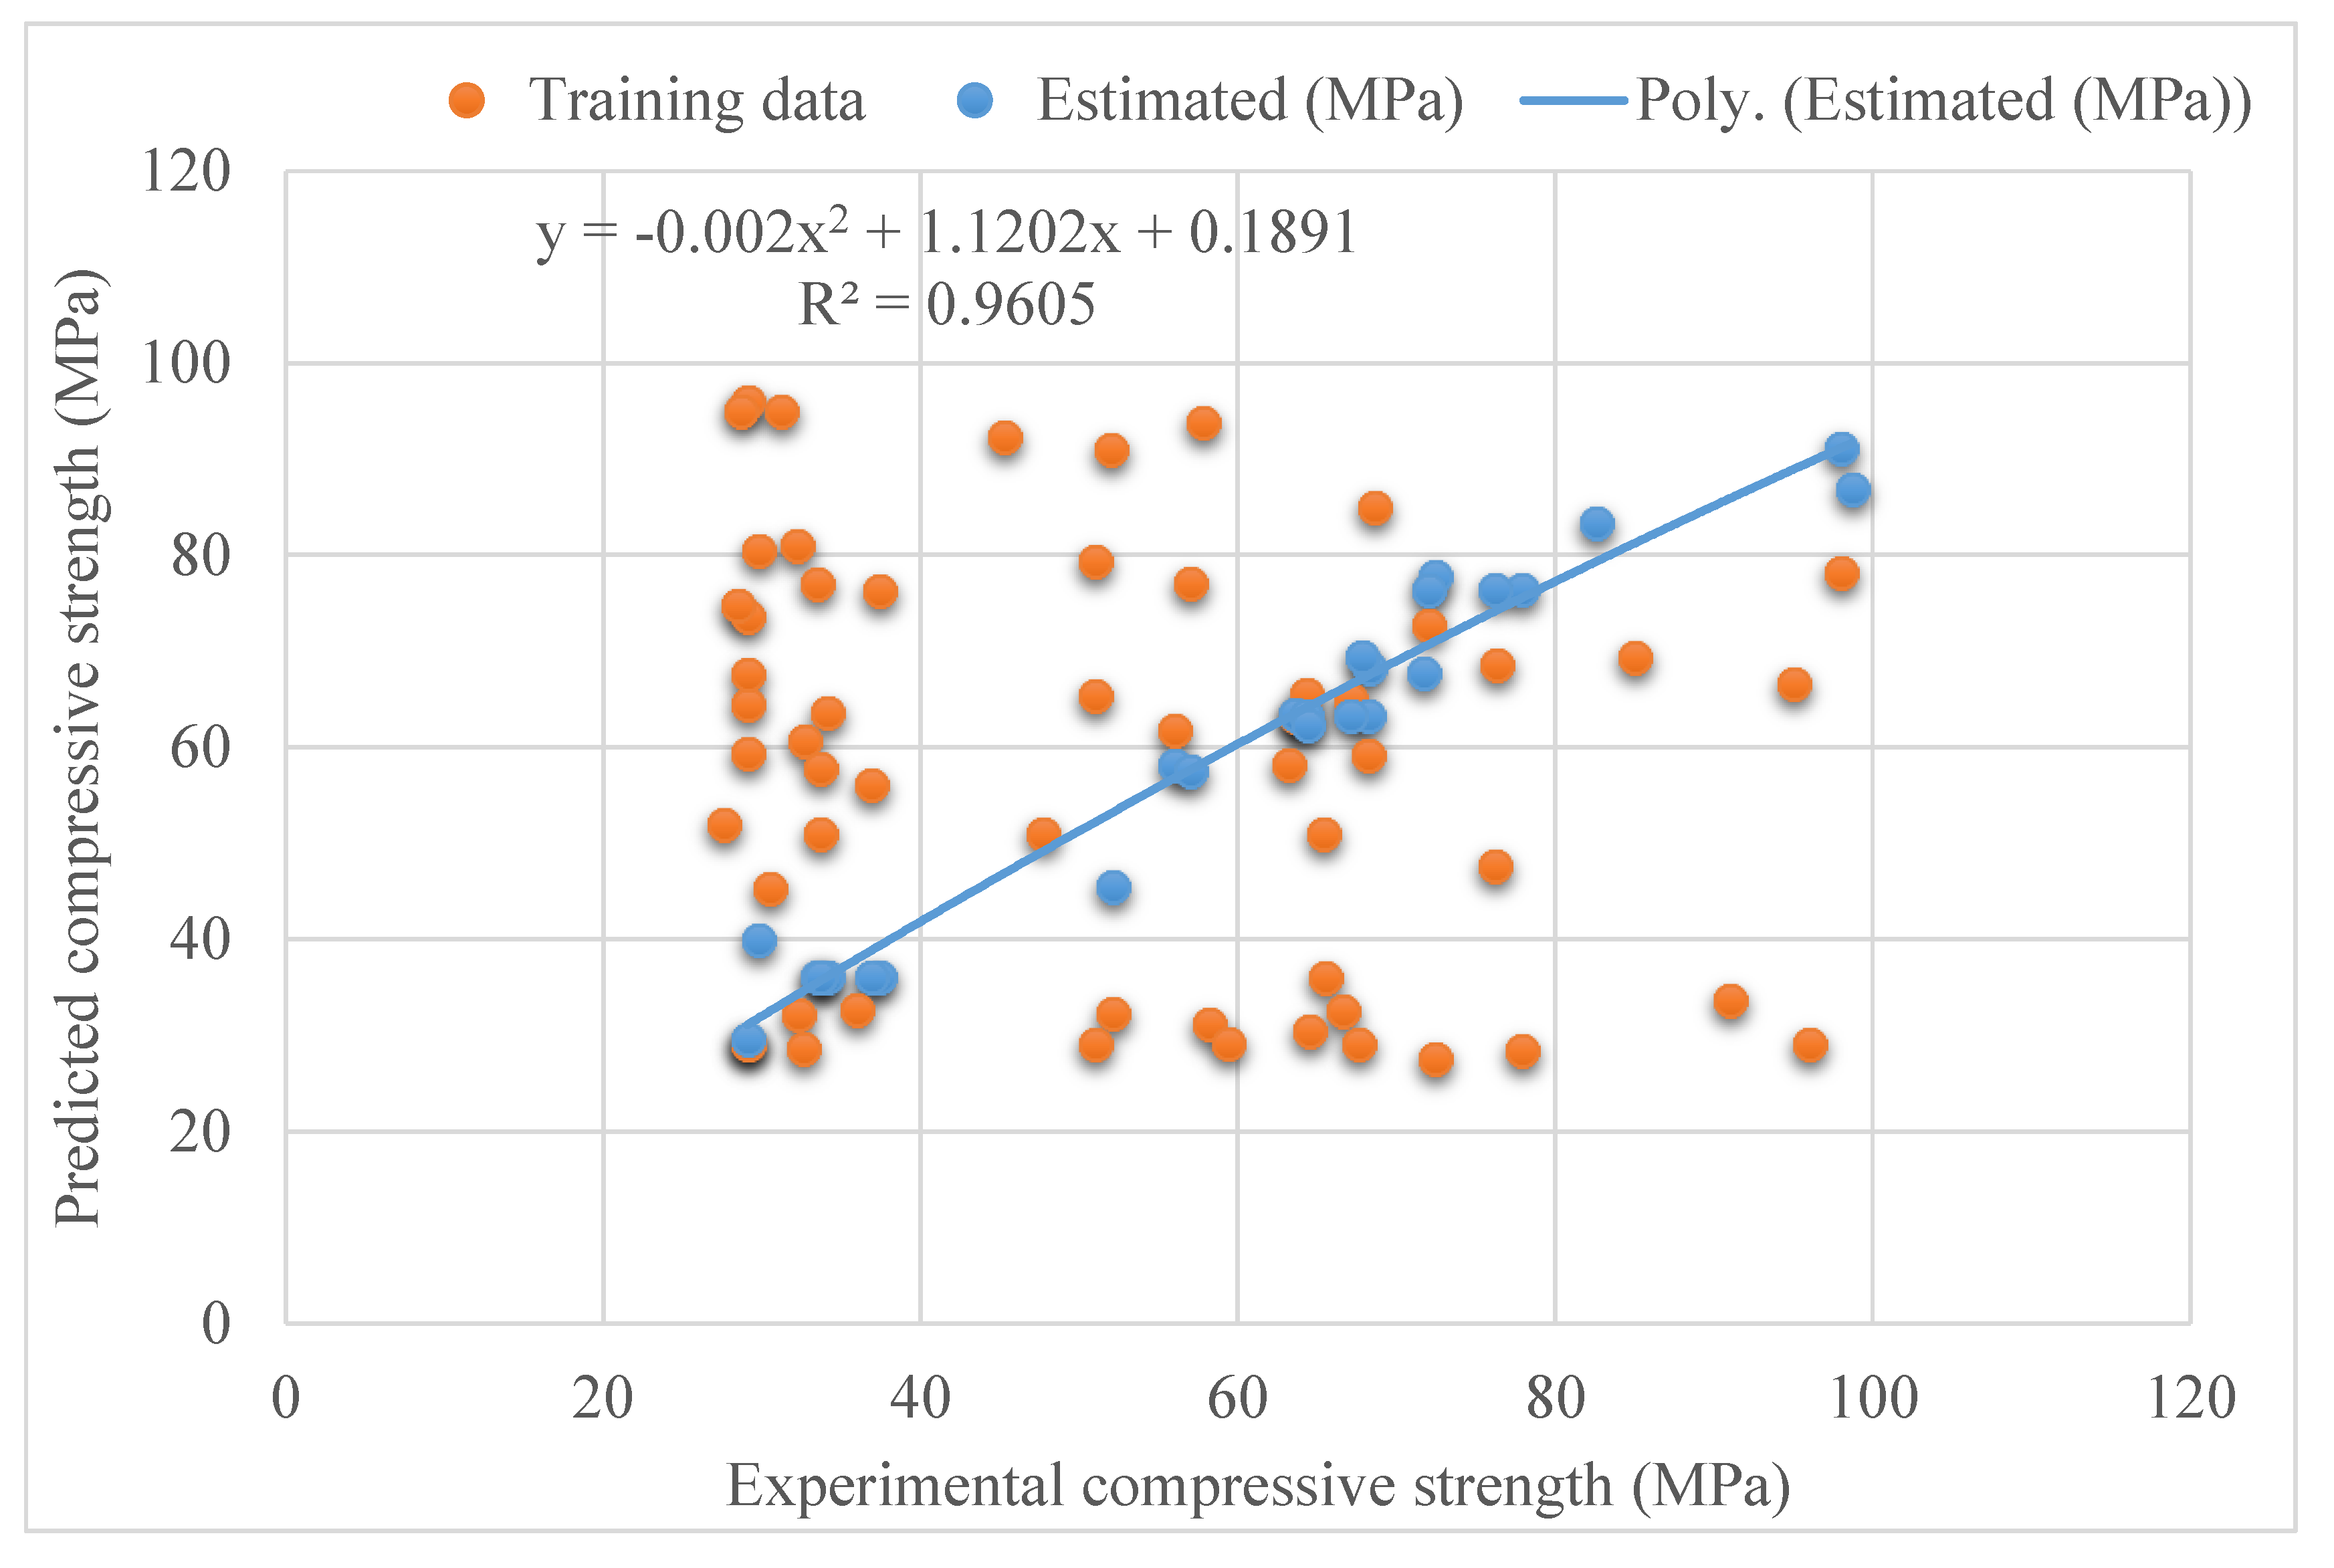
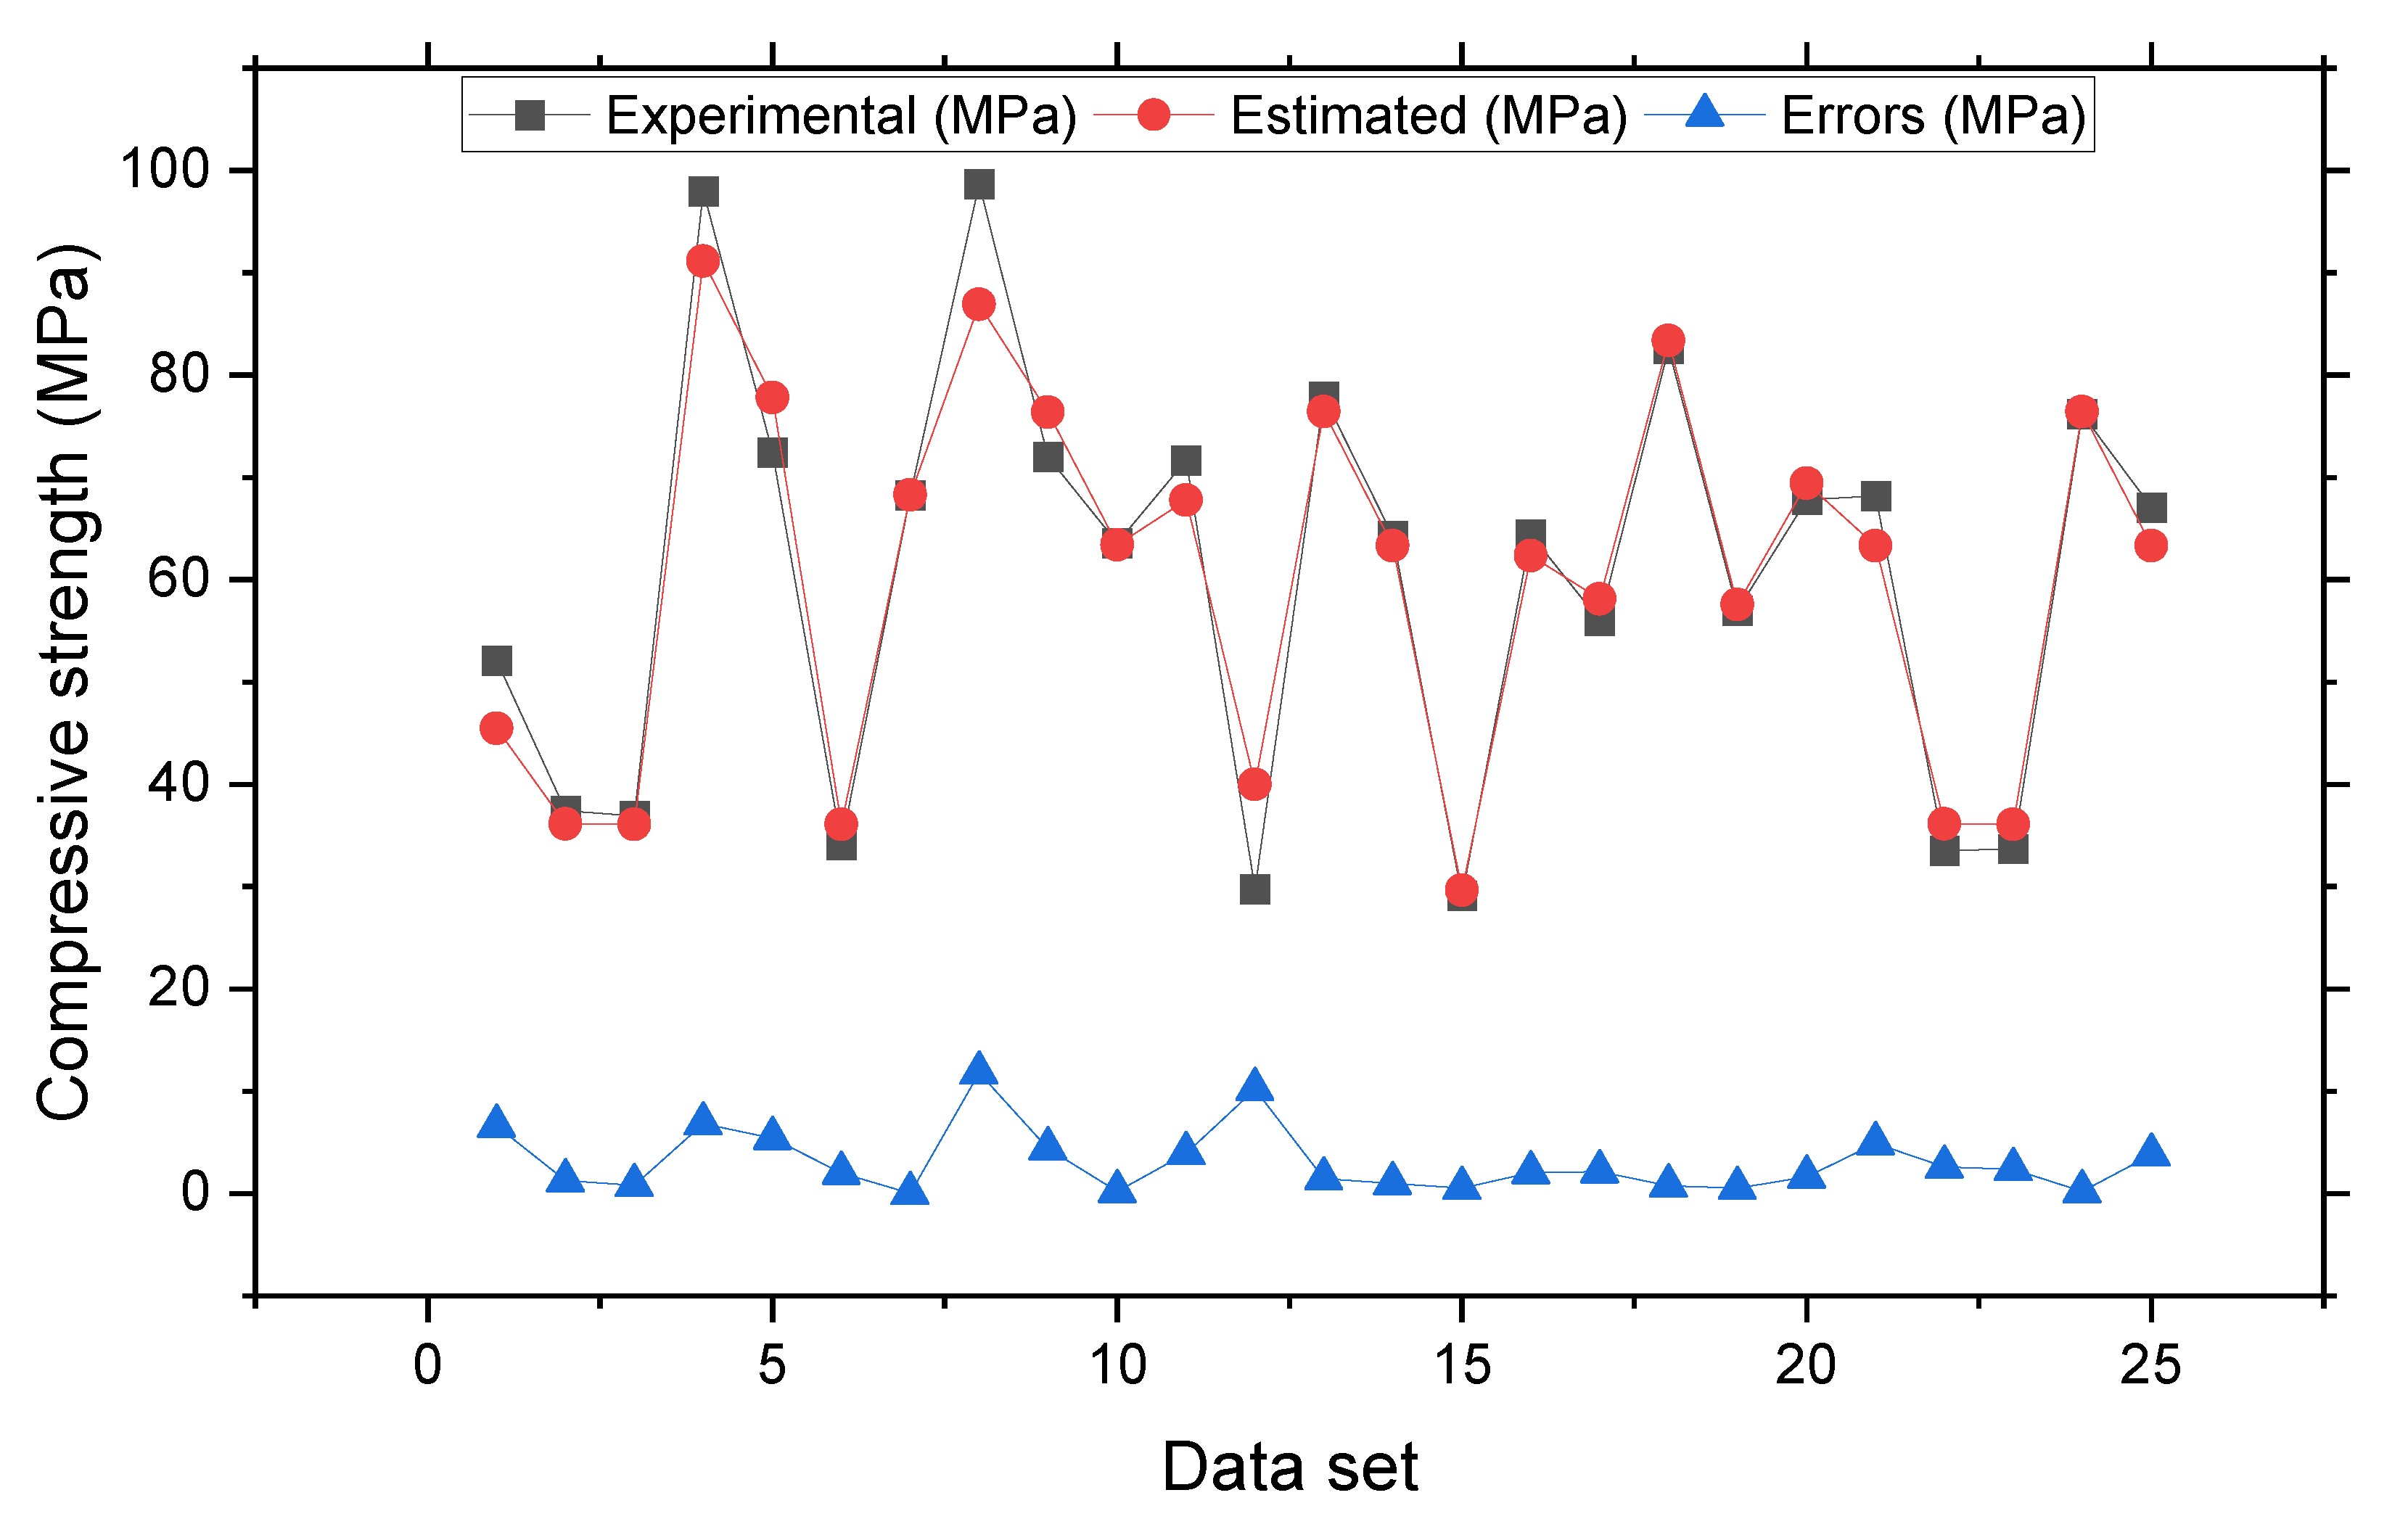
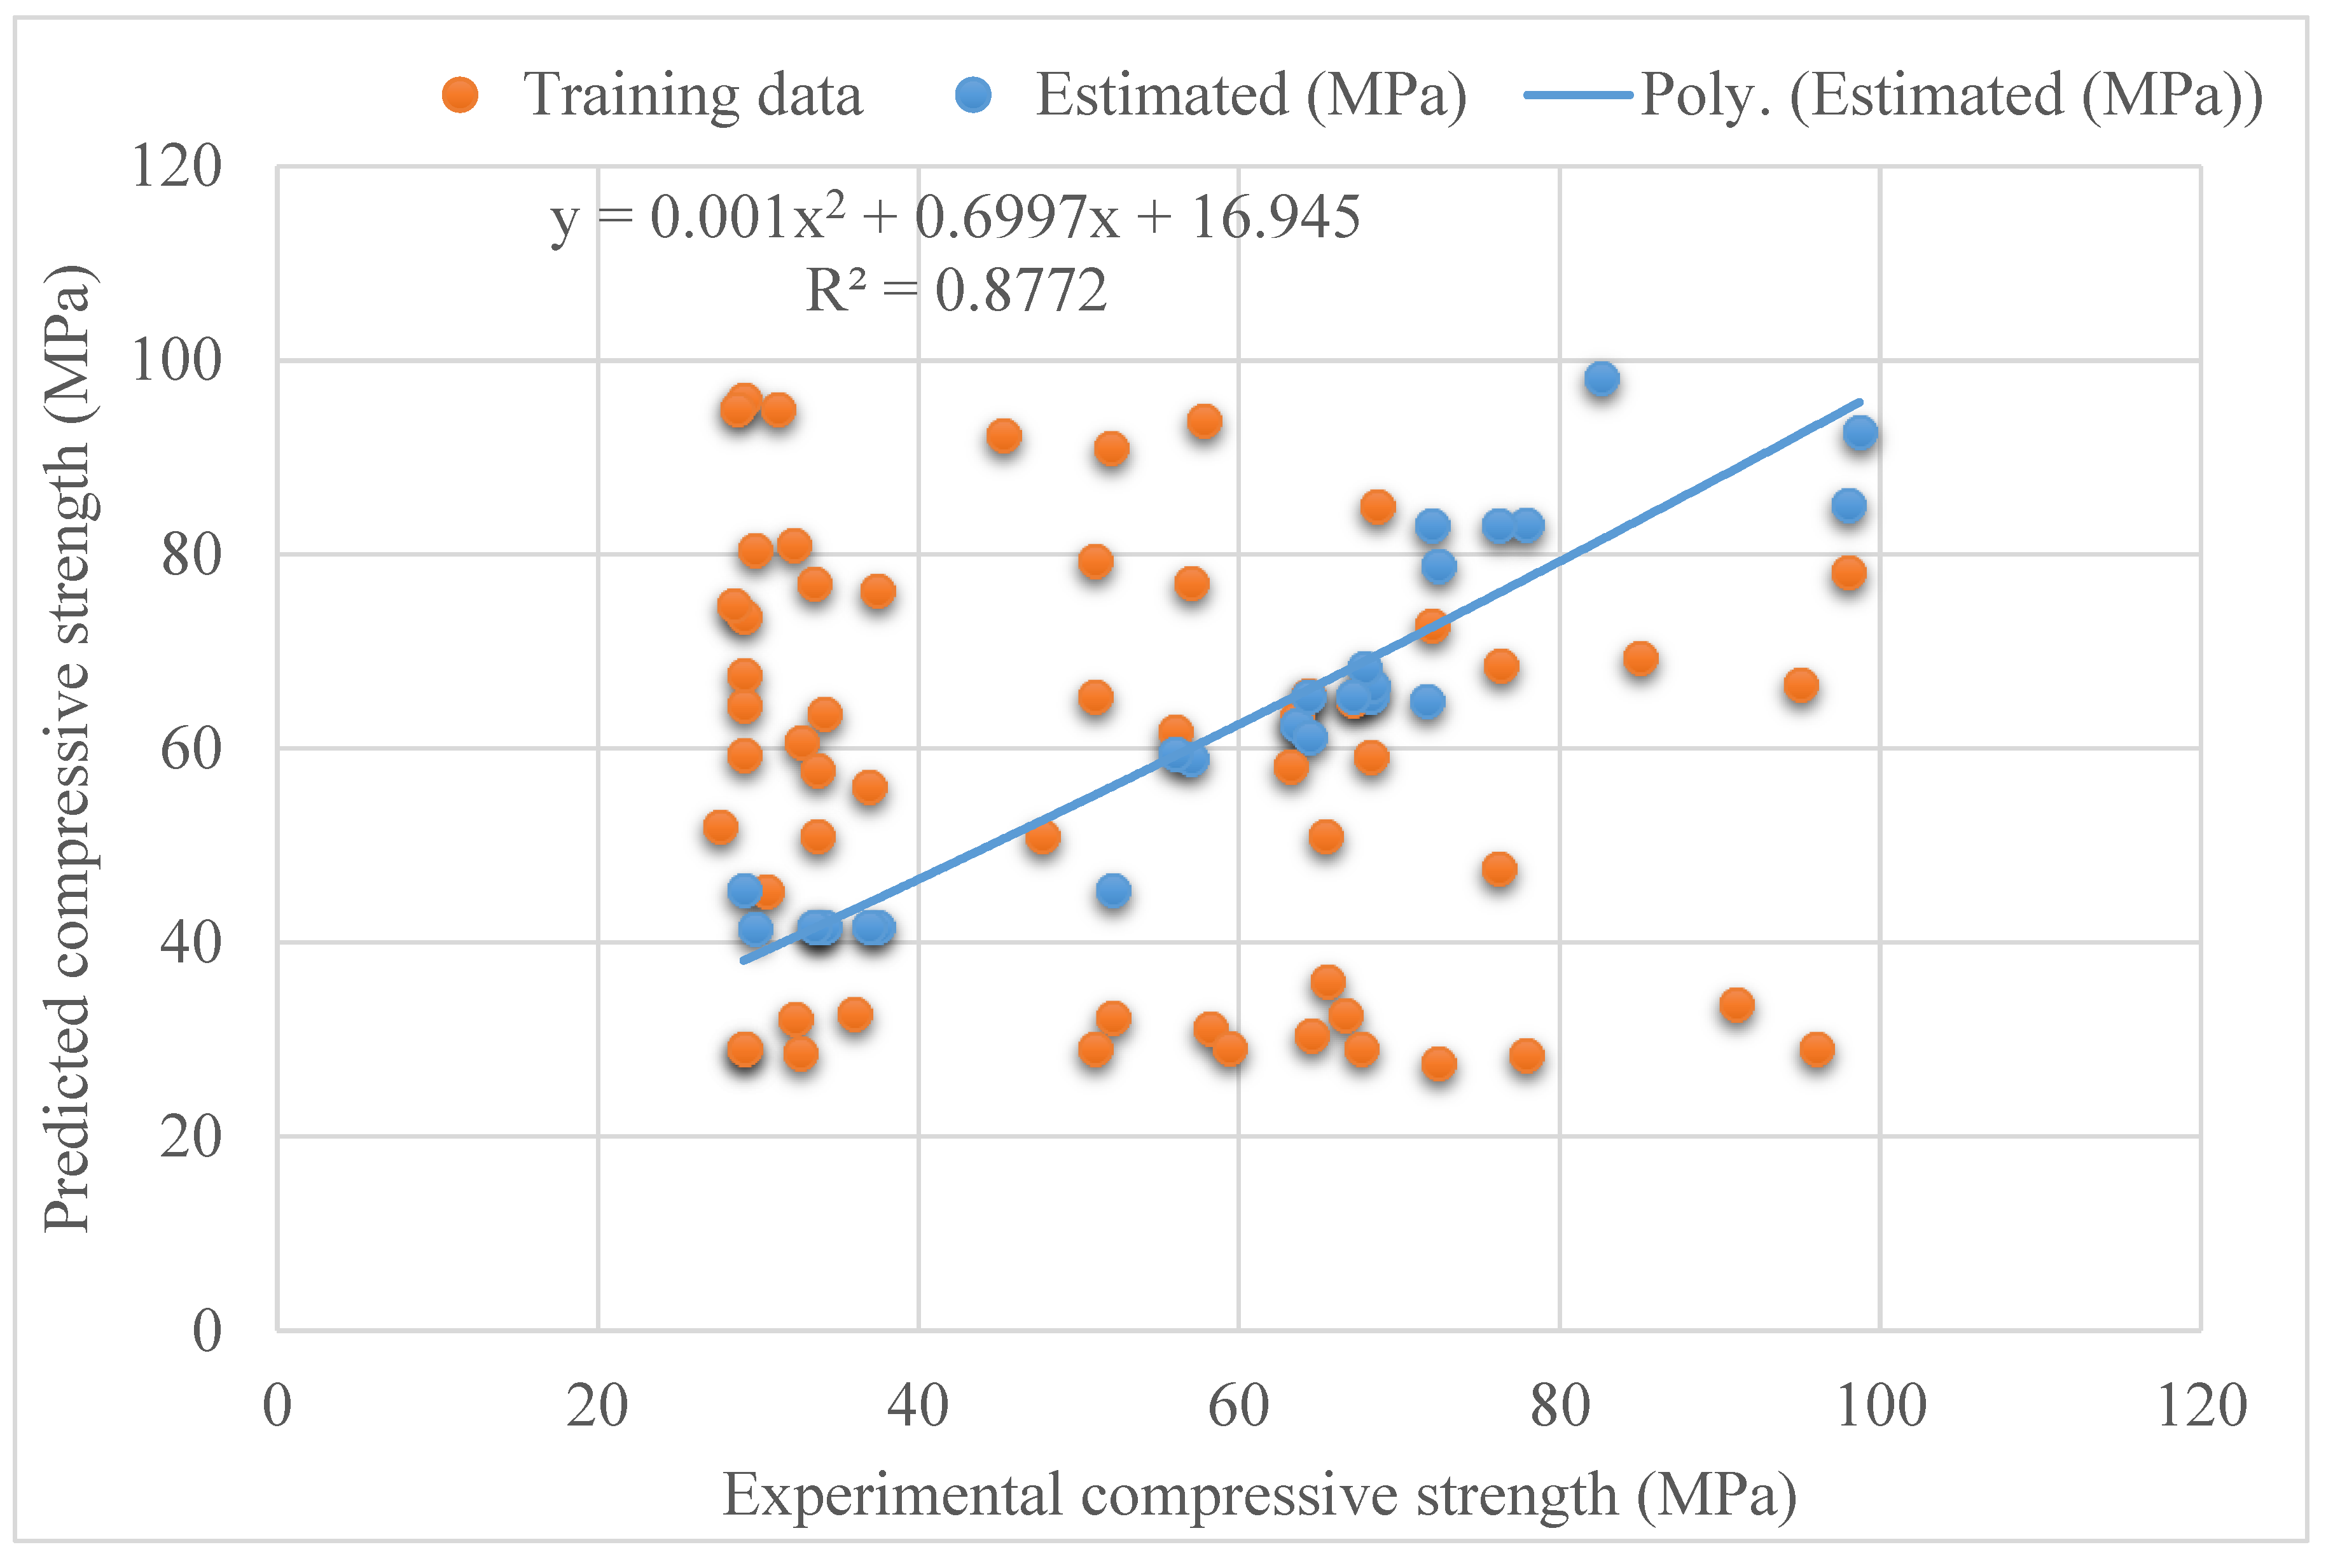
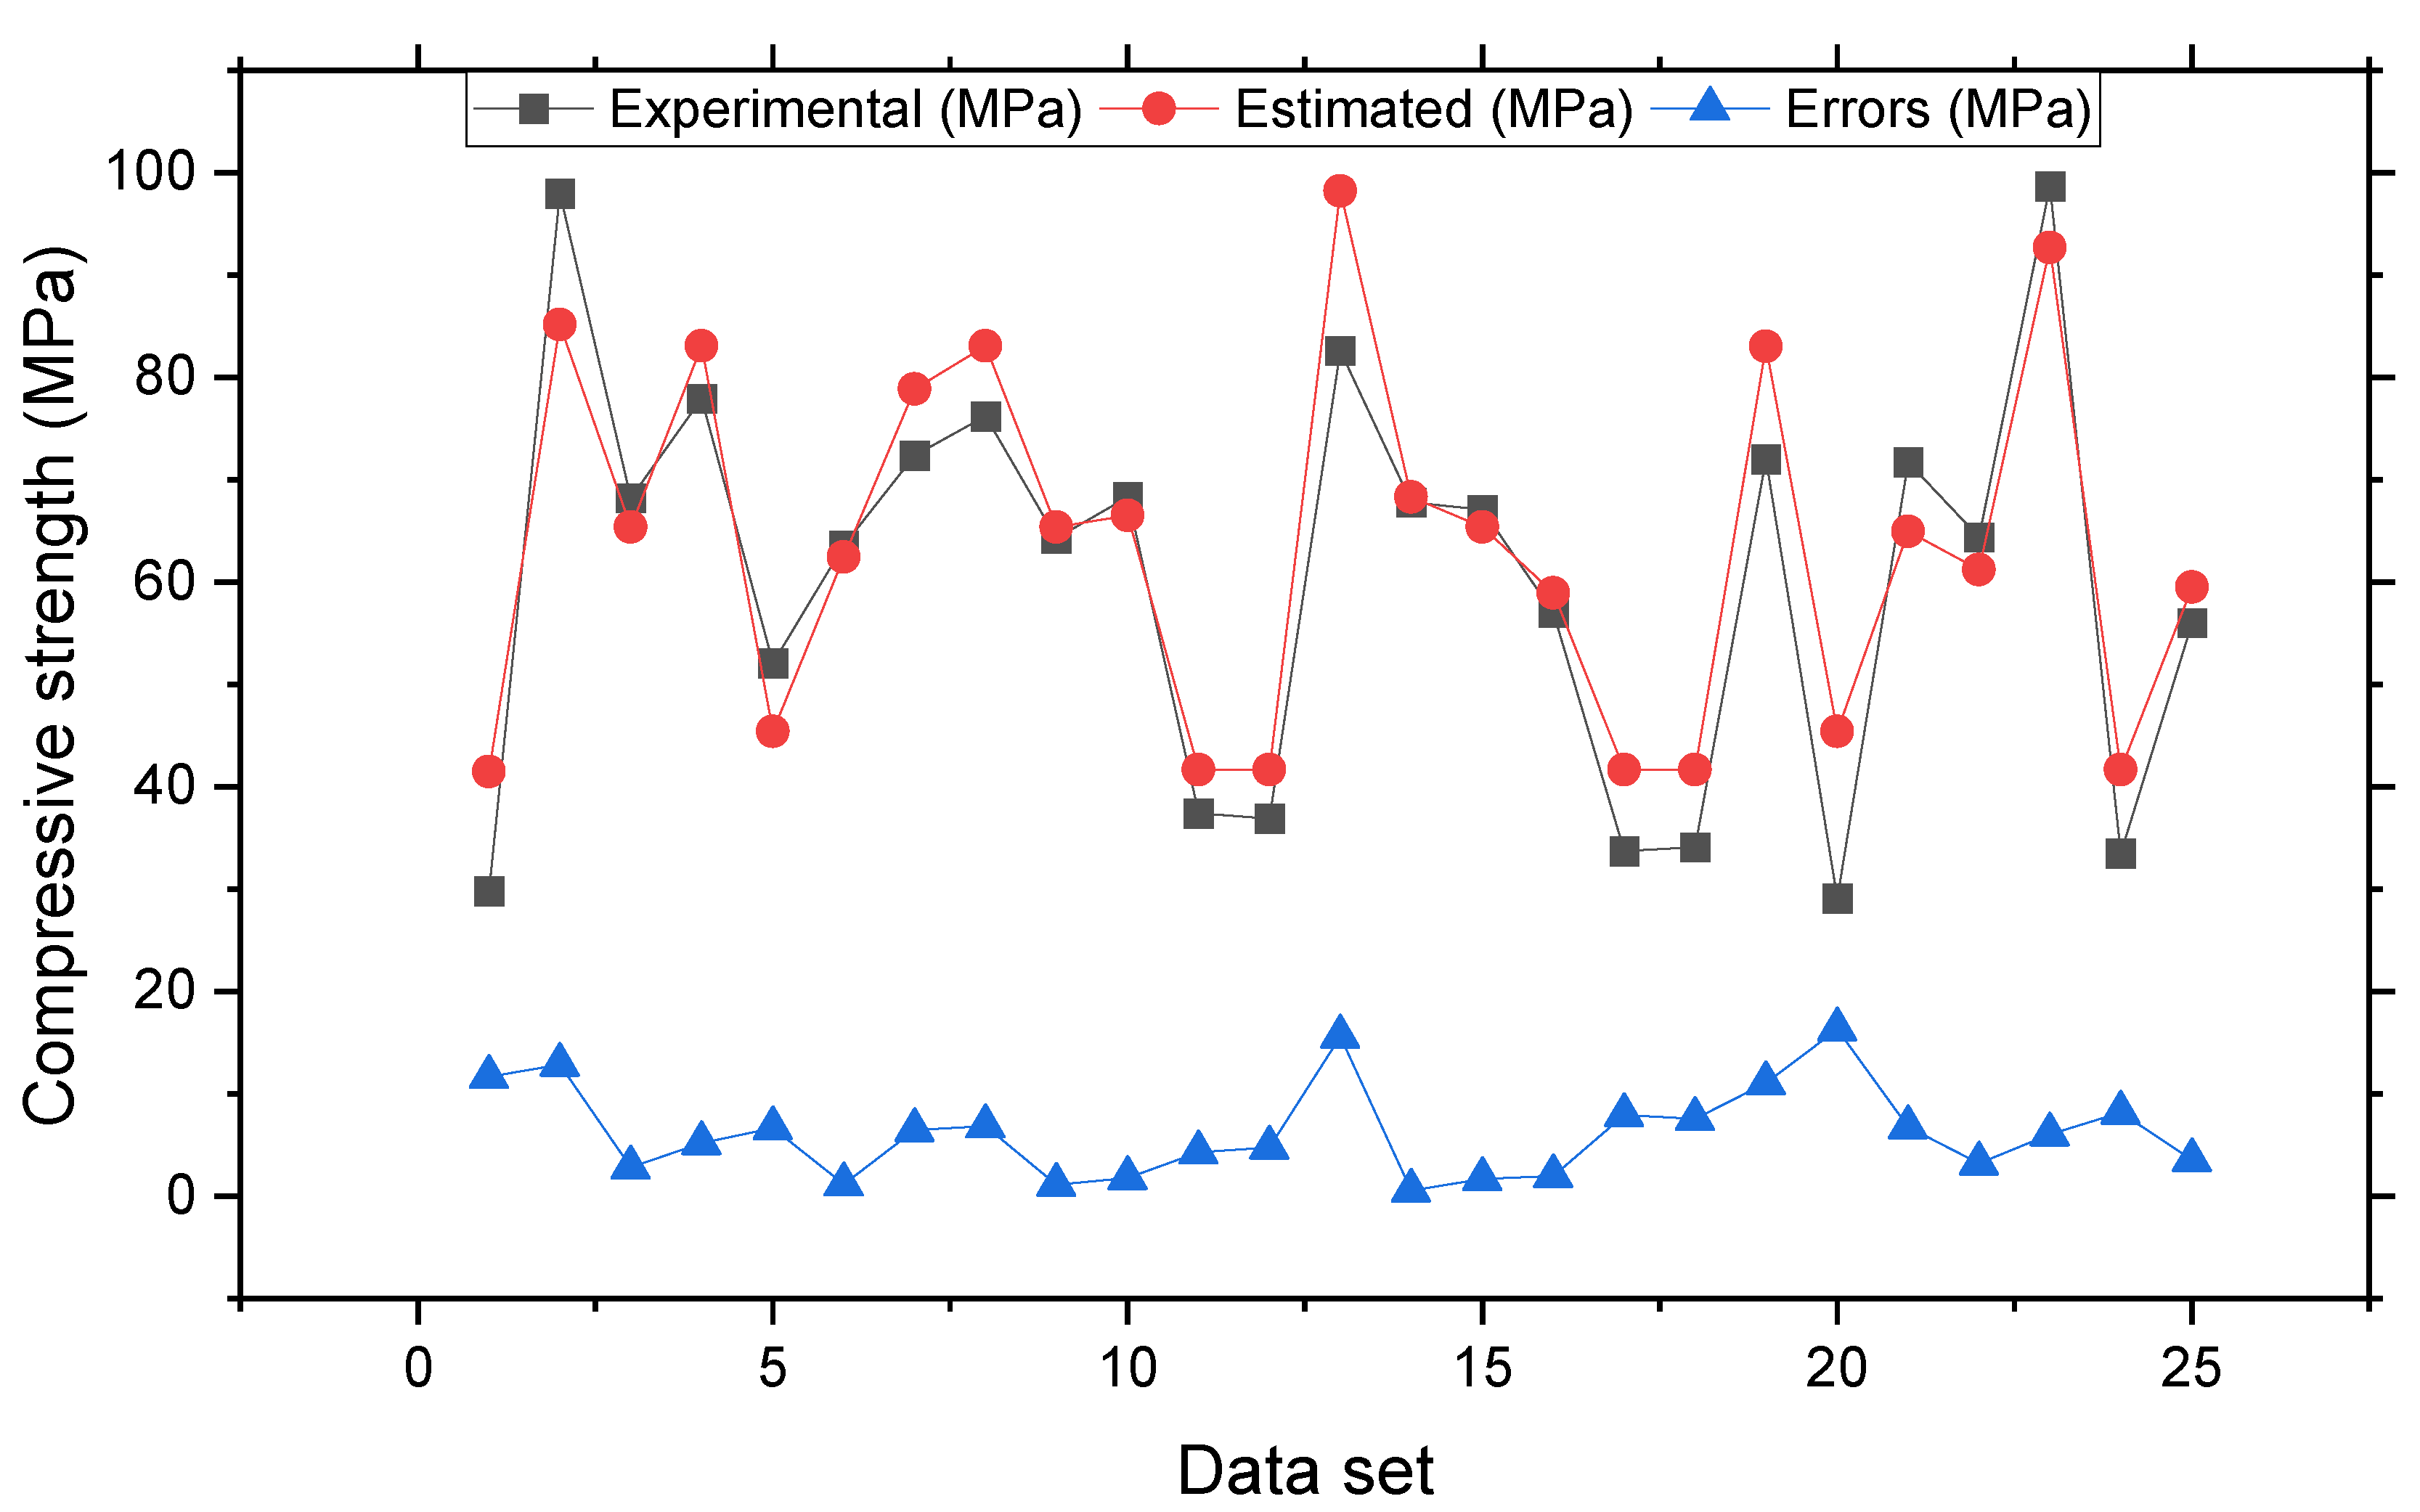
- The SVR, SVR AdaBoost, and SVR bagging models have coefficient of determination (R2) values of 0.81, 0.96, and 0.87, respectively. All of the models’ outputs are within acceptable bounds, with little variance from the exact results.
- The models’ performances were demonstrated by the k-fold cross-validation test and statistical analysis, which revealed that the SVR bagging model outperformed the other models investigated in terms of prediction.
- To determine how much the input parameters mattered, a sensitivity analysis was utilized, and it was discovered that cement, water, silica fume, sand, superplasticizer, coarse aggregate, Vf, fiber length, and fiber diameter contributed 16.2%, 15.2%, 21.9%, 6%, 16.4%, 13%, 8.7%, 2.6%, and 0.6%, respectively, to the outcome predictions.
- The unique ensemble machine learning algorithms, especially that of the SVR bagging model, can effectively estimate concrete strength qualities without the requirement for prolonged casting and testing process.
Supplementary Materials
Author Contributions
Funding
Institutional Review Board Statement
Informed Consent Statement
Data Availability Statement
Acknowledgments
Conflicts of Interest
References
- Nili, M.; Azarioon, A.; Danesh, A.; Deihimi, A. Experimental study and modeling of fiber volume effects on frost resistance of fiber reinforced concrete. Int. J. Civ. Eng. 2018, 16, 263–272. [Google Scholar] [CrossRef]
- Khan, M.; Ali, M. Improvement in concrete behavior with fly ash, silica-fume and coconut fibres. Constr. Build. Mater. 2019, 203, 174–187. [Google Scholar] [CrossRef]
- Li, L.; Khan, M.; Bai, C.; Shi, K. Uniaxial tensile behavior, flexural properties, empirical calculation and microstructure of multi-scale fiber reinforced cement-based material at elevated temperature. Materials 2021, 14, 1827. [Google Scholar] [CrossRef]
- Cao, M.; Mao, Y.; Khan, M.; Si, W.; Shen, S. Different testing methods for assessing the synthetic fiber distribution in cement-based composites. Constr. Build. Mater. 2018, 184, 128–142. [Google Scholar] [CrossRef]
- Khan, M.; Cao, M.; Xie, C.; Ali, M. Hybrid fiber concrete with different basalt fiber length and content. Struct. Concr. 2022, 23, 346–364. [Google Scholar] [CrossRef]
- Khan, M.; Cao, M.; Hussain, A.; Chu, S.H. Effect of silica-fume content on performance of CaCO3 whisker and basalt fiber at matrix interface in cement-based composites. Constr. Build. Mater. 2021, 300, 124046. [Google Scholar] [CrossRef]
- Arshad, S.; Sharif, M.B.; Irfan-ul-Hassan, M.; Khan, M.; Zhang, J.L. Efficiency of Supplementary Cementitious Materials and Natural Fiber on Mechanical Performance of Concrete. Arab. J. Sci. Eng. 2020, 45, 8577–8589. [Google Scholar] [CrossRef]
- Xie, C.; Cao, M.; Guan, J.; Liu, Z.; Khan, M. Improvement of boundary effect model in multi-scale hybrid fibers reinforced cementitious composite and prediction of its structural failure behavior. Compos. Part B Eng. 2021, 224, 109219. [Google Scholar] [CrossRef]
- Thomas, B.S.; Yang, J.; Bahurudeen, A.; Abdalla, J.A.; Hawileh, R.A.; Hamada, H.M.; Nazar, S.; Jittin, V.; Ashish, D.K. Sugarcane bagasse ash as supplementary cementitious material in concrete—A review. Mater. Today Sustain. 2021, 15, 100086. [Google Scholar] [CrossRef]
- Young, B.A.; Hall, A.; Pilon, L.; Gupta, P.; Sant, G. Can the compressive strength of concrete be estimated from knowledge of the mixture proportions?: New insights from statistical analysis and machine learning methods. Cem. Concr. Res. 2019, 115, 379–388. [Google Scholar] [CrossRef]
- Akande, K.O.; Owolabi, T.O.; Twaha, S.; Olatunji, S.O. Performance Comparison of SVM and ANN in Predicting Compressive Strength of Concrete. IOSR J. Comput. Eng. 2014, 16, 88–94. [Google Scholar] [CrossRef]
- Chou, J.S.; Tsai, C.F.; Pham, A.D.; Lu, Y.H. Machine learning in concrete strength simulations: Multi-nation data analytics. Constr. Build. Mater. 2014, 73, 771–780. [Google Scholar] [CrossRef]
- Duan, J.; Asteris, P.G.; Nguyen, H.; Bui, X.N.; Moayedi, H. A novel artificial intelligence technique to predict compressive strength of recycled aggregate concrete using ICA-XGBoost model. Eng. Comput. 2021, 37, 3329–3346. [Google Scholar] [CrossRef]
- Gupta, S.M. Support Vector Machines based Modelling of Concrete Strength. World Acad. Sci. Eng. Technol. 2007, 36, 305–311. [Google Scholar]
- Chou, J.S.; Pham, A.D. Enhanced artificial intelligence for ensemble approach to predicting high performance concrete compressive strength. Constr. Build. Mater. 2013, 49, 554–563. [Google Scholar] [CrossRef]
- Deepa, C.; SathiyaKumari, K.; Sudha, V.P. Prediction of the Compressive Strength of High Performance Concrete Mix using Tree Based Modeling. Int. J. Comput. Appl. 2010, 6, 18–24. [Google Scholar] [CrossRef]
- Erdal, H.I. Two-level and hybrid ensembles of decision trees for high performance concrete compressive strength prediction. Eng. Appl. Artif. Intell. 2013, 26, 1689–1697. [Google Scholar] [CrossRef]
- Nafees, A.; Khan, S.; Javed, M.F.; Alrowais, R.; Mohamed, A.M.; Mohamed, A.; Vatin, N.I. Forecasting the Mechanical Properties of Plastic Concrete Employing Experimental Data Using Machine Learning Algorithms: DT, MLPNN, SVM, and RF. Polymers 2022, 14, 1583. [Google Scholar] [CrossRef]
- Nafees, A.; Javed, M.F.; Khan, S.; Nazir, K.; Farooq, F.; Aslam, F.; Musarat, M.A.; Vatin, N.I. Predictive modeling of mechanical properties of silica fume-based green concrete using artificial intelligence approaches: MLPNN, ANFIS, and GEP. Materials 2021, 14, 7531. [Google Scholar] [CrossRef]
- Khan, M.A.; Aslam, F.; Javed, M.F.; Alabduljabbar, H.; Deifalla, A.F. New prediction models for the compressive strength and dry-thermal conductivity of bio-composites using novel machine learning algorithms. J. Clean. Prod. 2022, 350, 131364. [Google Scholar] [CrossRef]
- Salem, N.M.; Deifalla, A. Evaluation of the Strength of Slab-Column Connections with FRPs Using Machine Learning Algorithms. Polymers 2022, 14, 1517. [Google Scholar] [CrossRef] [PubMed]
- Ebid, A.; Deifalla, A. Using Artificial Intelligence Techniques to Predict Punching Shear Capacity of Lightweight Concrete Slabs. Materials 2022, 15, 2732. [Google Scholar] [CrossRef] [PubMed]
- Dong, W.; Huang, Y.; Lehane, B.; Ma, G. XGBoost algorithm-based prediction of concrete electrical resistivity for structural health monitoring. Autom. Constr. 2020, 114, 103155. [Google Scholar] [CrossRef]
- Ahmad, A.; Farooq, F.; Niewiadomski, P.; Ostrowski, K.; Akbar, A.; Aslam, F.; Alyousef, R. Prediction of compressive strength of fly ash based concrete using individual and ensemble algorithm. Materials 2021, 14, 794. [Google Scholar] [CrossRef] [PubMed]
- Su, M.; Zhong, Q.; Peng, H.; Li, S. Selected machine learning approaches for predicting the interfacial bond strength between FRPs and concrete. Constr. Build. Mater. 2021, 270, 121456. [Google Scholar] [CrossRef]
- Nguyen, K.T.; Nguyen, Q.D.; Le, T.A.; Shin, J.; Lee, K. Analyzing the compressive strength of green fly ash based geopolymer concrete using experiment and machine learning approaches. Constr. Build. Mater. 2020, 247, 118581. [Google Scholar] [CrossRef]
- Ben Chaabene, W.; Flah, M.; Nehdi, M.L. Machine learning prediction of mechanical properties of concrete: Critical review. Constr. Build. Mater. 2020, 260, 119889. [Google Scholar] [CrossRef]
- Castelli, M.; Vanneschi, L.; Silva, S. Prediction of high performance concrete strength using Genetic Programming with geometric semantic genetic operators. Expert Syst. Appl. 2013, 40, 6856–6862. [Google Scholar] [CrossRef]
- Suleiman, A.R.; Nehdi, M.L. Modeling self-healing of concrete using hybrid genetic algorithm-artificial neural network. Materials 2017, 10, 135. [Google Scholar] [CrossRef]
- Zhang, J.; Huang, Y.; Aslani, F.; Ma, G.; Nener, B. A hybrid intelligent system for designing optimal proportions of recycled aggregate concrete. J. Clean. Prod. 2020, 273, 122922. [Google Scholar] [CrossRef]
- Marani, A.; Nehdi, M.L. Machine learning prediction of compressive strength for phase change materials integrated cementitious composites. Constr. Build. Mater. 2020, 265, 120286. [Google Scholar] [CrossRef]
- Soulioti, D.V.; Barkoula, N.M.; Paipetis, A.; Matikas, T.E. Effects of fibre geometry and volume fraction on the flexural behaviour of steel-fibre reinforced concrete. Strain 2011, 47, e535–e541. [Google Scholar] [CrossRef]
- Yoo, D.Y.; Yoon, Y.S.; Banthia, N. Flexural response of steel-fiber-reinforced concrete beams: Effects of strength, fiber content, and strain-rate. Cem. Concr. Compos. 2015, 64, 84–92. [Google Scholar] [CrossRef]
- Jang, S.J.; Yun, H. Do Combined effects of steel fiber and coarse aggregate size on the compressive and flexural toughness of high-strength concrete. Compos. Struct. 2018, 185, 203–211. [Google Scholar] [CrossRef]
- Johnson, D.A.; Pedersen, N.; Jacobsen, C.B. Effect of steel fibers on flexural behaviour of normal and high strength concrete. Int. J. Civ. Environ. Eng. 2014, 8, 22–26. [Google Scholar]
- Dinh, N.H.; Park, S.H.; Choi, K.K. Effect of dispersed micro-fibers on tensile behavior of uncoated carbon textile-reinforced cementitious mortar after high-temperature exposure. Cem. Concr. Compos. 2021, 118, 103949. [Google Scholar] [CrossRef]
- Thomas, J.; Ramaswamy, A. Mechanical Properties of Steel Fiber-Reinforced Concrete. J. Mater. Civ. Eng. 2007, 19, 385–392. [Google Scholar] [CrossRef]
- Sivakumar, A.; Santhanam, M. Mechanical properties of high strength concrete reinforced with metallic and non-metallic fibres. Cem. Concr. Compos. 2007, 29, 603–608. [Google Scholar] [CrossRef]
- Afroughsabet, V.; Ozbakkaloglu, T. Mechanical and durability properties of high-strength concrete containing steel and polypropylene fibers. Constr. Build. Mater. 2015, 94, 73–82. [Google Scholar] [CrossRef]
- Atiş, C.D.; Karahan, O. Properties of steel fiber reinforced fly ash concrete. Constr. Build. Mater. 2009, 23, 392–399. [Google Scholar] [CrossRef]
- Lee, J.H.; Cho, B.; Choi, E. Flexural capacity of fiber reinforced concrete with a consideration of concrete strength and fiber content. Constr. Build. Mater. 2017, 138, 222–231. [Google Scholar] [CrossRef]
- Köksal, F.; Altun, F.; Yiǧit, I.; Şahin, Y. Combined effect of silica fume and steel fiber on the mechanical properties of high strength concretes. Constr. Build. Mater. 2008, 22, 1874–1880. [Google Scholar] [CrossRef]
- Yoon, E.S.; Park, S.B. An experimental study on the mechanical properties and long-term deformations of high-strength steel fiber reinforced concrete. J. Korean Soc. Civ. Eng. 2006, 26, 401–409. [Google Scholar]
- Abbass, W.; Khan, M.I.; Mourad, S. Evaluation of mechanical properties of steel fiber reinforced concrete with different strengths of concrete. Constr. Build. Mater. 2018, 168, 556–569. [Google Scholar] [CrossRef]
- Yoo, D.Y.; Yoon, Y.S.; Banthia, N. Predicting the post-cracking behavior of normal- and high-strength steel-fiber-reinforced concrete beams. Constr. Build. Mater. 2015, 93, 477–485. [Google Scholar] [CrossRef]
- Lee, H.-H.; Lee, H.-J. Characteristic Strength and Deformation of SFRC Considering Steel Fiber Factor and Volume fraction. J. Korea Concr. Inst. 2004, 16, 759–766. [Google Scholar] [CrossRef]
- Oh, Y.H. Evaluation of Flexural Strength for Normal and High Strength Concrete with Hooked Steel Fibers. J. Korea Concr. Inst. 2008, 20, 531–539. [Google Scholar] [CrossRef] [Green Version]
- Song, P.; Hwang, S. Mechanical properties of high-strength steel fiber-reinforced concrete. Constr. Build. Mater. 2004, 18, 669–673. [Google Scholar] [CrossRef]
- Reddy, V.M.; Rao, D.M.V.S. Effect of w/c ratio on workability and mechanical properties of high strength Self Compacting Concrete (M70 grade). IOSR J. Mech. Civ. Eng. 2014, 11, 15–21. [Google Scholar] [CrossRef]
- Nili, M.; Afroughsabet, V. Combined effect of silica fume and steel fibers on the impact resistance and mechanical properties of concrete. Int. J. Impact Eng. 2010, 37, 879–886. [Google Scholar] [CrossRef] [Green Version]
- Kim, J.J.; Kim, D.J.; Kang, S.T.; Lee, J.H. Influence of sand to coarse aggregate ratio on the interfacial bond strength of steel fibers in concrete for nuclear power plant. Nucl. Eng. Des. 2012, 252, 1–10. [Google Scholar] [CrossRef]
- Chitlange, M.R.; Pajgade, P.S. Strength appraisal of artificial sand as fine aggregate in SFRC. J. Eng. Appl. Sci. 2010, 5, 34–38. [Google Scholar]
- Khan, M.; Ali, M. Effect of super plasticizer on the properties of medium strength concrete prepared with coconut fiber. Constr. Build. Mater. 2018, 182, 703–715. [Google Scholar] [CrossRef]
- Aruntaş, H.Y.; Cemalgil, S.; Şimşek, O.; Durmuş, G.; Erdal, M. Effects of super plasticizer and curing conditions on properties of concrete with and without fiber. Mater. Lett. 2008, 62, 3441–3443. [Google Scholar] [CrossRef]
- Nili, M.; Afroughsabet, V. Property assessment of steel-fibre reinforced concrete made with silica fume. Constr. Build. Mater. 2012, 28, 664–669. [Google Scholar] [CrossRef]
- Saravana, R.M.K.; Sumathi, A. Effect of fly ash in fiber reinforced concrete composites. Jordan J. Civ. Eng. 2017, 11, 30–39. [Google Scholar]
- Challoob, M.A.; Srivastava, V.; Materials, A. Effect of Fly Ash and Steel Fibre on Portland Pozzolana Cement Concrete. Int. J. Eng. Trends Technol. 2013, 5, 144–147. [Google Scholar]
- Saha, A.K. Effect of class F fly ash on the durability properties of concrete. Sustain. Environ. Res. 2018, 28, 25–31. [Google Scholar] [CrossRef]
- Roshani, M.M.; Kargar, S.H.; Farhangi, V.; Karakouzian, M. Predicting the effect of fly ash on concrete’s mechanical properties by ann. Sustainability 2021, 13, 1469. [Google Scholar] [CrossRef]
- Ahmad, A.; Chaiyasarn, K.; Farooq, F.; Ahmad, W.; Suparp, S.; Aslam, F. Compressive strength prediction via gene expression programming (Gep) and artificial neural network (ann) for concrete containing rca. Buildings 2021, 11, 324. [Google Scholar] [CrossRef]
- Wang, Q.; Ahmad, W.; Ahmad, A.; Aslam, F.; Mohamed, A.; Vatin, N.I. Application of Soft Computing Techniques to Predict the Strength of Geopolymer Composites. Polymers 2022, 14, 1074. [Google Scholar] [CrossRef] [PubMed]
- Zhu, A.Y.; Ahmad, W.; Ahmad, N.I.; Vatin, A.M.; Mohamed, D.F. Predicting the Splitting Tensile Strength of Recycled Aggregate Concrete Using Individual and Ensemble Machine Learning Approaches. Crystals 2022, 12, 569. [Google Scholar] [CrossRef]
- Ahmad, A.; Ahmad, W.; Chaiyasarn, K.; Ostrowski, K.A.; Aslam, F.; Zajdel, P.; Joyklad, P. Prediction of geopolymer concrete compressive strength using novel machine learning algorithms. Polymers 2021, 13, 3389. [Google Scholar] [CrossRef] [PubMed]
- Leinweber, D.J. Stupid data miner tricks: Overfitting the S&P500. J. Investig. 2007, 16, 15–22. [Google Scholar]
- Kohavi, R. A Study of Cross-Validation and Bootstrap for Accuracy Estimation and Model Selection. Int. Jt. Conf. Artif. Intell. 1995, 30, 133. [Google Scholar]
- Farooq, F.; Ahmed, W.; Akbar, A.; Aslam, F.; Alyousef, R. Predictive modeling for sustainable high-performance concrete from industrial wastes: A comparison and optimization of models using ensemble learners. J. Clean. Prod. 2021, 292, 126032. [Google Scholar] [CrossRef]
- Ahmad, A.; Ostrowski, K.A.; Maślak, M.; Farooq, F.; Mehmood, I.; Nafees, A. Comparative study of supervised machine learning algorithms for predicting the compressive strength of concrete at high temperature. Materials 2021, 14, 4222. [Google Scholar] [CrossRef]
- Leung, K.W.K.; Pan, Z.L.; Warner, D.H. Kohn-Sham density functional theory prediction of fracture in silicon carbide under mixed mode loading. Model. Simul. Mater. Sci. Eng. 2016, 24, 035004. [Google Scholar] [CrossRef]
- Leung, K.W.K.; Pan, Z.L.; Warner, D.H. Atomistic-based predictions of crack tip behavior in silicon carbide across a range of temperatures and strain rates. Acta Mater. 2014, 77, 324–334. [Google Scholar] [CrossRef]
- Saroukhani, S.; Nguyen, L.D.; Leung, K.W.K.; Singh, C.V.; Warner, D.H. Harnessing atomistic simulations to predict the rate at which dislocations overcome obstacles. J. Mech. Phys. Solids 2016, 90, 203–214. [Google Scholar] [CrossRef]
- Kiani, S.; Leung, K.W.K.; Radmilovic, V.; Minor, A.M.; Yang, J.M.; Warner, D.H.; Kodambaka, S. Dislocation glide-controlled room-temperature plasticity in 6H-SiC single crystals. Acta Mater. 2014, 80, 400–406. [Google Scholar] [CrossRef] [Green Version]
- Ilawe, N.V.; Zimmerman, J.A.; Wong, B.M. Breaking badly: DFT-D2 gives sizeable errors for tensile strengths in palladium-hydride solids. J. Chem. Theory Comput. 2015, 11, 5426–5435. [Google Scholar] [CrossRef] [PubMed]


| Cement (kg/m3) | Water (kg/m3) | Sand (kg/m3) | Coarse Aggregate (kg/m3) | Superplasticizer (%) | Silica Fume % | Fly Ash % | Steel Fiber (%) | Fiber Length (mm) | Fiber Dia (mm) | Compressive Strength MPa (28 Days) | |
|---|---|---|---|---|---|---|---|---|---|---|---|
| Mean | 445.8 | 170.8 | 783.7 | 940.7 | 0.9 | 6.0 | 1.4 | 0.8 | 40.5 | 0.6 | 61.3 |
| Standard Error | 8.2 | 2.4 | 11.9 | 19.9 | 0.1 | 0.9 | 0.4 | 0.0 | 1.2 | 0.0 | 1.7 |
| Median | 400.0 | 157.8 | 743.0 | 1050.5 | 0.2 | 0.0 | 0.0 | 1.0 | 35.0 | 0.6 | 62.8 |
| Mode | 400.0 | 152.0 | 835.0 | 1047.0 | 0.0 | 0.0 | 0.0 | 0.5 | 60.0 | 0.8 | 29.1 |
| Standard Deviation | 105.4 | 30.7 | 153.3 | 256.8 | 1.8 | 11.7 | 5.7 | 0.6 | 16.1 | 0.2 | 21.6 |
| Range | 400.0 | 137.0 | 768.0 | 1170.0 | 9.0 | 43.0 | 30.0 | 2.0 | 60.0 | 0.9 | 73.1 |
| Minimum | 280.0 | 133.0 | 582.0 | 0.0 | 0.0 | 0.0 | 0.0 | 0.0 | 0.0 | 0.0 | 26.1 |
| Maximum | 680.0 | 270.0 | 1350.0 | 1170.0 | 9.0 | 43.0 | 30.0 | 2.0 | 60.0 | 0.9 | 99.2 |
| Count | 166.0 | 166.0 | 166.0 | 166.0 | 166.0 | 166.0 | 166.0 | 166.0 | 166.0 | 166.0 | 166.0 |
| Models | MAE (MPa) | RMSE (MPa) | R2 |
|---|---|---|---|
| Support vector regression | 7.0 | 9.1 | 0.81 |
| SVR AdaBoost | 4.4 | 8.0 | 0.96 |
| SVR bagging | 6.2 | 7.6 | 0.87 |
| K-Fold | SVR | SVR AdaBoost | SVR Bagging | ||||||
|---|---|---|---|---|---|---|---|---|---|
| MAE | RMSE | R2 | MAE | RMSE | R2 | MAE | RMSE | R2 | |
| 1 | 3.02 | 3.11 | 0.78 | 3.62 | 8.29 | 0.91 | 6.79 | 8.84 | 0.72 |
| 2 | 3.43 | 4.10 | 0.75 | 3.43 | 4.29 | 0.94 | 4.81 | 5.28 | 0.82 |
| 3 | 9.49 | 11.80 | 0.30 | 8.24 | 9.65 | 0.70 | 11.15 | 14.15 | 0.48 |
| 4 | 2.72 | 4.73 | 0.79 | 3.49 | 4.29 | 0.94 | 4.14 | 5.93 | 0.87 |
| 5 | 12.69 | 14.10 | 0.28 | 4.58 | 7.89 | 0.87 | 5.93 | 7.31 | 0.75 |
| 6 | 4.36 | 6.76 | 0.77 | 7.82 | 8.76 | 0.79 | 4.88 | 6.88 | 0.83 |
| 7 | 7.73 | 10.50 | 0.60 | 9.40 | 10.70 | 0.69 | 8.72 | 11.46 | 0.62 |
| 8 | 2.95 | 4.07 | 0.81 | 4.79 | 5.83 | 0.81 | 4.66 | 5.45 | 0.83 |
| 9 | 3.52 | 5.52 | 0.77 | 3.23 | 4.90 | 0.94 | 4.83 | 5.53 | 0.81 |
| 10 | 9.76 | 11.17 | 0.30 | 2.46 | 3.49 | 0.96 | 5.16 | 7.46 | 0.79 |
Publisher’s Note: MDPI stays neutral with regard to jurisdictional claims in published maps and institutional affiliations. |
© 2022 by the authors. Licensee MDPI, Basel, Switzerland. This article is an open access article distributed under the terms and conditions of the Creative Commons Attribution (CC BY) license (https://creativecommons.org/licenses/by/4.0/).
Share and Cite
Li, Y.; Zhang, Q.; Kamiński, P.; Deifalla, A.F.; Sufian, M.; Dyczko, A.; Kahla, N.B.; Atig, M. Compressive Strength of Steel Fiber-Reinforced Concrete Employing Supervised Machine Learning Techniques. Materials 2022, 15, 4209. https://doi.org/10.3390/ma15124209
Li Y, Zhang Q, Kamiński P, Deifalla AF, Sufian M, Dyczko A, Kahla NB, Atig M. Compressive Strength of Steel Fiber-Reinforced Concrete Employing Supervised Machine Learning Techniques. Materials. 2022; 15(12):4209. https://doi.org/10.3390/ma15124209
Chicago/Turabian StyleLi, Yongjian, Qizhi Zhang, Paweł Kamiński, Ahmed Farouk Deifalla, Muhammad Sufian, Artur Dyczko, Nabil Ben Kahla, and Miniar Atig. 2022. "Compressive Strength of Steel Fiber-Reinforced Concrete Employing Supervised Machine Learning Techniques" Materials 15, no. 12: 4209. https://doi.org/10.3390/ma15124209