
Using Fumed Silica to Develop Thermal Insulation Cement for Medium–Low Temperature Geothermal Wells


Abstract
:1. Introduction
2. Materials and Methods
2.1. Materials
2.2. Mix Design and Sample Preparation
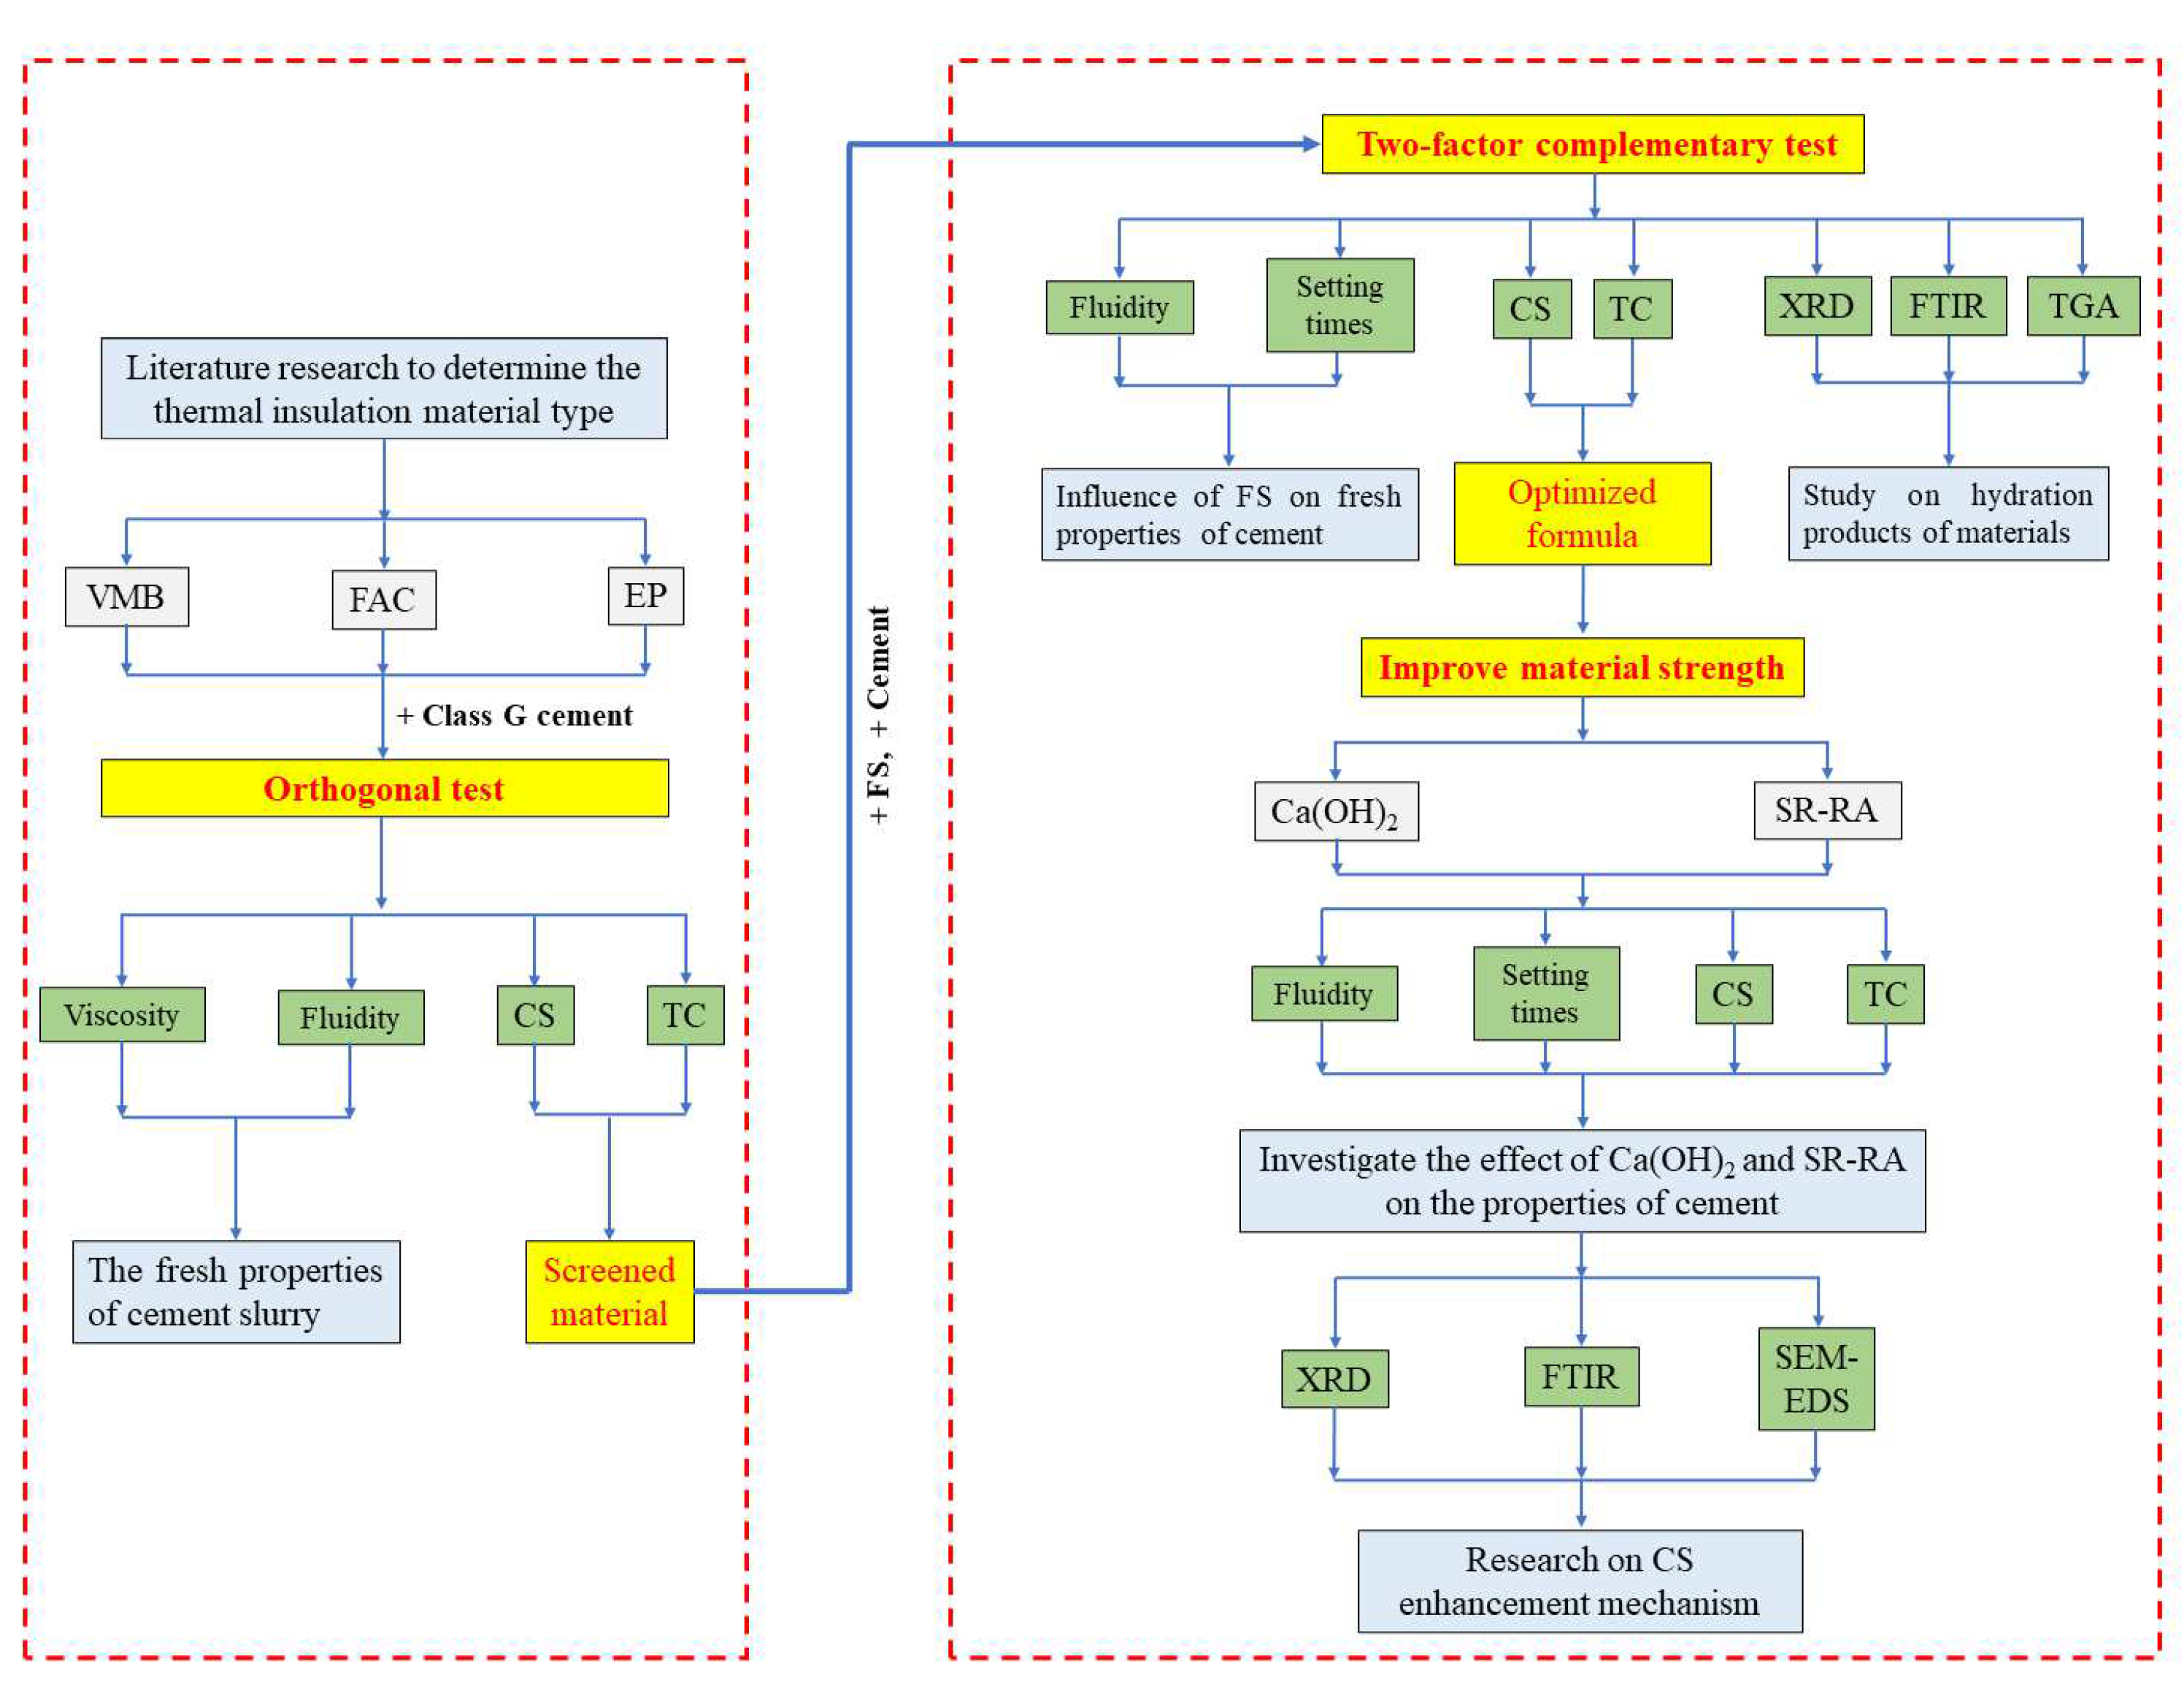
2.2.1. Orthogonal Experiment Design
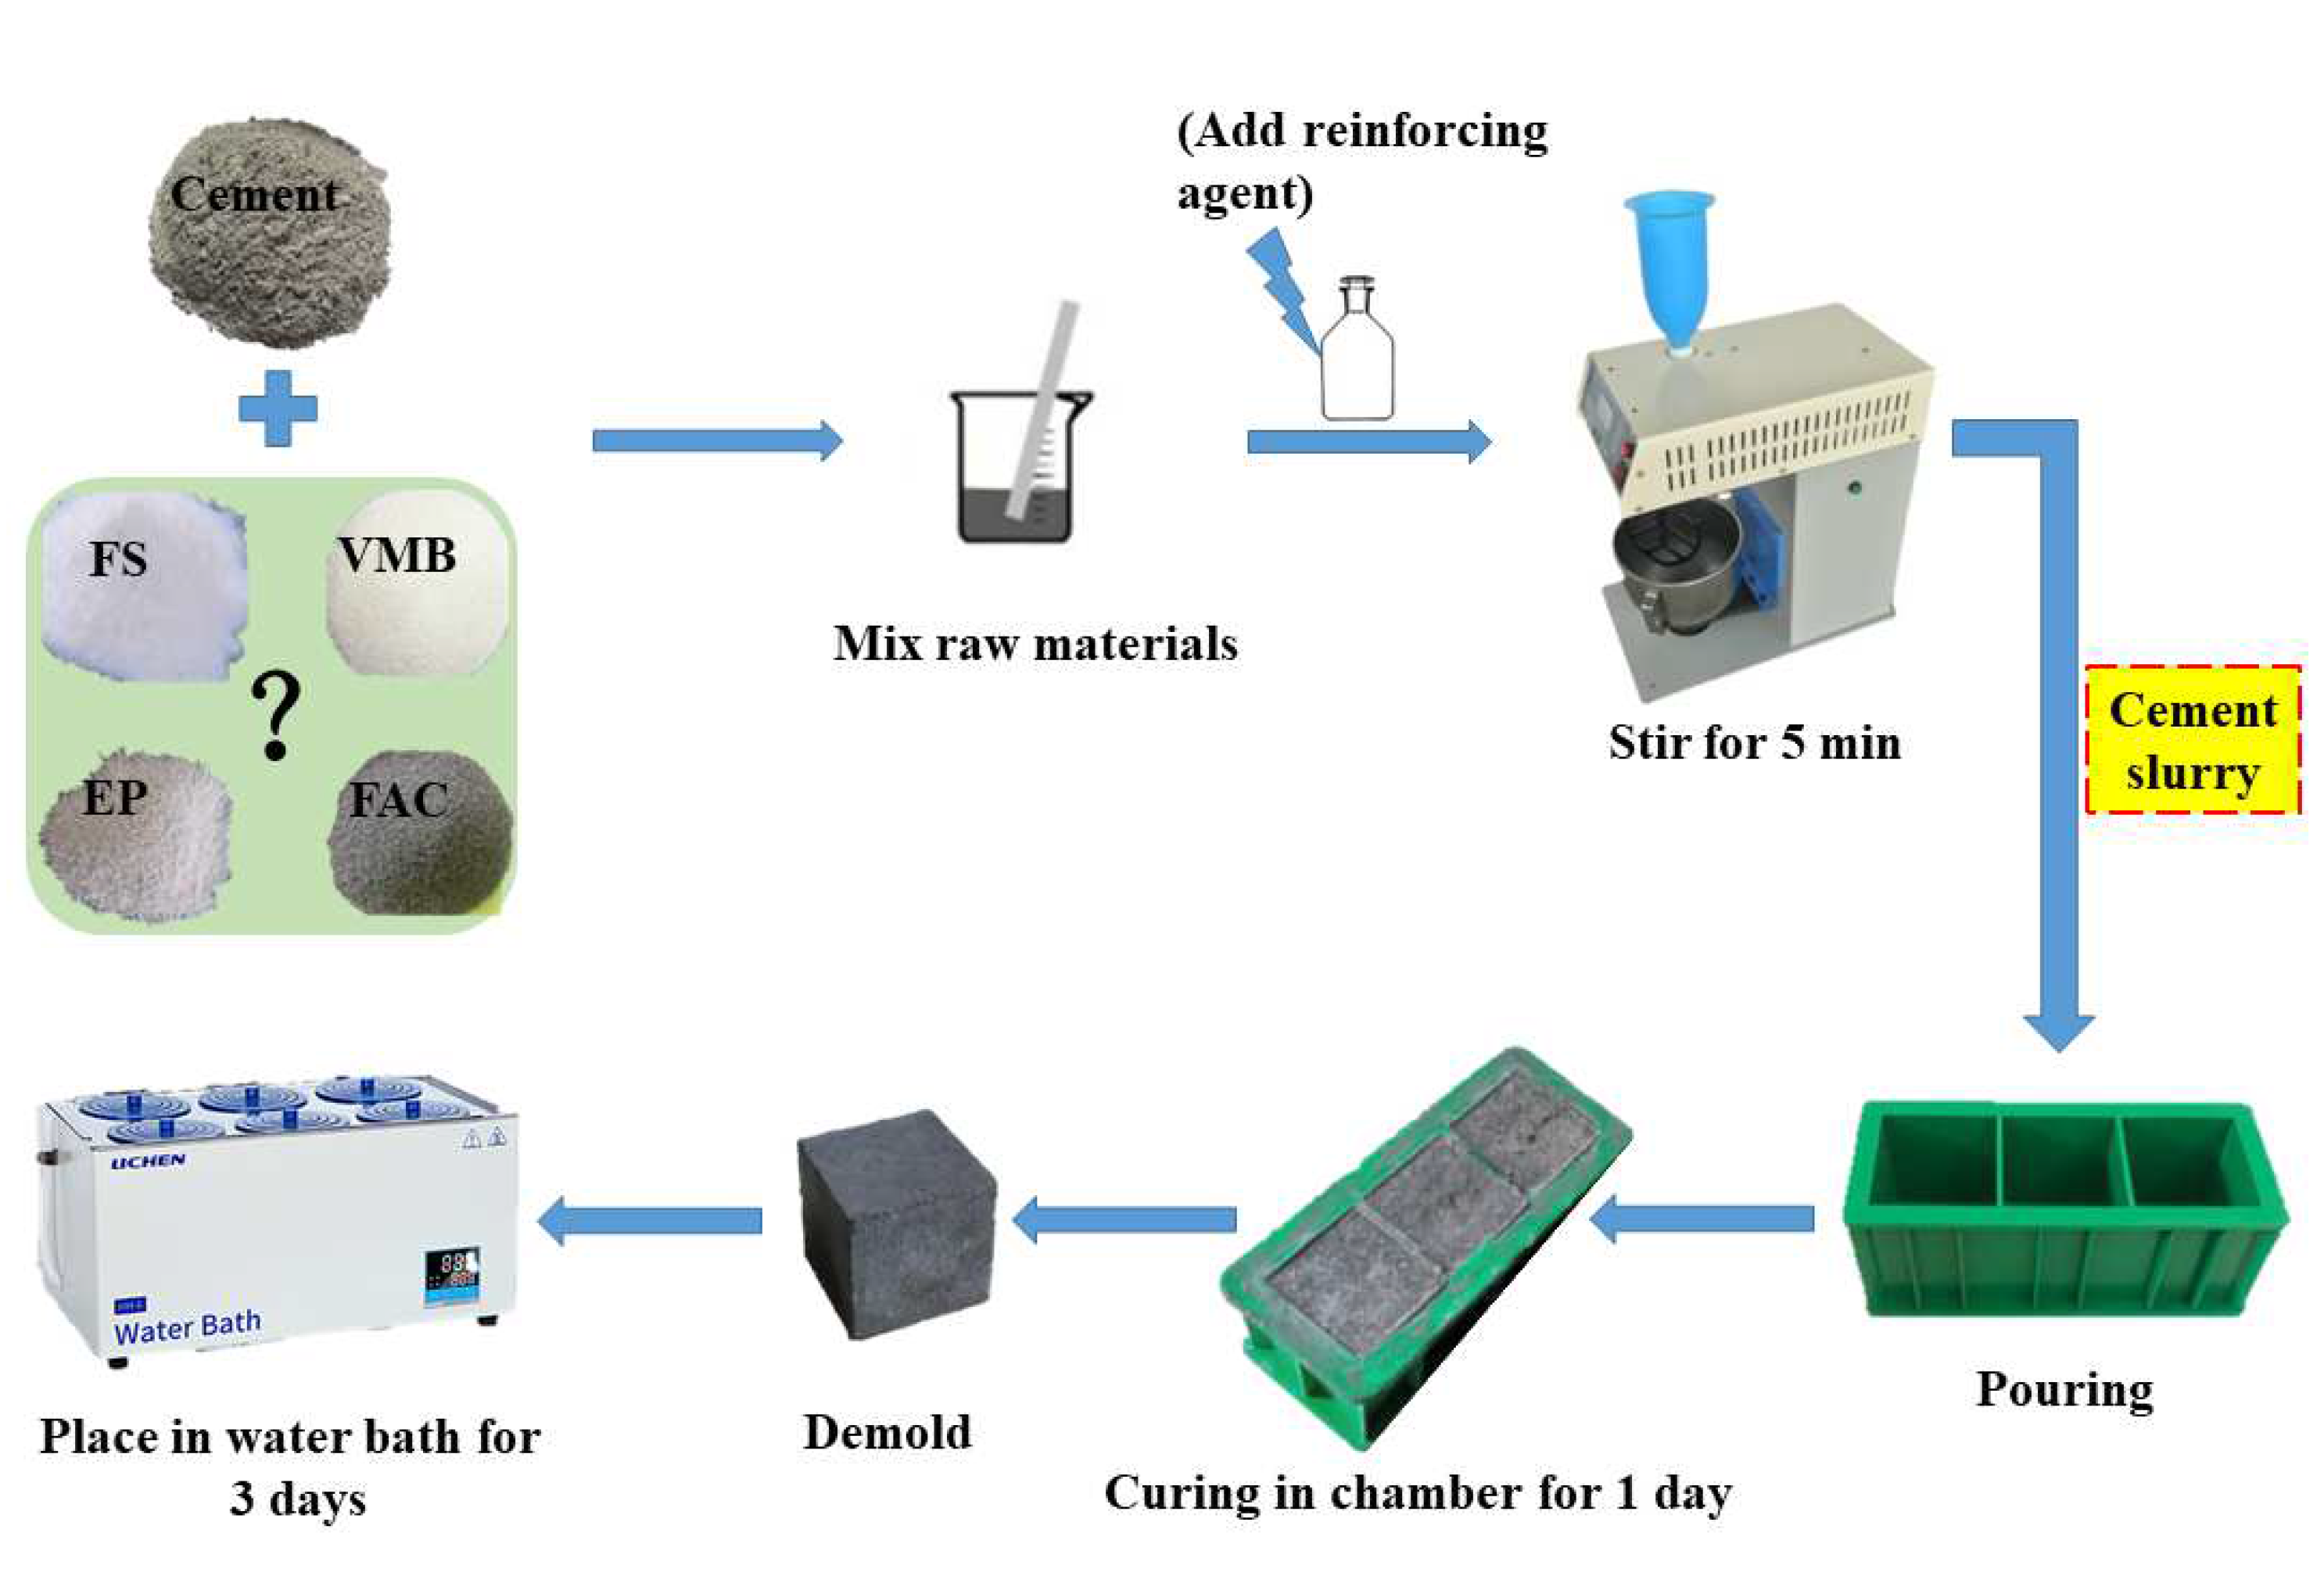
2.2.2. Preparation Procedure
2.3. Testing Methods
3. Results and Discussion
3.1. Orthogonal Test and Analysis
3.2. Two-Factor Complementary Test
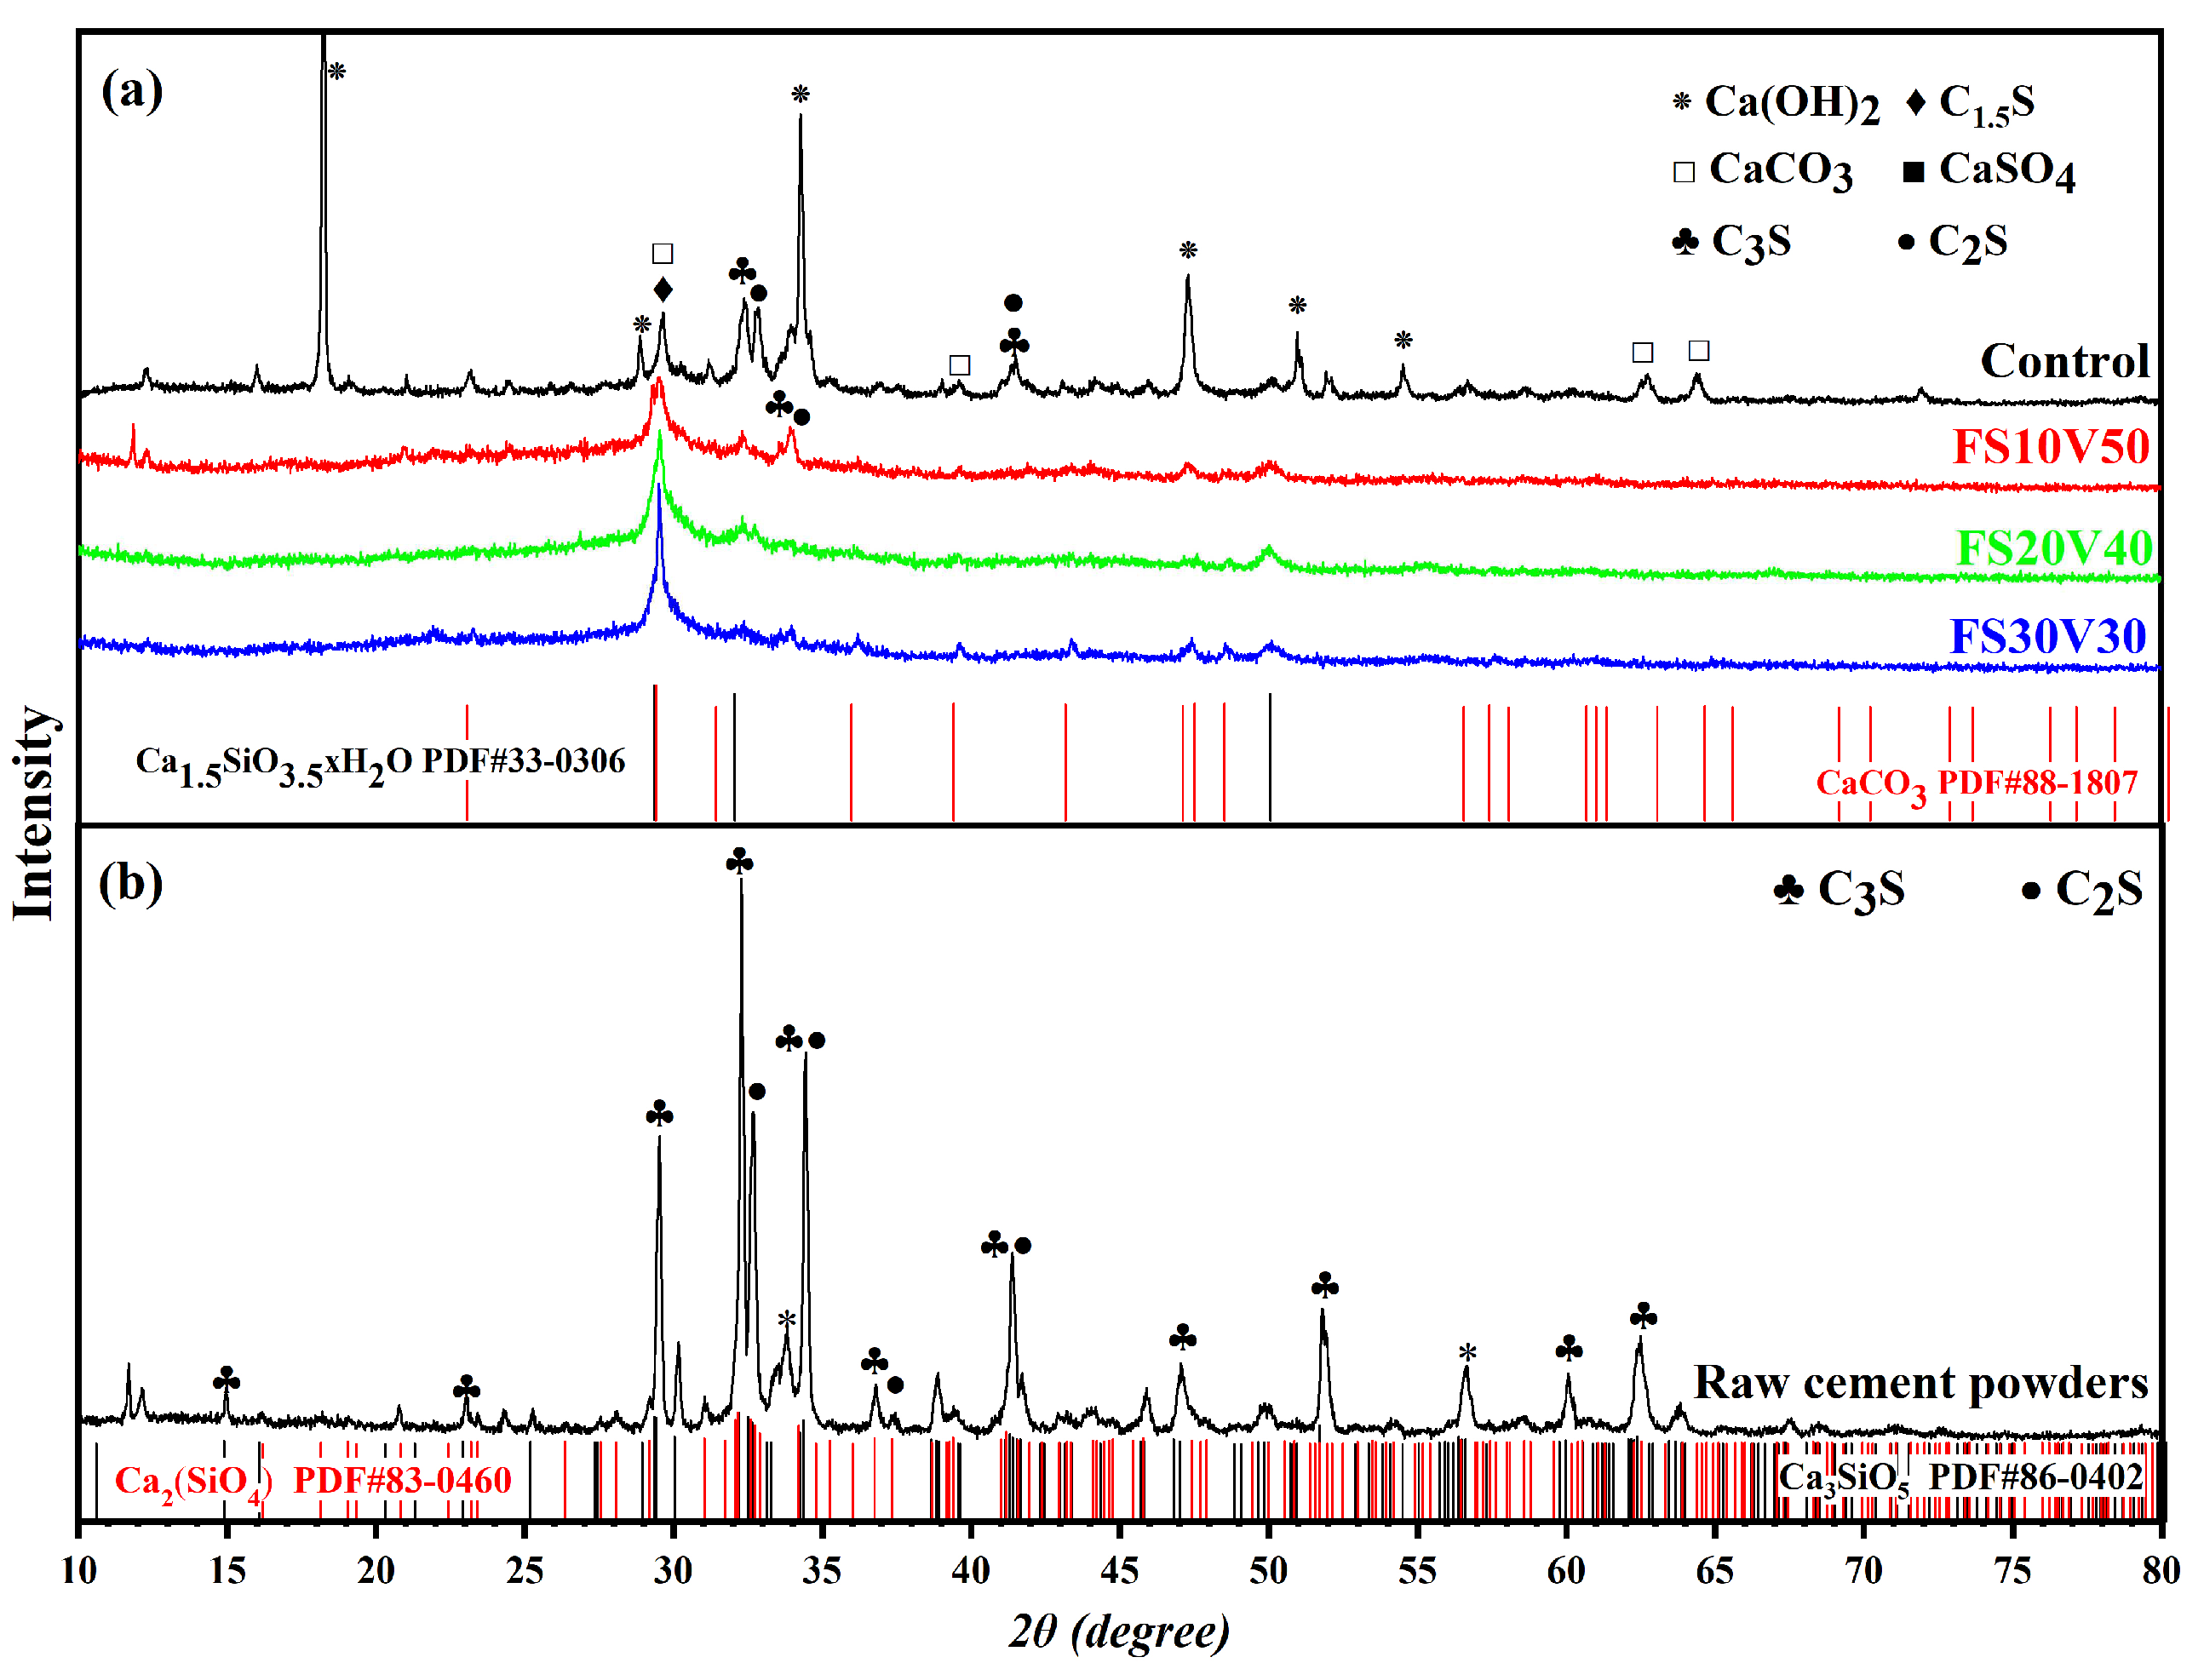
3.3. XRD
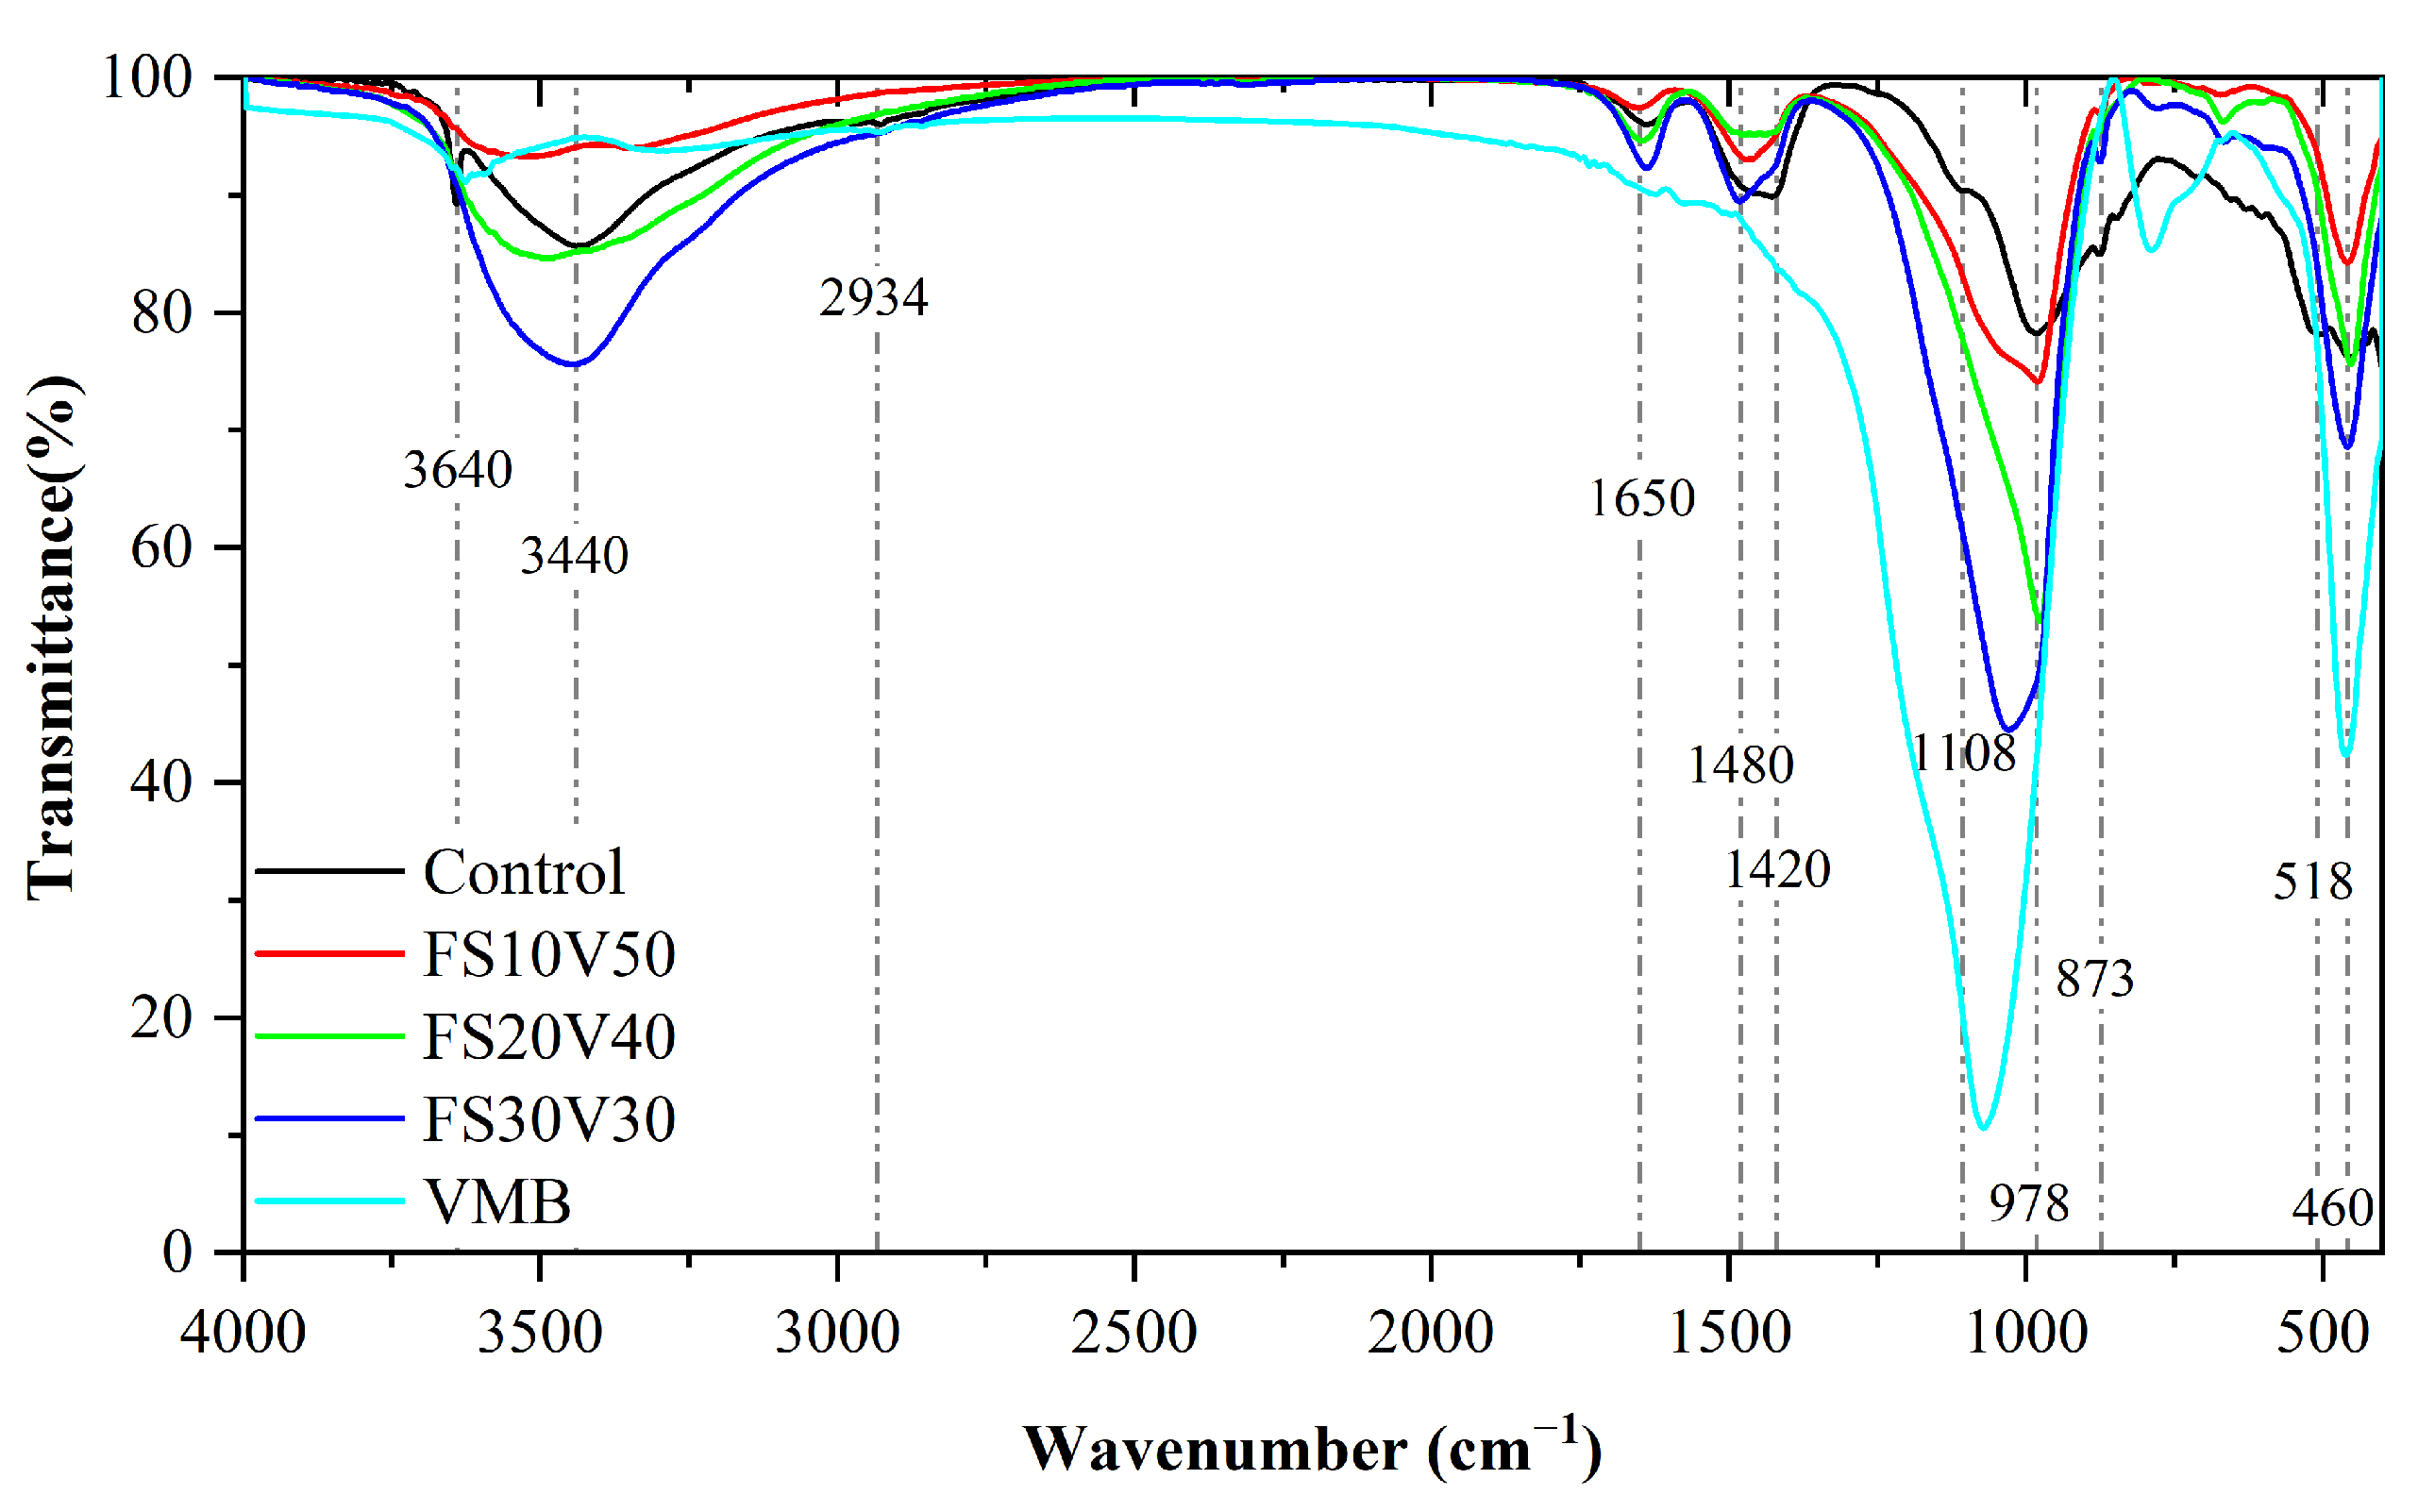
3.4. FT-IR Spectroscopy
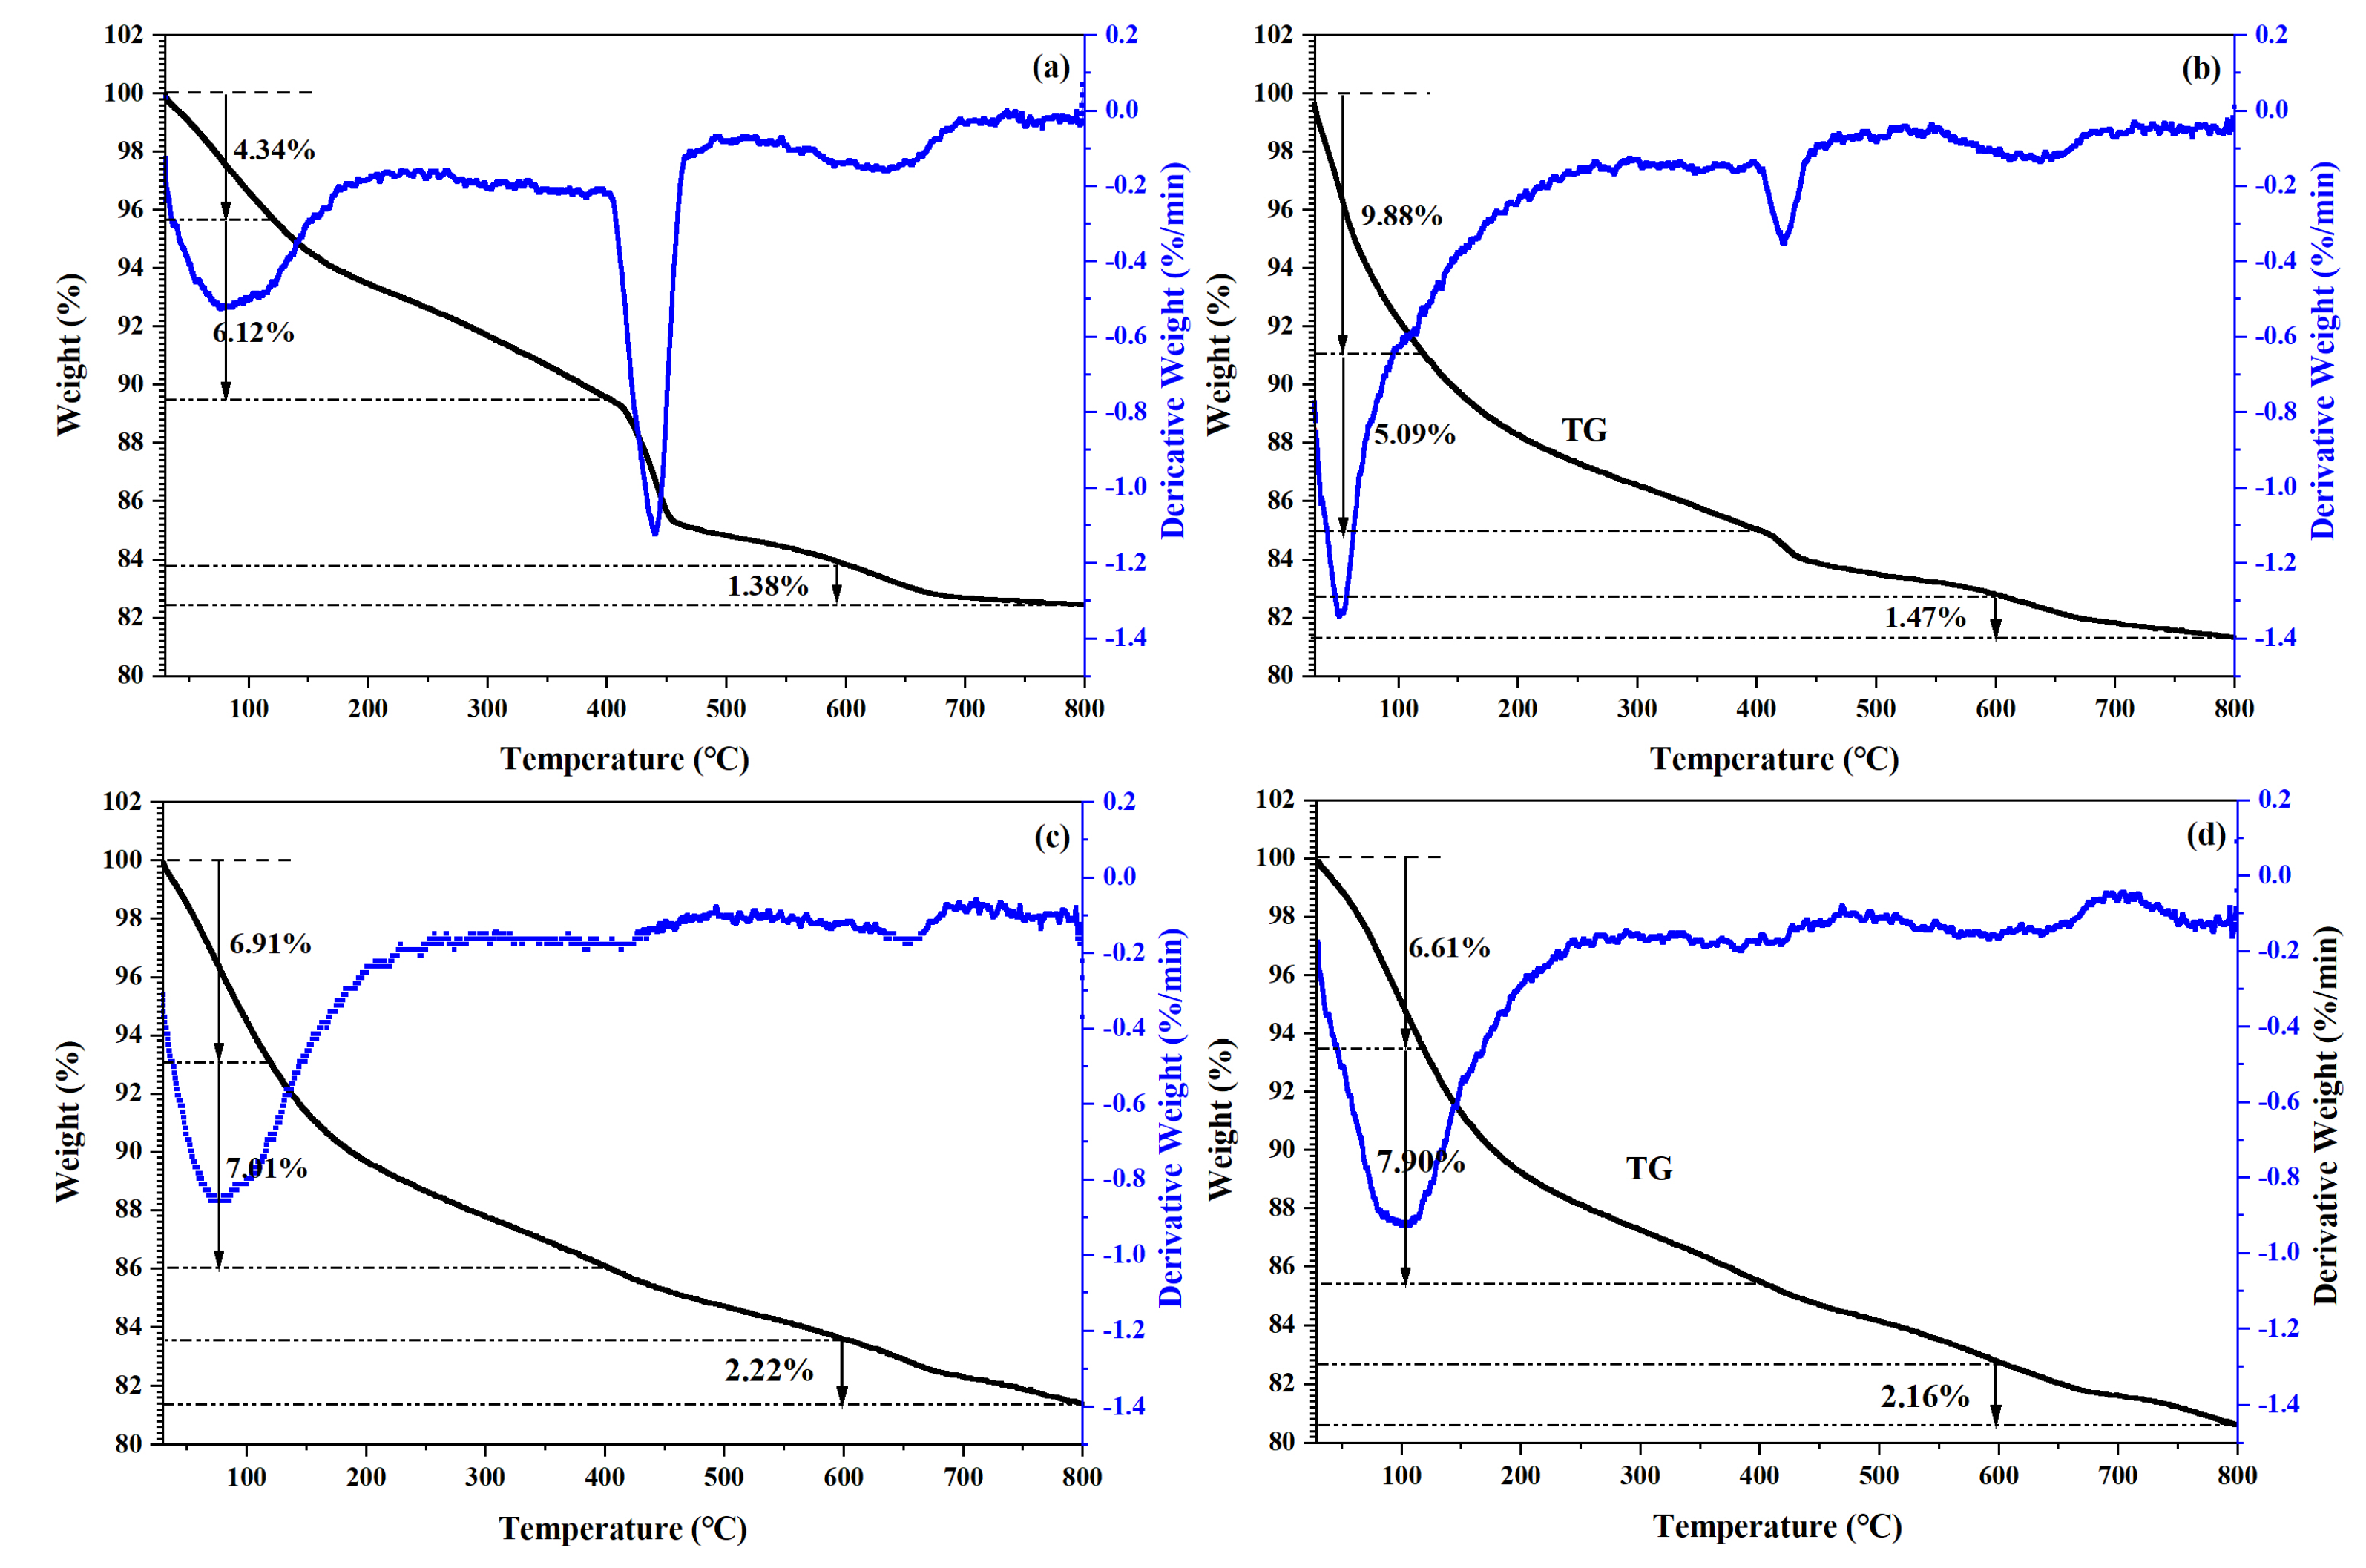
3.5. TGA
3.6. Compressive Strength Enhancement Mechanism
3.6.1. Compressive Strength
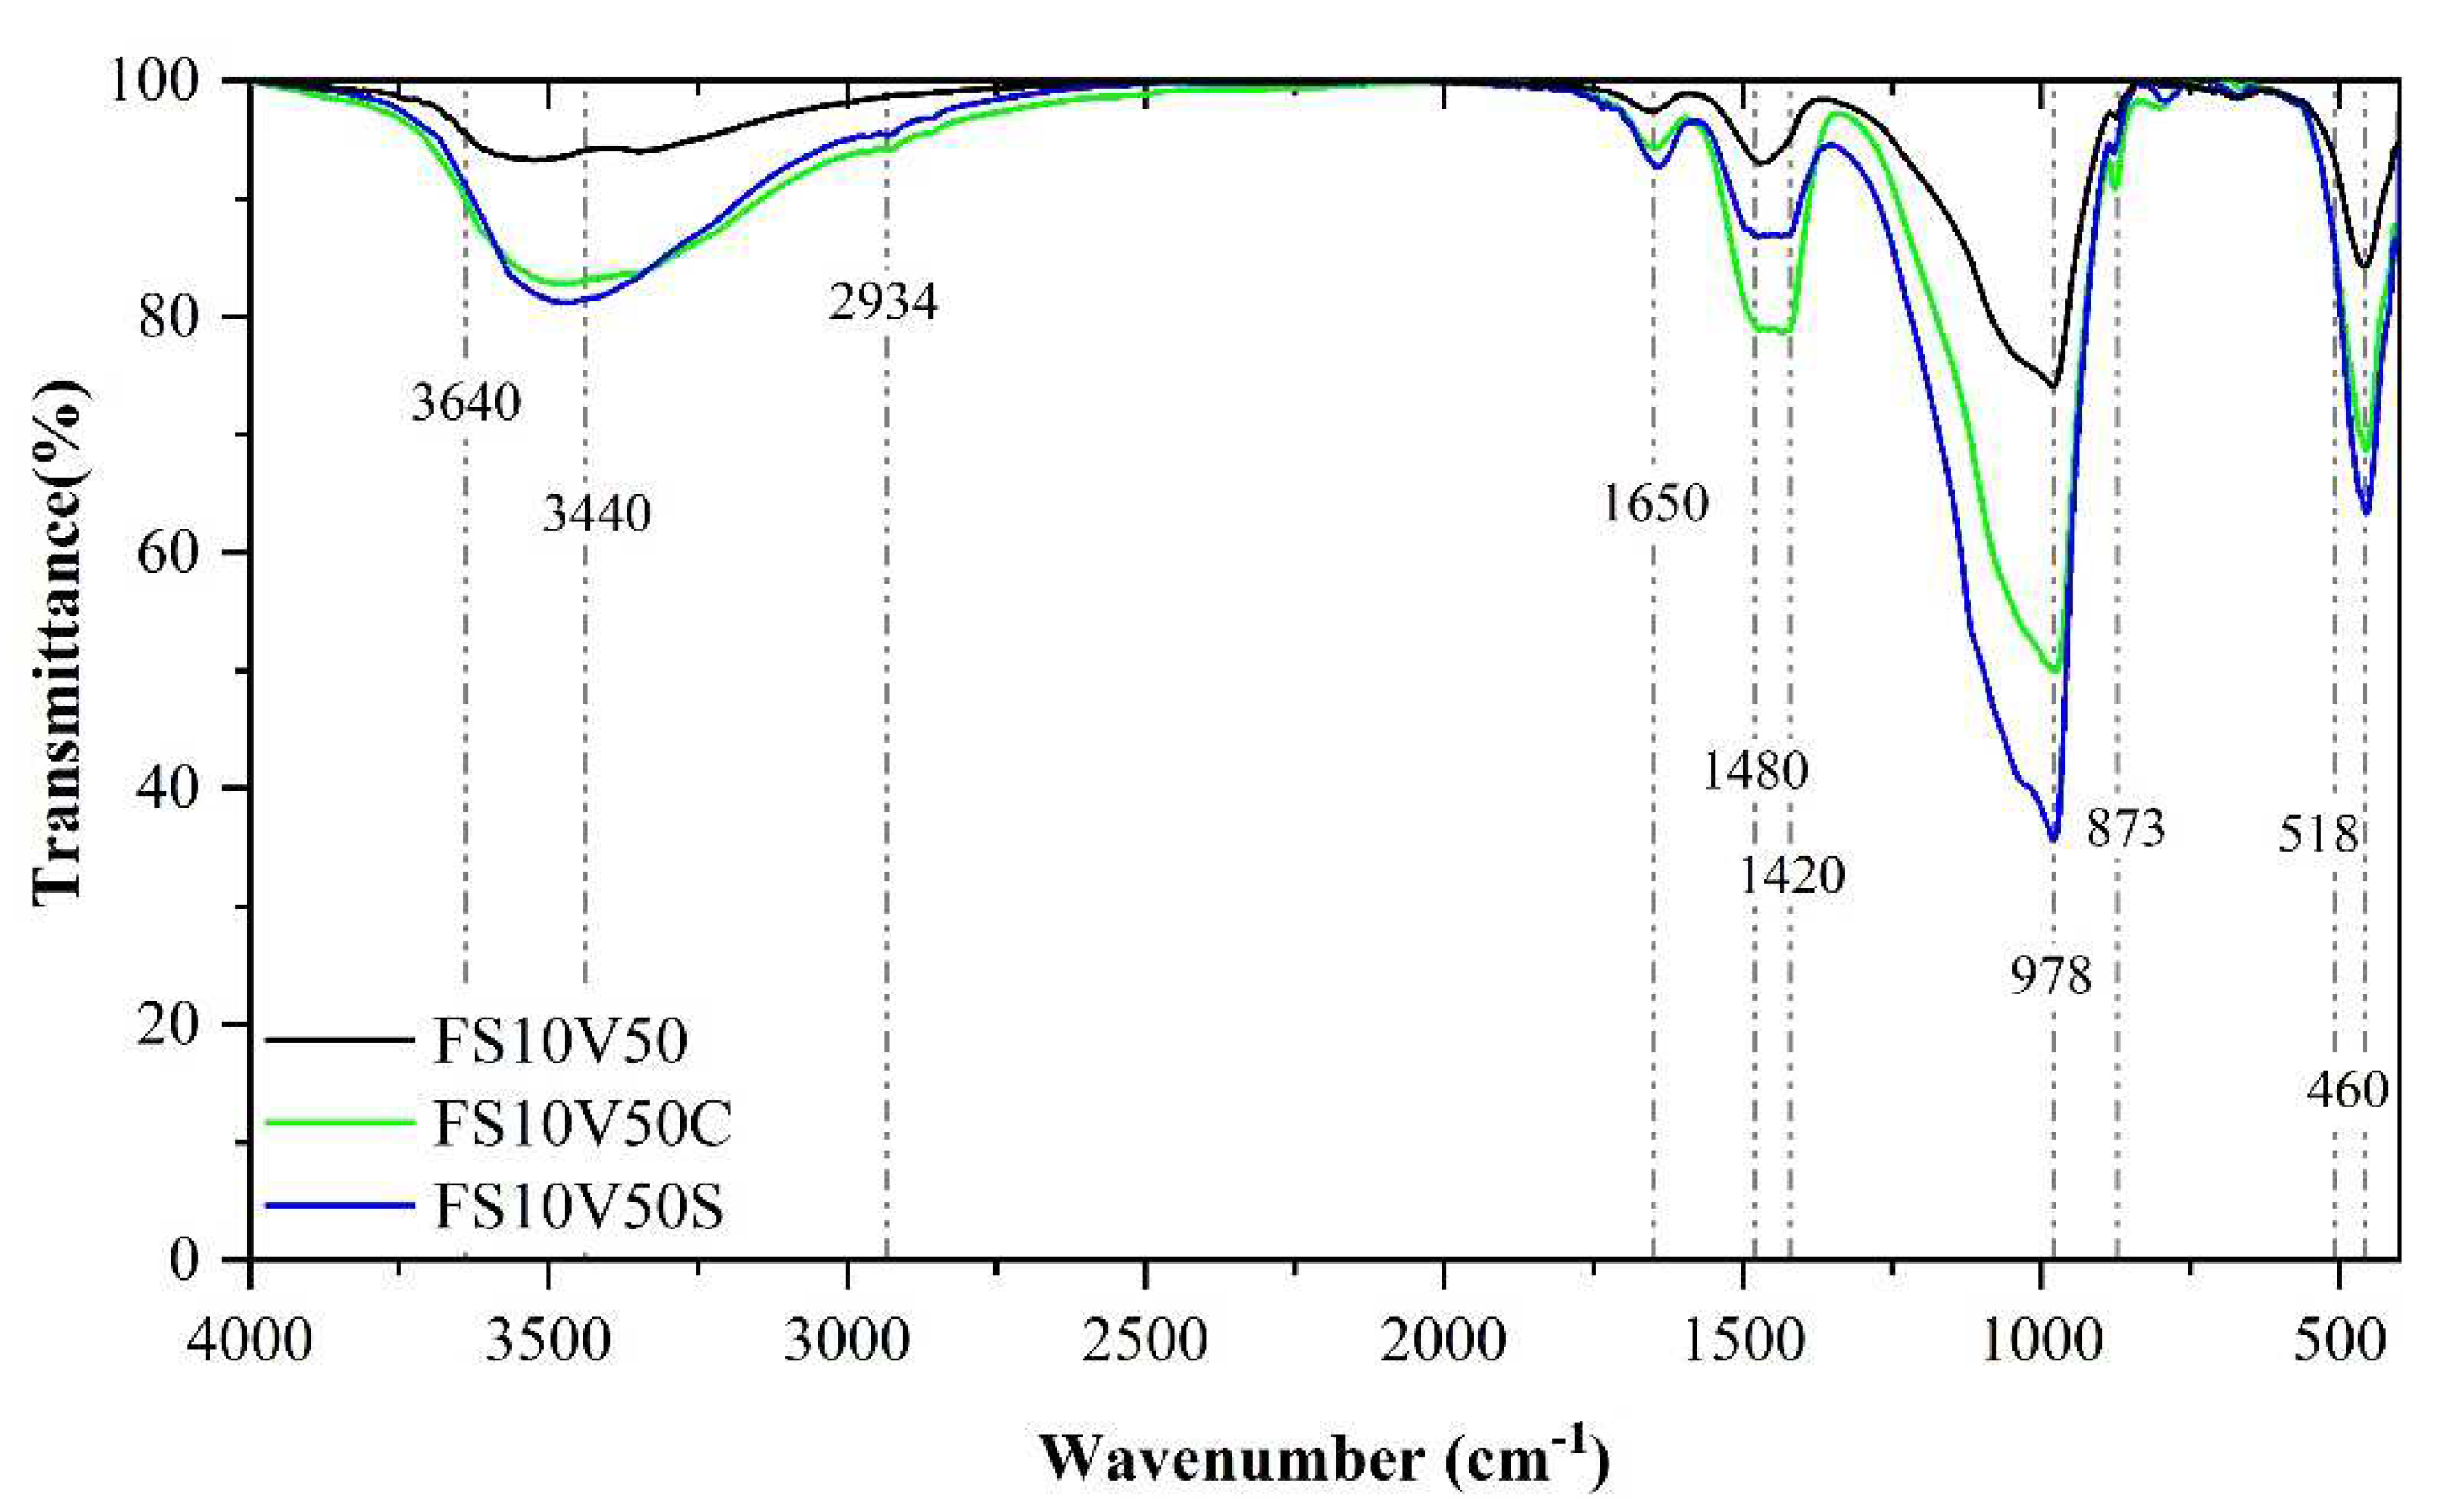
3.6.2. FTIR
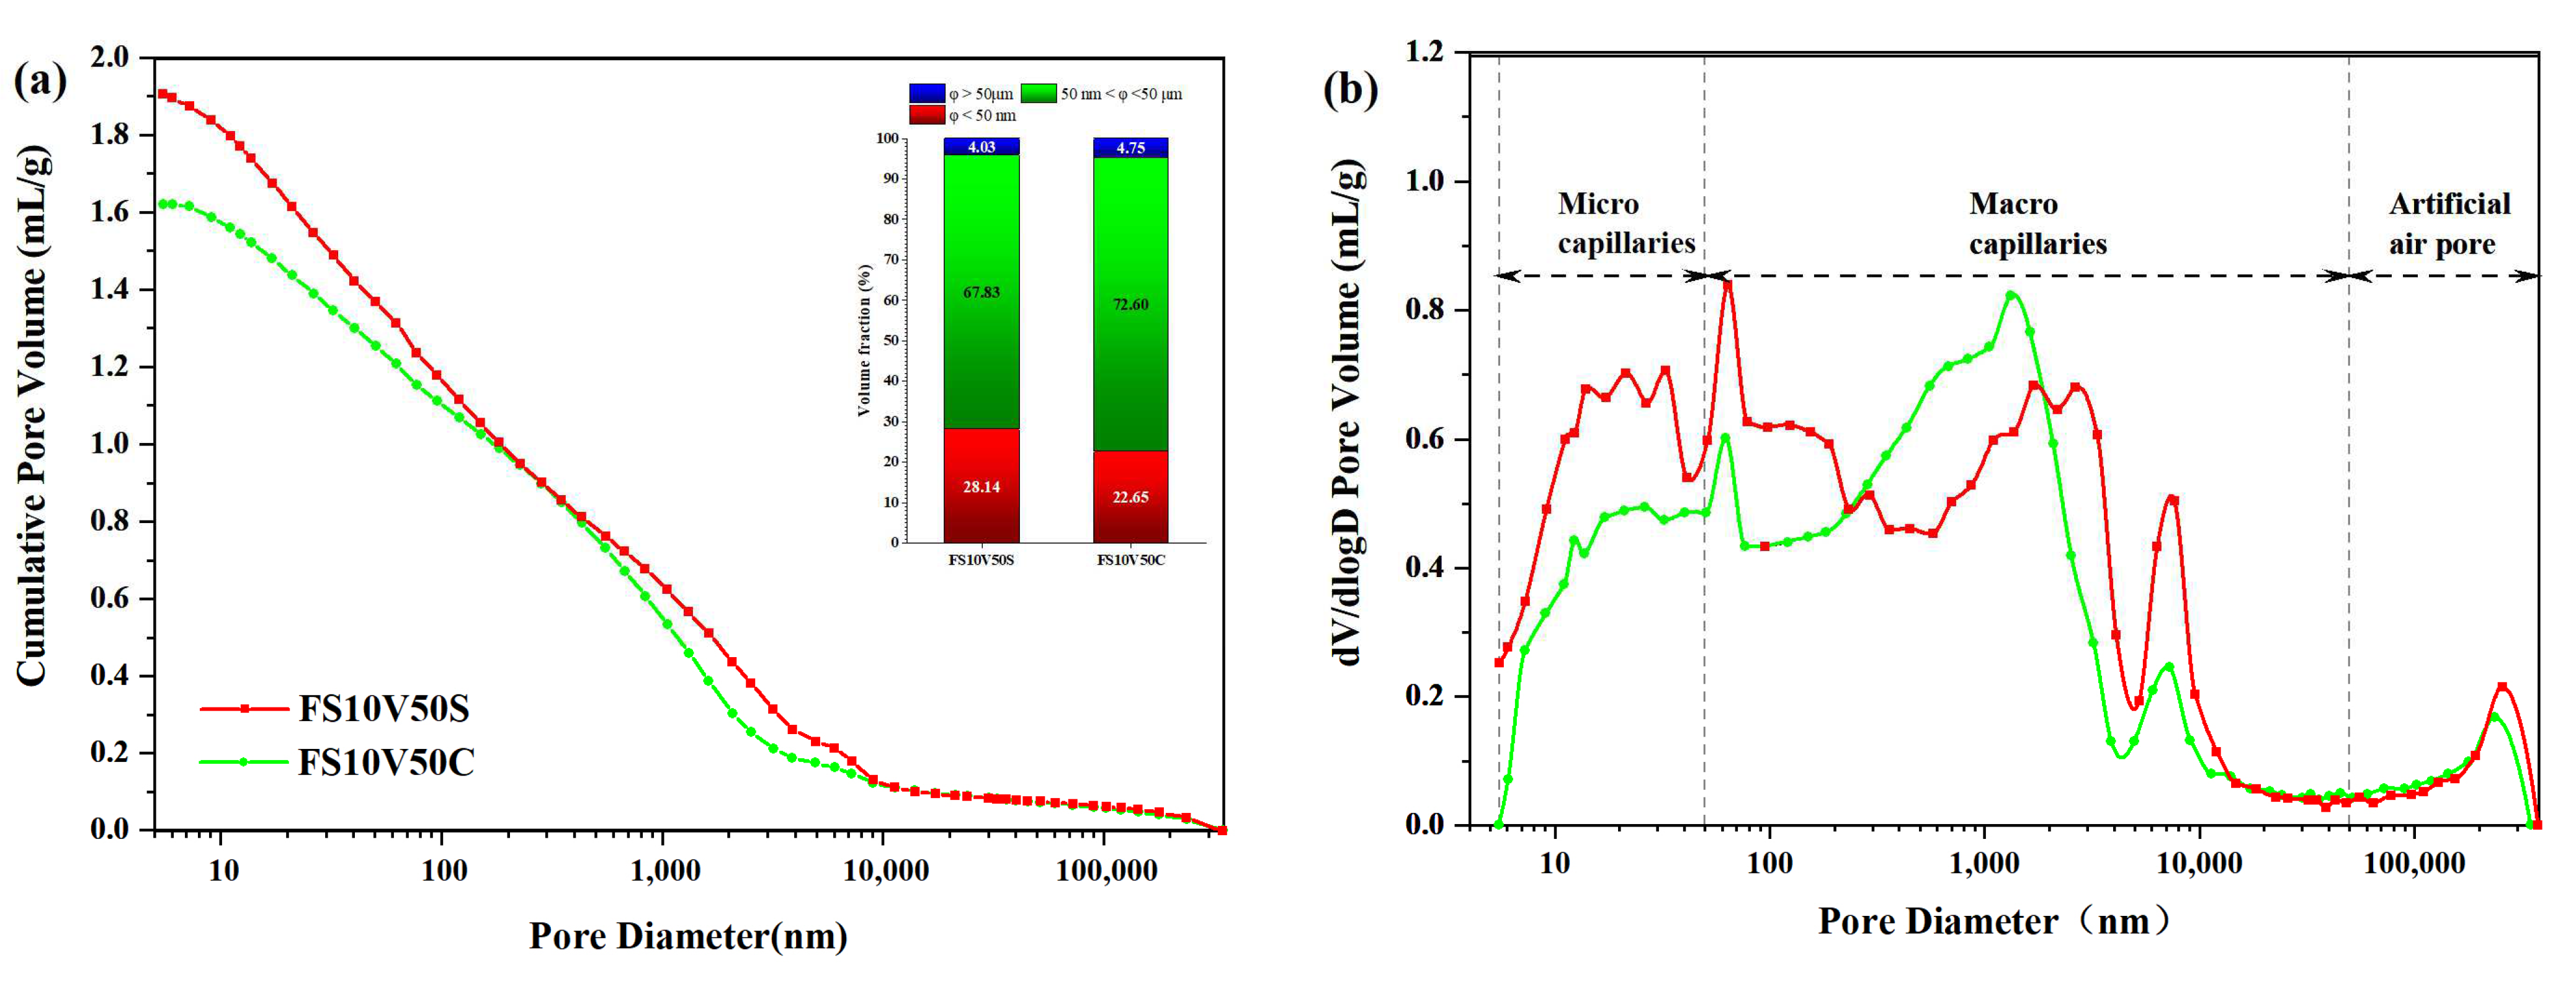
3.6.3. MIP
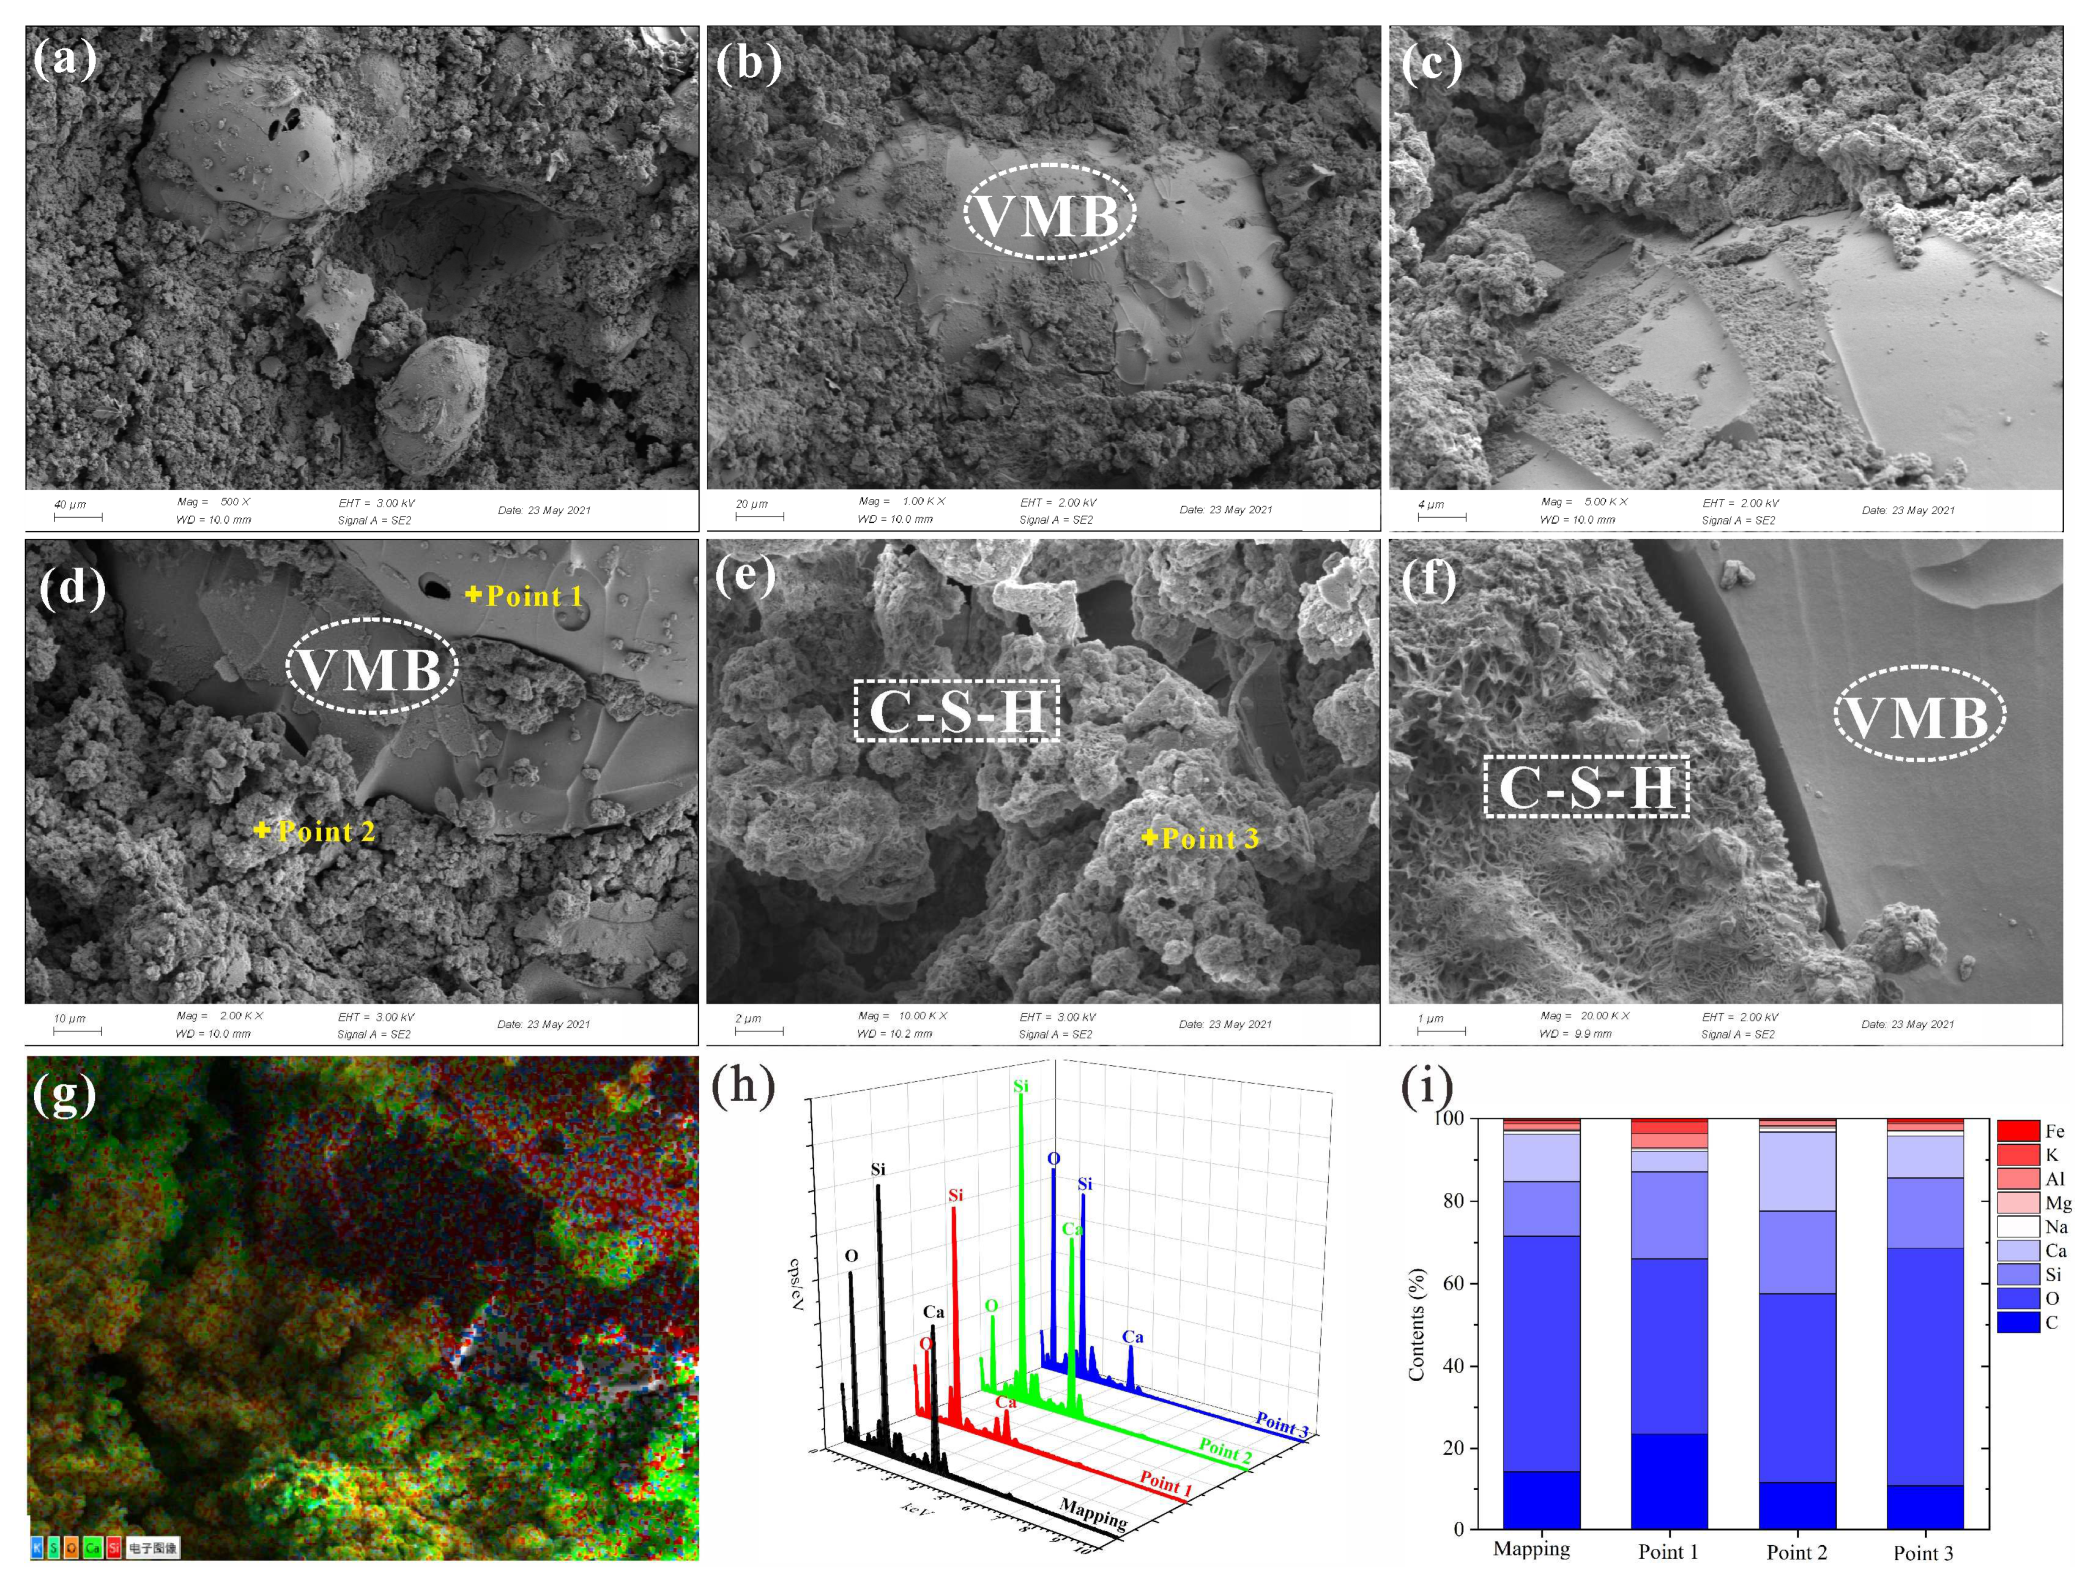
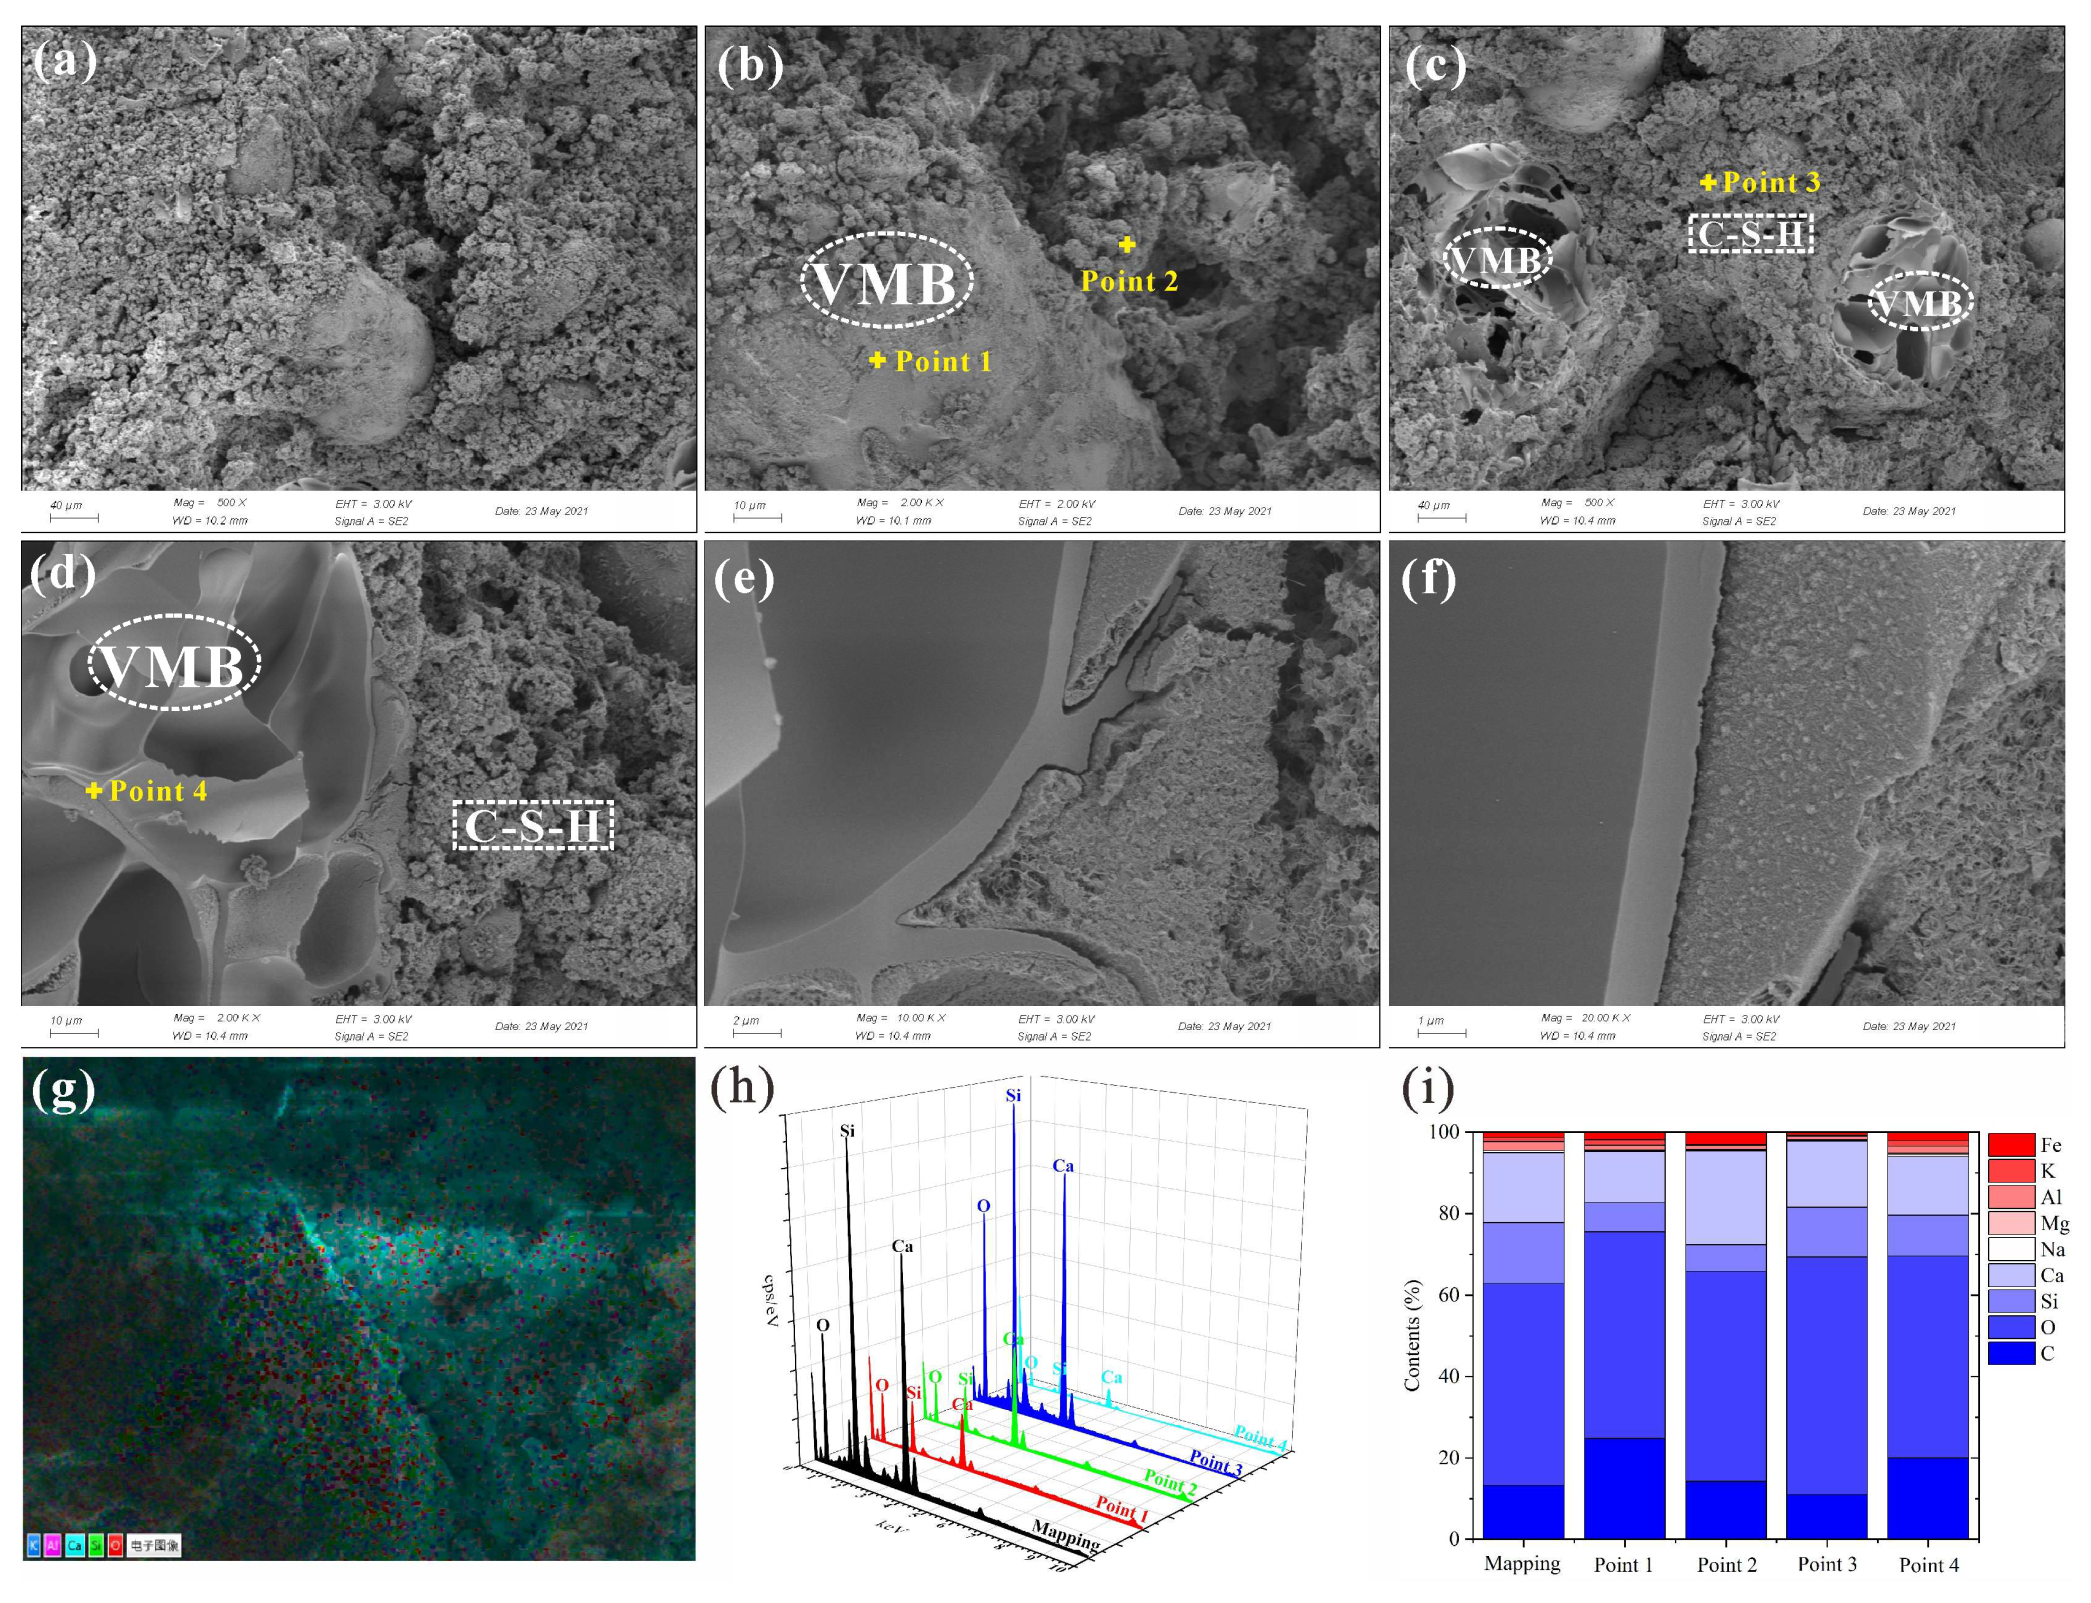
3.6.4. SEM&EDS
4. Conclusions
- (a)
- The order of influence of the three factors on the CS was insulation material > curing temperature > mass fraction, while the order of influence on the TC was mass fraction > type of insulation material > curing temperature. The impact of the mass fraction was particularly significant.
- (b)
- When the total mass fractions of VMB and FS were kept at 60%, the trend reflecting the change in TC and CS became complex. The composition of FS10V50 was chosen as the basis for improving CS, as it had the lowest TC and moderate CS. As the pozzolanic reaction of the FS consumed Ca(OH)2 and generated C–S–H gel, the CH content decreased, but the C–S–H gel content increased as the FS content increased.
- (c)
- The SR-RA could significantly improve the fluidity of FS10V50. The CS of FS10V50 increased to 5.85 MPa by adding 10% SR-RA but decreased by adding 10% Ca(OH)2. As the C–S–H gel is the main product of both the hydration and pozzolanic reactions, the matrices of both FS10V50S and FS10V50C were mainly composed of gel.
- (d)
- The chemical inertia of the VMB surface weakened the bond between the cement and VMBs, resulting in a substantial reduction in CS. The SR-RA improved the strength by promoting cement hydration without changing the chemical inertia of the VMB surface.
Author Contributions
Funding
Institutional Review Board Statement
Informed Consent Statement
Data Availability Statement
Acknowledgments
Conflicts of Interest
Appendix A

| NO. | Shear Stress (Pa) at Different Shear Rate (s−1) | |||||
|---|---|---|---|---|---|---|
| 1021.8 | 510.9 | 340.6 | 170.3 | 10.22 | 5.11 | |
| Control | 140.53 | 112.42 | 84.83 | 65.41 | 33.22 | 27.59 |
| OE1 | 94.54 | 68.99 | 61.32 | 48.55 | 30.66 | 23.00 |
| OE2 | / | 107.31 | 104.76 | 68.99 | 40.88 | 25.55 |
| OE3 | 66.43 | 58.77 | 48.55 | 38.33 | 25.55 | 17.89 |
| OE4 | / | 109.87 | 107.31 | 81.76 | 38.33 | 33.22 |
| OE5 | 68.99 | 53.66 | 51.10 | 40.88 | 27.59 | 17.89 |
| OE6 | 0.00 | 107.31 | 91.98 | 61.32 | 33.22 | 28.11 |
| OE7 | 66.43 | 53.66 | 48.55 | 40.88 | 33.22 | 25.55 |
| OE8 | 137.97 | 71.54 | 61.32 | 47.01 | 28.11 | 21.97 |
| OE9 | / | 109.87 | 104.76 | 68.99 | 35.77 | 25.55 |
References
- Zhang, K.M.; Wang, Z.Z.; Sun, J.H.; Zhou, Z.X.; Qian, S.H. Design and application of BLD series high efficient insulation steel pipe for geothermal wells. Drill. Eng. 2021, 48, 56–64. [Google Scholar] [CrossRef]
- Lin, W.J.; Liu, Z.M.; Wang, W.L.; Wang, G.L. The assessment of geothermal resources potential of China. Geol. China 2013, 40, 312–321. Available online: http://geochina.cgs.gov.cn/geochinaen/ch/reader/view_abstract.aspx?file_no=20130121&flag=1 (accessed on 1 July 2022).
- Zhang, F.Y.; Li, L.X. Study on Thermal Conductivity of Thermal Insulation Cement in Geothermal Well. Front. Earth Sci. 2022, 10, 784245. [Google Scholar] [CrossRef]
- Hamid, K.; Mehdi, A. Energy, exergy, and economic analysis of a geothermal power plant. Adv. Geo-Energy Res. 2018, 2, 190–209. [Google Scholar] [CrossRef] [Green Version]
- Ichim, A.; Teodoriu, C.; Falcone, G. Estimation of Cement Thermal Properties through the Three-phase Model with Application to Geothermal Wells. Energies 2018, 11, 2839. [Google Scholar] [CrossRef] [Green Version]
- Li, X.Y.; He, H.P.; Duan, Y.Z.; Li, Y.F. Analysis on the Thermal efficiency improvement process for geothermal well in porous sandstone. Oil Drill. Prod. Technol. 2017, 39, 484–490. [Google Scholar] [CrossRef]
- Kremieniewski, M.; Jasin´ski, B.; Zima, G.; Kut, Ł. Reduction of Fractionation of Lightweight Slurry to Geothermal Boreholes. Energies 2021, 14, 3686. [Google Scholar] [CrossRef]
- Zeng, Y.; Zhou, W.; Lamoreaux, J. Single-well circulation systems for geothermal energy transfer. Environ. Earth Sci. 2017, 76, 296. [Google Scholar] [CrossRef]
- Pang, Z.H. Wake up the sleeping energy-developing geothermal energy for carbon neutrality. Inst. Geol. Geophys. Beijing Chin. Acad. Sci. 2021. [Google Scholar]
- Song, X.; Wang, G.; Shi, Y.; Li, R.; Xu, Z.; Zheng, R.; Wang, Y.; Li, J. Numerical analysis of heat extraction performance of a deep coaxial borehole heat exchanger geothermal system. Energy 2018, 164, 1298–1310. [Google Scholar] [CrossRef]
- Song, X.Z.; Zheng, R.; Li, R.X. Study on thermal conductivity of cement with thermal conductive materials. Geothermics 2019, 81, 1–11. [Google Scholar] [CrossRef]
- Ichim, A.; Teodoriu, C.; Falcone, G. Influence of Cement Thermal Properties on Wellbore Heat Exchange. In Proceedings of the 41st Workshop on Geothermal Reservoir Engineering Stanford University, Stanford, CA, USA, 22–24 February 2016. [Google Scholar]
- Sugama, T.; Pyatina, T. Hydrophobic Lightweight Cement with Thermal Shock Resistance and Thermal Insulating Properties forEnergy-Storage Geothermal Well Systems. Materials 2021, 14, 6679. [Google Scholar] [CrossRef]
- Sliwa, T.; Ciepielowska, M. Cement Slurries with Modified Thermal Conductivity for Geothermal Applications. In Proceedings of the 47th Workshop on Geothermal Reservoir Engineering Stanford University, Stanford, CA, USA, 7–9 February 2022. SGP -TR-223. [Google Scholar]
- Lu, J.; Jiang, J.; Lu, Z.; Li, J.; Niu, Y.; Yang, Y. Pore structure and hardened properties of aerogel/cement composites based on nanosilica and surface modification. Constr. Build. Mater. 2020, 245, 118434. [Google Scholar] [CrossRef]
- Luo, Y.; Jiang, Y.; Feng, J.; Feng, J. Synthesis of white cement bonded porous fumed silica-based composite for thermal insulation with low thermal conductivity via a facile cast-in-place approach. Constr. Build. Mater. 2019, 206, 620–629. [Google Scholar] [CrossRef]
- Shakouri, S.; Bayer, Ö.; Erdoğan, S.T. Development of silica fume-based geopolymer foams. Constr. Build. Mater. 2020, 260, 120442. [Google Scholar] [CrossRef]
- Shah, S.N.; Mo, K.H.; Yap, S.P.; Radwan, M.K. Towards an energy efficient cement composite incorporating silica aerogel: A state of the art review. J. Build. Eng. 2021, 44, 103227. [Google Scholar] [CrossRef]
- Yi, L.S.; Liu, T.; Wu, Q.; Liu, M. Preparation of Porous Thermal Insulation Material with MSWI Fly Ash and Coal Ash. Min. Metall. Eng. 2021, 41, 124–127. [Google Scholar] [CrossRef]
- Kim, T.Y.; Jo, K.S.; Chu, Y.S. Characteristics of Hydration and Correlation on Cement-Based Thermal Insulation Material. J. Korean Ceram. Soc. 2019, 56, 489–496. [Google Scholar] [CrossRef] [Green Version]
- Allan, M.L.; Philippacopoulos, A.J. Literature Survey on Cements for Remediation of Deformed Casing in Geothermal Wells; U.S. Department of Energy, Office of Scientific and Technical Information: Washington, DC, USA, 1998; pp. 1–12. [CrossRef] [Green Version]
- Adjei, S.; Elkatatny, S. Overview of the lightweight oil-well cement mechanical properties for shallow wells. J. Pet. Sci. Eng. 2020, 198, 108201. [Google Scholar] [CrossRef]
- Ahmad, M.R.; Chen, B. Microstructural characterization of basalt fiber reinforced magnesium phosphate cement supplemented by silica fume. Constr. Build. Mater. 2020, 237, 117795. [Google Scholar] [CrossRef]
- Kodur, V.K.R.; Bhatt, P.P.; Naser, M.Z. High temperature properties of fiber reinforced polymers and fire insulation for fire resistance modeling of strengthened concrete structures. Compos. Part B. Eng. 2019, 175, 107104. [Google Scholar] [CrossRef]
- Sonnick, S.; Meier, M.; Ross-Jones, J.; Erlbeck, L.; Medina, I.; Nirschl, H.; Rädle, M. Correlation of pore size distribution with thermal conductivity of precipitated silica and experimental determination of the coupling effect. Appl. Therm. Eng. 2019, 150, 1037–1045. [Google Scholar] [CrossRef]
- Hu, X.X.; Qiao, X.C. Preparation of Thermal Insulation Mortar Using Coal Gasification Slag Vitrified Microspheres. Bull. Chin. Ceram. Soc. 2020, 39, 3304–3310. [Google Scholar] [CrossRef]
- Abu-Jdayil, B.; Mourad, A.H.; Hittini, W.; Hassan, M.; Hameedi, S. Traditional, state-of-the-art and renewable thermal building insulation materials: An overview. Constr. Build. Mater. 2019, 214, 709–735. [Google Scholar] [CrossRef]
- Gao, H.; Liu, H.; Liao, L.; Mei, L.; Shuai, P.; Xi, Z.; Lv, G. A novel inorganic thermal insulation material utilizing perlite tailings. Energy Build. 2019, 190, 25–33. [Google Scholar] [CrossRef]
- Schiavoni, S.; D’Alessandro, F.; Bianchi, F.; Asdrubali, F. Insulation materials for the building sector: A review and comparative analysis. Renew. Sustain. Energy Rev. 2016, 62, 988–1011. [Google Scholar] [CrossRef]
- Dabbaghi, F.; Sadeghi-Nik, A.; Libre, N.A.; Nasrollahpour, S. Characterizing fiber reinforced concrete incorporating zeolite and metakaolin as natural pozzolans. Structures 2021, 34, 2617–2627. [Google Scholar] [CrossRef]
- Bahari, A.; Sadeghi-Nik, A.; Cerro-Prada, E.; Sadeghi-Nik, A.; Roodbari, M.; Zhuge, Y. One-step random-walk process of nanoparticles in cement-based materials. J. Cent. South Univ. 2021, 28, 1679–1691. [Google Scholar] [CrossRef]
- Liu, M.; Tan, H.; He, X. Effects of nano-SiO2 on early strength and microstructure of steam-cured high volume fly ash cement system. Constr. Build. Mater. 2019, 194, 350–359. [Google Scholar] [CrossRef]
- Wang, X.S. Orthogonal Experimental Design. Shanxi Chem. Ind. 1989, 3, 53–58. [Google Scholar] [CrossRef]
- Xia, S.; Lin, R.; Cui, X.; Shan, J. The application of orthogonal test method in the parameters optimization of PEMFC under steady working condition. Int. J. Hydrog. Energy 2016, 41, 11380–11390. [Google Scholar] [CrossRef]
- Zhang, S.; Yuan, K.; Zhang, J.; Guo, J. Experimental Study on Performance Influencing Factors and Reasonable Mixture Ratio of Desert Sand Ceramsite Lightweight Aggregate Concrete. Adv. Civ. Eng. 2020, 2020, 8613932. [Google Scholar] [CrossRef] [Green Version]
- Ye, L.; Zhu, X. Analysis of cavitation orthogonal experiments in power ultrasonic honing. Adv. Mech. Eng. 2017, 9, 1687814017712947. [Google Scholar] [CrossRef]
- GB/T 19139-2012; Testing of Well Cements. General Administration of Quality Supervision, Inspection and Quarantine of the People’s Republic of China, and Standardization Administration of China: Beijing, China, 2012.
- GB/T 8077-2012; Method for Testing Uniformity of Concrete as Mixture. General Administration of Quality Supervision, Inspection and Quarantine of the People’s Republic of China, and Standardization Administration of China: Beijing, China, 2012.
- Tan, H.J.; Zheng, X.H.; Duan, C.Y.; Xia, B.R. Polylactic Acid Improves the Rheological Properties, and Promotes the Degradation of Sodium Carboxymethyl Cellulose-Modified Alkali-Activated Cement. Energies 2016, 9, 823. [Google Scholar] [CrossRef] [Green Version]
- API Recommended Practice 10B-2. Recommended Practice for Testing Well Cements; American Petroleum Institute: Washington, DC, USA, 2013. [Google Scholar]
- Abid, K.; Gholami, R.; Tiong, M.; Nagaratnam, B.; Muktadir, G. A pozzolanic supplementary material to reinforce class G cement used for drilling and completion operations. J. Pet. Sci. Eng. 2019, 177, 79–92. [Google Scholar] [CrossRef]
- Nowoświat, A.; Gołaszewski, J. Influence of the variability of calcareous fly ash properties on rheological properties of fresh mortar with its addition. Materials 2019, 12, 1942. [Google Scholar] [CrossRef] [Green Version]
- GB/T 1346-2011; Water Consumption, Setting Time and Stability of Cement Standard Consistency. General Administration of Quality Supervision, Inspection and Quarantine of the People’s Republic of China, and Standardization Administration of China: Beijing, China, 2012.
- Liu, Y.F.; Cao, Z.Q.; Wang, Y.Y.; Wang, D.J.; Liu, J.P. Experimental study of hygro-thermal characteristics of novel cement-cork mortars. Constr. Build. Mater. 2021, 271, 121901. [Google Scholar] [CrossRef]
- Jiang, D.; Lv, S.; Cui, S.; Sun, S.; Song, X.; He, S.; Zhang, J.; An, P. Effect of thermal insulation components on physical and mechanical properties of plant fibre composite thermal insulation mortar. J. Mater. Res. Technol. 2020, 9, 12996–13013. [Google Scholar] [CrossRef]
- Seabra, M.P.; Paiva, H.; Labrincha, J.A.; Ferreira, V.M. Admixtures effect on fresh state properties of aerial lime-basedmortars. Constr. Build. Mater. 2009, 23, 1147–1153. [Google Scholar] [CrossRef]
- Xu, F.; Peng, C.; Zhu, J.; Chen, J. Design and evaluation of polyester fiber and SBR latex compound-modified perlite mortar with rubber powder. Constr. Build. Mater. 2016, 127, 751–761. [Google Scholar] [CrossRef]
- Fang, Y.; Yin, X.; Cui, P.; Wang, X.; Zhuang, K.; Ding, Z.; Xing, F. Properties of magnesium potassium phosphate cement-expanded perlitecomposites applied as fire resistance coating. Constr. Build. Mater. 2021, 293, 123513. [Google Scholar] [CrossRef]
- Yoriya, S.; Intana, T.; Tepsri, P. Separation of cenospheres from lignite fly ash using acetone–water mixture. Appl. Sci. 2019, 9, 3792. [Google Scholar] [CrossRef] [Green Version]
- Danish, A.; Mosaberpanah, M.A. Formation mechanism and applications of cenospheres: A review. J. Mater. Sci. 2020, 55, 4539–4557. [Google Scholar] [CrossRef]
- Han, Z.Z.; Yang, L.T. The Study of Measurement Relationship between Range, Average Deviation and Standard Deviation. Stat. Inf. Forum 2008, 4, 5–8. [Google Scholar] [CrossRef]
- Jiang, D.; Cui, S.; Xu, F.; Tuo, T. Impact of leaf fibre modification methods on compatibility between leaf fibres and cement-based materials. Constr. Build. Mater. 2015, 94, 502–512. [Google Scholar] [CrossRef]
- Jing, Q.; Fang, L.; Liu, H.; Liu, P. Preparation of surface-vitrified micron sphere using perlite from Xinyang, China. Appl. Clay Sci. 2011, 53, 745–748. [Google Scholar] [CrossRef]
- Hanif, A.; Lu, Z.; Diao, S.; Zeng, X.; Li, Z. Properties investigation of fiber reinforced cement-based composites incorporating cenosphere fillers. Constr. Build. Mater. 2017, 140, 139–149. [Google Scholar] [CrossRef]
- Chen, W.; Huang, Z. Experimental Study of the Mechanical Properties and Microstructures of Lightweight Toughness Cement-Based Composites. Materials 2019, 12, 3891. [Google Scholar] [CrossRef] [Green Version]
- Amani, M. Cementing Challenges in Geothermal Wells. In Proceedings of the AAPG European Region, 3rd Hydrocarbon Geothermal Cross Over Technology Workshop, Geneva, Switzerland, 9–10 April 2019; Volume 25, p. 26. Available online: https://www.searchanddiscovery.com/abstracts/html/2019/geneva-90346/abstracts/2019.ER.Geneva.32.html (accessed on 1 July 2022).
- Li, Z.; Wang, Y.; Wu, Y. Nano Fumed Silica Particles on Cement Properties. IOP Conference Series: Earth and Environmental Science. IOP Publ. 2020, 525, 012149. [Google Scholar]
- Kong, D.; Su, Y.; Du, X.; Yang, Y.; Wei, S.; Shah, S.P. Influence of nano-silica agglomeration on fresh properties of cement paste. Constr. Build. Mater. 2013, 43, 557–562. [Google Scholar] [CrossRef]
- Kong, D.; Du, X.; Wei, S.; Zhang, H.; Yang, Y.; Shah, S.P. Influence of nano-silica agglomeration on microstructure and properties of the hardened cement-based materials. Constr. Build. Mater. 2012, 37, 707–715. [Google Scholar] [CrossRef]
- Cao, G.J.; Gong, J.W.; Lin, Y.; Chen, R.; Wang, L. Research on Influencing Factors of Thermal Conductivity of Cement Stone. Yellow River 2020, 42, 94–99. [Google Scholar] [CrossRef]
- Lian, T.W.; Kondo, A.; Kozawa, T.; Ohmura, T.; Tuan, W.H.; Naito, M. Effect of fumed silica properties on the thermal insulation performance of fibrous compact. Ceram. Int. 2015, 41, 9966–9971. [Google Scholar] [CrossRef]
- Demir, I.; Baspinar, M.S. Effect of silica fume and expanded perlite addition on the technical properties of the fly ash–lime–gypsum mixture. Constr. Build. Mater. 2008, 22, 1299–1304. [Google Scholar] [CrossRef]
- Zhu, N.; Jin, F.; Kong, X.; Xu, Y.; Zhou, J.; Wang, B.; Wu, H. Interface and anti-corrosion properties of sea-sand concrete with fumed silica. Constr. Build. Mater. 2018, 188, 1085–1091. [Google Scholar] [CrossRef]
- Jo, B.W.; Kim, C.H.; Tae, G.H.; Park, J.B. Characteristics of cement mortar with nano-SiO2 particles. Constr. Build. Mater. 2007, 21, 1351–1355. [Google Scholar] [CrossRef]
- Pavlík, V.; Bisaha, J. Lightweight Mortars Based on Expanded Perlite. Key Eng. Mater. 2018, 776, 104–117. [Google Scholar] [CrossRef]
- Huang, Z.H.; Li, G.; Zhu, J.; Chen, Y.F.; Zhou, H.G.; Liu, S.Y.; Tong, Z.Y.; Huang, Z.H. Study on the Influence of Nano-Silica on the Strength of Mortar; Academic Committee of National Symposium on Modern Structural Engineering, Tianjin University: Tianjin, China, 2016; pp. 1822–1825. [Google Scholar]
- Han, D.; Han, M. Effect of pre-mixed cement on the dispersion of silica fume in ternary blended cementitious paste. Mater. Res. Innov. 2015, 19 (Suppl. 5), S5-700–S5-707. [Google Scholar] [CrossRef]
- Zeng, Q.; Mao, T.; Li, H.D.; Peng, Y. Thermally insulating lightweight cement-based composites incorporating glass beads and nano-silica aerogels for sustainably energy-saving buildings. Energy Build. 2018, 174, 97–110. [Google Scholar] [CrossRef]
- Zhou, L.M. Research on Performances Optimization of Vitrified Microsphere Thermal Insulation Mortar. Master’s Thesis, Chongqing University, Chongqing, China, 2015. [Google Scholar]
- Fang, Z.P.; Huang, W. Experimental Study on compressive strength and thermal conductivity of Air Entrained Vitrified Beads Fly Ash Thermal Insulation Concrete. J. Hunan City Univ. 2020, 29, 1–5. [Google Scholar] [CrossRef]
- Liu, M. Effects and Related Mechanisms of Polycarboxylate Superplasticizers on Cement Hydration. Ph.D. Thesis, University of Technology, Wuhan, China, 2015. [Google Scholar]
- Carde, C.; François, R. Effect of the leaching of calcium hydroxide from cement paste on mechanical and physical properties. Cem. Concr. Res. 1997, 27, 539–550. [Google Scholar] [CrossRef]
- Beaudoin, J.J. Calcium hydroxide in cement matrices: Physico-mechanical and physico-chemical contributions. Calcium Hydroxide Concr. Mater. Sci. Concr. 2000, 131–142. [Google Scholar]
- Liu, H.T.; Yu, Y.J.; Liu, H.M.; Jin, J.Z.; Liu, S. Hybrid effects of nano-silica and graphene oxide on mechanical properties and hydration products of oil well cement. Constr. Build. Mater. 2018, 191, 311–319. [Google Scholar] [CrossRef]
- Sun, L. A preparation method of aerogel-expanded perlite and its application in concrete. Master’s Thesis, Taiyuan University of Technology, Taiyuan, China, 2015. [Google Scholar]
- Yaseen, S.A.; Yiseen, G.A.; Li, Z.J. Elucidation of Calcite Structure of Calcium Carbonate Formation Based on Hydrated Cement Mixed with Graphene Oxide and Reduced Graphene Oxide. ACS Omega 2019, 4, 10160–10170. [Google Scholar] [CrossRef] [Green Version]
- Han, Z.; Jin, J.; Wang, Y.; Zhang, Z.; Gu, J.; Ou, M.; Xu, X. Encapsulating TiO2 into Polyvinyl Alcohol Coated Polyacrylonitrile Composite Beads for the Effective Removal of Methylene Blue. J. Braz. Chem. Soc. 2019, 30, 211–223. [Google Scholar] [CrossRef]
- Cao, J.H.; Liu, H.L.; Pan, H.; Han, X.; Li, H.Y. Preparation and Properties of SiO2 Aerogel/Foam Cement Composites. Cem. Technol. 2020, 6, 97–102. [Google Scholar] [CrossRef]
- Putra, I.M.W.A.; Arryanto, Y.; Kartini, I. Preparation of cement-zeolite-clay composite plate and its adsorption-desorption study with respect to ethanol/water mixture. In Proceedings of the 2nd International Conference on Chemical Sciences, Yogyakarta, Indonesia, 14–16 October 2010; Available online: https://www.researchgate.net/publication/277007054 (accessed on 1 July 2022).
- Bost, P.; Regnier, M.; Horgnies, M. Comparison of the accelerating effect of various additions on the early hydration of Portland cement. Constr. Build. Mater. 2016, 113, 290–296. [Google Scholar] [CrossRef]
- Wang, L.; Li, Z.; Liu, P.; Jing, Q.S.; An, W. Preparation and properties of the insulation board made of expanded perlite filled with aerogel. Concrete 2018, 11, 106–109. [Google Scholar] [CrossRef]
- Xin, C.; Guo, F.D.; Du, J.P. Structure and surface properties of silica by gas phase method. Chem. Enterp. Manag. 2015, 12, 175. [Google Scholar] [CrossRef]
- Björnström, J.; Martinelli, A.; Matic, A.; Börjesson, L.; Panas, I. Accelerating effects of colloidal nano-silica for beneficial calcium–silicate–hydrate formation in cement. Chem. Phys. Lett. 2004, 392, 242–248. [Google Scholar] [CrossRef]
- Lin, K.L.; Chang, W.C.; Lin, D.F.; Luo, H.L.; Tsai, M.C. Effects of nano-SiO2 and different ash particle sizes on sludge ash-cement mortar. J. Environ. Manag. 2008, 88, 708–714. [Google Scholar] [CrossRef] [PubMed]
- Gao, T.; Jelle, B.P.; Gustavsen, A.; Jacobsen, S. Aerogel-incorporated concrete: An experimental study. Constr. Build. Mater. 2014, 52, 130–136. [Google Scholar] [CrossRef]
- Singh, L.P.; Goel, A.; Bhattachharyya, S.K.; Ahalawat, S.; Sharma, U.; Mishra, G. Effect of Morphology and Dispersibility of Silica Nanoparticles on the Mechanical Behaviour of Cement Mortar. Int. J. Concr. Struct. Mater. 2015, 9, 207–217. [Google Scholar] [CrossRef] [Green Version]
- Ramezani, M.; Dehghani, A.; Sherif, M.M. Carbon nanotube reinforced cementitious composites: A comprehensive review. Constr. Build. Mater. 2022, 315, 125100. [Google Scholar] [CrossRef]
- Ramezani, M. Design and predicting performance of carbon nanotube reinforced cementitious materials: Mechanical properties and dispersion characteristics. Ph.D. Thesis, University of Louisville, Louisville, KY, USA, 2019. [Google Scholar] [CrossRef] [Green Version]
- Bo, X. A special Concrete Reinforcing Agent for Commercial Mixing Station and Its Preparation Method. China Patent CN202010715482.4, 23 July 2020. [Google Scholar]
- Shinmi, T.; Kato, H.; Chabayashi, T.; Doi, H. Effect of Finely Ground Calcium Hydroxide on the Strength Development of Steam-Cured Concrete. Trans. Mater. Res. Soc. Jpn. 2007, 32, 657–660. [Google Scholar] [CrossRef]
- Dai, X.; Aydın, S.; Yardımcı, M.Y.; Lesage, K.; Schutter, G.D. Effect of Ca(OH)2 Addition on the Engineering Properties of Sodium Sulfate Activated Slag. Materials 2021, 14, 4266. [Google Scholar] [CrossRef]
- Huang, K.L.; Li, S.J.; Zang, X.H. Effects of different types of recycled fine aggregate on mechanical properties of thermal insulation concrete. Bull. Chin. Ceram. Soc. 2021, 40, 2341–2347+2379. [Google Scholar] [CrossRef]
- Fu, H.; Zhu, X.L. Study on the effect of Ca(OH)2 solution on hydraulic concrete reinforcing agent. Jiangxi Hydraul. Sci. Technol. 2018, 44, 167–170. [Google Scholar] [CrossRef]
- Esmaily, H.; Nuranian, H. Non-autoclaved high strength cellular concrete from alkali activated slag. Constr. Build Mater. 2012, 26, 200–206. [Google Scholar] [CrossRef]
- Li, D.L.; Wang, D.M.; Cui, Y. Study on pore structure and thermal conductivity of aerogel enhanced porous geopolymers. J. Therm. Anal. Calorim. 2022, 147, 1061–1070. [Google Scholar] [CrossRef]
- Chen, X.D.; Wu, S.X.; Zhou, J.K. Experimental study and analytical model for pore structure of hydrated cement paste. Appl. Clay Sci. 2014, 101, 159–167. [Google Scholar] [CrossRef]
- Frías, M.; Cabrera, J. Pore size distribution and degree of hydration of metakaolin–cement pastes. Cem. Concr. Res. 2000, 30, 561–569. [Google Scholar] [CrossRef]
- SFA. Silica Fume User’s Manual. Silica Fume Association. 2011. Available online: https://www.silicafume.org/pdf/silicafume-users-manual.pdf (accessed on 1 July 2022).
- Kadri, E.H.; Duval, R. Hydration heat kinetics of concrete with silica fume. Constr. Build. Mater. 2009, 23, 3388–3392. [Google Scholar] [CrossRef]
- Suarez, L.; Abu-Lebdeh, T.M.; Picornell, M.; Hamoush, S.A. Investigating the Role of Fly Ash and Silica Fume in the Cement Hydration Process. Am. J. Eng. Appl. Sci. 2016, 9, 134–145. [Google Scholar] [CrossRef]
- Tu, J.; Wang, Y.; Zhou, M.; Zhang, Y. Heat transfer mechanism of glazed hollow bead insulation concrete. J. Build. Eng. 2021, 40, 102629. [Google Scholar] [CrossRef]
- Ramezani, M.; Kim, Y.H.; Sun, Z. Modeling the mechanical properties of cementitious materials containing CNTs. Cem. Concr. Compos. 2019, 104, 103347. [Google Scholar] [CrossRef]
- Mousavi, M.A.; Sadeghi-Nik, A.; Bahari, A.; Jin, C.; Ahmed, R.; Ozbakkaloglu, T.; de Brito, J. Strength optimization of cementitious composites reinforced by carbon nanotubes and Titania nanoparticles. Constr. Build. Mater. 2021, 303, 124510. [Google Scholar] [CrossRef]


| TIC | Thermal insulation cement | FAC | Fly-ash cenospheres |
| FS | Fumed silica | EP | Expanded perlite |
| TC | Thermal conductivity | TIM | Thermally insulated materials |
| CS | Compressive strength | SR-RA | Reinforcing agent No. SR |
| RA | Reinforcing agent | W/C | Water to cement ratio |
| CH | Calcium hydroxide | W/S | Water to solid ratio |
| VMB | Vitrified microbubble | τ | Shear stress |
| μp | Plastic viscosity | γ | Shear rate |
| τ0 | Yield point | R | Range |
| RA | Range of factor A | RB | Range of factor B |
| RC | Range of factor C | df | Degree of freedom |
| MS | Mean square | F | Statistic inspection value |
| SS | Sum of the squared deviations from the mean | φ | Pore size |
| at% | Atomic percentage | C–S–H | Calcium Silicate Hydrate |
| C3S (%) | 2C3A + C4AF (%) | C3A (%) | Loss on Ignition (%) | W/C = 0.5, 15–30 min Slurry Consistency (BC) | 52 °C, 35.6 MPa, Thickening Time (min) |
|---|---|---|---|---|---|
| 54.2 | 18.4 | 1.9 | 1.35 | 18.6 | 103 |
| Silica (%) | Chloride Ion Content (%) | PH Value (%) | Total Alkali Content (%) | Water Content (%) |
|---|---|---|---|---|
| 65.88 | 0.26 | 9.35 | 5.45 | 0.75 |
| Bulk Density (kg/m3) | Particle Size (mm) | Porosity (%) | Specific Surface Area (m2/g) | Pore Size (nm) | TC (W/(m·K)) |
|---|---|---|---|---|---|
| 4.01 | 0.1–0.5 | >90 | 800–1000 | 20–40 | 0.018 |
| Oxide | Al2O3 | CaO | SiO2 | SO3 | Fe2O3 | Na2O | K2O | TiO2 | MnO | MgO |
|---|---|---|---|---|---|---|---|---|---|---|
| Oil well cement | 3.15 | 64.77 | 19.52 | 3.21 | 5.11 | 0.37 | 0.69 | 0.33 | 0.04 | 2.23 |
| VMB | 11.92 | 1.29 | 75.81 | 0.02 | 0.98 | 3.21 | 5.87 | 0.10 | 0.07 | 0.34 |
| FAC | 23.39 | 3.63 | 59.21 | 1.28 | 4.80 | 1.61 | 3.09 | 1.10 | 0.05 | 1.31 |
| EP | 13.54 | 1.58 | 75.84 | 0.05 | 0.67 | 2.89 | 4.84 | 0.09 | 0.04 | 0.37 |
| SR-RA | 1.56 | 3.58 | 78.22 | 9.96 | 0.90 | 3.77 | 0.74 | 0.09 | 0.02 | 0.73 |
| Factors | Curing Temperature (°C) | Type of Thermal Insulation Material | Mass Fraction of Insulation Materials (wt%) |
|---|---|---|---|
| Level 1 | 25 | VMB | 10 |
| Level 2 | 60 | EP | 20 |
| Level 3 | 90 | FAC | 30 |
| No. | Factors | |||
|---|---|---|---|---|
| Curing and Testing Temperature (°C) | Type of TIM | Mass Fraction of Insulation Materials (wt%) | Blank Column | |
| (Factor A) | (Factor B) | (Factor C) | ||
| OE1 | 25 (1) | VMB (1) | 10 (1) | 1 |
| OE2 | 25 (1) | EP (2) | 20 (2) | 2 |
| OE3 | 25 (1) | FAC (3) | 30 (3) | 3 |
| OE4 | 60 (2) | EP (2) | 10 (1) | 3 |
| OE5 | 60 (2) | FAC (3) | 20 (2) | 1 |
| OE6 | 60 (2) | VMB (1) | 30 (3) | 2 |
| OE7 | 90 (3) | FAC (3) | 10 (1) | 2 |
| OE8 | 90 (3) | VMB (1) | 20 (2) | 3 |
| OE9 | 90 (3) | EP (2) | 30 (3) | 1 |
| No. | Cement (g) | VMB (g) | EP (g) | FAC (g) | W/S Ratio |
|---|---|---|---|---|---|
| OE1 | 90 | 10 | 0 | 0 | 0.50 |
| OE2 | 80 | 0 | 20 | 0 | 0.50 |
| OE3 | 70 | 0 | 0 | 30 | 0.50 |
| OE4 | 90 | 0 | 10 | 0 | 0.50 |
| OE5 | 80 | 0 | 0 | 20 | 0.50 |
| OE6 | 70 | 0 | 30 | 0 | 0.50 |
| OE7 | 90 | 0 | 0 | 10 | 0.50 |
| OE8 | 80 | 20 | 0 | 0 | 0.50 |
| OE9 | 70 | 0 | 30 | 0 | 0.50 |
| No. | Factor A | Factor B | Factor C | Plastic Viscosity (mPa·s) | Yield Stress (Pa) | Fluidity (cm) | Density (g/cm3) | CS (MPa) | TC (W/(m·K)) |
|---|---|---|---|---|---|---|---|---|---|
| control | / | / | / | 110.68 | 39.35 | 16.2 | 1.84 | / | / |
| OE1 | 25 (1) | VMB (1) | 10 (1) | 66.15 | 31.81 | 17.5 | 1.61 | 17.47 | 0.6622 |
| OE2 | 25 (1) | EP (2) | 20 (2) | 160.83 | 36.14 | 10.3 | 1.52 | 9.57 | 0.5443 |
| OE3 | 25 (1) | FAC (3) | 30 (3) | 45.23 | 27.06 | 16.5 | 1.52 | 9.9 | 0.4972 |
| OE4 | 60 (2) | EP (2) | 10 (1) | 158.71 | 41.17 | 12.7 | 1.63 | 18.25 | 0.6686 |
| OE5 | 60 (2) | FAC (3) | 20 (2) | 44.89 | 27.94 | 17.3 | 1.59 | 16.83 | 0.5371 |
| OE6 | 60 (2) | VMB (1) | 30 (3) | 158.62 | 31.48 | 13.5 | 1.38 | 28.94 | 0.5435 |
| OE7 | 90 (3) | FAC (3) | 10 (1) | 36.57 | 32.16 | 18.2 | 1.72 | 21.69 | 0.6699 |
| OE8 | 90 (3) | VMB (1) | 20 (2) | 108.33 | 24.15 | 15.5 | 1.48 | 32.55 | 0.5853 |
| OE9 | 90 (3) | EP (2) | 30 (3) | 170.17 | 33.69 | 8.5 | 1.43 | 12.53 | 0.5176 |
| Performance Index | Source of Range | Ki1 | Ki2 | Ki3 | ki1 | ki2 | ki3 | Ri |
|---|---|---|---|---|---|---|---|---|
| CS | (Factor A) | 36.93 | 64.01 | 66.76 | 12.31 | 21.34 | 22.25 | 9.94 |
| (Factor B) | 78.95 | 40.34 | 48.41 | 26.32 | 13.45 | 16.14 | 12.86 | |
| (Factor C) | 57.39 | 58.94 | 51.37 | 19.13 | 19.65 | 17.12 | 2.52 | |
| TC | (Factor A) | 1.70 | 1.74 | 1.77 | 0.57 | 0.58 | 0.59 | 0.023 |
| (Factor B) | 1.70 | 1.73 | 1.70 | 0.57 | 0.58 | 0.57 | 0.028 | |
| (Factor C) | 2.00 | 1.66 | 1.55 | 0.67 | 0.55 | 0.52 | 0.11 |
| Performance Index | Source of Variation | SS | df | MS | F | Level of Significance |
|---|---|---|---|---|---|---|
| CS | Factor (A) | 181.191 | 2 | 90.595 | 4.391 | 0.185 (non-significant) |
| Factor (B) | 276.505 | 2 | 138.253 | 6.701 | 0.130 (non-significant) | |
| Factor (C) | 10.701 | 2 | 5.351 | 0.259 | 0.794 (non-significant) | |
| Error | 41.265 | 2 | 20.632 | / | / | |
| Total | 3635.590 | 8 | / | / | / | |
| R2 = 0.919 (Adjusted R2 = 0.676) | ||||||
| TC | Factor (A) | 0.001 | 2 | 0.000 | 2.572 | 0.280 (non-significant) |
| Factor (B) | 0.001 | 2 | 0.001 | 4.130 | 0.195 (non-significant) | |
| Factor (C) | 0.035 | 2 | 0.018 | 110.855 | 0.009 (significant) | |
| Error | 0.000 | 2 | 0.000 | / | / | |
| Total | 3.072 | 8 | / | / | / | |
| R2 = 0.992 (Adjusted R2 = 0.966) | ||||||
| NO. | Cement | FS | VMB | W/S Ratio | Curing and Test Temperature (°C) |
|---|---|---|---|---|---|
| control | 100 | 0 | 0 | 0.50 | 90 |
| FS30V30 | 40 | 30 | 30 | 2.57 | 90 |
| FS20V40 | 40 | 20 | 30 | 2.11 | 90 |
| FS10V50 | 40 | 10 | 50 | 1.52 | 90 |
| No. | CS (MPa) | TC (W/(m·K)) | Slurry Density (g/cm3) | Fluidity (cm) | Initial Setting Time (min) | Final Setting Time (min) |
|---|---|---|---|---|---|---|
| control | 34.7 | 0.7265 | 1.84 | 16.2 | 147 | 185 |
| FS30V30 | 2.03 | 0.2373 | 1.10 | 6.0 | 40 | 49 |
| FS20V40 | 5.40 | 0.2906 | 1.08 | 6.0 | 45 | 80 |
| FS10V50 | 3.50 | 0.1836 | 1.01 | 8.0 | 111 | 128 |
| No. | Temperature (°C) | Additive Type | Dosage (%) | CS (MPa) | TC (W/(m·K)) | Density (g/cm3) | Fluidity (cm) | Initial Setting Time (min) | Final Setting Time (min) |
|---|---|---|---|---|---|---|---|---|---|
| FS10V50 | 90 | / | 0 | 3.50 | 0.1836 | 1.04 | 8.0 | 111 | 128 |
| FS10V50S | 90 | SR-RA | 10 | 5.85 | 0.1905 | 1.00 | 14.2 | 89 | 110 |
| FS10V50C | 90 | CH | 10 | 1.76 | 0.2247 | 1.07 | 10.1 | 65 | 73 |
| No. | Porosity (%) | Bulk Density (g/mL) | Median Pore Radius (V/nm) | Median Pore Radius (A/nm) | Total Pore Volume (mL/g) | Total Pore Area (m2/g) |
|---|---|---|---|---|---|---|
| FS10V50C | 75.8 | 0.46 | 412.3 | 16.9 | 1.61 | 100.0 |
| FS10V50S | 78.4 | 0.41 | 224.2 | 14.6 | 1.90 | 154.5 |
Publisher’s Note: MDPI stays neutral with regard to jurisdictional claims in published maps and institutional affiliations. |
© 2022 by the authors. Licensee MDPI, Basel, Switzerland. This article is an open access article distributed under the terms and conditions of the Creative Commons Attribution (CC BY) license (https://creativecommons.org/licenses/by/4.0/).
Share and Cite
Shen, L.; Tan, H.; Ye, Y.; He, W. Using Fumed Silica to Develop Thermal Insulation Cement for Medium–Low Temperature Geothermal Wells. Materials 2022, 15, 5087. https://doi.org/10.3390/ma15145087
Shen L, Tan H, Ye Y, He W. Using Fumed Silica to Develop Thermal Insulation Cement for Medium–Low Temperature Geothermal Wells. Materials. 2022; 15(14):5087. https://doi.org/10.3390/ma15145087
Chicago/Turabian StyleShen, Lan, Huijing Tan, You Ye, and Wei He. 2022. "Using Fumed Silica to Develop Thermal Insulation Cement for Medium–Low Temperature Geothermal Wells" Materials 15, no. 14: 5087. https://doi.org/10.3390/ma15145087