
Effect of Basalt Powder on Hydration, Rheology, and Strength Development of Cement Paste
Abstract
:1. Introduction
2. Materials and Methods
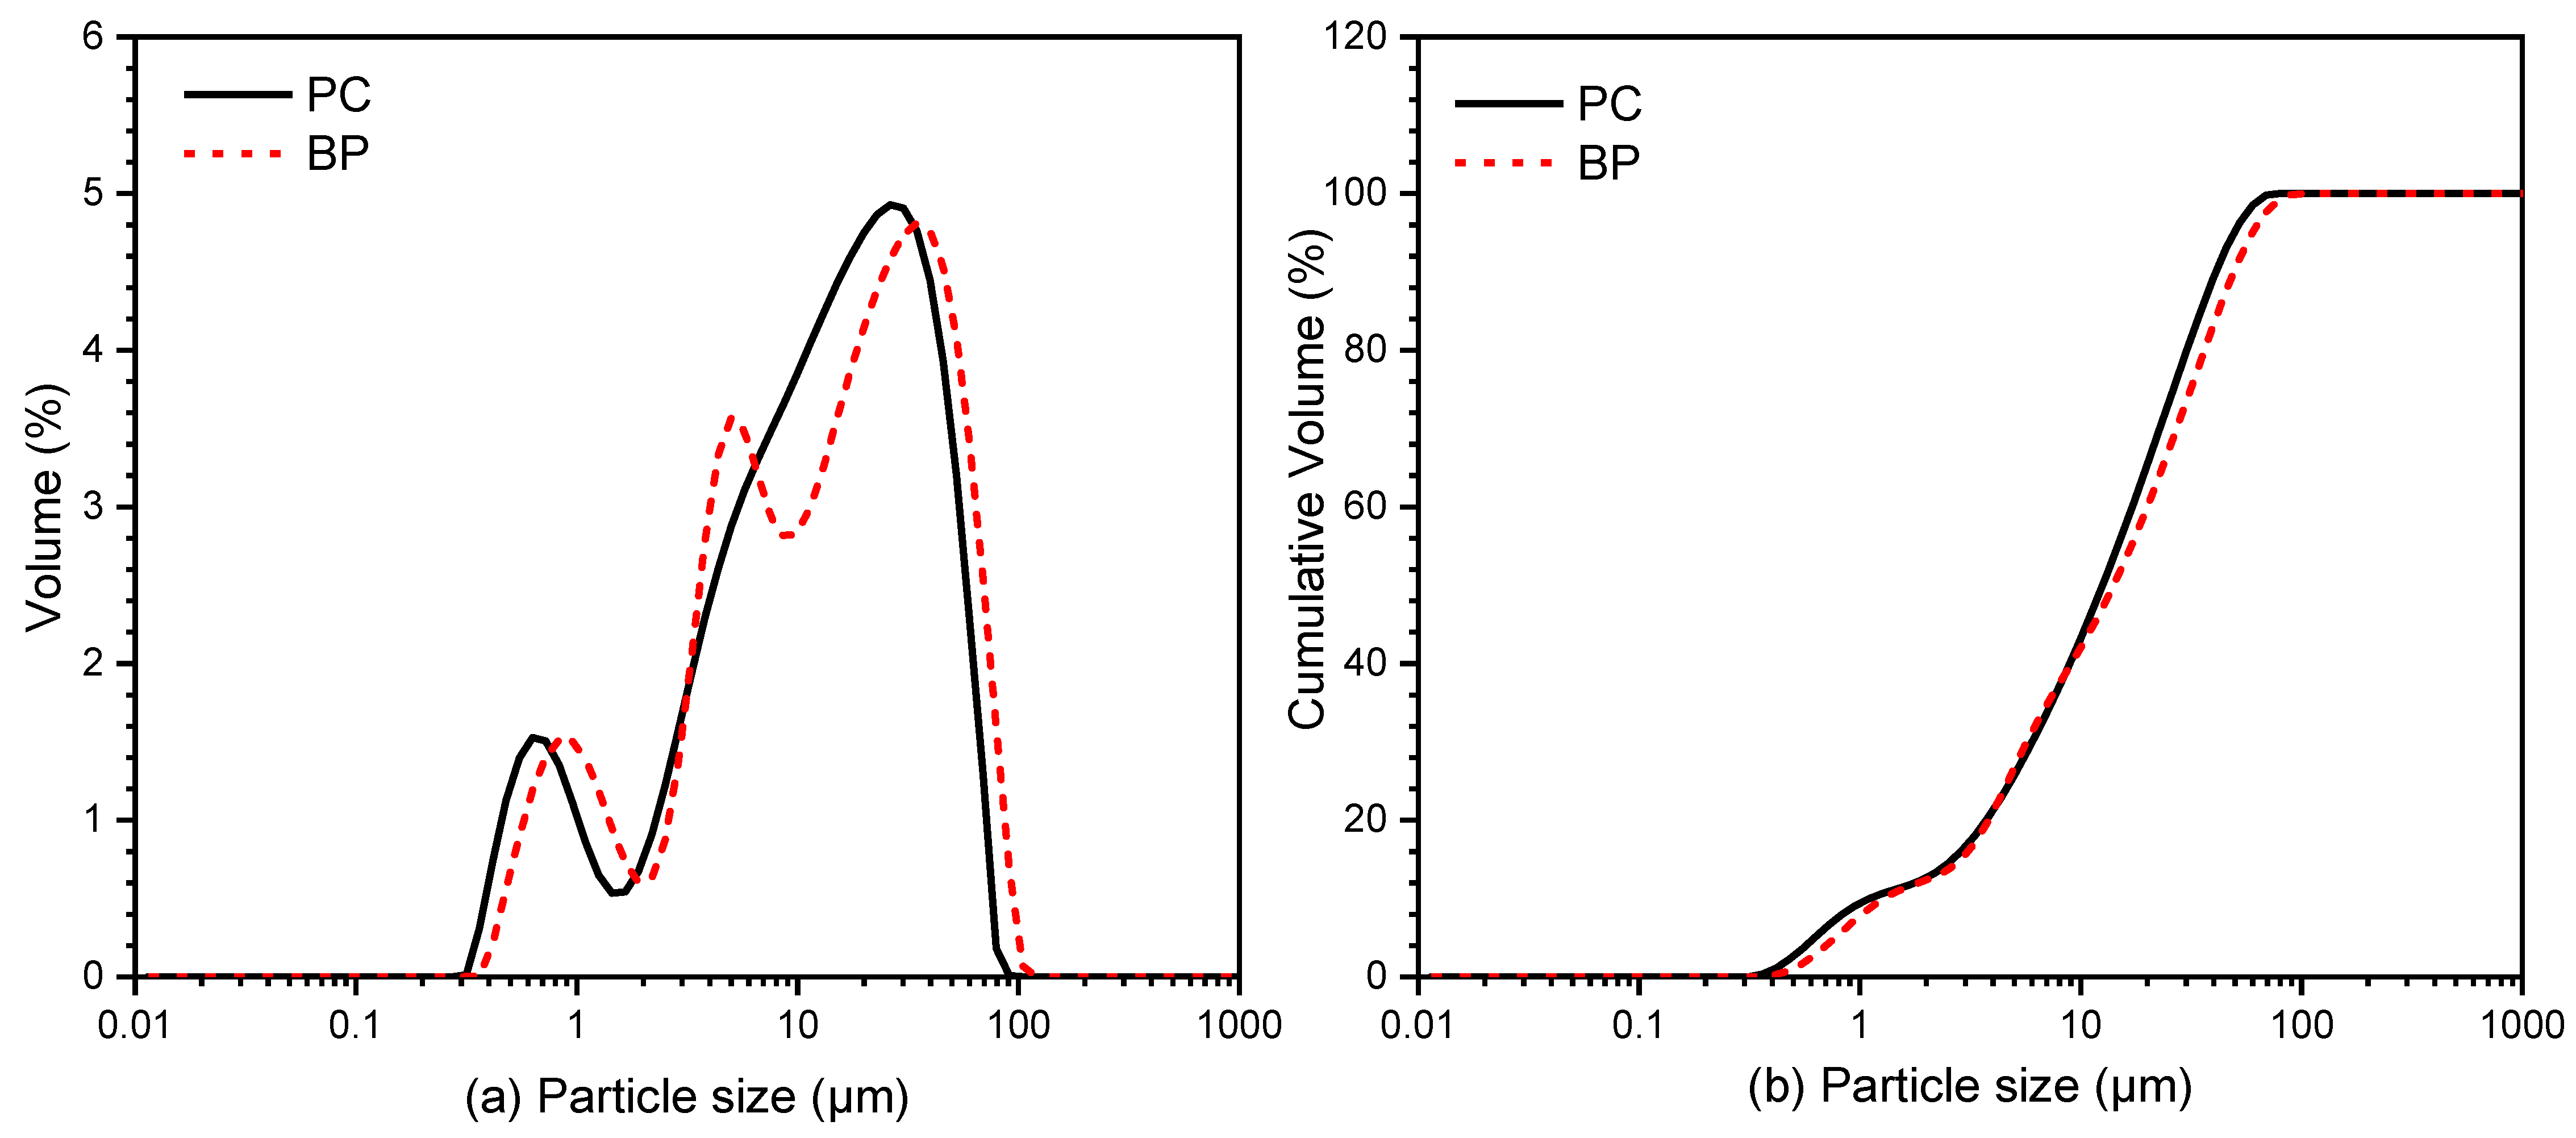
2.1. Materials and Mixture
2.2. Zeta Potential Test
2.3. Mechanical Performance
2.4. SEM Analysis
- (1)
- Hydration product analysis. In this test, BP paste was placed in the curing room after preparation. About 1 g of paste was taken out in 15 min, 1, 4, and 7 h, respectively. These pastes were then immersed in absolute ethanol for hydration cessation. Afterward, these samples were filtered out and desiccated in a drying oven. The arid particles were used to analyze the formation of early hydration products on their surface.
- (2)
- Fracture characteristics. The specimens at each curing age were loaded for 5 s under the compressive stress of 80% peak load. The loaded sample was cut into small test blocks with a side length of about 20 mm and immersed in absolute ethanol for more than 24 h to stop hydration. Then the test block was soaked in epoxy resin. The grinding and polishing steps of the sample were carried out after the epoxy resin had hardened. Afterward, the crack propagation of the sample was observed using SEM.
- (3)
- Fracture surface analysis. The crushed pieces after the strength test were collected and halted hydration using absolute ethanol to observe the fracture morphology.
2.5. X-ray Diffraction Analysis (XRD)
2.6. Thermogravimetric Analysis (TGA)
2.7. Rheological Measurement
3. Results and Discussion
3.1. Surface Chemical Properties Analysis
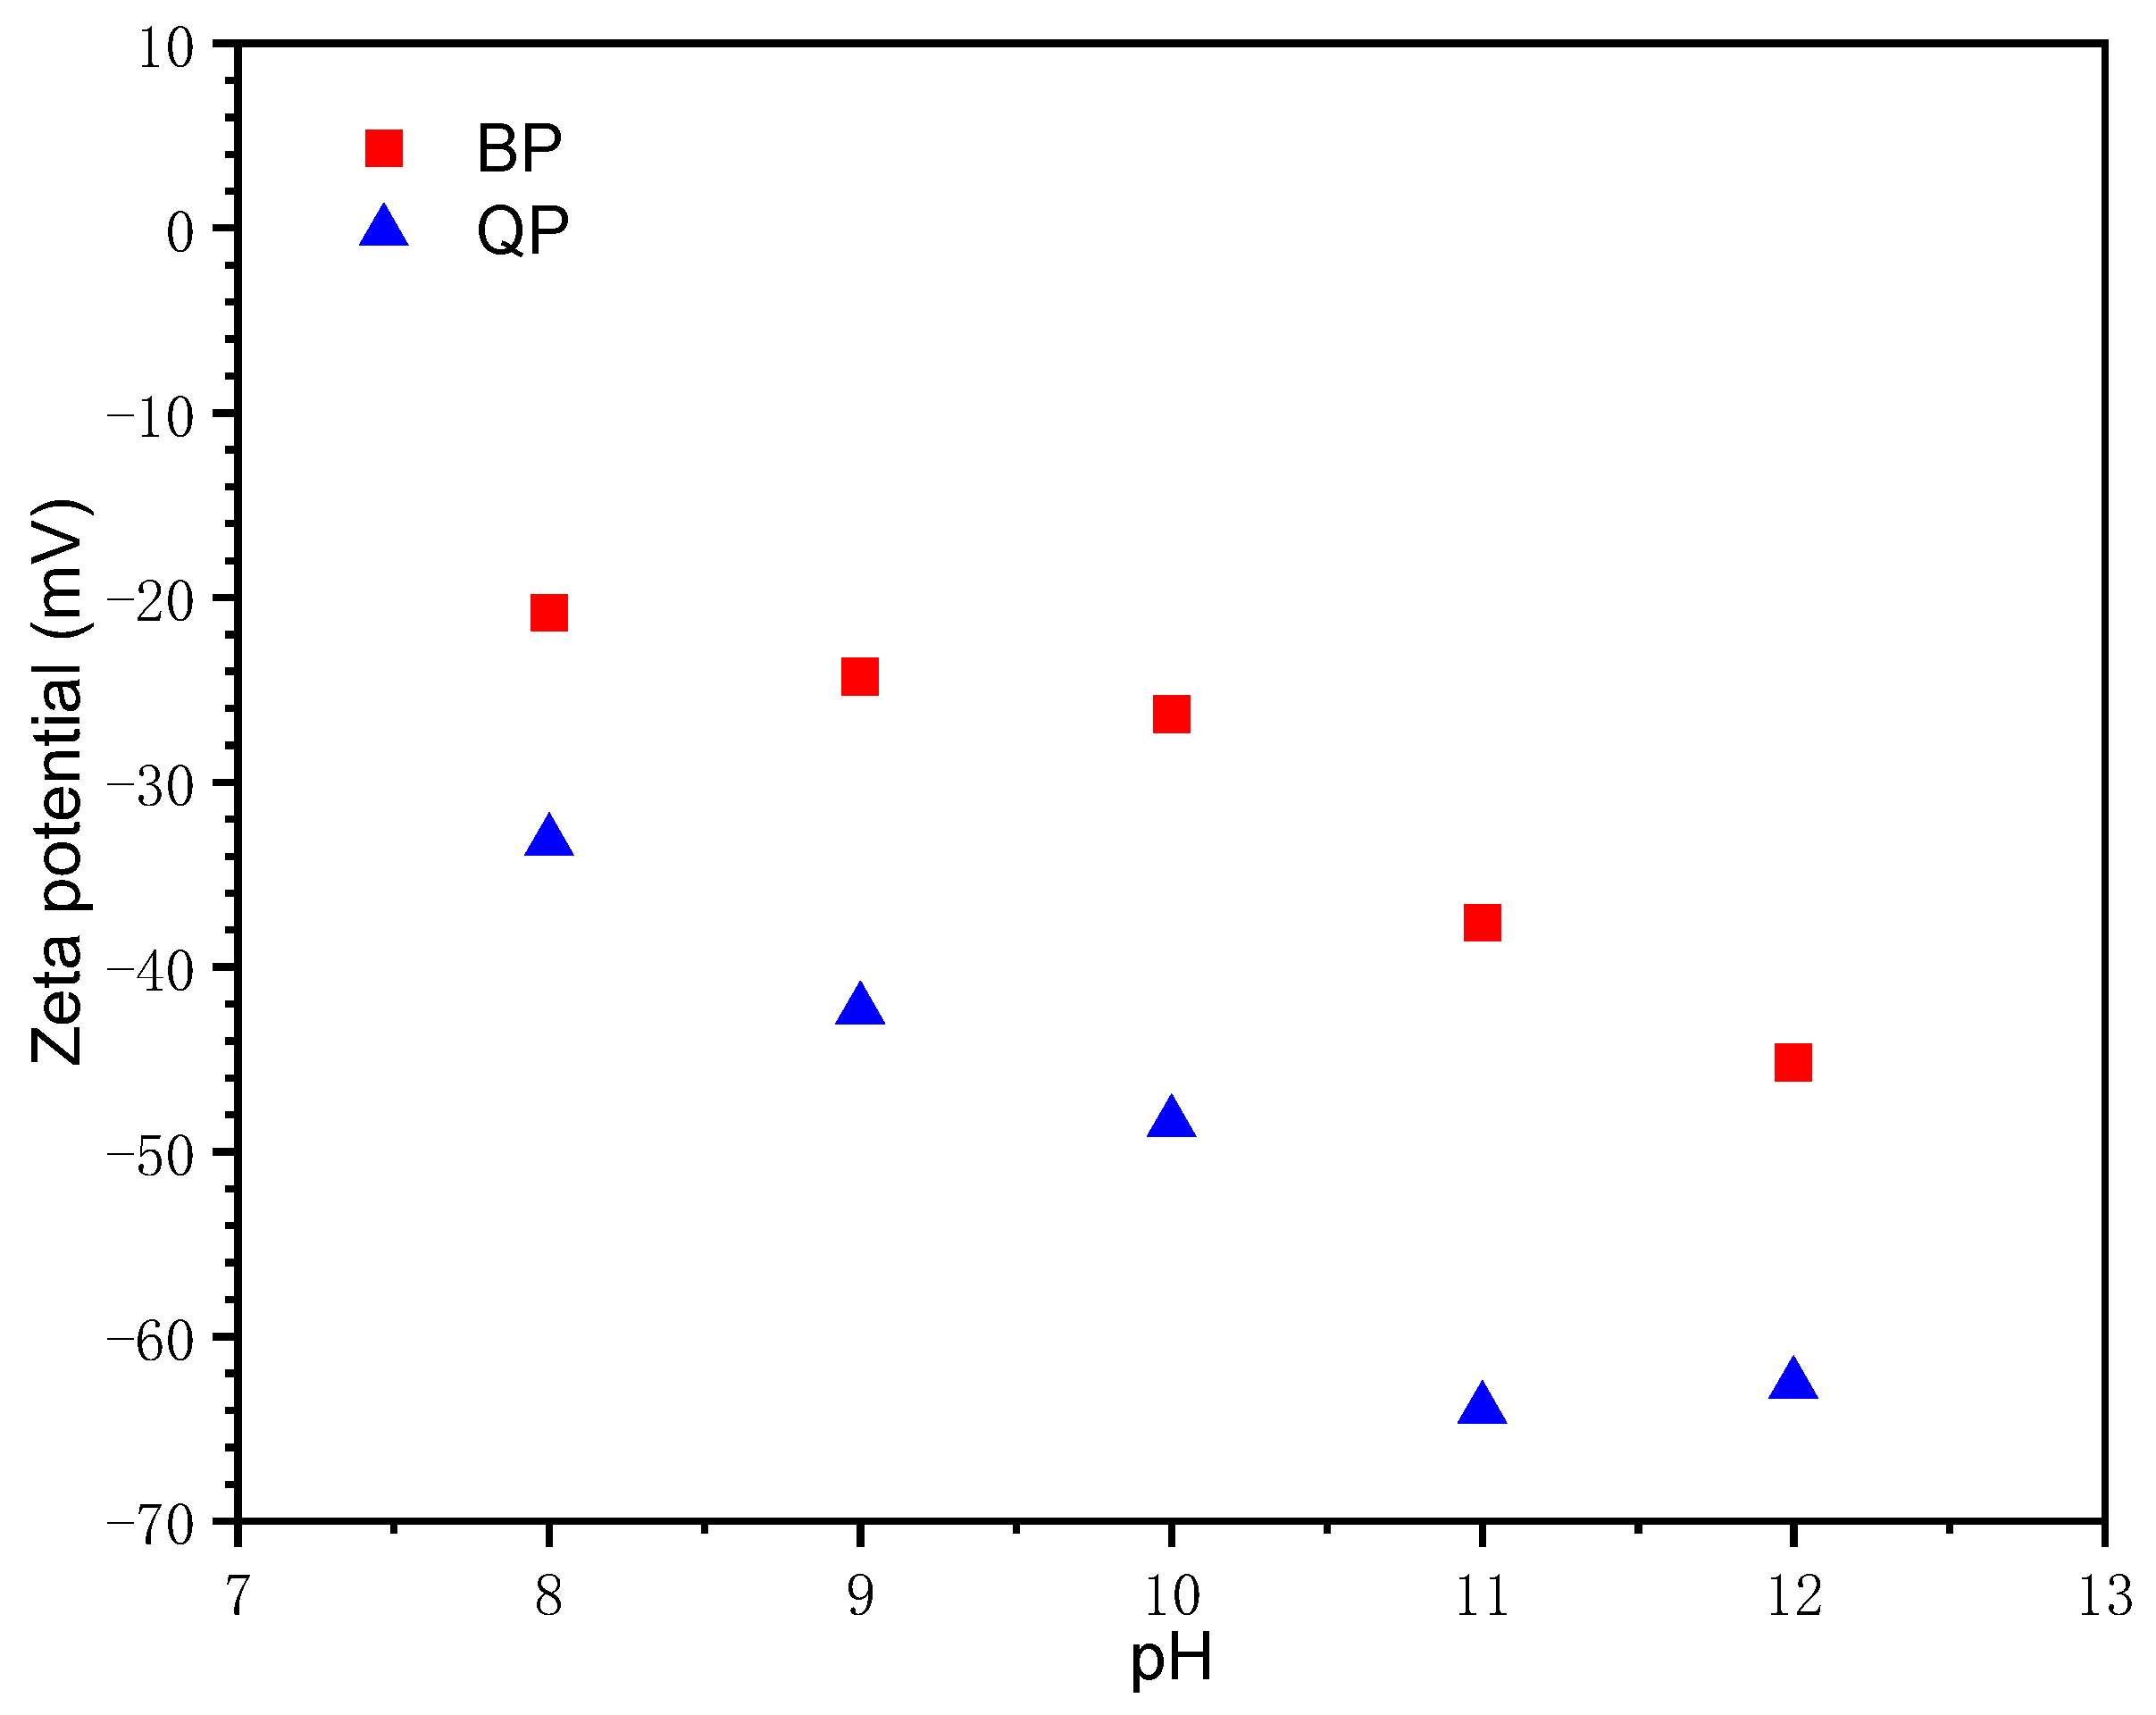
3.1.1. Effect of pH
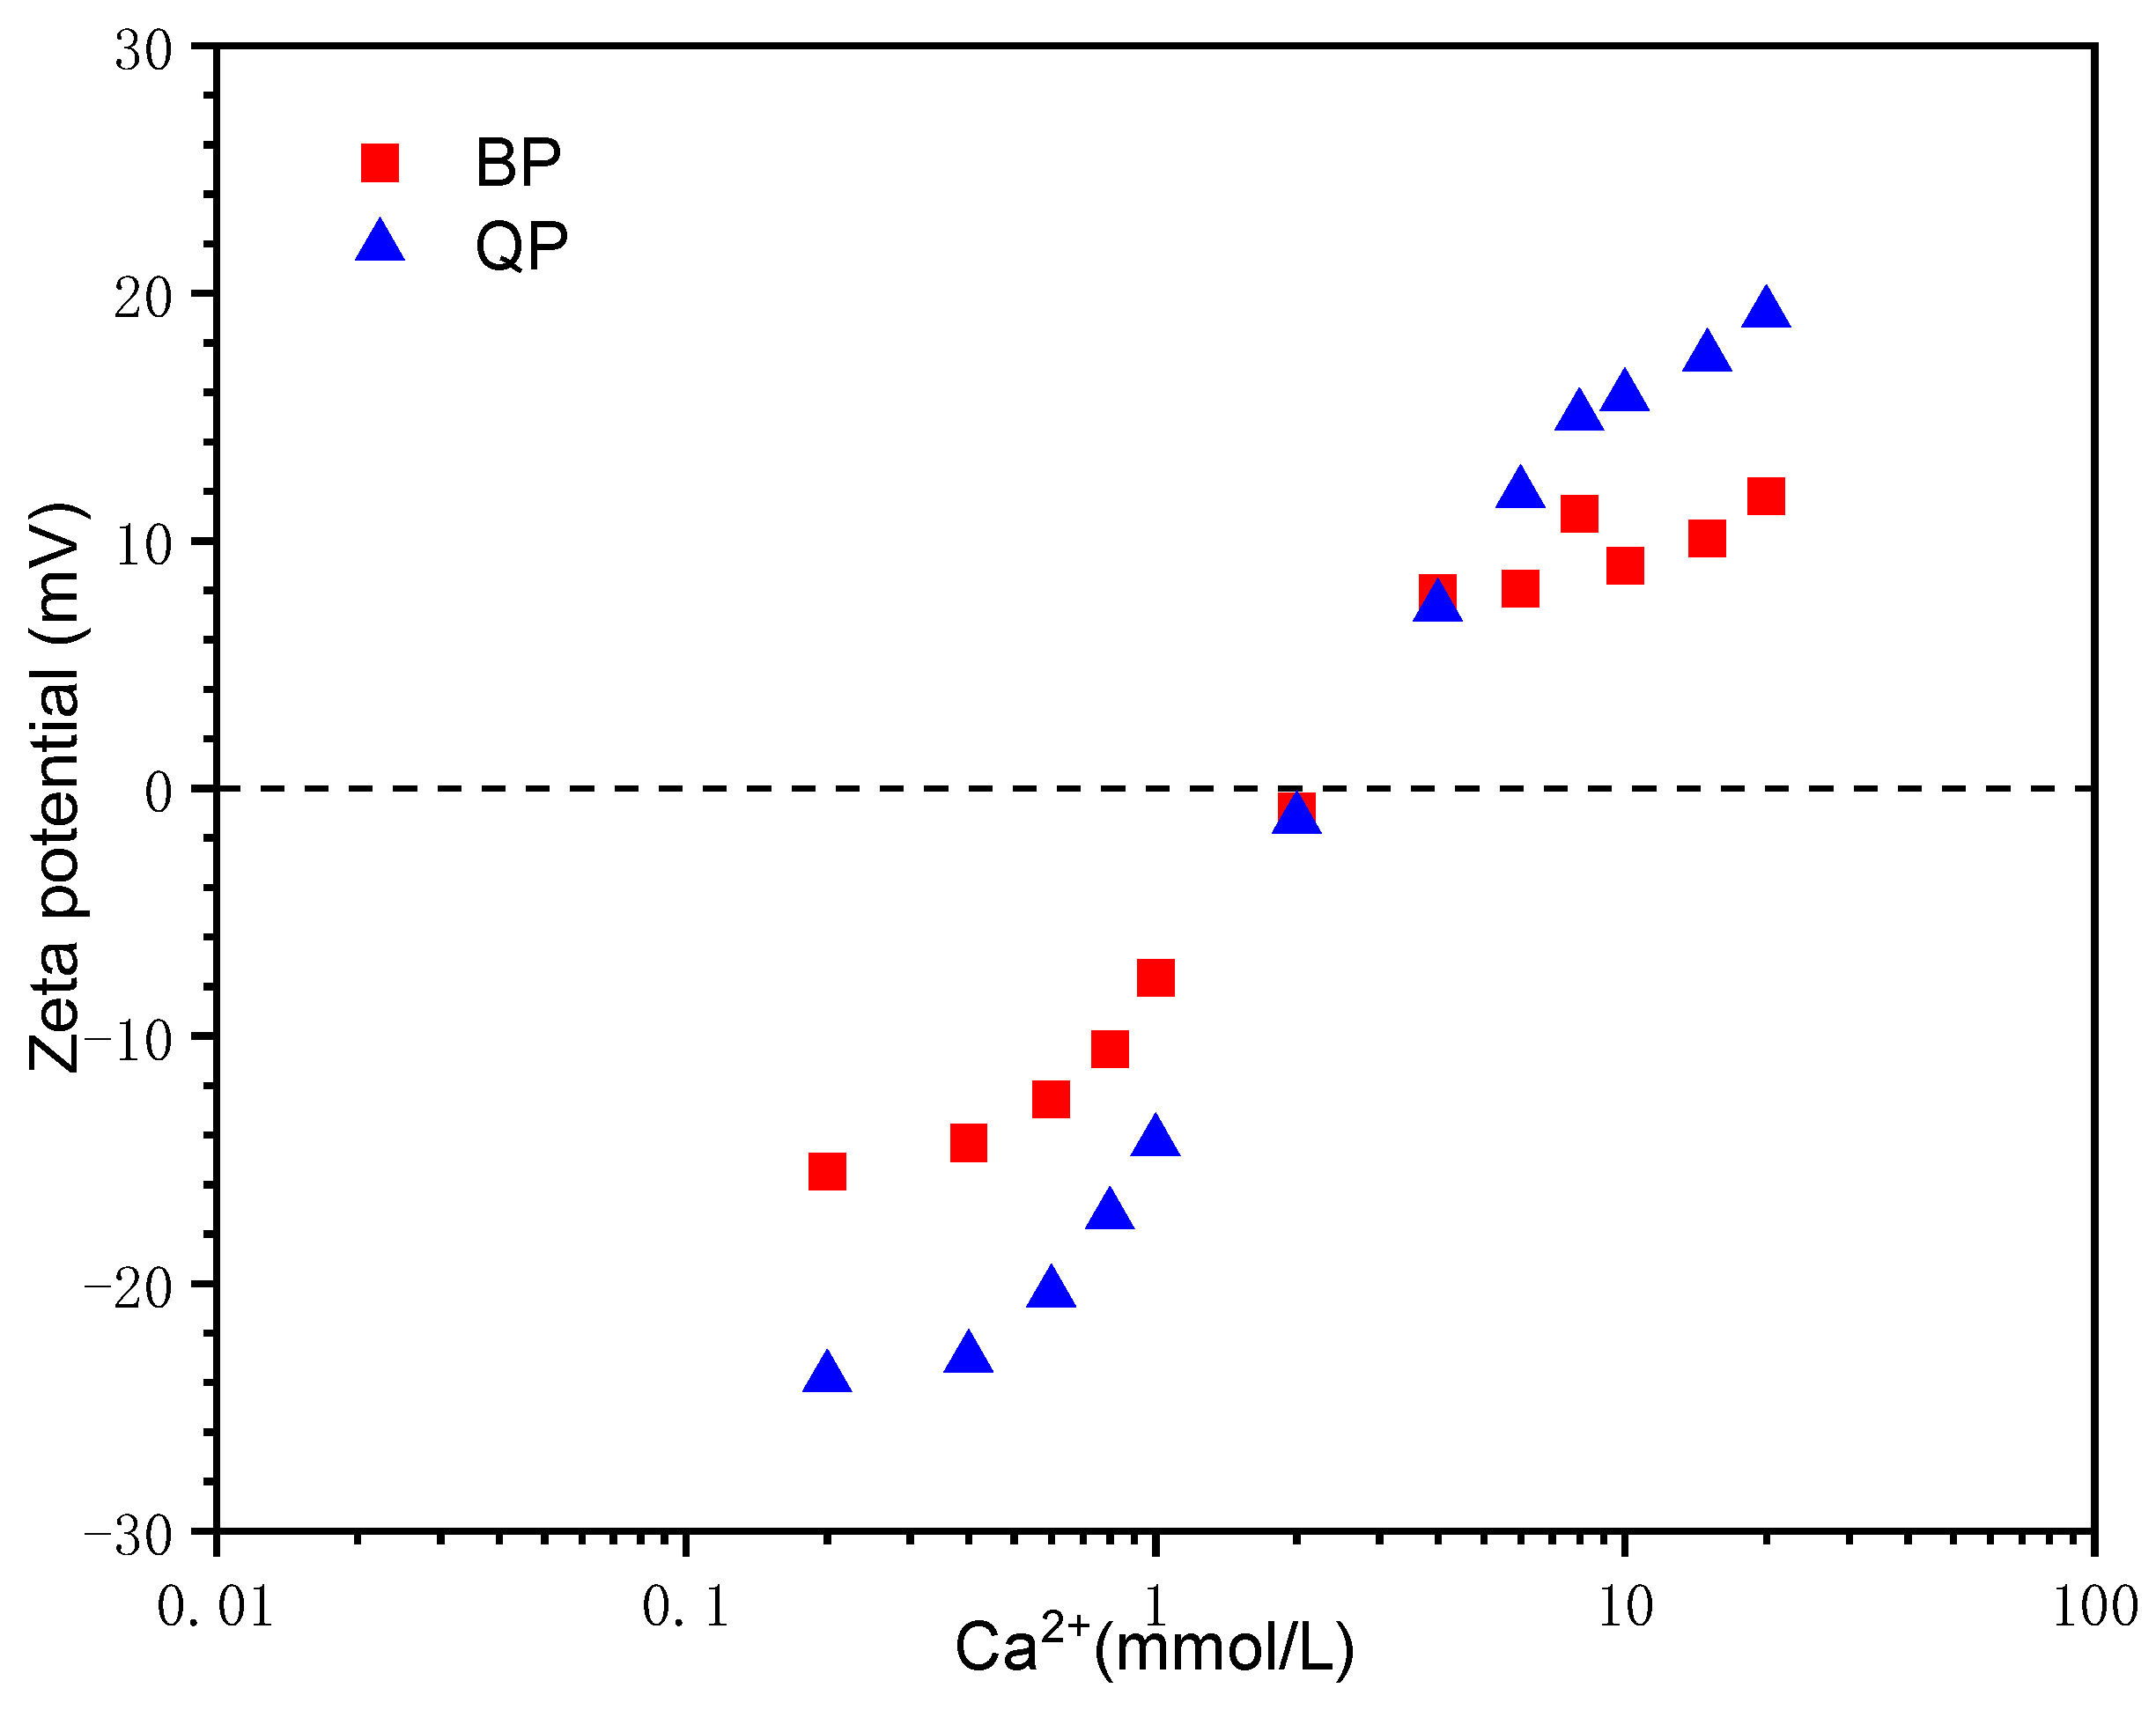
3.1.2. Effect of Ca2+ Concentration
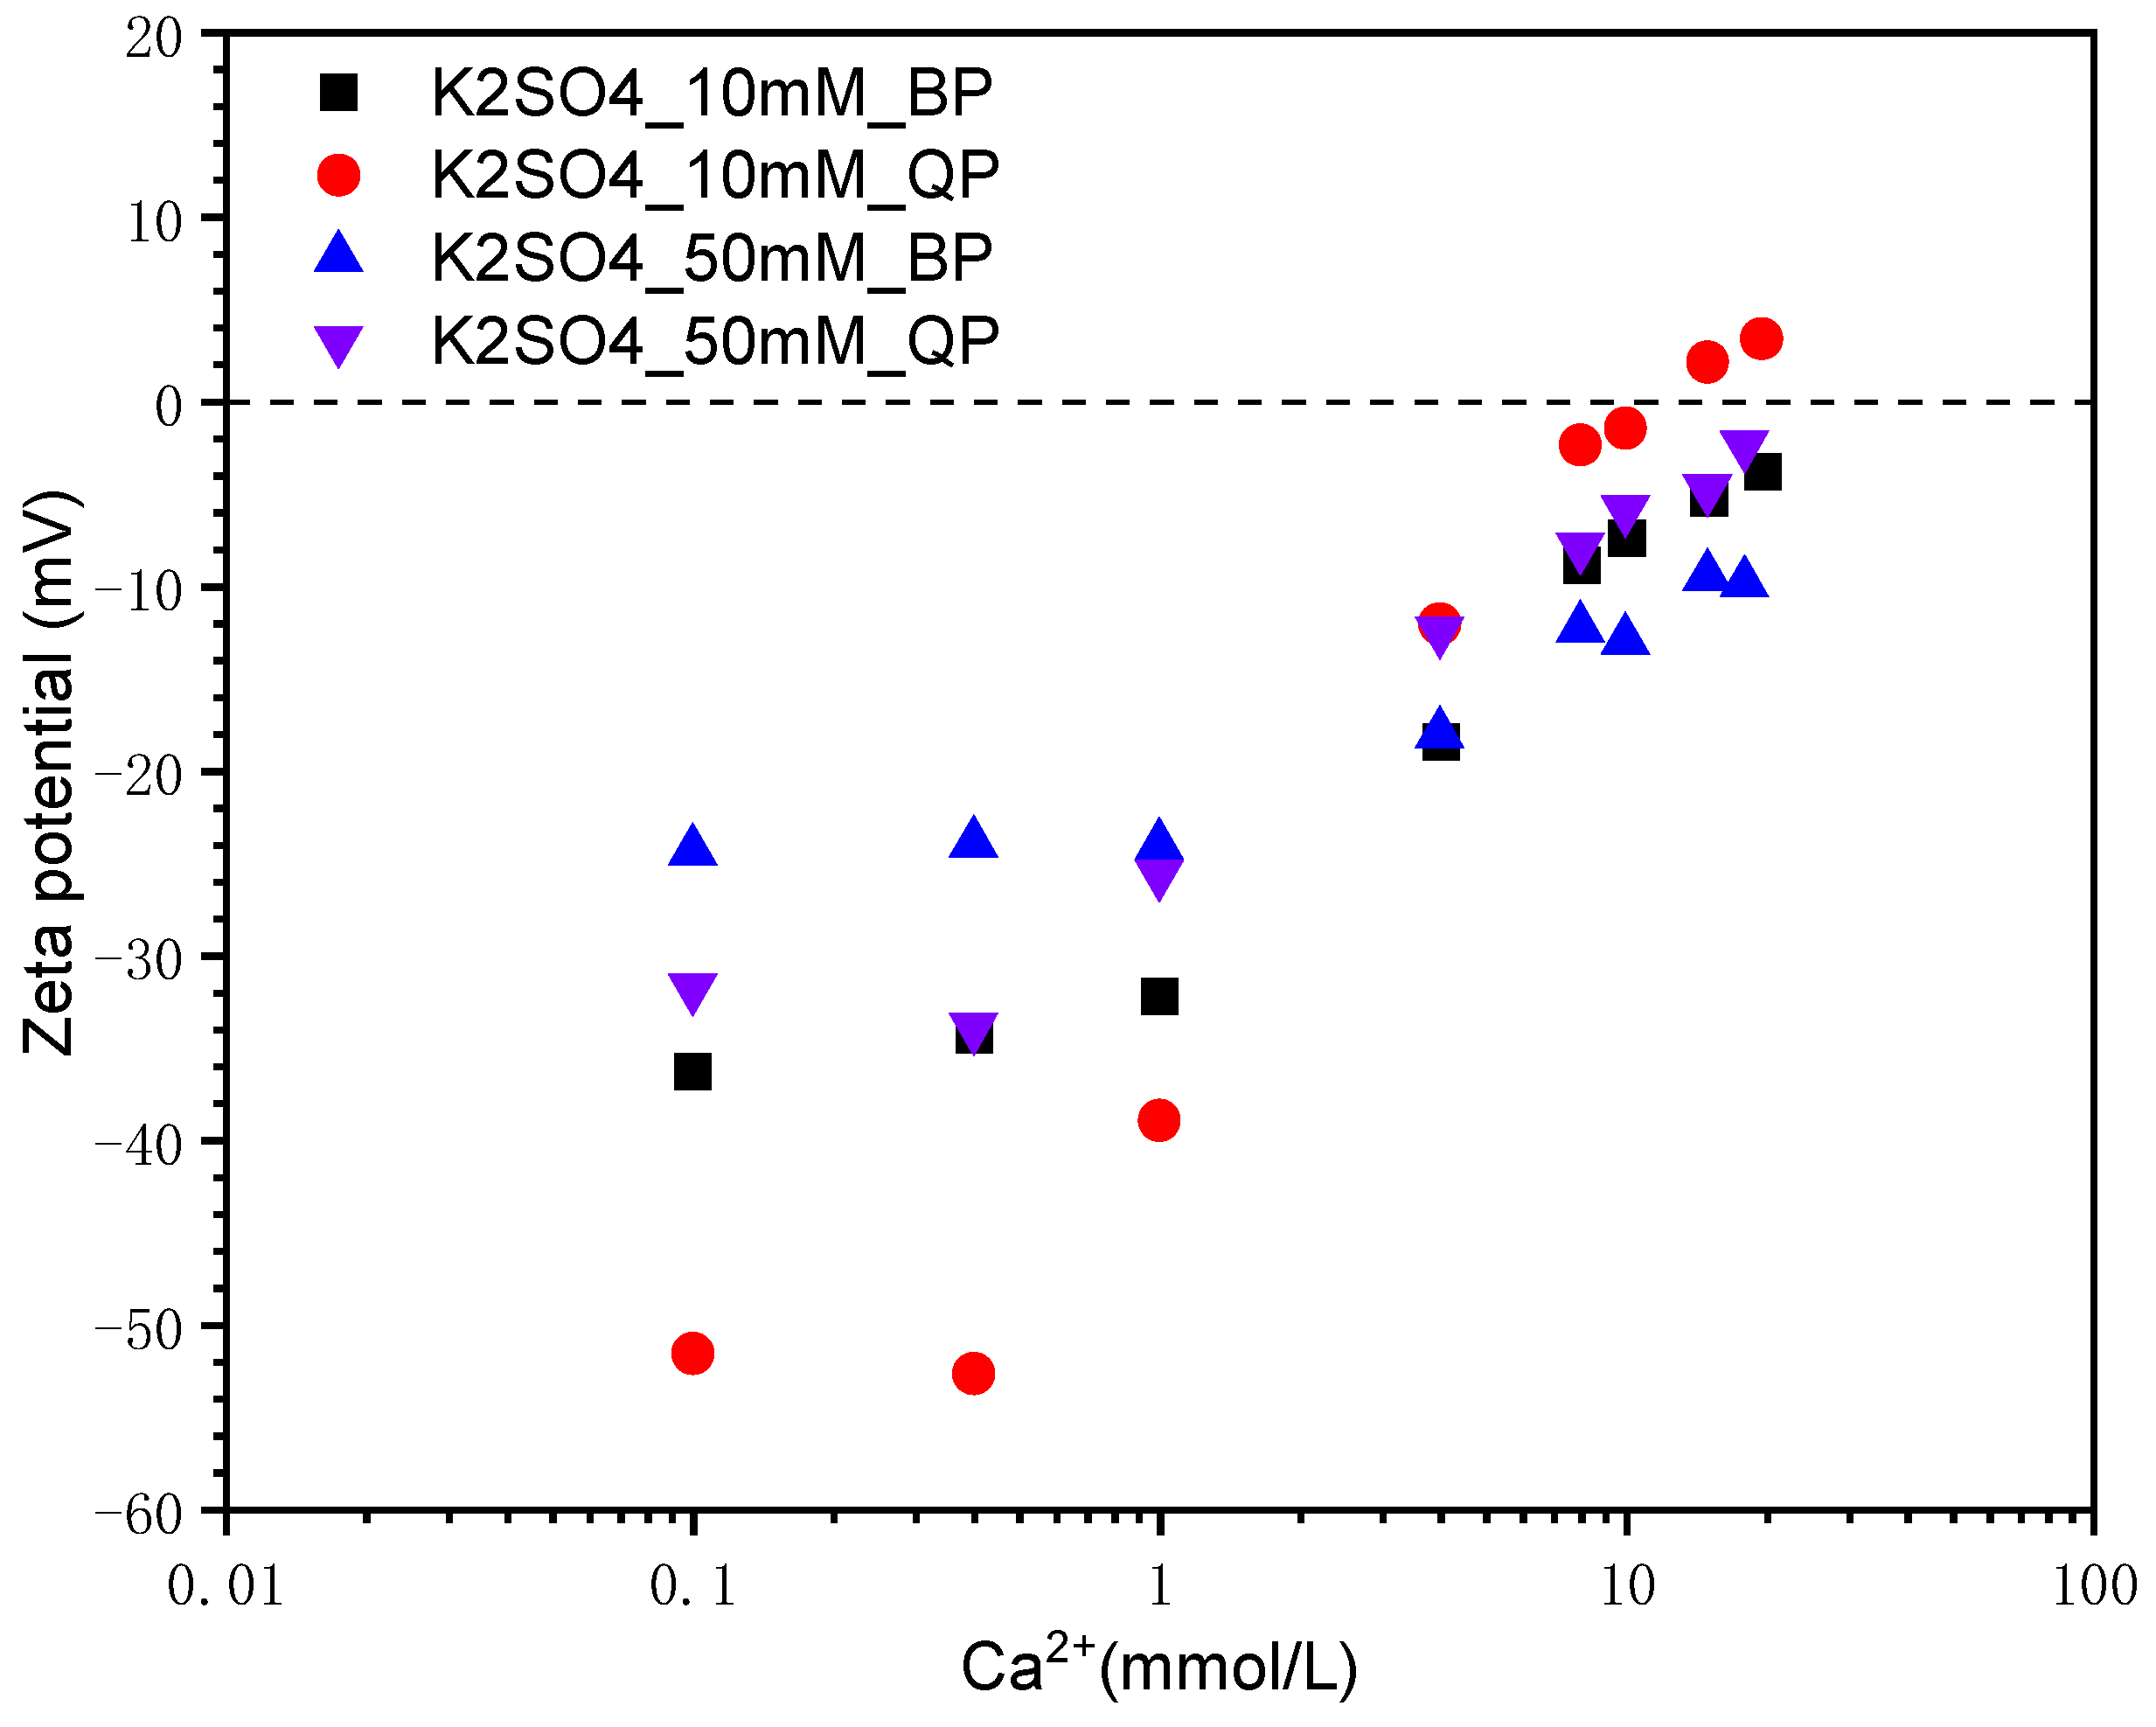
3.1.3. Effect of SO42− Concentration
3.2. Effect on the Hydration
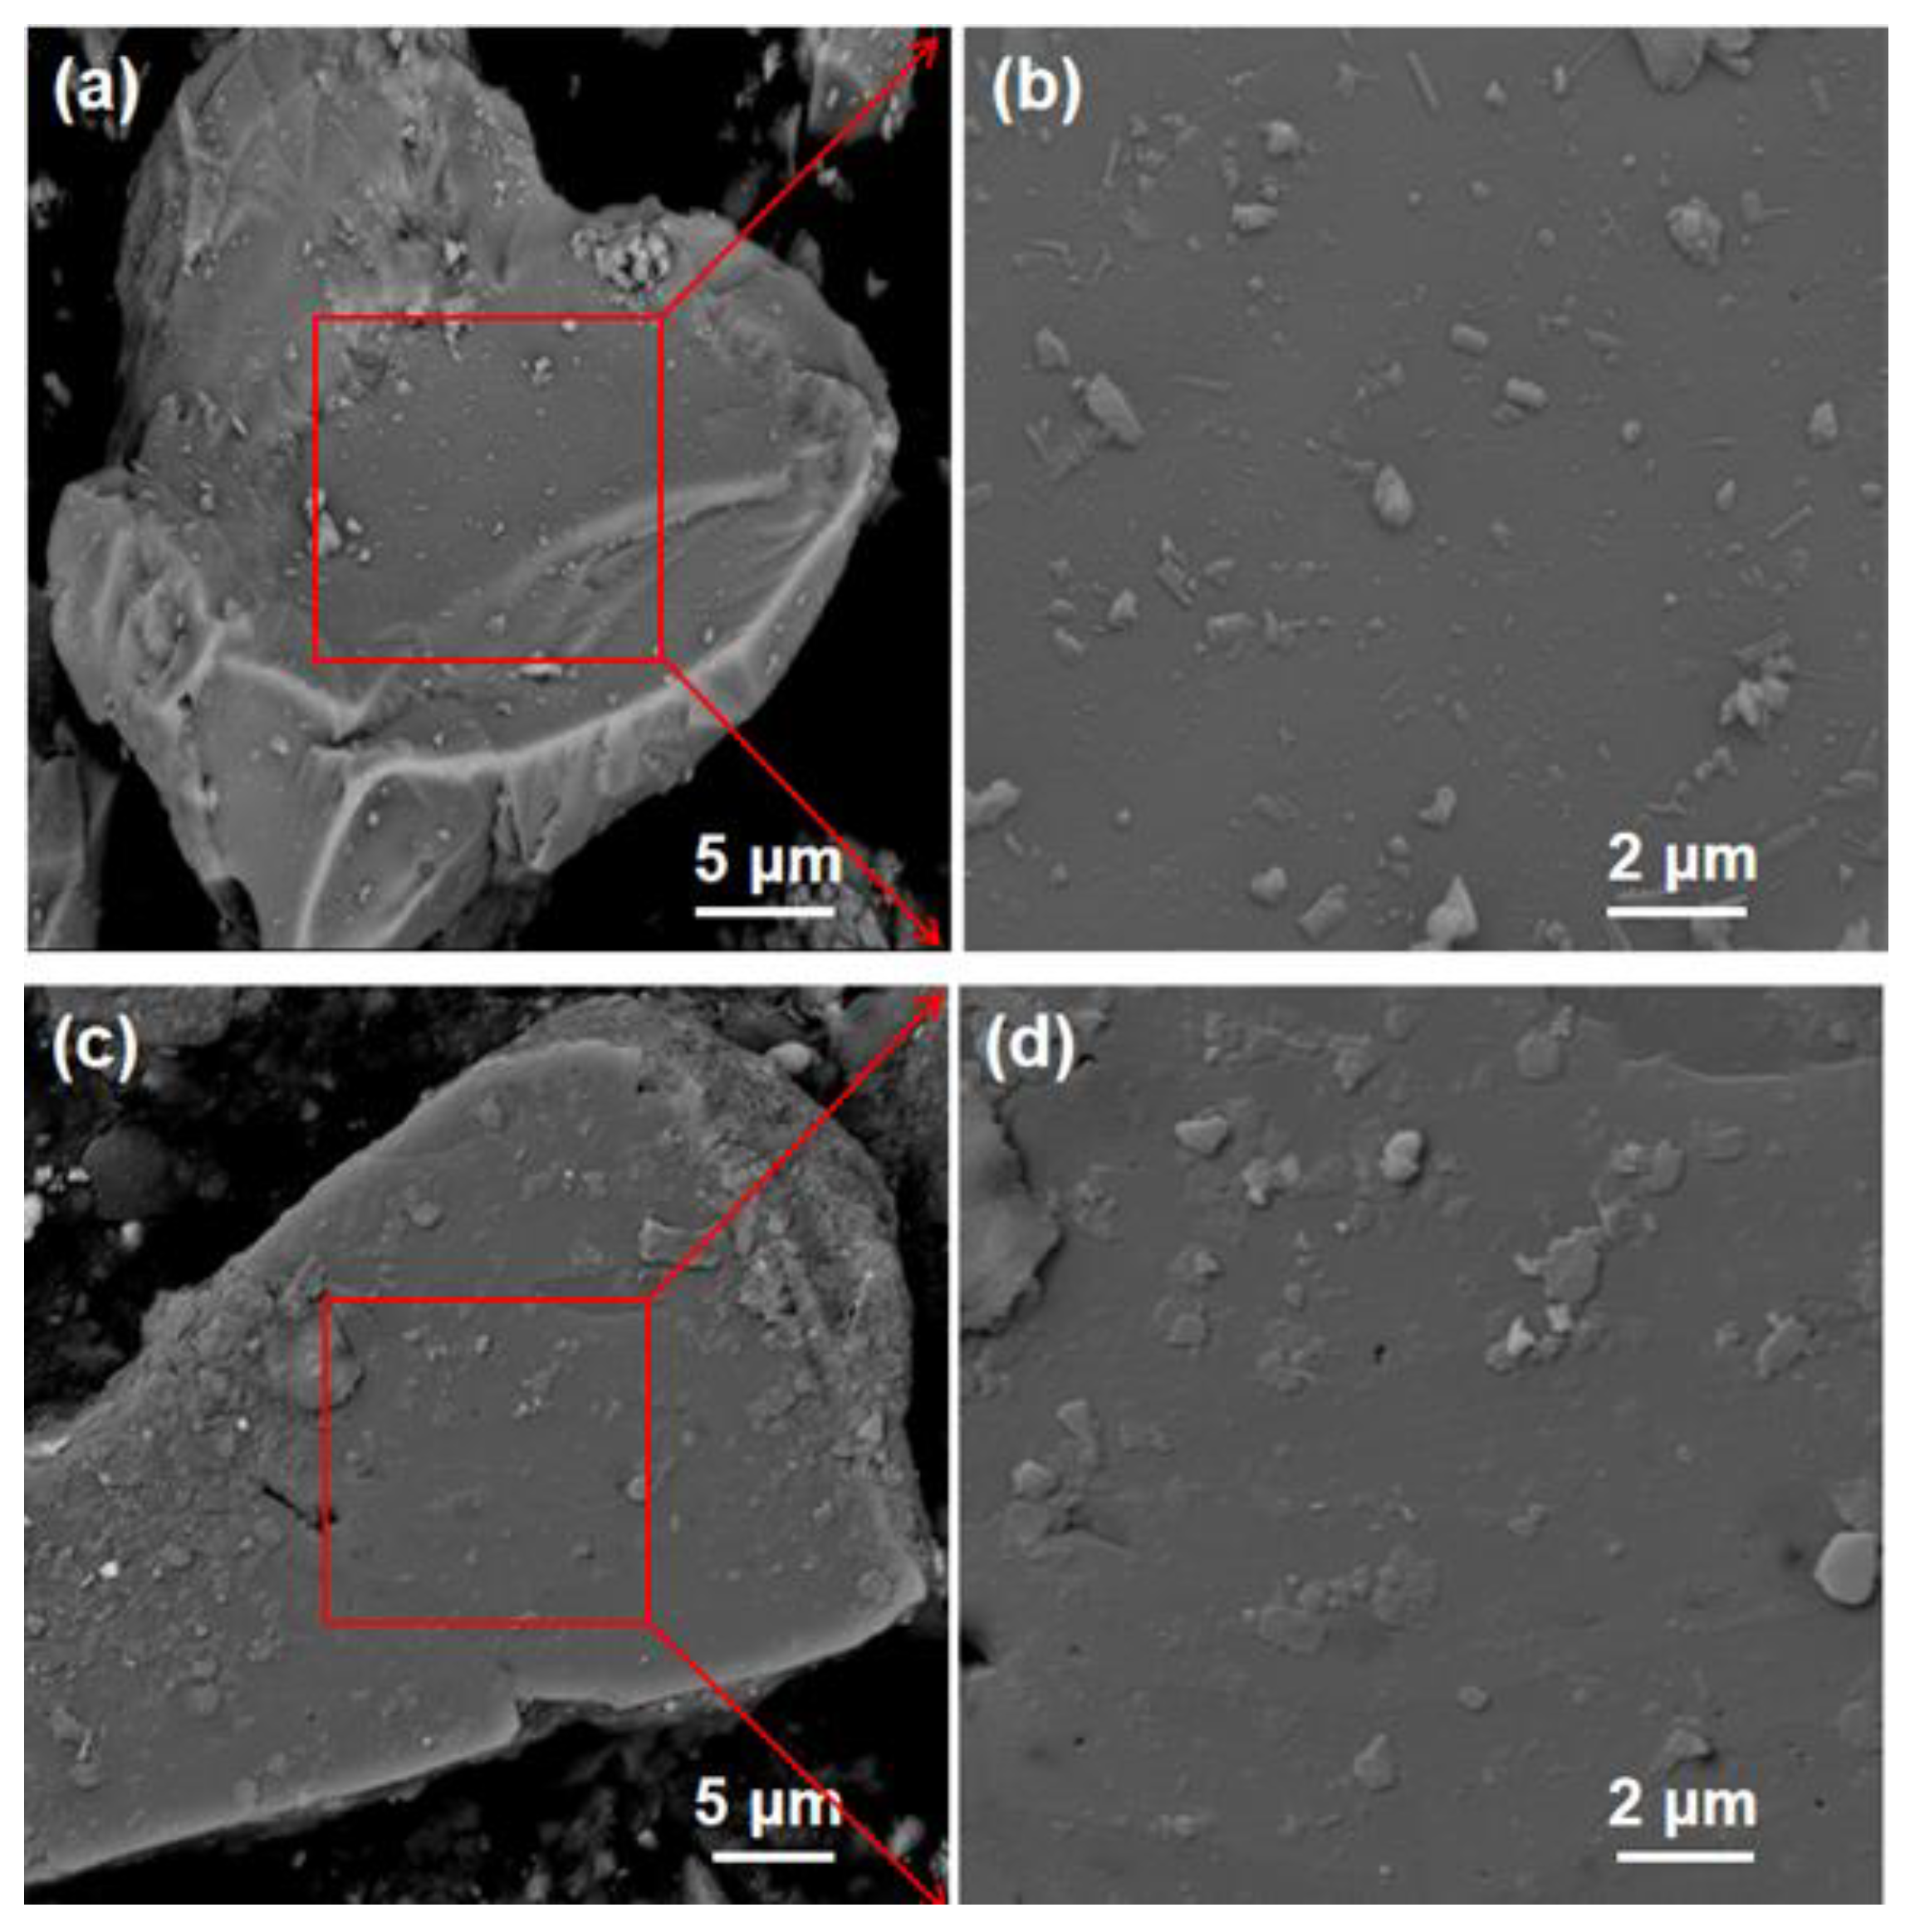
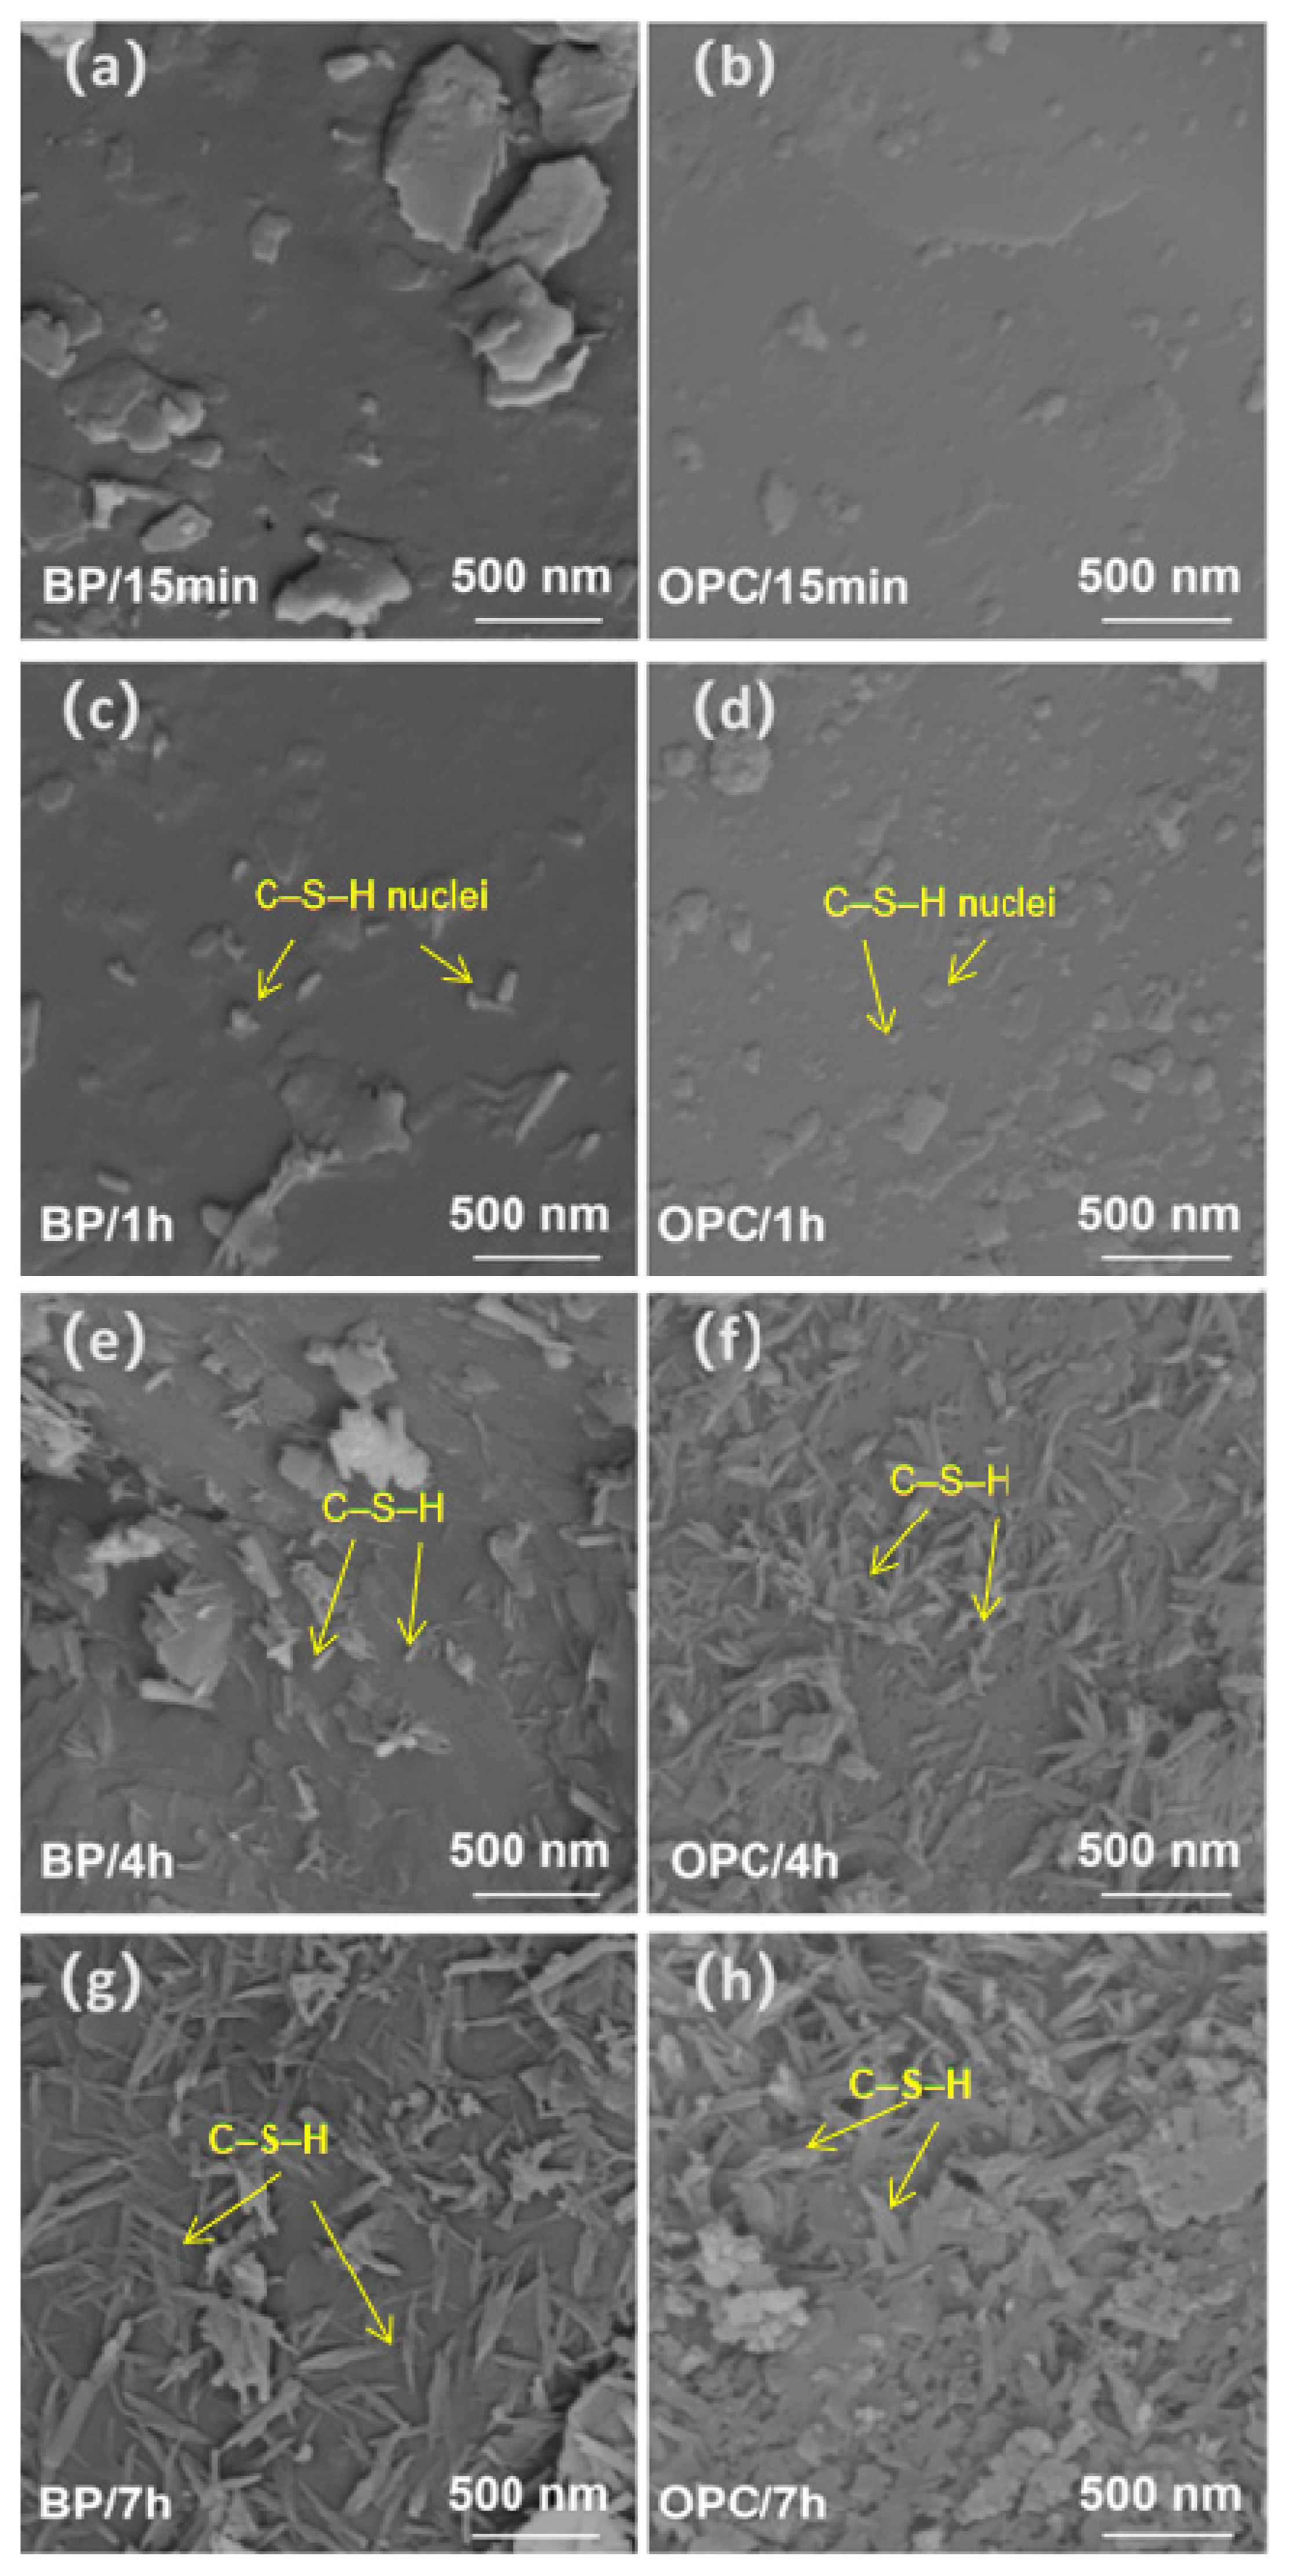
3.2.1. Morphology of Hydration Products
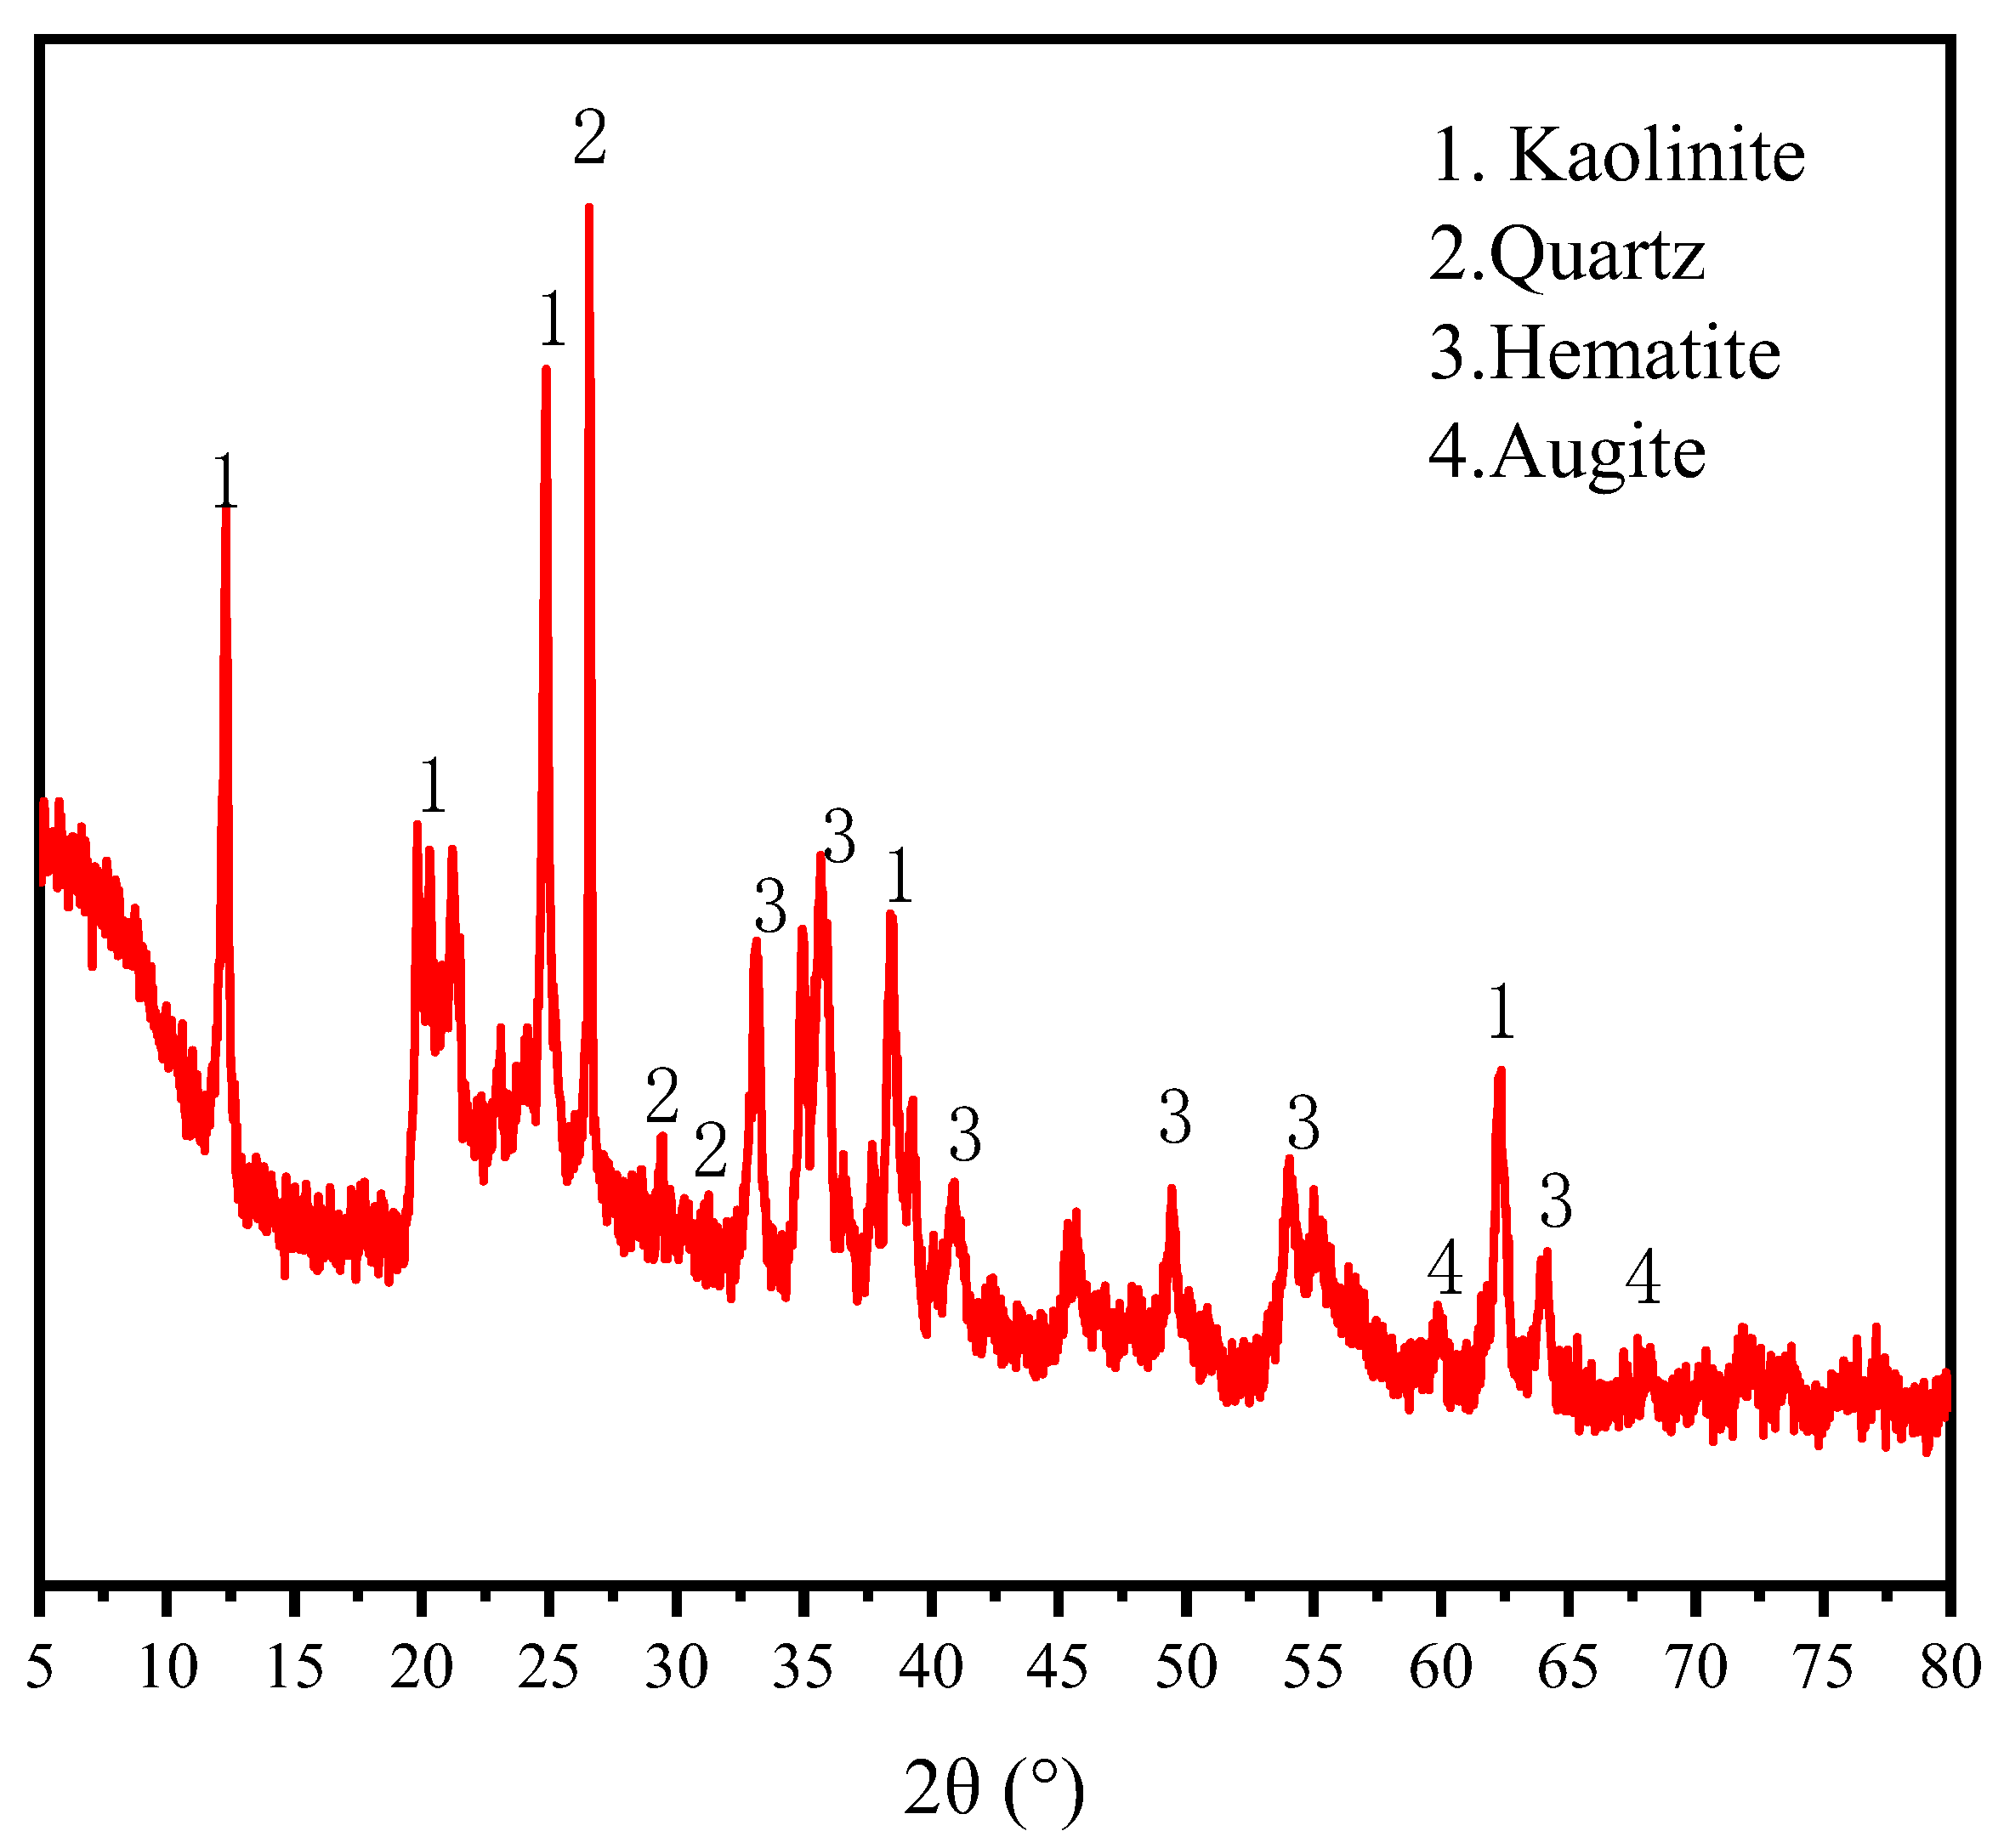
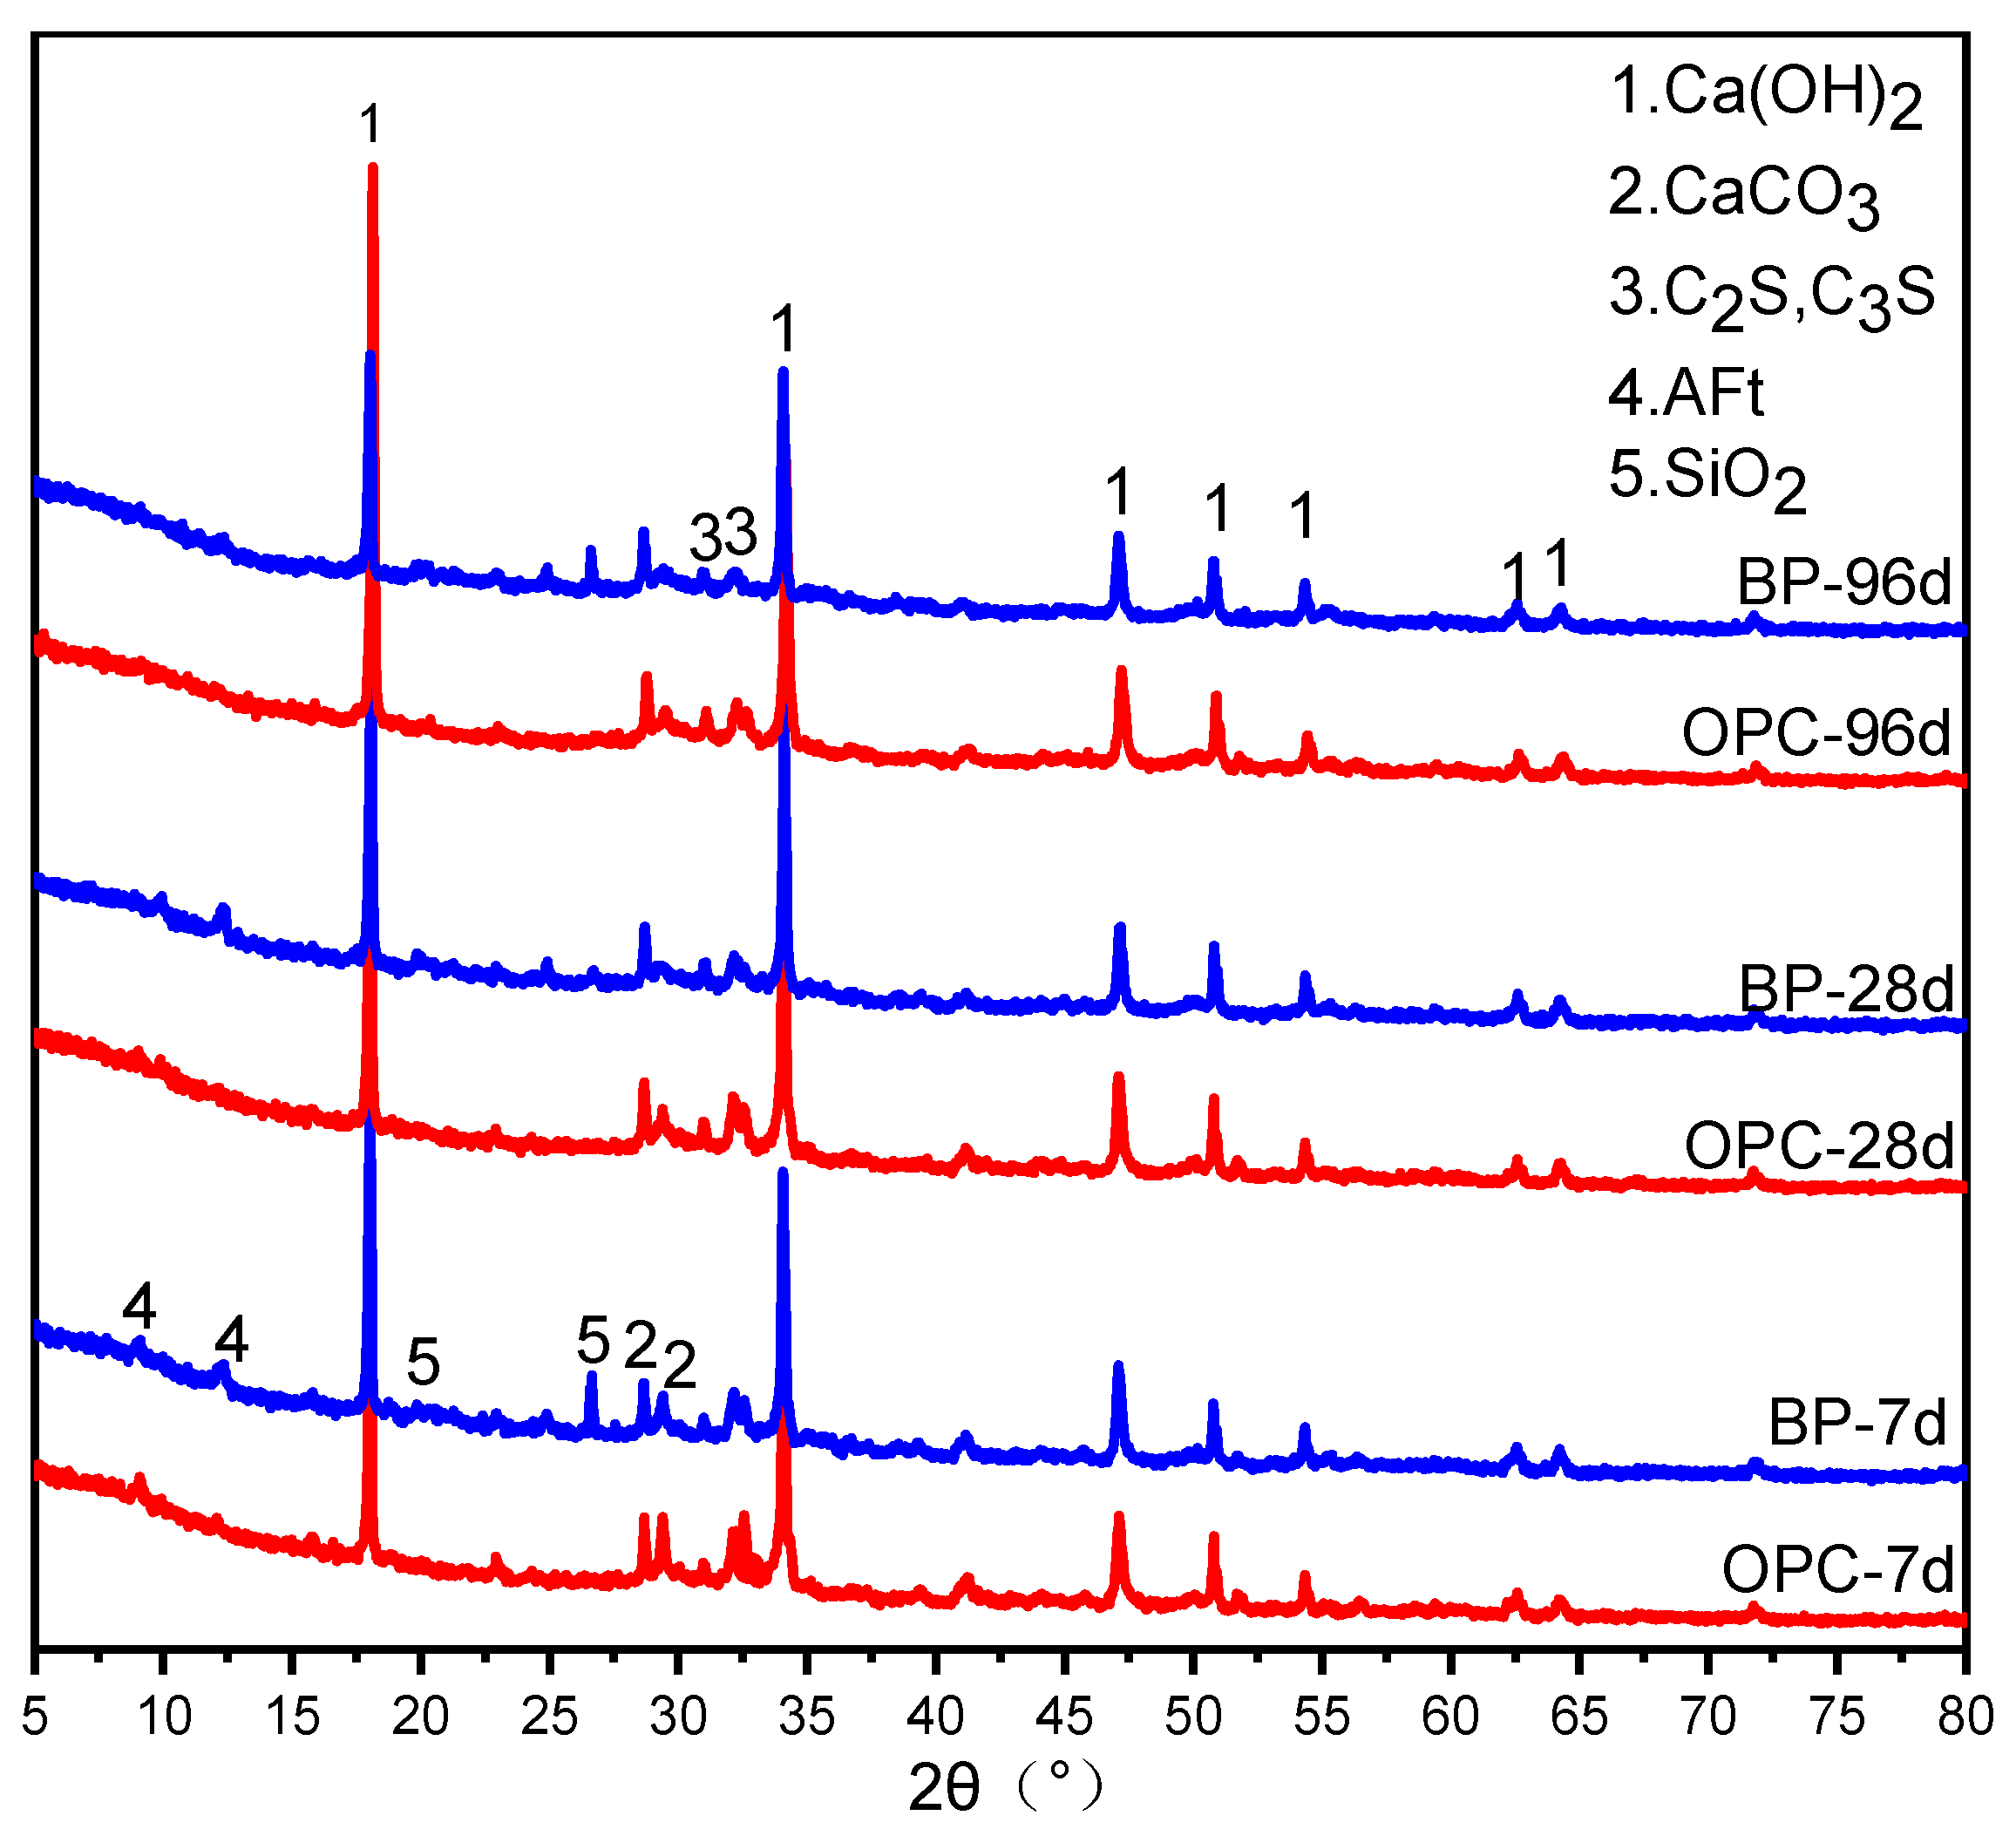
3.2.2. XRD Analysis
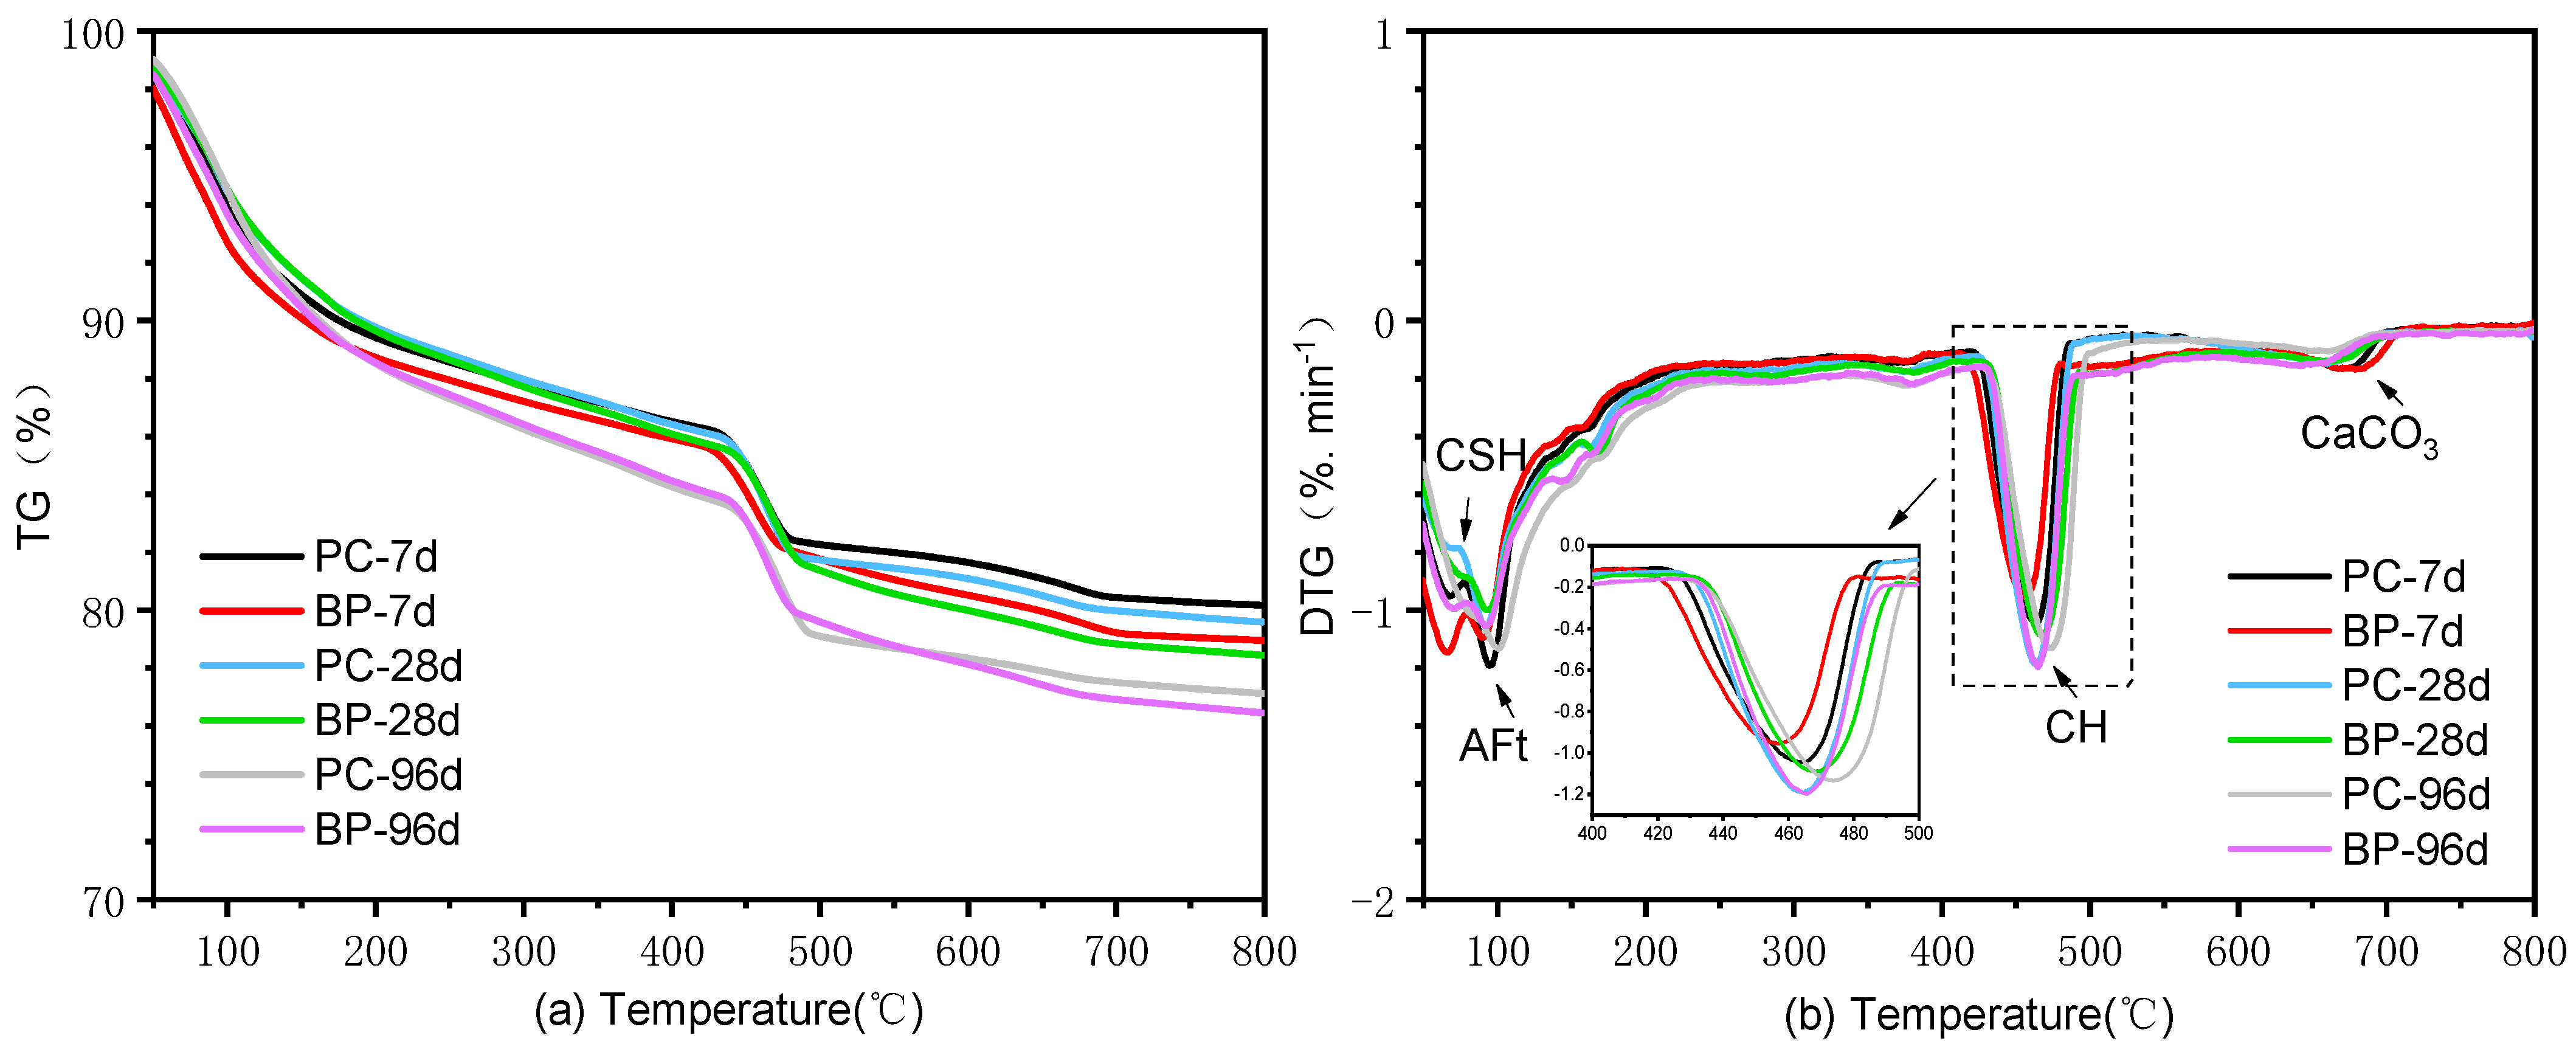
3.2.3. TGA Analysis
3.3. Effect on the Hydration
3.4. Effect on the Strength Development
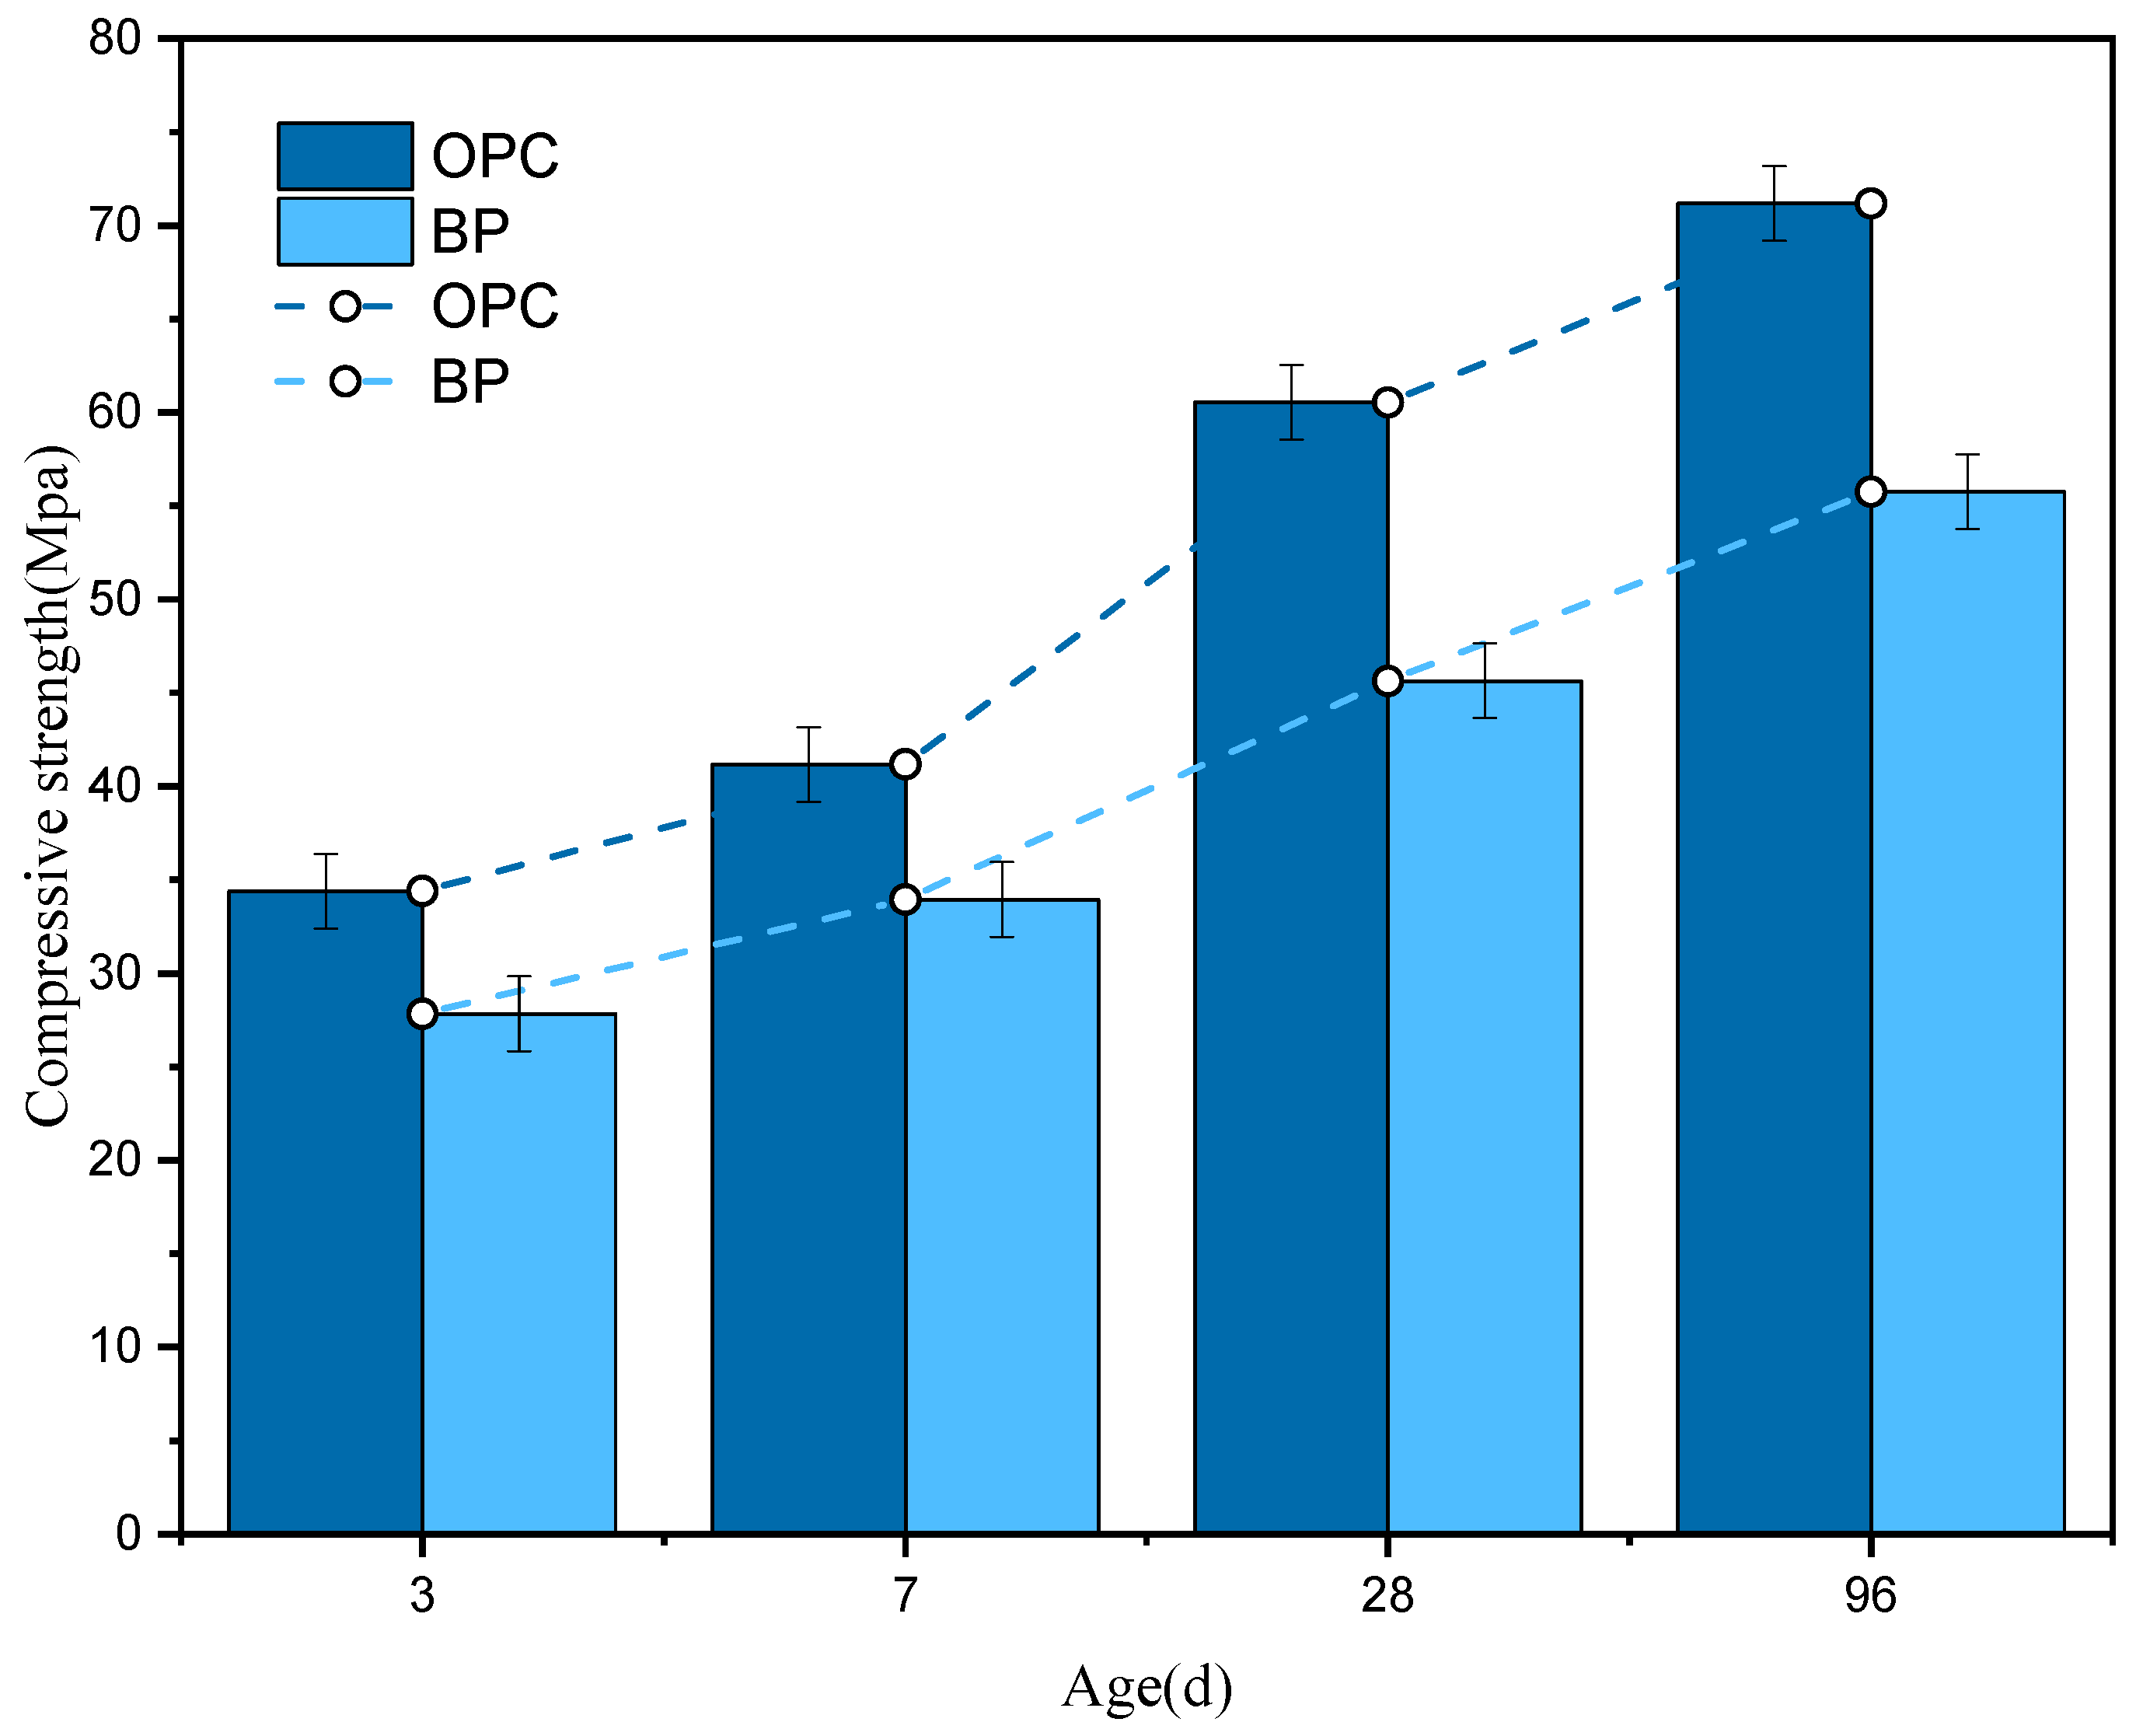
3.4.1. Compressive Strength
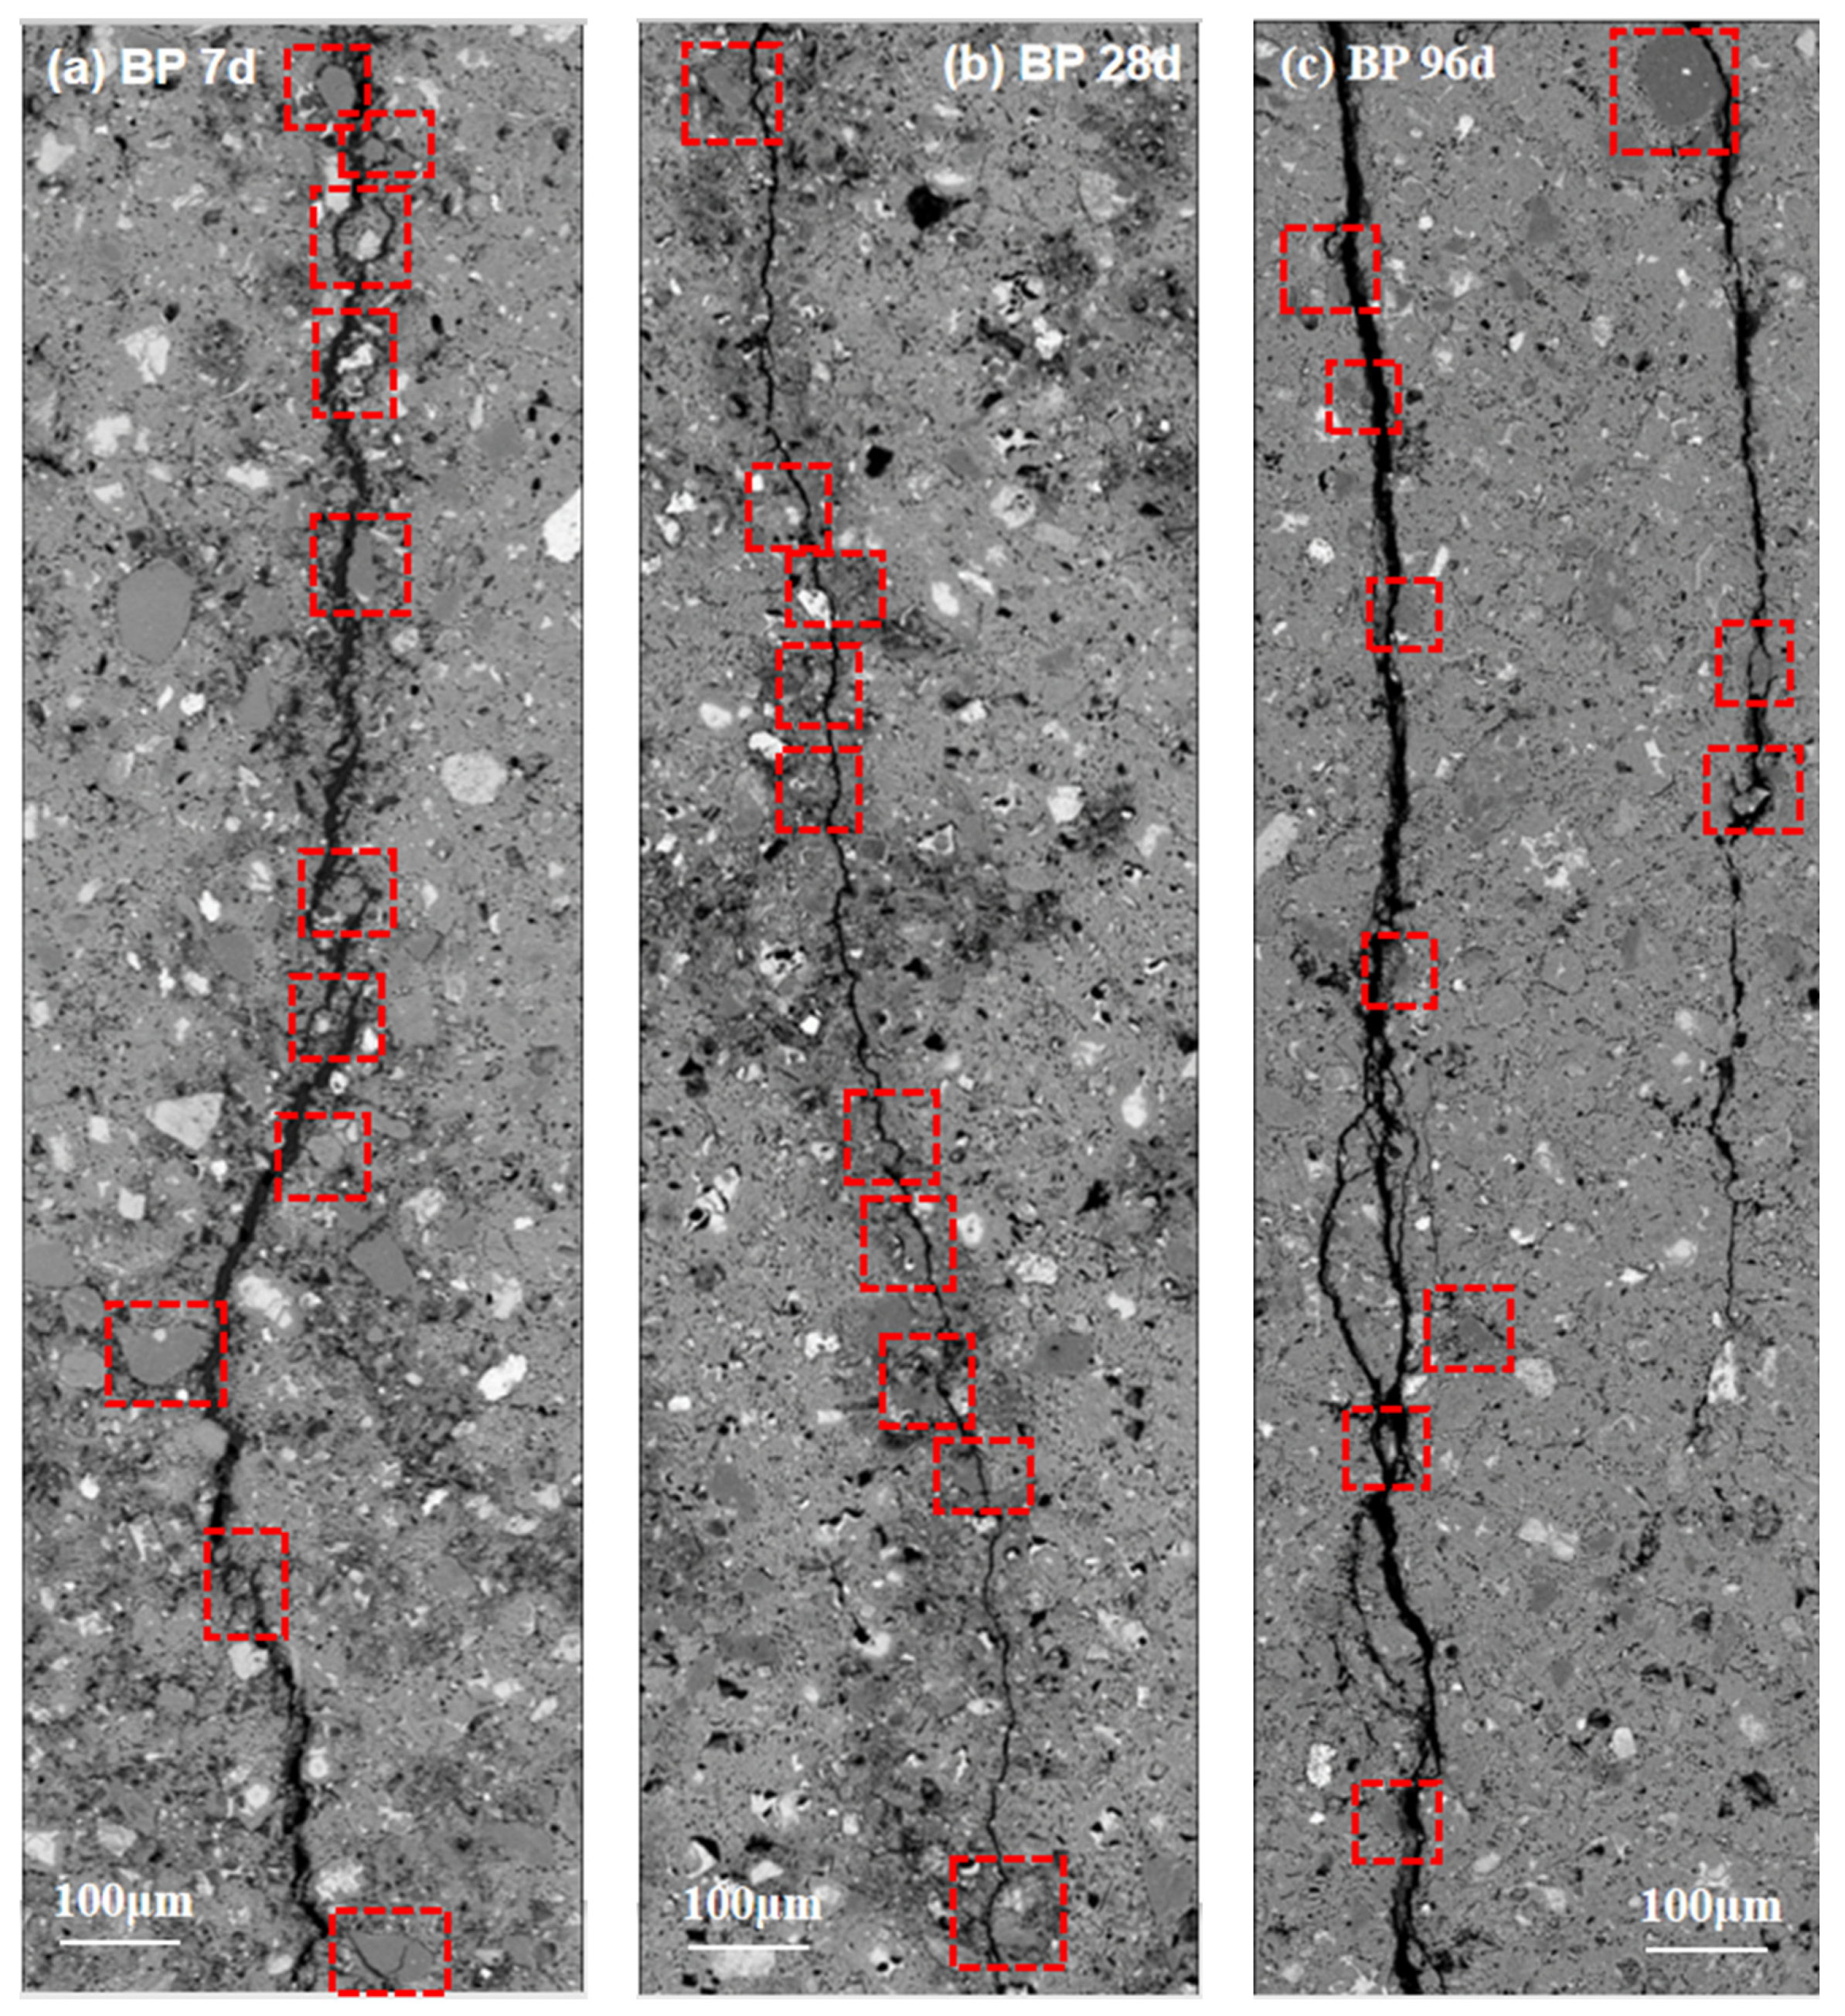
3.4.2. Crack Characterization
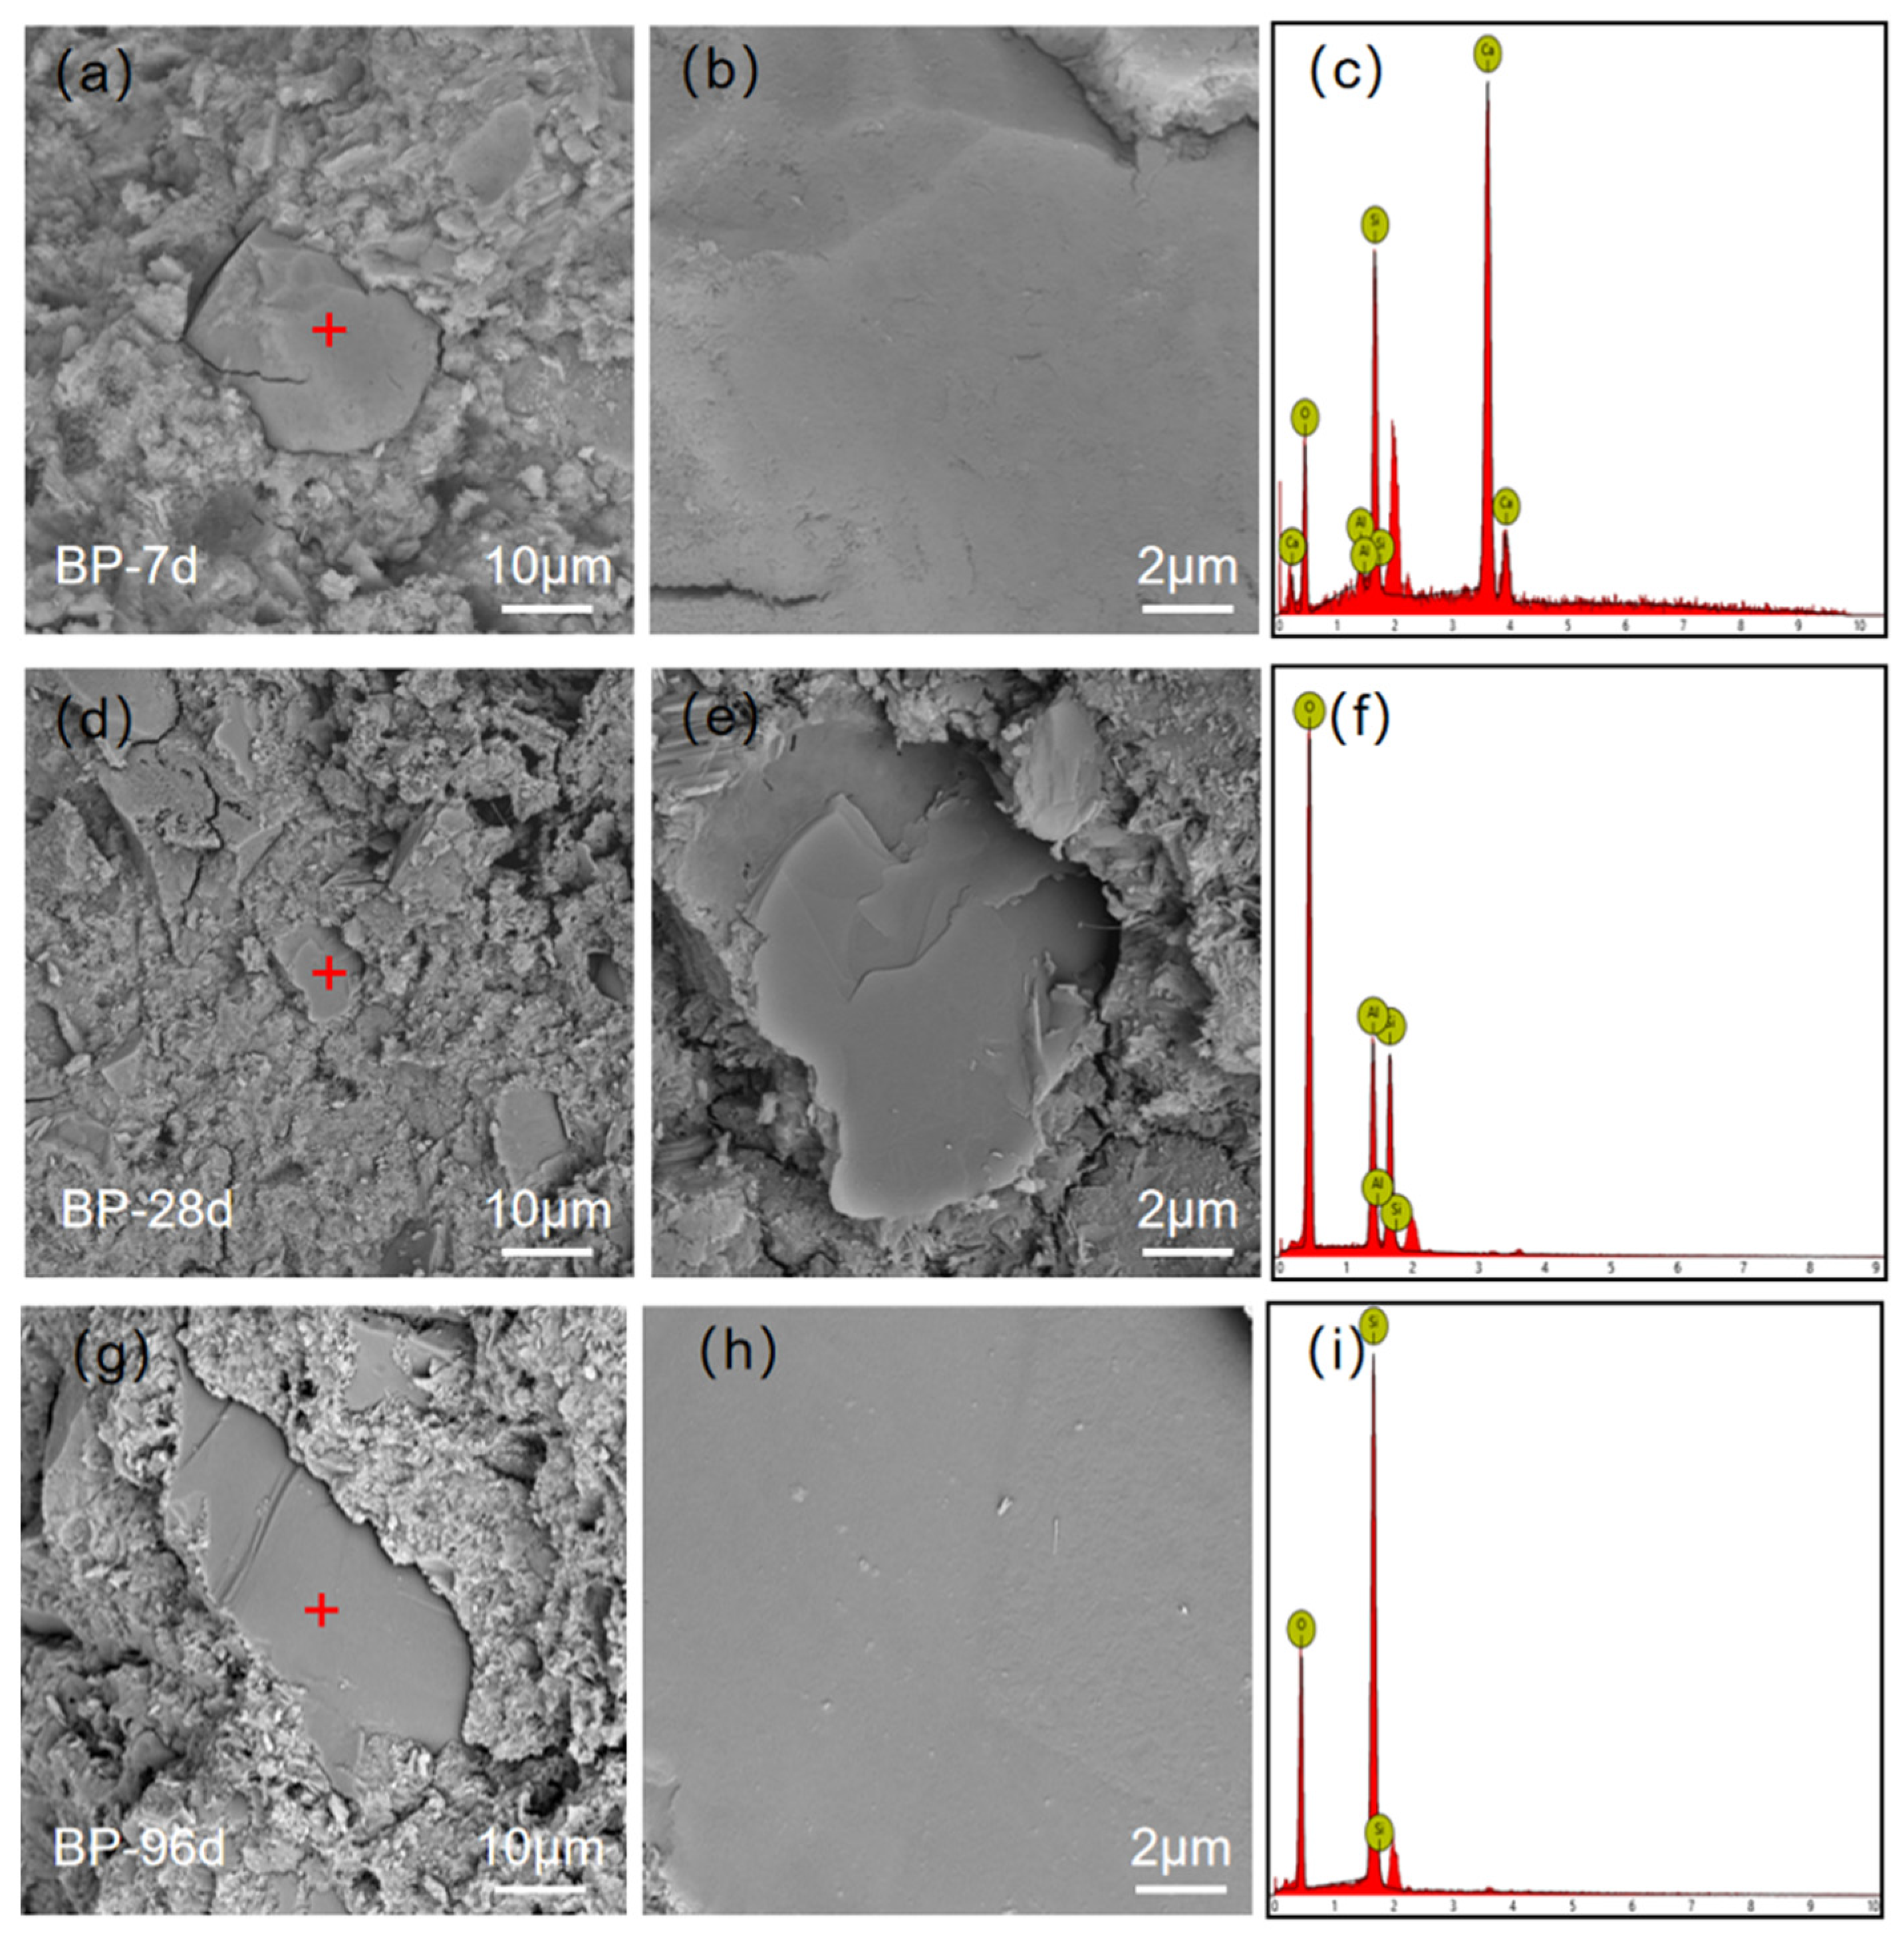
3.4.3. Fracture Surface
4. Discussion
5. Conclusions
- (1)
- BP has a weak absorption of Ca2+. The surface chemical properties are directly responsible for this weak interaction.
- (2)
- BP retards the formation of CSH on its surface and delays cement hydration. It is due to the weak absorption of Ca2+, which is crucial to the nucleation and development of CSH.
- (3)
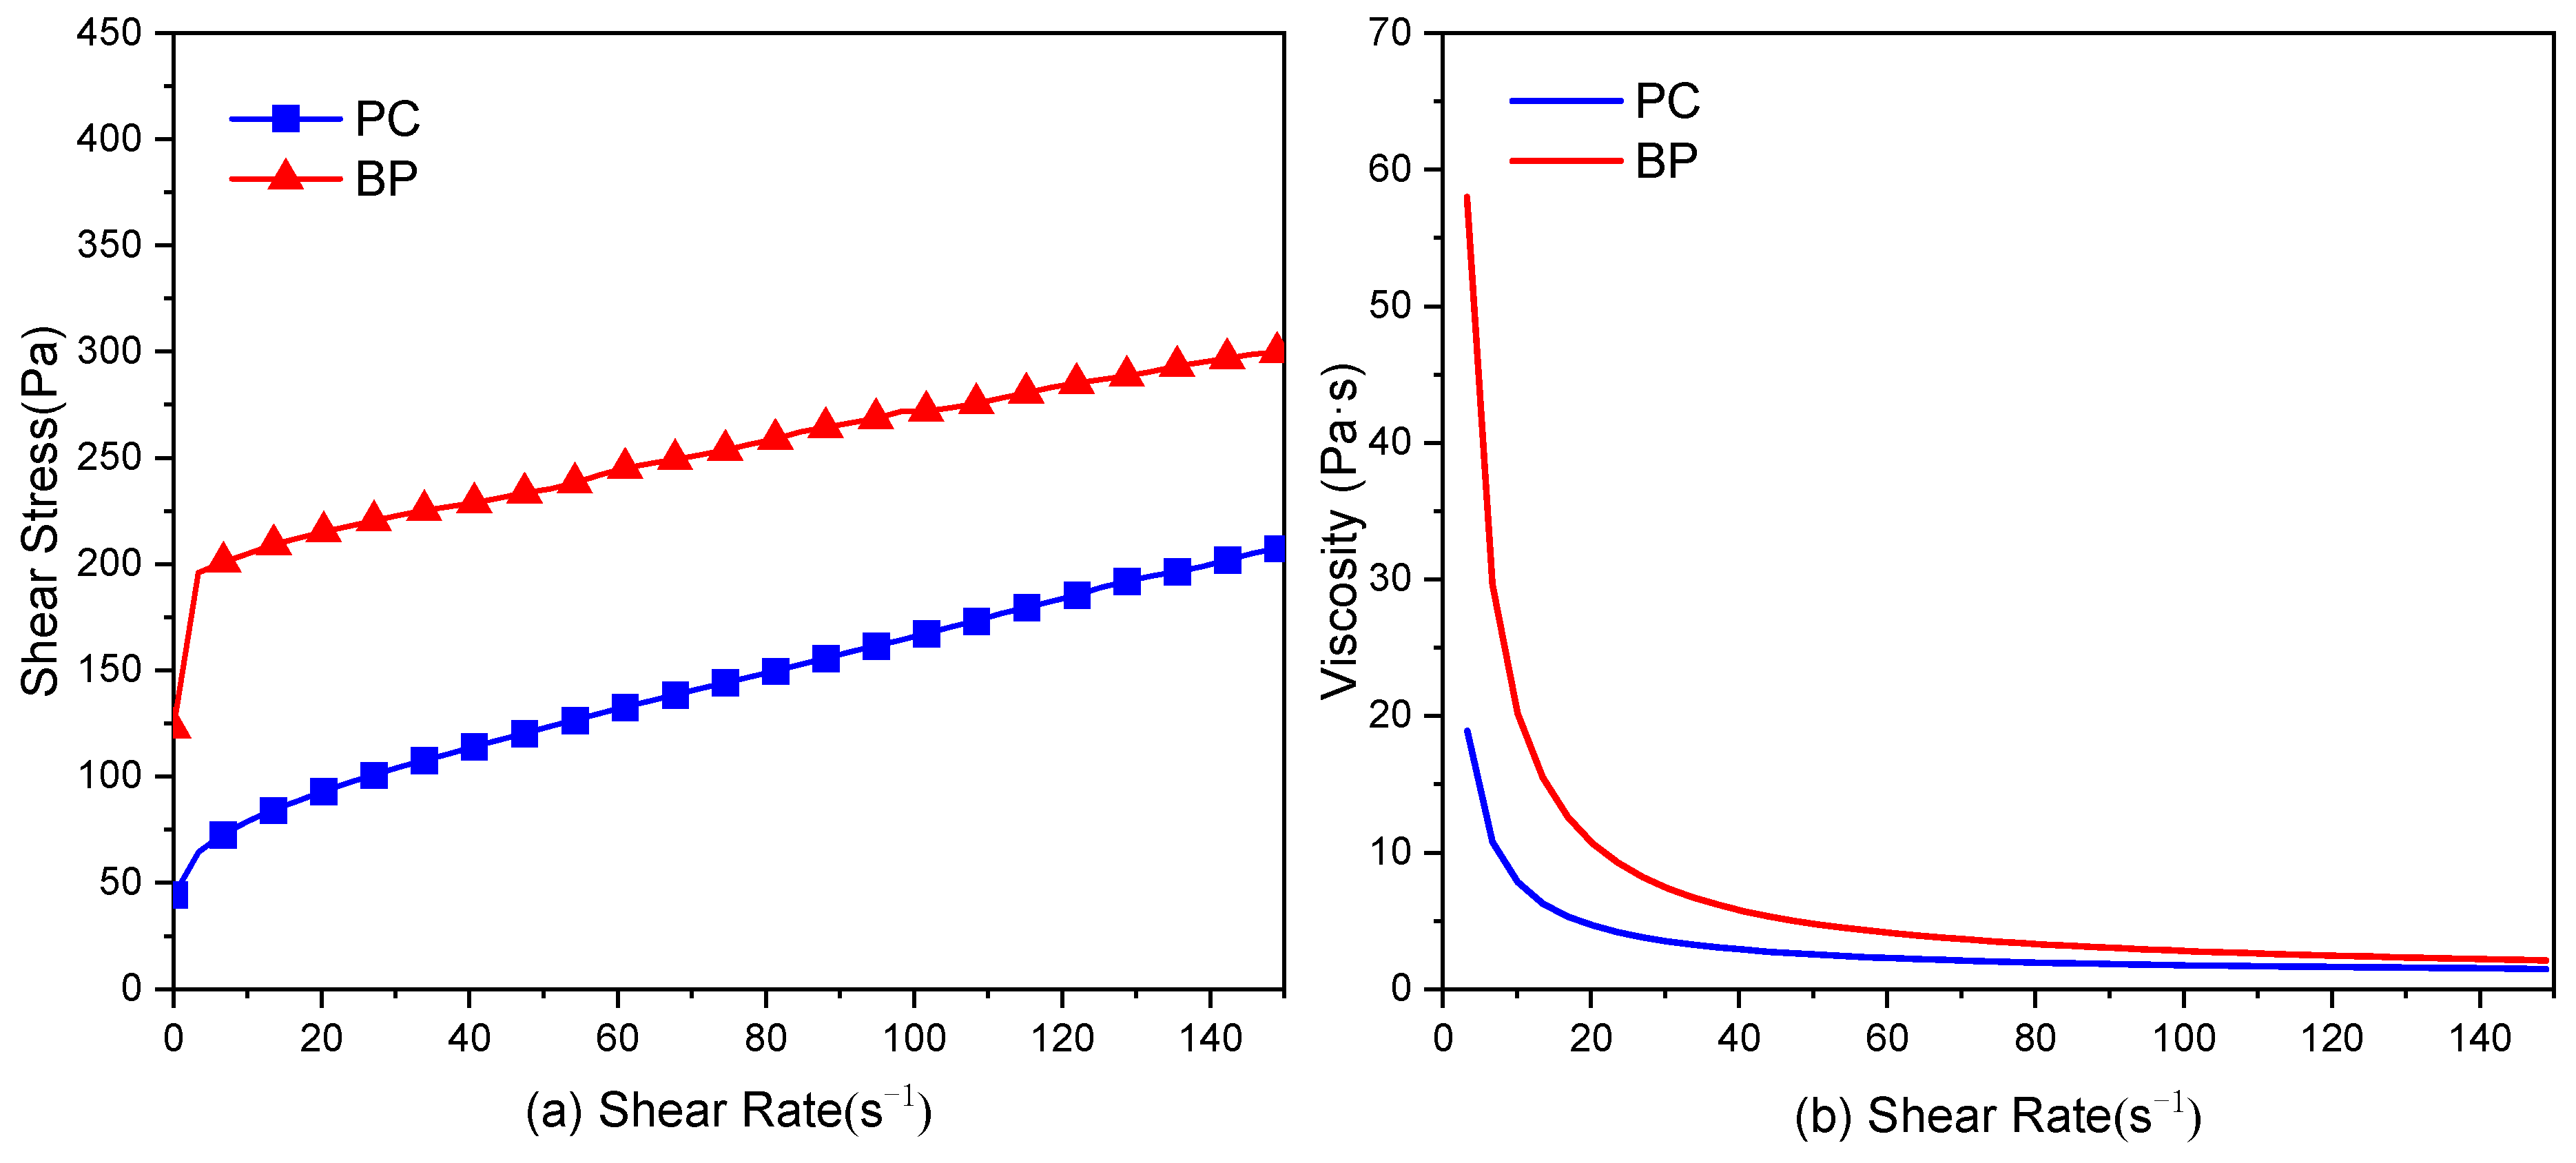
- The addition of BP increases the shear stress of cement paste. Besides the particle size and morphology, the surface chemical properties play an important role in this increase. Its low adsorption capacity for Ca2+ results in a weak electrostatic repulsion between particles, thus promoting particle agglomeration in fresh cement paste.
- (4)
- The crack characteristics and fracture surface show that the interface strength between BP and hydrate is very weak regardless of the curing age. It also illustrates that BP has very low chemical activity. In addition, the substitution of BP for cement leads to a dilution effect. These factors cause the strength of cement paste to decrease.
Author Contributions
Funding
Institutional Review Board Statement
Informed Consent Statement
Data Availability Statement
Acknowledgments
Conflicts of Interest
References
- Gartner, E. Industrially Interesting Approaches to “Low-Co2” Cements. Cem. Concr. Res. 2004, 34, 1489–1498. [Google Scholar] [CrossRef]
- Ali, M.B.; Saidur, R.; Hossain, M.S. A Review on Emission Analysis in Cement Industries. Renew. Sustain. Energy Rev. 2011, 15, 2252–2261. [Google Scholar] [CrossRef]
- Liu, J.; Wang, Y. Predicting the Chloride Diffusion in Concrete Incorporating Fly Ash by a Multi-Scale Model. J. Clean. Prod. 2022, 330, 129767. [Google Scholar] [CrossRef]
- Alsaif, A. Utilization of Ceramic Waste as Partially Cement Substitute—A Review. Constr. Build. Mater. 2021, 300, 124009. [Google Scholar] [CrossRef]
- Ashish, D.K. Concrete Made with Waste Marble Powder and Supplementary Cementitious Material for Sustainable Development. J. Clean. Prod. 2019, 211, 716–729. [Google Scholar] [CrossRef]
- Dias Ponzi, G.G.; Jacks Mendes Dos Santos, V.H.; Martel, R.B.; Pontin, D.; de Stepanha, A.S.D.G.; Schütz, M.K.; Dalla Vecchia, F. Basalt Powder as a Supplementary Cementitious Material in Cement Paste for Ccs Wells: Chemical and Mechanical Resistance of Cement Formulations for Co2 Geological Storage Sites. Int. J. Greenh. Gas Control. 2021, 109, 103337. [Google Scholar] [CrossRef]
- Binici, H.; Yardim, Y.; Aksogan, O.; Resatoglu, R.; Dincer, A.; Karrpuz, A. Durability Properties of Concretes Made with Sand and Cement Size Basalt. Sustain. Mater. Technol. 2020, 23, e00145. [Google Scholar] [CrossRef]
- Qin, J.; Qian, J.; Li, Z.; You, C.; Dai, X.; Yue, Y.; Fan, Y. Mechanical Properties of Basalt Fiber Reinforced Magnesium Phosphate Cement Composites. Constr. Build. Mater. 2018, 188, 946–955. [Google Scholar] [CrossRef]
- Borhan, T.M. Properties of Glass Concrete Reinforced with Short Basalt Fibre. Mater. Des. 2012, 42, 265–271. [Google Scholar] [CrossRef]
- Ralegaonkar, R.; Gavali, H.; Aswath, P.; Abolmaali, S. Application of Chopped Basalt Fibers in Reinforced Mortar: A Review. Constr. Build. Mater. 2018, 164, 589–602. [Google Scholar] [CrossRef]
- Adesina, A. Performance of Cementitious Composites Reinforced with Chopped Basalt Fibres—An Overview. Constr. Build. Mater. 2021, 266, 120970. [Google Scholar] [CrossRef]
- Yang, L.; Xie, H.; Zhang, D.; Zhang, F.; Lin, C.; Fang, S. Acoustic Emission Characteristics and Crack Resistance of Basalt Fiber Reinforced Concrete under Tensile Load. Constr. Build. Mater. 2021, 312, 125442. [Google Scholar] [CrossRef]
- Assie, S.; Escadeillas, G.; Waller, V. Estimates of Self-Compacting Concrete ‘Potential’ Durability. Constr. Build. Mater. 2007, 21, 1909–1917. [Google Scholar] [CrossRef]
- Topcu, I.B.; Bilir, T.; Uygunoglu, T. Effect of Waste Marble Dust Content as Filler on Properties of Self-Compacting Concrete. Constr. Build. Mater. 2009, 23, 1947–1953. [Google Scholar] [CrossRef]
- Dobiszewska, M.; Schindler, A.K.; Pichór, W. Mechanical Properties and Interfacial Transition Zone Microstructure of Concrete with Waste Basalt Powder Addition. Constr. Build. Mater. 2018, 177, 222–229. [Google Scholar] [CrossRef]
- Dobiszewska, M.; Beycioğlu, A. Physical Properties and Microstructure of Concrete with Waste Basalt Powder Addition. Materials 2020, 13, 3503. [Google Scholar] [CrossRef]
- Tasong, W.A.; Cripps, J.C.; Lynsdale, C.J. Aggregate-Cement Chemical Interactions. Cem. Concr. Res. 1998, 28, 1037–1048. [Google Scholar] [CrossRef]
- Laibao, L.; Yunsheng, Z.; Wenhua, Z.; Zhiyong, L.; Lihua, Z. Investigating the Influence of Basalt as Mineral Admixture on Hydration and Microstructure Formation Mechanism of Cement. Constr. Build. Mater. 2013, 48, 434–440. [Google Scholar] [CrossRef]
- Li, Y.; Zeng, X.; Zhou, J.; Shi, Y.; Umar, H.A.; Long, G.; Xie, Y. Development of an Eco-Friendly Ultra-High Performance Concrete Based on Waste Basalt Powder for Sichuan-Tibet Railway. J. Clean. Prod. 2021, 312, 127775. [Google Scholar] [CrossRef]
- Saraya, M.E.-S.I. Study Physico-Chemical Properties of Blended Cements Containing Fixed Amount of Silica Fume, Blast Furnace Slag, Basalt and Limestone, a Comparative Study. Constr. Build. Mater. 2014, 72, 104–112. [Google Scholar] [CrossRef]
- Youness, D.; Mechaymech, A.; Al Wardany, R. Flow Assessment and Development Towards Sustainable Self-Consolidating Concrete Using Blended Basalt and Limestone-Cement Systems. J. Clean. Prod. 2021, 283, 124582. [Google Scholar] [CrossRef]
- Ouyang, X.; Yu, L.; Wang, L.; Xu, S.; Ma, Y.; Fu, J. Surface Properties of Ceramic Waste Powder and Its Effect on the Rheology, Hydration and Strength Development of Cement Paste. J. Build. Eng. 2022, 61, 105253. [Google Scholar] [CrossRef]
- Huang, J.; Xu, W.; Chen, H.; Xu, G. Elucidating How Ionic Adsorption Controls the Rheological Behavior of Quartz and Cement-Quartz Paste. Constr. Build. Mater. 2021, 272, 121957. [Google Scholar] [CrossRef]
- Ouyang, X.; Wang, L.; Xu, S.; Ma, Y.; Ye, G. Surface Characterization of Carbonated Recycled Concrete Fines and Its Effect on the Rheology, Hydration and Strength Development of Cement Paste. Cem. Concr. Res. 2020, 114, 103809. [Google Scholar] [CrossRef]
- Ouyang, X.; Koleva, D.A.; Ye, G.; Van Breugel, K. Insights into the Mechanisms of Nucleation and Growth of C–S–H on Fillers. Mater. Struct. 2017, 50, 213. [Google Scholar] [CrossRef] [Green Version]
- Standard, A.C. Standard Practice for Mechanical Mixing of Hydraulic Cement Pastes and Mortars of Plastic Consistency; Annual book of ASTM standards: West Conshohocken, PA, USA, 2006. [Google Scholar]
- Zhang, S.; Liu, Y. Molecular-Level Mechanisms of Quartz Dissolution under Neutral and Alkaline Conditions in the Presence of Electrolytes. Geochem. J. 2014, 48, 189–205. [Google Scholar] [CrossRef] [Green Version]
- Nangia, S.; Garrison, B.J. Reaction Rates and Dissolution Mechanisms of Quartz as a Function of Ph. J. Phys. Chem. A 2008, 112, 2027–2033. [Google Scholar] [CrossRef] [PubMed]
- Ali, A.M.; Yahya, N.; Mijinyawa, A.; Kwaya, M.Y.; Sikiru, S. Molecular Simulation and Microtextural Characterization of Quartz Dissolution in Sodium Hydroxide. J. Pet. Explor. Prod. Technol. 2020, 10, 2669–2684. [Google Scholar] [CrossRef]
- Wang, Z.; Chen, Y.; Xu, L.; Zhu, Z.; Zhou, Y.; Pan, F.; Wu, K. Insight into the Local C-S-H Structure and Its Evolution Mechanism Controlled by Curing Regime and Ca/Si Ratio. Constr. Build. Mater. 2022, 333, 127388. [Google Scholar] [CrossRef]
- Ouyang, X.; Koleva, D.A.; Ye, G.; Van Breugel, K. Understanding the Adhesion Mechanisms between Csh and Fillers. Cem. Concr. Res. 2017, 100, 275–283. [Google Scholar] [CrossRef]
- Ouyang, X.; Wang, L.; Fu, J.; Xu, S.; Ma, Y. Surface Properties of Clay Brick Powder and Its Influence on Hydration and Strength Development of Cement Paste. Constr. Build. Mater. 2021, 300, 123958. [Google Scholar] [CrossRef]
- Gameiro, A.; Santos Silva, A.; Faria, P.; Grilo, J.; Branco, T.; Veiga, R.; Velosa, A. Physical and Chemical Assessment of Lime-Metakaolin Mortars: Influence of Binder:Aggregate Ratio. Cem. Concr. Compos. 2014, 45, 264–271. [Google Scholar] [CrossRef] [Green Version]
- Liu, X.; Niu, D.; Li, X.; Lv, Y. Effects of Ca(Oh)2–Caco3 Concentration Distribution on the Ph and Pore Structure in Natural Carbonated Cover Concrete: A Case Study. Constr. Build. Mater. 2018, 186, 1276–1285. [Google Scholar] [CrossRef]
- Grilo, J.; Santos Silva, A.; Faria, P.; Gameiro, A.; Veiga, R.; Velosa, A. Mechanical and Mineralogical Properties of Natural Hydraulic Lime-Metakaolin Mortars in Different Curing Conditions. Constr. Build. Mater. 2014, 51, 287–294. [Google Scholar] [CrossRef]
- Marchon, D.; Kawashima, S.; Bessaies-Bey, H.; Mantellato, S.; Ng, S. Hydration and Rheology Control of Concrete for Digital Fabrication: Potential Admixtures and Cement Chemistry. Cem. Concr. Res. 2018, 112, 96–110. [Google Scholar] [CrossRef]
- Wallevik, O.H.; Wallevik, J.E. Rheology as a Tool in Concrete Science: The Use of Rheographs and Workability Boxes. Cem. Concr. Res. 2011, 41, 1279–1288. [Google Scholar] [CrossRef]
- Flatt, R.J. Towards a Prediction of Superplasticized Concrete Rheology. Mater. Struct. 2004, 37, 289–300. [Google Scholar] [CrossRef]
- Morris, J.F. A Review of Microstructure in Concentrated Suspensions and Its Implications for Rheology and Bulk Flow. RHEOLOGICA ACTA 2009, 48, 909–923. [Google Scholar] [CrossRef]
- Vance, K.; Kumar, A.; Sant, G.; Neithalath, N. The Rheological Properties of Ternary Binders Containing Portland Cement, Limestone, and Metakaolin or Fly Ash. Cem. Concr. Res. 2013, 52, 196–207. [Google Scholar] [CrossRef]
- Bonavetti, V.; Donza, H.; Menendez, G.; Cabrera, O.; Irassar, E.F. Limestone Filler Cement in Low W/C Concrete: A Rational Use of Energy. Cem. Concr. Res. 2003, 33, 865–871. [Google Scholar] [CrossRef]
- Lawrence, P.; Cyr, M.; Ringot, E. Mineral Admixtures in Mortars—Effect of Inert Materials on Short-Term Hydration. Cem. Concr. Res. 2003, 33, 1939–1947. [Google Scholar] [CrossRef]
- Mielniczuk, B.; Jebli, M.; Jamin, F.; El Youssoufi, M.S.; Pelissou, C.; Monerie, Y. Characterization of Behavior and Cracking of a Cement Paste Confined between Spherical Aggregate Particles. Cem. Concr. Res. 2016, 79, 235–242. [Google Scholar] [CrossRef] [Green Version]
- Ouyang, X.; Ye, G.; Van Breugel, K. Experimental and Numerical Evaluation of Mechanical Properties of Interface between Filler and Hydration Products. Constr. Build. Mater. 2017, 135, 538–549. [Google Scholar] [CrossRef]
- Wu, K.; Han, H.; Li, H.; Dong, B.; Liu, T.; De Schutter, G. Experimental Study on Concurrent Factors Influencing the Itz Effect on Mass Transport in Concrete. Cem. Concr. Compos. 2021, 123, 104215. [Google Scholar] [CrossRef]
- Jonsson, B.; Nonat, A.; Labbez, C.; Cabane, B.; Wennerström, H. Controlling the Cohesion of Cement Paste. Langmuir 2005, 21, 9211–9221. [Google Scholar] [CrossRef] [PubMed]
- Garrault-Gauffinet, S.; Nonat, A. Experimental Investigation of Calcium Silicate Hydrate (C-S-H) Nucleation. J. Cryst. Growth 1999, 200, 565–574. [Google Scholar] [CrossRef]
- Lavergne, F.; Belhadi, R.; Carriat, J.; Fraj, A.B. Effect of Nano-Silica Particles on the Hydration, the Rheology and the Strength Development of a Blended Cement Paste. Cem. Concr. Compos. 2019, 95, 42–55. [Google Scholar] [CrossRef]


| Name | SiO2 | CaO | Al2O3 | MgO | K2O | Fe2O3 | TiO2 | NaO2 | P2O5 | Loss |
|---|---|---|---|---|---|---|---|---|---|---|
| OPC | 19.15 | 63.05 | 4.62 | 2.06 | 0.70 | 3.80 | 0.40 | 0.35 | 0.55 | 1.7 |
| BP | 42.24 | 0.81 | 33.08 | 0.56 | 1.35 | 19.08 | 1.28 | - | 0.29 | 0.8 |
| QP | 97.5 | - | 1.49 | - | 0.75 | 0.25 | - | - | - | - |
| Mixture | OPC (%) | Basalt Powder (%) | w/b |
|---|---|---|---|
| OPC paste | 100 | - | 0.4 |
| BP paste | 80 | 20 | 0.4 |
| Solution 1 | Solution 2 | Solution 3 | |||
|---|---|---|---|---|---|
| NaOH | pH | Ca(OH)2 | pH | Ca(OH)2 | K2SO4 |
| - | 8 | 0.2 | 9.2 | 0.1 | 10 |
| - | 9 | 0.4 | 9.3 | 0.4 | 10 |
| - | 10 | 0.6 | 9.6 | 1 | 10 |
| - | 11 | 0.8 | 10.1 | 4 | 10 |
| - | 12 | 1 | 10.5 | 8 | 10 |
| - | - | 2 | 10.8 | 10 | 10 |
| - | - | 4 | 10.9 | 15 | 10 |
| - | - | 6 | 11 | 19.6 | 10 |
| - | - | 8 | 11.9 | 0.1 | 50 |
| - | - | 10 | 12 | 0.4 | 50 |
| - | - | 15 | 12.2 | 1 | 50 |
| - | - | 20 | 12.3 | 4 | 50 |
| - | - | - | - | 8 | 50 |
| - | - | - | - | 10 | 50 |
| - | - | - | - | 15 | 50 |
| - | - | - | - | 18 | 50 |
Publisher’s Note: MDPI stays neutral with regard to jurisdictional claims in published maps and institutional affiliations. |
© 2022 by the authors. Licensee MDPI, Basel, Switzerland. This article is an open access article distributed under the terms and conditions of the Creative Commons Attribution (CC BY) license (https://creativecommons.org/licenses/by/4.0/).
Share and Cite
Li, J.; Che, D.; Liu, Z.; Yu, L.; Ouyang, X. Effect of Basalt Powder on Hydration, Rheology, and Strength Development of Cement Paste. Materials 2022, 15, 8632. https://doi.org/10.3390/ma15238632
Li J, Che D, Liu Z, Yu L, Ouyang X. Effect of Basalt Powder on Hydration, Rheology, and Strength Development of Cement Paste. Materials. 2022; 15(23):8632. https://doi.org/10.3390/ma15238632
Chicago/Turabian StyleLi, Jiaming, Dehao Che, Zhihao Liu, Lan Yu, and Xiaowei Ouyang. 2022. "Effect of Basalt Powder on Hydration, Rheology, and Strength Development of Cement Paste" Materials 15, no. 23: 8632. https://doi.org/10.3390/ma15238632