
Particle Characterization of Manufactured Sand and Its Influence on Concrete Properties

Abstract
:1. Introduction
2. Materials and Methods
2.1. Raw Materials
2.2. Method for Measuring Particle Characterization
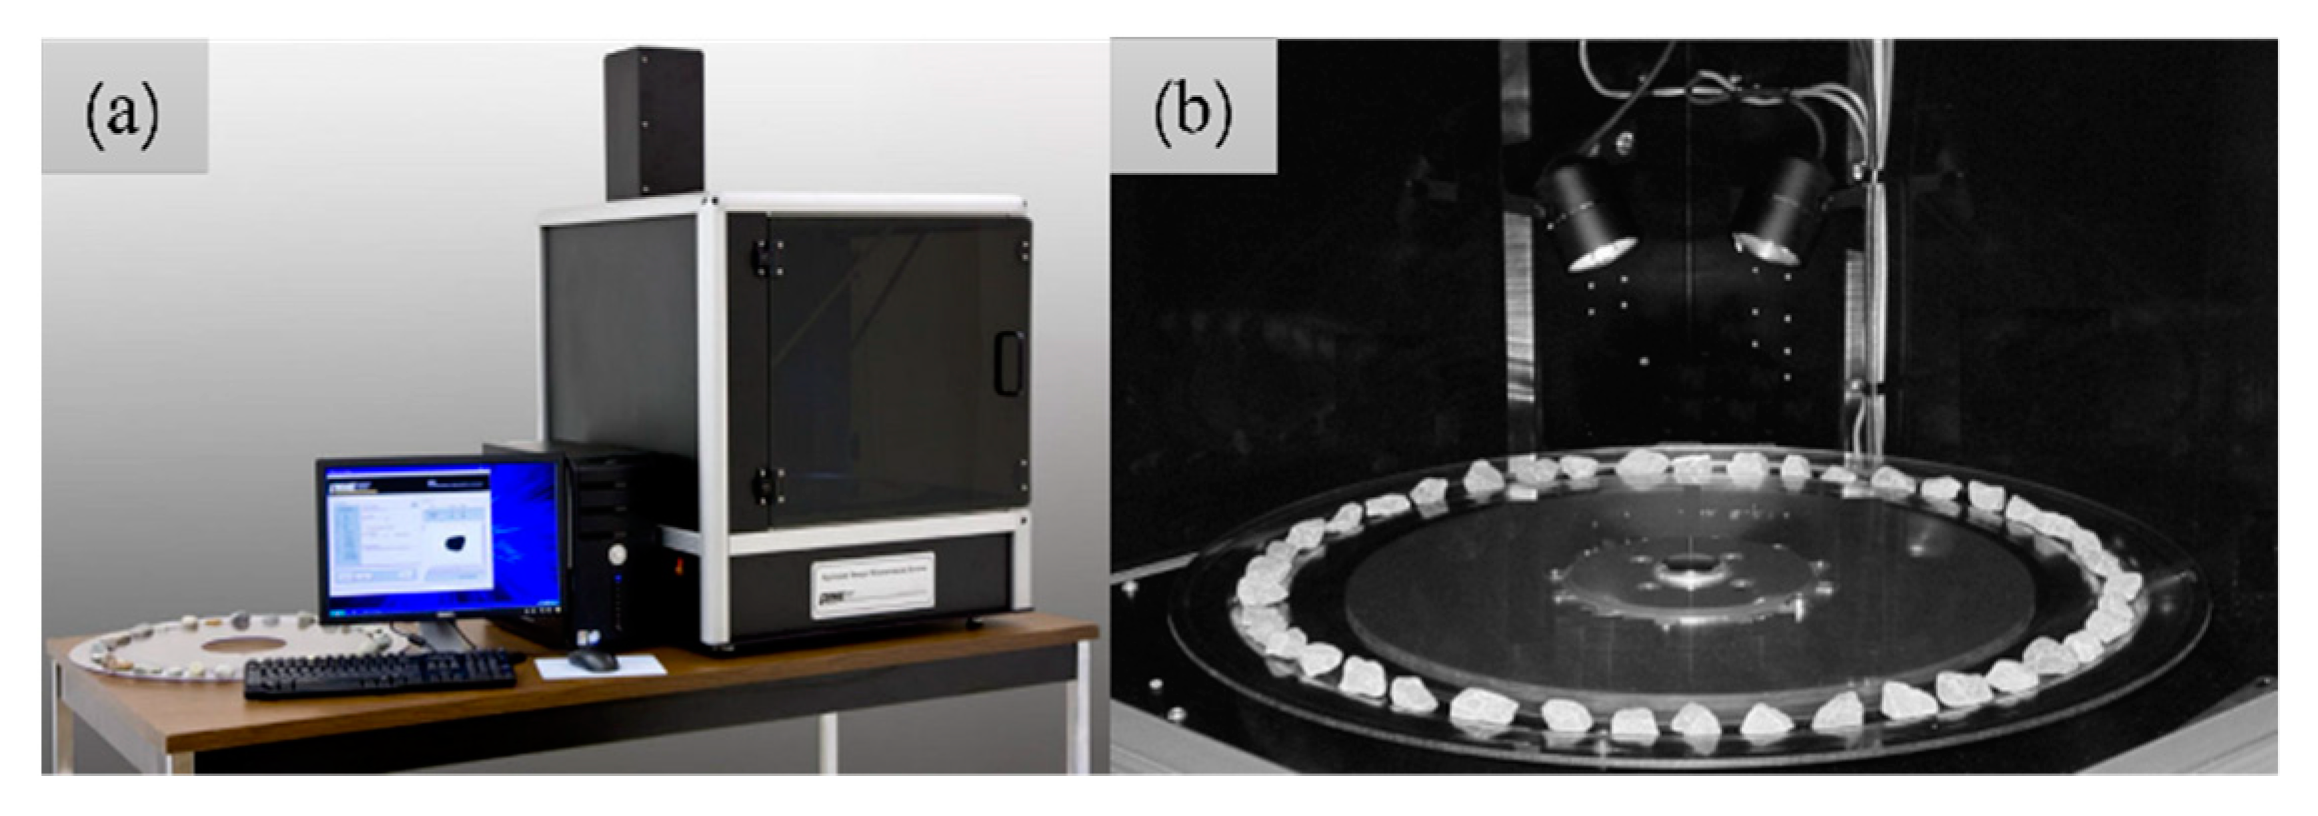
2.2.1. AIMS
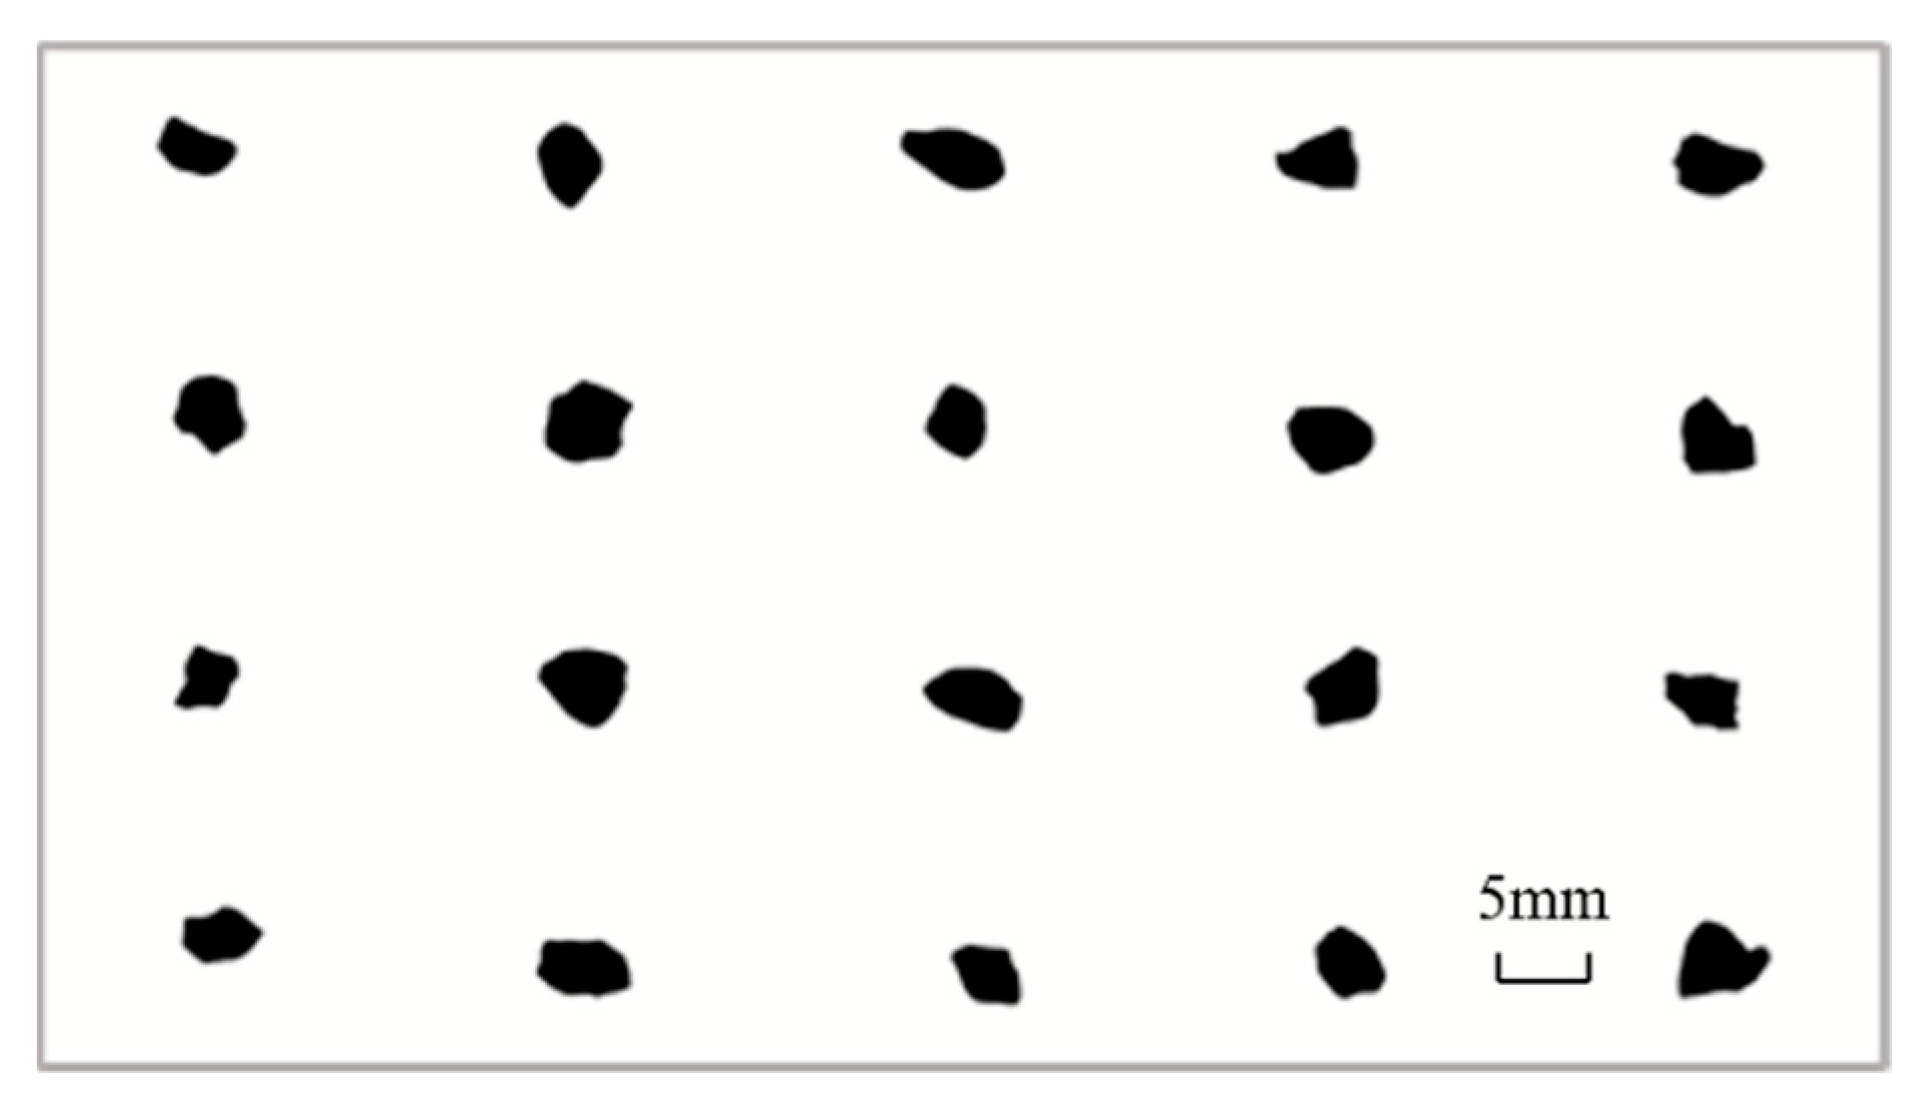
2.2.2. DIP
- (a)
- After sieving the manufactured sand, clean and dry the particles within the range of 2.36–4.75 mm.
- (b)
- Put the particles on the frame in three different stable placement forms, and take photos from different directions according to needs.
- (c)
- Use Photoshop software to binarize each image.
- (d)
- Analyze each binary image by using Image Pro Plus to obtain five particle shape parameters, such as aspect, convexity, regularity, roundness, and fractal dimension.
2.3. Testing of Concrete Performance
3. Testing of Particle Shape Characteristics and Correlation between Shape Parameters
3.1. Particle Shape Parameters Obtained by Using AIMS
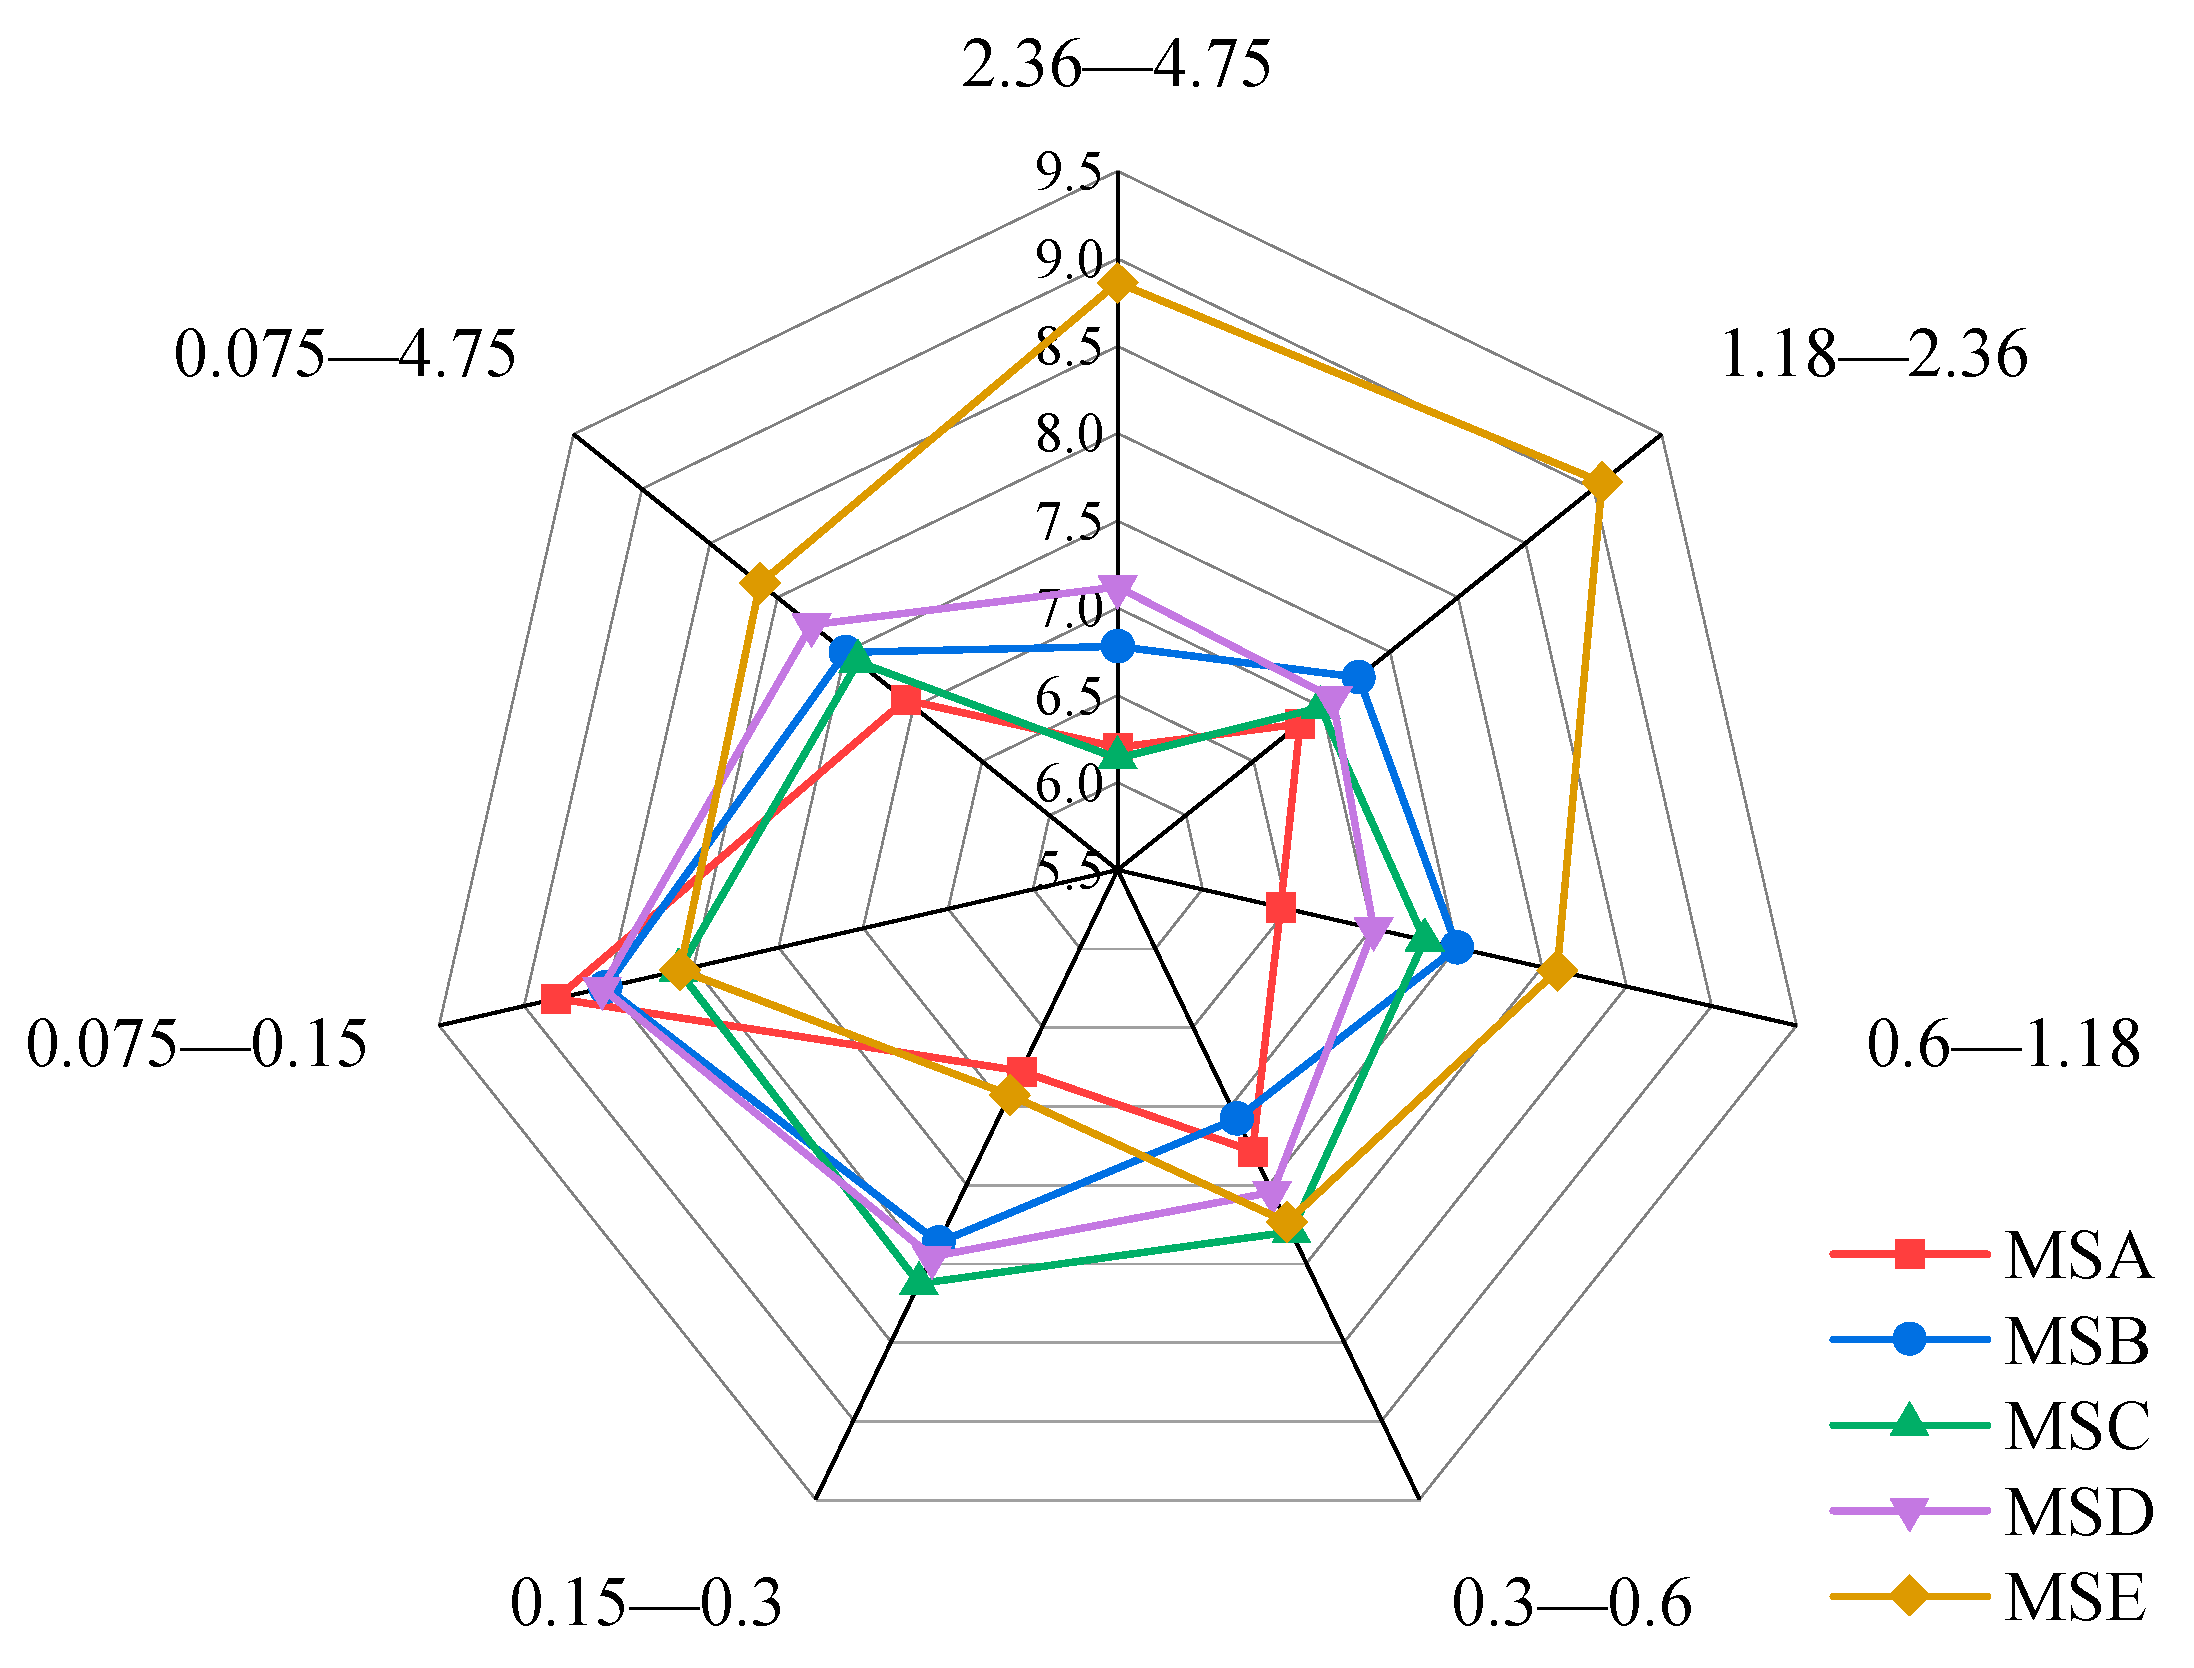
3.1.1. Angularity
3.1.2. Form2D
3.2. Particle Shape Parameters Obtained by Using DIP
4. Analysis of the Relationship between Particle Characterization of Manufactured Sand and Concrete Performance
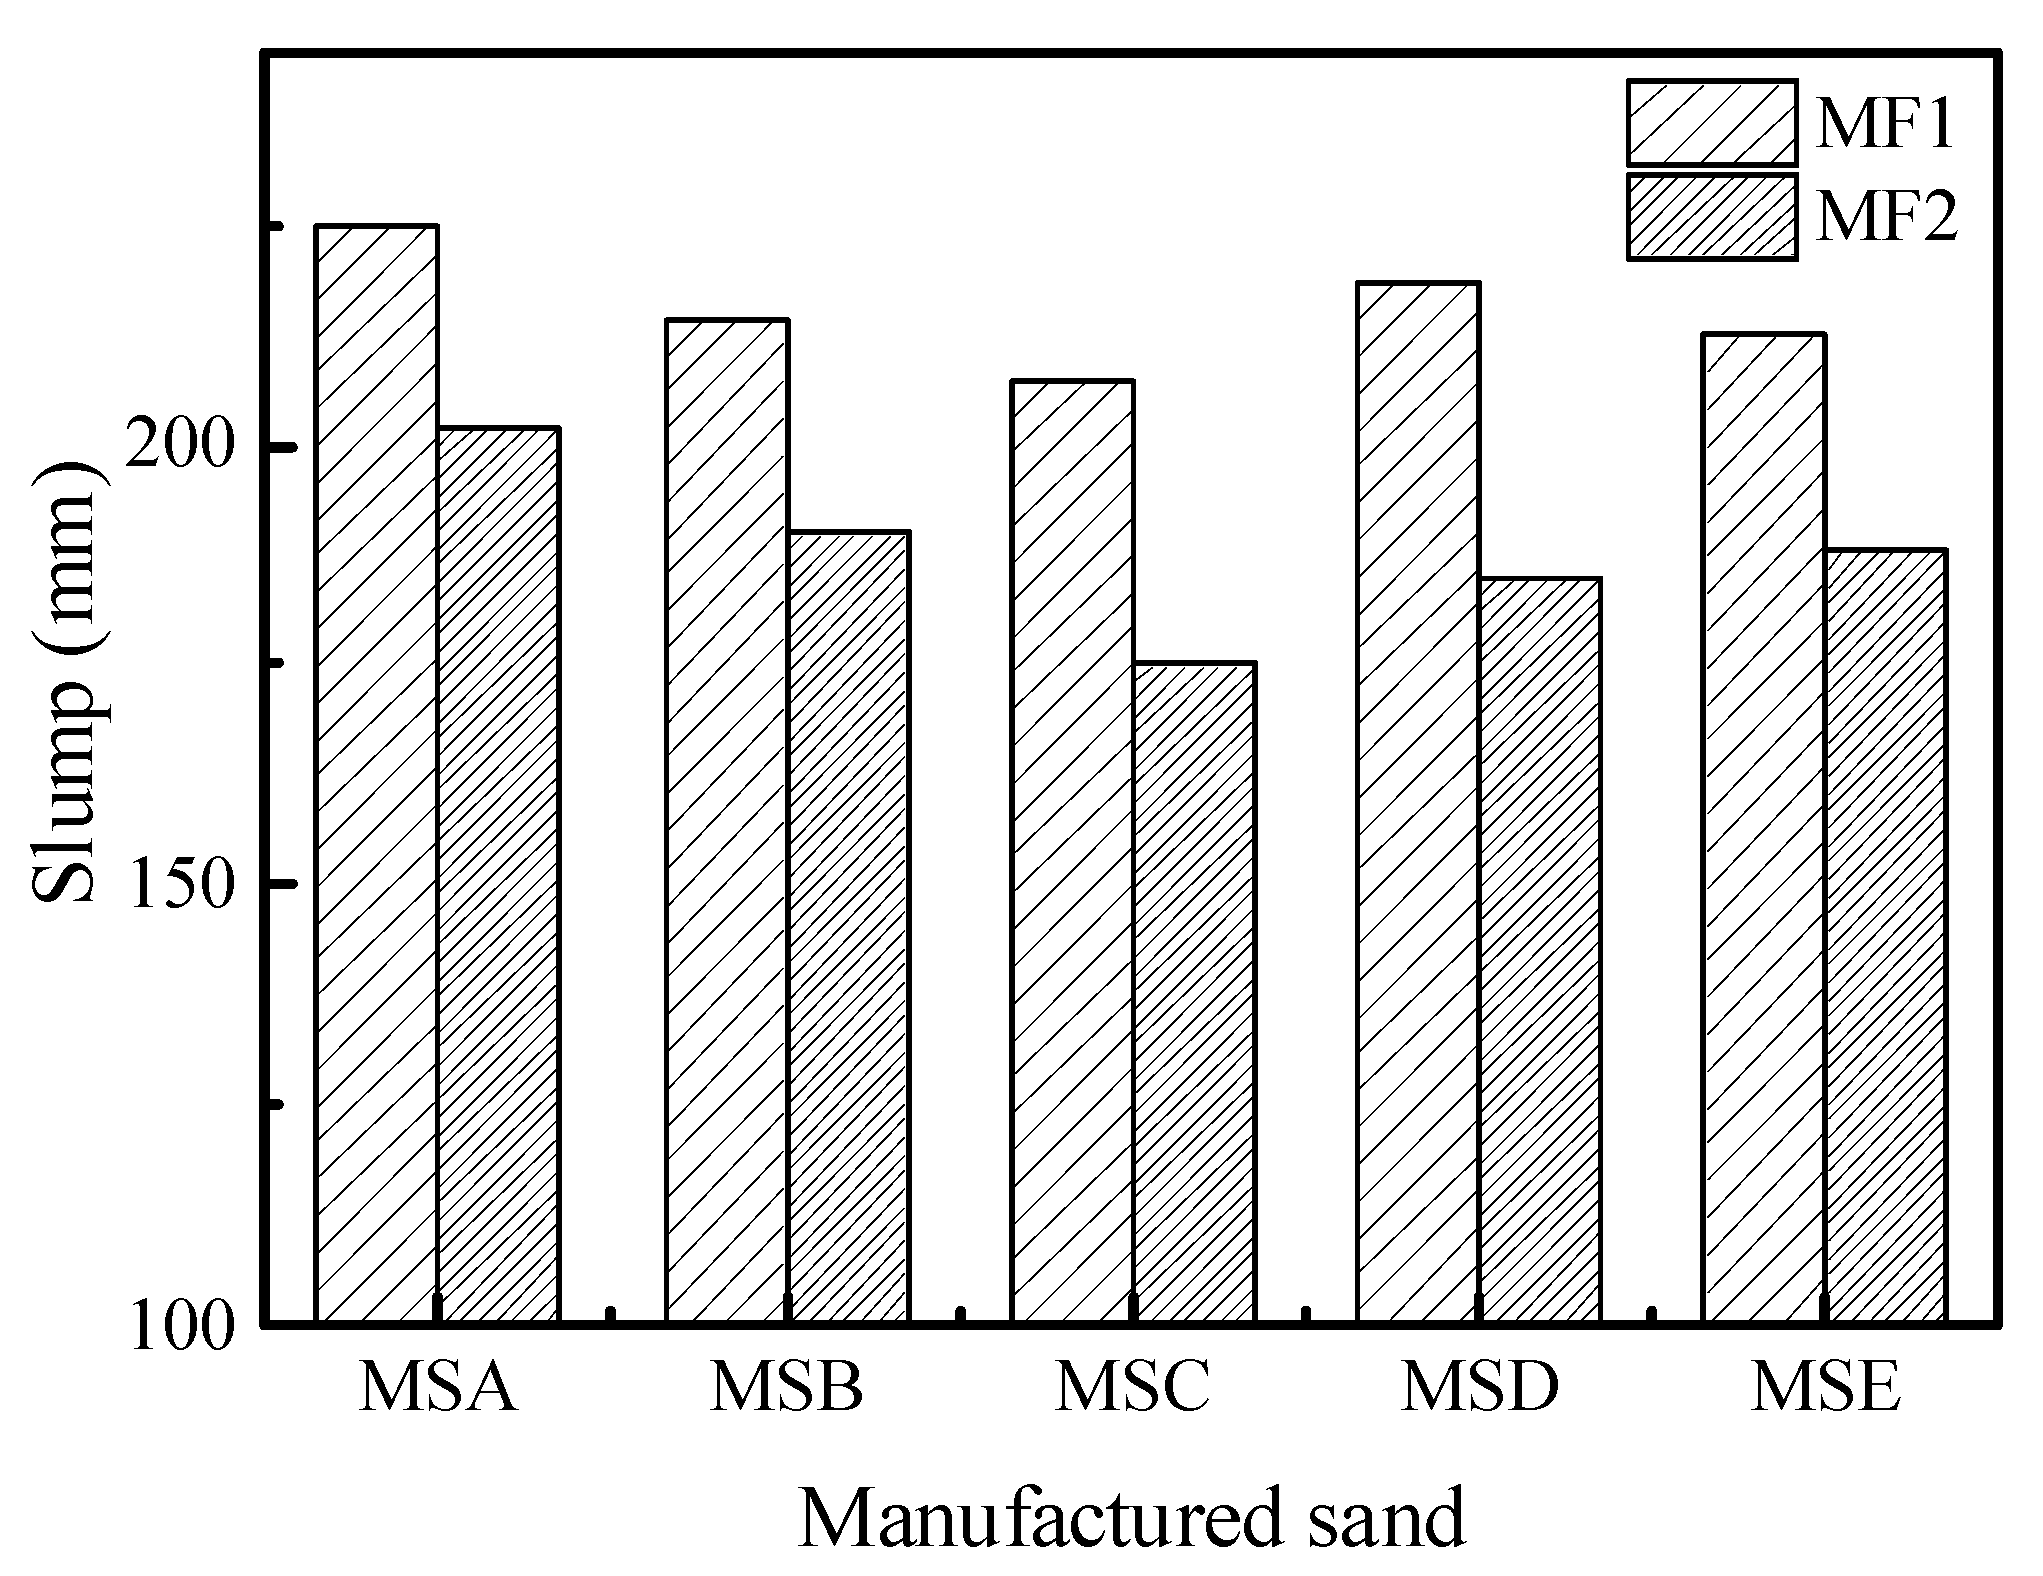
4.1. Workability of Concrete and Its Relationship with Particle Shape Parameters
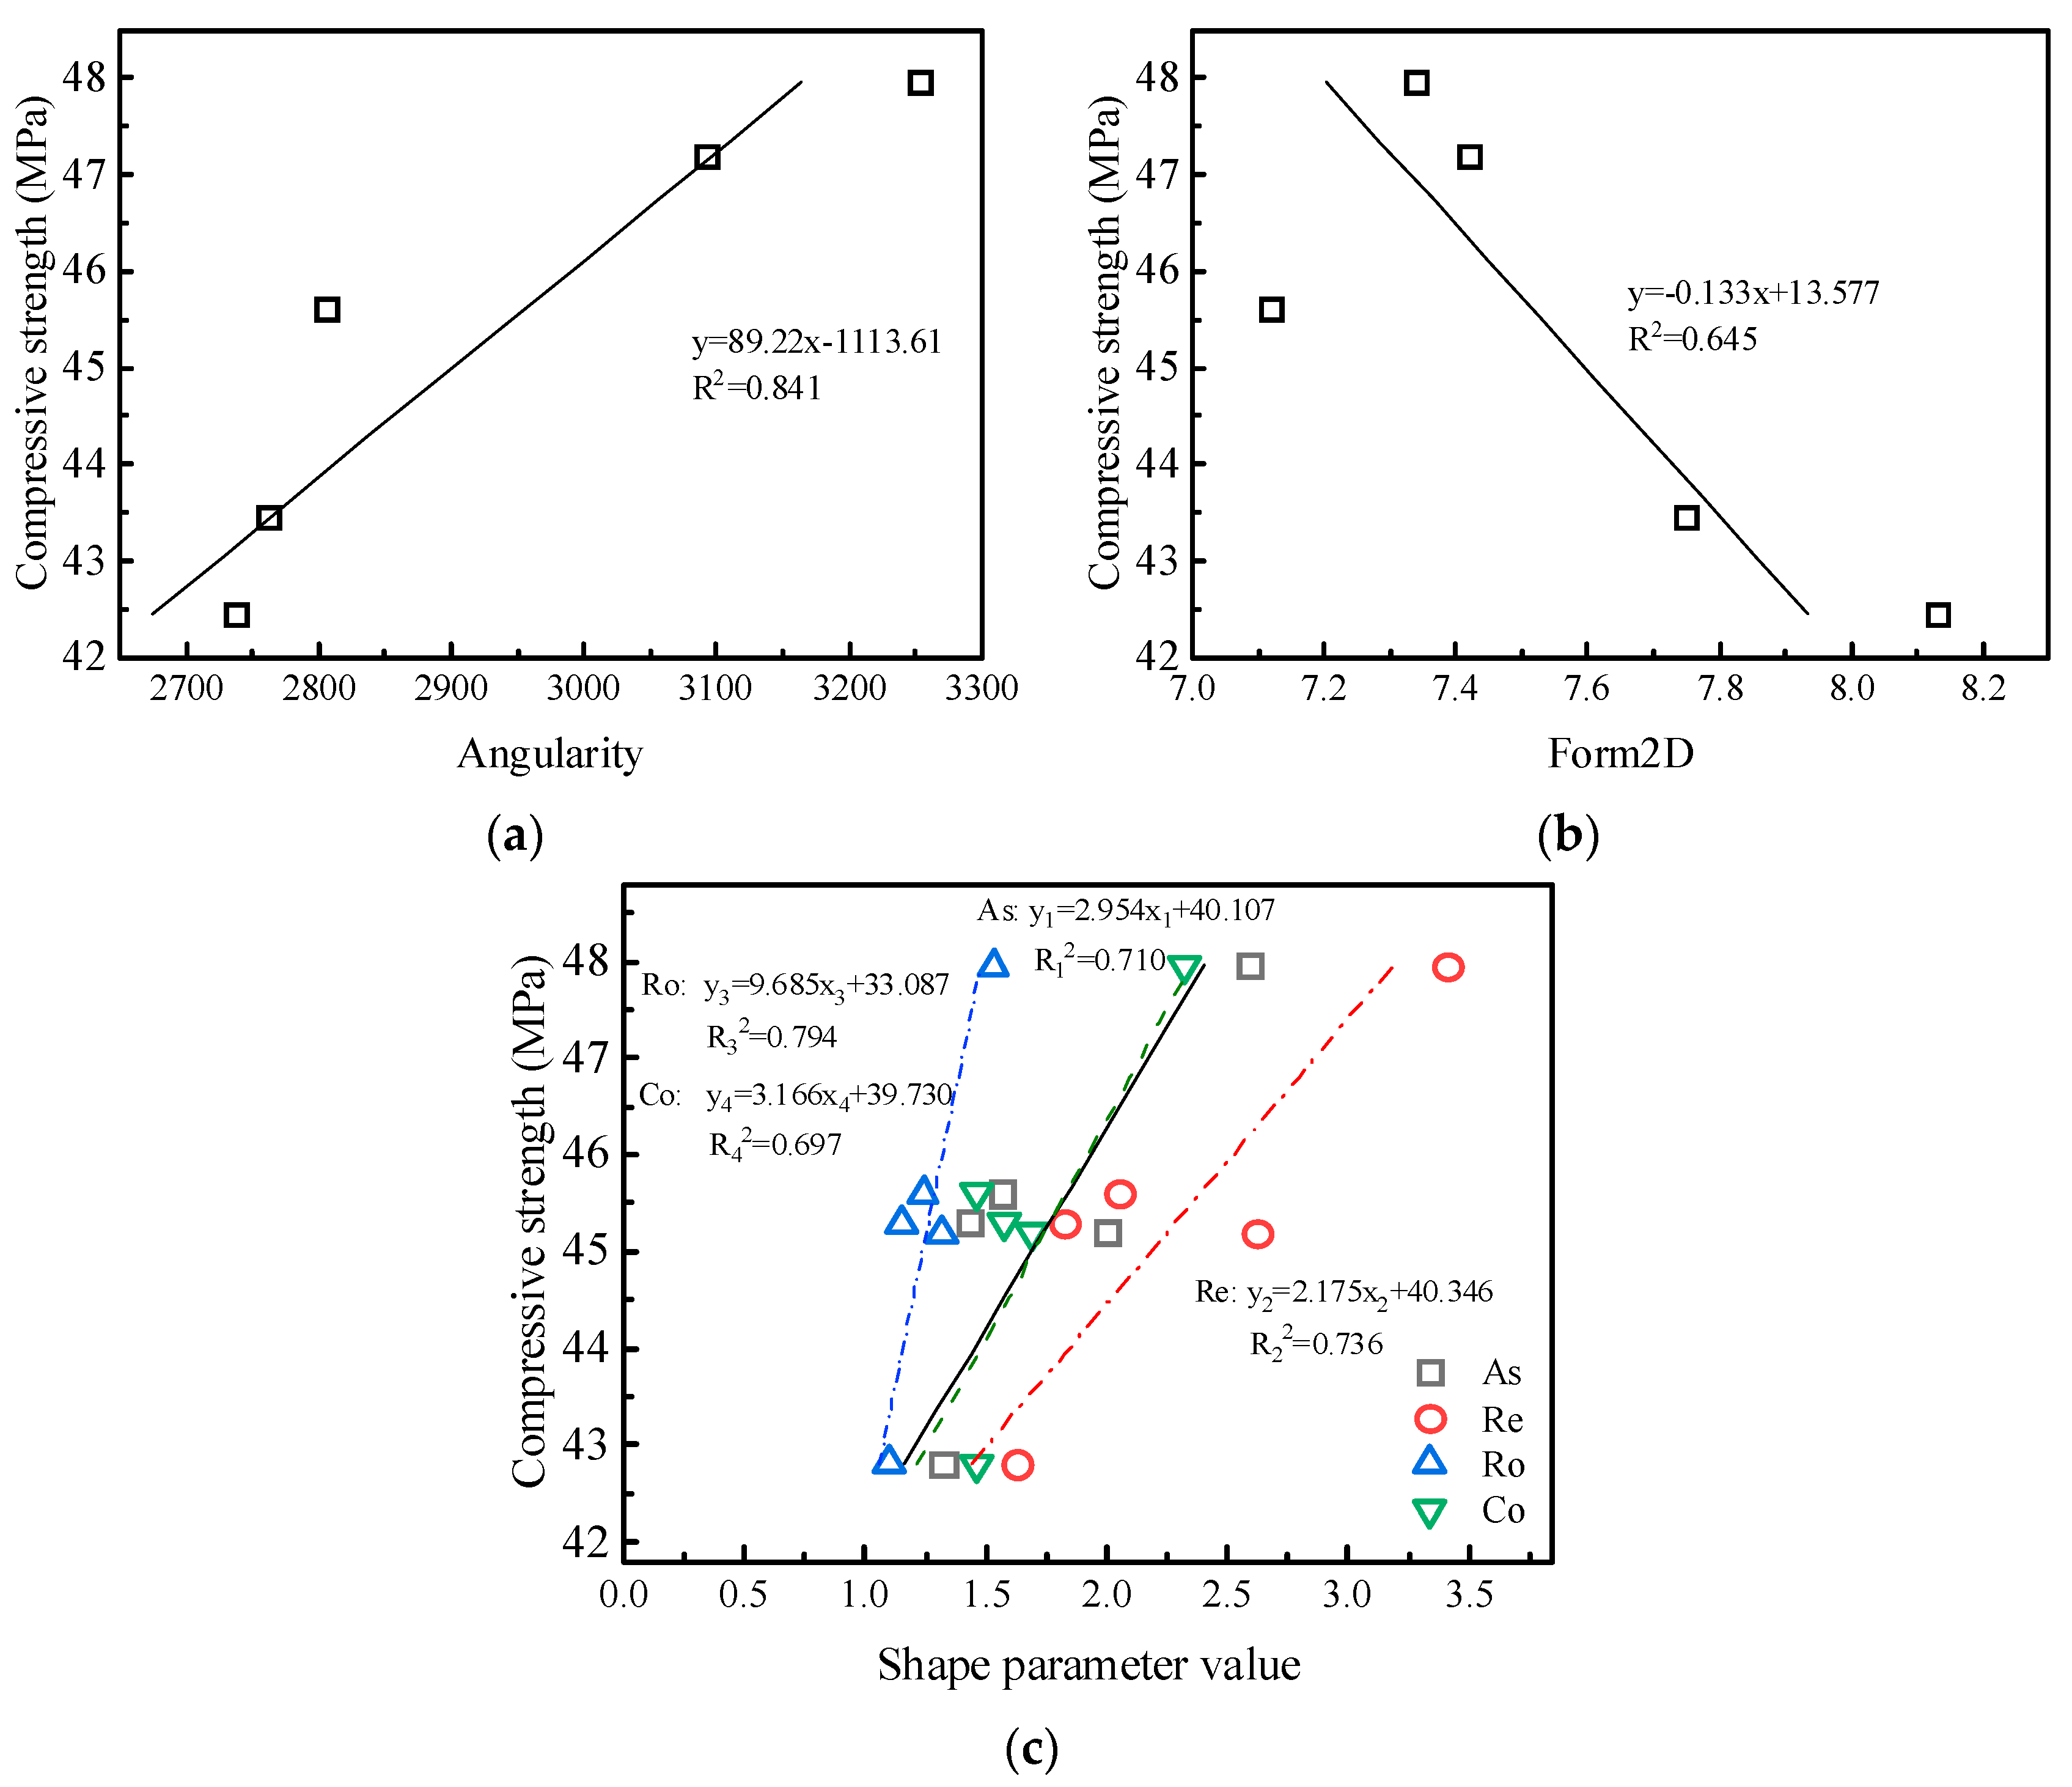
4.2. Mechanical Properties of Concrete and Concrete’s Relationship with Particle Shape Parameters
4.3. Durability Performance of Concrete and Its Relationship with Particle Shape Parameters
4.4. Influence of Manufactured Sand Shape on Drying Shrinkage of Concrete
5. Conclusions
- The type and particle size of manufactured sand have a significant impact on angularity and form2D. With a range of particle size from large to small, the angularity of manufactured sand increases first and then decreases, while the form2D value has no apparent rules. An angularity within the 0.3–0.6 mm grain size can reflect the mean angularity of the whole grain size of manufactured sand.
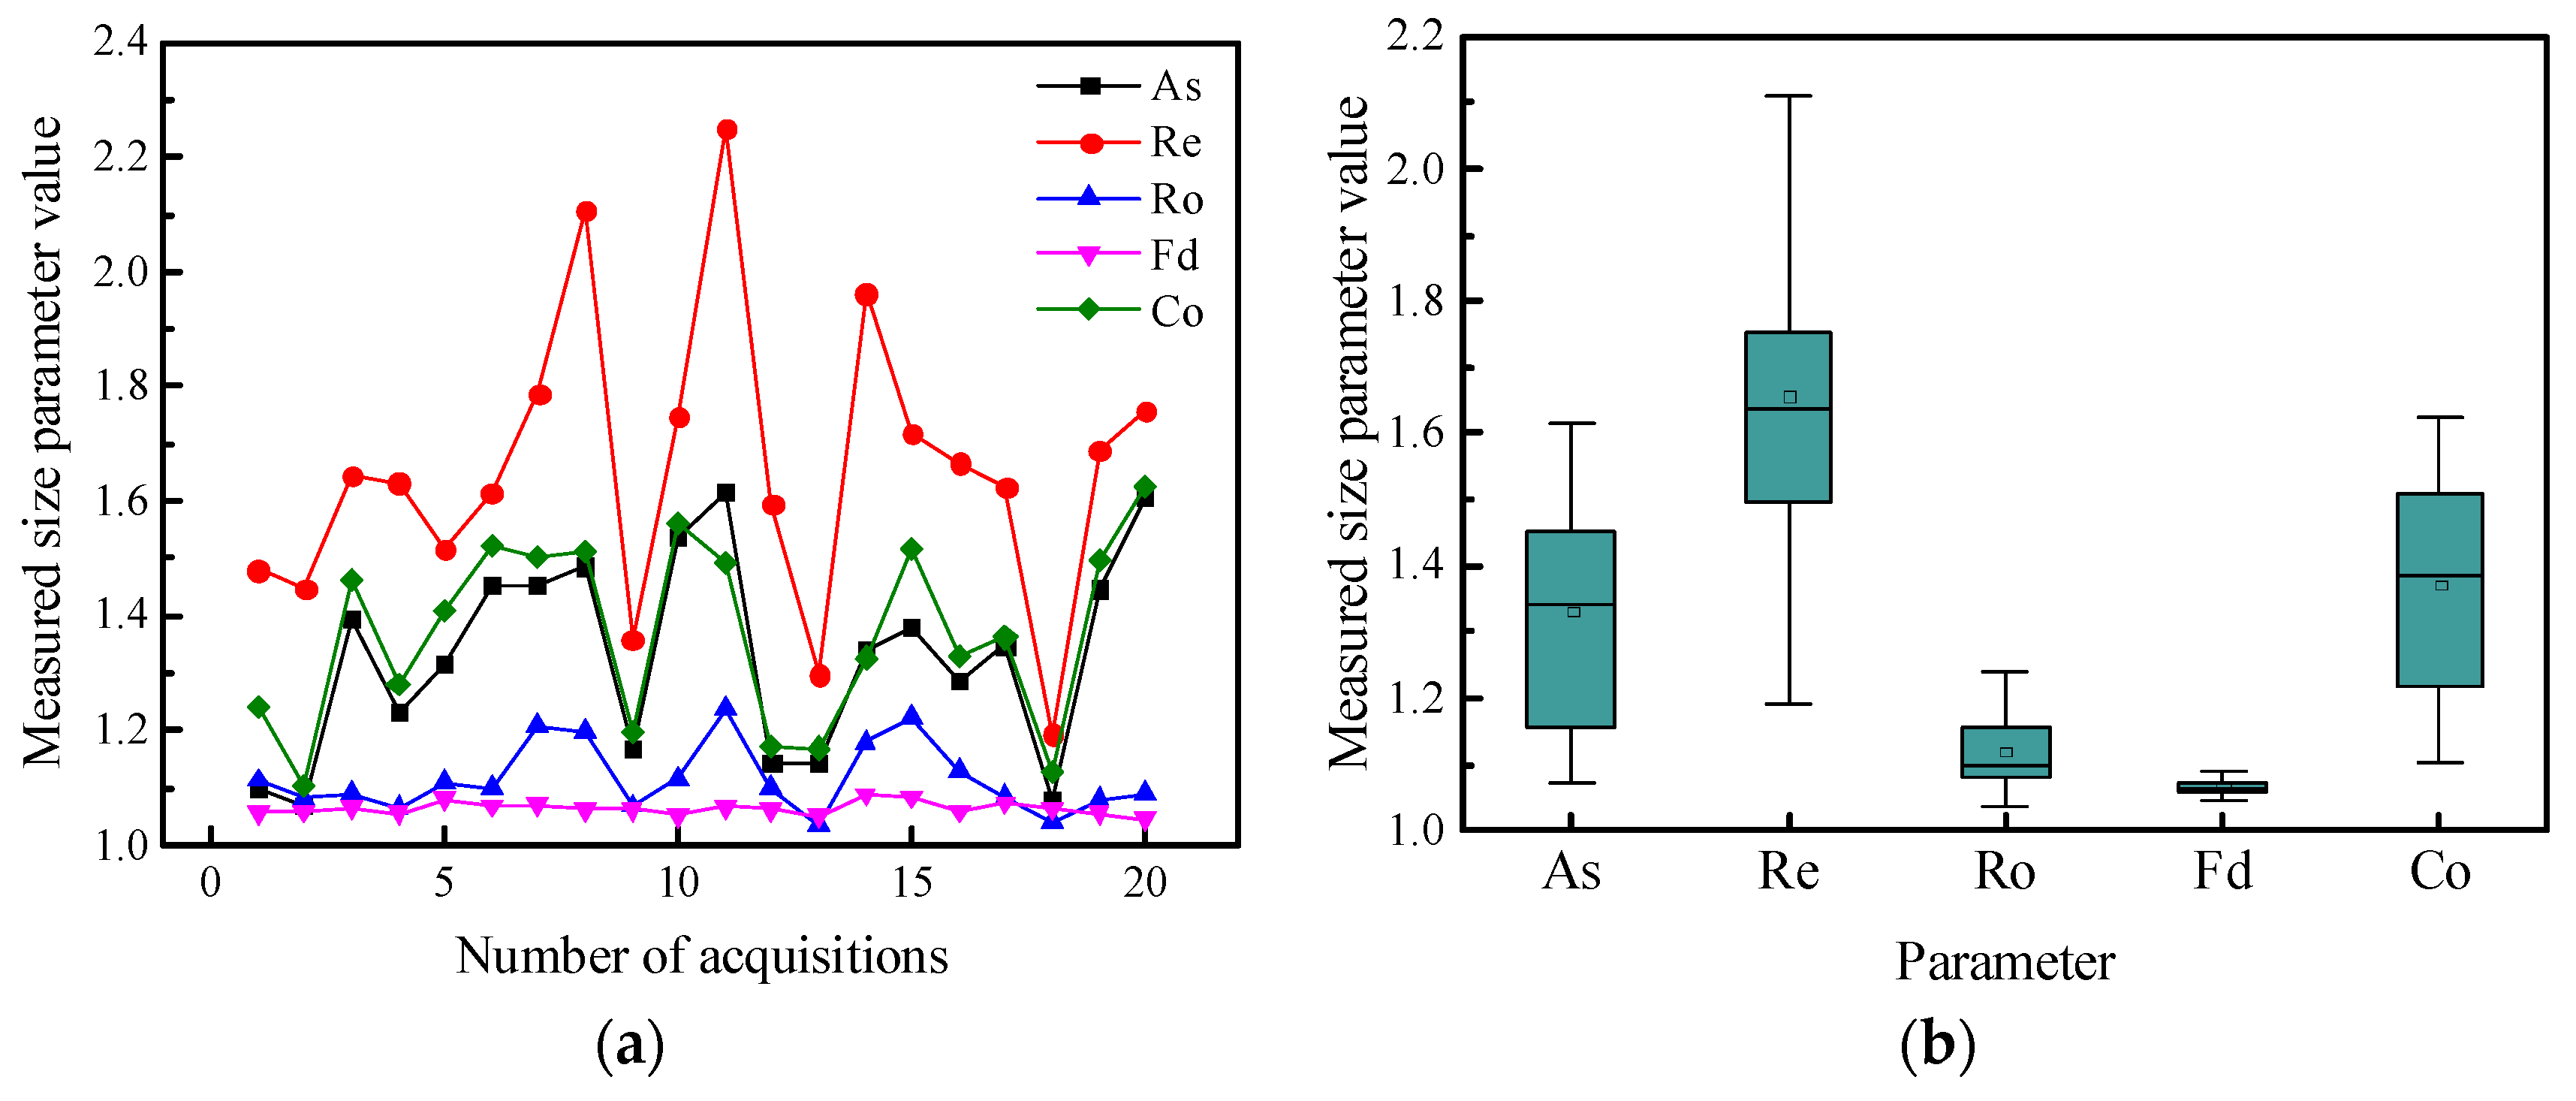
- The particle shape parameters obtained by using image processing with a single projection have an extensive fluctuation range, so it is impossible to accurately judge the particle shape of manufactured sand. More accurate particle shape parameters can be obtained by increasing the number and direction of the projection. There is an obvious linear relationship between the aspect and convexity with an R2 value of 0.913, while fractal dimension does not correlate with the other parameters.
- Under the two mix proportions, concrete with MSA has the best working performance, and MSC has the highest strength and the worst durability. The negative effects of particle shape can be effectively reduced by adjusting the water to cement ratio or the amount of cementitious material as required.
- The particle shape parameters have good correlations with the slump and compressive strength of concrete, and the correlations of angularity with the slump and compressive strength are the highest, which are 0.802 and 0.841, respectively. The shape of manufactured sand has little effect on the durability of concrete.
- The particle shape characteristics of manufactured sand have a significant impact on the performance of concrete. An accurate characterization of the grain shape of manufactured sand will be helpful for on-site construction, saving raw materials, and reducing the generation of solid wastes. Therefore, it is necessary to incorporate a particle shape evaluation into the aggregate standard.
Author Contributions
Funding
Institutional Review Board Statement
Informed Consent Statement
Data Availability Statement
Conflicts of Interest
References
- DeRousseau, M.A.; Kasprzyk, J.R.; Srubar, W.V. Computational Design Optimization of Concrete Mixtures: A Review. Cem. Concr. Res. 2018, 109, 42–53. [Google Scholar] [CrossRef]
- Xu, W.; Wen, X.; Wei, J.; Xu, P.; Zhang, B.; Yu, Q.; Ma, H. Feasibility of Kaolin Tailing Sand to Be as an Environmentally Friendly Alternative to River Sand in Construction Applications. J. Clean. Prod. 2018, 205, 1114–1126. [Google Scholar] [CrossRef]
- Zheng, X.; Liu, H.; You, S.; Easa, S.; Cheng, K.; Chen, Z.; Ji, T. Cracking Resistance and Sustainability Assessment of Alkali-Activated Slag Concrete Incorporating Lightweight Aggregate. Cem. Concr. Compos. 2022, 131, 104556. [Google Scholar] [CrossRef]
- Dimitriou, G.; Savva, P.; Petrou, M.F. Enhancing Mechanical and Durability Properties of Recycled Aggregate Concrete. Constr. Build. Mater. 2018, 158, 228–235. [Google Scholar] [CrossRef]
- Koehnken, L.; Rintoul, M.S.; Goichot, M.; Tickner, D.; Loftus, A.C.; Acreman, M.C. Impacts of Riverine Sand Mining on Freshwater Ecosystems: A Review of the Scientific Evidence and Guidance for Future Research. River Res. Appl. 2020, 36, 362–370. [Google Scholar] [CrossRef]
- Torres, A.; Brandt, J.; Lear, K.; Liu, J. A Looming Tragedy of the Sand Commons. Science 2017, 357, 970–971. [Google Scholar] [CrossRef]
- Zhu, J.; Shu, X.; Tang, J.; Li, T.; Ran, Q.; Liu, J. Effect of Microfines from Manufactured Sand on Yield Stress of Cement Paste. Constr. Build. Mater. 2021, 267, 120987. [Google Scholar] [CrossRef]
- Bendixen, M.; Best, J.; Hackney, C.; Iversen, L.L. Time Is Running out for Sand. Nature 2019, 571, 29–31. [Google Scholar] [CrossRef]
- Best, J. Anthropogenic Stresses on the World’s Big Rivers. Nat. Geosci. 2019, 12, 148. [Google Scholar] [CrossRef]
- Cepuritis, R.; Wigum, B.J.; Garboczi, E.J.; Mørtsell, E.; Jacobsen, S. Filler from Crushed Aggregate for Concrete: Pore Structure, Specific Surface, Particle Shape and Size Distribution. Cem. Concr. Compos. 2014, 54, 2–16. [Google Scholar] [CrossRef]
- Estephane, P.; Garboczi, E.J.; Bullard, J.W.; Wallevik, Ó.H. Using Fine Sand Shape Metrics Determined from X-Ray Microcomputed Tomography to Illustrate the Influence of Particle Shape on the Properties of Dispersed Mortars. Cem. Concr. Compos. 2021, 123, 104176. [Google Scholar] [CrossRef]
- Shen, W.; Liu, Y.; Wang, Z.; Cao, L.; Wu, D.; Wang, Y.; Ji, X. Influence of Manufactured Sand’s Characteristics on Its Concrete Performance. Constr. Build. Mater. 2018, 172, 574–583. [Google Scholar] [CrossRef]
- Cepuritis, R.; Garboczi, E.J.; Ferraris, C.F.; Jacobsen, S.; Sørensen, B.E. Measurement of Particle Size Distribution and Specific Surface Area for Crushed Concrete Aggregate Fines. Adv. Powder Technol. 2017, 28, 706–720. [Google Scholar] [CrossRef] [Green Version]
- Hafid, H.; Ovarlez, G.; Toussaint, F.; Jezequel, P.H.; Roussel, N. Effect of Particle Morphological Parameters on Sand Grains Packing Properties and Rheology of Model Mortars. Cem. Concr. Res. 2016, 80, 44–51. [Google Scholar] [CrossRef]
- Kirthika, S.K.; Singh, S.K.; Chourasia, A. Alternative Fine Aggregates in Production of Sustainable Concrete—A Review. J. Clean. Prod. 2020, 268, 122089. [Google Scholar] [CrossRef]
- Xiao, J.; Qiang, C.; Nanni, A.; Zhang, K. Use of Sea-Sand and Seawater in Concrete Construction: Current Status and Future Opportunities. Constr. Build. Mater. 2017, 155, 1101–1111. [Google Scholar] [CrossRef]
- Erdoǧan, S.T.; Nie, X.; Stutzman, P.E.; Garboczi, E.J. Micrometer-Scale 3-D Shape Characterization of Eight Cements: Particle Shape and Cement Chemistry, and the Effect of Particle Shape on Laser Diffraction Particle Size Measurement. Cem. Concr. Res. 2010, 40, 731–739. [Google Scholar] [CrossRef]
- Ueno, A.; Ogawa, Y. Influence of Coarse Aggregate Shape on Optimum Fine to Total Aggregate Ratio Using a Virtual Voids-Ratio Diagram in Concrete Compaction. Cem. Concr. Compos. 2020, 106, 103463. [Google Scholar] [CrossRef]
- Garboczi, E.J.; Bullard, J.W. 3D Analytical Mathematical Models of Random Star-Shape Particles via a Combination of X-Ray Computed Microtomography and Spherical Harmonic Analysis. Adv. Powder Technol. 2017, 28, 325–339. [Google Scholar] [CrossRef] [Green Version]
- Ruan, X.; Li, Y.; Jin, Z.; Pan, Z.; Yin, Z. Modeling Method of Concrete Material at Mesoscale with Refined Aggregate Shapes Based on Image Recognition. Constr. Build. Mater. 2019, 204, 562–575. [Google Scholar] [CrossRef]
- Kuang, D.; Zhang, B.; Jiao, Y.; Fang, J.; Chen, H.; Wang, L. Impact of Particle Morphology on Aggregate-Asphalt Interface Behavior. Constr. Build. Mater. 2017, 132, 142–149. [Google Scholar] [CrossRef]
- Shen, W.; Yang, Z.; Cao, L.; Cao, L.; Liu, Y.; Yang, H.; Lu, Z.; Bai, J. Characterization of Manufactured Sand: Particle Shape, Surface Texture and Behavior in Concrete. Constr. Build. Mater. 2016, 114, 595–601. [Google Scholar] [CrossRef]
- Miller, N.A.; Henderson, J.J. Quantifying Sand Particle Shape Complexity Using a Dynamic, Digital Imaging Technique. Agron. J. 2010, 102, 1407–1414. [Google Scholar] [CrossRef]
- Cui, P.; Xiao, Y.; Yan, B.; Li, M.; Wu, S. Morphological Characteristics of Aggregates and Their Influence on the Performance of Asphalt Mixture. Constr. Build. Mater. 2018, 186, 303–312. [Google Scholar] [CrossRef]
- Wang, F.; Xiao, Y.; Chen, Z.; Cui, P.; Liu, J.; Wang, N. Morphological Characteristics of Mineral Filler and Their Influence on Active Adhesion between Aggregates and Bitumen. Constr. Build. Mater. 2022, 323, 126520. [Google Scholar] [CrossRef]
- Johansson, R.; Evertsson, M. CFD Simulation of a Centrifugal Air Classifier Used in the Aggregate Industry. Miner. Eng. 2014, 63, 149–156. [Google Scholar] [CrossRef]
- Erdoǧan, S.T.; Garboczi, E.J.; Fowler, D.W. Shape and Size of Microfine Aggregates: X-Ray Microcomputed Tomography vs. Laser Diffraction. Powder Technol. 2007, 177, 53–63. [Google Scholar] [CrossRef]
- Bagheri, G.H.; Bonadonna, C.; Manzella, I.; Vonlanthen, P. On the Characterization of Size and Shape of Irregular Particles. Powder Technol. 2015, 270, 141–153. [Google Scholar] [CrossRef]
- Estephane, P.; Garboczi, E.J.; Bullard, J.W.; Wallevik, O.H. Three-Dimensional Shape Characterization of Fine Sands and the Influence of Particle Shape on the Packing and Workability of Mortars. Cem. Concr. Compos. 2019, 97, 125–142. [Google Scholar] [CrossRef]
- Cepuritis, R.; Jacobsen, S.; Pedersen, B.; Mørtsell, E. Crushed Sand in Concrete-Effect of Particle Shape in Different Fractions and Filler Properties on Rheology. Cem. Concr. Compos. 2016, 71, 26–41. [Google Scholar] [CrossRef]
- Blott, S.J.; Pye, K. Particle Shape: A Review and New Methods of Characterization and Classification. Sedimentology 2008, 55, 31–63. [Google Scholar] [CrossRef]
- Yamei, H.; Lihua, W. Effect of Particle Shape of Limestone Manufactured Sand and Natural Sand on Concrete. Procedia Eng. 2017, 210, 87–92. [Google Scholar] [CrossRef]
- Prakash, R.; Thenmozhi, R.; Raman, S.N.; Subramanian, C.; Divyah, N. An Investigation of Key Mechanical and Durability Properties of Coconut Shell Concrete with Partial Replacement of Fly Ash. Struct. Concr. 2021, 22, E985–E996. [Google Scholar] [CrossRef]


| Property | Measured Value |
|---|---|
| Apparent density (kg/m3) | 3120 |
| Initial setting time (min) | 135 |
| Final setting time (min) | 195 |
| Soundness | Qualified |
| 3d Compressive strength (MPa) | 27.9 |
| 28d Compressive strength (MPa) | 52.7 |
| 3d Flexural strength (MPa) | 6.8 |
| 28d Flexural strength (MPa) | 9.6 |
| Chemical Composition | P·O 42.5 | Fly Ash | Stone Powder |
|---|---|---|---|
| CaO | 59.55 | 4.04 | 39.83 |
| SiO2 | 21.43 | 3.81 | 16.47 |
| Al2O3 | 5.84 | 47.12 | 0.81 |
| Fe2O3 | 4.13 | 33.11 | 0.52 |
| MgO | 3.21 | 0.61 | 4.76 |
| SO3 | 2.16 | 1.44 | 0.12 |
| Loss | 2.39 | 2.98 | 37.41 |
| Category | Tap Bulk Density (kg/m3) | Void Ratio (%) | Mass Content | Crushed Value (%) | MBV (g/kg) |
|---|---|---|---|---|---|
| MSA | 1664.3 | 41.55 | 12.84 | 10.85 | 0.50 |
| MSB | 1613.8 | 42.58 | 13.46 | 11.45 | 0.50 |
| MSC | 1516.3 | 45.69 | 14.62 | 14.52 | 1.50 |
| MSD | 1587.6 | 41.96 | 15.82 | 12.58 | 1.00 |
| MSE | 1579.8 | 43.78 | 11.46 | 11.93 | 0.50 |
| Notation | Cement | Fly Ash | Re-Crushed Stone | Manufactured Sand | Water | Superplasticizer |
|---|---|---|---|---|---|---|
| MF1 | 312.56 | 78.14 | 1086.37 | 754.93 | 168.46 | 3.9072 |
| MF2 | 411.25 | 102.81 | 981.22 | 740.22 | 164.52 | 5.1663 |
Publisher’s Note: MDPI stays neutral with regard to jurisdictional claims in published maps and institutional affiliations. |
© 2022 by the authors. Licensee MDPI, Basel, Switzerland. This article is an open access article distributed under the terms and conditions of the Creative Commons Attribution (CC BY) license (https://creativecommons.org/licenses/by/4.0/).
Share and Cite
Wu, J.; Shen, W.; Zhao, D.; Wu, M.; Yu, Z.; Zhao, Z.; Li, Z.; Wu, D.; Sun, J. Particle Characterization of Manufactured Sand and Its Influence on Concrete Properties. Materials 2022, 15, 4593. https://doi.org/10.3390/ma15134593
Wu J, Shen W, Zhao D, Wu M, Yu Z, Zhao Z, Li Z, Wu D, Sun J. Particle Characterization of Manufactured Sand and Its Influence on Concrete Properties. Materials. 2022; 15(13):4593. https://doi.org/10.3390/ma15134593
Chicago/Turabian StyleWu, Jiale, Weiguo Shen, Deqiang Zhao, Miaomiao Wu, Zhen Yu, Zhicheng Zhao, Zhitang Li, Dinglve Wu, and Jiangtao Sun. 2022. "Particle Characterization of Manufactured Sand and Its Influence on Concrete Properties" Materials 15, no. 13: 4593. https://doi.org/10.3390/ma15134593