
Some Thermomagnetic and Mechanical Properties of Amorphous Fe75Zr4Ti3Cu1B17 Ribbons


Abstract
:1. Introduction
2. Materials and Methods
3. Results and Discussion
4. Conclusions
Author Contributions
Funding
Institutional Review Board Statement
Informed Consent Statement
Data Availability Statement
Conflicts of Interest
References
- Brück, E. Developments in magnetocaloric refrigeration. J. Phys. D Appl. Phys. 2005, 38, R381–R391. [Google Scholar] [CrossRef]
- Sanderman, K.G. Magnetocaloric materials: The search for new systems. Scr. Mater. 2012, 67, 566–571. [Google Scholar] [CrossRef] [Green Version]
- Franco, V.; Blázquez, J.S.; Ipus, J.J.; Law, J.Y.; Moreno-Ramirez, L.M.; Conde, A. Magnetocaloric effect: From materials research to refrigeration devices. Prog. Mater. Sci. 2018, 93, 112–232. [Google Scholar] [CrossRef]
- Álvarez, P.; Gorria, P.; Sánchez Llamazares, J.L.; Blanco, J.A. Searching the conditions for a table-like shape of the magnetic entropy in magneto-caloric materials. J. Alloys Compd. 2013, 568, 98–101. [Google Scholar] [CrossRef]
- Świerczek, J.; Hasiak, M. Microstructure and magnetic entropy change in amorphous Fe76Mo10Cu1B13 alloy. IEEE Trans. Magn. 2014, 50, 2003504. [Google Scholar] [CrossRef]
- Franco, V.; Blázquez, J.S.; Millán, M.; Borrego, J.M.; Conde, C.F.; Conde, A. The magnetocaloric effect in soft magnetic amorphous alloys. J. Appl. Phys. 2007, 101, 09C503. [Google Scholar] [CrossRef] [Green Version]
- Kiss, L.F.; Kemény, T.; Franco, V.; Conde, A. Enhancement of magnetocaloric effect in B-rich FeZrBCu amorphous alloys. J. Alloys Compd. 2015, 622, 756–760. [Google Scholar] [CrossRef]
- Zhong, X.C.; Tian, H.C.; Wang, S.S.; Liu, Z.W.; Zhang, Z.G.; Zeng, D.C. Thermal magnetic and magnetocaloric properties of Fe80−xMxB10Zr9Cu1 (M = Ni, Ti; x = 0,3,5) amorphous alloys. J. Alloys Compd. 2015, 633, 188–193. [Google Scholar] [CrossRef]
- Wang, G.F.; Li, H.L.; Zhang, X.F.; Ma, Q.; Liu, Y.L.; Li, Y.F.; Zhao, Z.R. Large magnetocaloric effect in Fe-B-Mn-Zr-Nb amorphous alloys near room temperature. J. Supercond. Nov. Magn. 2016, 29, 1837–1842. [Google Scholar] [CrossRef]
- McHenry, M.C.; Willard, M.A.; Loughlin, D.E. Amorphous and nanocrystalline materials for application as soft magnets. Prog. Mater. Sci. 1999, 44, 291–433. [Google Scholar] [CrossRef]
- Herzer, G. Grain size dependence of coercivity and permeability in nanocrystalline ferromagnets. IEEE Trans. Magn. 1990, 26, 1397–1402. [Google Scholar] [CrossRef]
- Herzer, G. Modern soft magnets: Amorphous and nanocrystalline materials. Acta Mater. 2014, 61, 718–734. [Google Scholar] [CrossRef]
- Świerczek, J. Nanocrystallization and magnetocaloric effect in amorphous Fe-Mo-Cu-B alloy. J. Alloys Compd. 2014, 615, 255–262. [Google Scholar] [CrossRef]
- Miglierini, M.; Kopcewicz, M.; Idzikowski, B.; Horváth, H.; Grabias, A.; Škorvánek, I.; Dużewski, P.; Daróczi, C.S. Structure, hyperfine interactions and magnetic behavior of amorphous and nanocrystalline Fe80M7B12Cu1 (M = Nb, Ti or Mo) alloys. J. Appl. Phys. 1999, 85, 1014–1025. [Google Scholar] [CrossRef]
- Miglierini, M.; Greneche, J.M.; Idzikowski, B. Temperature Mössbauer effect study of nanocrystalline FeMCuB alloys. Mater. Sci. Eng. A 2001, S304–S306, 937–940. [Google Scholar] [CrossRef]
- Świerczek, J.; Kupczyk, A.; Hasiak, M. Flattening of isothermal magnetic entropy change versus temperature Curie in amorphous Fe-Mn-Mo-B ribbons. J. Alloys Compd. 2019, 808, 151496. [Google Scholar] [CrossRef]
- Franco, V.; Conde, A. Magnetic refrigerants with continuous phase transitions: Amorphous and nanostructured materials. Scr. Mater. 2012, 67, 594–599. [Google Scholar] [CrossRef]
- Slater, J.C. Atomic radii in crystals. J. Chem. Phys. 1964, 41, 3199–3204. [Google Scholar] [CrossRef]
- Brand, R.A. Improving the validity of hyperfine field distributions from magnetic alloys: Part I: Unpolarized source. Nucl. Instrum. Methods Phys. Res. 1987, B28, 398–416. [Google Scholar] [CrossRef]
- Oliver, W.C.; Pharr, G.M. Measurement of hardness and elastic modulus by instrumented indentation: Advances in understanding and refinements to methodology. J. Mater. Res. 2004, 19, 3–20. [Google Scholar] [CrossRef]
- Pavuk, M.; Miglierini, M.; Vujtek, M.; Mashlan, M.; Zboril, R.; Juraskova, Y. AFM and Mössbauer spectroscopy investigation of the nanocrystallization process in Fe-Mo-Cu-B rapidly quenched alloy. J. Phys. Condens. Matter 2007, 19, 216219. [Google Scholar] [CrossRef]
- Moreno-Ramirez, L.M.; Blázquez, J.S.; Franco, V.; Conde, A.; Marsilius, M.; Budinsky, V.; Herzer, G. Magnetocaloric response of amorphous and nanocrystalline Cr-containing Vitroperm-type alloys. J. Magn. Magn. Mater. 2016, 409, 56–61. [Google Scholar] [CrossRef]
- Li, J.-F.; Wang, X.; Liu, X.; Zhao, S.-F.; Yao, K.-F. Effect of fluxing treatment on the properties of Fe66Co15Mo1P7.5C5.5B2Si3 bulk metallic glass by water quenching. Phys. B Condens. Matter 2018, 528, 24–26. [Google Scholar] [CrossRef]
- Read, D.A.; Moyo, T.; Jassin, S.; Dunlap, R.A.; Hallam, G.C. Hyperfine field distributions and magnetic properties of melt-spun and sputtered Fe-rich Fe-Zr amorphous alloys. J. Magn. Magn. Mater. 1989, 82, 87–93. [Google Scholar] [CrossRef]
- Świerczek, J. Superparamagnetic behavior and magnetic entropy change in partially crystallized Fe-Mo-Cu-B alloy. Phys. Stat. Solidi A 2014, 211, 1567–1576. [Google Scholar] [CrossRef]
- Fukamichi, K.; Kikuchi, M.; Arakawa, S.; Masumoto, T. Invar-type new ferromagnetic amorphous Fe-B alloys. Sol. State Commun. 1977, 23, 955–958. [Google Scholar] [CrossRef]
- Banerjee, S.K. On a generalized approach to first and second order magnetic transition. Phys. Lett. 1964, 12, 16–17. [Google Scholar] [CrossRef]
- Świerczek, J. Medium range ordering and some magnetic properties of amorphous Fe90Zr7B3 alloy. J. Magn. Magn. Mater. 2010, 322, 2696–2702. [Google Scholar] [CrossRef]
- Franco, V.; Blázquez, J.S.; Conde, A. Field dependence of the magnetocaloric effect in materials with a second order phase transition: A master curve for the magnetic entropy change. Appl. Phys. Lett. 2006, 89, 222512. [Google Scholar] [CrossRef]
- Wang, G.F.; Li, H.L.; Zhao, Z.R.; Zhang, X.F. Stable magnetocaloric effect and refrigeration capacity in Co-doped FeCoMnZrNbB amorphous ribbons near room temperature. J. Alloys Compd. 2017, 692, 793–796. [Google Scholar] [CrossRef]
- Świerczek, J.; Kupczyk, A.; Hasiak, M. Structure and some magnetic properties of amorphous and partially crystallized Fe-(Co)-Mn-Mo-B alloys. J. Magn. Magn. Mater. 2020, 499, 166269. [Google Scholar] [CrossRef]
- Coey, J.M.D. Magnetism in Amorphous Solids. In Amorphous Solids and the Liquid State; March, N.H., Street, R.A., Tosi, M.P., Eds.; Springer: Boston, MA, USA, 1985; Chapter 13. [Google Scholar] [CrossRef]
- Kupczyk, A.; Świerczek, J.; Hasiak, M.; Prusik, K.; Zbroszczyk, J.; Gębara, P. Microstructure and some thermomagnetic properties of amorphous Fe-(Co)-Mn-Mo-B alloys. J. Alloys Compd. 2018, 735, 253–260. [Google Scholar] [CrossRef]
- Hasiak, M.; Sobieszczańska, B.; Łaszcz, A.; Biały, M.; Chęcmanowski, J.; Zatoński, T.; Bożemska, E.; Wawrzyńska, M. Production, mechanical properties and biomedical characterization of ZrTi-based bulk metallic glasses in comparison with 316L stainless steel and Ti6Al4V alloy. Materials 2022, 15, 252. [Google Scholar] [CrossRef]


| Thermal History of the Sample | Subspectra | A (%) | ||||
|---|---|---|---|---|---|---|
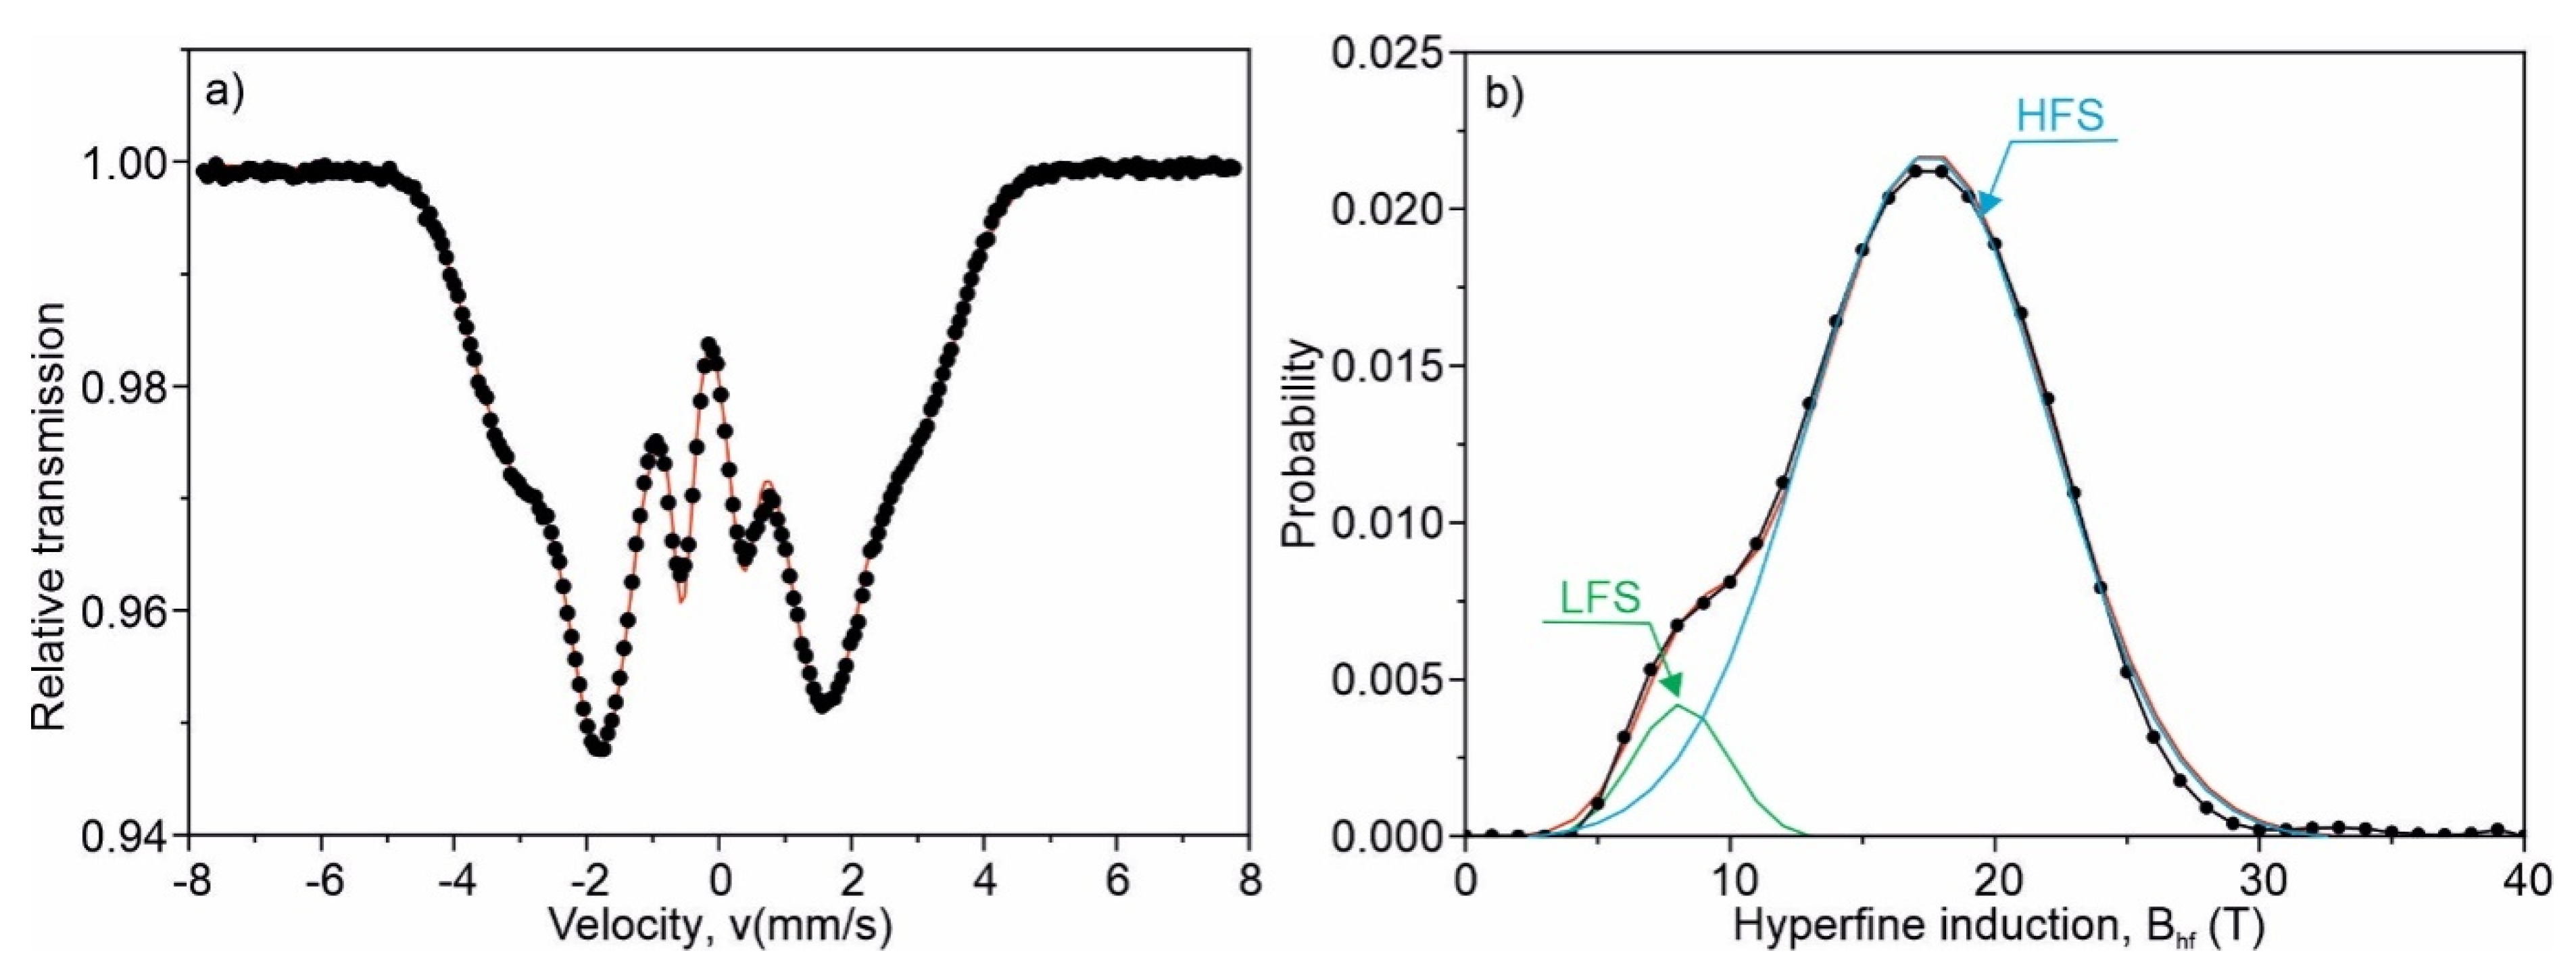
| as-quenched | set of sextets | 16.7 (1) | 5.0 (1) | −0.090 ± 0.003 | 2.93 (2) | 100 |
| Composition | TC (K) | |∆SMpeak| (J·kg−1·K−1) | Reference |
|---|---|---|---|
| Fe76Mo10Cu1B13 | 277 | 0.88 | [5] |
| Fe70Mn10Mo5B15 | 298 | 0.89 | [33] |
| Fe69.75Co0.25Mn10Mo5B15 | 320 | 0.92 | [33] |
| Fe69.5Co0.5Mn10Mo5B15 | 370 | 1.30 | [33] |
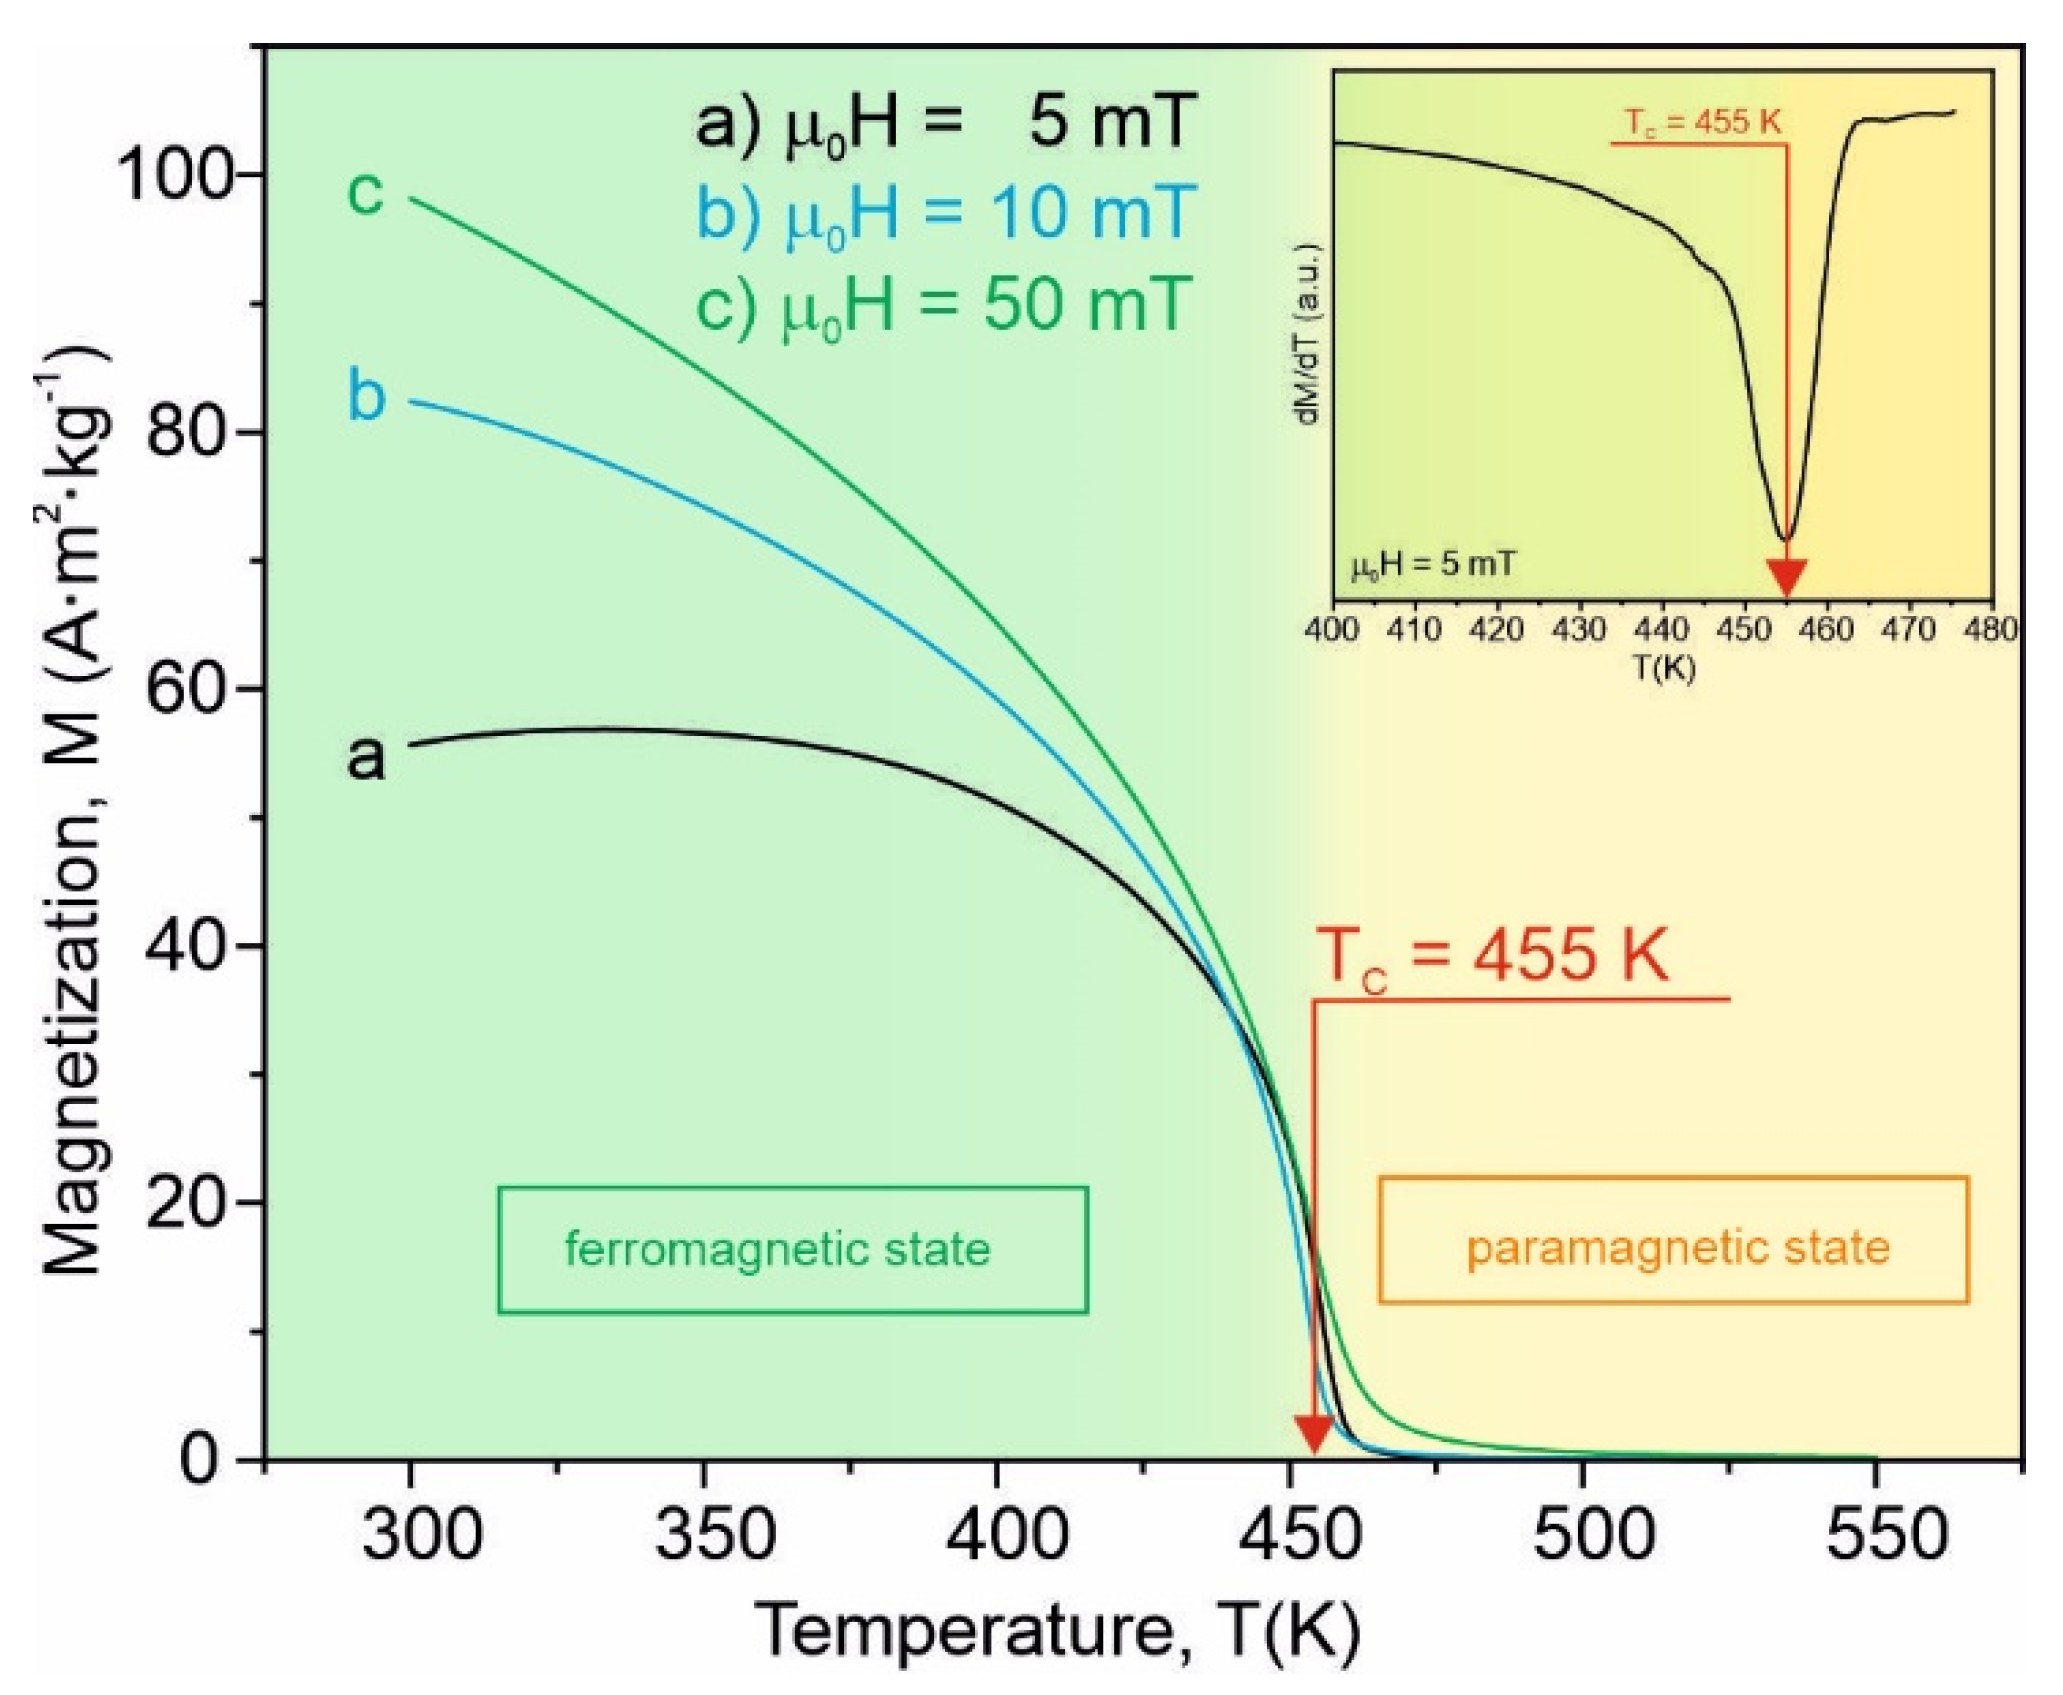
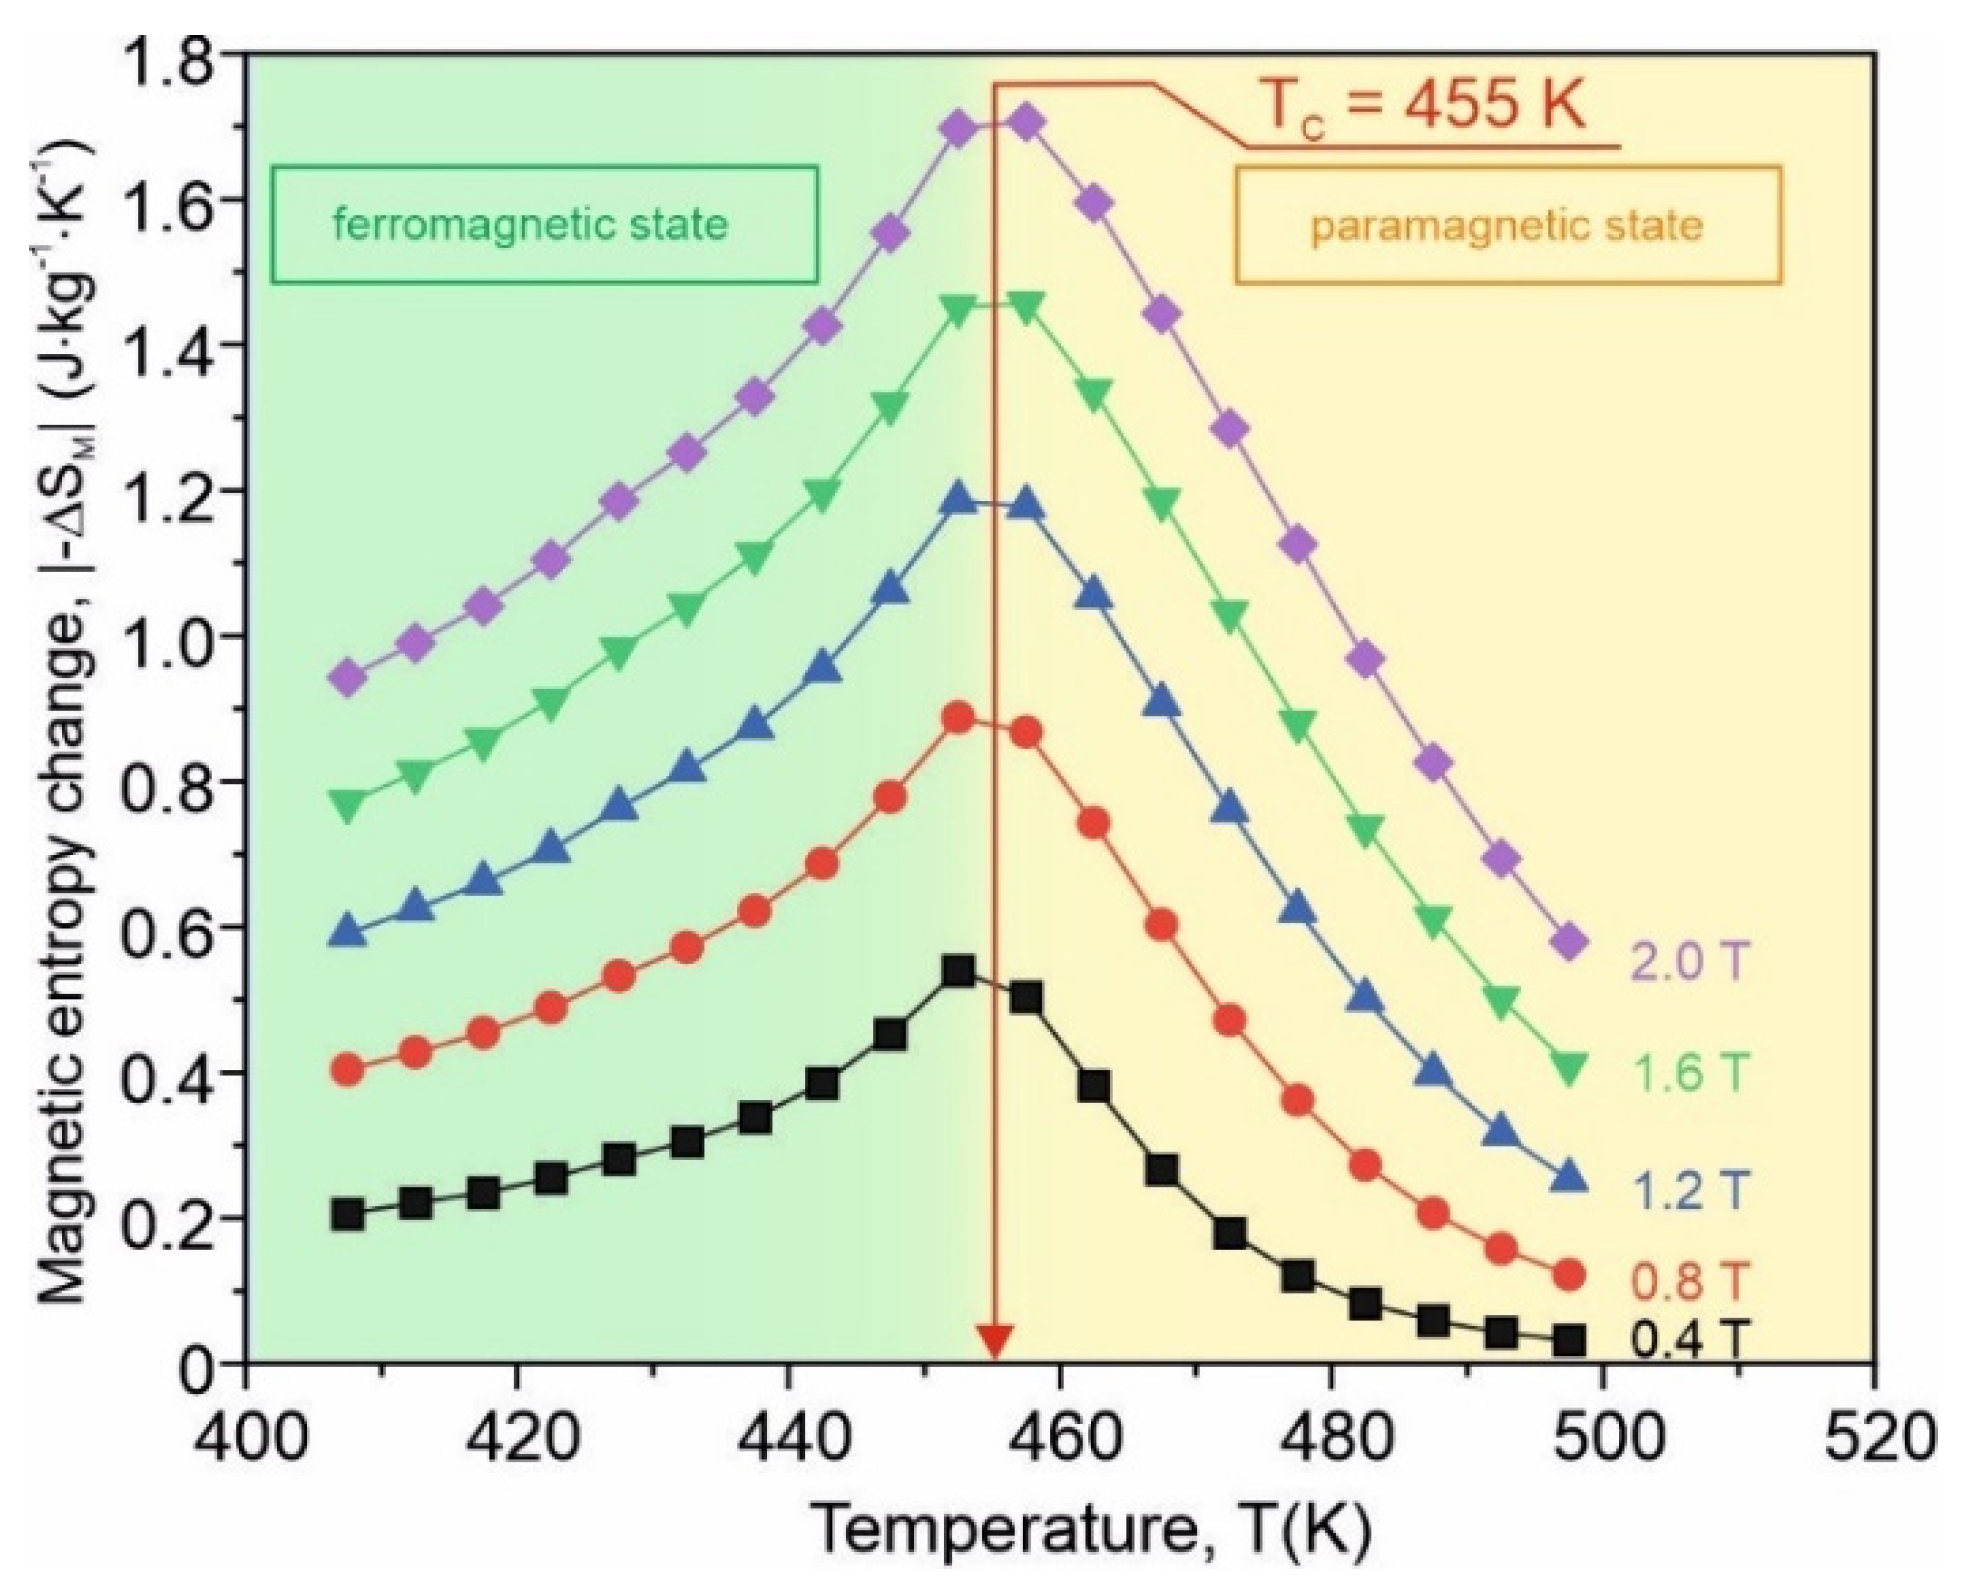
| Fe75Zr4Ti3Cu1B17 | 455 | 1.70 | [This work] |
Publisher’s Note: MDPI stays neutral with regard to jurisdictional claims in published maps and institutional affiliations. |
© 2022 by the authors. Licensee MDPI, Basel, Switzerland. This article is an open access article distributed under the terms and conditions of the Creative Commons Attribution (CC BY) license (https://creativecommons.org/licenses/by/4.0/).
Share and Cite
Hasiak, M.; Świerczek, J. Some Thermomagnetic and Mechanical Properties of Amorphous Fe75Zr4Ti3Cu1B17 Ribbons. Materials 2022, 15, 368. https://doi.org/10.3390/ma15010368
Hasiak M, Świerczek J. Some Thermomagnetic and Mechanical Properties of Amorphous Fe75Zr4Ti3Cu1B17 Ribbons. Materials. 2022; 15(1):368. https://doi.org/10.3390/ma15010368
Chicago/Turabian StyleHasiak, Mariusz, and Jan Świerczek. 2022. "Some Thermomagnetic and Mechanical Properties of Amorphous Fe75Zr4Ti3Cu1B17 Ribbons" Materials 15, no. 1: 368. https://doi.org/10.3390/ma15010368