
Enhanced Metakaolin Reactivity in Blended Cement with Additional Calcium Hydroxide


Abstract
:1. Introduction
- AS2 is metakaolin (Al2O3 · 2SiO2 · 2H2O);
- CH is calcium hydroxide (Ca(OH)2);
- H is water (H2O);
- C-S-H is the collective term for calcium silicate hydrates having wide range of C/S molar ratios (C: CaO; S: SiO2);
- C2ASH8 is hydrated stratlingite;
- C3AH6 is tricalcium aluminate hydrate;
- C4AH13 is tetracalcium aluminate hydrate.
2. Materials and Methods
2.1. Materials
2.2. Sample Preparation
2.3. Measurement Methods
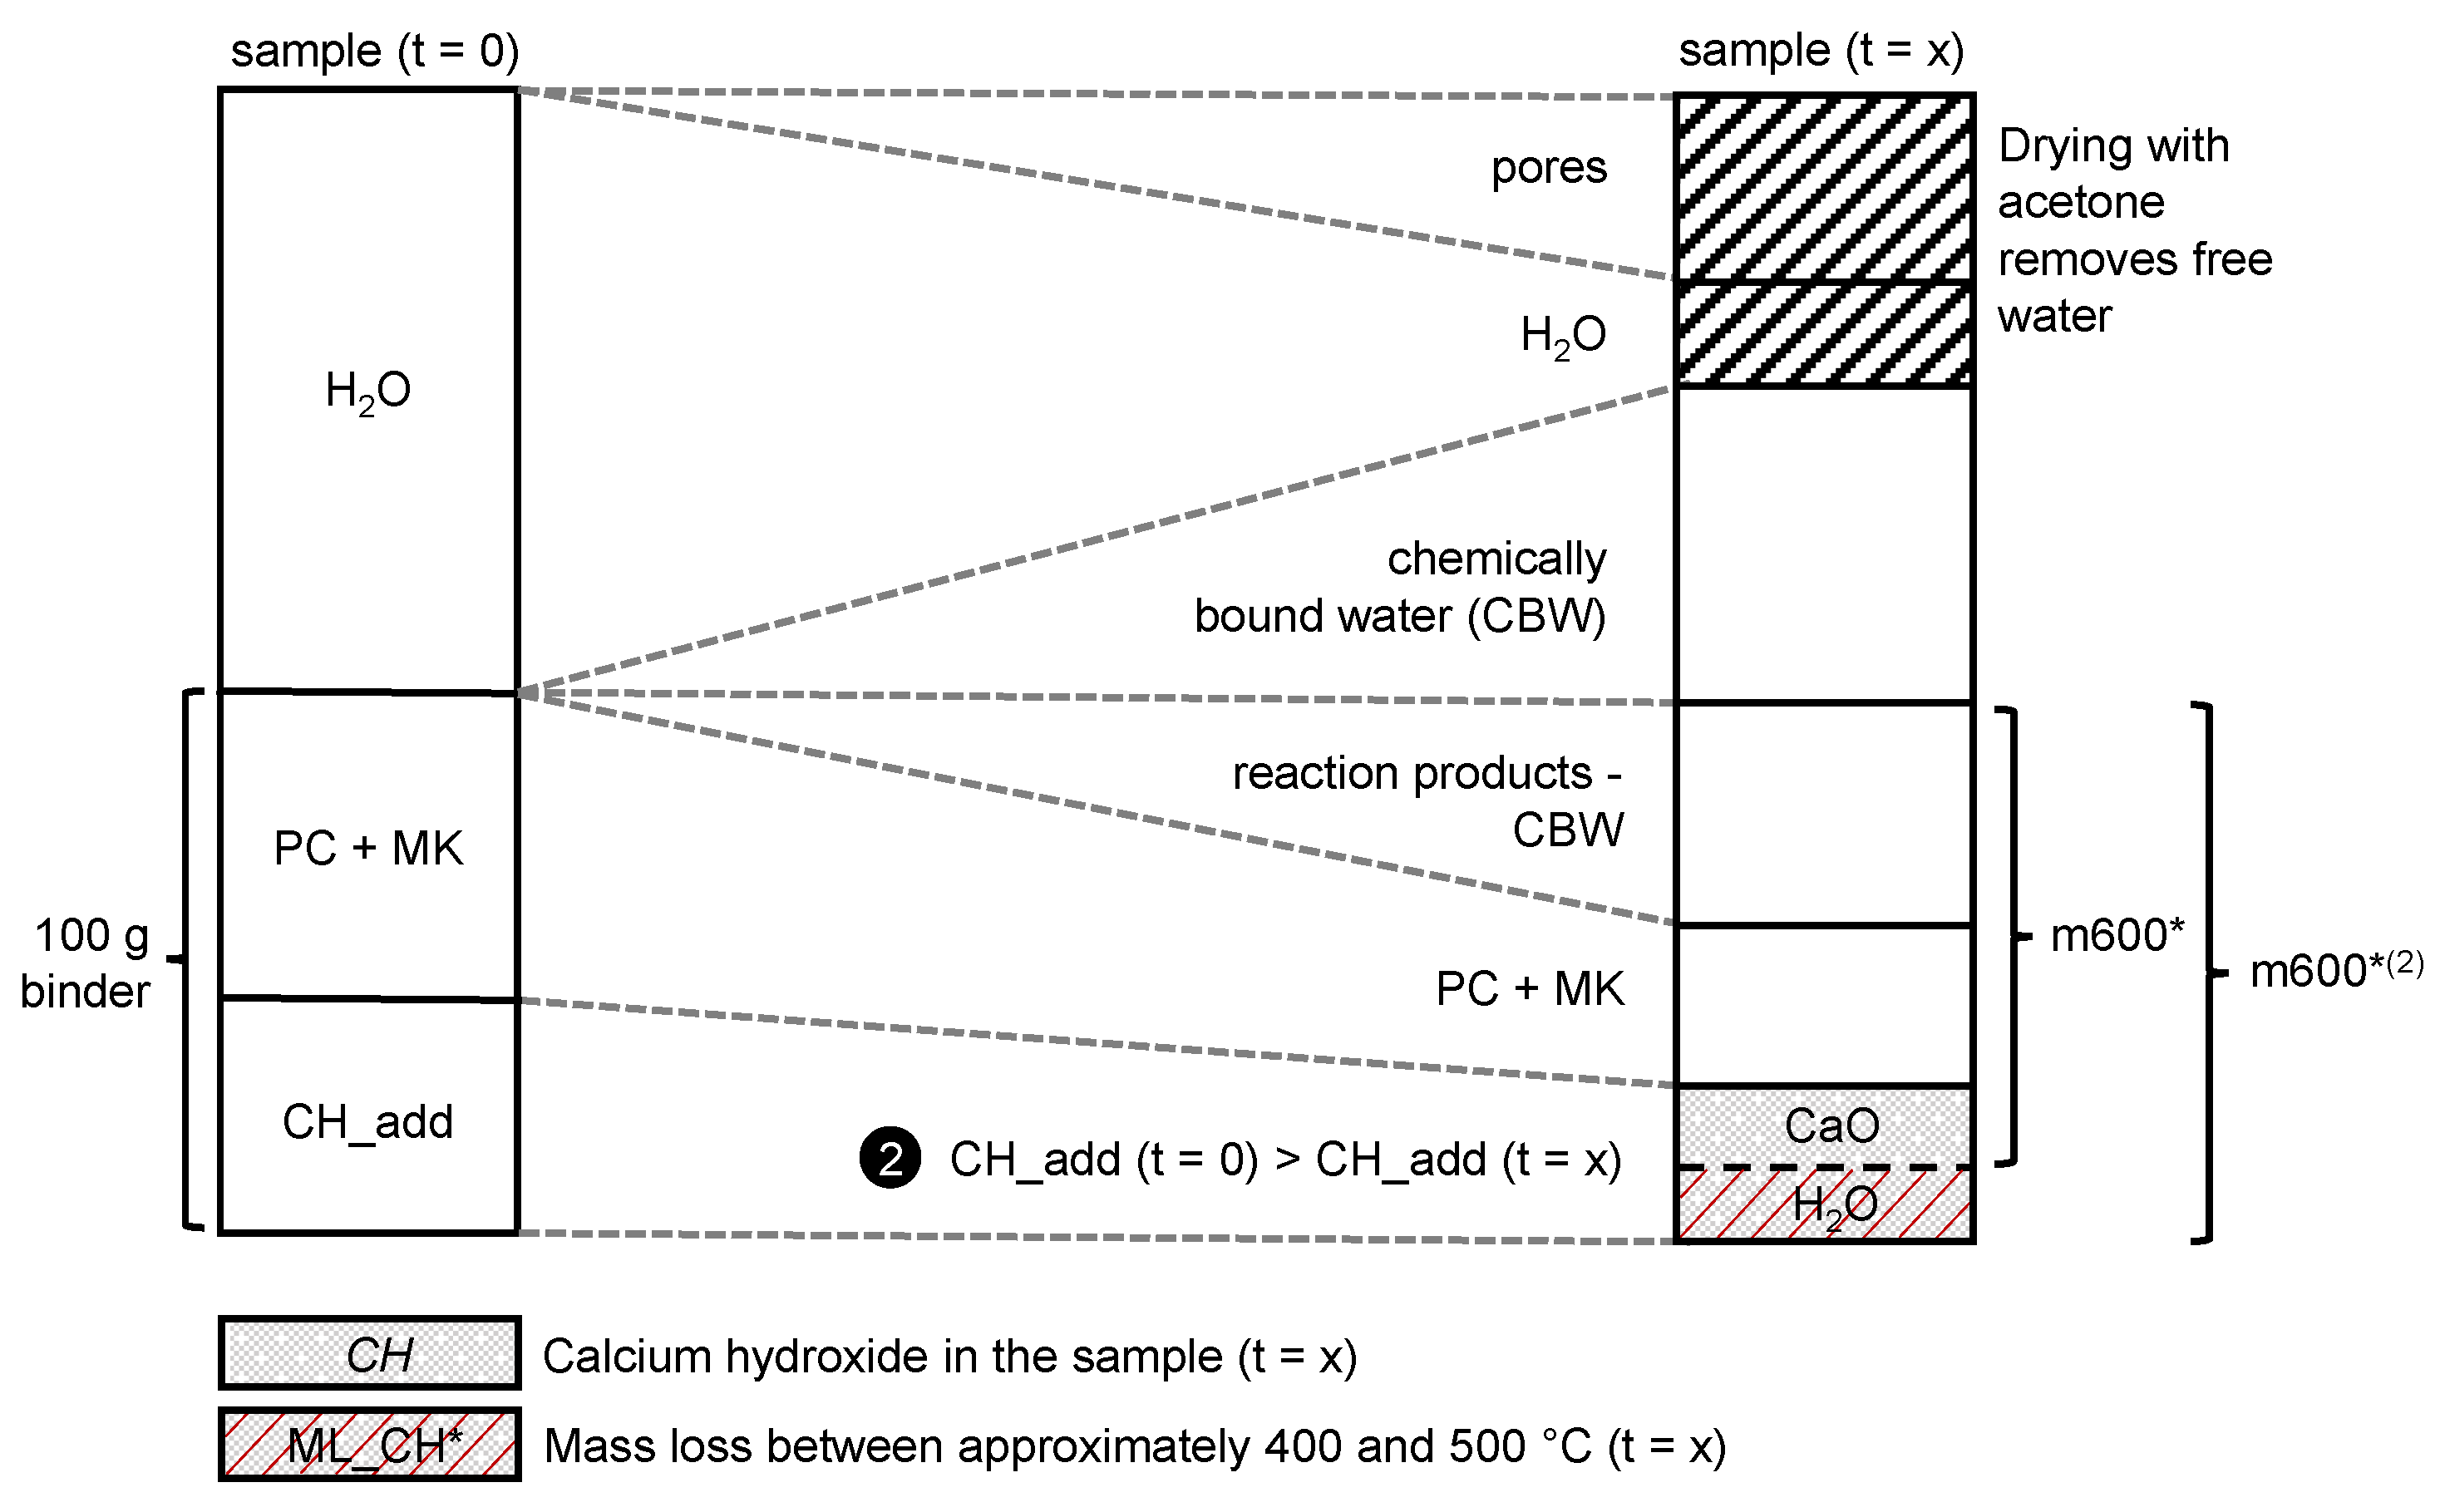
2.4. Mass Balance Approach for Normalization of TGA Data from Samples with CH_add
- x* is the corrected TGA value in wt.%;
- x is any TGA data (mass or mass loss) in wt.%;
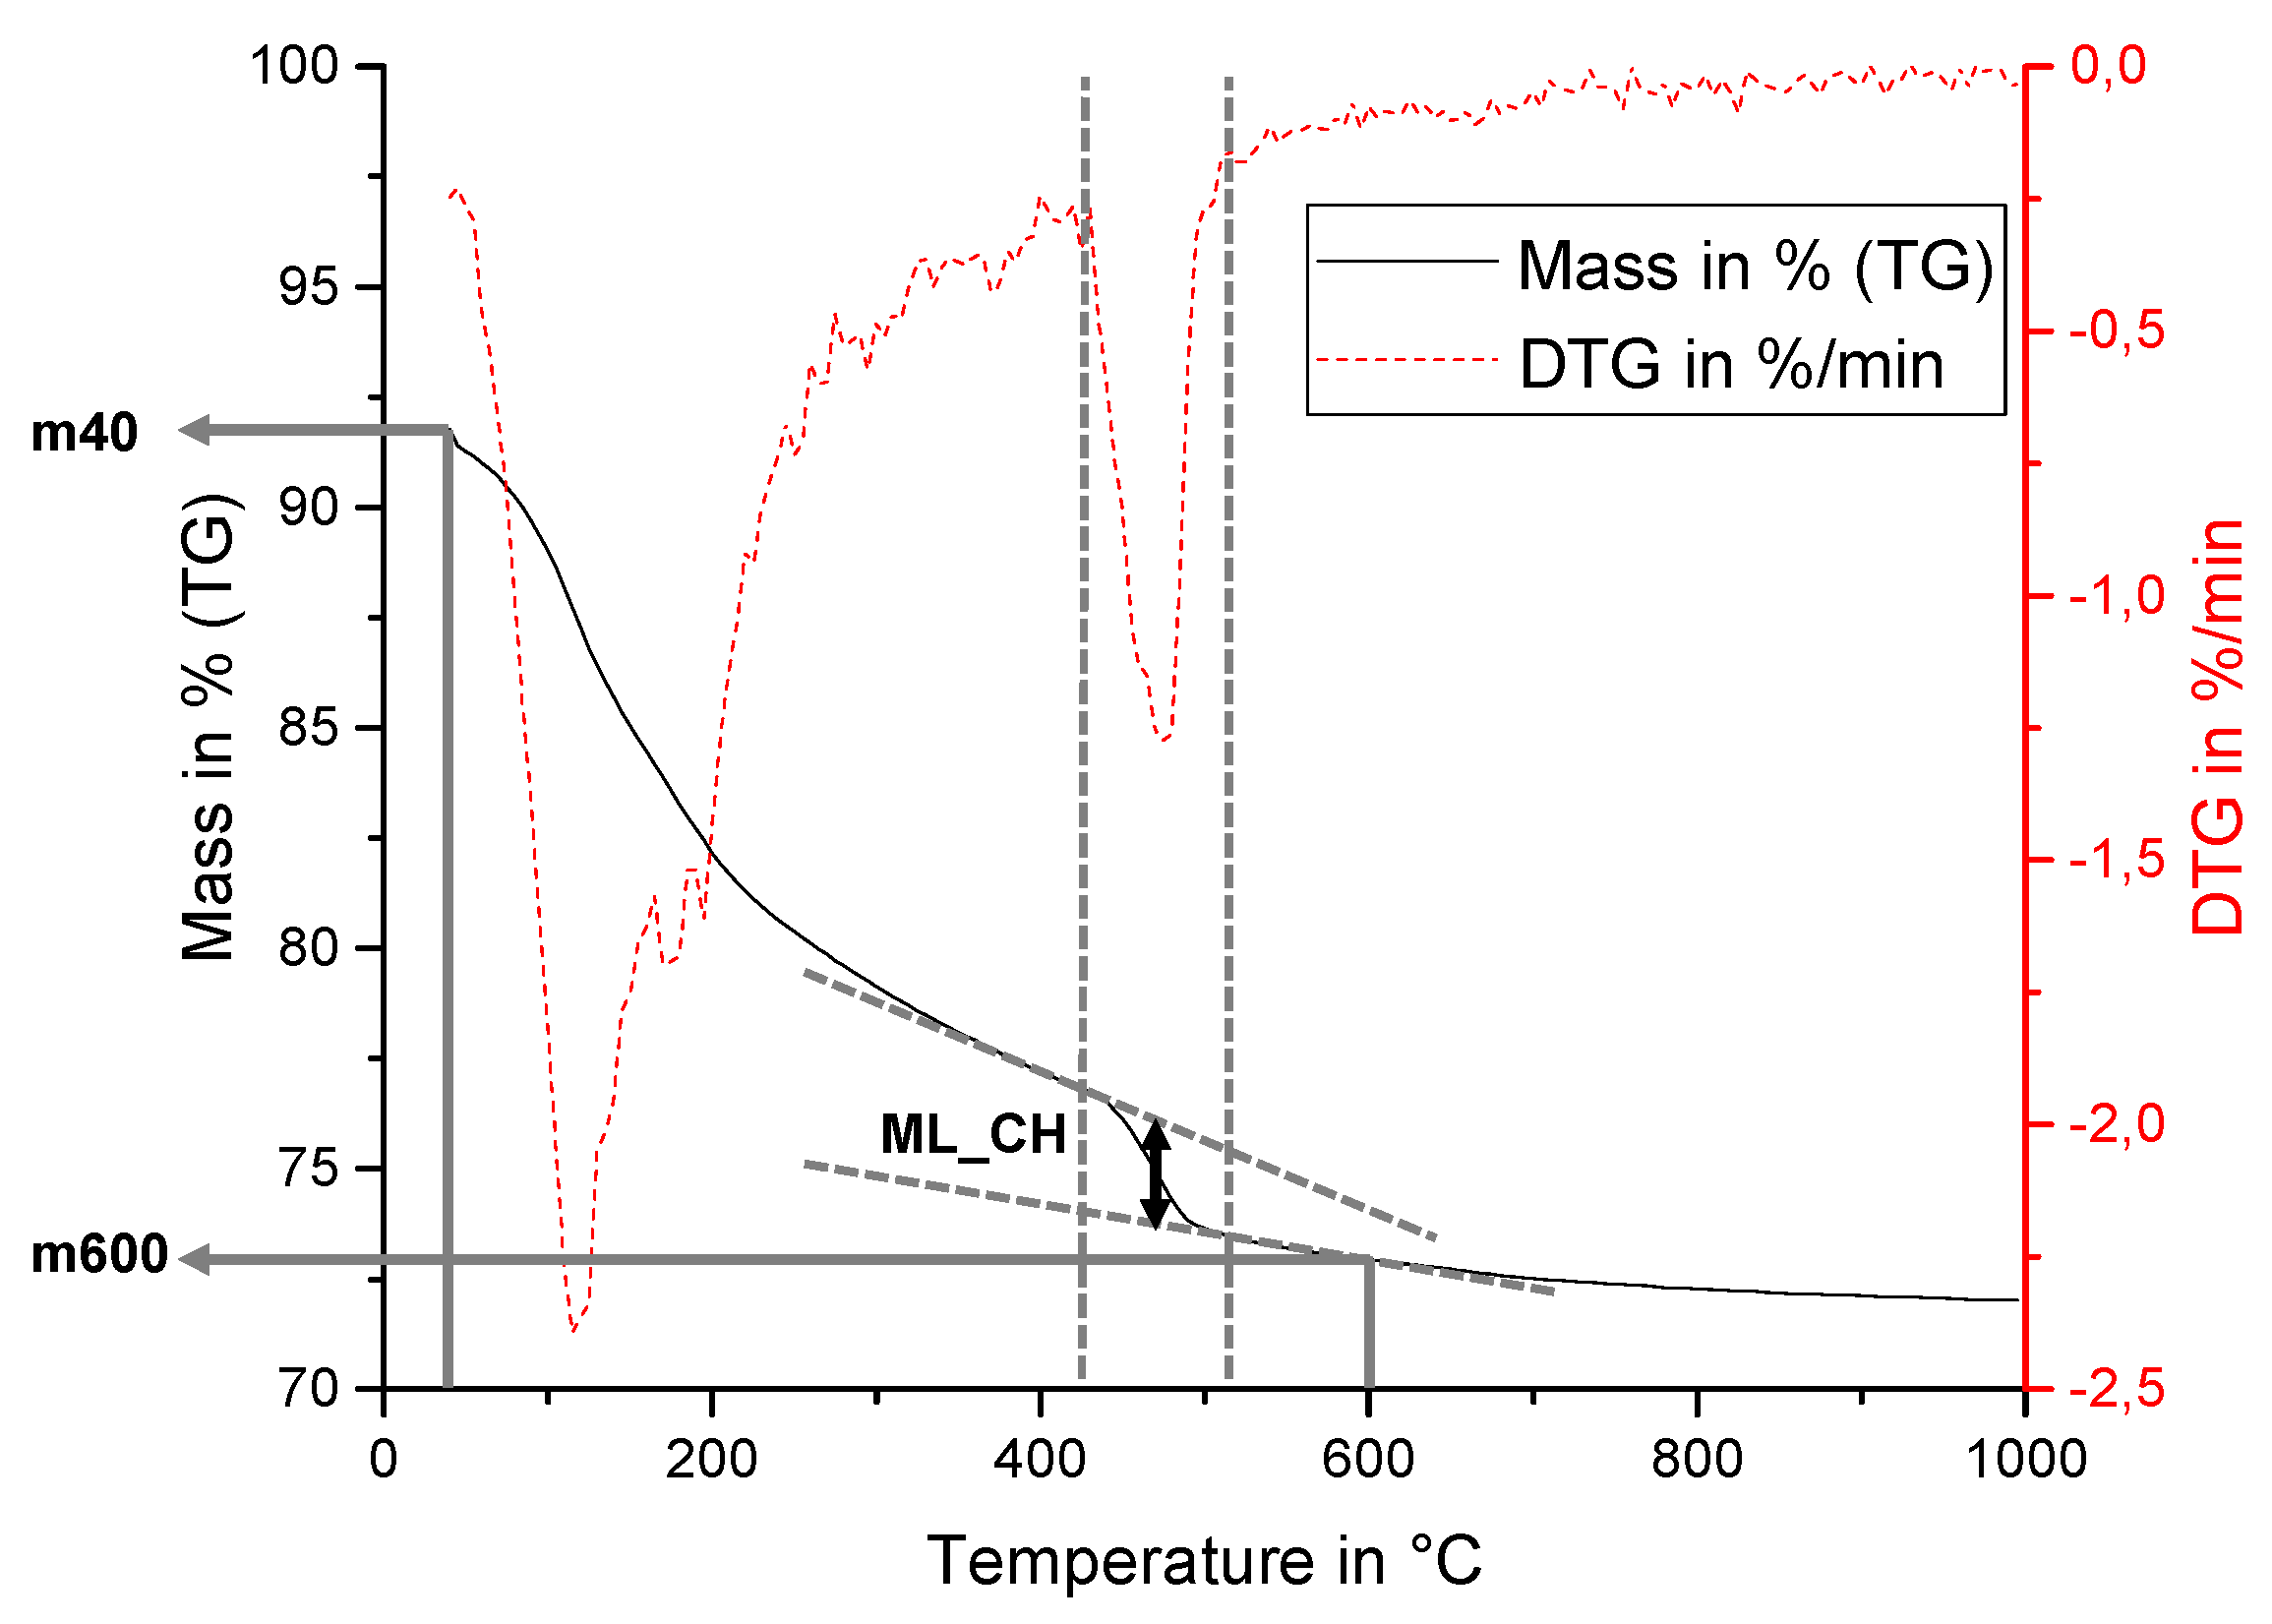
- m40 is the mass at 40 °C taken from TGA data in wt.% (see Figure 3).
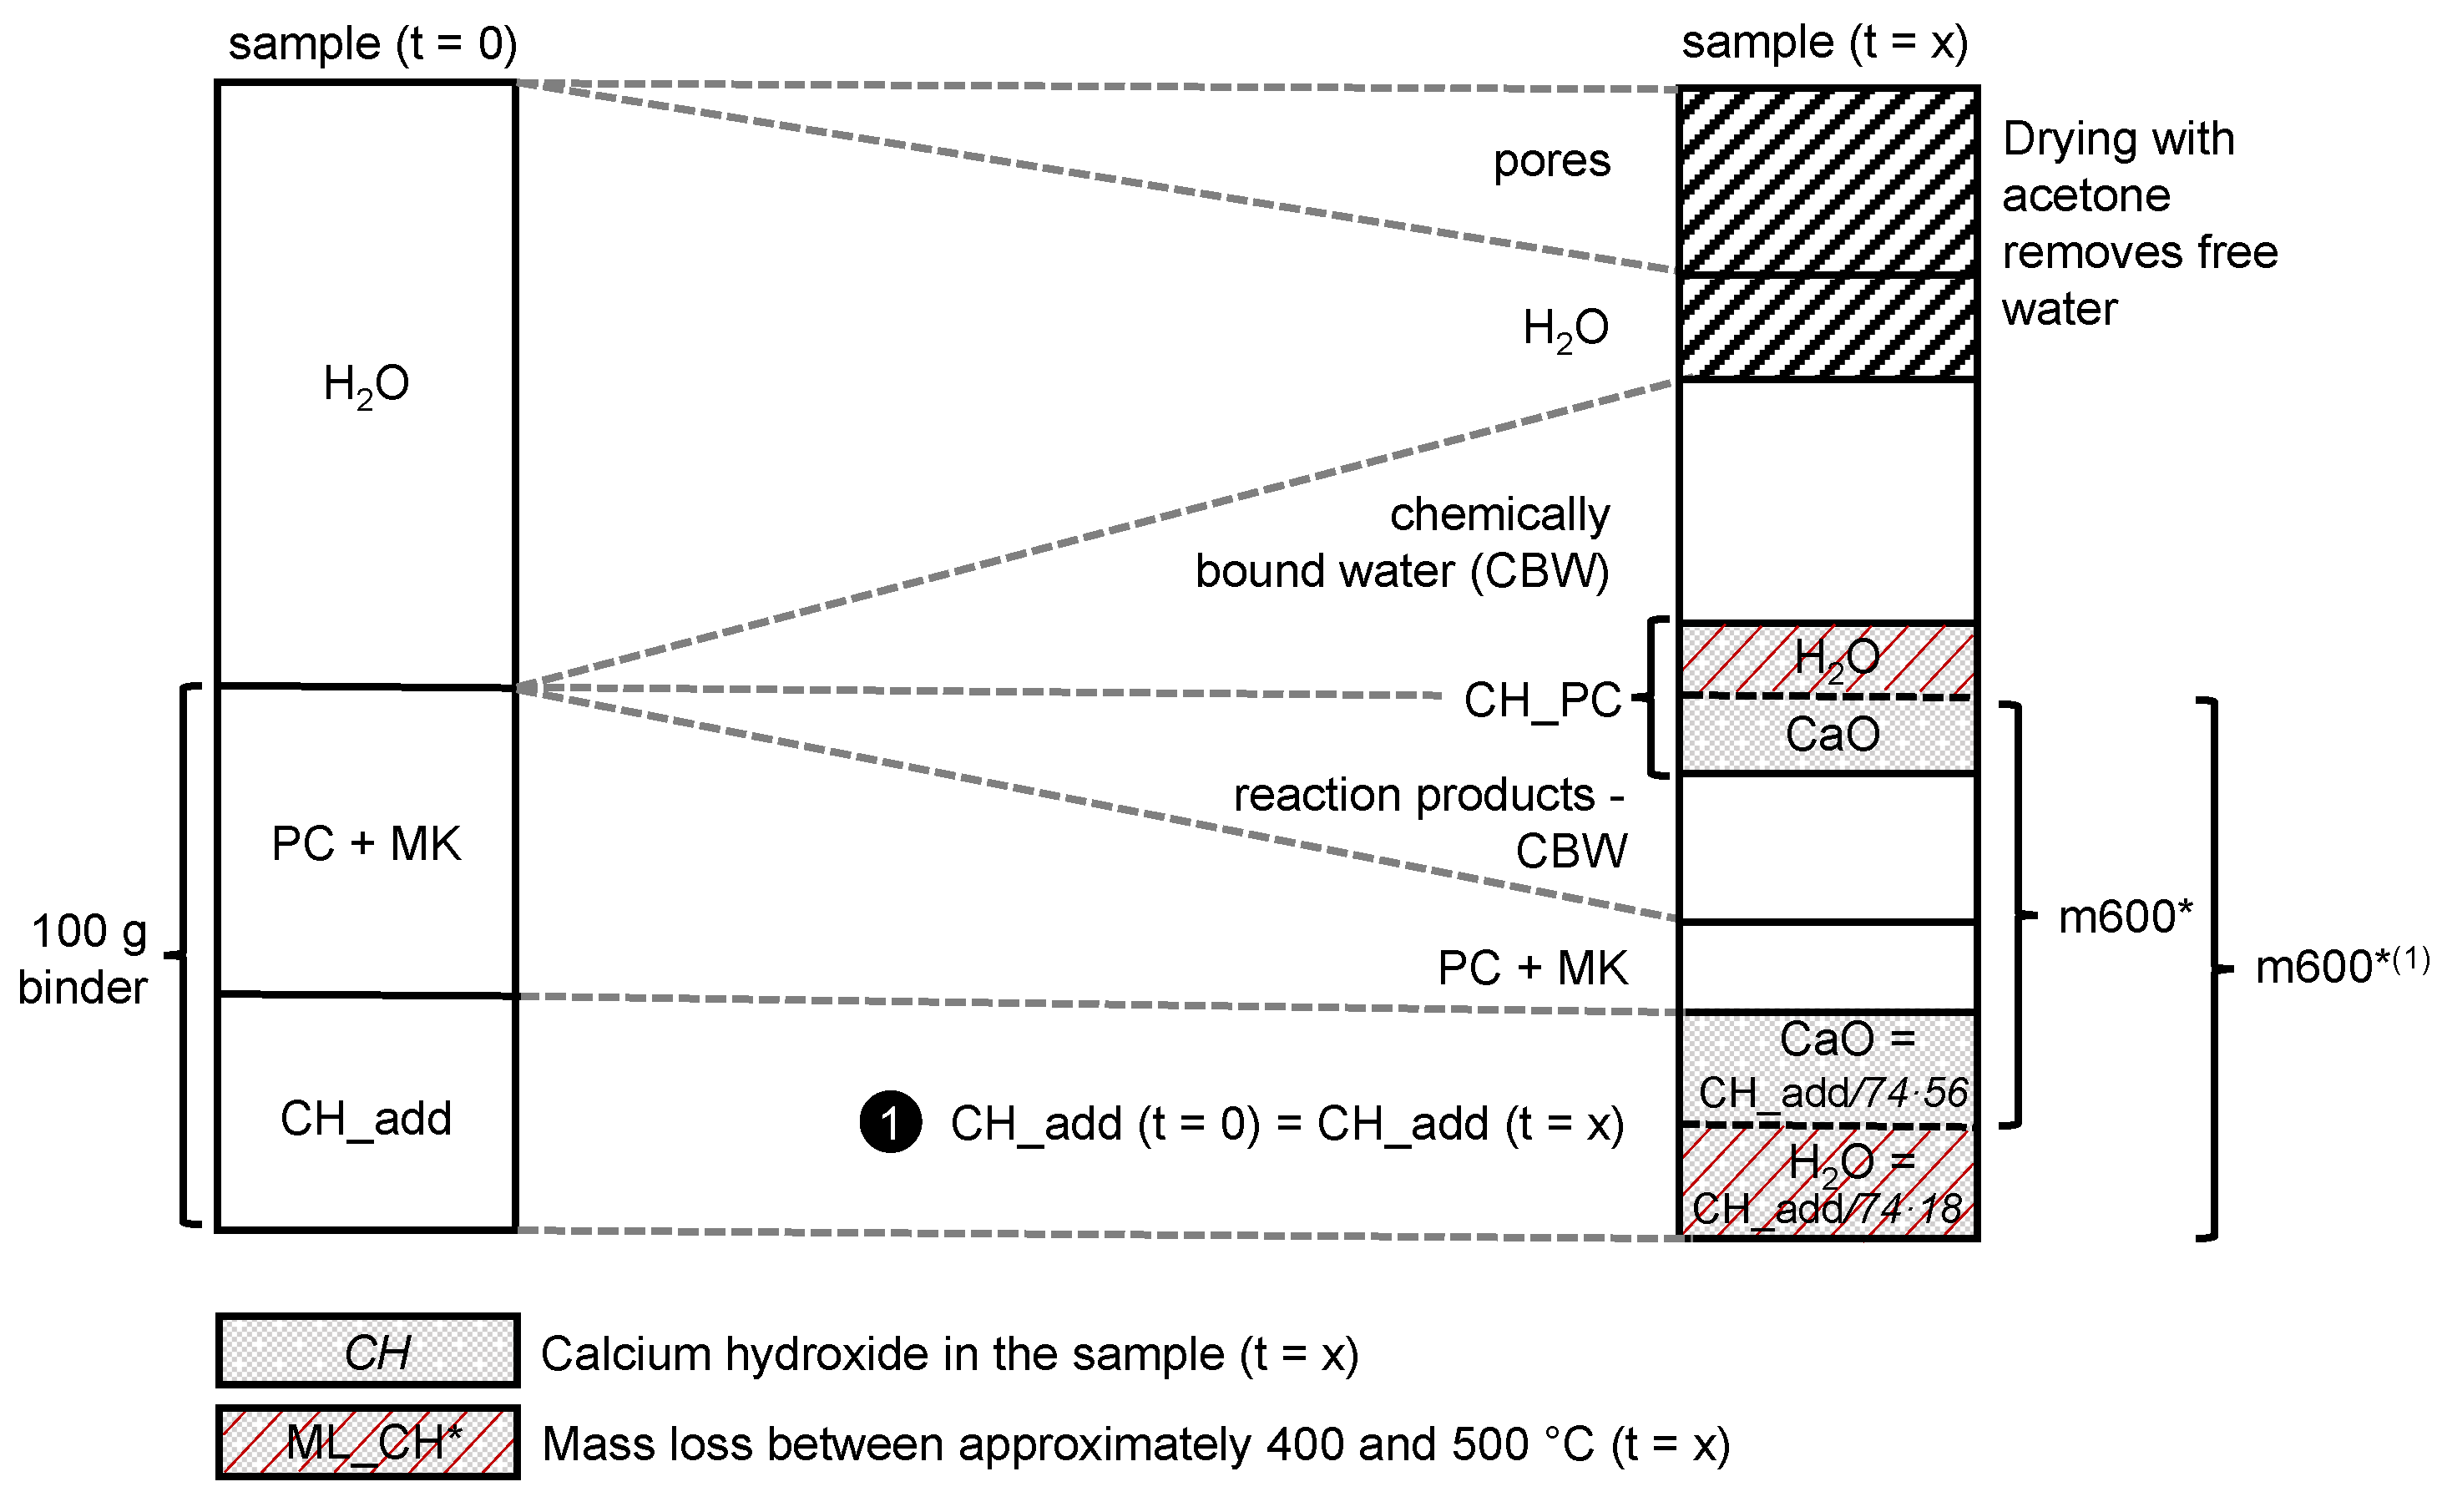
- CH is the amount of calcium hydroxide in the sample (t = x) in g/100 g binder;
- ML_CH* is the corrected mass loss between approximately 400 °C and 500 °C; determined with the tangential method from TGA data in wt.% (ML_CH shown in Figure 3, corrected according to Equation (4));
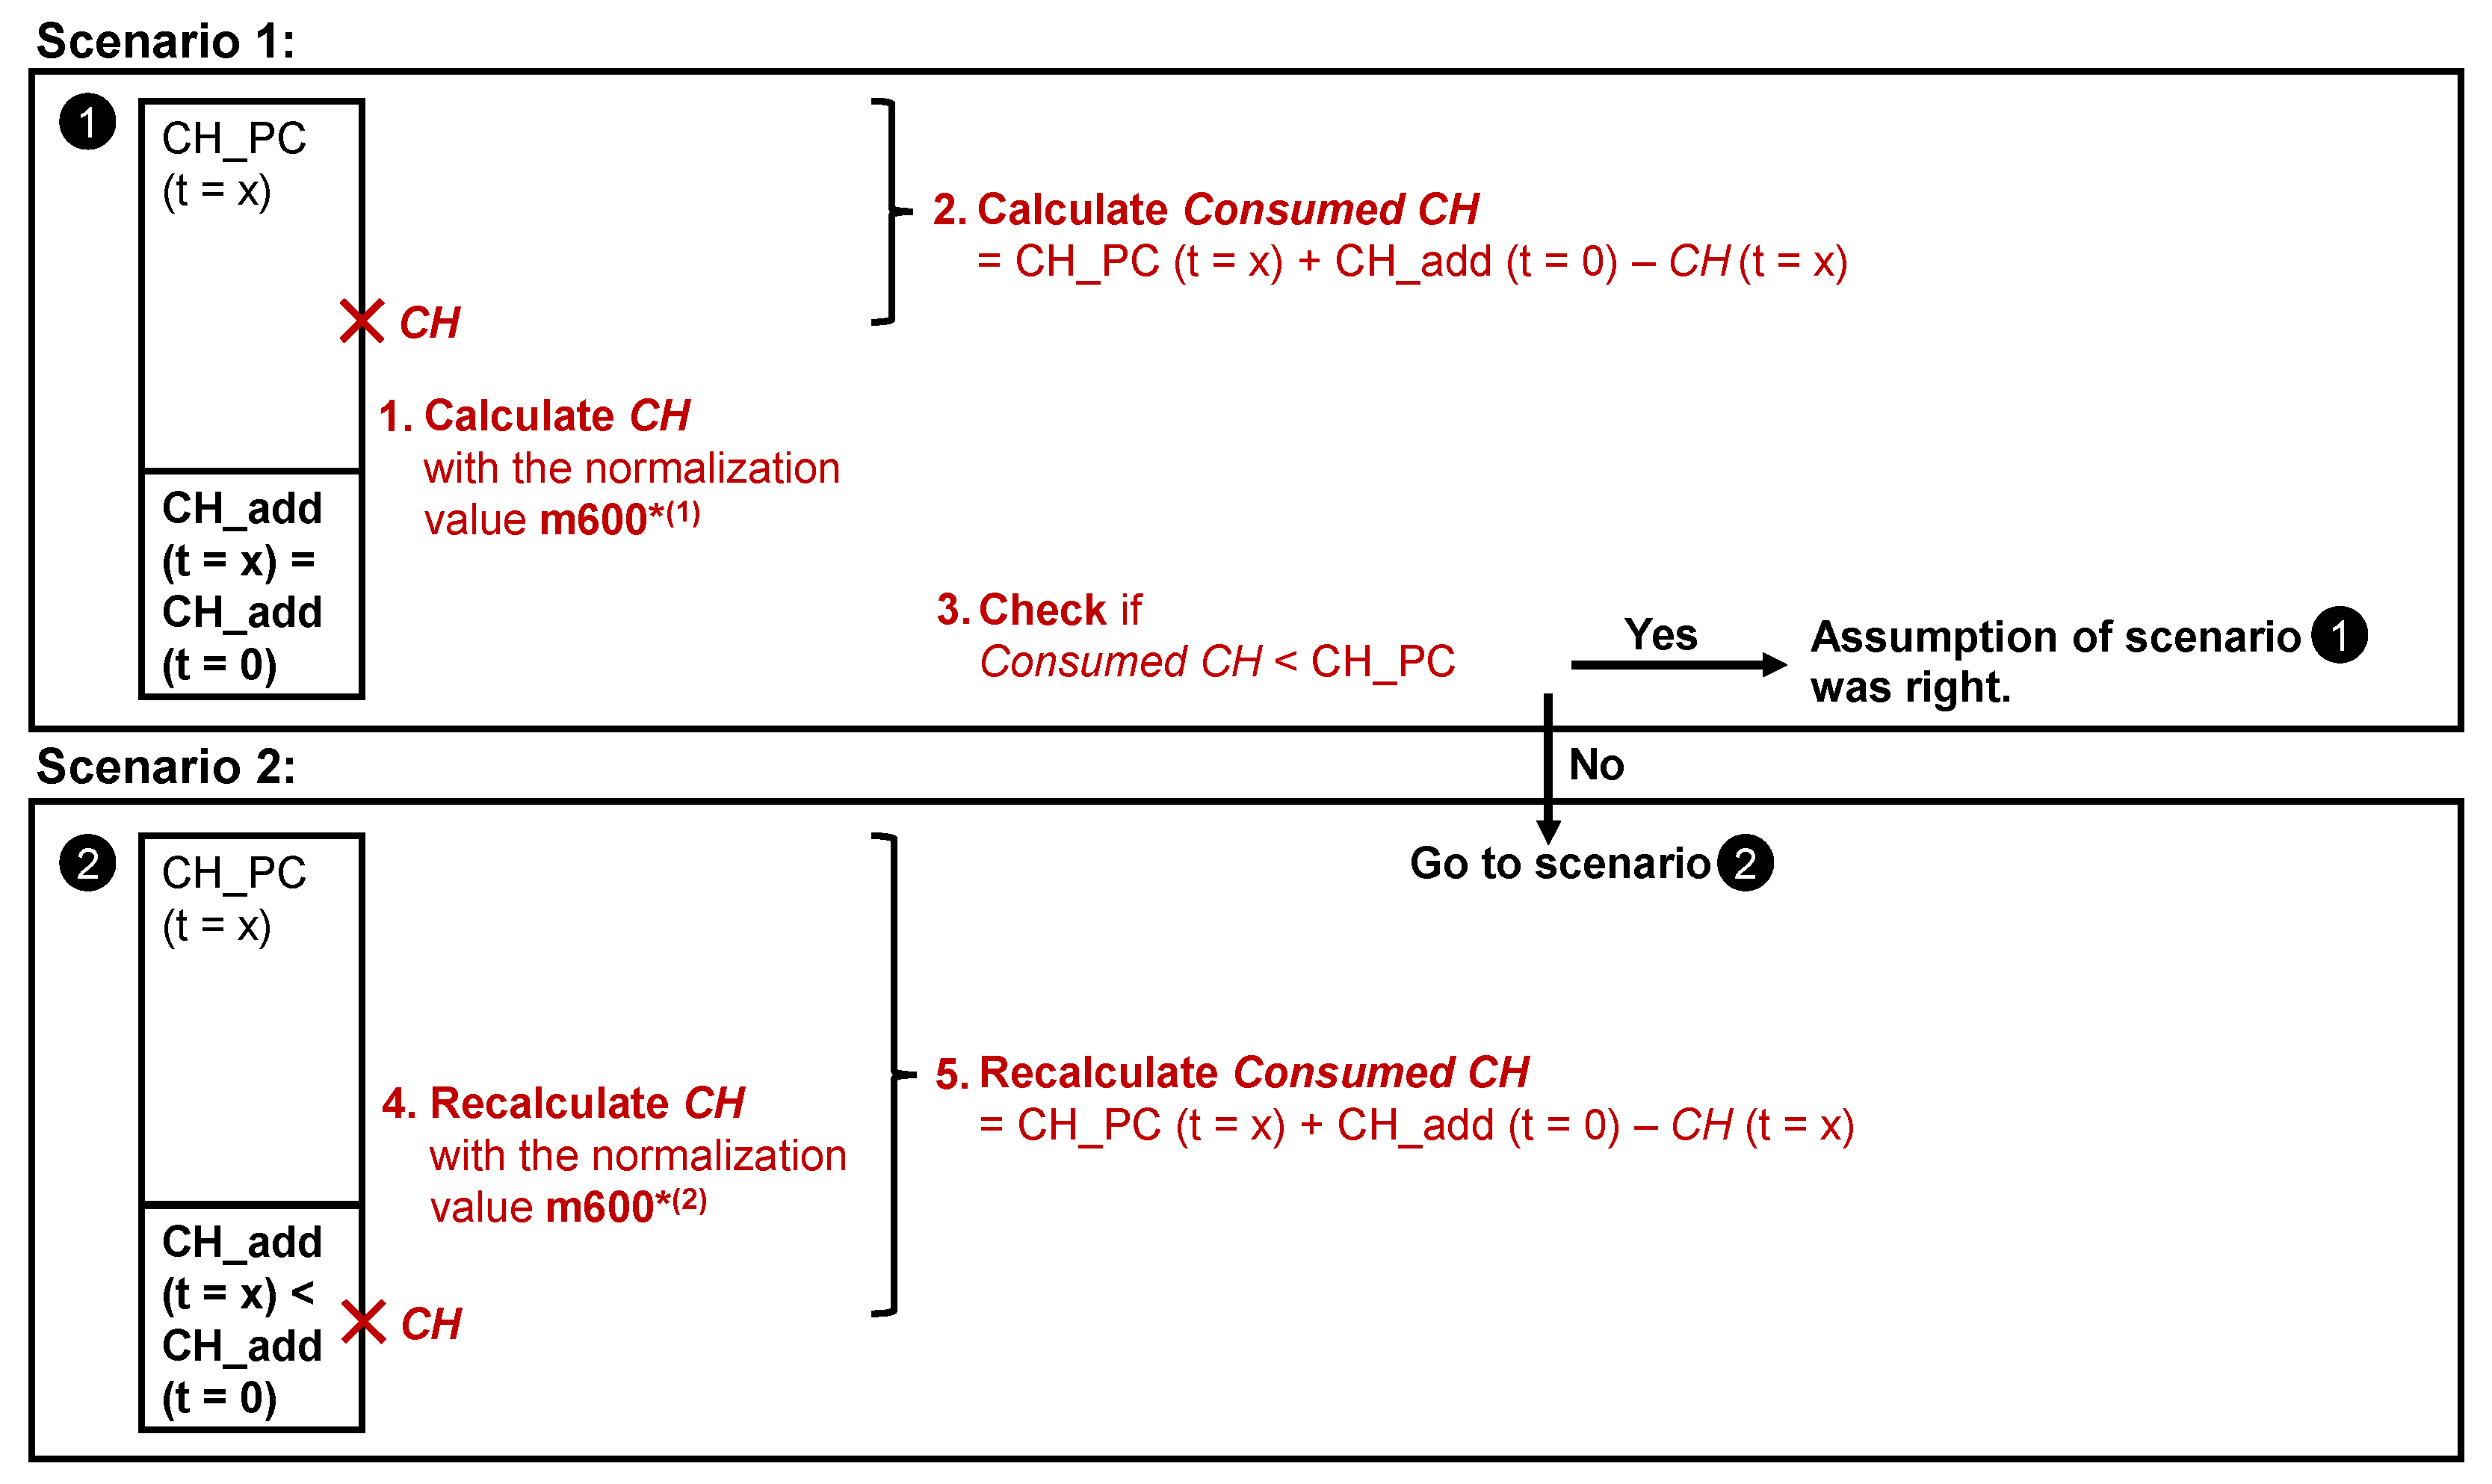
- m600* is the corrected mass at 600 °C taken from TGA data in wt.% (m600 shown in Figure 3, corrected according to Equation (4)), typically representing the binder mass, in this paper also referred to as the normalization value as it normalizes the CH results relative to the binder (i.e., to have units in g/100 g binder). To account for the added CH (CH_add) as part of the binder, this value has to be replaced by a corrected one, m600*(1) or m600*(2) as detailed in the following descriptions and calculated according to Equation (6) or (8).
- m600*(1) is the normalization value for scenario 1 in wt.%;
- m600* is the corrected mass at 600 °C taken from TGA data in wt.% (m600 shown in Figure 3, corrected according to Equation (4));
- CH_add is the amount of additionally added CH in the initial binder (t = 0) in wt.%;
- PC is the amount of PC in the initial binder (t = 0) in wt.%;
- MK is the amount of MK in the initial binder (t = 0) in wt.%.
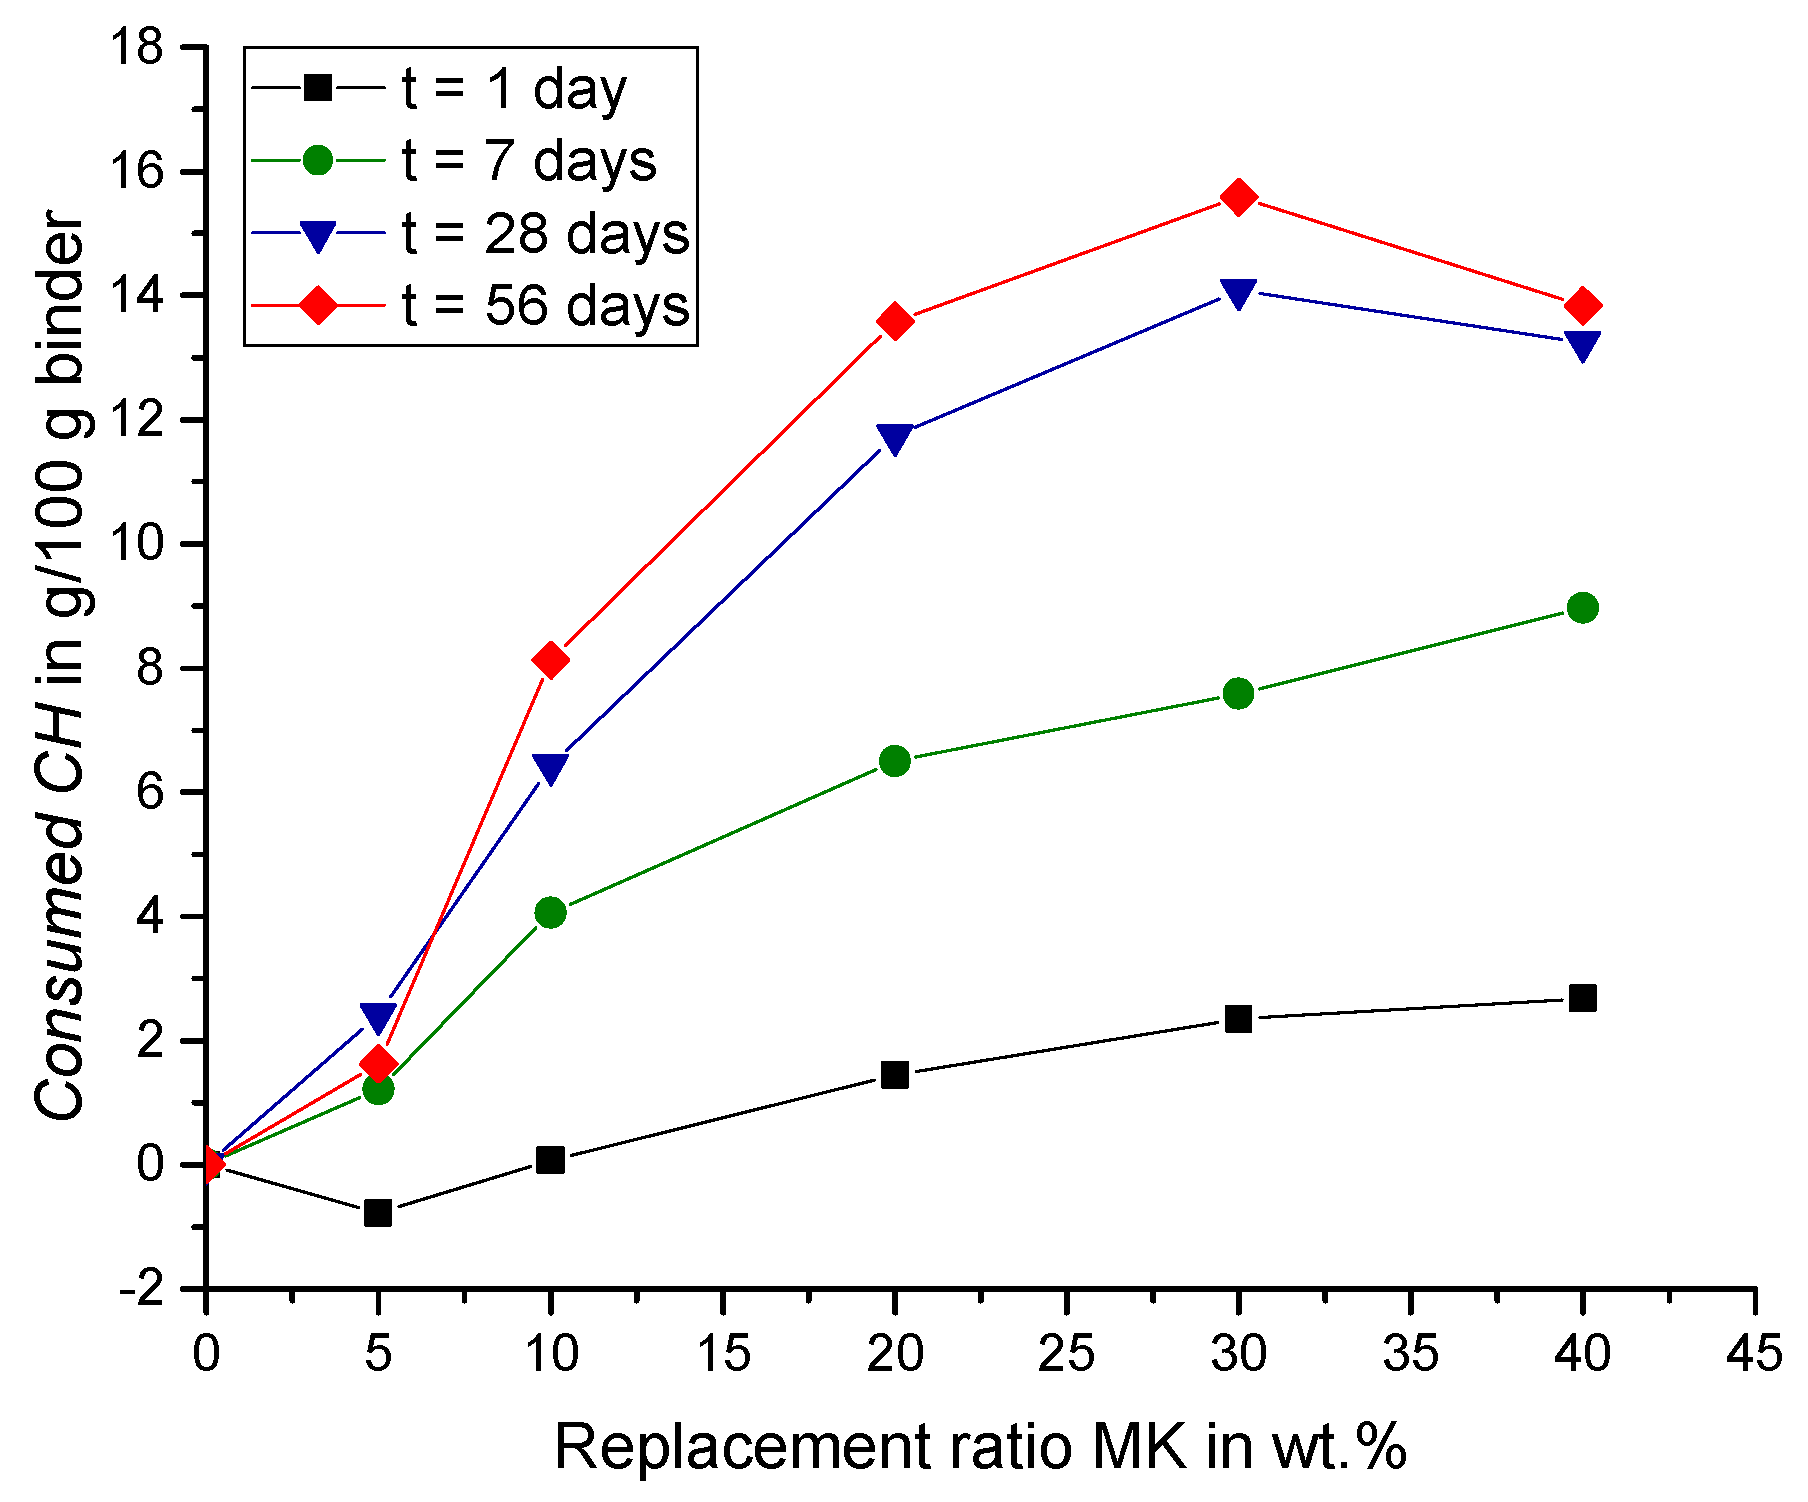
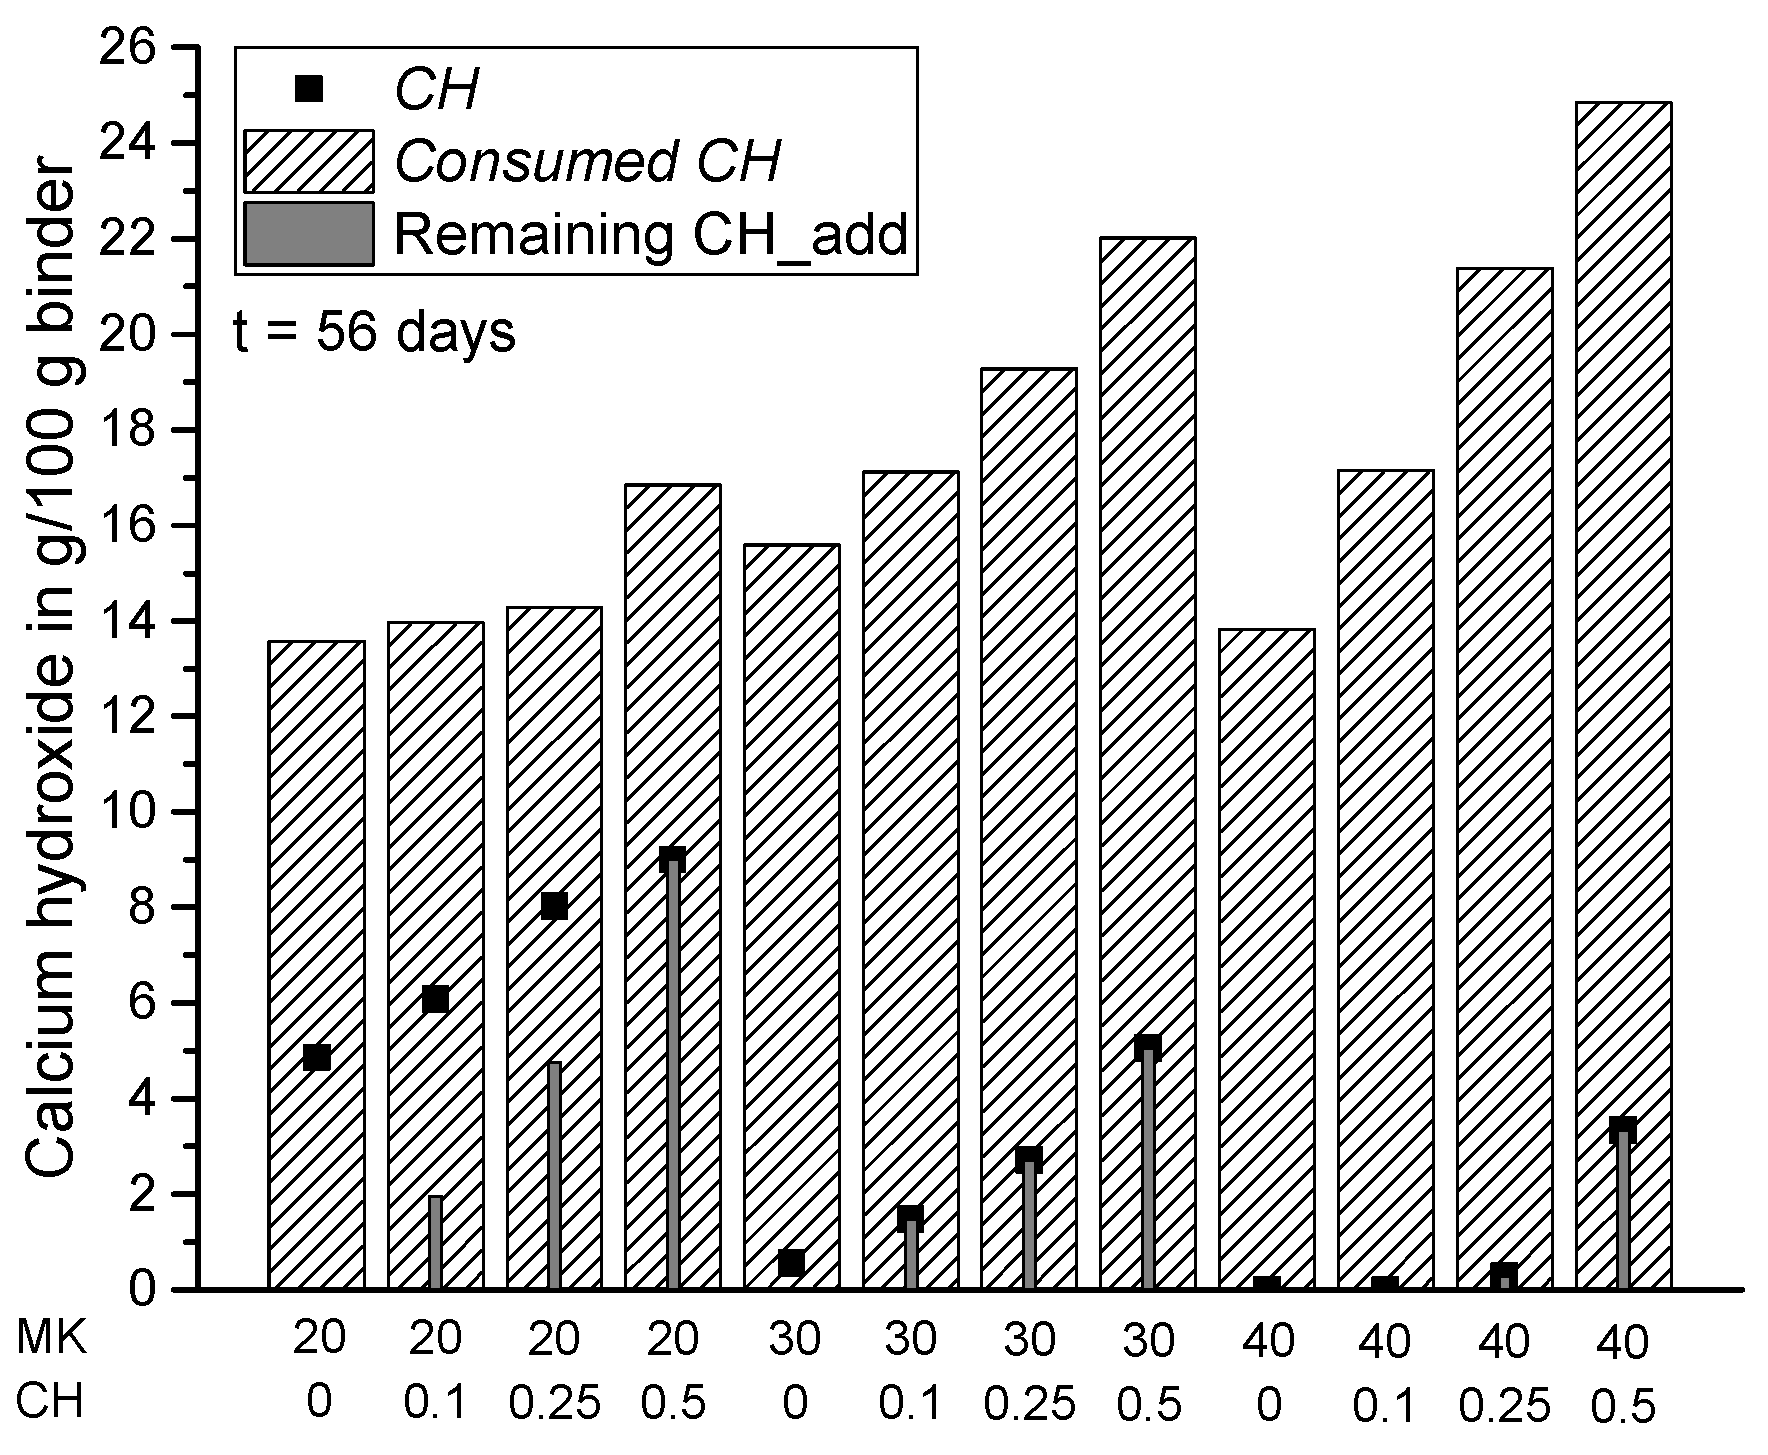
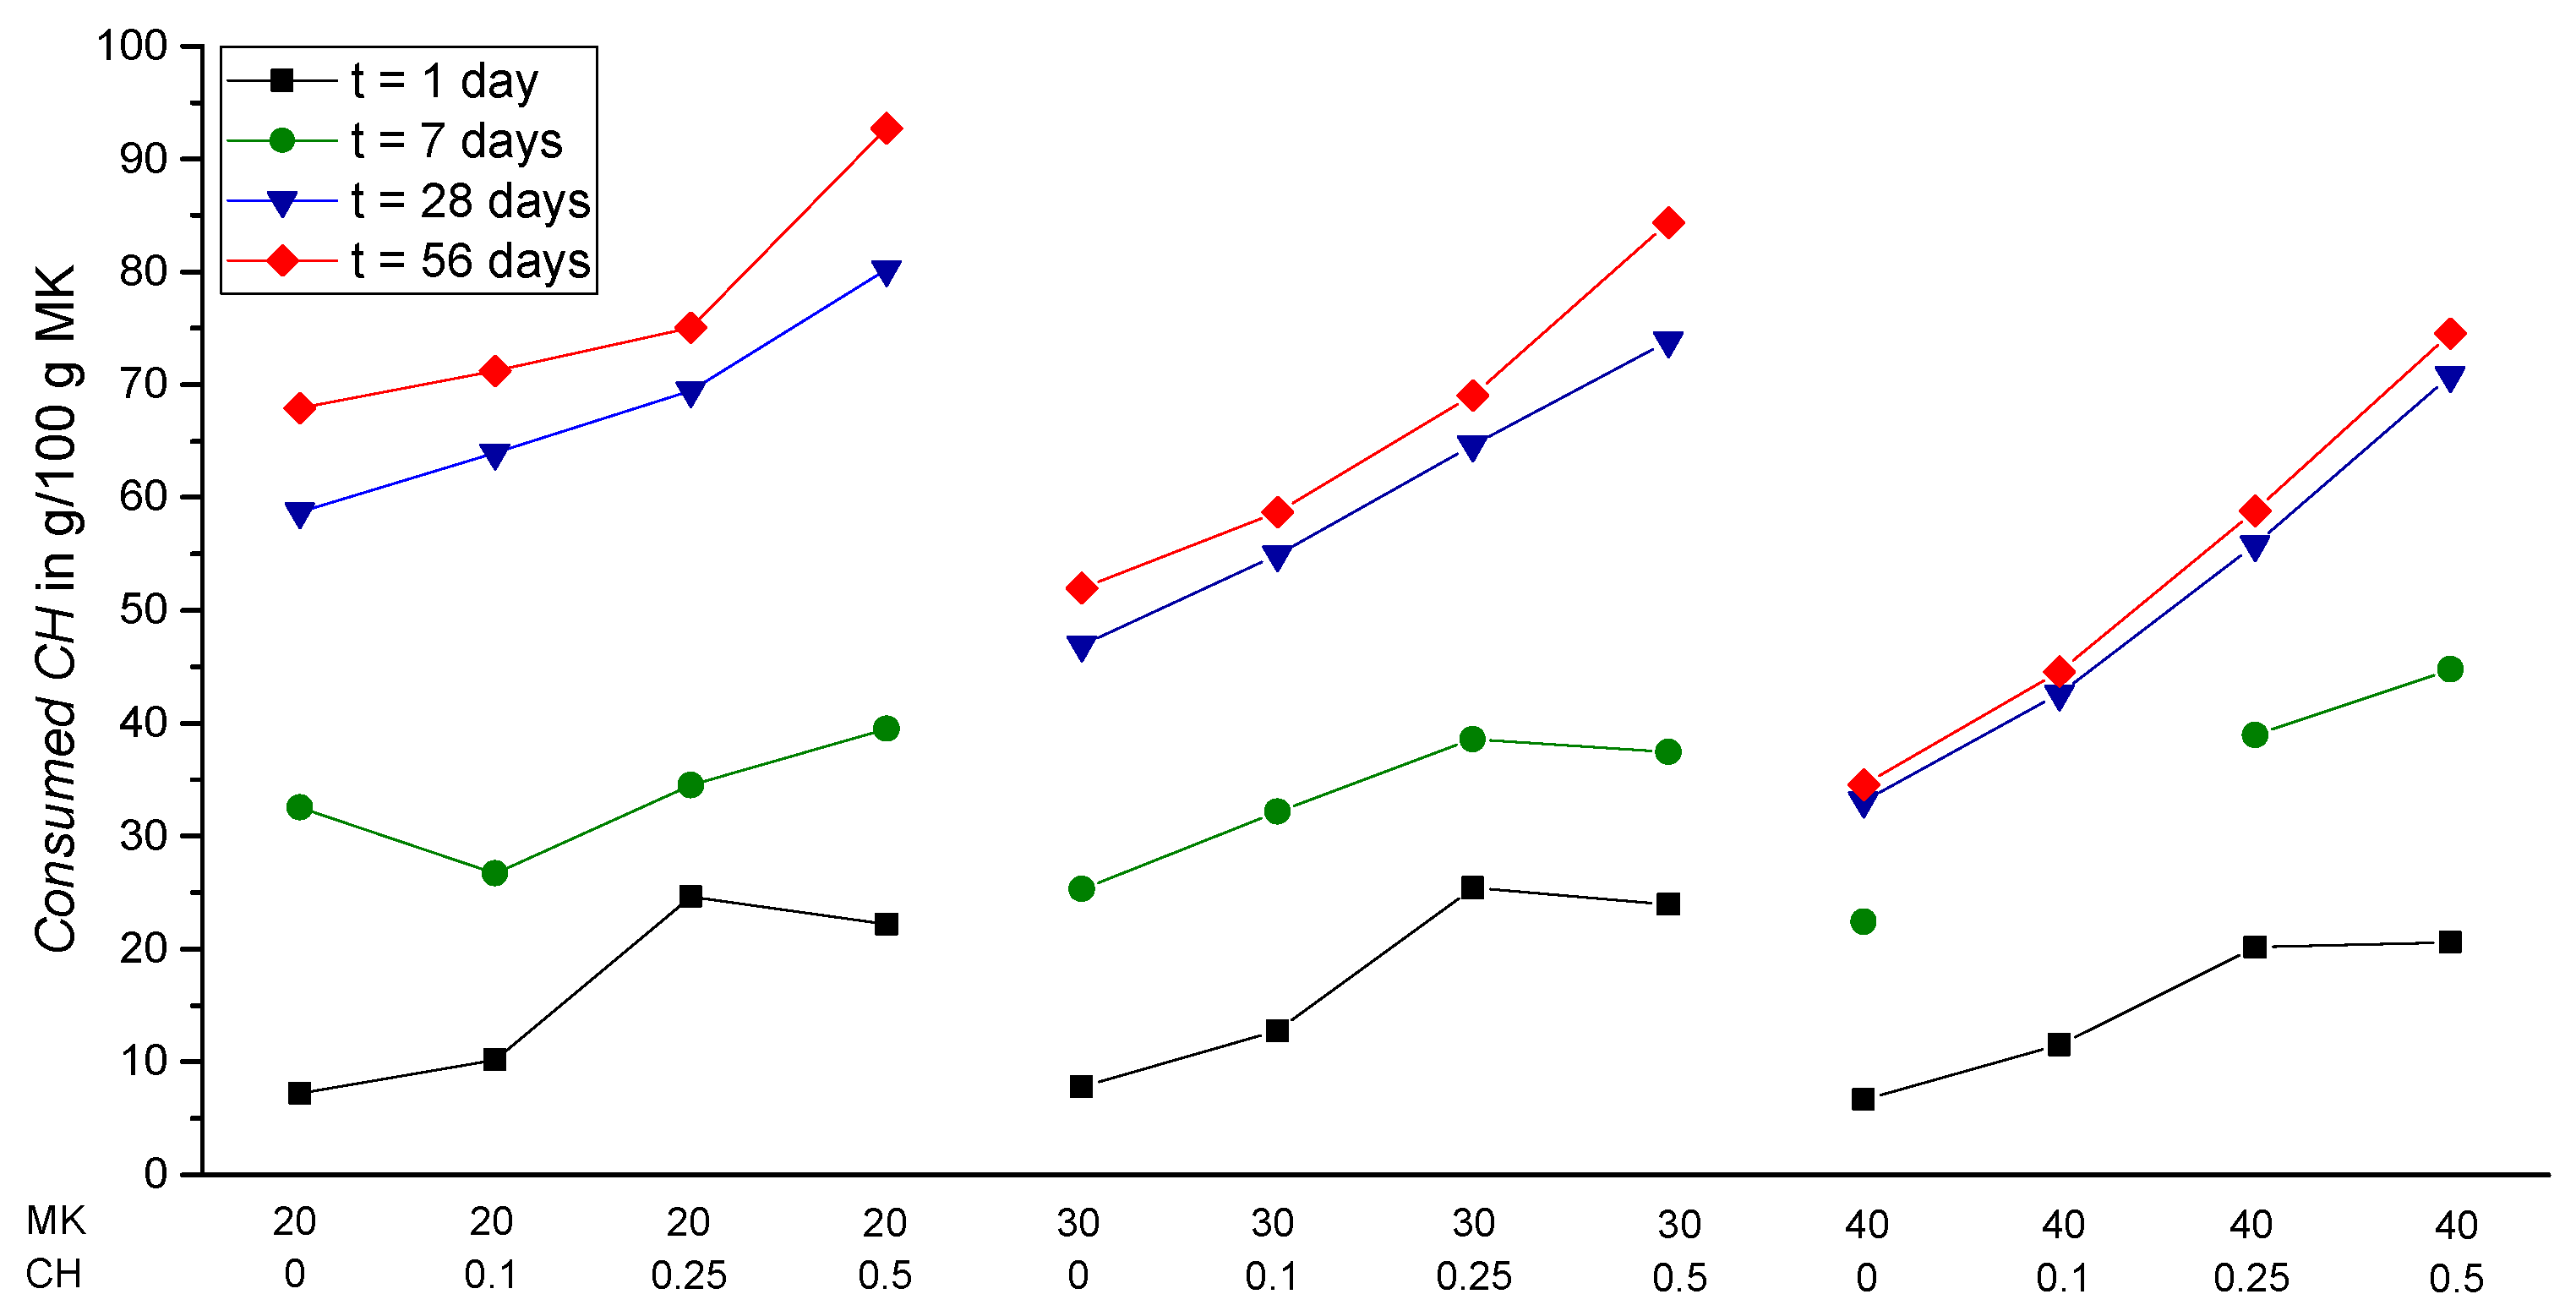
- Consumed CH is the amount of CH consumed by the pozzolanic reaction of MK in g/100 g binder;
- CH_PC is the amount of CH produced by PC hydration (t = x) in g/100 g binder;
- CH_add is the amount of additionally added CH in the initial binder (t = 0) in g/100 g binder or wt.%, respectively;
- CH is the amount of calcium hydroxide in the sample (t = x) in g/100 g binder;
- k is the replacement ratio of PC by MK in wt.%;
- CH_MK0 is the amount of CH in the reference sample without MK (t = x) in g/100 g binder (calculated according to Equation (5)).
- m600*(2) is the normalization value for scenario 2 in wt.%;
- m600* is the corrected mass at 600 °C taken from TGA data in wt.% (m600 shown in Figure 3, corrected according to Equation (4));
- ML_CH* is the corrected mass loss between approximately 400 °C and 500 °C determined with the tangential method from TGA data in wt.% (ML_CH shown in Figure 3, corrected according to Equation (4)).
3. Results and Discussion
4. Conclusions
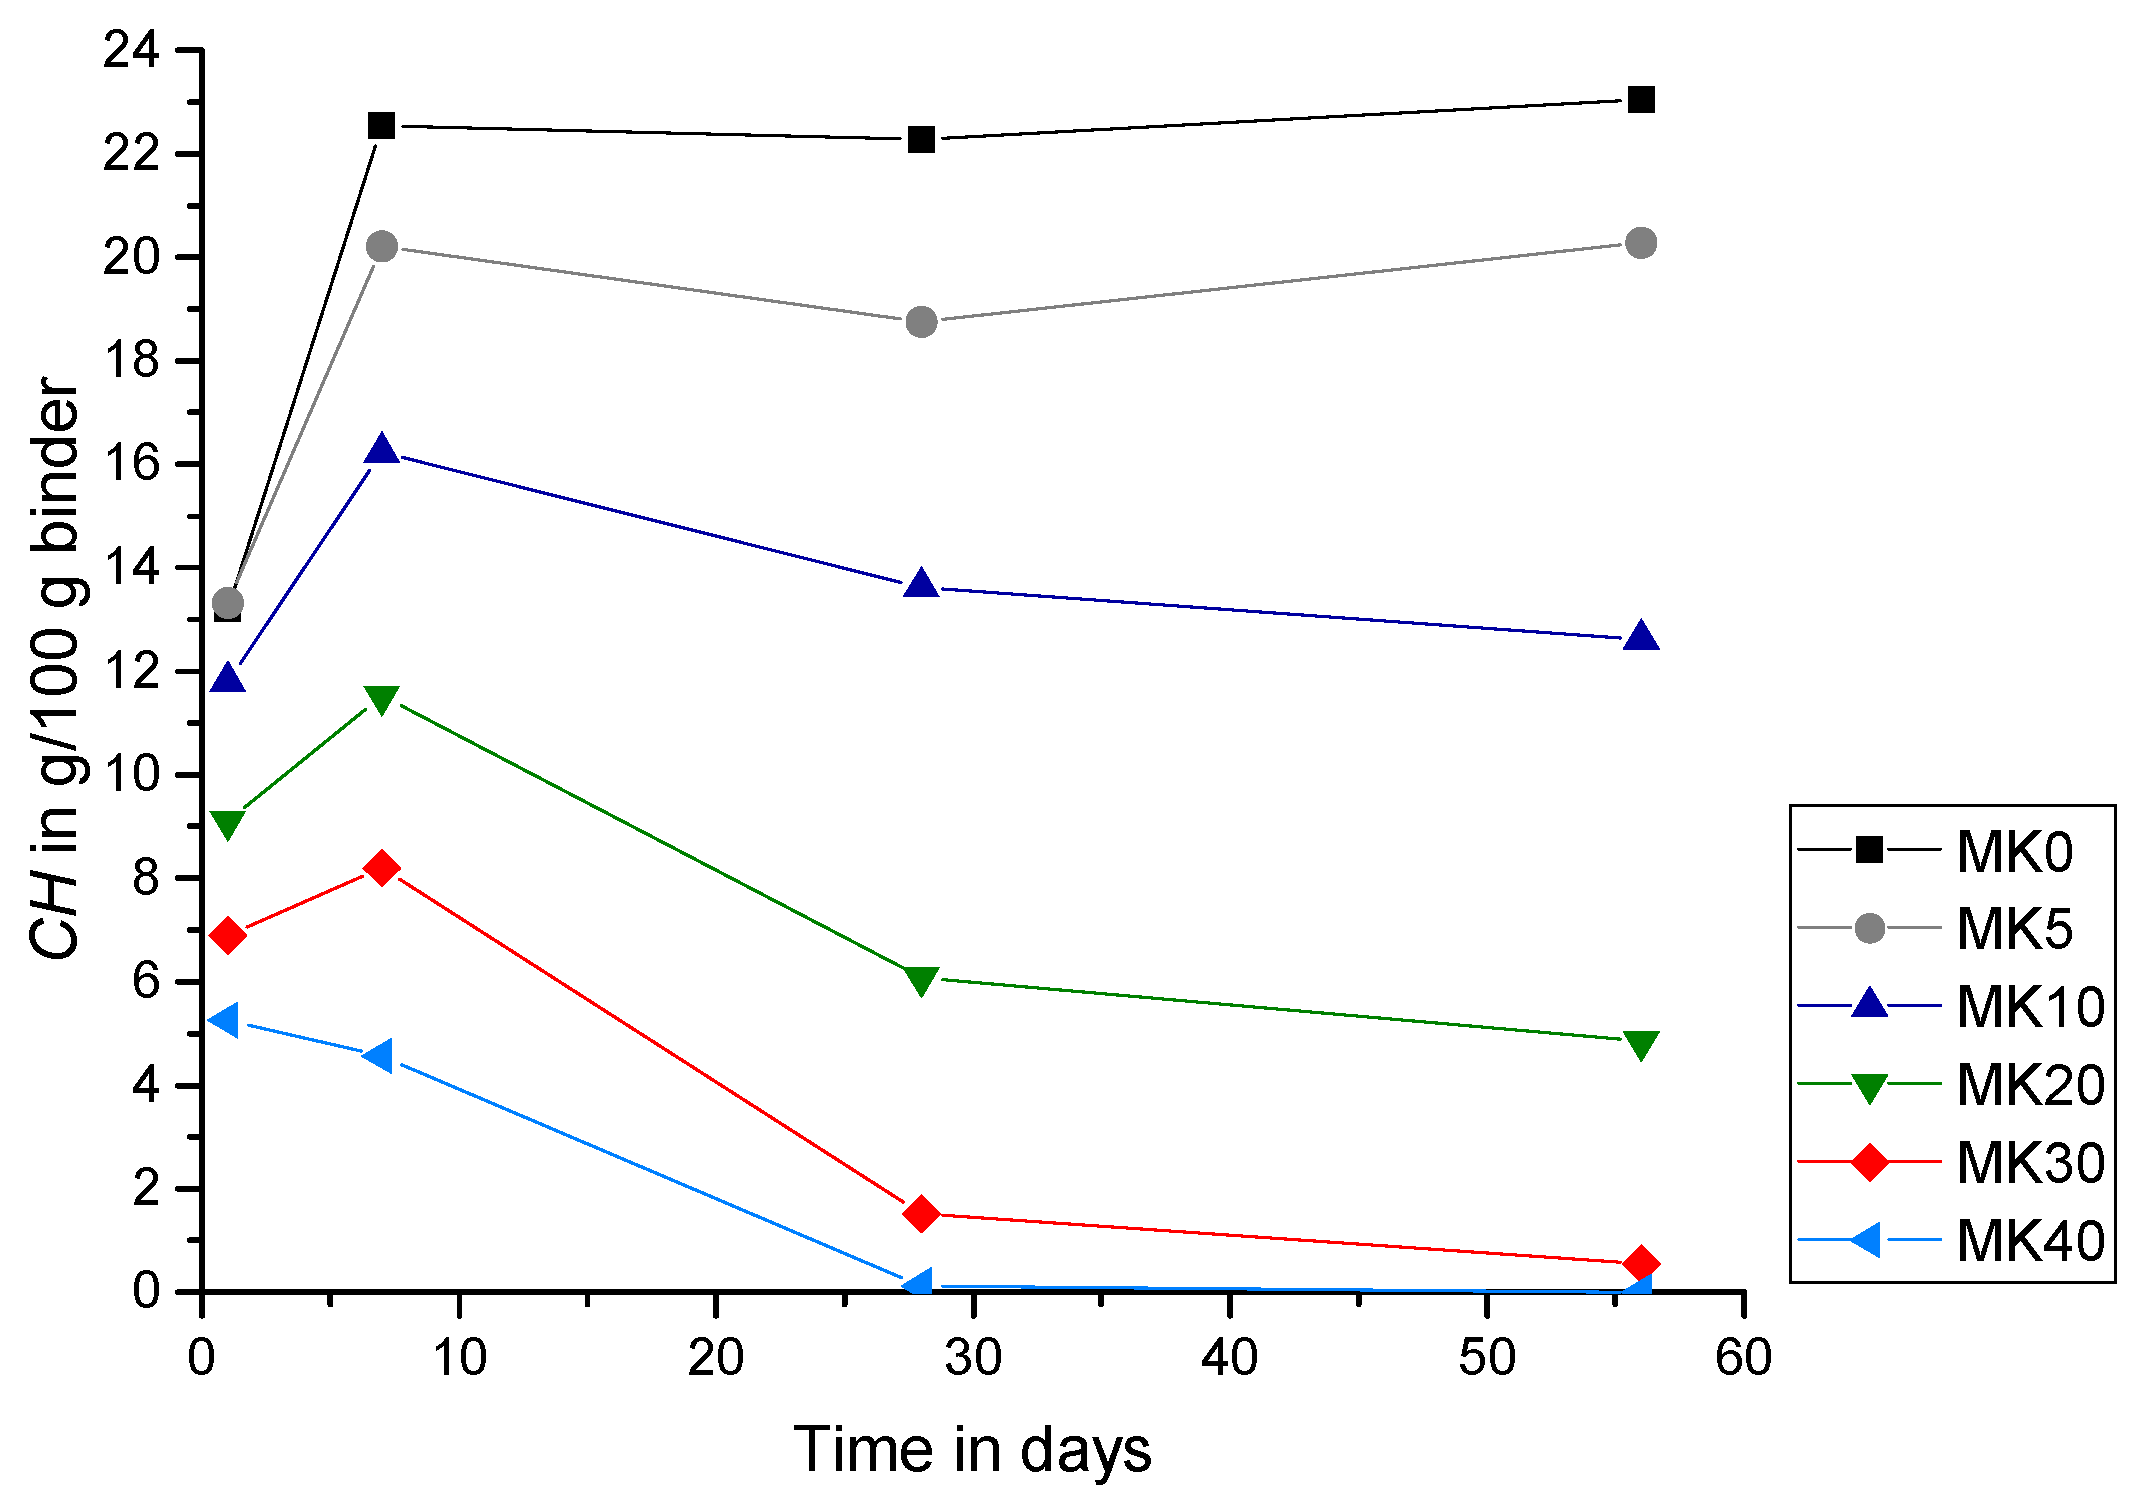
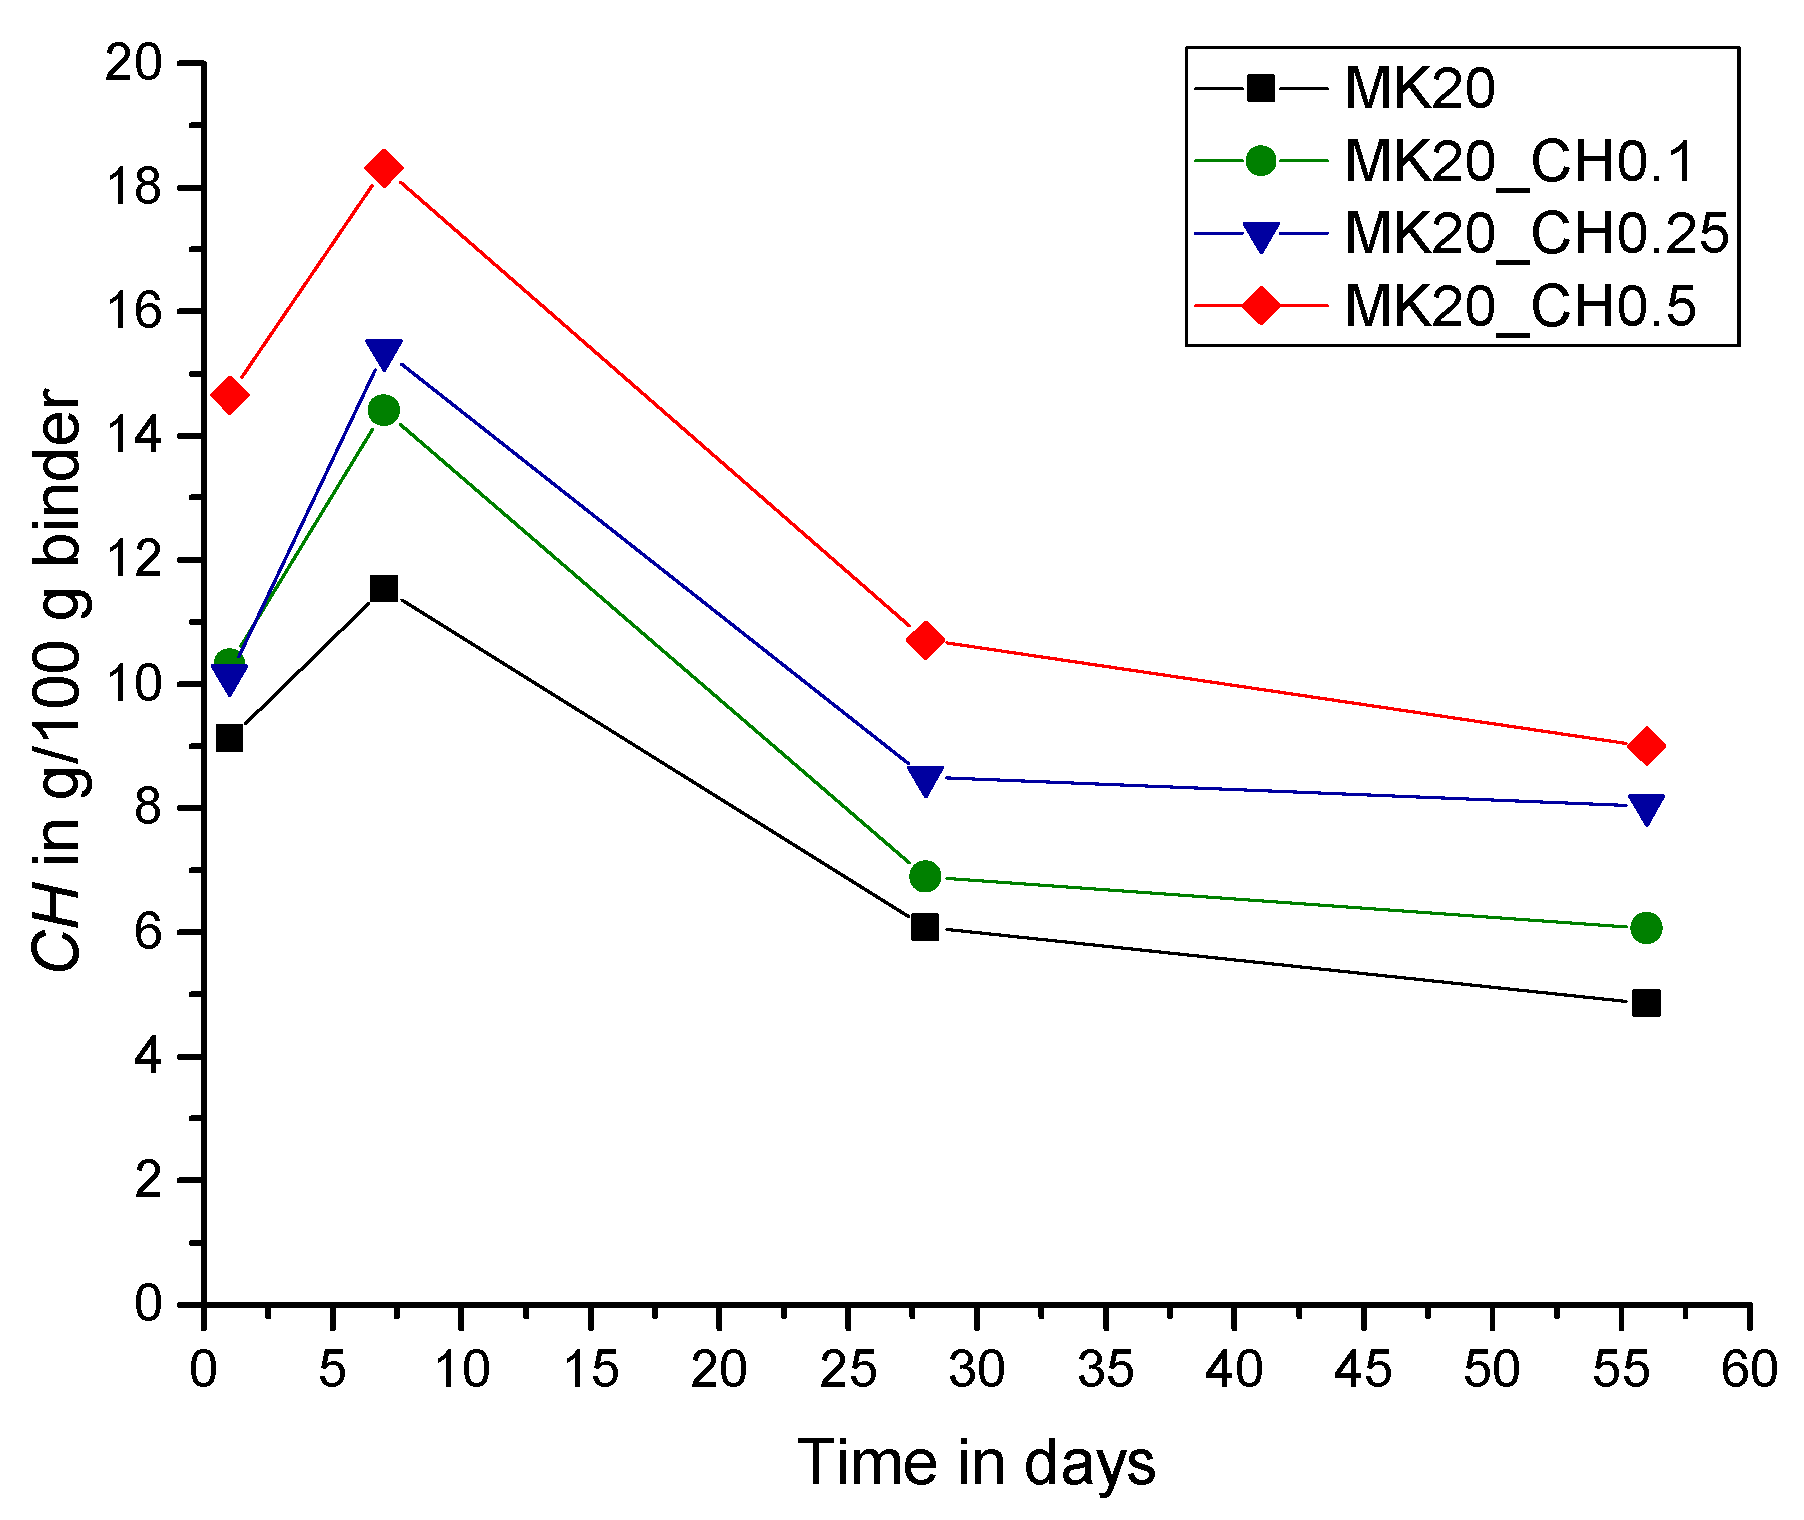
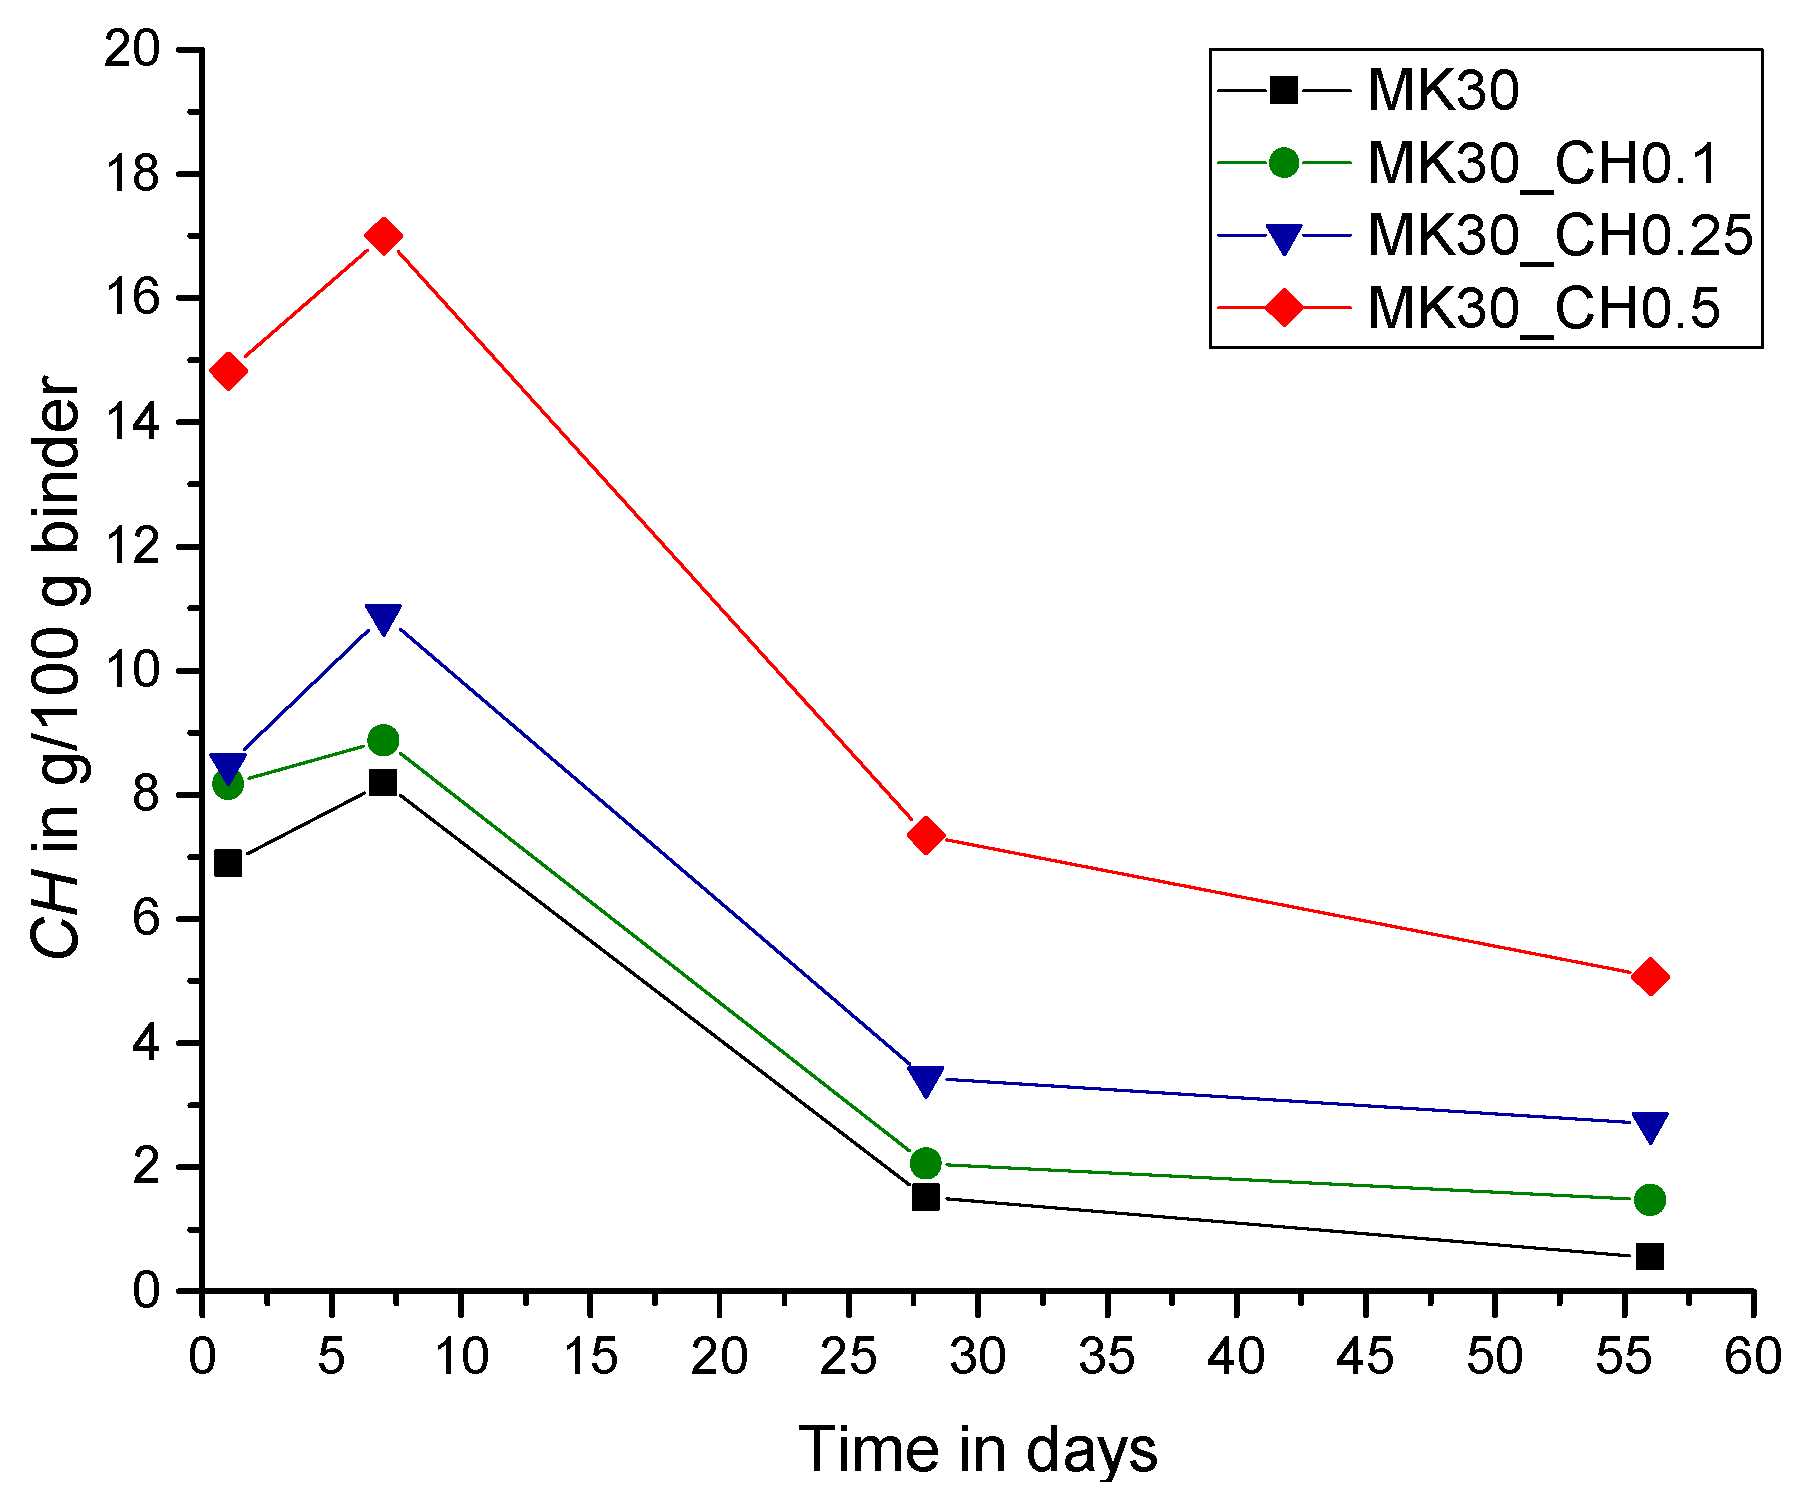
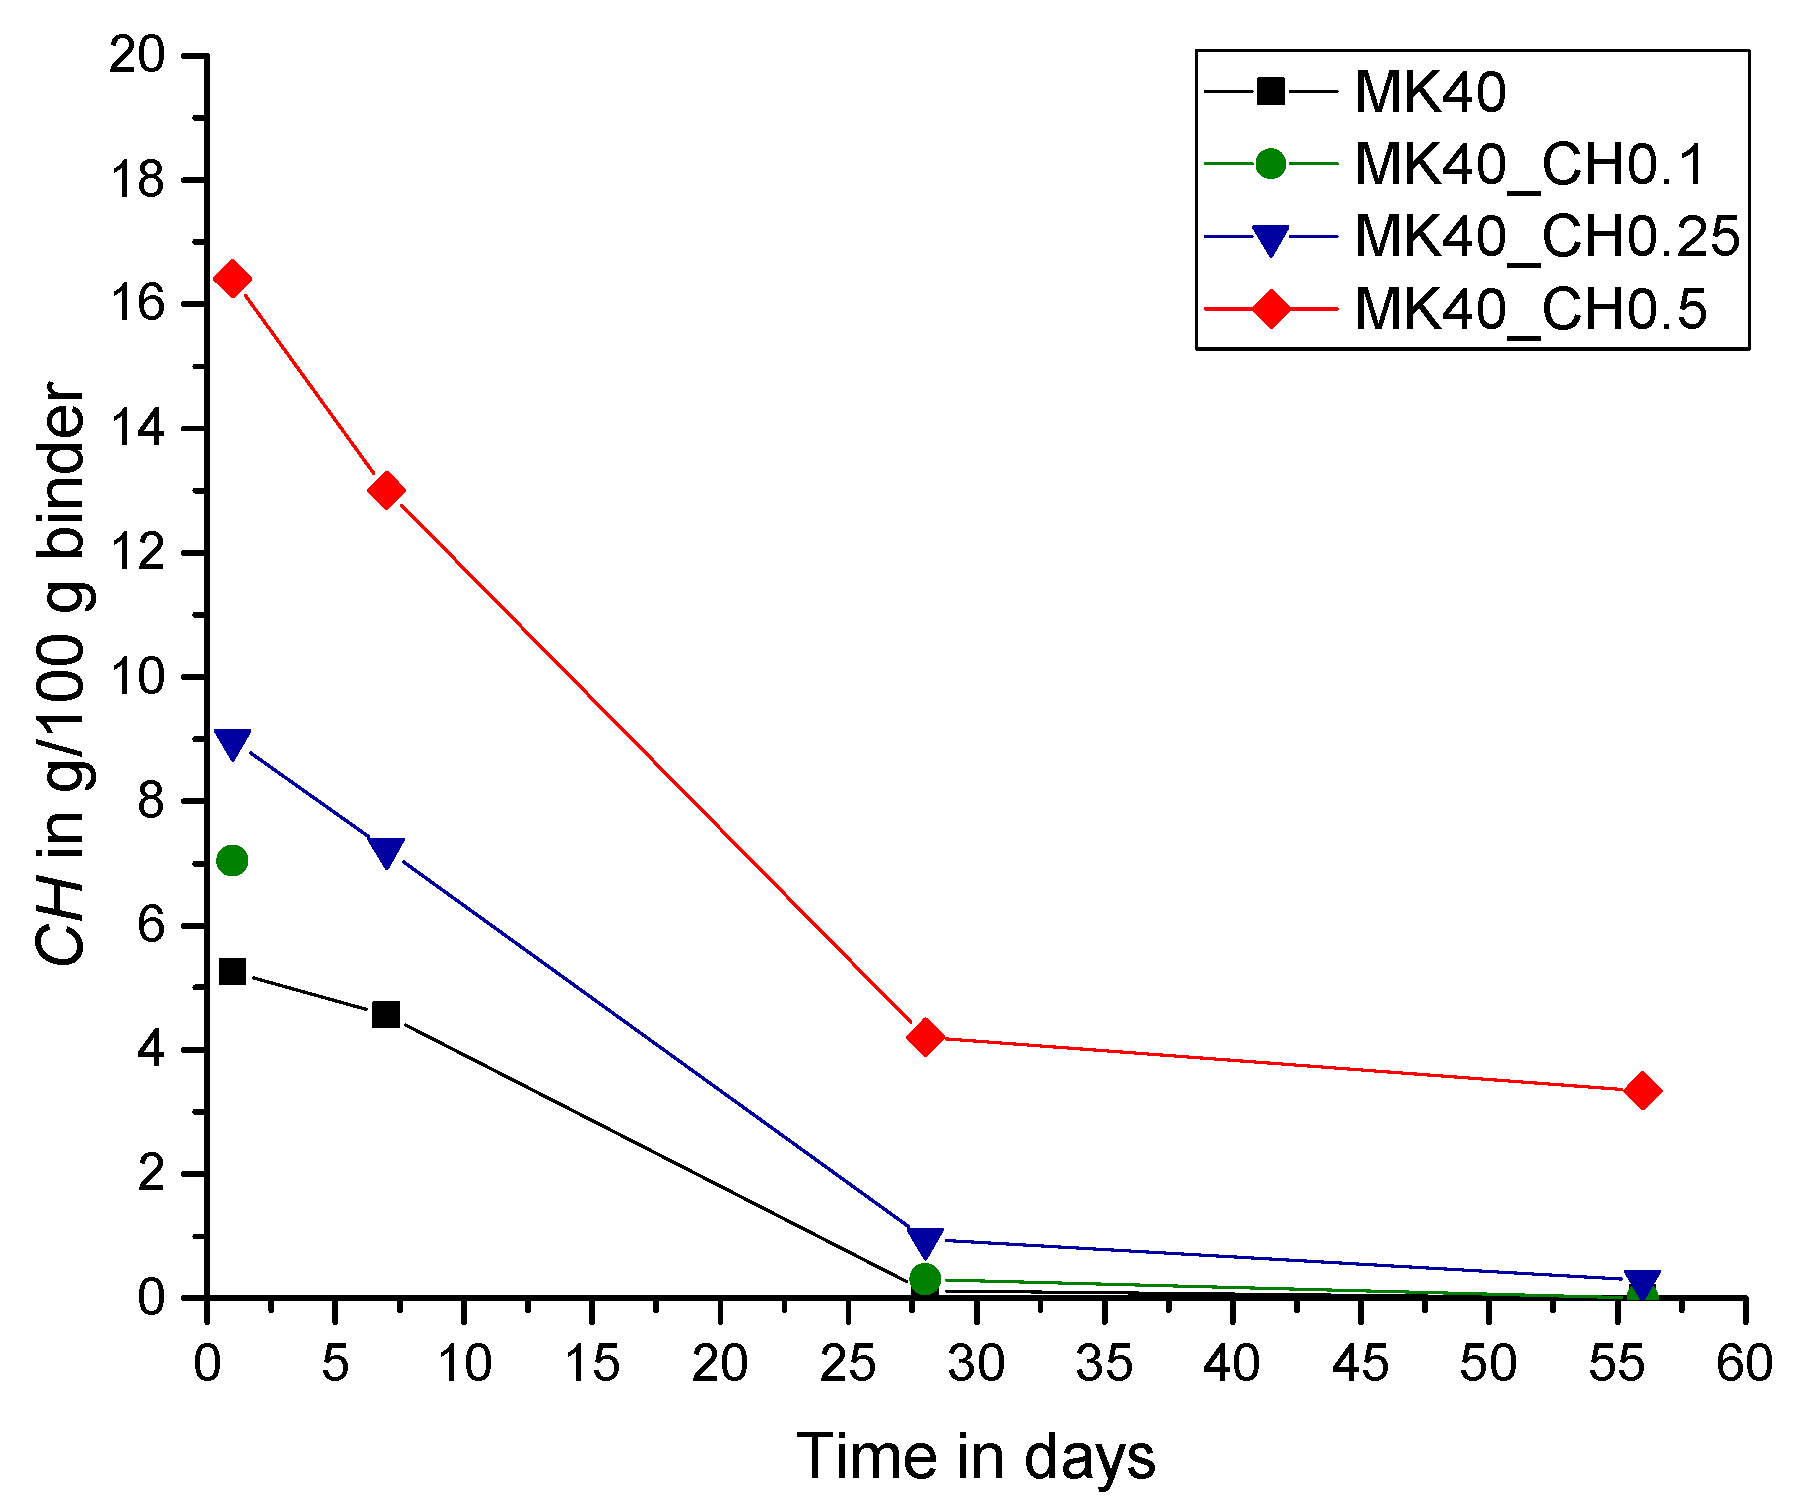
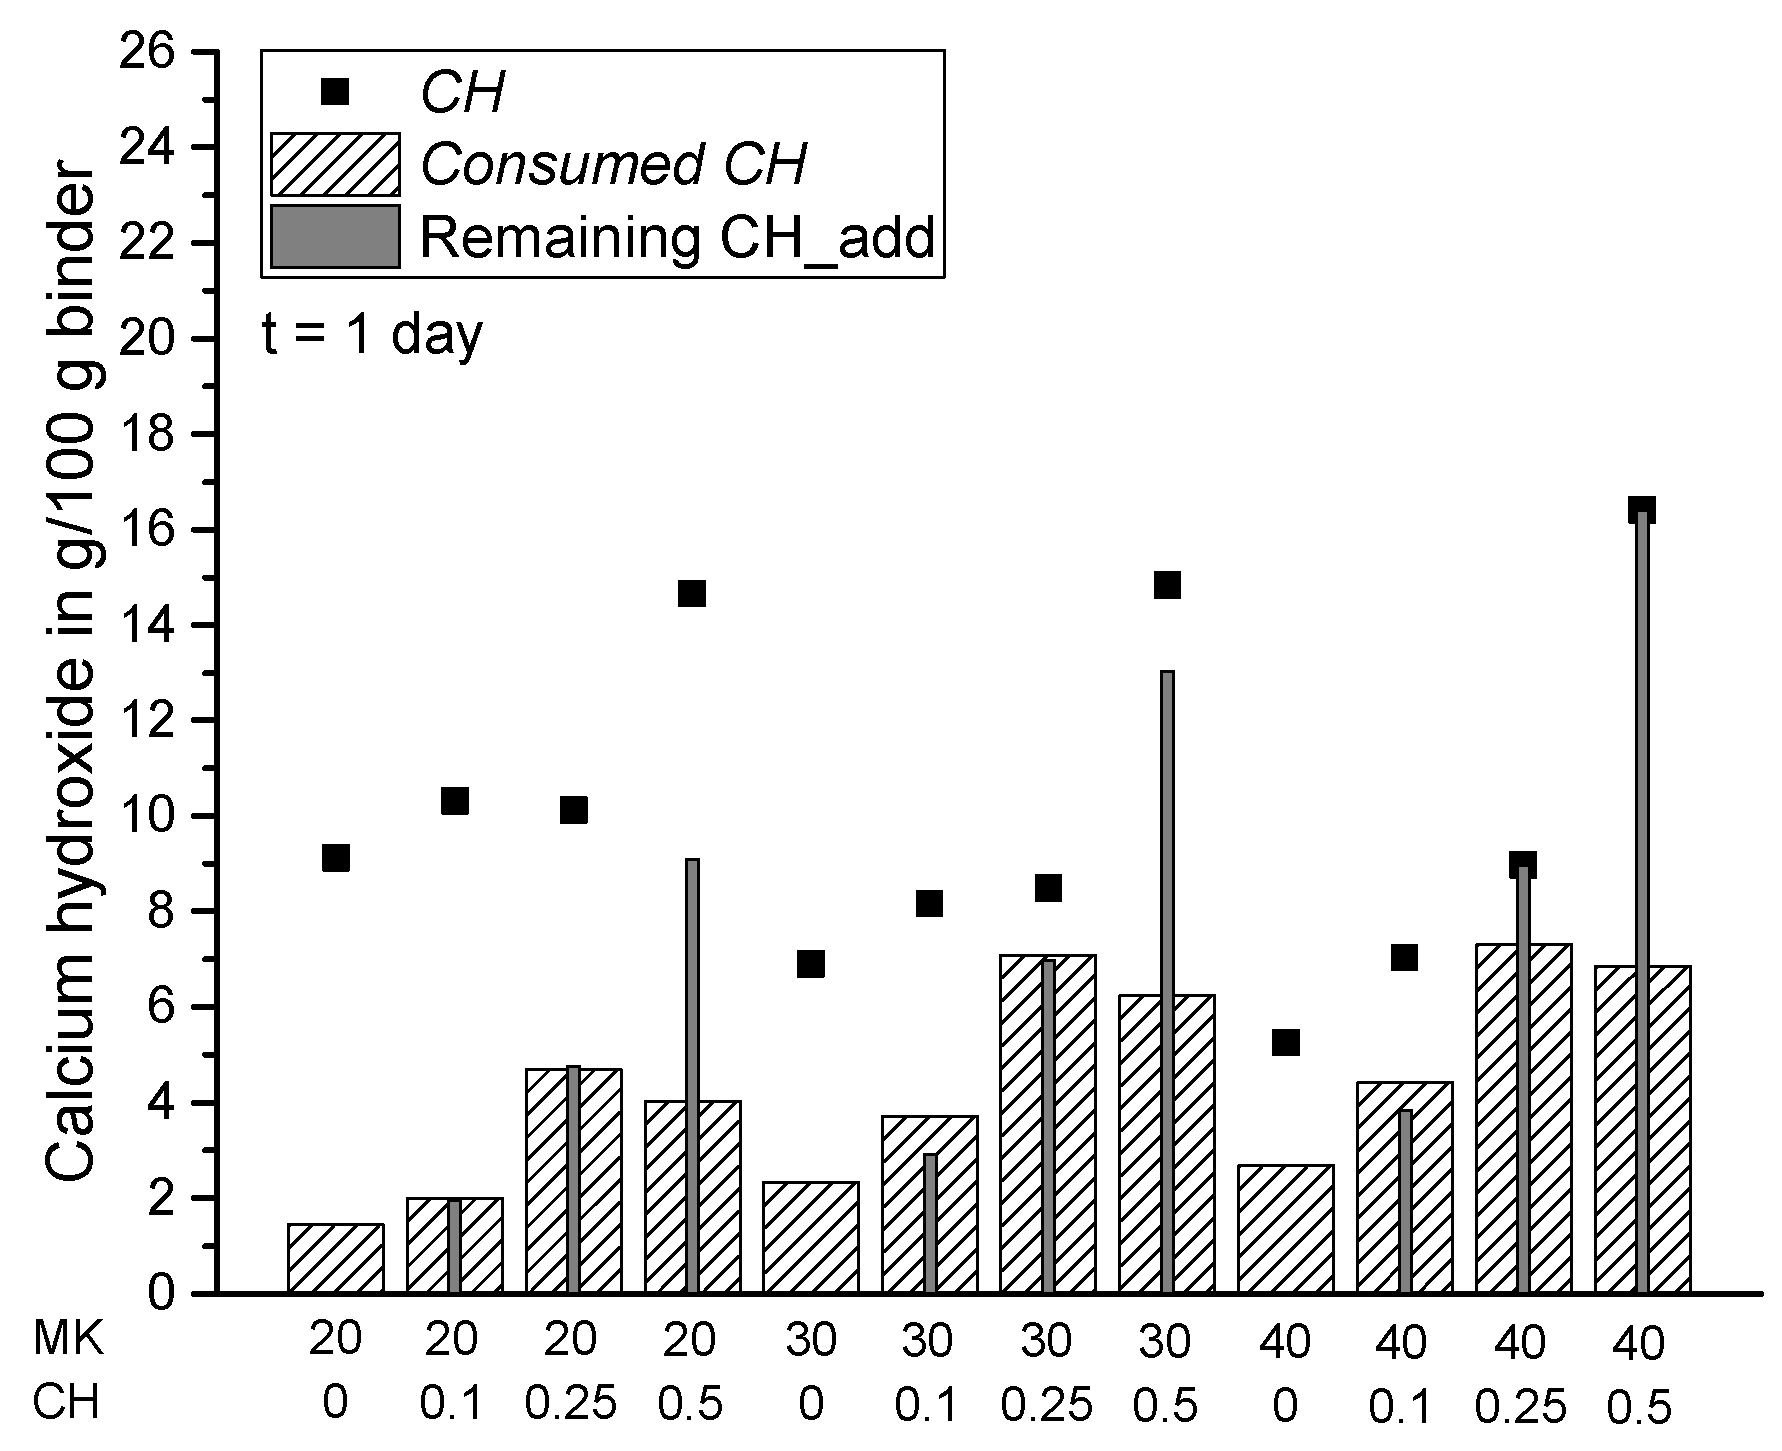
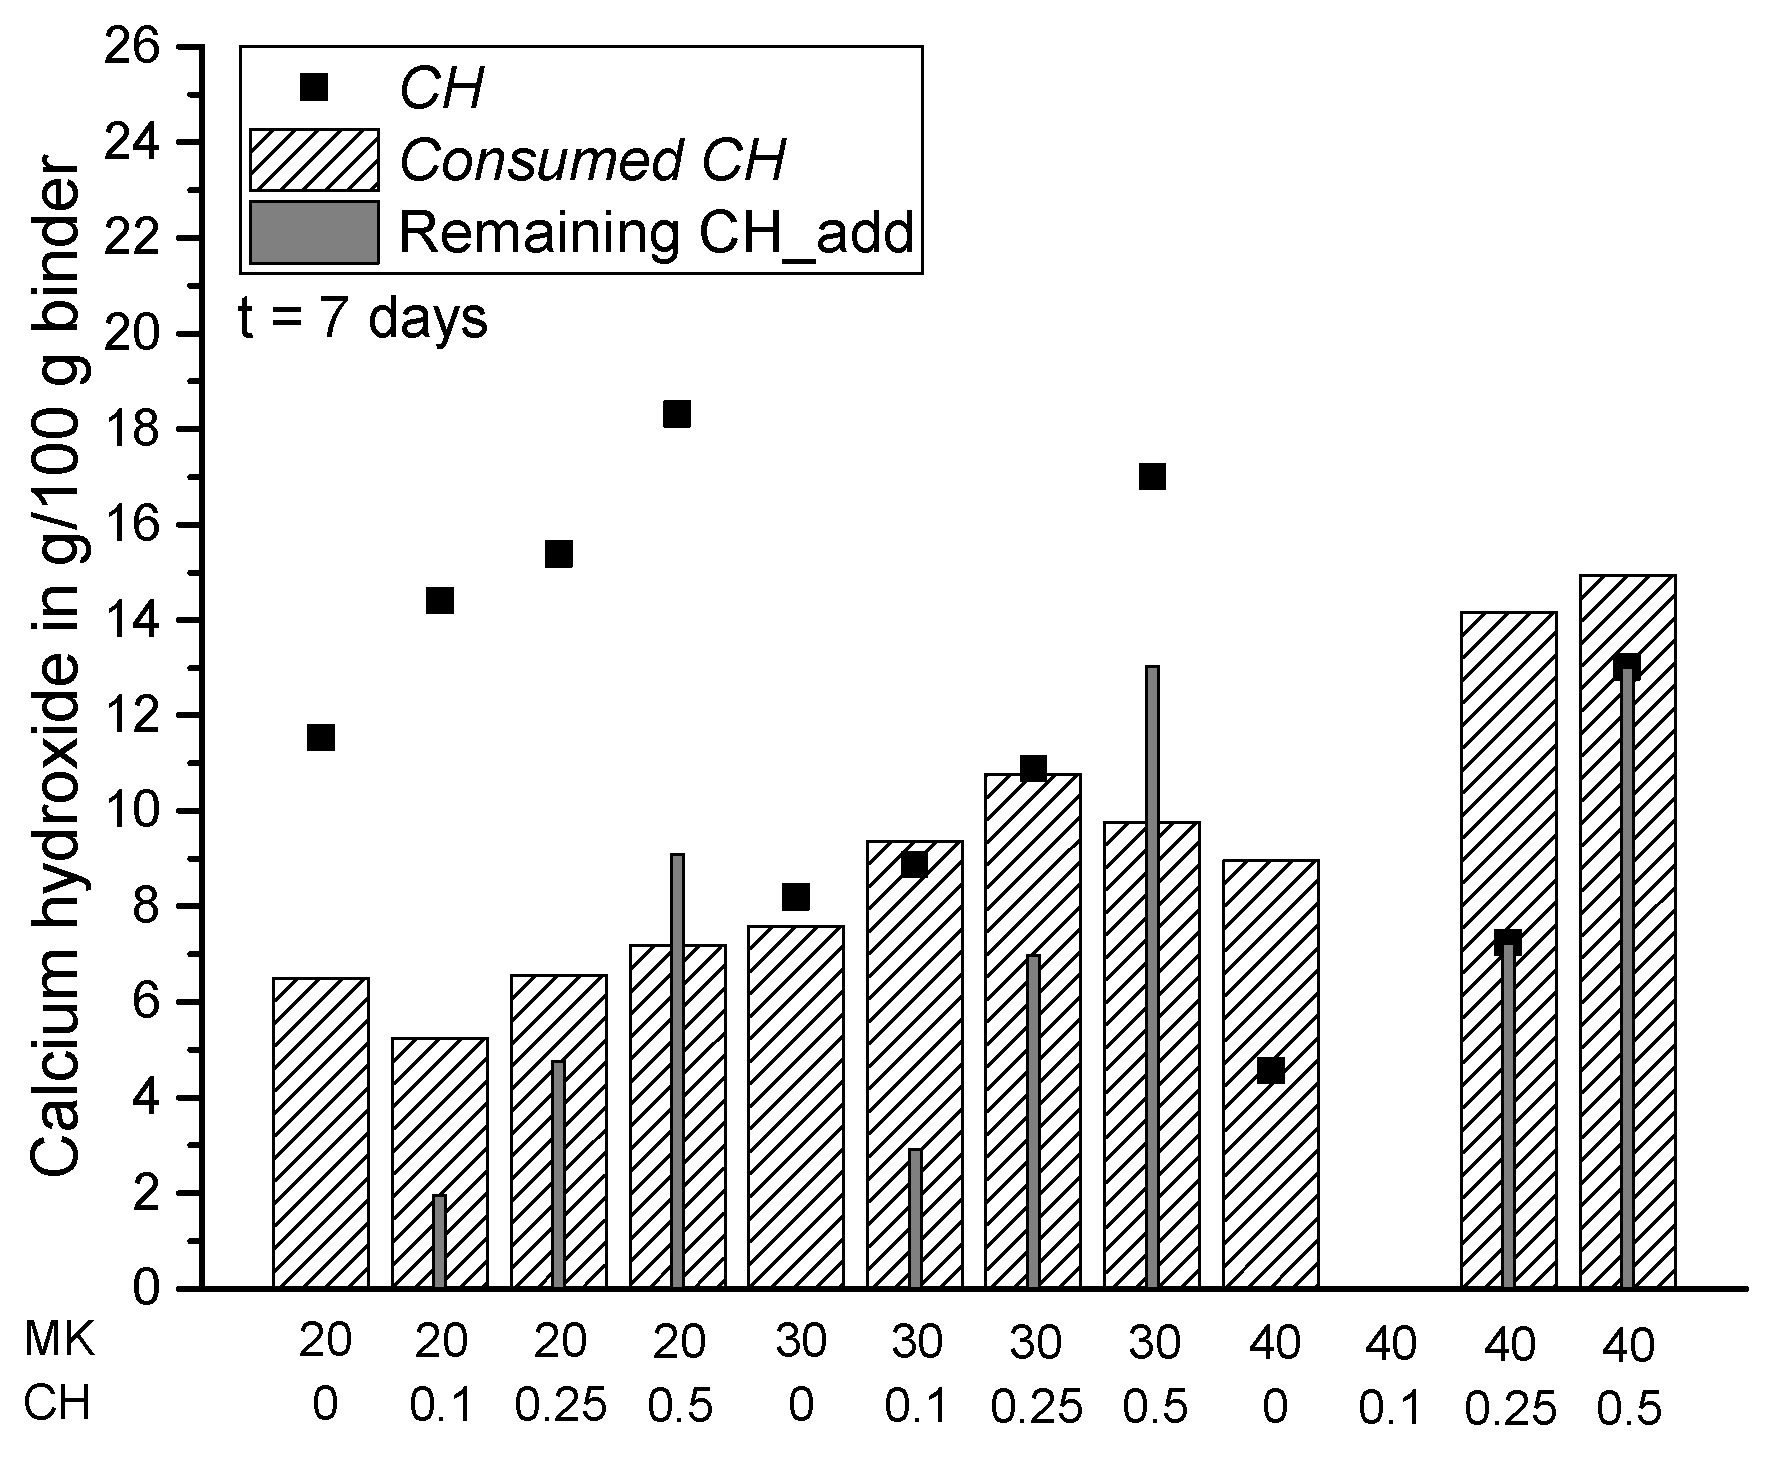
- For replacement ratios of 20 and 30 wt.% MK, an increase in calcium hydroxide (CH) is observed until the seventh day, followed by a decrease during further hydration time. For the samples with a replacement ratio of 40 wt.% MK, the reduction of CH already starts at the first day.
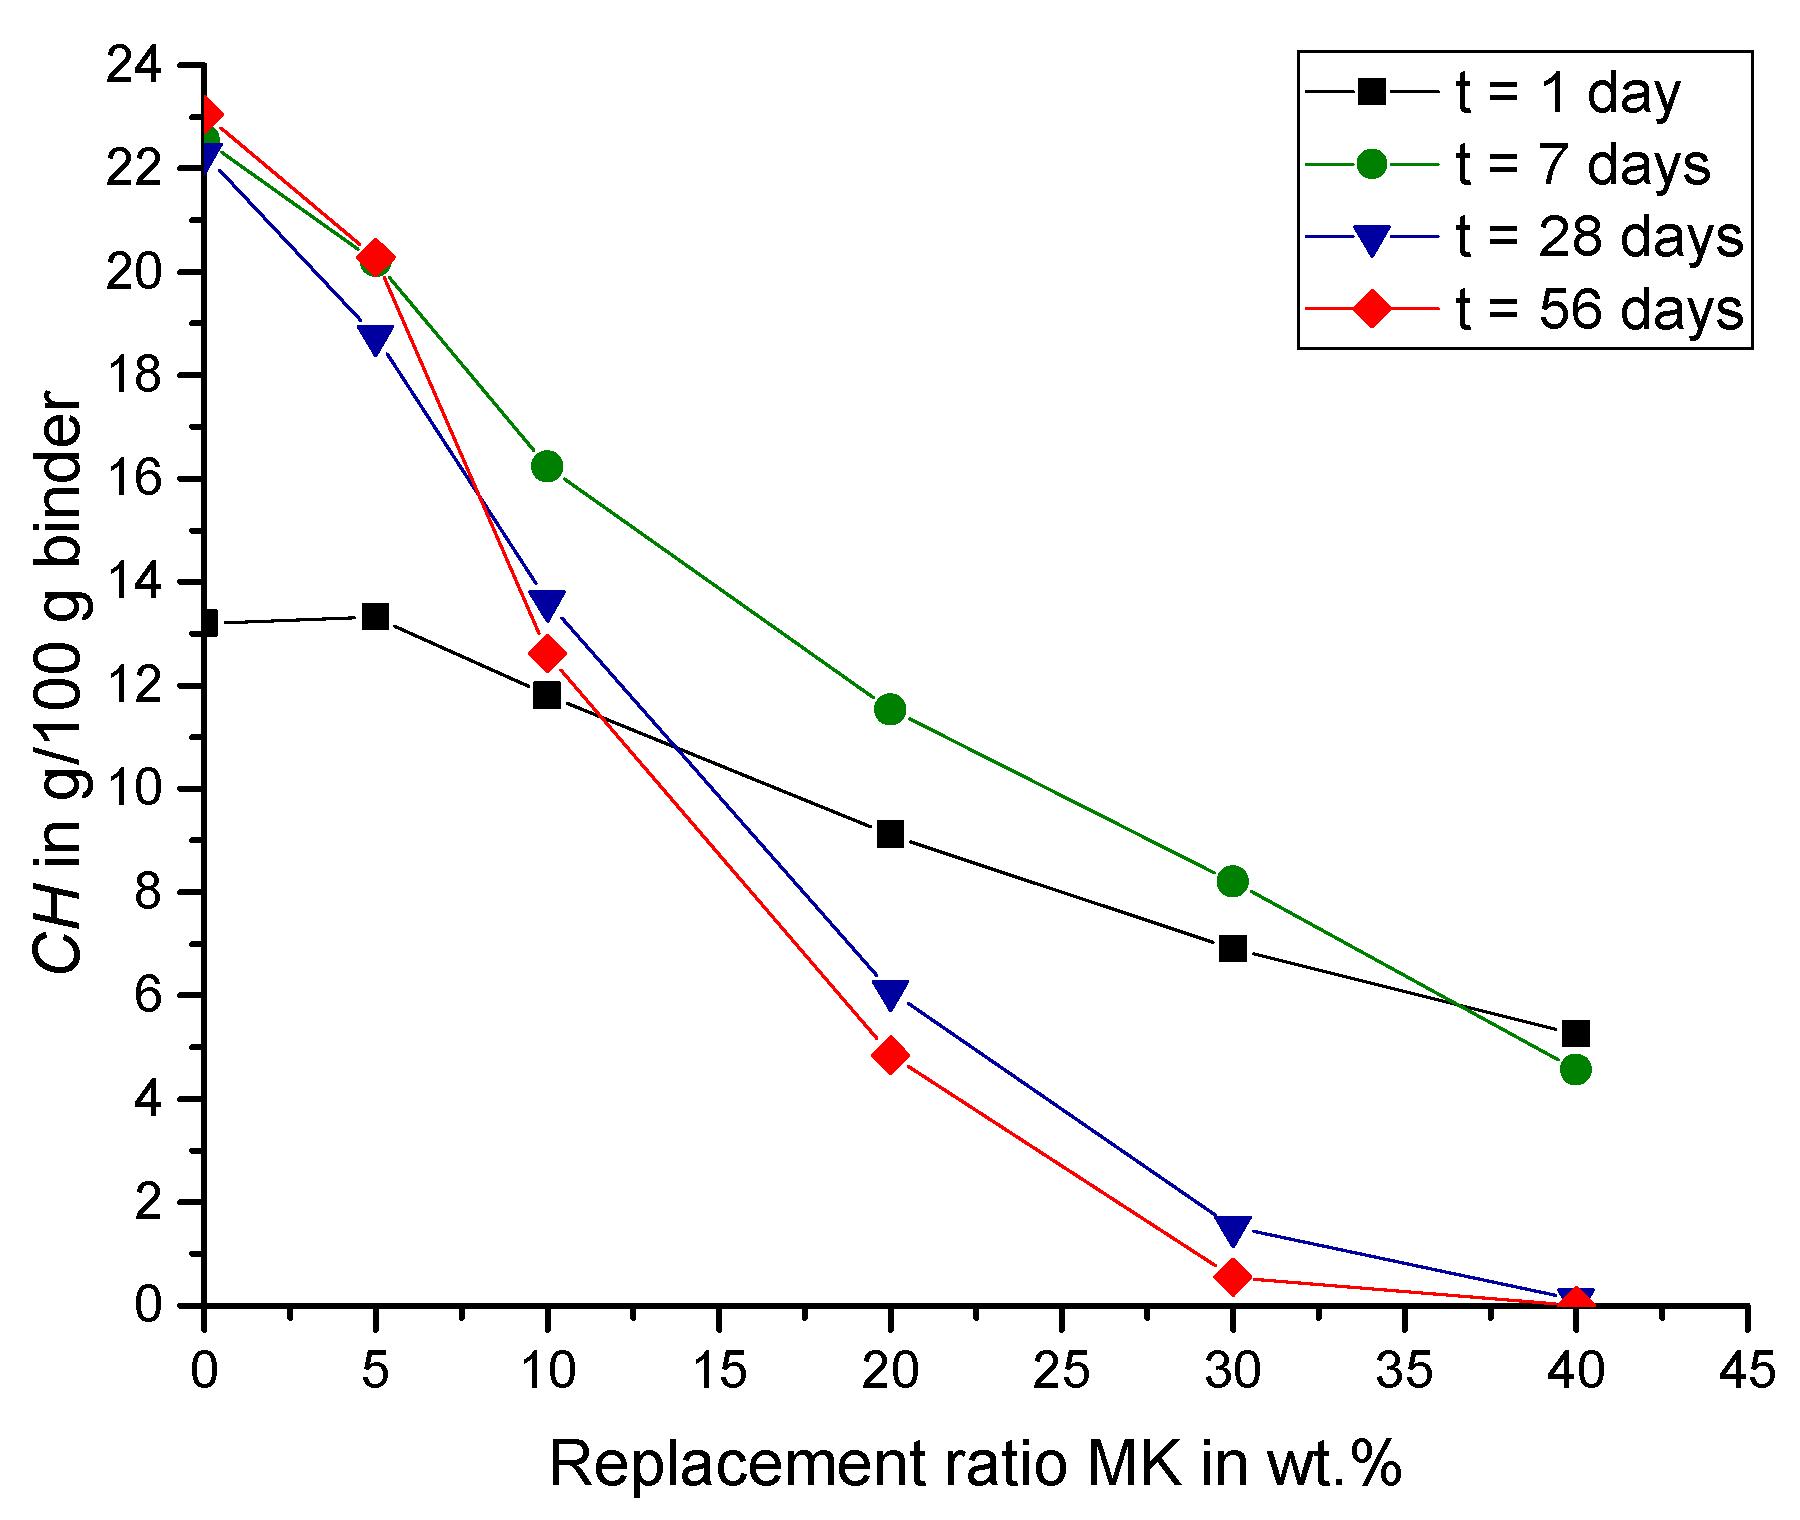
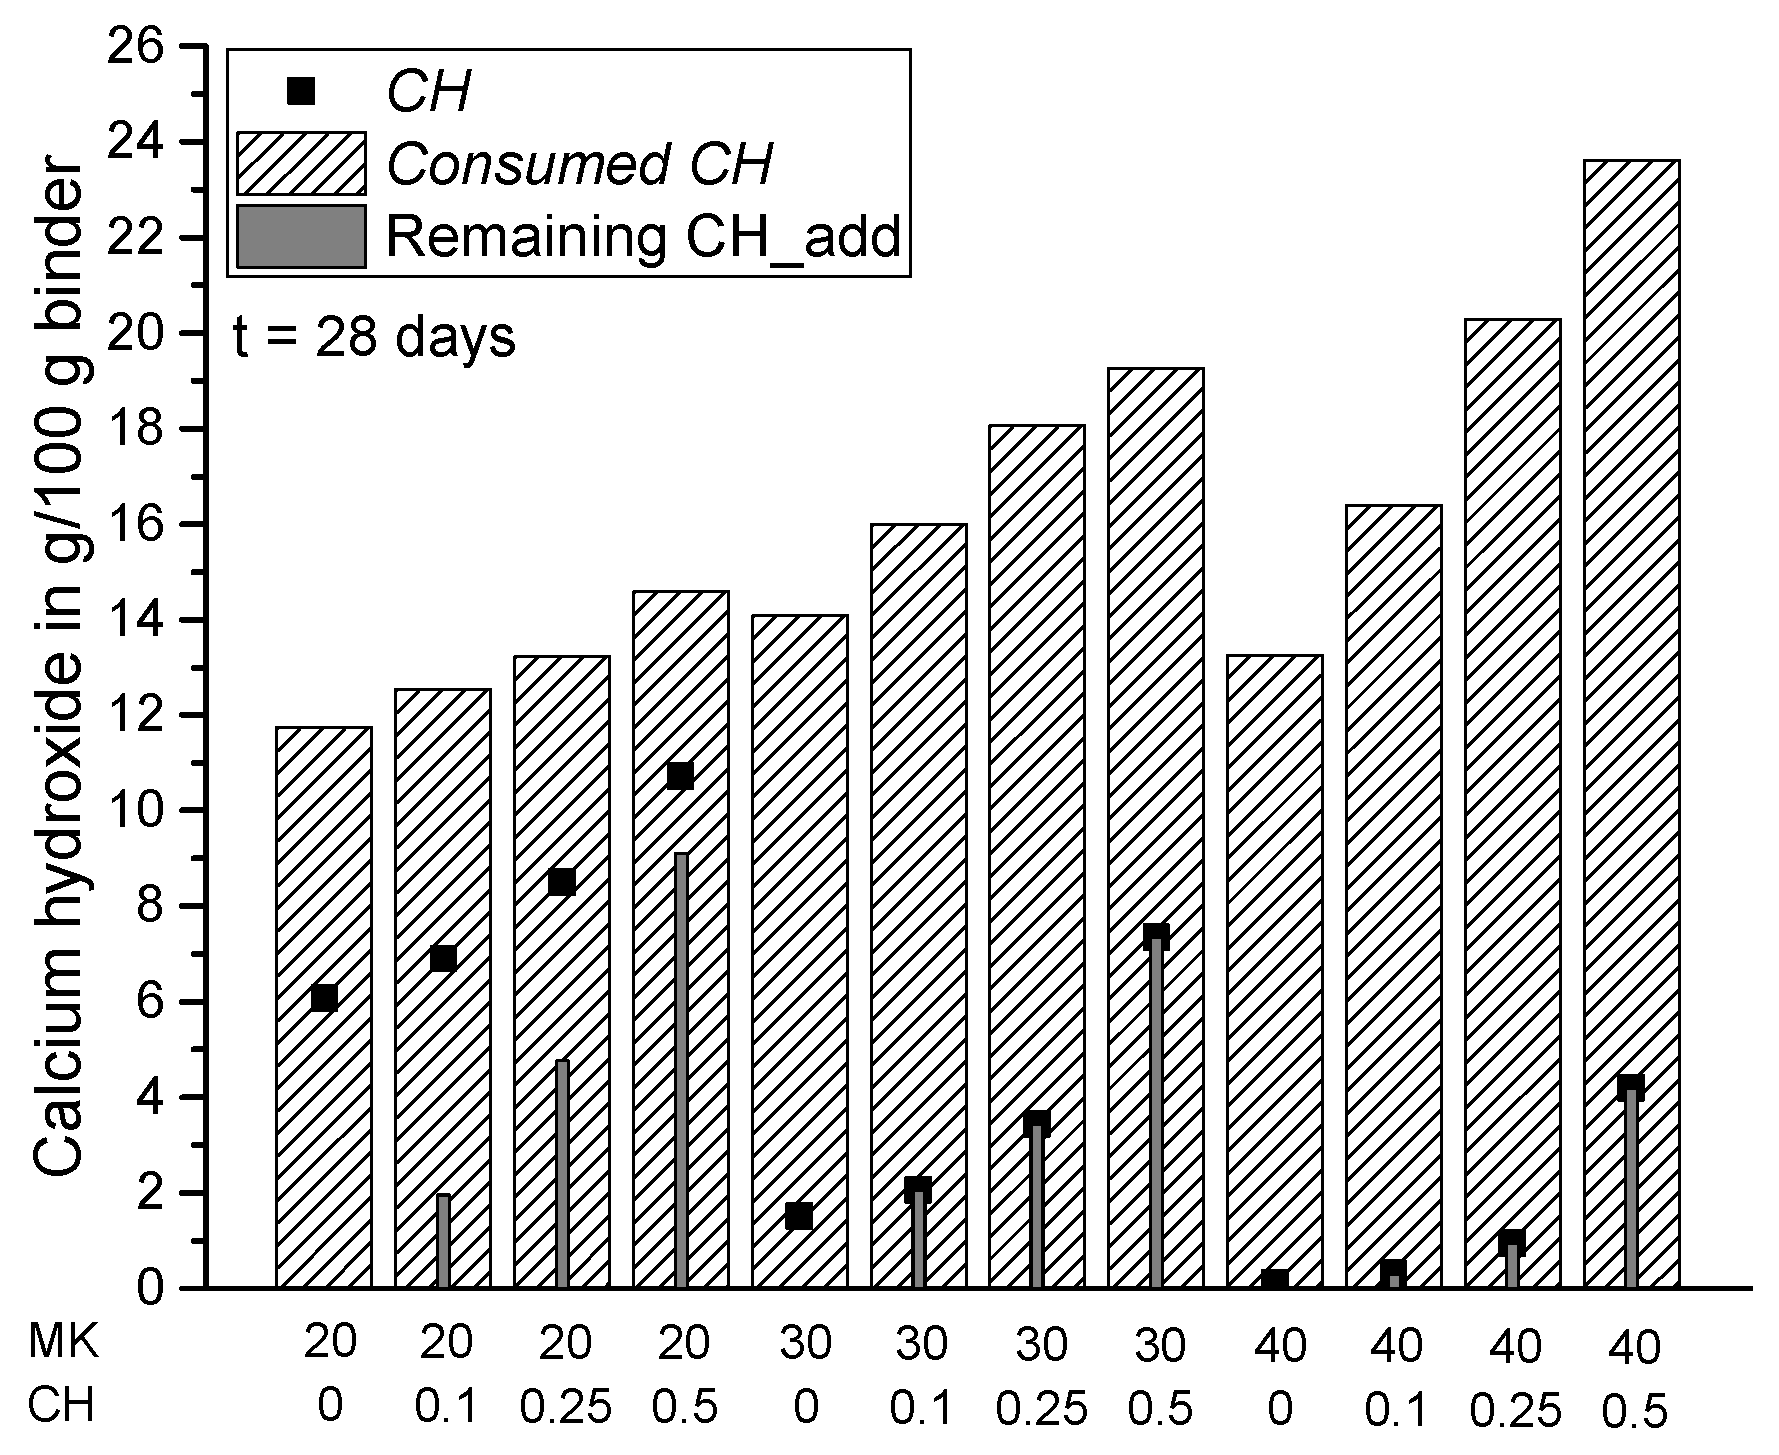
- For samples without CH_add, CH consumption by pozzolanic reaction of MK after 28 and 56 days is the highest with a replacement ratio of 30 wt.% MK.
- For samples without CH_add, replacement ratios of 30 wt.% MK or higher result in a complete consumption of CH after 28 days at the latest so that the pozzolanic reaction of MK is limited by the amount of CH supplied by cement hydration in these samples.
- CH_add leads to a stronger pozzolanic reaction of MK based on the calculated CH consumption.
Author Contributions
Funding
Institutional Review Board Statement
Informed Consent Statement
Data Availability Statement
Acknowledgments
Conflicts of Interest
References
- Statista. Worldwide Tall Building Completions in 2019, by Structural Material. 2021. Available online: https://www.statista.com/statistics/319931/structural-materials-of-tall-buildings-worldwide/ (accessed on 3 May 2021).
- European Cement Association (CEMBUREAU). 2019 Activity Report; European Cement Association (CEMBUREAU): Brussels, Belgium, 2020. [Google Scholar]
- WWF Germany. Climate Protection in the Concrete and Cement Industry. Background and Possible Courses of Action. 2019. Available online: https://www.wwf.de/fileadmin/fm-wwf/Publikationen-PDF/WEB_WWF_Zement_Broschuere_EN.pdf (accessed on 7 December 2021).
- Schneider, M.; Romer, M.; Tschudin, M.; Bolio, H. Sustainable cement production—Present and future. Cem. Concr. Res. 2011, 41, 642–650. [Google Scholar] [CrossRef]
- Carević, I.; Serdar, M.; Štirmer, N.; Ukrainczyk, N. Preliminary screening of wood biomass ashes for partial resources replacements in cementitious materials. J. Clean. Prod. 2019, 229, 1045–1064. [Google Scholar] [CrossRef]
- Schwarzkopp, F.; Dresche, J.; Gornig, M.; Blazejczak, J. Die Nachfrage nach Primär- und Sekundärrohstoffen der Steine-und-Erden-Industrie bis 2035 in Deutschland; Technical Report for German Building Materials Association: Berlin, Germany, 2016. [Google Scholar]
- Beuntner, N. Zur Eignung und Wirkungsweise Calcinierter Tone als Reaktive Bindemittelkomponente im Zement. Ph.D. Thesis, University of the German Federal Armed Forces, Munich, Germany, 23 October 2017. [Google Scholar]
- Trümer, A. Calcinierte Tone als Puzzolane der Zukunft—Von den Rohstoffen bis zur Wirkung im Beton. Ph.D. Thesis, Bauhaus Weimar University, Weimar, Germany, 28 January 2020. [Google Scholar]
- Danner, T. Reactivity of Calcined Clays. Ph.D. Thesis, Norwegian University of Science and Technology, Trondheim, Norway, August 2013. [Google Scholar]
- Ito, A.; Wagai, R. Global distribution of clay-size minerals on land surface for biogeochemical and climatological studies. Sci. Data 2017, 4, 170103. [Google Scholar] [CrossRef]
- He, C.; Osbaeck, B.; Makovicky, E. Pozzolanic reactions of six principal clay minerals: Activation, reactivity assessments and technological effects. Cem. Concr. Res. 1995, 25, 1691–1702. [Google Scholar] [CrossRef]
- Hollanders, S.; Adriaens, R.; Skibsted, J.; Cizer, Ö.; Elsen, J. Pozzolanic reactivity of pure calcined clays. Appl. Clay Sci. 2016, 132–133, 552–560. [Google Scholar] [CrossRef]
- Thienel, C.; Beuntner, N. Effects of calcined clay as low carbon cementing materials on the properties of concrete. In Concrete in the Low Carbon Era: Proceedings of the International Conference, Dundee, UK, 9–11 July 2012; University of Dundee: Dundee, UK, 2012. [Google Scholar]
- Berriel, S.S.; Díaz, Y.C.; Hernández, J.F.M.; Habert, G. Assessment of sustainability of low carbon cement in Cuba. Cement pilot production and prospective case. In Calcined Clays for Sustainable Concrete. Proceedings of the 1st International Conference on Calcinated Clays for Sustainable Concrete; Scrivener, K., Favier, A., Eds.; RILEM Bookseries Edition; Springer Science+Business Media B.V.: Dordrecht, The Netherlands, 2015; pp. 189–194. [Google Scholar]
- Weise, K. Über das Potenzial von Calciniertem Ton in Zementgebundenen Systemen; Springer Vieweg: Wiesbaden, Germany, 2020. [Google Scholar]
- Fernandez, R.; Martirena, F.; Scrivener, K. The origin of the pozzolanic activity of calcined clay minerals: A comparison between kaolinite, illite and montmorillonite. Cem. Concr. Res. 2011, 41, 113–122. [Google Scholar] [CrossRef]
- Bratoev, B.; Doykov, I.; Ninov, J.; Lenchev, A. Pozzolanic activity assessment of calcined clays with complex minerals content. Adv. Cem. Res. 2018, 30, 103–112. [Google Scholar] [CrossRef]
- Maier, M.; Beuntner, N.; Thienel, K.-C. An approach for the evaluation of local raw material potential for calcined clay as SCM, based on geological and mineralogical data: Examples from German Clay Deposits. In Calcined Clays for Sustainable Concrete; Bishnoi, S., Ed.; RILEM Bookseries Edition; Springer: Singapore, 2020; pp. 37–47. [Google Scholar]
- Justice, J.M.; Kurtis, K.E. Influence of Metakaolin Surface Area on Properties of Cement-Based Materials. J. Mater. Civ. Eng. 2007, 19, 762–771. [Google Scholar] [CrossRef]
- Murat, M. Hydration reaction and hardening of calcined clays and related minerals—I. Preliminary investigation on metakaolinite. Cem. Concr. Res. 1983, 13, 259–266. [Google Scholar] [CrossRef]
- Wild, S.; Khatib, J.M. Portlandite consumption in metakaolin cement pastes and mortars. Cem. Concr. Res. 1997, 27, 137–146. [Google Scholar] [CrossRef]
- Tironi, A.; Castellano, C.C.; Bonavetti, V.L.; Trezza, M.A.; Scian, A.N.; Irassar, E.F. Kaolinitic calcined clays—Portland cement system: Hydration and properties. Constr. Build. Mater. 2014, 64, 215–221. [Google Scholar] [CrossRef]
- Khater, H.M. Influence of metakaolin on resistivity of cement mortar to magnesium chloride solution. J. Mater. Civ. Eng. 2011, 23, 1295–1301. [Google Scholar] [CrossRef]
- Santos, B.S.; Albuquerque, D.D.M.; Ribeiro, D.V. Effect of the addition of metakaolin on the carbonation of Portland cement concretes. Rev. IBRACON Estrut. Mater. 2020, 13, 1–18. [Google Scholar] [CrossRef]
- Madandoust, R.; Mousavi, S.Y. Fresh and hardened properties of self-compacting concrete containing metakaolin. Constr. Build. Mater. 2012, 35, 752–760. [Google Scholar] [CrossRef]
- Ramezanianpour, A.; Jovein, H.B. Influence of metakaolin as supplementary cementing material on strength and durability of concretes. Constr. Build. Mater. 2012, 30, 470–479. [Google Scholar] [CrossRef]
- Mermerdaş, K.; Gesoğlu, M.; Güneyisi, E.; Özturan, T. Strength development of concretes incorporated with metakaolin and different types of calcined kaolins. Constr. Build. Mater. 2012, 37, 766–774. [Google Scholar] [CrossRef]
- Aramburo, C.H.; Pedrajas, C.; Talero, R. Portland Cements with High Content of Calcined Clay: Mechanical Strength Behaviour and Sulfate Durability. Materials 2020, 13, 4206. [Google Scholar] [CrossRef]
- Abdelli, K.; Tahlaiti, M.; Belarbi, R.; Oudjit, M.N. Influence of the origin of metakaolin on pozzolanic reactivity of mortars. Energy Procedia 2017, 139, 230–235. [Google Scholar] [CrossRef]
- Shah, S.; Desai, S. Impact of temperature and duration of calcination of metakaolin on the compressive strength of metakaolin incorporated concrete. In Technologies for Sustainable Development; CRC Press: Boca Raton, FL, USA, 2020; pp. 106–115. [Google Scholar]
- Cyr, M.; Trinh, M.; Husson, B.; Casaux-Ginestet, G. Effect of cement type on metakaolin efficiency. Cem. Concr. Res. 2014, 64, 63–72. [Google Scholar] [CrossRef]
- Briki, Y.; Avet, F.; Zajac, M.; Bowen, P.; Ben Haha, M.; Scrivener, K. Understanding of the factors slowing down metakaolin reaction in limestone calcined clay cement (LC3) at late ages. Cem. Concr. Res. 2021, 146, 106477. [Google Scholar] [CrossRef]
- Röser, F. Über die Reaktivität von Betonzusatzstoffen. Ein Versuchsbasiertes Hydratationsmodell. Ph.D. Thesis, Darmstadt University, Darmstadt, Germany, 21 June 2018. [Google Scholar]
- Weise, K.; Ukrainczyk, N.; Koenders, E. A Mass Balance Approach for Thermogravimetric Analysis in Pozzolanic Reactivity R3 Test and Effect of Drying Methods. Materials 2021, 14, 5859. [Google Scholar] [CrossRef] [PubMed]
- Scrivener, K.; Snellings, R.; Lothenbach, B. A Practical Guide to Microstructural Analysis of Cementitious Materials; CRC Press: Boca Raton, FL, USA, 2016. [Google Scholar]
- Beuntner, N.; Thienel, C. Solubility and kinetics of calcined clay: Study of interaction by pore solution. In Proceedings of the 2nd International Conference on the Chemistry of Construction Materials, Munich, Germany, 10–12 October 2016. [Google Scholar]
- Weise, K. Die Reaktivität von Hüttensand als Betonzusatzstoff: Eine thermogravimetrische Systemstudie; Springer Vieweg: Berlin, Germany, 2018. [Google Scholar]
- El-Diadamony, H.; Amer, A.; Sokkary, T.; El-Hoseny, S. Hydration and characteristics of metakaolin pozzolanic cement pastes. HBRC J. 2018, 14, 150–158. [Google Scholar] [CrossRef] [Green Version]
- Frías, M.; Cabrera, J. Pore size distribution and degree of hydration of metakaolin–cement pastes. Cem. Concr. Res. 2000, 30, 561–569. [Google Scholar] [CrossRef]
- Lawrence, P.; Cyr, M.; Ringot, E. Mineral admixtures in mortars. Cem. Concr. Res. 2003, 33, 1939–1947. [Google Scholar] [CrossRef]
- Gutteridge, W.A.; Dalziel, J.A. Filler cement: The effect of the secondary component on the hydration of Portland cement. Cem. Concr. Res. 1990, 20, 778–782. [Google Scholar] [CrossRef]
- Scrivener, K.L.; Lothenbach, B.; De Belie, N.; Gruyaert, E.; Skibsted, J.; Snellings, R.; Vollpracht, A. TC 238-SCM: Hydration and microstructure of concrete with SCMs. Mater. Struct. 2015, 48, 835–862. [Google Scholar] [CrossRef]
- Lagier, F.; Kurtis, K. Influence of Portland cement composition on early age reactions with metakaolin. Cem. Concr. Res. 2007, 37, 1411–1417. [Google Scholar] [CrossRef]
- Sha, W.; Pereira, G. Differential scanning calorimetry study of ordinary Portland cement paste containing metakaolin and theoretical approach of metakaolin activity. Cem. Concr. Compos. 2001, 23, 455–461. [Google Scholar] [CrossRef]
- Manns, W. Gemeinsame Anwendung von Silicastaub und Steinkohlenflugasche als Betonzusatzstoff. Beton 1997, 47, 716–720. [Google Scholar]


| SiO2 | Al2O3 | Fe2O3 | CaO | MgO | Na2O | K2O | TiO2 | Other | |
|---|---|---|---|---|---|---|---|---|---|
| MK | 52.95 | 42.18 | 2.38 | 0.05 | 0.07 | 0.00 | 0.31 | 1.77 | 0.29 |
| PC | 19.40 | 3.30 | 5.42 | 68.58 | 0.69 | 0.27 | 0.47 | 0.24 | 1.63 |
| Abbreviation | Replacement Ratio in wt.% | CH_add/MK | MK in wt.% | PC in wt.% | CH_add in wt.% |
|---|---|---|---|---|---|
| MK0 | 0 | - | 0.00 | 100.00 | 0.00 |
| MK5 | 5 | - | 5.00 | 95.00 | 0.00 |
| MK10 | 10 | - | 10.00 | 90.00 | 0.00 |
| MK20 | 20 | - | 20.00 | 80.00 | 0.00 |
| MK30 | 30 | - | 30.00 | 70.00 | 0.00 |
| MK40 | 40 | - | 40.00 | 60.00 | 0.00 |
| MK20_CH0.1 | 20 | 0.10 | 19.61 | 78.43 | 1.96 |
| MK20_CH0.25 | 20 | 0.25 | 19.05 | 76.19 | 4.76 |
| MK20_CH0.5 | 20 | 0.50 | 18.18 | 72.73 | 9.09 |
| MK30_CH0.1 | 30 | 0.10 | 29.13 | 67.96 | 2.91 |
| MK30_CH0.25 | 30 | 0.25 | 27.91 | 65.12 | 6.98 |
| MK30_CH0.5 | 30 | 0.50 | 26.09 | 60.87 | 13.04 |
| MK40_CH0.1 | 40 | 0.10 | 38.46 | 57.69 | 3.85 |
| MK40_CH0.25 | 40 | 0.25 | 36.36 | 54.55 | 9.09 |
| MK40_CH0.5 | 40 | 0.50 | 33.33 | 50.00 | 16.67 |
Publisher’s Note: MDPI stays neutral with regard to jurisdictional claims in published maps and institutional affiliations. |
© 2022 by the authors. Licensee MDPI, Basel, Switzerland. This article is an open access article distributed under the terms and conditions of the Creative Commons Attribution (CC BY) license (https://creativecommons.org/licenses/by/4.0/).
Share and Cite
Weise, K.; Ukrainczyk, N.; Duncan, A.; Koenders, E. Enhanced Metakaolin Reactivity in Blended Cement with Additional Calcium Hydroxide. Materials 2022, 15, 367. https://doi.org/10.3390/ma15010367
Weise K, Ukrainczyk N, Duncan A, Koenders E. Enhanced Metakaolin Reactivity in Blended Cement with Additional Calcium Hydroxide. Materials. 2022; 15(1):367. https://doi.org/10.3390/ma15010367
Chicago/Turabian StyleWeise, Kira, Neven Ukrainczyk, Aaron Duncan, and Eduardus Koenders. 2022. "Enhanced Metakaolin Reactivity in Blended Cement with Additional Calcium Hydroxide" Materials 15, no. 1: 367. https://doi.org/10.3390/ma15010367