
Chemical and Microstructural Properties of Designed Cohesive M-S-H Pastes


 ,
,
Abstract
:1. Introduction
2. Materials and Methods
2.1. Raw Materials
2.2. Preparation of M-S-H Samples
2.3. Chemical, Mineralogical and Microstructural Analysis of Pastes
2.3.1. Mineralogical and Chemical Analyses
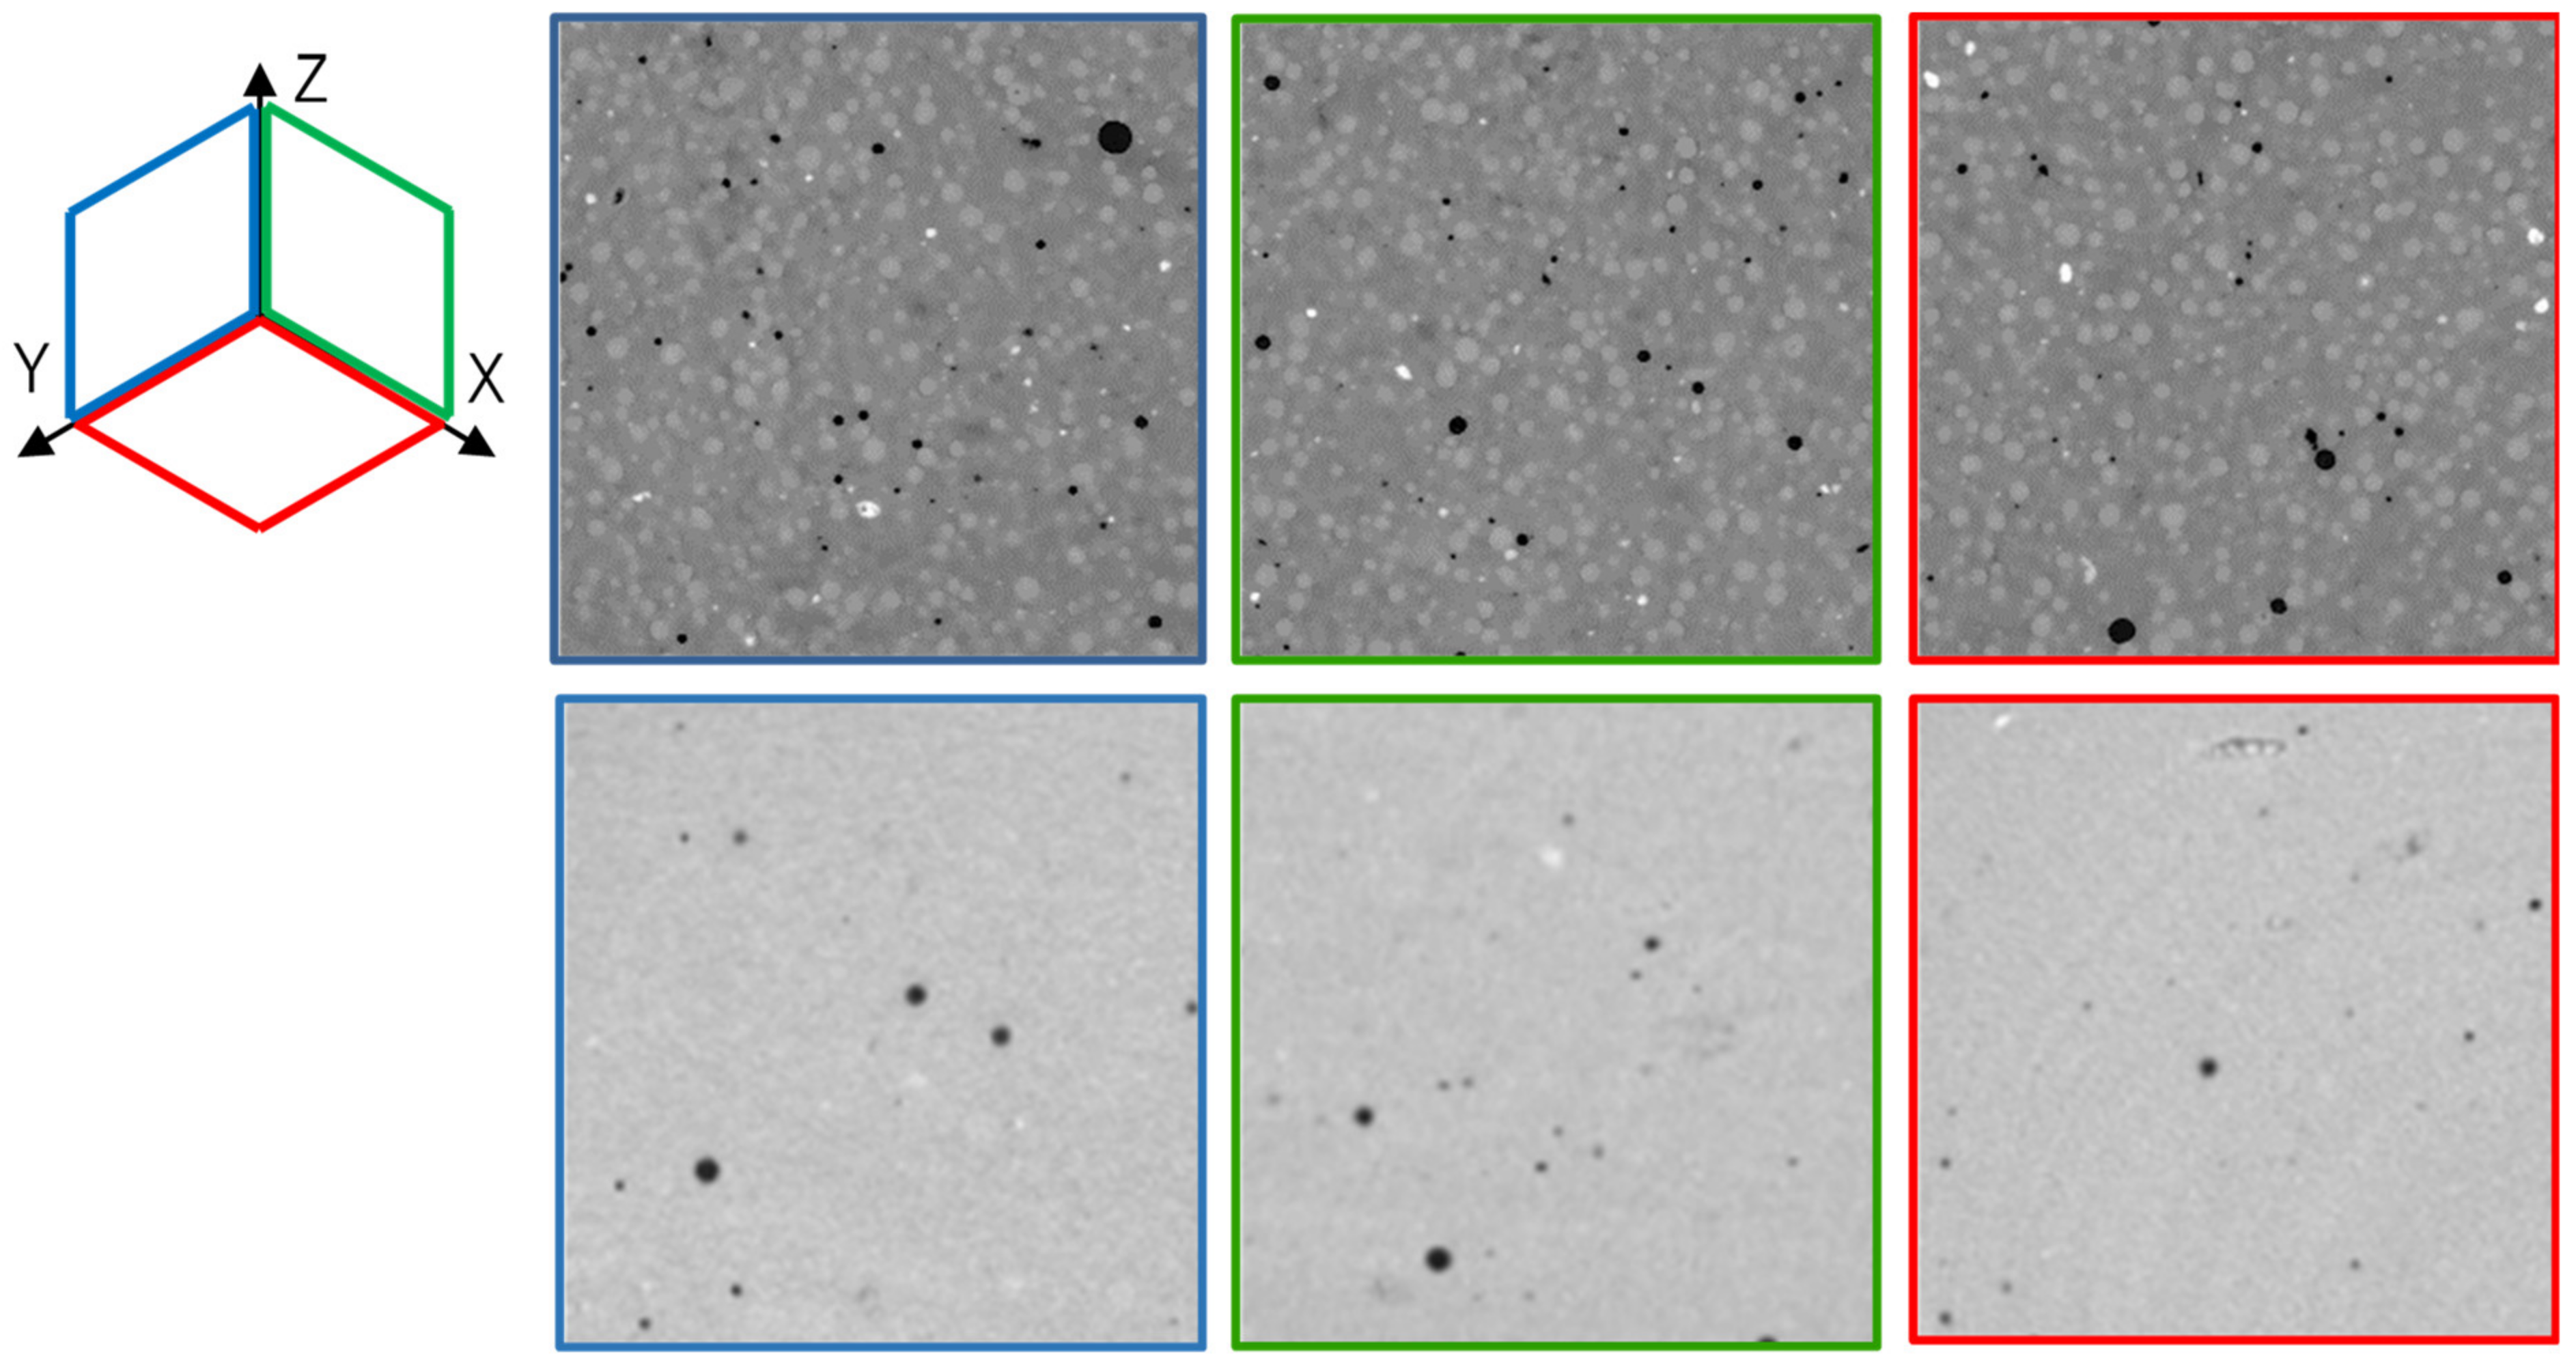
2.3.2. Microstructure Analyses
3. Chemical and Microstructural Characterization of M-S-H as a Function of Design and Curing Protocols
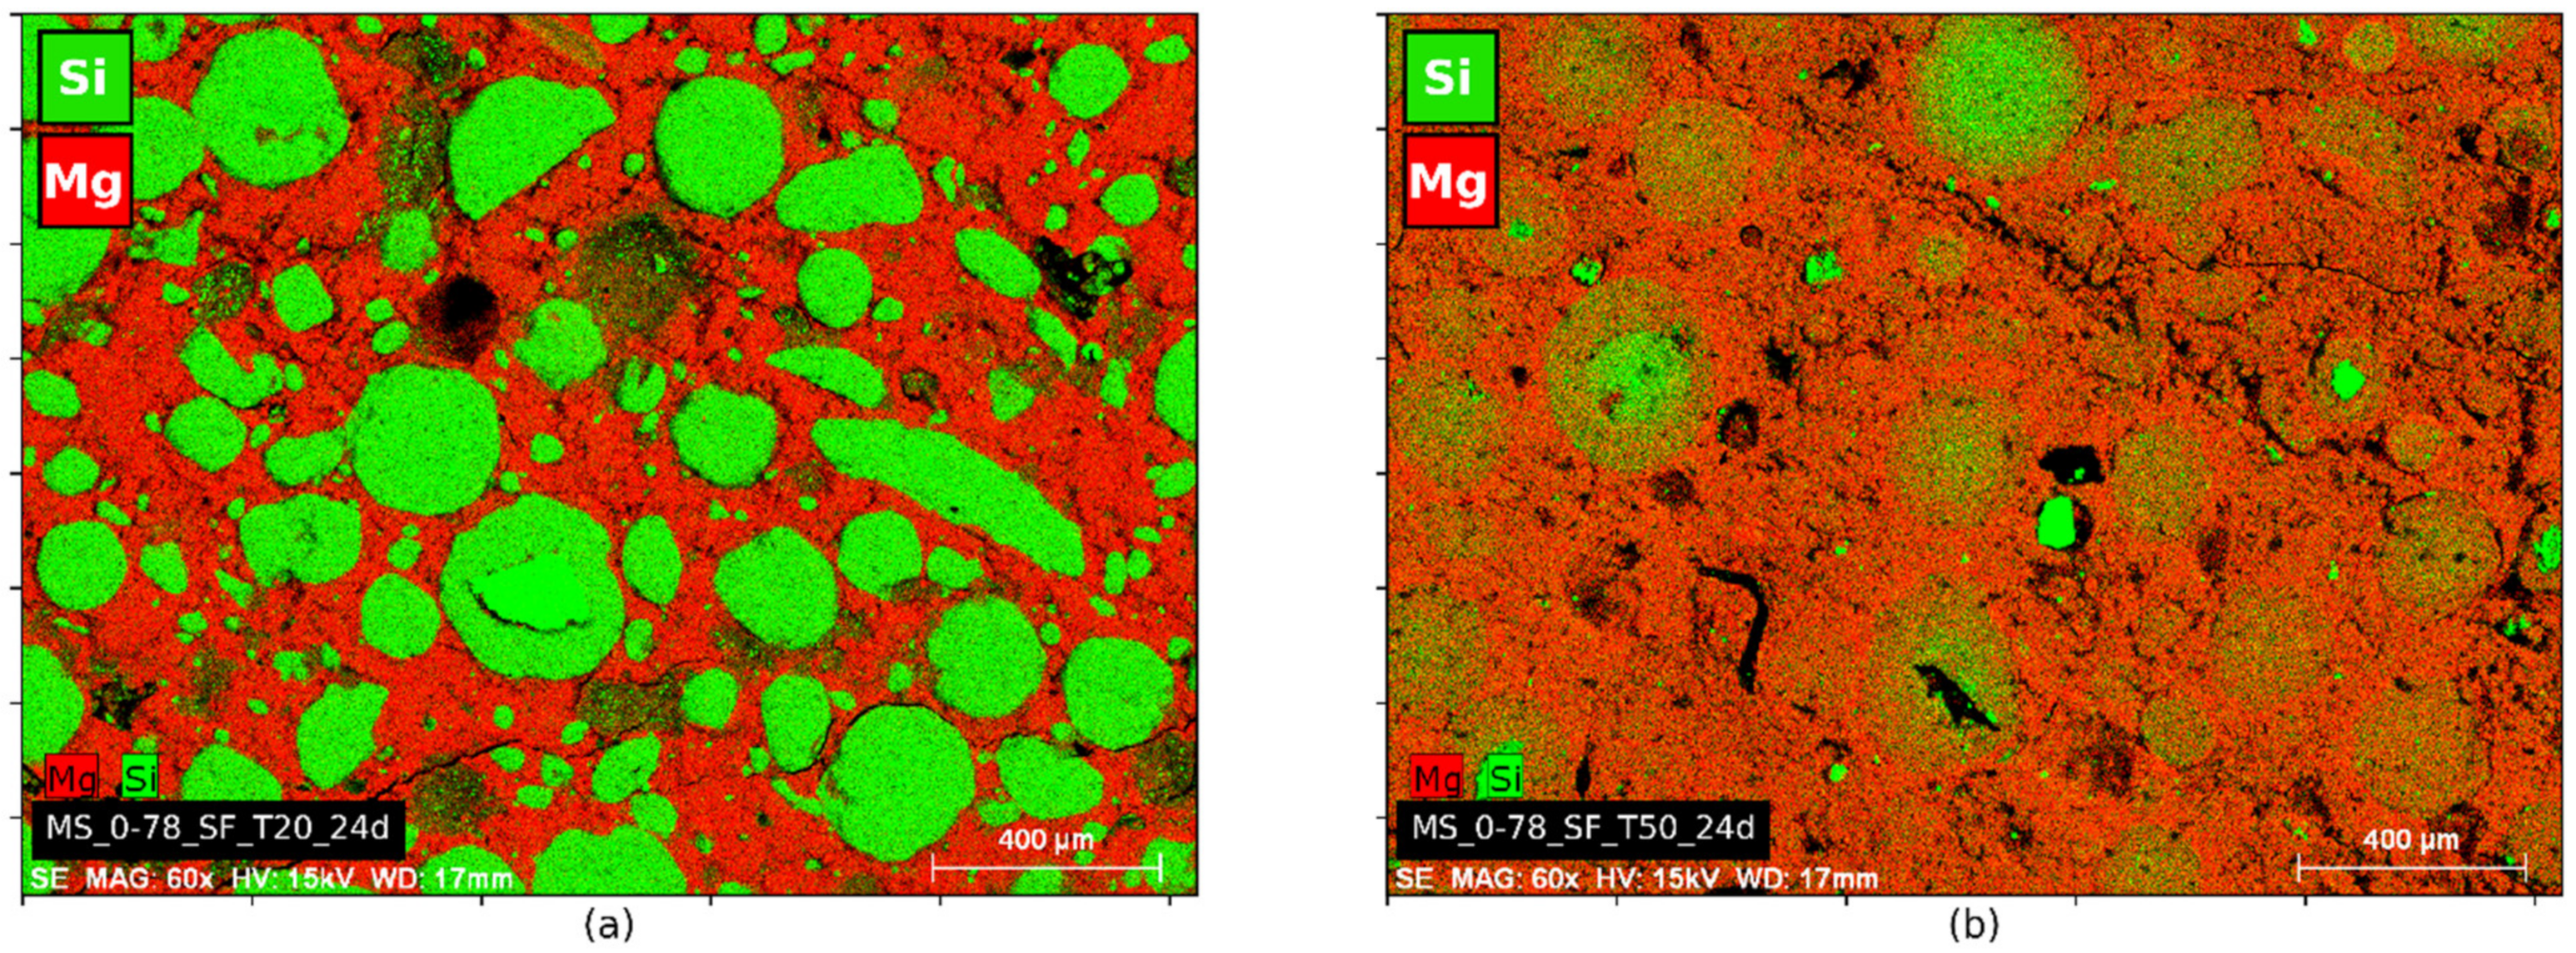
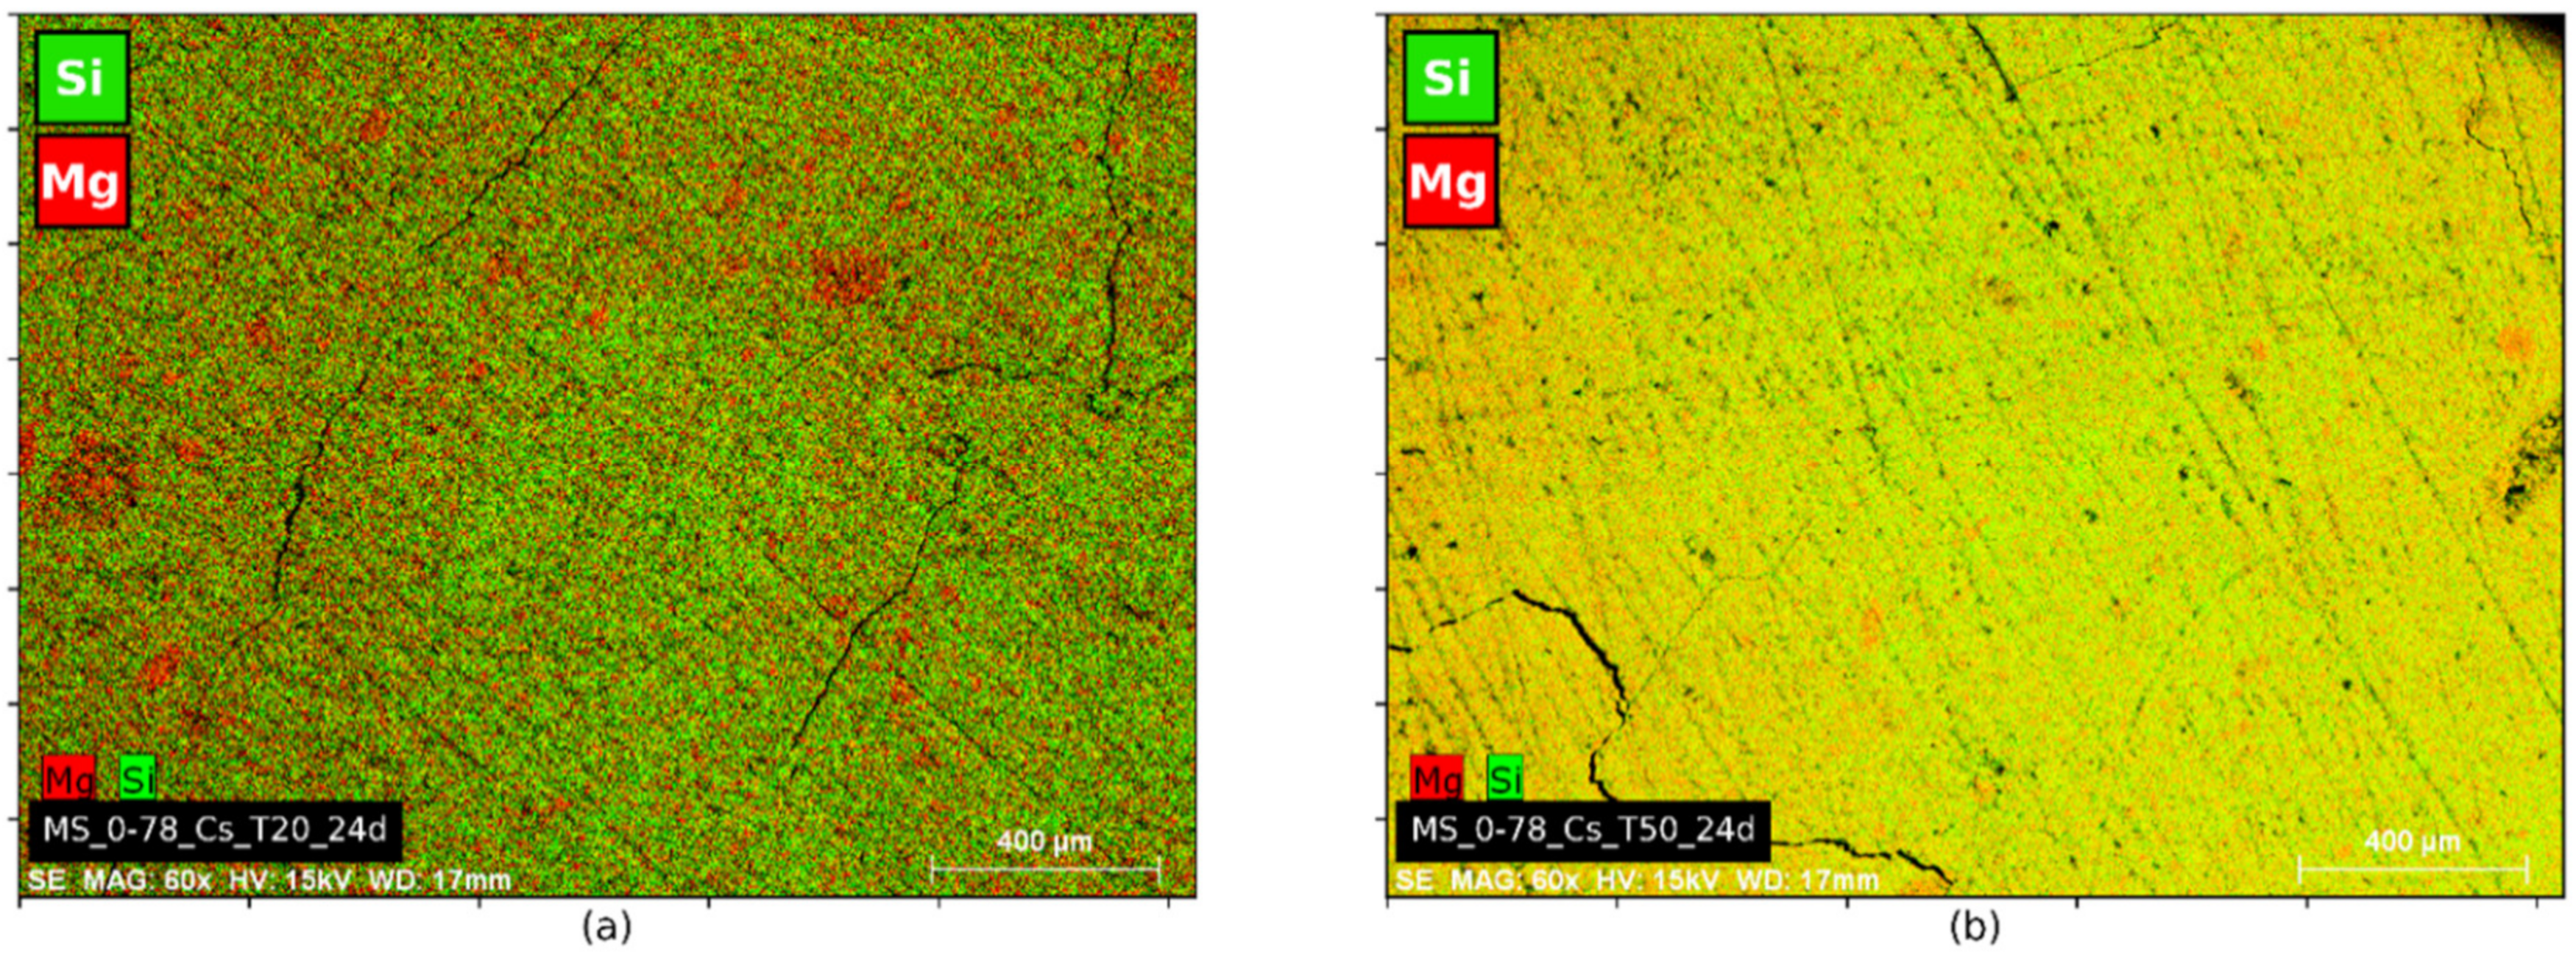
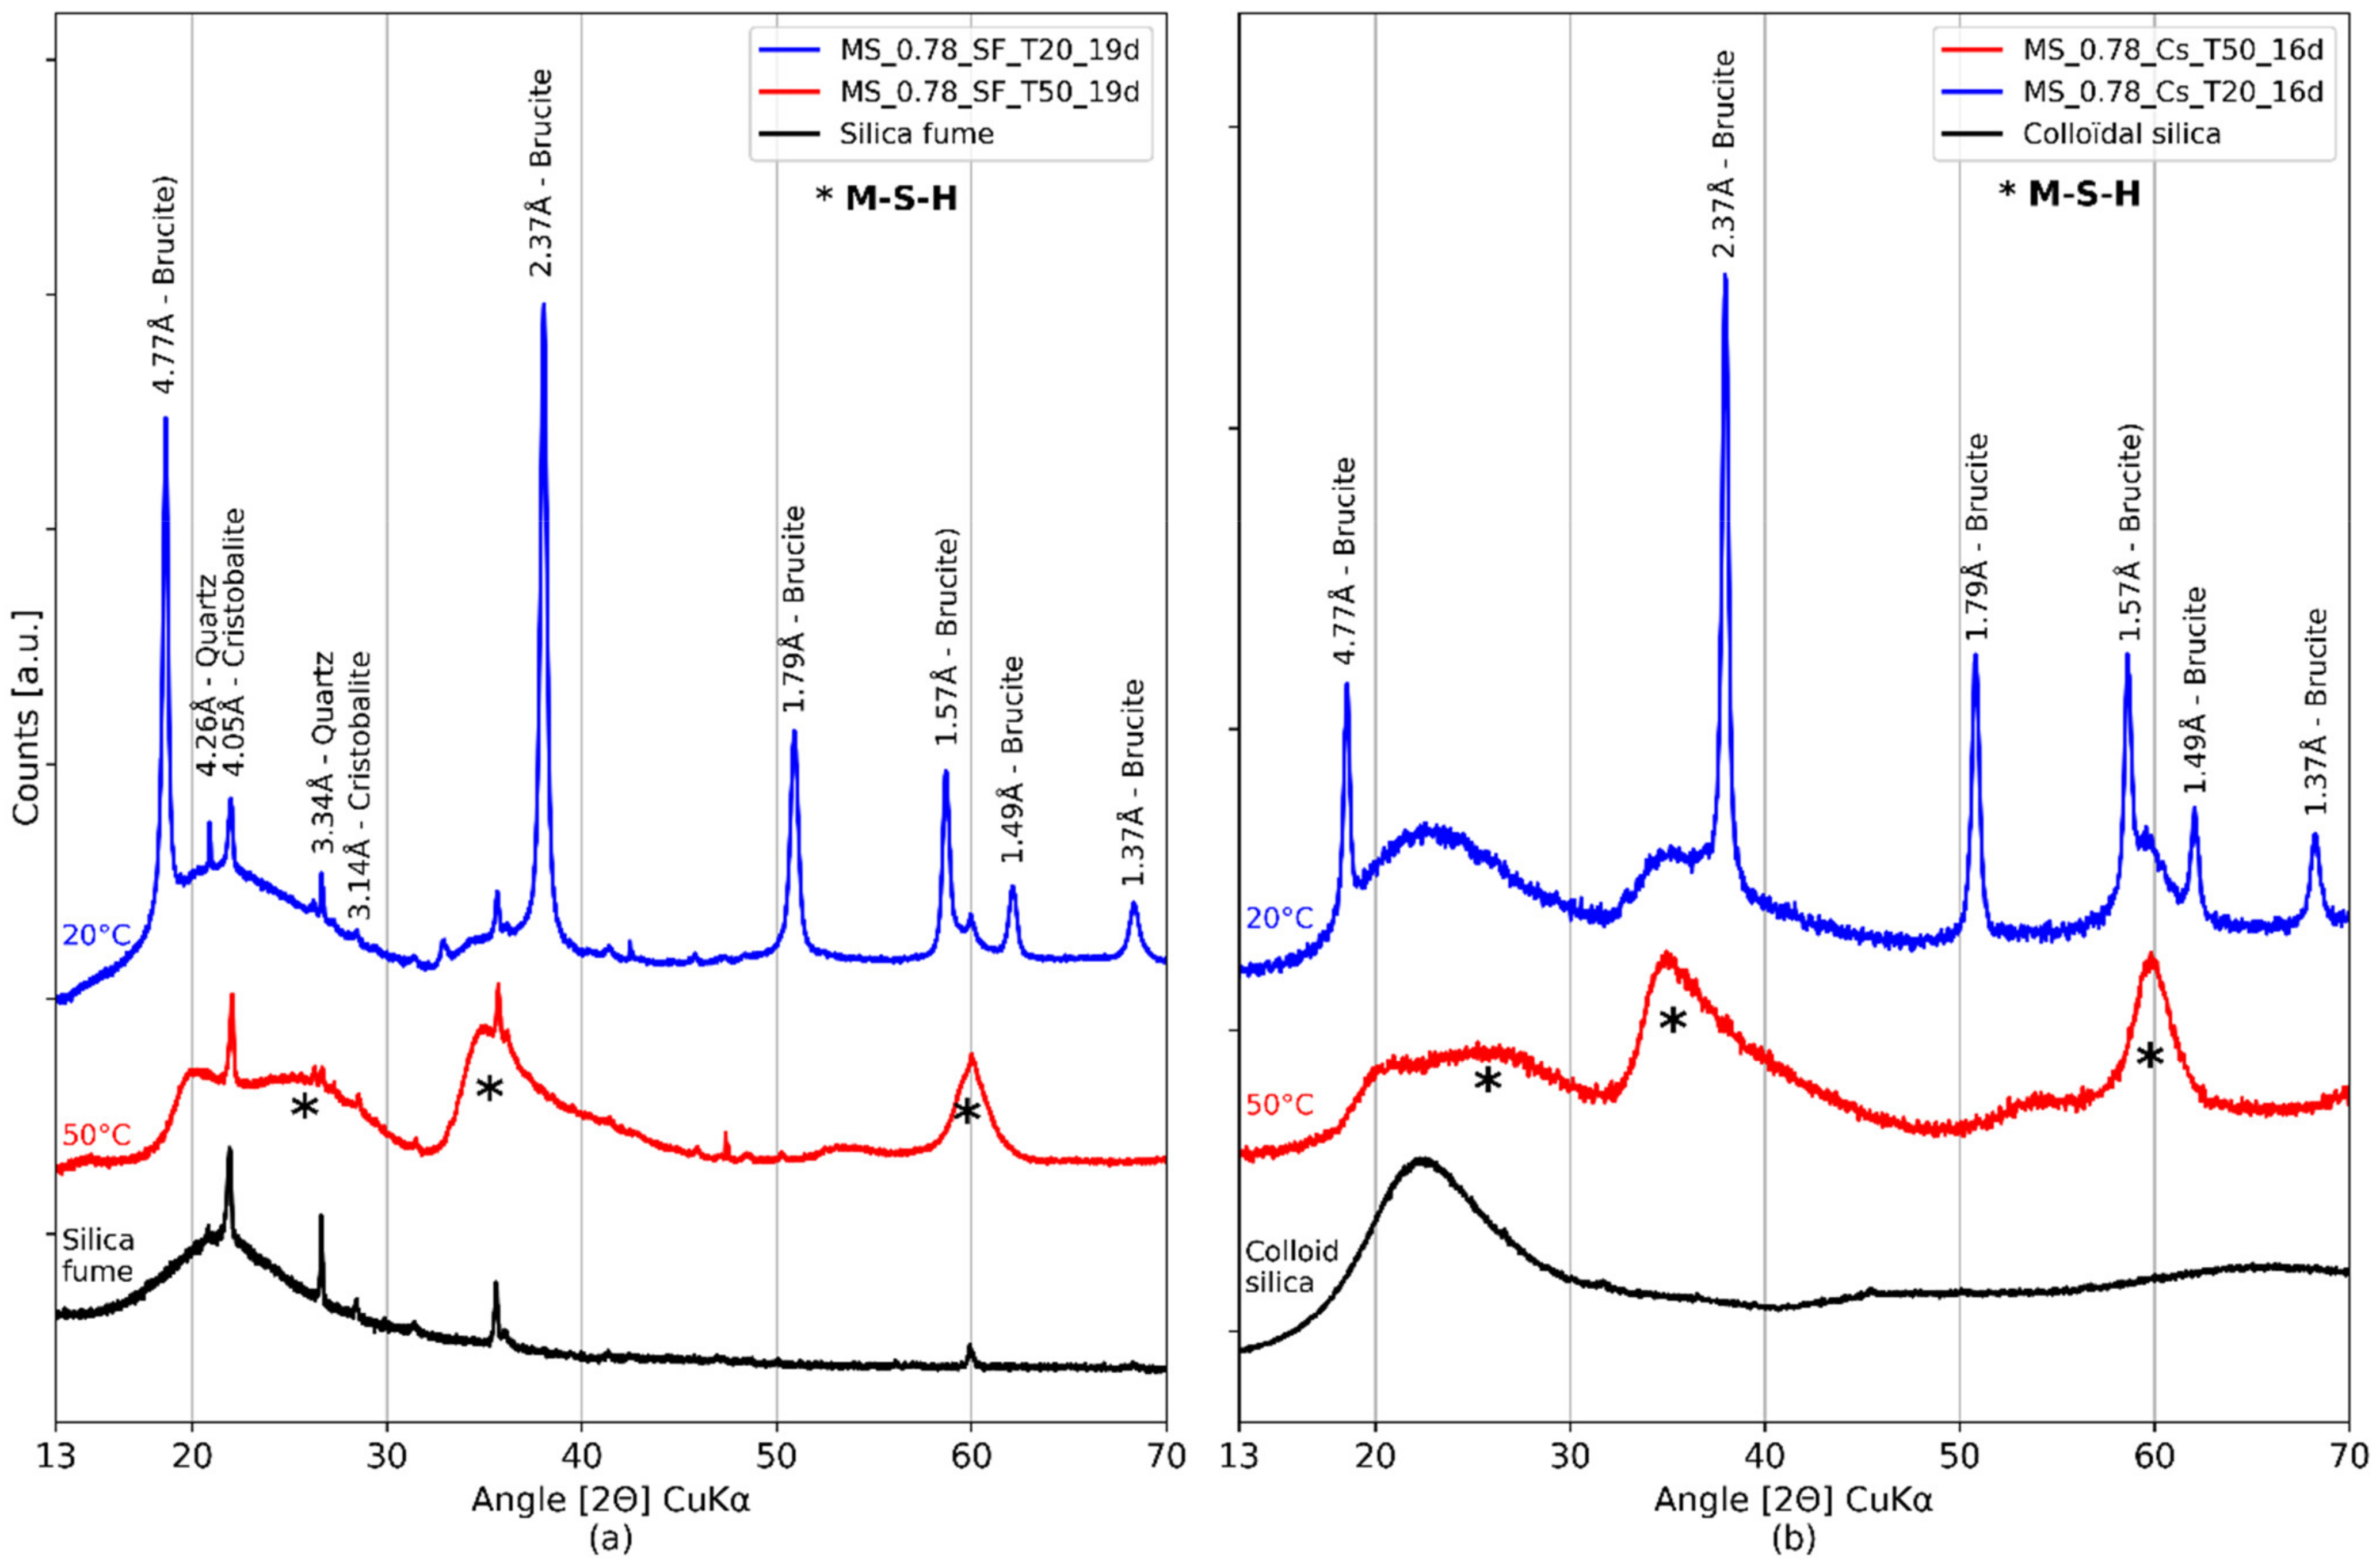
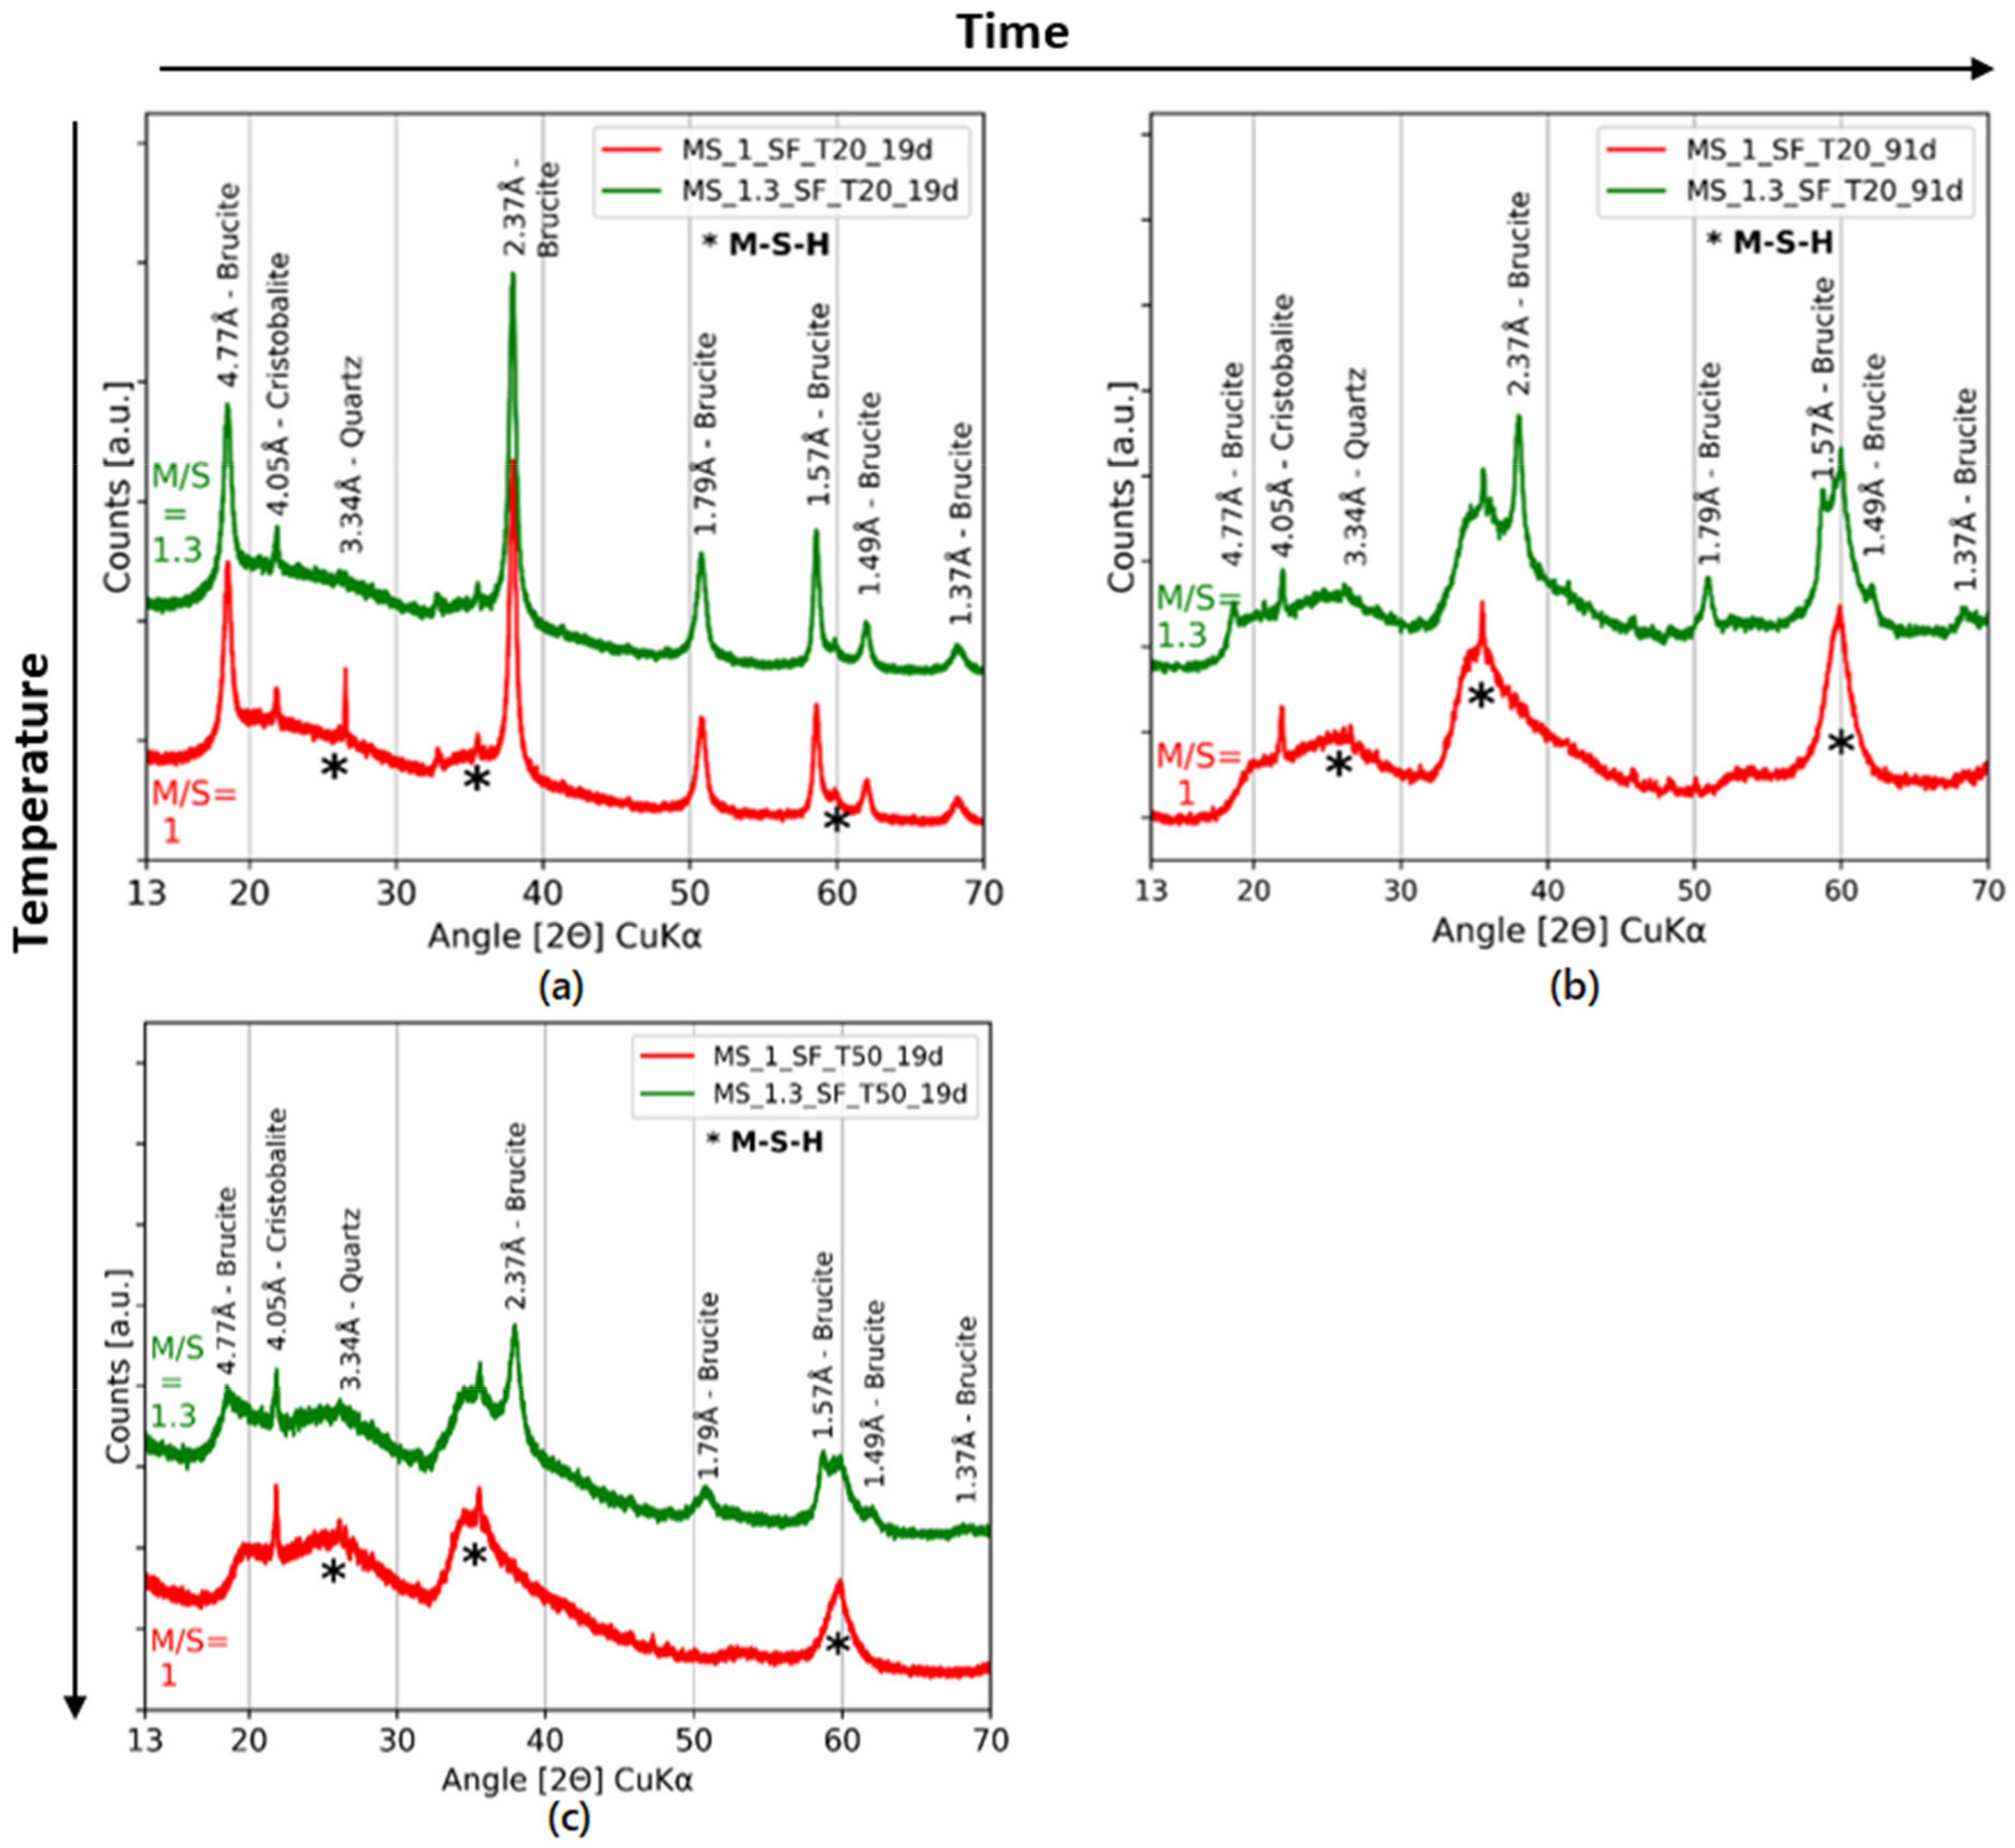
3.1. Influence of the Type of Silica
3.2. Influence of the Curing Temperature
3.3. Formation of M-S-H
4. In-Depth Characterization of Colloidal Silica M-S-H Pastes with Different M/S Ratios
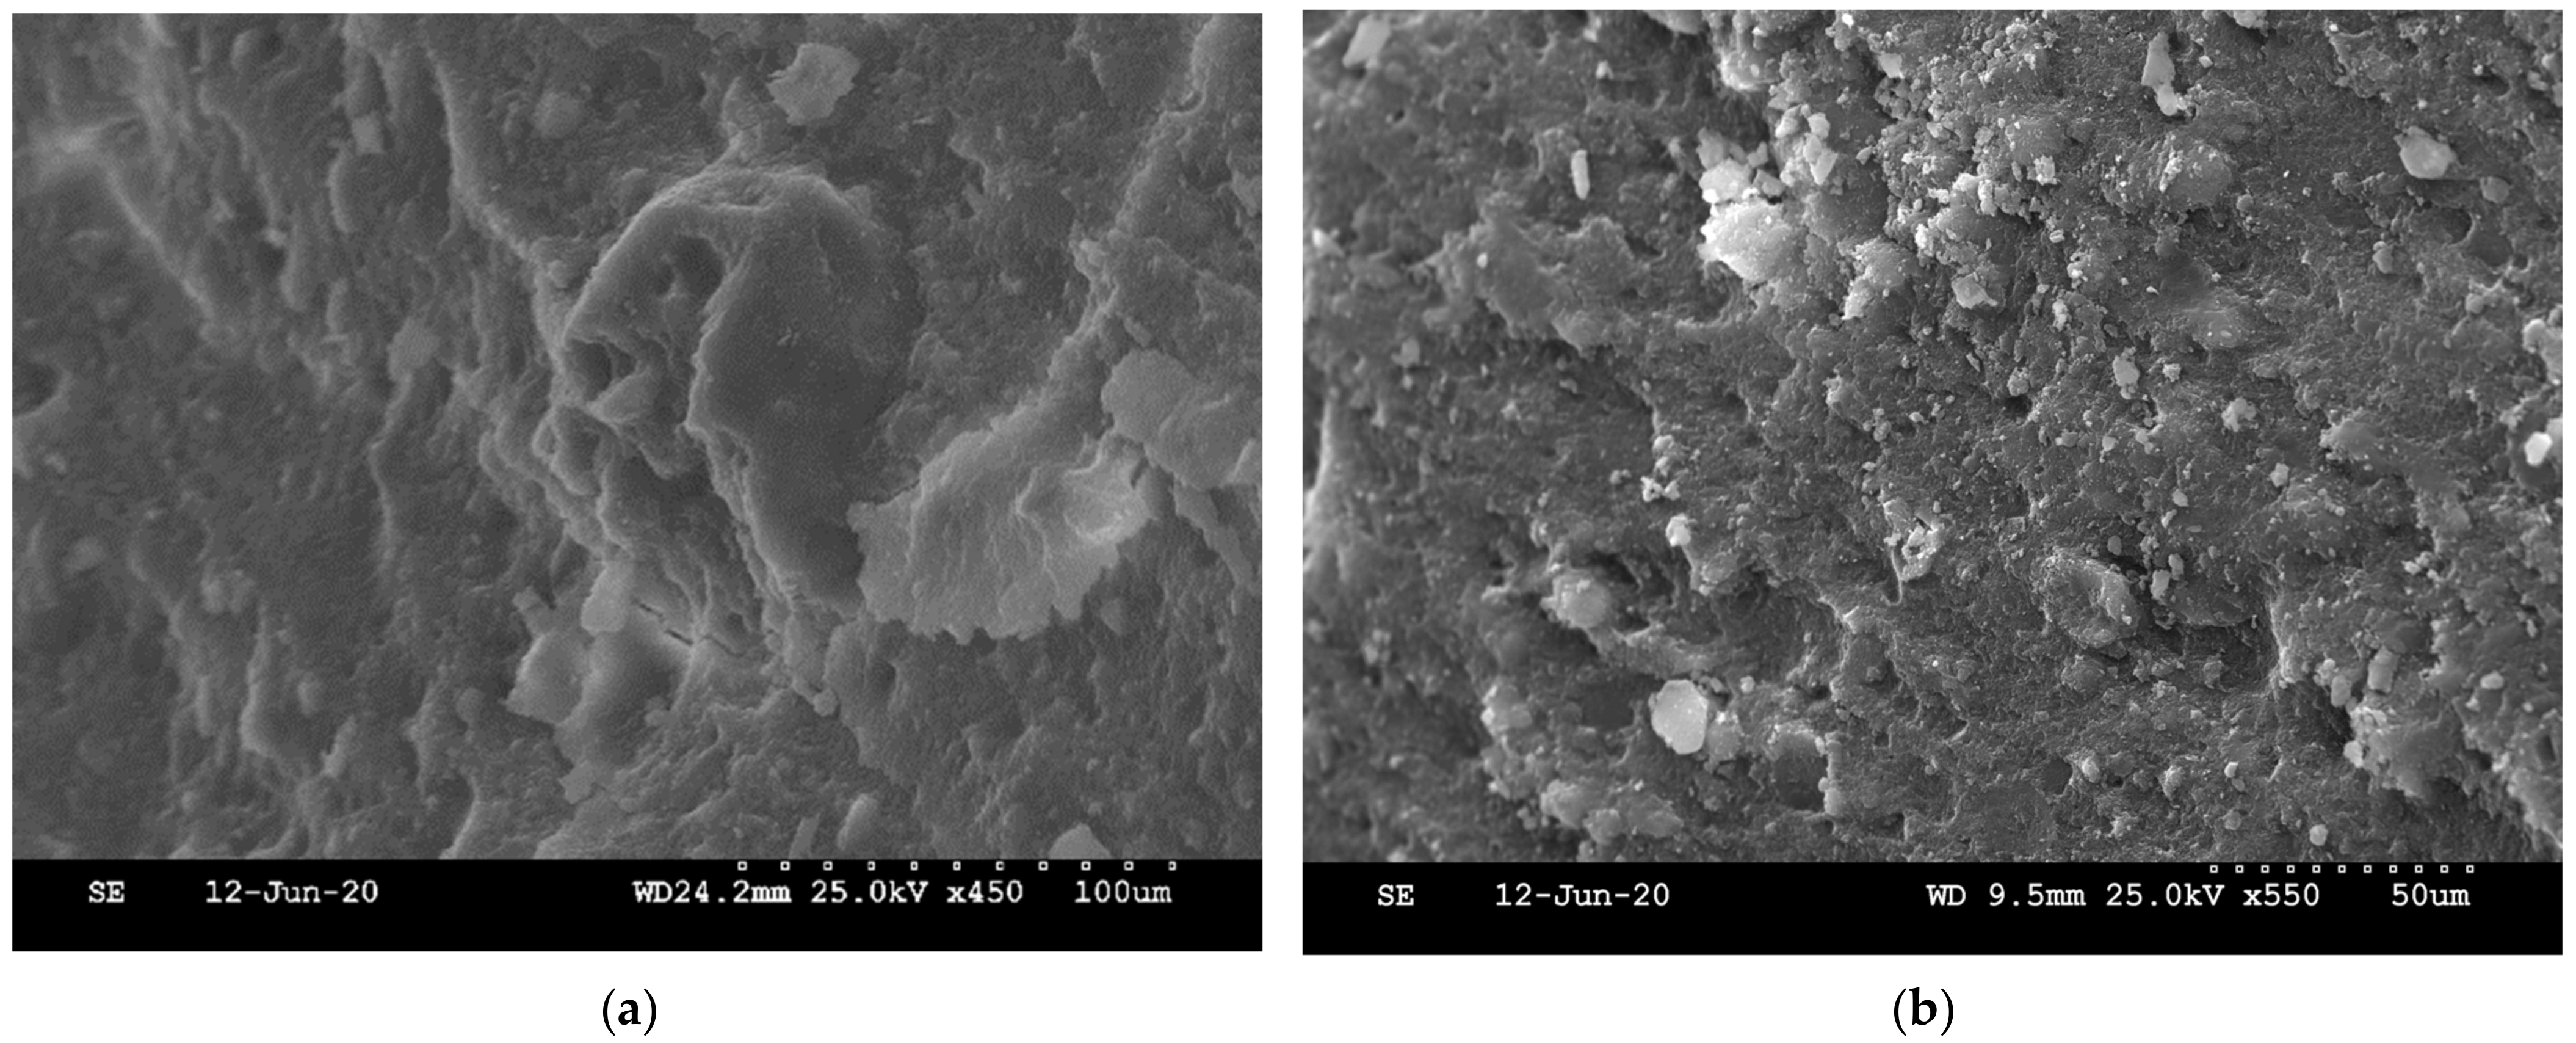
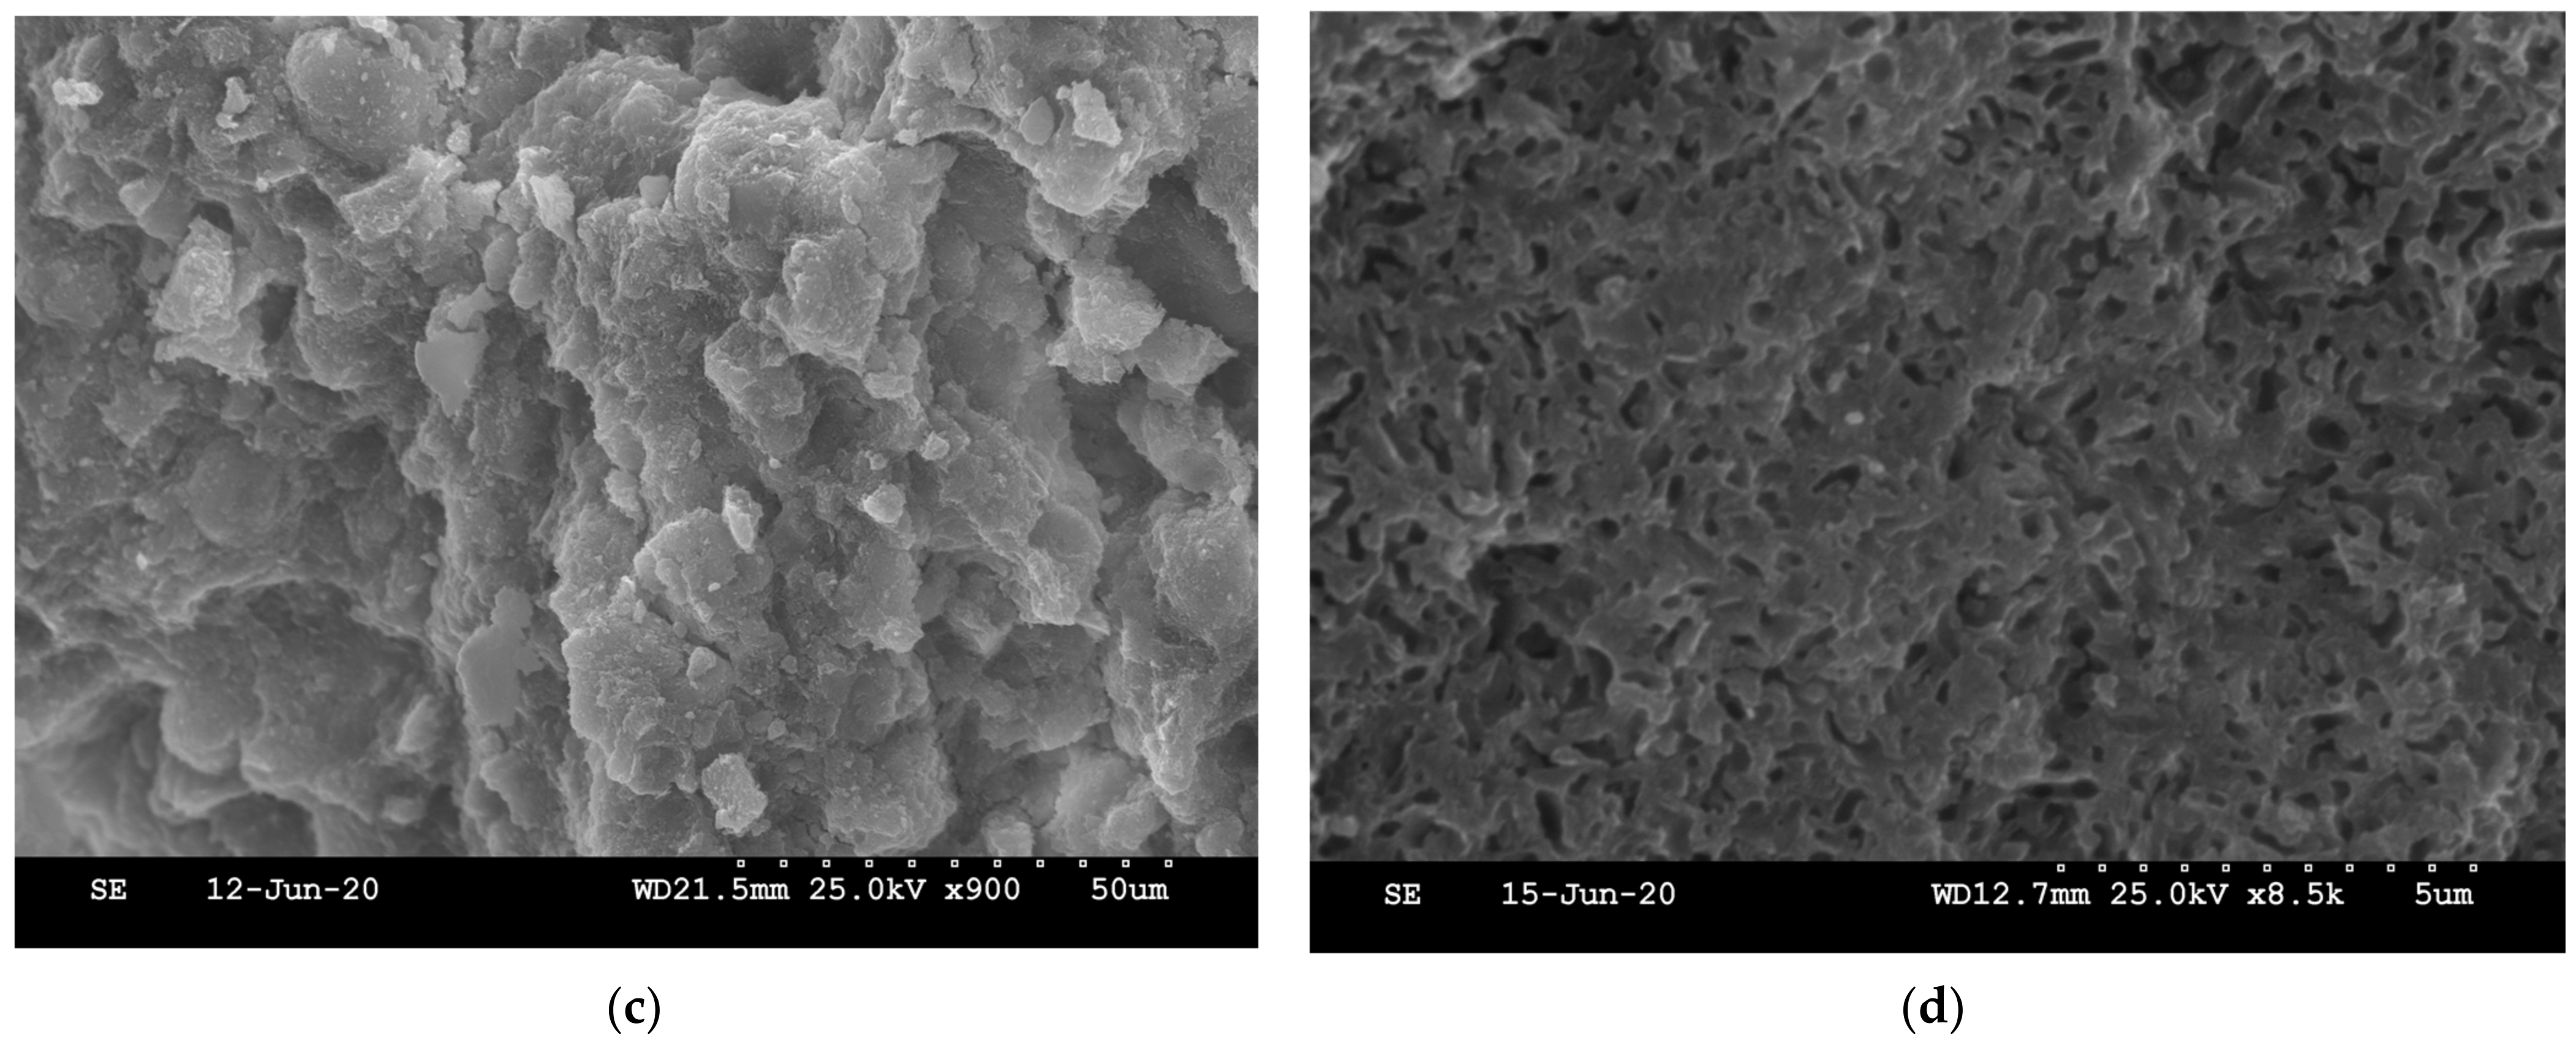
4.1. Morphology of M-S-H
4.2. Solid Composition
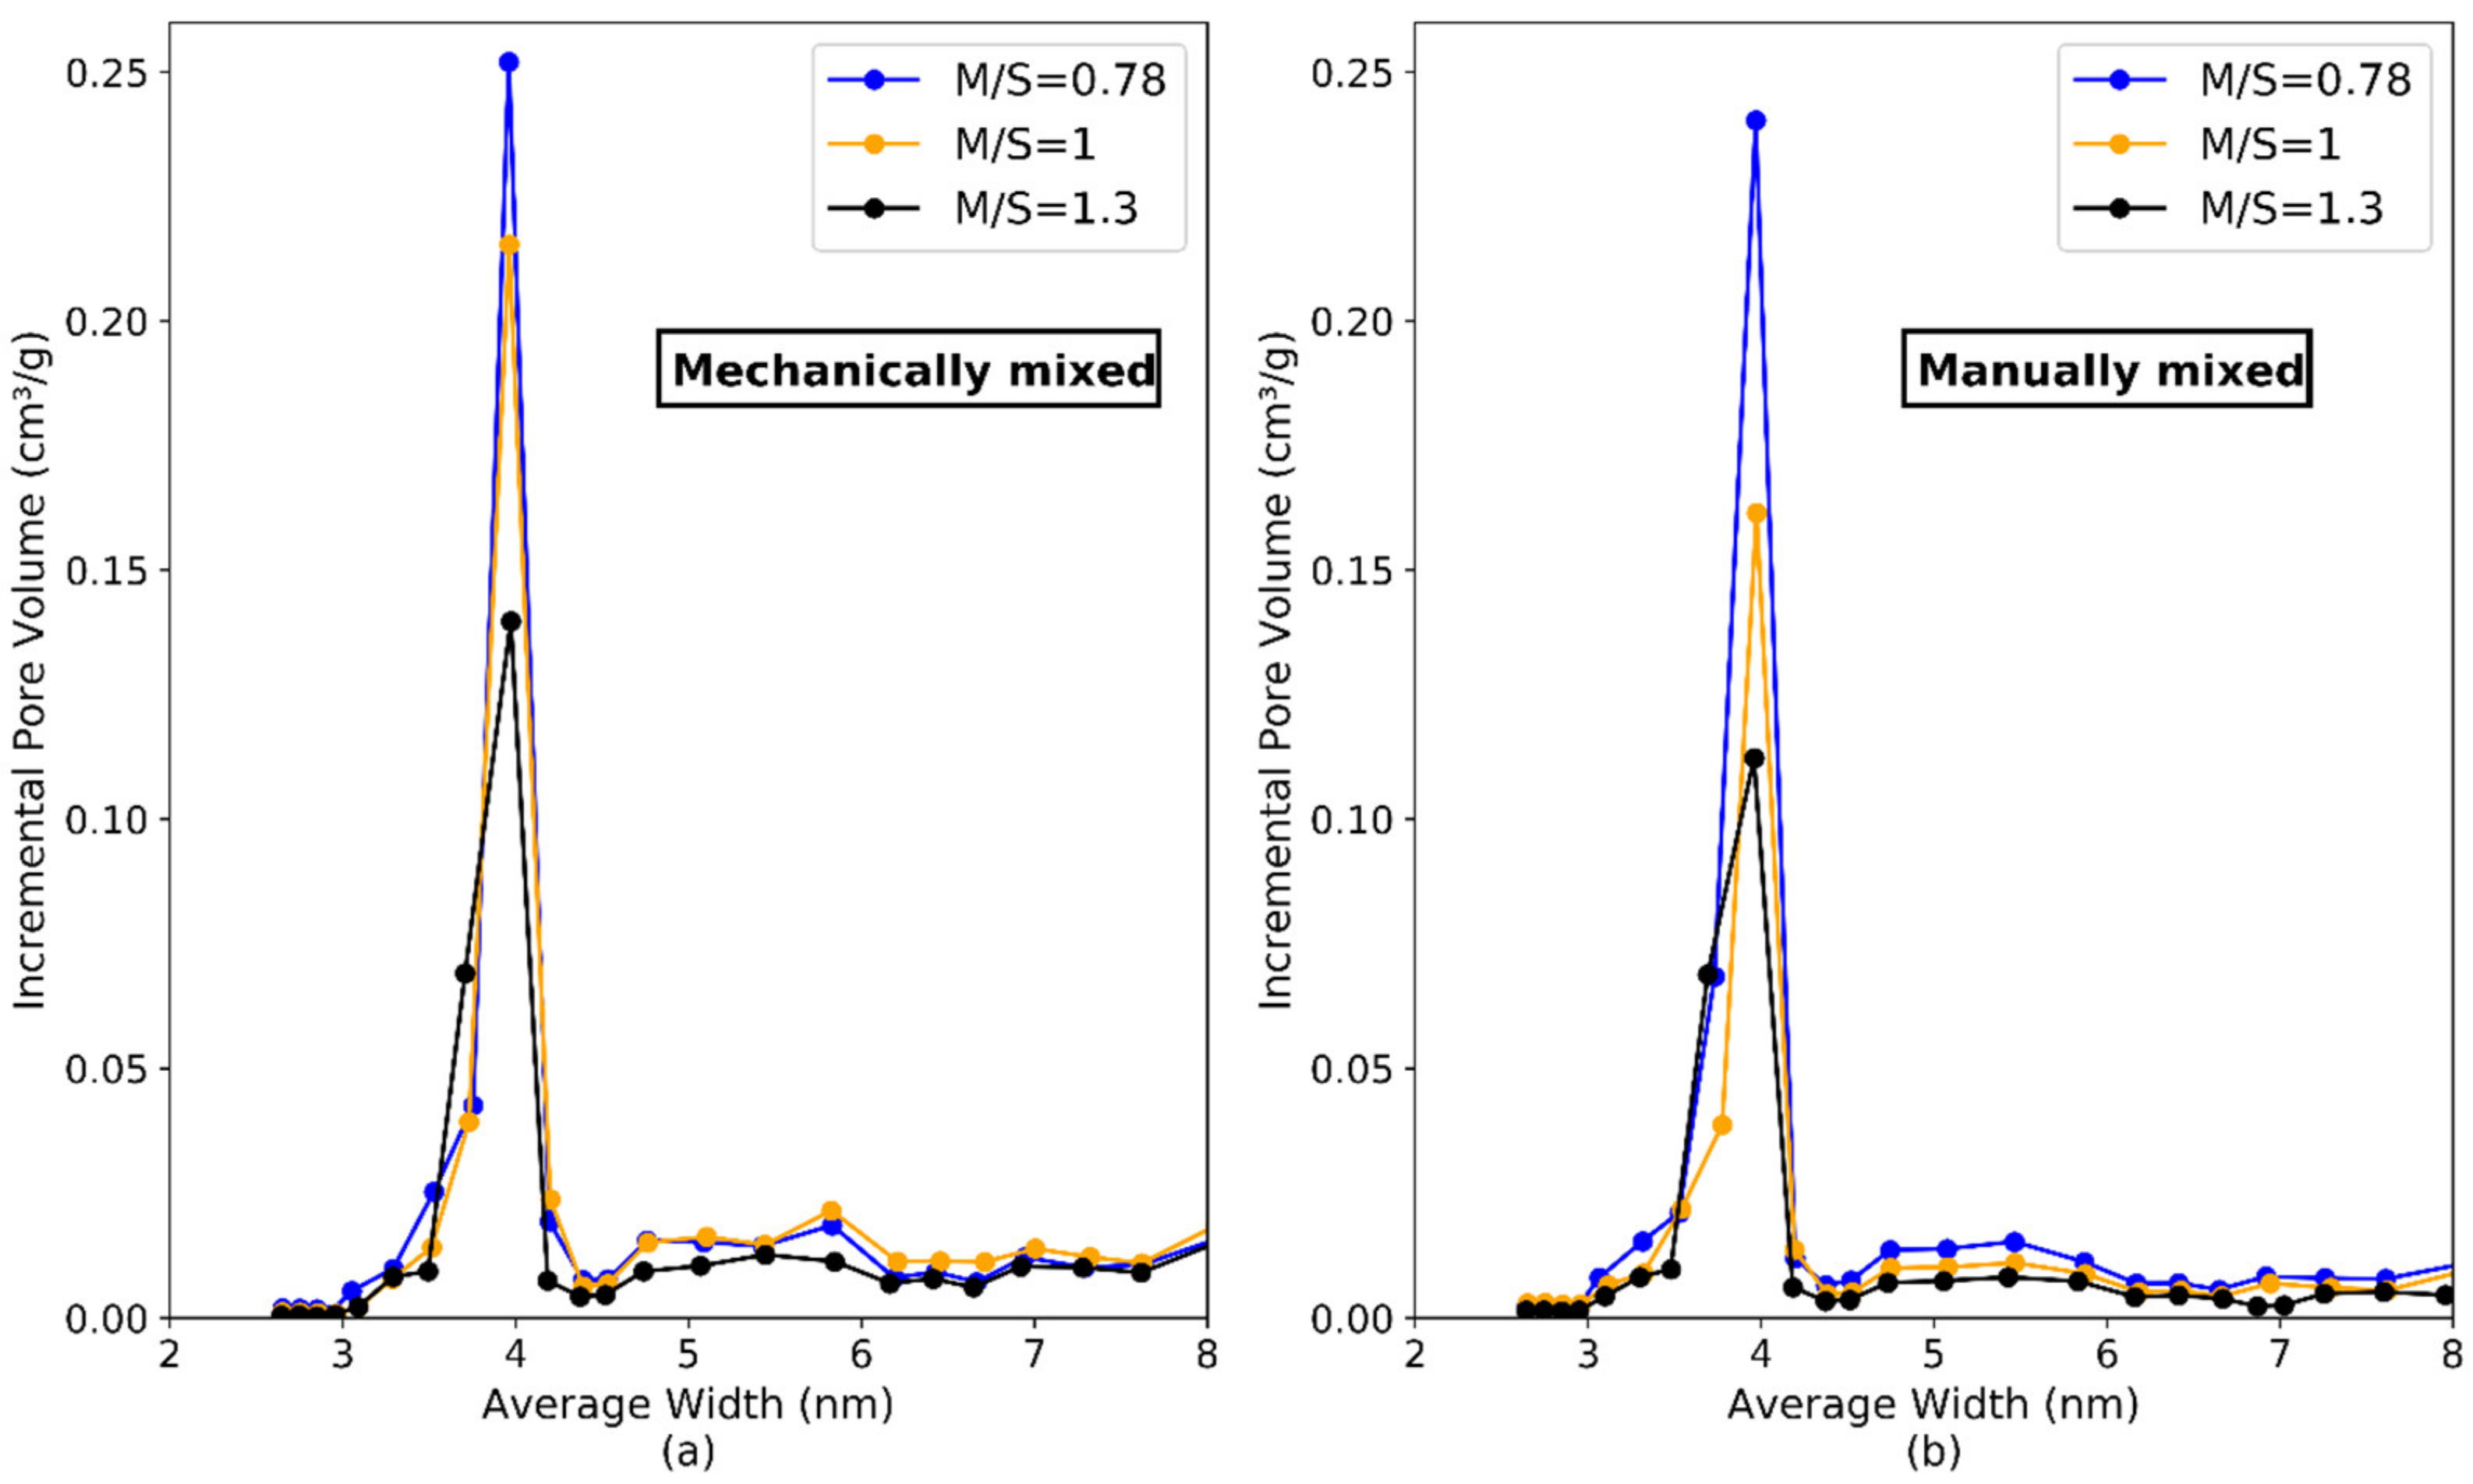
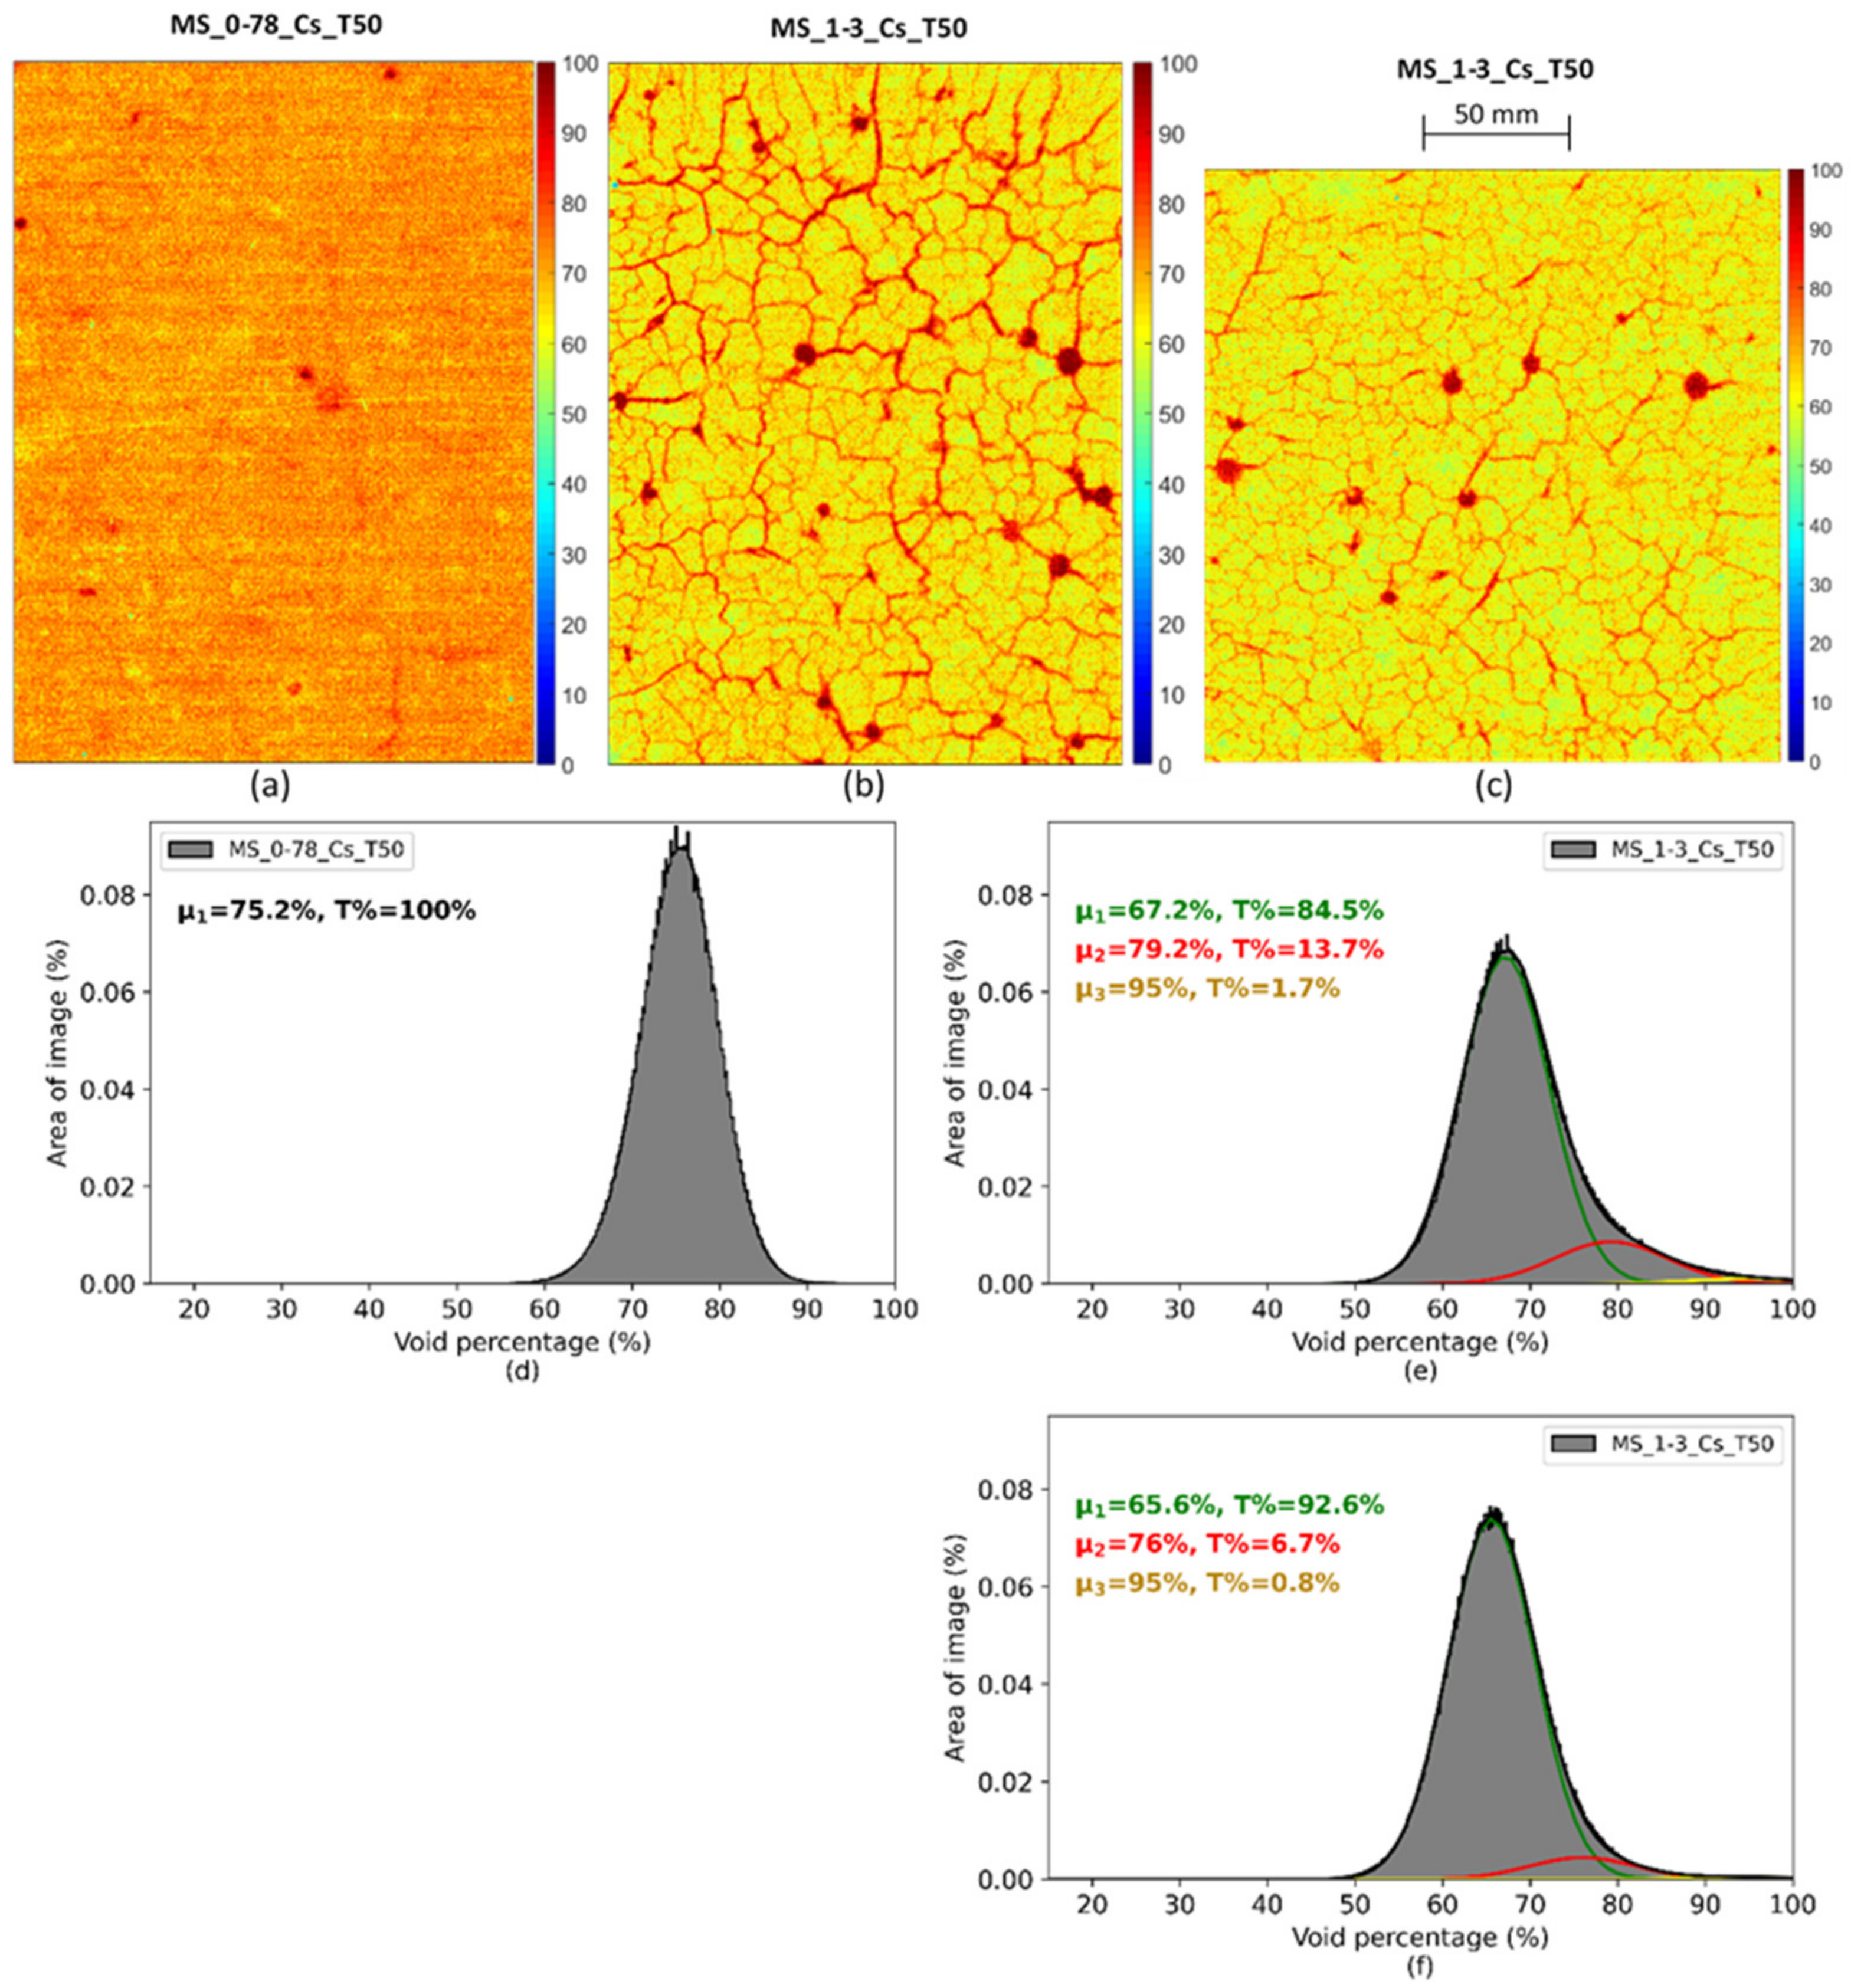
4.3. Microstructure and Porosity
5. Conclusions
Author Contributions
Funding
Institutional Review Board Statement
Informed Consent Statement
Acknowledgments
Conflicts of Interest
Appendix A

| Step | Abrasive Paper | Retention Strength | Speed (rd/min) | Time (min) | Abrasive Product | Lubricant + Rinsing Agent |
|---|---|---|---|---|---|---|
| 1 | 240 | 30 N | 500 | 1–3 | Ethanol | |
| 2 | 1200 | 30 N | 250 | 1 | Ethanol | |
| 3 | 2000 | 30 N | 250 | 1 | Ethanol | |
| 4 | 4000 | 30 N | 250 | 1 | Ethanol | |
| 5 | 3 μm | Manual | 250 | 5 | Diamond powder (3 μm) | Ethanol |
| 6 | 1 μm | Manual | 250 | 5 | Diamond powder (1 μm) | Ethanol |
References
- Bonen, D.; Cohen, M.D. Magnesium Sulfate Attack on Portland Cement Paste-I. Microstructural Analysis. Cem. Concr. Res. 1992, 22, 169–180. [Google Scholar] [CrossRef]
- Jakobsen, U.H.; De Weerdt, K.; Geiker, M.R. Elemental Zonation in Marine Concrete. Cem. Concr. Res. 2016, 85, 12–27. [Google Scholar] [CrossRef] [Green Version]
- Santhanam, M.; Cohen, M.D.; Olek, J. Mechanism of Sulfate Attack: A Fresh Look: Part 1: Summary of Experimental Results. Cem. Concr. Res. 2002, 32, 915–921. [Google Scholar] [CrossRef]
- De Weerdt, K.; Justnes, H. The Effect of Sea Water on the Phase Assemblage of Hydrated Cement Paste. Cem. Concr. Compos. 2015, 55, 215–222. [Google Scholar] [CrossRef]
- Rosenqvist, M.; Bertron, A.; Fridh, K.; Hassanzadeh, M. Concrete Alteration Due to 55 years of Exposure to River Water: Chemical and Mineralogical Characterisation. Cem. Concr. Res. 2017, 92, 110–120. [Google Scholar] [CrossRef]
- Dauzeres, A.; Achiedo, G.; Nied, D.; Bernard, E.; Alahrache, S.; Lothenbach, B. Magnesium Perturbation in Low-PH Concretes Placed in Clayey Environment—Solid Characterizations and Modeling. Cem. Concr. Res. 2016, 79, 137–150. [Google Scholar] [CrossRef]
- García Calvo, J.L.; Hidalgo, A.; Alonso, C.; Fernández Luco, L. Development of Low-PH Cementitious Materials for HLRW Repositories: Resistance against Ground Waters Aggression. Cem. Concr. Res. 2010, 40, 1290–1297. [Google Scholar] [CrossRef]
- Jenni, A.; Mäder, U.; Lerouge, C.; Gaboreau, S.; Schwyn, B. In Situ Interaction between Different Concretes and Opalinus Clay. Phys. Chem. Earth Parts A/B/C 2014, 70–71, 71–83. [Google Scholar] [CrossRef] [Green Version]
- Lerouge, C.; Gaboreau, S.; Grangeon, S.; Claret, F.; Warmont, F.; Jenni, A.; Cloet, V.; Mäder, U. In Situ Interactions between Opalinus Clay and Low Alkali Concrete. Phys. Chem. Earth Parts A/B/C 2017, 99, 3–21. [Google Scholar] [CrossRef]
- Mäder, U.; Jenni, A.; Lerouge, C.; Gaboreau, S.; Miyoshi, S.; Kimura, Y.; Cloet, V.; Fukaya, M.; Claret, F.; Otake, T.; et al. 5-year chemico-physical evolution of concrete–claystone interfaces, Mont Terri rock laboratory (Switzerland). In Mont Terri Rock Laboratory, 20 Years: Two Decades of Research and Experimentation on Claystones for Geological Disposal of Radioactive Waste; Bossart, P., Milnes, A.G., Eds.; Springer International Publishing: Cham, Switzerland, 2018; pp. 309–329. ISBN 978-3-319-70458-6. [Google Scholar]
- Alonso, M.C.; García Calvo, J.L.; Cuevas, J.; Turrero, M.J.; Fernández, R.; Torres, E.; Ruiz, A.I. Interaction Processes at the Concrete-Bentonite Interface after 13 Years of FEBEX-Plug Operation. Part I: Concrete Alteration. Phys. Chem. Earth Parts A/B/C 2017, 99, 38–48. [Google Scholar] [CrossRef]
- Fernández, R.; Torres, E.; Ruiz, A.I.; Cuevas, J.; Alonso, M.C.; García Calvo, J.L.; Rodríguez, E.; Turrero, M.J. Interaction Processes at the Concrete-Bentonite Interface after 13 Years of FEBEX-Plug Operation. Part II: Bentonite Contact. Phys. Chem. Earth Parts A/B/C 2017, 99, 49–63. [Google Scholar] [CrossRef]
- Escadeillas, G.; Hornain, H. Chap 12: La Durabilité des Bétons Vis-A-Vis des Environnements Chimiquement Agressifs. In La Durabilité des Bétons; Presses des Ponts et Chaussées: Paris, France, 2008; pp. 613–705. [Google Scholar]
- Jakobsen, U.H. Microstructural Surface Deterioration of Concrete Exposed to Seawater; Results after 2 Years Exposure. In Proceedings of the 14th Euroseminar on Microscopy Applied to Building Materials, Helsingør, Denmark, 10–14 June 2013. [Google Scholar]
- Santhanam, M. Magnesium Attack of Cementitious Materials in Marine Environments. In Performance of Cement-Based Materials in Aggressive Aqueous Environments: State-of-the-Art Report, RILEM TC 211—PAE; Alexander, M., Bertron, A., De Belie, N., Eds.; RILEM State-of-the-Art Reports; Springer: Dordrecht, The Netherlands, 2013; pp. 75–90. ISBN 978-94-007-5413-3. [Google Scholar]
- Buffo-Lacarrière, L.; Sellier, A.; Turatsinze, A.; Escadeillas, G. Finite Element Modelling of Hardening Concrete: Application to the Prediction of Early Age Cracking for Massive Reinforced Structures. Mater. Struct. 2011, 44, 1821–1835. [Google Scholar] [CrossRef]
- Juenger, M.; Provis, J.L.; Elsen, J.; Matthes, W.; Hooton, R.D.; Duchesne, J.; Courard, L.; He, H.; Michel, F.; Snellings, R.; et al. Supplementary Cementitious Materials for Concrete: Characterization Needs. MRS Online Proc. Libr. OPL 2012, 1488, 8–22. [Google Scholar] [CrossRef]
- Thomas, M.D.A.; Hooton, R.D.; Scott, A.; Zibara, H. The Effect of Supplementary Cementitious Materials on Chloride Binding in Hardened Cement Paste. Cem. Concr. Res. 2012, 42, 1–7. [Google Scholar] [CrossRef]
- Lauch, K.-S.; Dieryck, V.; Pollet, V. The Use of Ternary Cements to Reduce the Environmental Impact of Concrete. RILEM Tech. Lett. 2016, 1, 88–93. [Google Scholar] [CrossRef]
- Codina, M.; Cau-dit-Coumes, C.; Le Bescop, P.; Verdier, J.; Ollivier, J.P. Design and Characterization of Low-Heat and Low-Alkalinity Cements. Cem. Concr. Res. 2008, 38, 437–448. [Google Scholar] [CrossRef]
- El Bitouri, Y.; Buffo-Lacarrière, L.; Sellier, A.; Bourbon, X. Modelling of Chemo-Mechanical Behaviour of Low PH Concretes. Cem. Concr. Res. 2016, 81, 70–80. [Google Scholar] [CrossRef] [Green Version]
- Wang, L.; Yang, H.Q.; Zhou, S.H.; Chen, E.; Tang, S.W. Mechanical Properties, Long-Term Hydration Heat, Shinkage Behavior and Crack Resistance of Dam Concrete Designed with Low Heat Portland (LHP) Cement and Fly Ash. Constr. Build. Mater. 2018, 187, 1073–1091. [Google Scholar] [CrossRef]
- Wang, L.; Jin, M.; Wu, Y.; Zhou, Y.; Tang, S. Hydration, Shrinkage, Pore Structure and Fractal Dimension of Silica Fume Modified Low Heat Portland Cement-Based Materials. Constr. Build. Mater. 2021, 272, 121952. [Google Scholar] [CrossRef]
- Dauzères, A.; Le Bescop, P.; Cau-Dit-Coumes, C.; Brunet, F.; Bourbon, X.; Timonen, J.; Voutilainen, M.; Chomat, L.; Sardini, P. On the Physico-Chemical Evolution of Low-PH and CEM I Cement Pastes Interacting with Callovo-Oxfordian Pore Water under Its in Situ CO2 Partial Pressure. Cem. Concr. Res. 2014, 58, 76–88. [Google Scholar] [CrossRef]
- Codina, M. Les Bétons Bas PH: Formulation, Caractérisation et Étude à Long Terme. Ph.D. Thesis, INSA de Toulouse, Toulouse, France, 2007. [Google Scholar]
- Carde, C.; François, R.; Torrenti, J.-M. Leaching of Both Calcium Hydroxide and C-S-H from Cement Paste: Modeling the Mechanical Behavior. Cem. Concr. Res. 1996, 26, 1257–1268. [Google Scholar] [CrossRef]
- Heukamp, F.H.; Ulm, F.-J.; Germaine, J.T. Mechanical Properties of Calcium-Leached Cement Pastes: Triaxial Stress States and the Influence of the Pore Pressures. Cem. Concr. Res. 2001, 31, 767–774. [Google Scholar] [CrossRef]
- Heukamp, F.H.; Ulm, F.-J.; Germaine, J.T. Poroplastic Properties of Calcium-Leached Cement-Based Materials. Cem. Concr. Res. 2003, 33, 1155–1173. [Google Scholar] [CrossRef]
- Nguyen, V.H.; Colina, H.; Torrenti, J.M.; Boulay, C.; Nedjar, B. Chemo-Mechanical Coupling Behaviour of Leached Concrete: Part I: Experimental Results. Nucl. Eng. Des. 2007, 237, 2083–2089. [Google Scholar] [CrossRef]
- Sellier, A.; Buffo-Lacarrière, L.; Gonnouni, M.E.; Bourbon, X. Behavior of HPC Nuclear Waste Disposal Structures in Leaching Environment. Nucl. Eng. Des. 2011, 241, 402–414. [Google Scholar] [CrossRef]
- Liu, L.; Sun, C.; Geng, G.; Feng, P.; Li, J.; Dähn, R. Influence of Decalcification on Structural and Mechanical Properties of Synthetic Calcium Silicate Hydrate (C-S-H). Cem. Concr. Res. 2019, 123, 105793. [Google Scholar] [CrossRef]
- Nied, D.; Enemark-Rasmussen, K.; L’Hopital, E.; Skibsted, J.; Lothenbach, B. Properties of Magnesium Silicate Hydrates (M-S-H). Cem. Concr. Res. 2016, 79, 323–332. [Google Scholar] [CrossRef]
- Roosz, C.; Grangeon, S.; Blanc, P.; Montouillout, V.; Lothenbach, B.; Henocq, P.; Giffaut, E.; Vieillard, P.; Gaboreau, S. Crystal Structure of Magnesium Silicate Hydrates (M-S-H): The Relation with 2:1 Mg–Si Phyllosilicates. Cem. Concr. Res. 2015, 73, 228–237. [Google Scholar] [CrossRef]
- D’Espinose de la Caillerie, J.-B.; Kermarec, M.; Clause, O. 29Si NMR Observation of an Amorphous Magnesium Silicate Formed during Impregnation of Silica with Mg(II) in Aqueous Solution. J. Phys. Chem. 1995, 99, 17273–17281. [Google Scholar] [CrossRef]
- Brew, D.R.M.; Glasser, F.P. Synthesis and Characterisation of Magnesium Silicate Hydrate Gels. Cem. Concr. Res. 2005, 35, 85–98. [Google Scholar] [CrossRef]
- Bernard, E.; Lothenbach, B.; Rentsch, D.; Pochard, I.; Dauzères, A. Formation of Magnesium Silicate Hydrates (M-S-H). Phys. Chem. Earth Parts A/B/C 2017, 99, 142–157. [Google Scholar] [CrossRef]
- Bernard, E.; Lothenbach, B.; Cau-Dit-Coumes, C.; Chlique, C.; Dauzères, A.; Pochard, I. Magnesium and Calcium Silicate Hydrates, Part I: Investigation of the Possible Magnesium Incorporation in Calcium Silicate Hydrate (C-S-H) and of the Calcium in Magnesium Silicate Hydrate (M-S-H). Appl. Geochem. 2018, 89, 229–242. [Google Scholar] [CrossRef]
- Lothenbach, B.; Nied, D.; L’Hôpital, E.; Achiedo, G.; Dauzères, A. Magnesium and Calcium Silicate Hydrates. Cem. Concr. Res. 2015, 77, 60–68. [Google Scholar] [CrossRef]
- Zhang, T.; Zou, J.; Wang, B.; Wu, Z.; Jia, Y.; Cheeseman, C.R. Characterization of Magnesium Silicate Hydrate (MSH) Gel Formed by Reacting MgO and Silica Fume. Materials 2018, 11, 909. [Google Scholar] [CrossRef] [Green Version]
- Roosz, C.; Vieillard, P.; Blanc, P.; Gaboreau, S.; Gailhanou, H.; Braithwaite, D.; Montouillout, V.; Denoyel, R.; Henocq, P.; Madé, B. Thermodynamic Properties of C-S-H, C-A-S-H and M-S-H Phases: Results from Direct Measurements and Predictive Modelling. Appl. Geochem. 2018, 92, 140–156. [Google Scholar] [CrossRef]
- Bernard, E.; Lothenbach, B.; Le Goff, F.; Pochard, I.; Dauzères, A. Effect of Magnesium on Calcium Silicate Hydrate (C-S-H). Cem. Concr. Res. 2017, 97, 61–72. [Google Scholar] [CrossRef] [Green Version]
- Bernard, E.; Dauzères, A.; Lothenbach, B. Magnesium and Calcium Silicate Hydrates, Part II: Mg-Exchange at the Interface “Low-PH” Cement and Magnesium Environment Studied in a C-S-H and M-S-H Model System. Appl. Geochem. 2018, 89, 210–218. [Google Scholar] [CrossRef]
- Bernard, E.; Lothenbach, B.; Chlique, C.; Wyrzykowski, M.; Dauzères, A.; Pochard, I.; Cau-Dit-Coumes, C. Characterization of Magnesium Silicate Hydrate (M-S-H). Cem. Concr. Res. 2019, 116, 309–330. [Google Scholar] [CrossRef]
- Tonelli, M.; Martini, F.; Calucci, L.; Geppi, M.; Borsacchi, S.; Ridi, F. Traditional Portland Cement and MgO-Based Cement: A Promising Combination? Phys. Chem. Earth Parts A/B/C 2017, 99, 158–167. [Google Scholar] [CrossRef]
- Zhang, T.; Vandeperre, L.J.; Cheeseman, C.R. Formation of Magnesium Silicate Hydrate (M-S-H) Cement Pastes Using Sodium Hexametaphosphate. Cem. Concr. Res. 2014, 65, 8–14. [Google Scholar] [CrossRef] [Green Version]
- Tonelli, M.; Martini, F.; Calucci, L.; Fratini, E.; Geppi, M.; Ridi, F.; Borsacchi, S.; Baglioni, P. Structural Characterization of Magnesium Silicate Hydrate: Towards the Design of Eco-Sustainable Cements. Dalton Trans. 2016, 45, 3294–3304. [Google Scholar] [CrossRef]
- Sonat, C.; Unluer, C. Development of Magnesium-Silicate-Hydrate (M-S-H) Cement with Rice Husk Ash. J. Clean. Prod. 2019, 211, 787–803. [Google Scholar] [CrossRef]
- Hesaraki, S.; Zamanian, A.; Moztarzadeh, F. Effect of Adding Sodium Hexametaphosphate Liquefier on Basic Properties of Calcium Phosphate Cements. J. Biomed. Mater. Res. Part A 2009, 88A, 314–321. [Google Scholar] [CrossRef]
- Jia, Y.; Wang, B.; Wu, Z.; Han, J.; Zhang, T.; Vandeperre, L.J.; Cheeseman, C.R. Role of Sodium Hexametaphosphate in MgO/SiO2 Cement Pastes. Cem. Concr. Res. 2016, 89, 63–71. [Google Scholar] [CrossRef]
- Tonelli, M.; Martini, F.; Milanesi, A.; Calucci, L.; Geppi, M.; Borsacchi, S.; Ridi, F. Effect of Phosphate Additives on the Hydration Process of Magnesium Silicate Cements. J. Anal. Calorim. 2019, 138, 3311–3321. [Google Scholar] [CrossRef]
- Bernard, E. Magnesium Silicate Hydrate (M-S-H) Characterization: Temperature, Calcium, Aluminium and Alkali. Ph.D. Thesis, Université Bourgogne Franche-Comté, Bourgogne Franche-Comté, France, 2017. [Google Scholar]
- Lothenbach, B.; Durdziński, P.; De Weerdt, K. Chapter 5: Thermogravimetric analysis. In A Practical Guide to Microstructural Analysis of Cementitious Materials; CRC Press: Boca Raton, FL, USA, 2016; pp. 177–212. ISBN 978-1-4987-3867-5. [Google Scholar]
- Mehta, P.; Monteiro, P.J.M. Concrete: Microstructure, Properties, and Materials: Microstructure, Properties, and Materials; McGraw Hill Professional: New York, NY, USA, 2005; ISBN 978-0-07-146289-1. [Google Scholar]
- Sardini, P.; Siitari-Kauppi, M.; Beaufort, D.; Hellmuth, K.-H. On the Connected Porosity of Mineral Aggregates in Crystalline Rocks. Am. Mineral. 2006, 91, 1069–1080. [Google Scholar] [CrossRef]
- Hellmuth, K.H.; Siitari-Kauppi, M.; Lindberg, A. Study of Porosity and Migration Pathways in Crystalline Rock by Impregnation with 14C-Polymethylmethacrylate. J. Contam. Hydrol. 1993, 13, 403–418. [Google Scholar] [CrossRef]
- Hellmuth, K.-H.; Lukkarinen, S.; Siitari-kauppi, M. Rock Matrix Studies with Carbon-14-Polymethylmethacrylate (PMMA); Method Development and Applications. Isot. Isot. Environ. Health Stud. 1994, 30, 47–60. [Google Scholar] [CrossRef]
- Sammaljärvi, J.; Shroff Rama, M.; Ikonen, J.; Muuri, E.; Hellmuth, K.-H.; Siitari-Kauppi, M. Free Radical Polymerisation of Methacrylates with Thermal Initiator in Clay Rock. Eng. Geol. 2016, 210, 70–83. [Google Scholar] [CrossRef]
- Lalan, P.; Dauzères, A.; De Windt, L.; Sammaljärvi, J.; Bartier, D.; Techer, I.; Detilleux, V.; Siitari-Kauppi, M. Mineralogical and Microstructural Evolution of Portland Cement Paste/Argillite Interfaces at 70 °C—Considerations for Diffusion and Porosity Properties. Cem. Concr. Res. 2019, 115, 414–425. [Google Scholar] [CrossRef]
- Sammaljärvi, J.; Jokelainen, L.; Ikonen, J.; Siitari-Kauppi, M. Free Radical Polymerisation of MMA with Thermal Initiator in Brick and Grimsel Granodiorite. Eng. Geol. 2012, 135–136, 52–59. [Google Scholar] [CrossRef]
- Delayre, C.; Sammaljärvi, J.; Billon, S.; Muuri, E.; Sardini, P.; Siitari-Kauppi, M. Comparison of Phosphor Screen Autoradiography and Micro-Pattern Gas Detector Based Autoradiography for the Porosity of Altered Rocks. Sci. Rep. 2020, 10, 9455. [Google Scholar] [CrossRef]
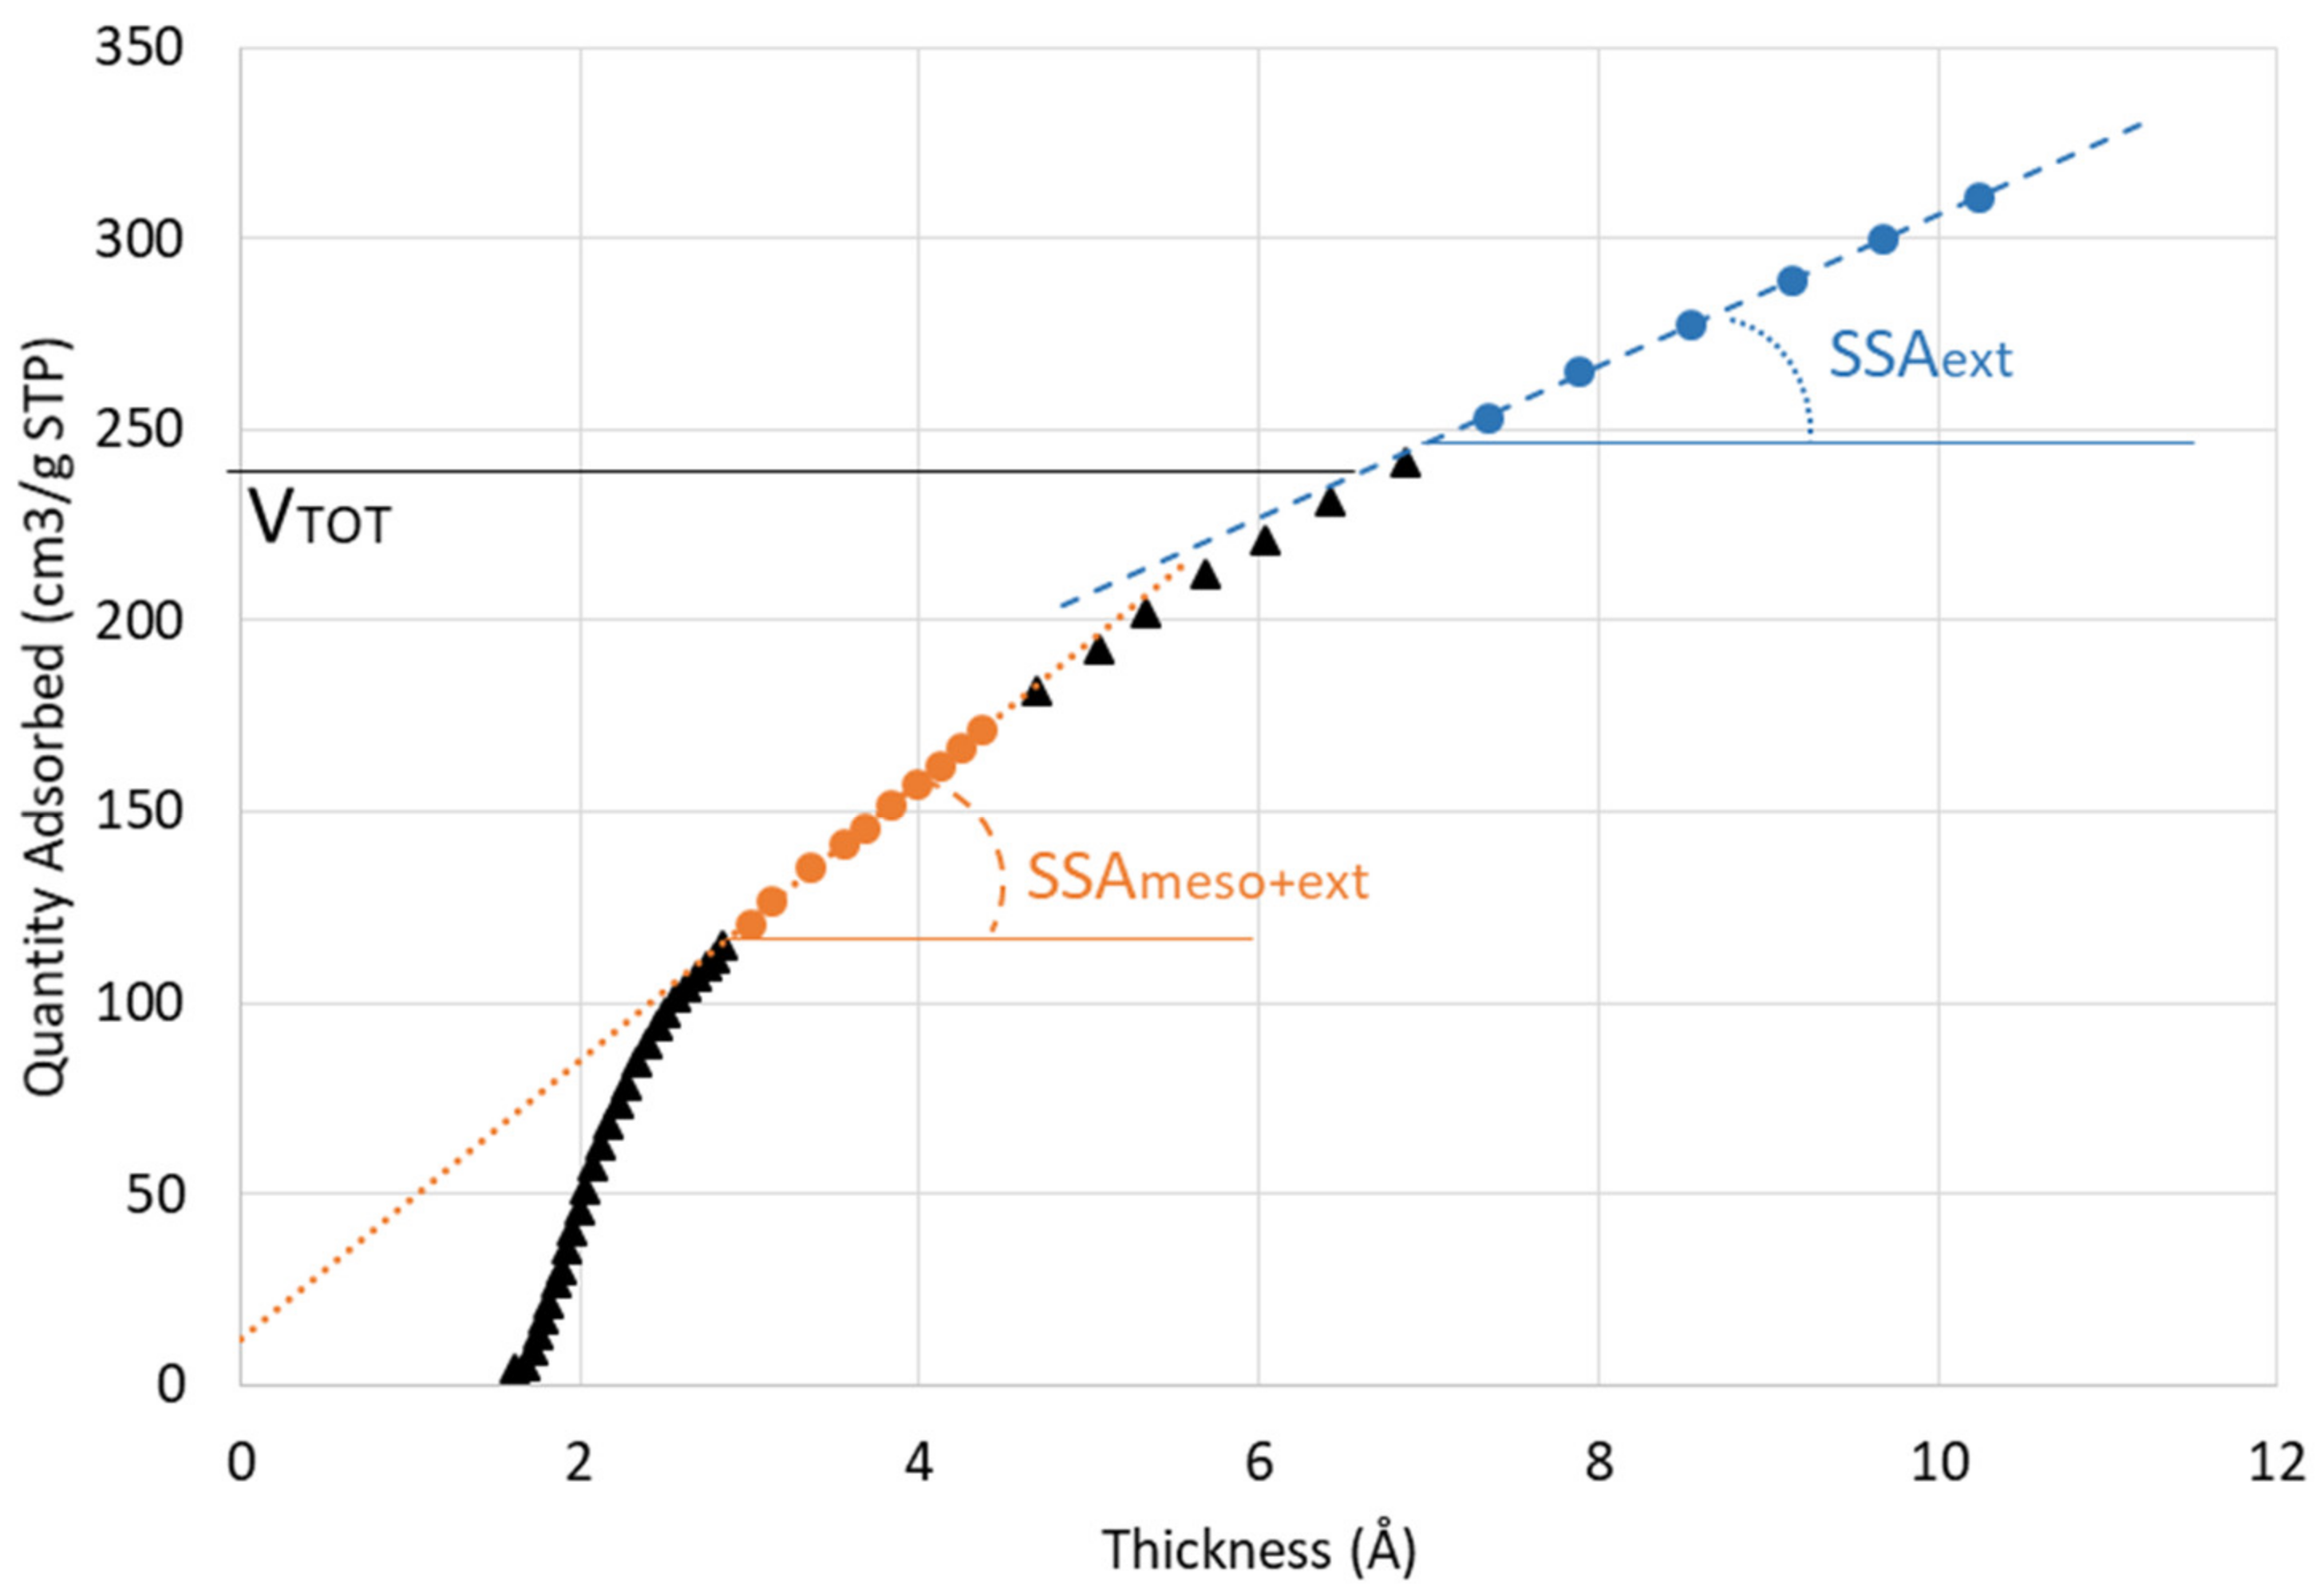
- Galarneau, A.; Mehlhorn, D.; Guenneau, F.; Coasne, B.; Villemot, F.; Minoux, D.; Aquino, C.; Dath, J.-P. Specific Surface Area Determination for Microporous/Mesoporous Materials: The Case of Mesoporous FAU-Y Zeolites. Langmuir 2018, 34, 14134–14142. [Google Scholar] [CrossRef] [PubMed]
- De Boer, J.H.; Lippens, B.C.; Linsen, B.G.; Broekhoff, J.C.P.; van den Heuvel, A.; Osinga, T.H.J. Thet-Curve of Multimolecular N2-Adsorption. J. Colloid Interface Sci. 1966, 21, 405–414. [Google Scholar] [CrossRef]
- Barrett, E.P.; Joyner, L.G.; Halenda, P.P. The Determination of Pore Volume and Area Distributions in Porous Substances. I. Computations from Nitrogen Isotherms. J. Am. Chem. Soc. 1951, 73, 373–380. [Google Scholar] [CrossRef]
- Monnier, G.; Stengel, P.; Fies, J.C. Une Méthode de Mesure de La Densité Apparente de Petits Agglomérats Terreux. Application à l’analyse Des Systèmes de Porosité Du Sol. Ann. Agron. 1973, 24, 533–545. [Google Scholar]
- French Standard X31-505; Qualité des Sols—Méthodes Physiques-Méthode de Détermination du Volume Apparent et du Contenu en eau des Mottes. AFNOR: Paris, France, 1992; 12p.
- Li, Z.; Zhang, T.; Hu, J.; Tang, Y.; Niu, Y.; Wei, J.; Yu, Q. Characterization of Reaction Products and Reaction Process of MgO–SiO2–H2O System at Room Temperature. Constr. Build. Mater. 2014, 61, 252–259. [Google Scholar] [CrossRef]
- Dumas, A.; Martin, F.; Le Roux, C.; Micoud, P.; Petit, S.; Ferrage, E.; Brendlé, J.; Grauby, O.; Greenhill-Hooper, M. Phyllosilicates Synthesis: A Way of Accessing Edges Contributions in NMR and FTIR Spectroscopies. Example of Synthetic Talc. Phys. Chem. Miner. 2013, 40, 361–373. [Google Scholar] [CrossRef]
- Zhuravlev, L.T. The Surface Chemistry of Amorphous Silica. Zhuravlev Model. Colloids Surf. A Physicochem. Eng. Asp. 2000, 173, 1–38. [Google Scholar] [CrossRef] [Green Version]
- Grangeon, S.; Claret, F.; Roosz, C.; Sato, T.; Gaboreau, S.; Linard, Y. Structure of Nanocrystalline Calcium Silicate Hydrates: Insights from X-ray Diffraction, Synchrotron X-ray Absorption and Nuclear Magnetic Resonance. J. Appl. Cryst. 2016, 49, 771–783. [Google Scholar] [CrossRef]
- Sing, K.S.W. Reporting physisorption data for gas/solid systems with special reference to the determination of surface area and porosity (Recommendations 1984). Pure Appl. Chem. 1985, 57, 603–619. [Google Scholar] [CrossRef]
- Bardestani, R.; Patience, G.S.; Kaliaguine, S. Experimental Methods in Chemical Engineering: Specific Surface Area and Pore Size Distribution Measurements—BET, BJH, and DFT. Can. J. Chem. Eng. 2019, 97, 2781–2791. [Google Scholar] [CrossRef]
- Bisio, C.; Gatti, G.; Boccaleri, E.; Marchese, L.; Superti, G.B.; Pastore, H.O.; Thommes, M. Understanding Physico–Chemical Properties of Saponite Synthetic Clays. Microporous Mesoporous Mater. 2008, 107, 90–101. [Google Scholar] [CrossRef]
- Richardson, I.G. The Nature of C-S-H in Hardened Cements. Cem. Concr. Res. 1999, 29, 1131–1147. [Google Scholar] [CrossRef]
- Kangni-Foli, E. Apport de Matériaux Cimentaires Modèles à La Description Des Cinétiques de Carbonatation de Bétons Bas-PH: Conséquences Sur La Microstructure Le Transport de Gaz et Les Déformations. Ph.D. Thesis, Paris Sciences et Lettres, Paris, France, 2019. [Google Scholar]
- Bernard, E.; Lothenbach, B.; Cau-Dit-Coumes, C.; Pochard, I.; Rentsch, D. Aluminum Incorporation into Magnesium Silicate Hydrate (M-S-H). Cem. Concr. Res. 2020, 128, 105931. [Google Scholar] [CrossRef]
- Shah, V.; Scott, A. Hydration and Microstructural Characteristics of MgO in the Presence of Metakaolin and Silica Fume. Cem. Concr. Compos. 2021, 121, 104068. [Google Scholar] [CrossRef]


| Type of Silica | M/S | T (°C) | Sample Name | g | Sp/b | w/b | |||
|---|---|---|---|---|---|---|---|---|---|
| MgO | Silica Fume | Milli-Q-Water | Superplasticizer (Dry Extract) | ||||||
| Silica fume | 0.78 | 20 | MS_0-78_SF_T20 | 176.4 | 336.9 | 513.8 | 0 | 0 | 1 |
| 50 | MS_0-78_SF_T50 | ||||||||
| 1 | 20 | MS_1_SF_T20 | 208.7 | 309.2 | 522.2 | 0 | 0 | 1 | |
| 50 | MS_1_SF_T50 | ||||||||
| 1.3 | 20 | MS_1-3_SF_T20 | 242.8 | 278.1 | 526.3 | 0 | 0 | 1 | |
| 50 | MS_1-3_SF_T50 | ||||||||
| Type of Silica | M/S | T (°C) | Sample Name | g | Sp/b | w/b | |||
| MgO | Rheomac AS 150 | Milli-Q-Water | Superplasticizer (Dry Extract) | ||||||
| Colloidal silica | 0.78 | 20 | MS_0-78_Cs_T20_M | 63.2 | 241.3 | 145.8 | 8.94 | 4.9% | 1.45 |
| 50 | MS_0-78_Cs_T50_M | ||||||||
| 0.78 | 50 | MS_0-78_Cs_T50_E | 241.1 | 920.3 | 312.5 | 47.4 | 6.8% | 1.1 | |
| 1 | 50 | MS_1_Cs_T50_M | 71.7 | 213.3 | 151.5 | 9.18 | 5.1% | 1.45 | |
| 1 | 20 | MS_1_Cs_T20_E | 292.5 | 872.7 | 292.7 | 45.1 | 6.2% | 1 | |
| 50 | MS_1_Cs_T50_E | ||||||||
| 1.3 | 20 | MS_1-3_Cs_T20_M | 119.8 | 274.3 | 235.1 | 7.14 | 2.8% | 1.45 | |
| 50 | MS_1-3_Cs_T50_M | ||||||||
| 1.3 | 50 | MS_1-3_Cs_T50_E | 331.7 | 760.8 | 403 | 38.25 | 5.4% | 1.1 |
| Sample Name | Location of Test | Protocol |
|---|---|---|
| MS_0-78_SF_T20_19d | Sorbonne Université | PANalytical X’Pert Pro (PANalytical Empyrean instrument) operating at 40 kV and 40 mA with a Cu anti-cathode (λ~1.54 Å) |
| MS_0-78_SF_T50_19d | Sorbonne Université | |
| MS_0-78_Cs_T20_16d | Sorbonne Université | |
| MS_0-78_Cs_T50_16d | Sorbonne Université | 2Θ = 5°–70° with a step size of 0.0131, for a total duration of 4 h |
| MS_1_SF_T20_91d | Sorbonne Université | |
| MS_1-3_SF_T20_91d | Sorbonne Université | |
| Colloidal silica | LMDC | |
| Silica fume | IRSN | |
| MS_1_SF_T20_19d | IRSN | |
| MS_1-3_SF_T20_19d | IRSN | PANalytical Aeris operating at 600 W, 40 kV and 15 mA, with a Cu anti-cathode (λ~1.54 Å), |
| MS_1_SF_T50_19d | IRSN | |
| MS_1-3_SF_T50_19d | IRSN | |
| MS_0-78_Cs_T50_128d | IRSN | step size of 0.0109, for a total duration of 20 min |
| MS_1_Cs_T50_156d | IRSN | |
| MS_1-3_Cs_T50_122d | IRSN |
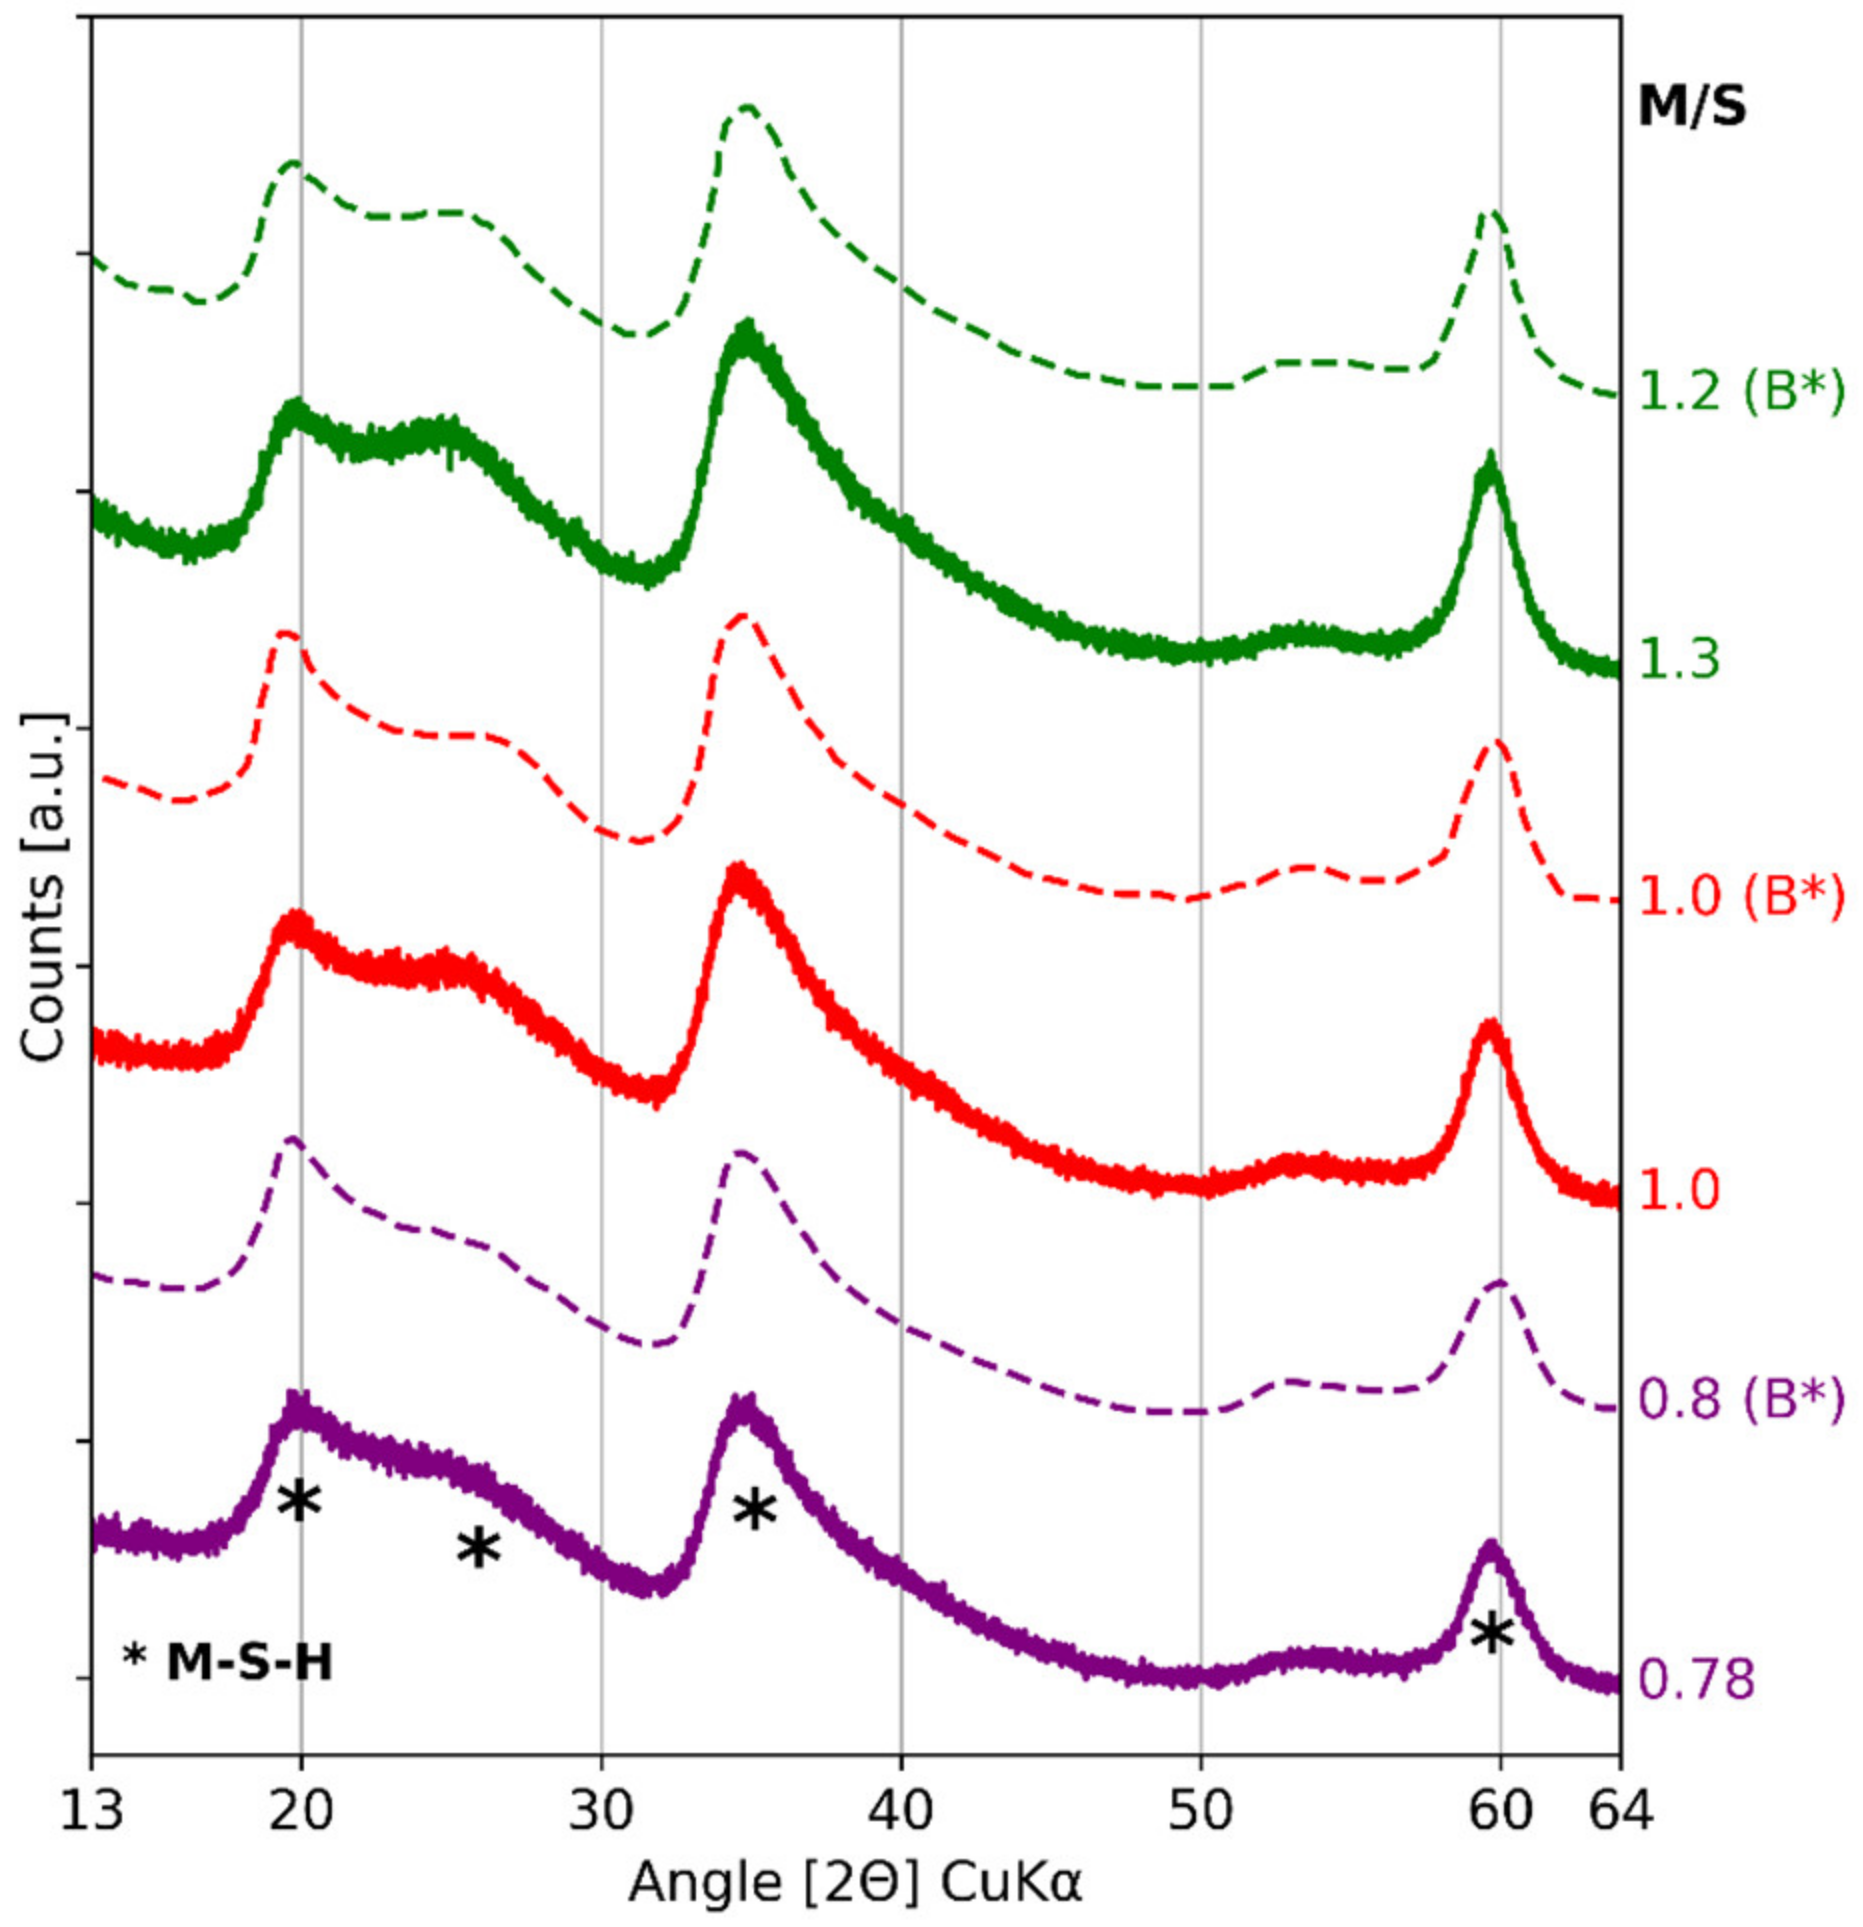
| References | Species | Unit | Peaks Indexing | |||||
|---|---|---|---|---|---|---|---|---|
| COD 96-901-0145 and COD 96-900-9687 | Quartz and cristobalite | Å | 4.26 | 4.05 | 3.34 | 3.14 | ||
| [2Θ] CuKα | 20.85 | 21.92 | 26.65 | 28.39 | ||||
| Bernard et al. [36] | Brucite | Å | 4.76 | 2.74 | 2.37 | 1.79 | 1.57 | 1.50 |
| [2Θ] CuKα | 18.6 | 32.7 | 38 | 50.9 | 58.7 | 62 | ||
| Data of Figure 4 | Amorphous silica | Å | 4.04 | |||||
| [2Θ] CuKα | 22 | |||||||
| Bernard et al. [43] and Roosz et al. [33] | M-S-H | Å | 4.43 | 3.42 | 2.56 | 1.70 | 1.54 | |
| [2Θ] CuKα | 20 | 26 | 35 | 54 | 60 | |||
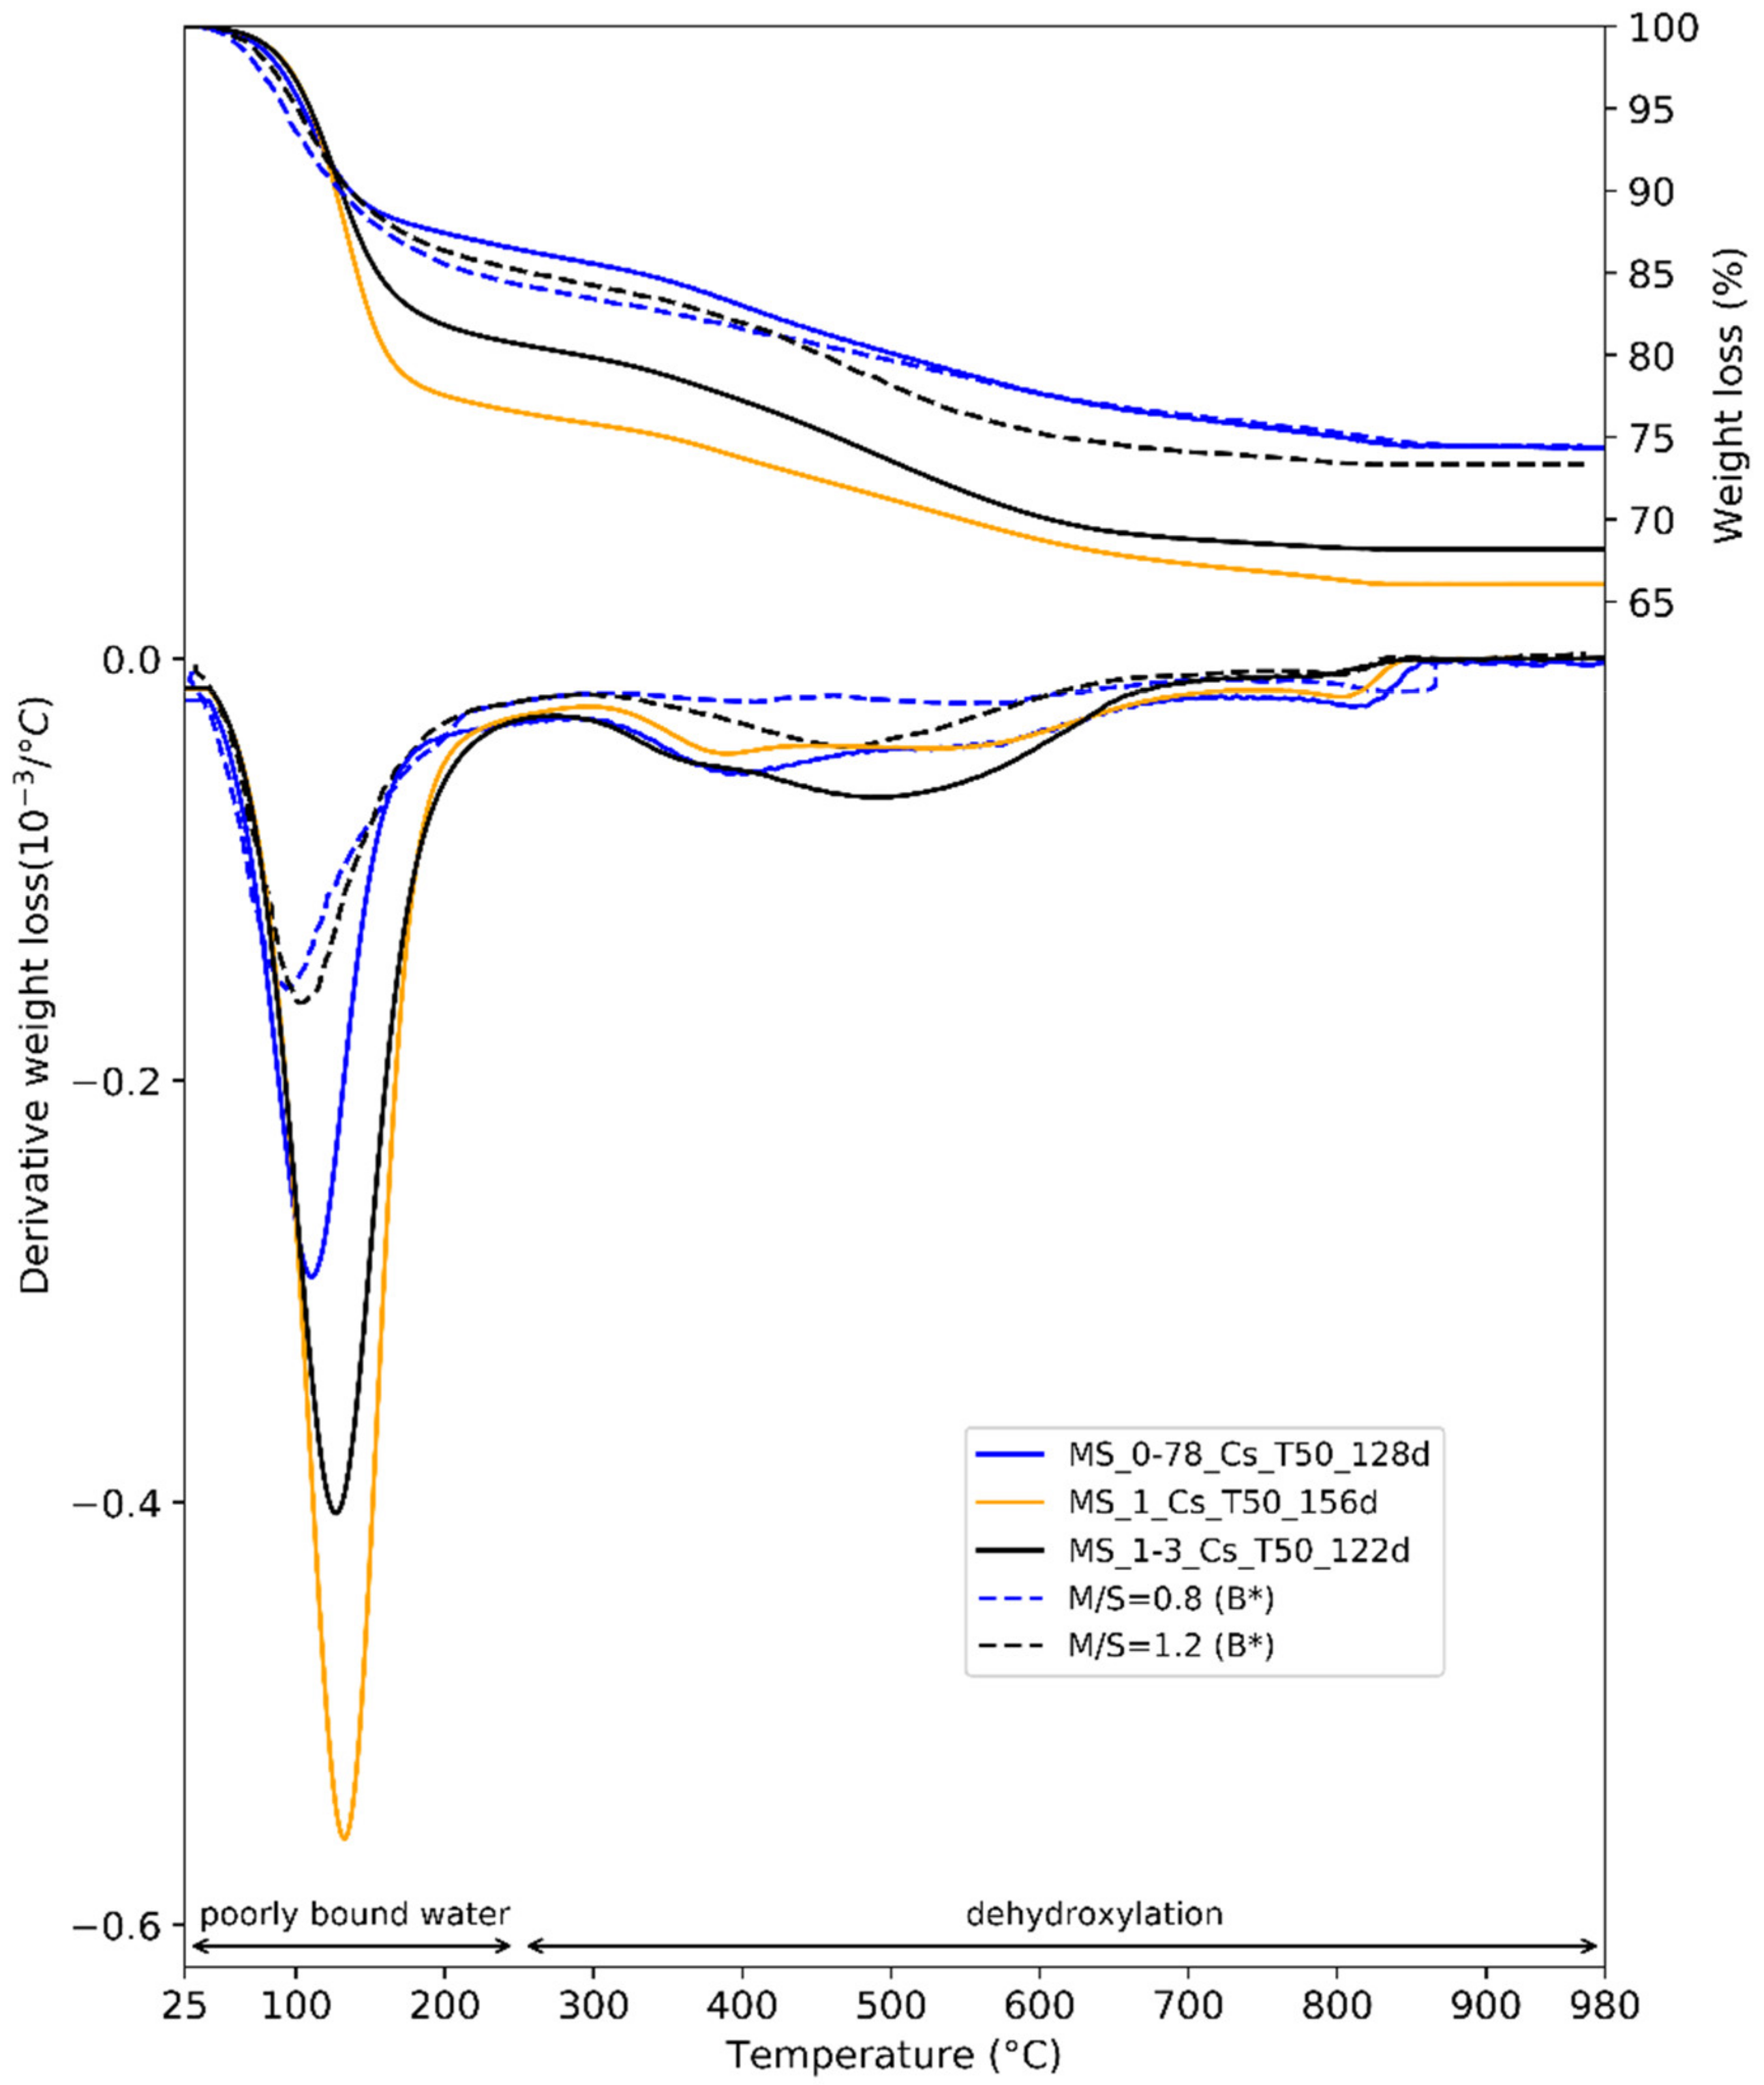
| Author | Species Concerned | Temperature and Phase Associated to Weight Losses | ||
|---|---|---|---|---|
| Lothenbach et al. [52] | M-S-H | 270–700 °C | ||
| hydroxyl groups in M-S-H | ||||
| Nied et al. [32] | M-S-H | 280–750 °C | 750–840 °C | |
| Mg–OH in M-S-H | Si-OH in M-S-H | |||
| Dumas et al. [67] | talc | 150–450 °C | 450–750 °C | 750–850 °C |
| Mg–OH and Si–OH | small particles | big particles | ||
| Zhuralev [68] | amorphous silica | 190–400 °C | 400–900 °C | 900–1200 °C |
| vicinal bridged OH groups of silanols | geminal OH groups of silanols | complete removal of all OH groups | ||
| Bernard et al. [43] | M-S-H | 390 °C | 500 °C | 900–1200 °C |
| surface Si–OH in M-S-H | Mg–OH in M-S-H | internal Si–OH in M-S-H | ||
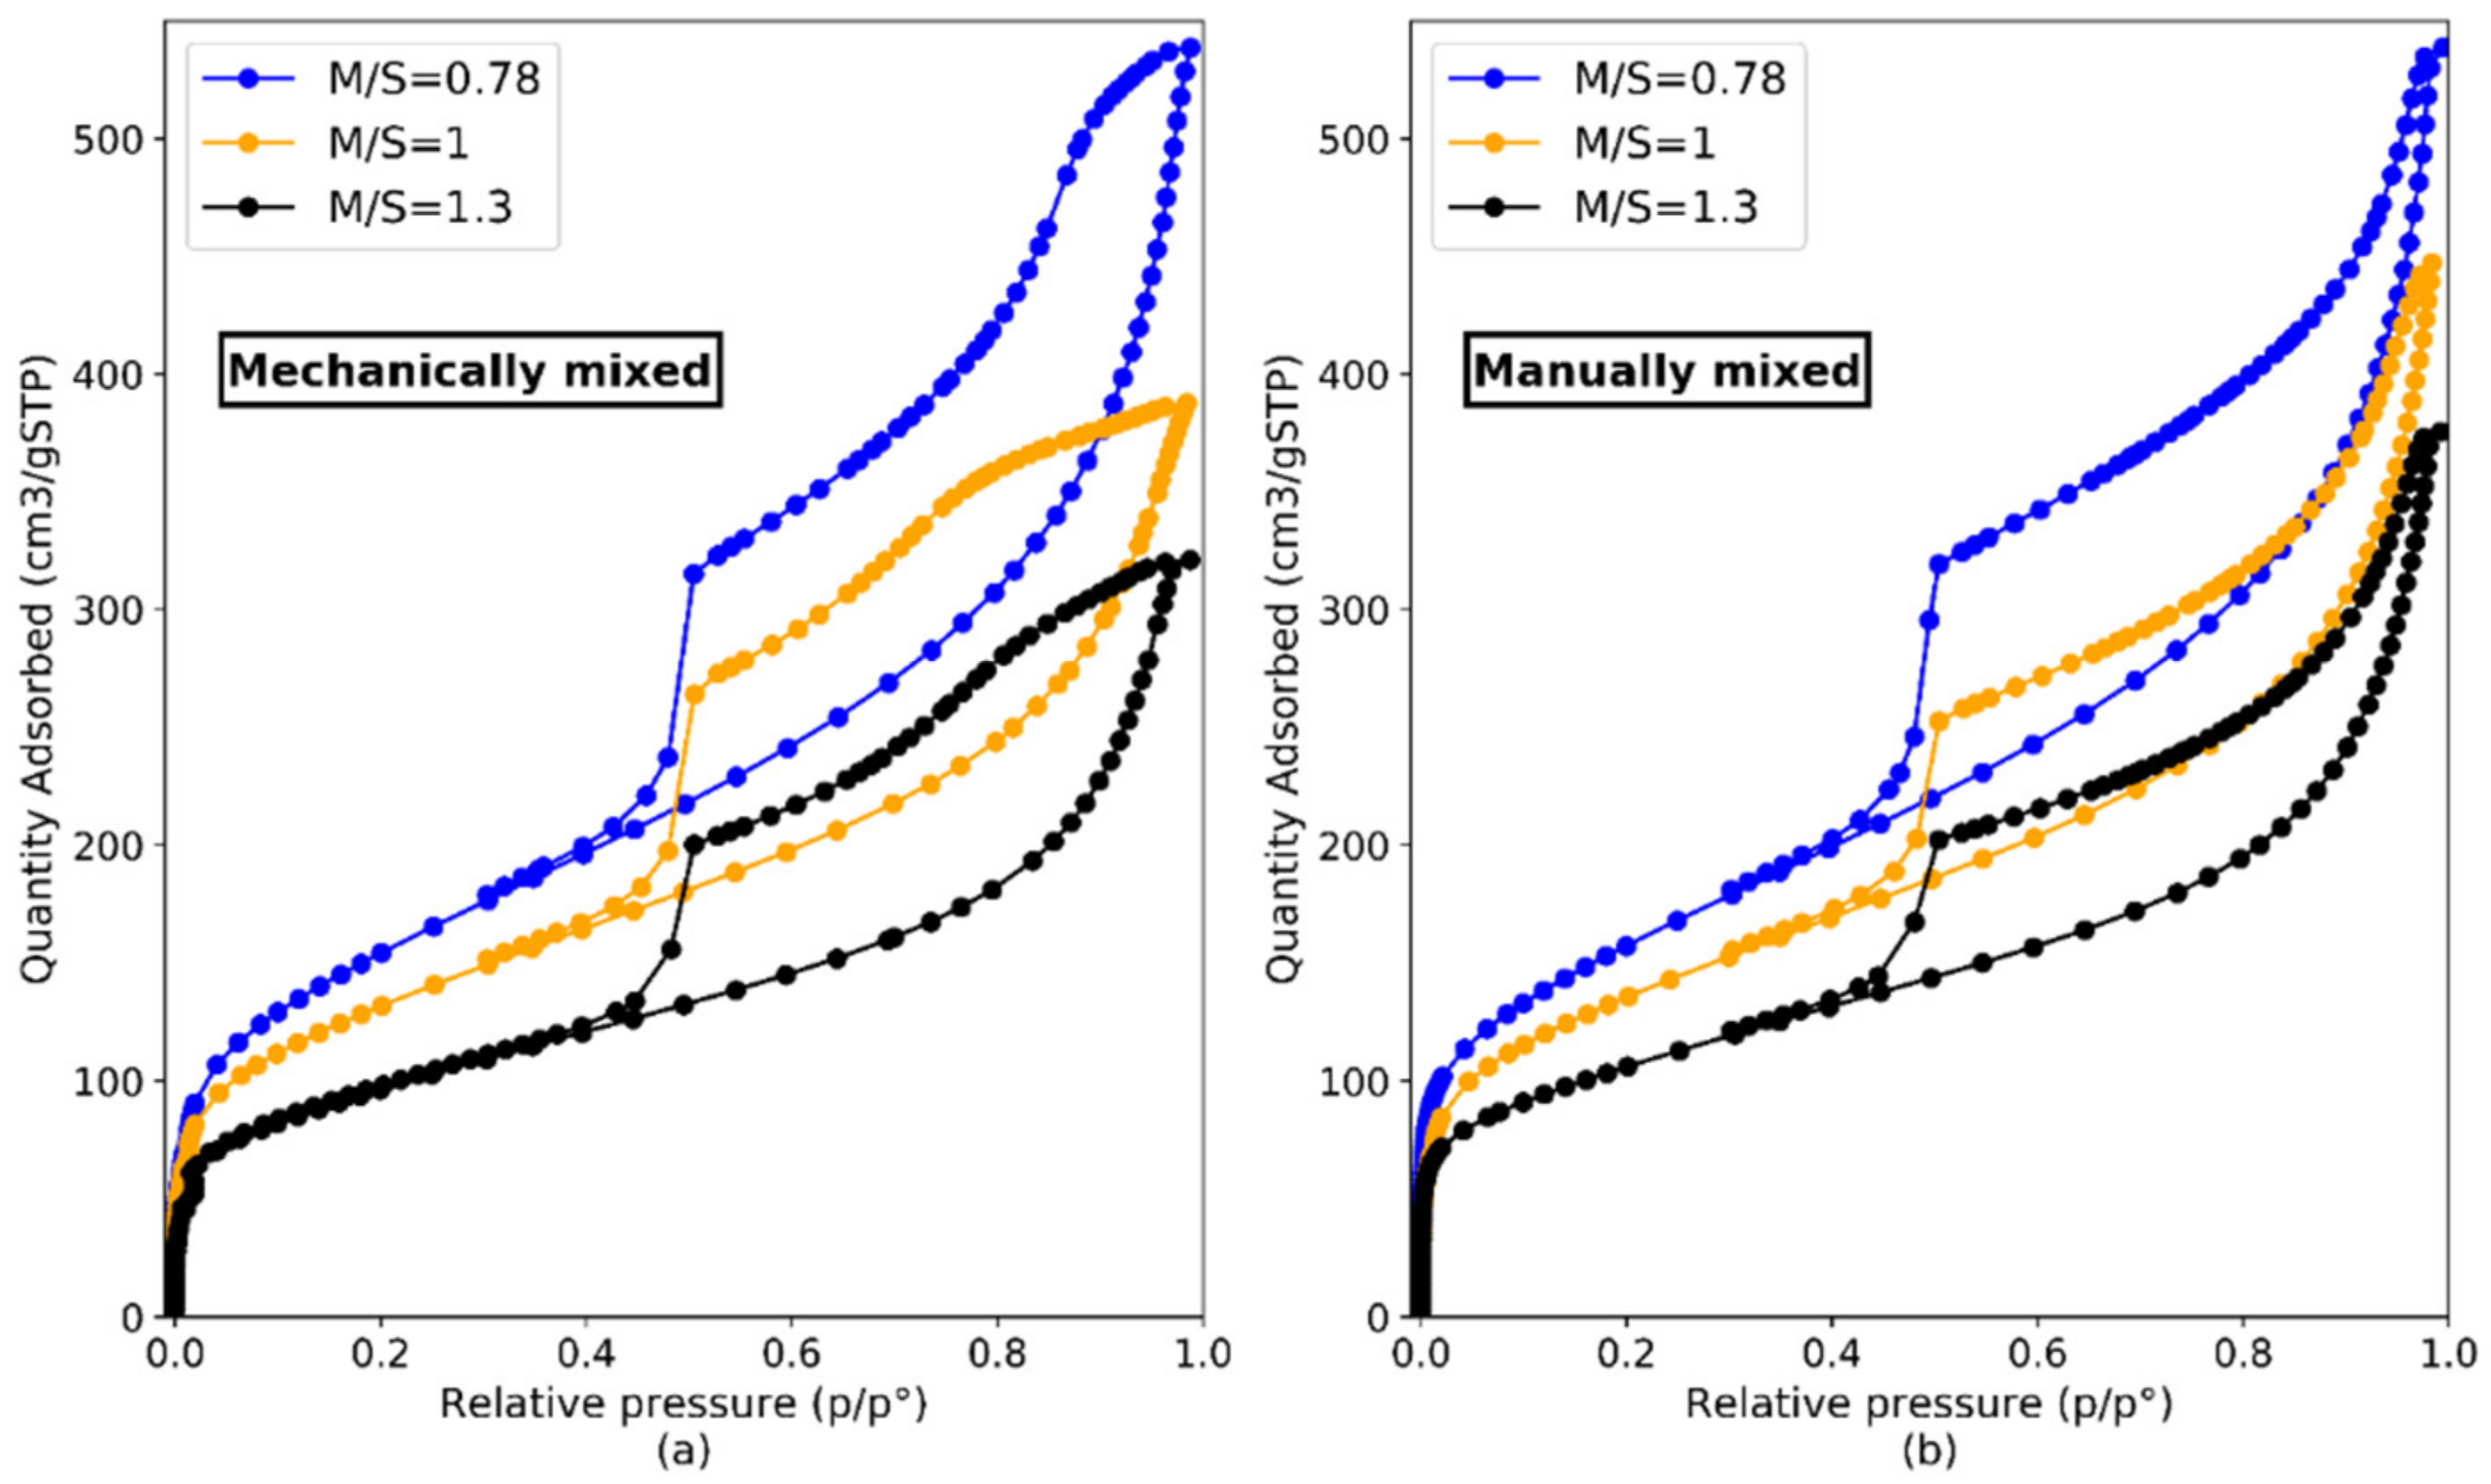
| Mechanically Mixed | Manually Mixed | |||||
|---|---|---|---|---|---|---|
| M/S | 0.78 | 1 | 1.3 | 0.78 | 1 | 1.3 |
| w/b | 1.1 | 1 | 1.1 | 1.45 | 1.45 | 1.45 |
| Age (days) | 70 | 50 | 70 | 230 | 70 | 230 |
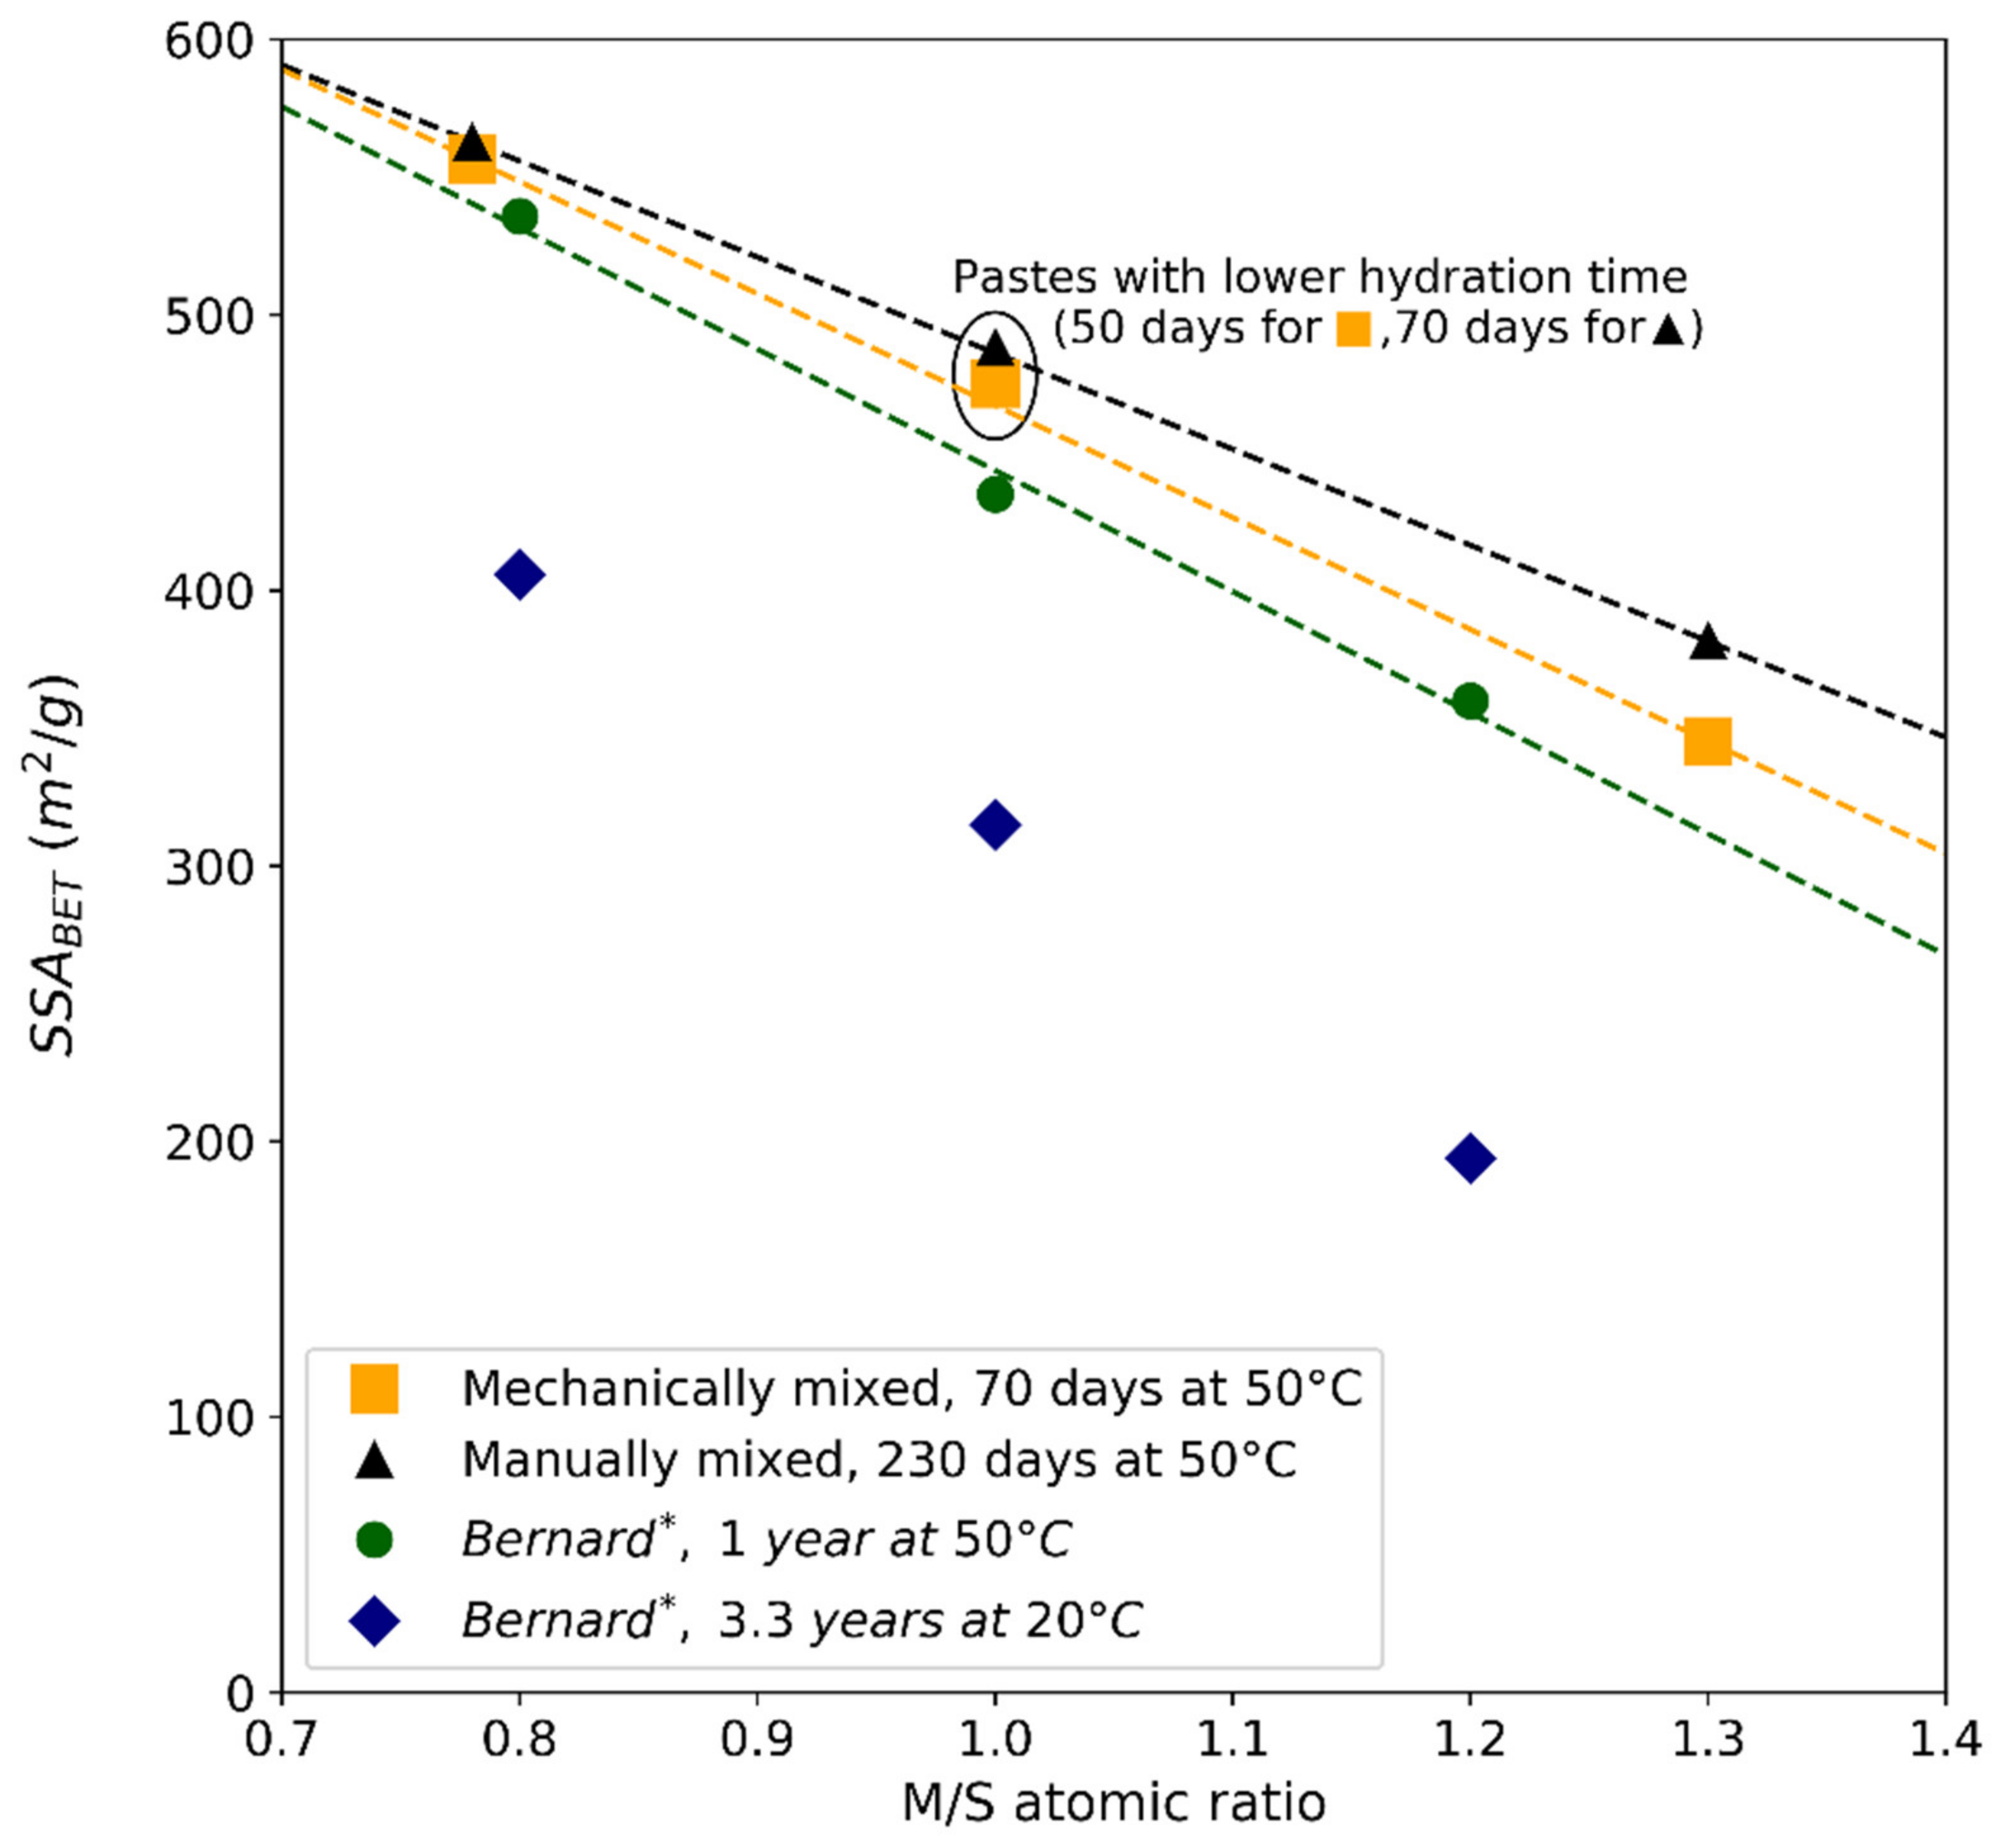
| Average specific surface area BET (m2/g) | 556.7 | 475.2 | 345.3 | 562.9 | 488.2 | 381.6 |
| Medium uncertainty | 1.2 | 0.8 | 1.1 | 0.8 | 1.1 | 0.6 |
| Standard deviation | 11.7 | 3.7 | 6.6 | 8.7 | 8.1 | 3.0 |
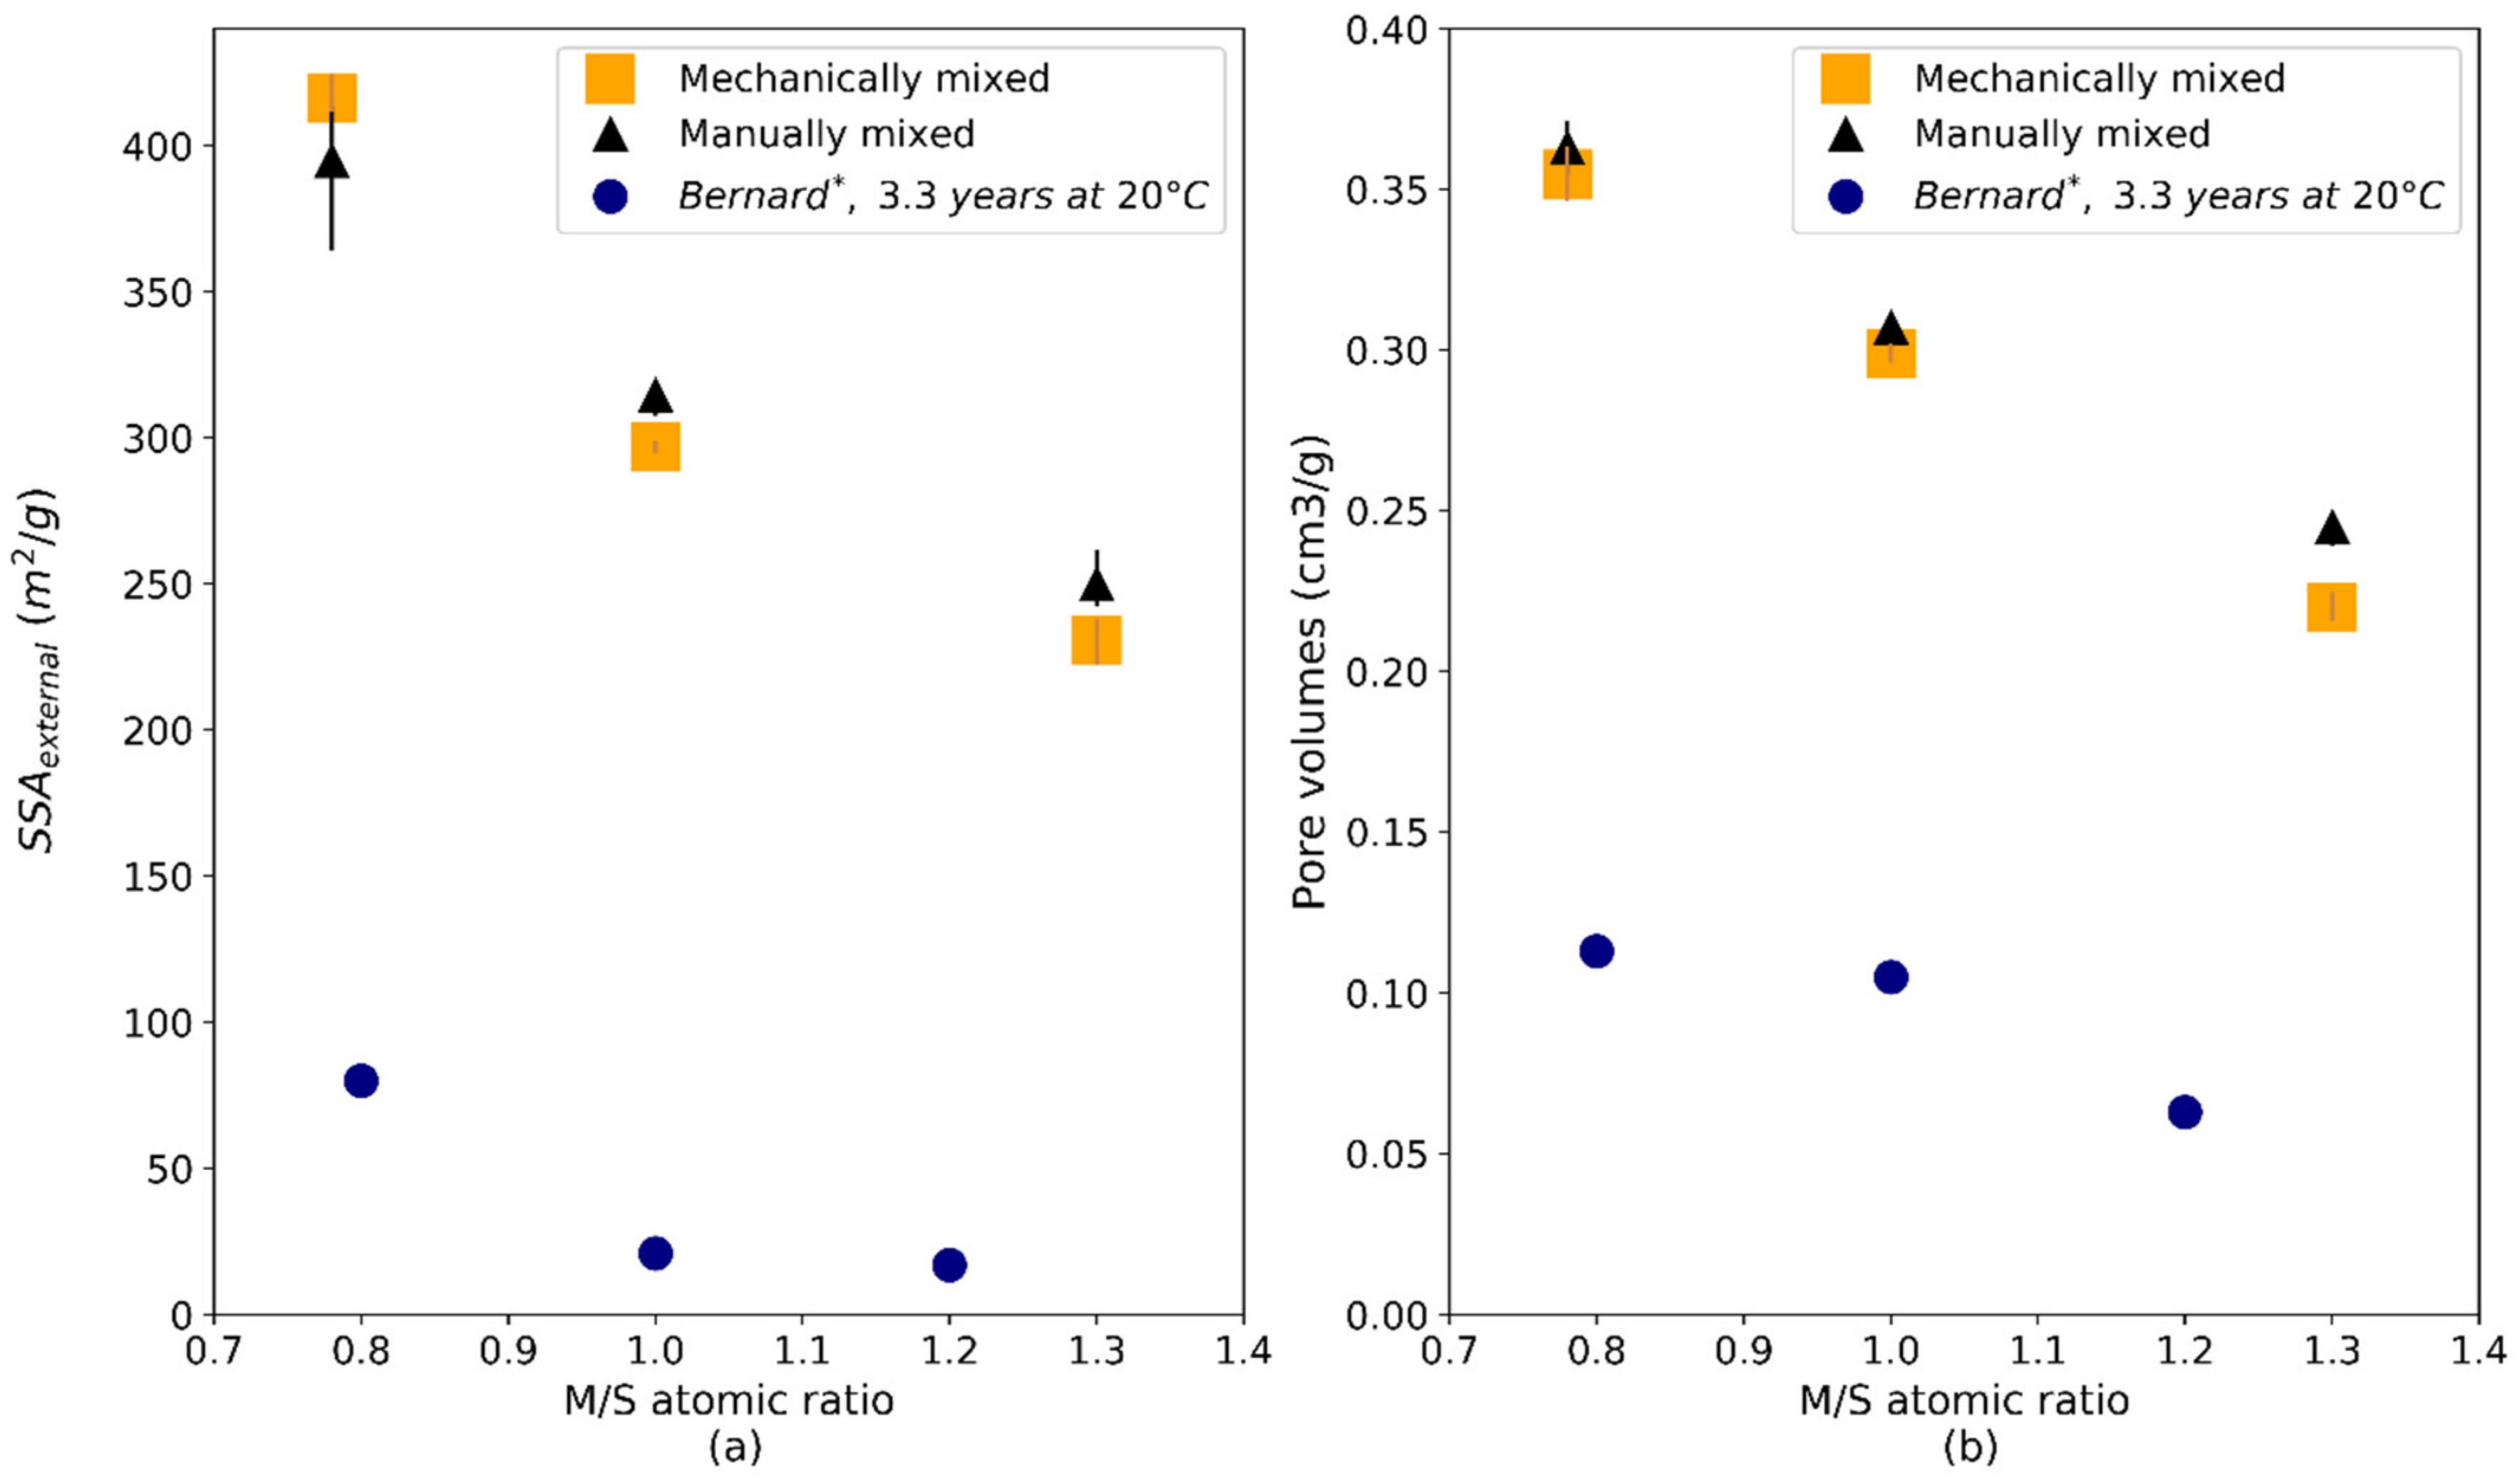
| External average specific surface area (t-plot) (m2/g) | 416.6 | 296.8 | 230.6 | 394.9 | 314.6 | 249.8 |
| Standard deviation | 6.5 | 1.8 | 7.4 | 26.3 | 5.4 | 9.5 |
| Vtot (cm3/g) | 230.0 | 193.5 | 142.3 | 235.0 | 198.3 | 158.3 |
| Standard deviation | 5.0 | 2.1 | 2.5 | 5.0 | 2.9 | 2.9 |
| Pore volume (cm3/g) | 0.355 | 0.299 | 0.220 | 0.363 | 0.307 | 0.245 |
| Mechanically Mixed | Manually Mixed | ||||||
|---|---|---|---|---|---|---|---|
| M/S | 0.78 | 1 | 1.3 | 0.78 | 1 | 1.3 | |
| w/b | 1.1 | 1 | 1.1 | 1.45 | 1.45 | 1.45 | |
| Age (days) | 120 | 430 | 120 | 430 | 120 | 430 | |
| MIP | Porosity (%) | 46.54 | 39.71 | 39.17 | 46.83 | 46.38 | - |
| Kerdane and helium pycnometry | Bulk density (g/cm3) | 0.83 | 0.88 | 0.84 | 0.75 | 0.67 | 0.71 |
| True density (g/cm3) | 2.23 | 2.30 | 2.22 | 2.30 | 2.34 | 2.31 | |
| Porosity (%) | 62.86 | 61.78 | 61.89 | 67.60 | 71.39 | 69.17 | |
| Auto-radiography | Porosity (%)-Aged of 180 days | - | - | - | 75.2 | - | 66.4 |
| Water Porosity | Porosity (%) | 77.62 | 70.08 | 71.03 | 86.14 | 78.79 | 74.69 |
Publisher’s Note: MDPI stays neutral with regard to jurisdictional claims in published maps and institutional affiliations. |
© 2022 by the authors. Licensee MDPI, Basel, Switzerland. This article is an open access article distributed under the terms and conditions of the Creative Commons Attribution (CC BY) license (https://creativecommons.org/licenses/by/4.0/).
Share and Cite
Dewitte, C.; Bertron, A.; Neji, M.; Lacarrière, L.; Dauzères, A. Chemical and Microstructural Properties of Designed Cohesive M-S-H Pastes. Materials 2022, 15, 547. https://doi.org/10.3390/ma15020547
Dewitte C, Bertron A, Neji M, Lacarrière L, Dauzères A. Chemical and Microstructural Properties of Designed Cohesive M-S-H Pastes. Materials. 2022; 15(2):547. https://doi.org/10.3390/ma15020547
Chicago/Turabian StyleDewitte, Charlotte, Alexandra Bertron, Mejdi Neji, Laurie Lacarrière, and Alexandre Dauzères. 2022. "Chemical and Microstructural Properties of Designed Cohesive M-S-H Pastes" Materials 15, no. 2: 547. https://doi.org/10.3390/ma15020547